Embed Size (px)
Citation preview
Intrusion & Anomaly Detection & Prevention

Intrusion & Anomaly Detection & PreventionIntrusion Detection: Monitor events, analyze for signs of incidents Look for violations or imminent violations of security policies accepted use policies standard security practices
Intrusion Detection System (IDS): Software that automates this process
Network Based IDS (NIDS): Monitors network traffic Analyzes the traffic for an application protocol activity with suspicious activity (e.g. many login attempts from an IP address)
Log Intrusion Detection Systems (LIDS): Detect intrusions on specific environments mainly using logs
Signatures: Simple, fast, can be updated easily Vendors supply signature files But new attack cannot be identified since there is no sig for it
Statistical or Heuristic IDS: Learn what “normal” traffic looks like Alert on anything that is not normal Requires learning period but can spot new attacks Changes in network may require new learning period
Network Based IDS (NIDS): Usually on the perimeter of organizations's network Access to all traffic, can log suspicious traffic Tuning is needed to reduce false positives
Host Based IDS (HIDS): Implemented in-house for specific high-value servers Traffic and load are more predictable Monitors system integrity, application activity, file changes, network traffic at the host, system logs
Intrusion & Anomaly Detection & Prevention
Log Management: Information regarding an incident should be in several places e.g. routers, firewalls, net IDS, host IDS, application logs Employ one or more central logging servers Configure to send duplicates of logs to centralized logging svr
Log Management Architecture: Log generation: hosts make logs available to log servers Log analysis: analysis on servers – use single entry format Log monitoring: report generation, alerts
Log Management Functions: Log parsing – e.g. look for phrases in an application protocol Event filtering – e.g. limit # times an event is to be recorded Event aggregation – summarize a collection of similar events Compression – lots of data is going to be saved Rotation – current log is relatively small compared to past logs Archive – keep records for some period – attacks last long time Intergrity – check that files have not been modified
Intrusion & Anomaly Detection & Prevention
Why Log Management?:
Detect/prevent unauthorized access and insider abuse
Meet regulatory requirement, ensure regulatory compliance
Forensic analysis and correlation
Track suspicious behavior
IT troubleshooting and network operation
Monitor user activity
Best practices/frameworks such as COBIT, ISO, ITIL, etc COBIT: framework for IT management & governance ISO: privacy principles & safeguarding procedures for IT ITIL: access controls, crypto standards, etc..
Deliver reports to departments
Measure application performance
Achieve RoI or cost reduction in system maintenance
Intrusion & Anomaly Detection & Prevention

Three Models of IDS:
Anomaly Detection: “learning” systems - work by continuously creating “norms” of activities. Norms are later used to detect anomalies that might indicate an intrusion.
Anomaly detection compares observed activity against expected normal usage profiles developed for users, groups of users, applications, or system resource usage
Misuse Detection: Look for signatures (unique patterns known to be associated with misuse or slight variations)
Hybrid Detection: Combines the above
Intrusion & Anomaly Detection & Prevention
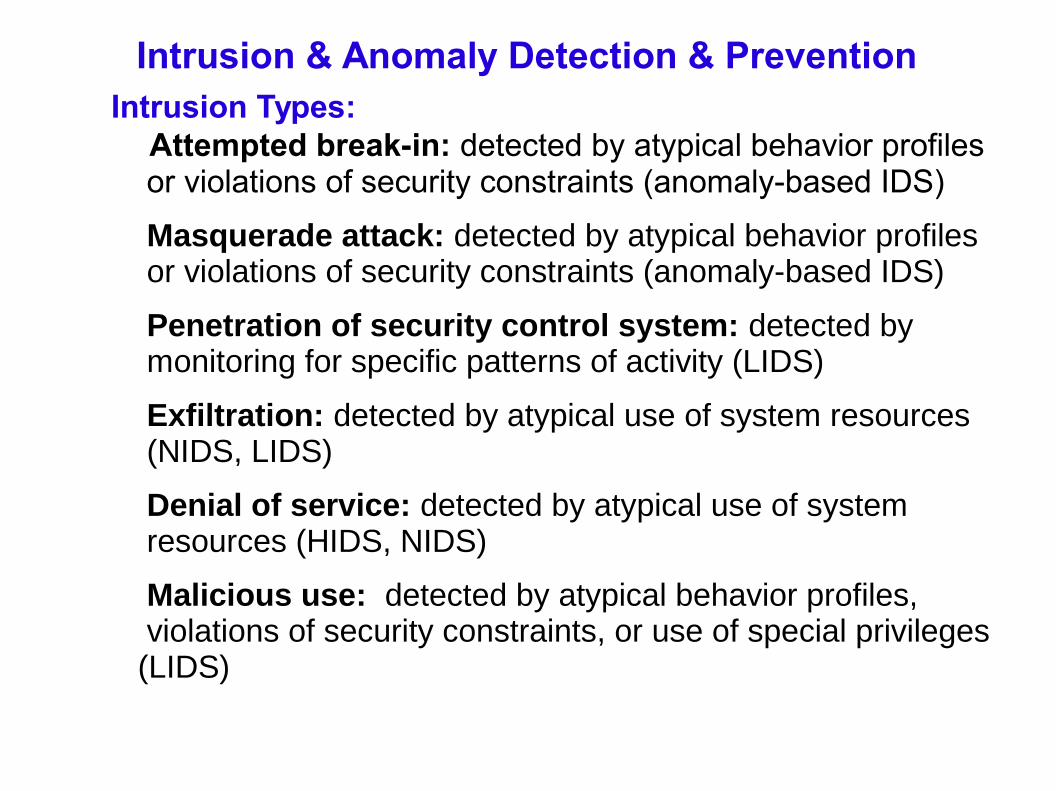
Intrusion & Anomaly Detection & PreventionIntrusion Types: Attempted break-in: detected by atypical behavior profiles or violations of security constraints (anomaly-based IDS)
Masquerade attack: detected by atypical behavior profiles or violations of security constraints (anomaly-based IDS)
Penetration of security control system: detected by monitoring for specific patterns of activity (LIDS)
Exfiltration: detected by atypical use of system resources (NIDS, LIDS)
Denial of service: detected by atypical use of system resources (HIDS, NIDS)
Malicious use: detected by atypical behavior profiles, violations of security constraints, or use of special privileges (LIDS)
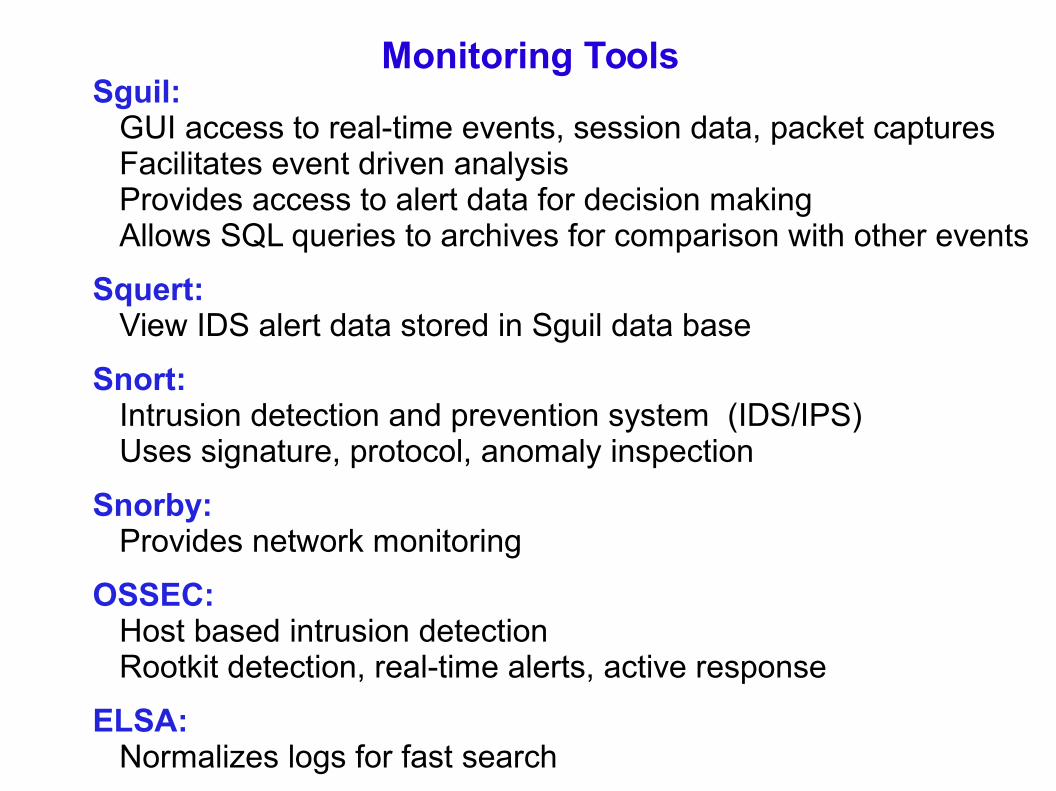
Sguil: GUI access to real-time events, session data, packet captures Facilitates event driven analysis Provides access to alert data for decision making Allows SQL queries to archives for comparison with other events
Squert: View IDS alert data stored in Sguil data base
Snort: Intrusion detection and prevention system (IDS/IPS) Uses signature, protocol, anomaly inspection
Snorby: Provides network monitoring
OSSEC: Host based intrusion detection Rootkit detection, real-time alerts, active response
ELSA: Normalizes logs for fast search
Monitoring Tools
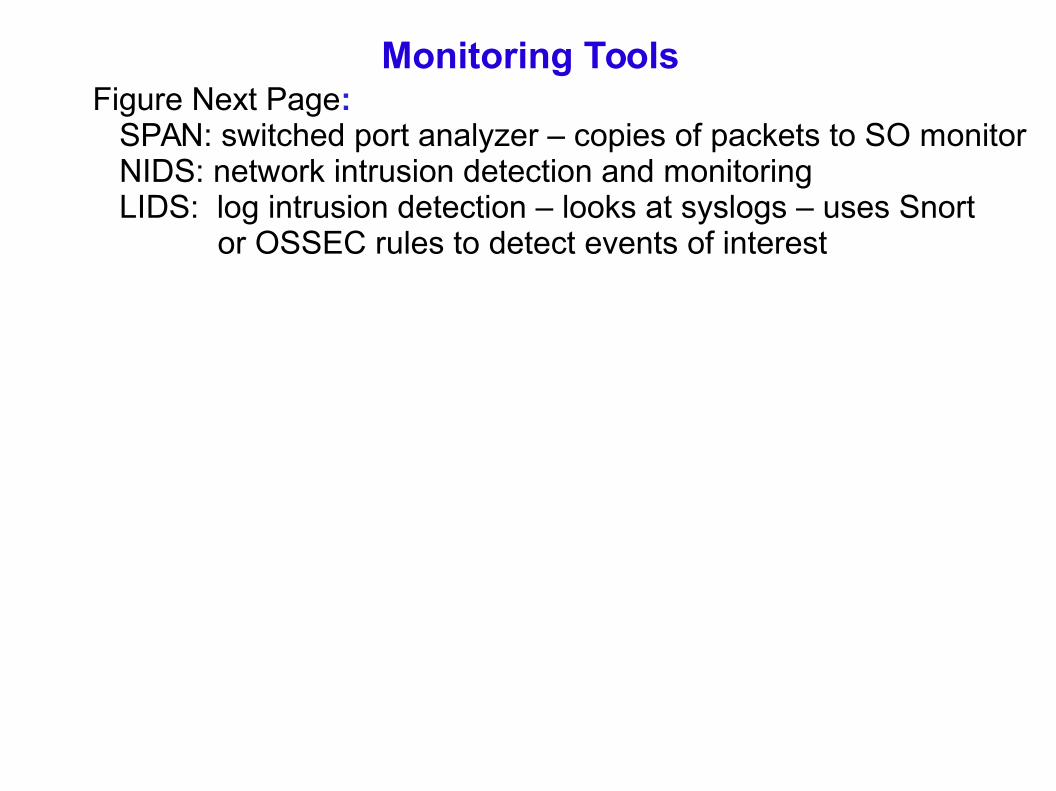
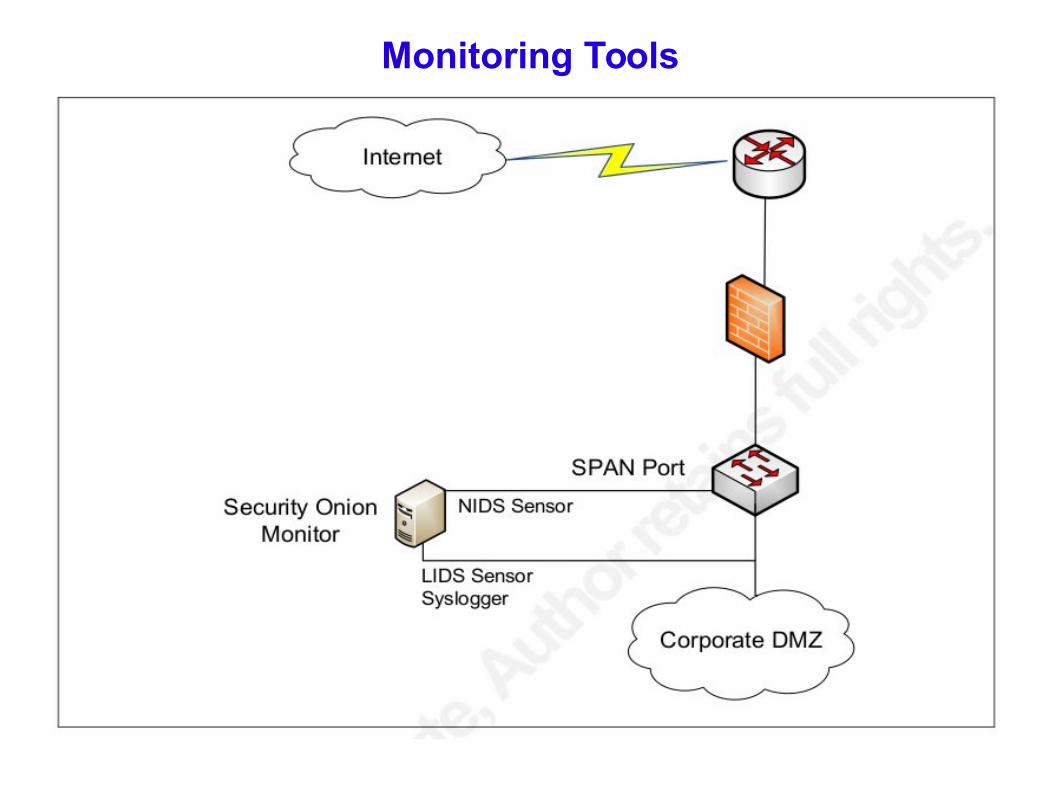
Figure Next Page: SPAN: switched port analyzer – copies of packets to SO monitor NIDS: network intrusion detection and monitoring LIDS: log intrusion detection – looks at syslogs – uses Snort or OSSEC rules to detect events of interest
Monitoring Tools
Monitoring Tools
Figure Next Page:
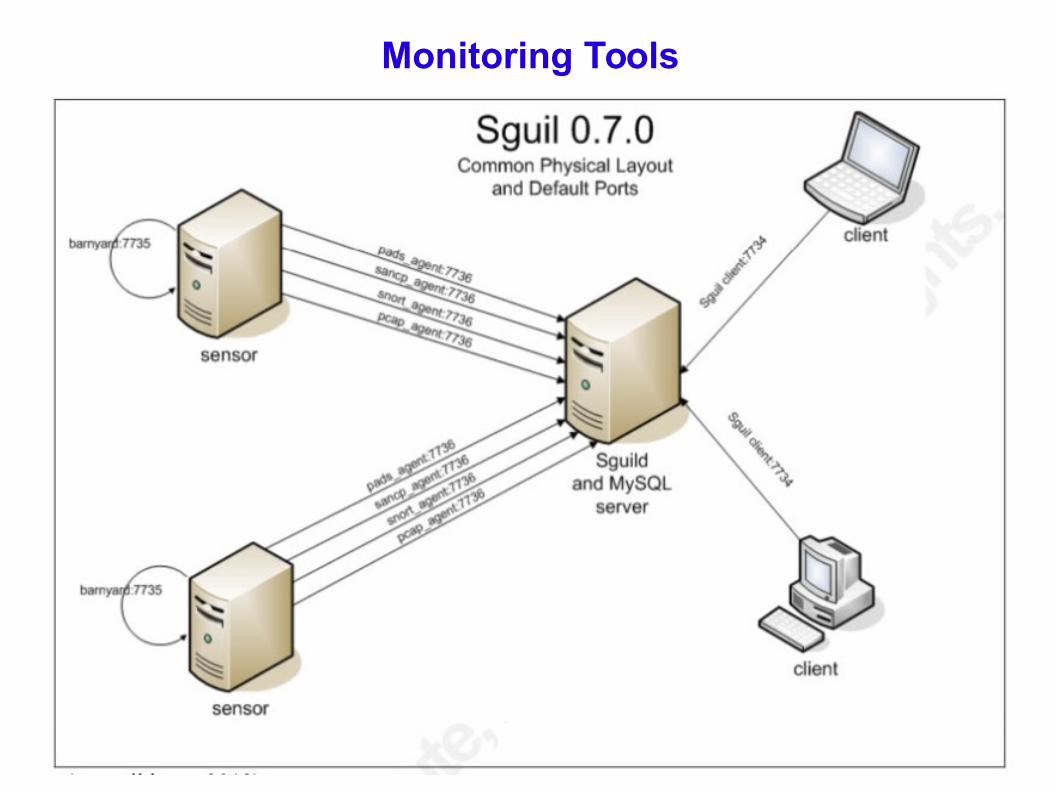
Alerts are stored in the Sguil MySQL database – these are accessed via Snorby
Sguil system has one server, many sensors (large nets) Sensors perform monitoring tasks and feed info back to server Server archives info, provides info to Sguil clients as requested Server may ask sensors for specific information – typically previously received packet data
Monitoring Tools
Monitoring Tools

OSSEC: Configured to collect logs See /var/ossec/etc/ossec.conf
Change to (log collection)
<remote> <connection>syslog</connection> <allowedips>any</allowedips> <protocol>udp</protocol> <port>514</port> </remote>
Firewall should divert traffic to ossec > sudo ufw allow proto udp from 10.0.2.0 \ to 10.0.2.15 port 514 > sudo /var/ossec/bin/osseccontrol restart
Monitoring Tools
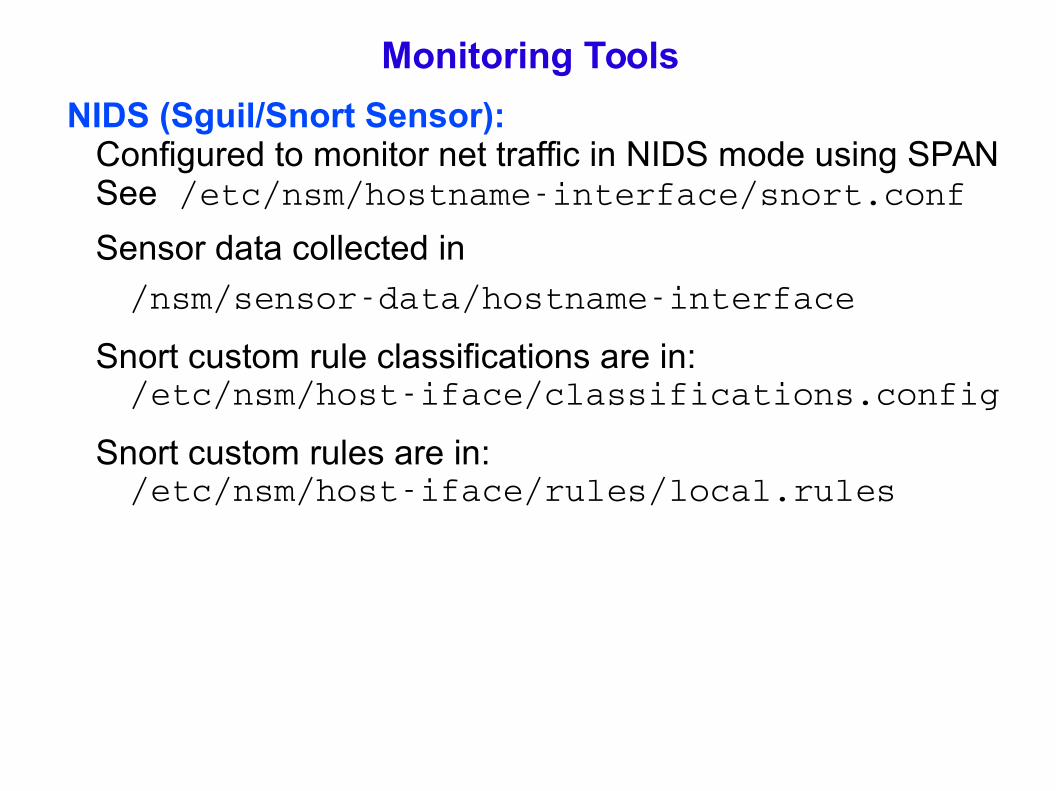
NIDS (Sguil/Snort Sensor): Configured to monitor net traffic in NIDS mode using SPAN See /etc/nsm/hostnameinterface/snort.conf
Sensor data collected in
/nsm/sensordata/hostnameinterface
Snort custom rule classifications are in: /etc/nsm/hostiface/classifications.config
Snort custom rules are in: /etc/nsm/hostiface/rules/local.rules
Monitoring Tools
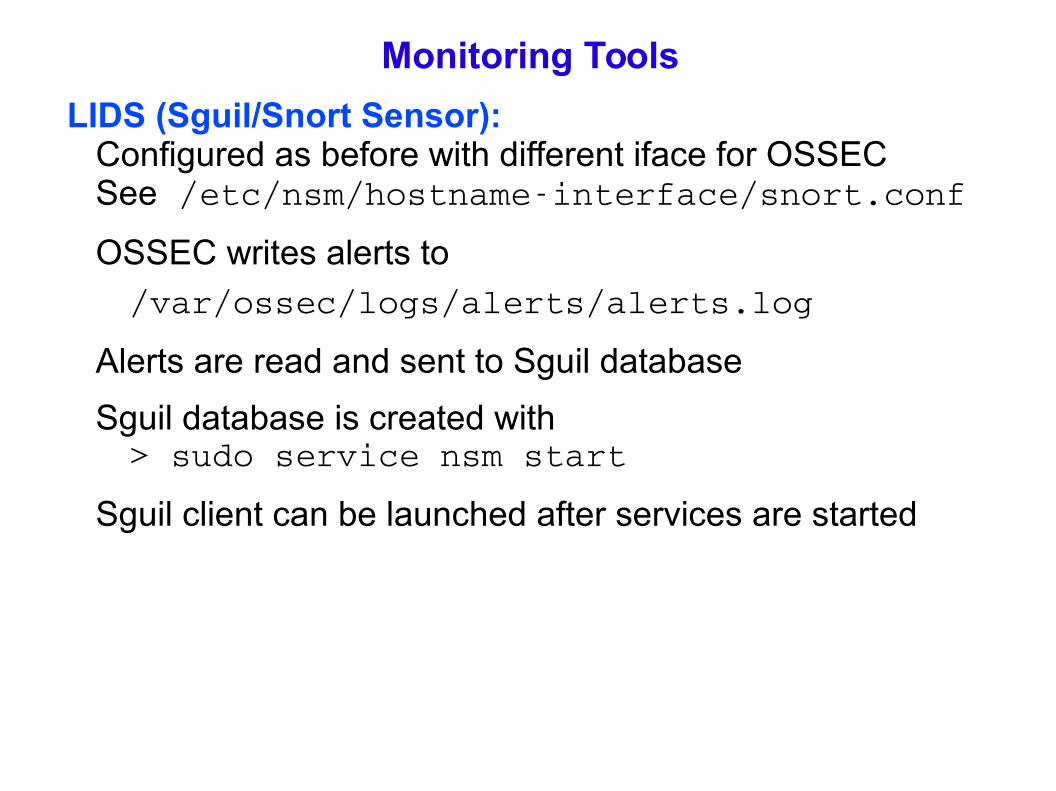
LIDS (Sguil/Snort Sensor): Configured as before with different iface for OSSEC See /etc/nsm/hostnameinterface/snort.conf
OSSEC writes alerts to
/var/ossec/logs/alerts/alerts.log
Alerts are read and sent to Sguil database
Sguil database is created with > sudo service nsm start
Sguil client can be launched after services are started
Monitoring Tools
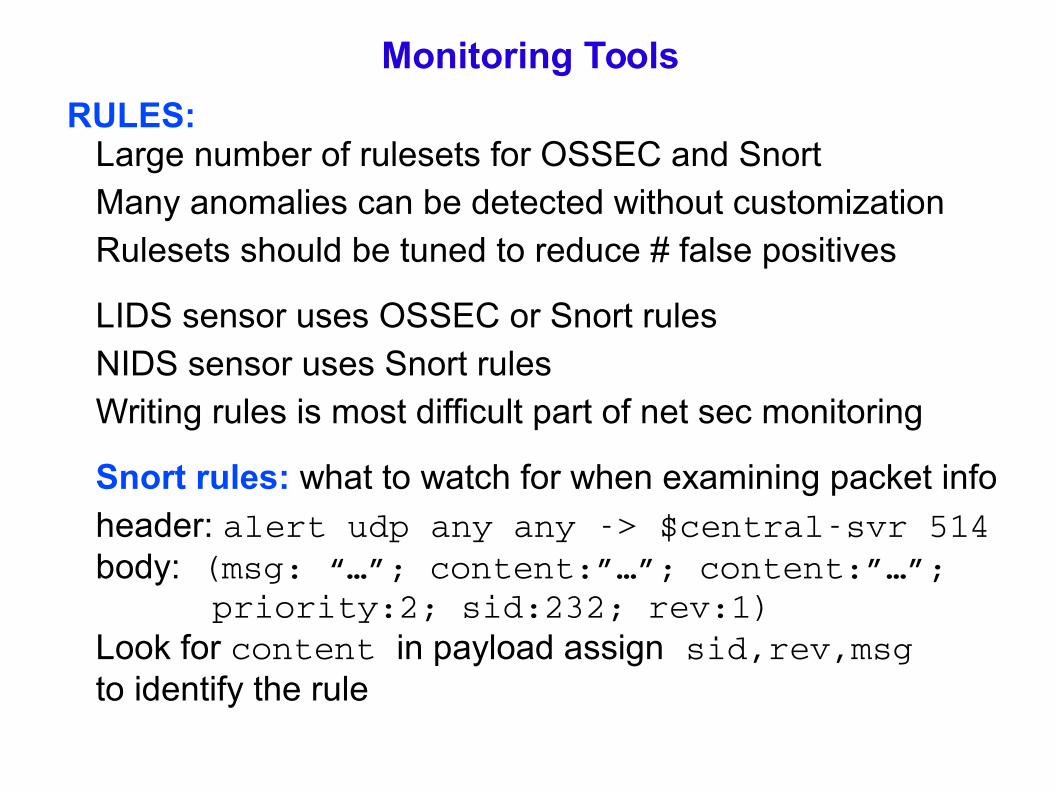
RULES: Large number of rulesets for OSSEC and Snort Many anomalies can be detected without customization Rulesets should be tuned to reduce # false positives
LIDS sensor uses OSSEC or Snort rules NIDS sensor uses Snort rules Writing rules is most difficult part of net sec monitoring
Snort rules: what to watch for when examining packet info header: alert udp any any > $centralsvr 514 body: (msg: “…”; content:”…”; content:”…”; priority:2; sid:232; rev:1) Look for content in payload assign sid,rev,msg to identify the rule
Monitoring Tools
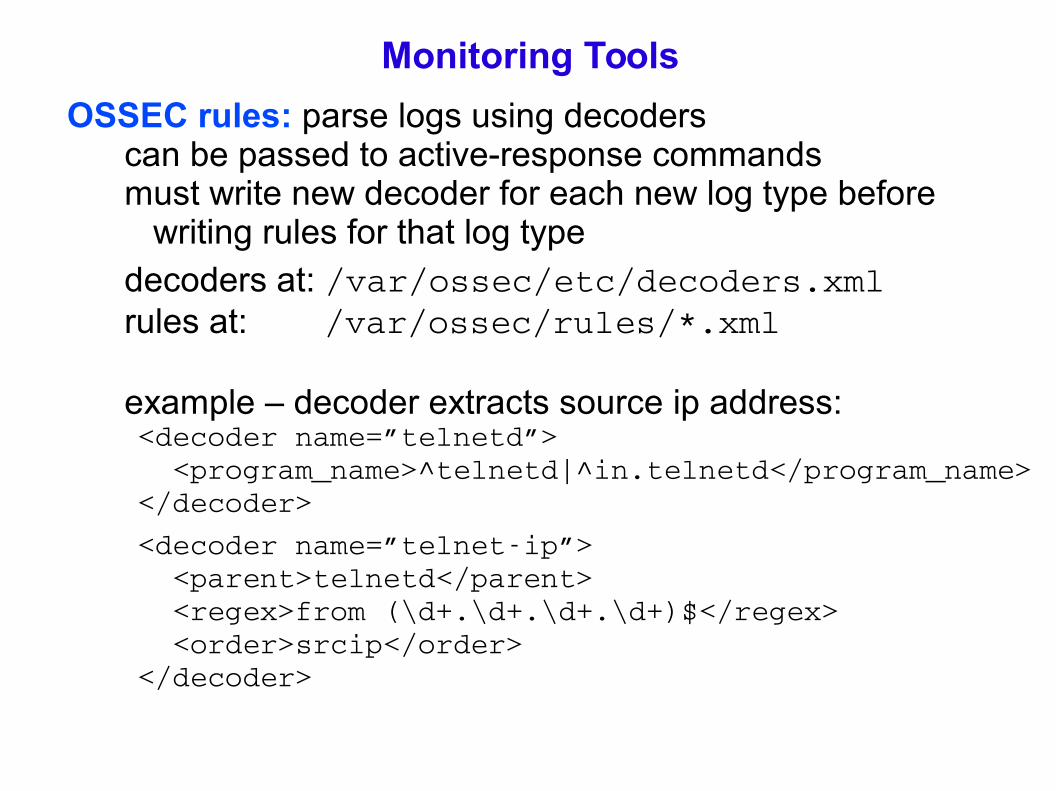
OSSEC rules: parse logs using decoders can be passed to active-response commands must write new decoder for each new log type before writing rules for that log type decoders at: /var/ossec/etc/decoders.xml rules at: /var/ossec/rules/*.xml example – decoder extracts source ip address: <decoder name=”telnetd”> <program_name>^telnetd|^in.telnetd</program_name> </decoder>
<decoder name=”telnetip”> <parent>telnetd</parent> <regex>from (\d+.\d+.\d+.\d+)$</regex> <order>srcip</order> </decoder>
Monitoring Tools
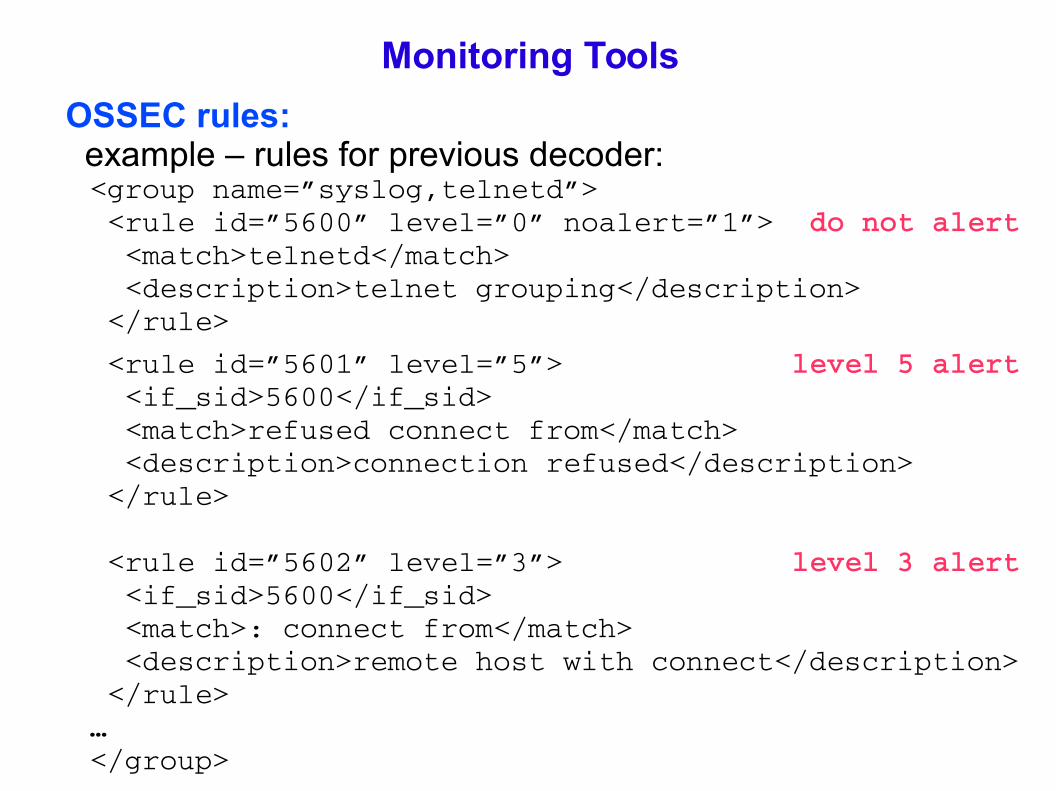
OSSEC rules: example – rules for previous decoder: <group name=”syslog,telnetd”> <rule id=”5600” level=”0” noalert=”1”> do not alert <match>telnetd</match> <description>telnet grouping</description> </rule>
<rule id=”5601” level=”5”> level 5 alert <if_sid>5600</if_sid> <match>refused connect from</match> <description>connection refused</description> </rule> <rule id=”5602” level=”3”> level 3 alert <if_sid>5600</if_sid> <match>: connect from</match> <description>remote host with connect</description> </rule> … </group>
Monitoring Tools
Event Analysis: Snort or OSSEC alerts are displayed on Sguil console Analyst categorizes alerts based on type of activity Analyst selects appropriate event status, adds comments Then alert is removed from the console Sguil provides complete audit trail at a later date Screenshot on next page
Monitoring Tools
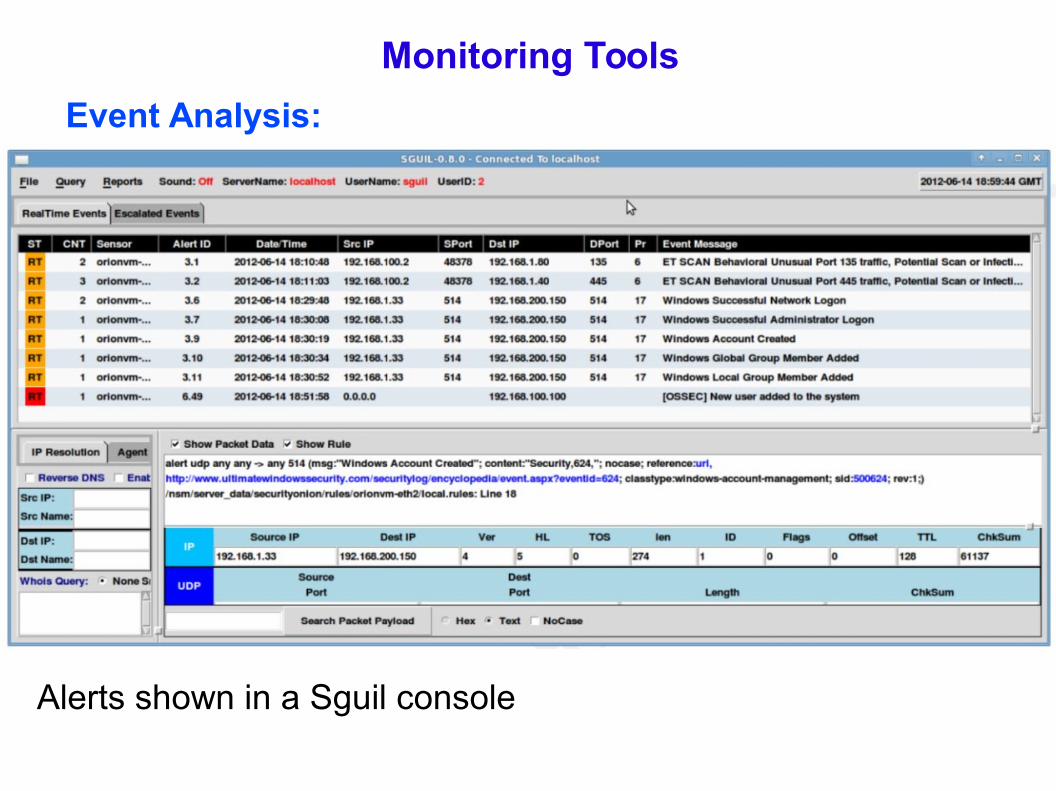
Event Analysis:
Alerts shown in a Sguil console
Monitoring Tools
Event Correlation: Correlate across different logs to get comprehensive picture of the chain of events Analyst develops theory about what happened, then uses logs to confirm or reject Cannot correlate accurately if clocks are skewed on sensored machines
Monitoring Tools
Active Defense
What: Strategies employed to prevent, obstruct, or otherwise block unwanted access to a system or network.
How: Firewalls: parse packet information and take action based on some rules
VPN: encrypt traffic, even packet headers
Proxy server: controls access, hides topology, adds visibility to application traffic
Configuration and choice of network services: ftp servers can be vulnerable but secure ftp (SFTP) is Less vulnerable and is used in a similar way telnet must be used carefully rsh must be used carefully permissions: set uid must be used very carefully

Firewall
Active Defense
What They Can Do: Parse inbound and outbound packets Test parsed results against criteria defined in tables Block packets or allow the packets to continue Generate reports and alerts Generate log files for future analysis
What They Cannot Do: Deal with lapses in security practices and policies e.g. an employee might bypass a firewall by attaching a modem to an office phone and dialing in! Cannot protect an entire network – only a single point e.g. the attacker may be an insider (VPN will help with this) Generally cannot authenticate except by ip address (so we use something like kerberos for that) Generally cannot authorize the use of a service
Firewalls

Firewalls
Performance Issues: Must buffer traffic to allow time for a decision to be made
Maximum hi-end throughput is typically 800 Mbps
Typically TCP traffic occurs in bursts but buffer size may be too small – either release the traffic before analysis or get larger buffers but there is still a throughput problem
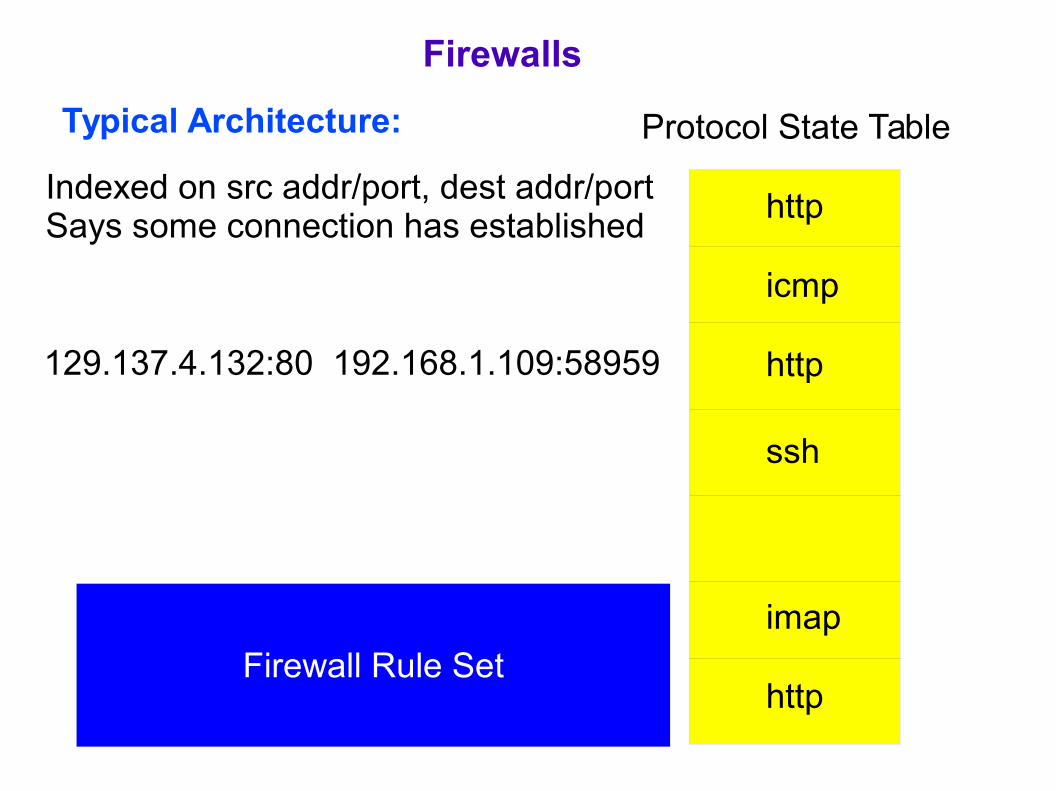
Typical Architecture:
Indexed on src addr/port, dest addr/portSays some connection has established
Protocol State Table
http
http
http
icmp
ssh
imap
129.137.4.132:80 192.168.1.109:58959
Firewall Rule Set
Firewalls

Typical Architecture:
Indexed on src addr/port, dest addr/portSays some connection has established
Protocol State Table
http
http
http
icmp
ssh
imap
129.137.4.132:80 192.168.1.109:58959
129.137.4.132:80 192.168.1.109:58959 http
incoming packet
Firewall Rule Set
Firewalls

Typical Architecture:
Indexed on src addr/port, dest addr/portSays some connection has established
Protocol State Table
http
http
http
icmp
ssh
imap
129.137.4.132:80 192.168.1.109:58959
incoming packet proceeds on match
Firewall Rule Set
Firewalls

Typical Architecture:
Indexed on src addr/port, dest addr/portSays some connection has established
Protocol State Table
http
http
http
icmp
ssh
imap
129.137.4.132:80 192.168.1.109:58959
129.137.4.132:80 192.168.1.109:58959 ssh
incoming packet
Firewall Rule Set
Firewalls

Typical Architecture:
Indexed on src addr/port, dest addr/portSays some connection has established
Protocol State Table
http
http
http
icmp
ssh
imap
129.137.4.132:80 192.168.1.109:58959
129.137.4.132:80 192.168.1.109:58959 ssh
incoming packet
Firewall Rule Set
Firewalls

Typical Architecture:
Indexed on src addr/port, dest addr/portSays some connection has established
Protocol State Table
http
http
http
icmp
ssh
imap
129.137.4.132:80 192.168.1.109:58959
129.137.4.132:80 192.168.1.109:58959 ssh
incoming packet OK to proceedadd an entry to the state table
Firewall Rule Set
ssh
Firewalls
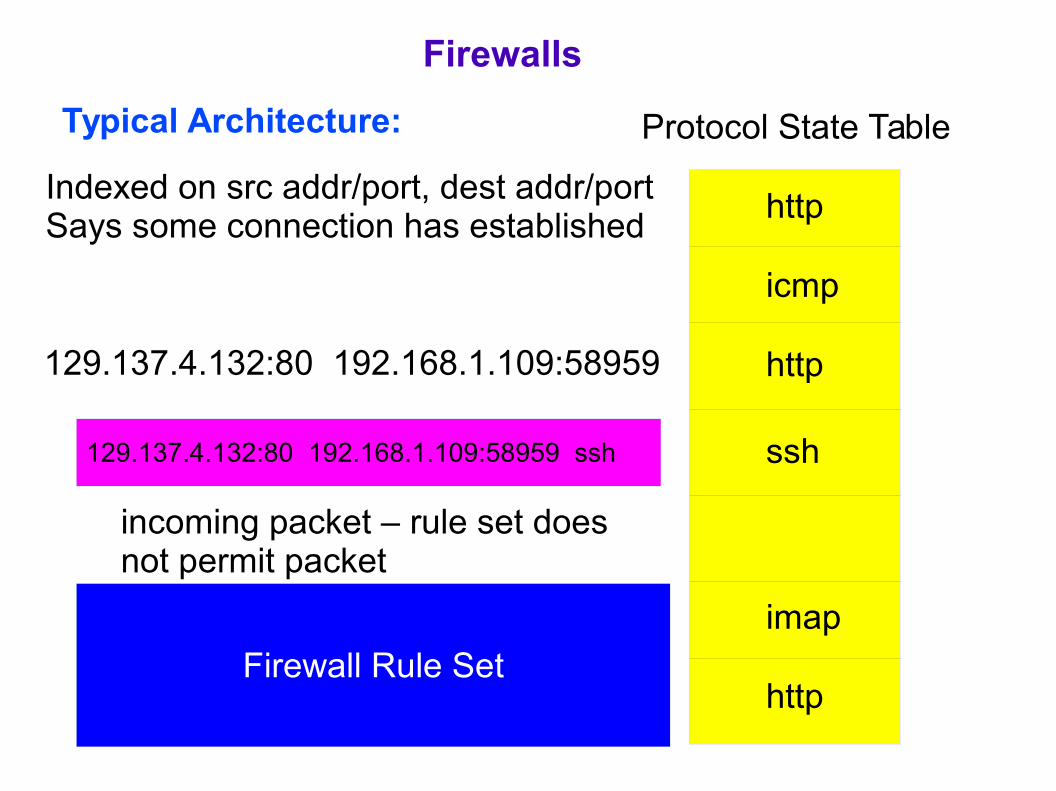
Typical Architecture:
Indexed on src addr/port, dest addr/portSays some connection has established
Protocol State Table
http
http
http
icmp
ssh
imap
129.137.4.132:80 192.168.1.109:58959
129.137.4.132:80 192.168.1.109:58959 ssh
incoming packet – rule set does not permit packet
Firewall Rule Set
Firewalls
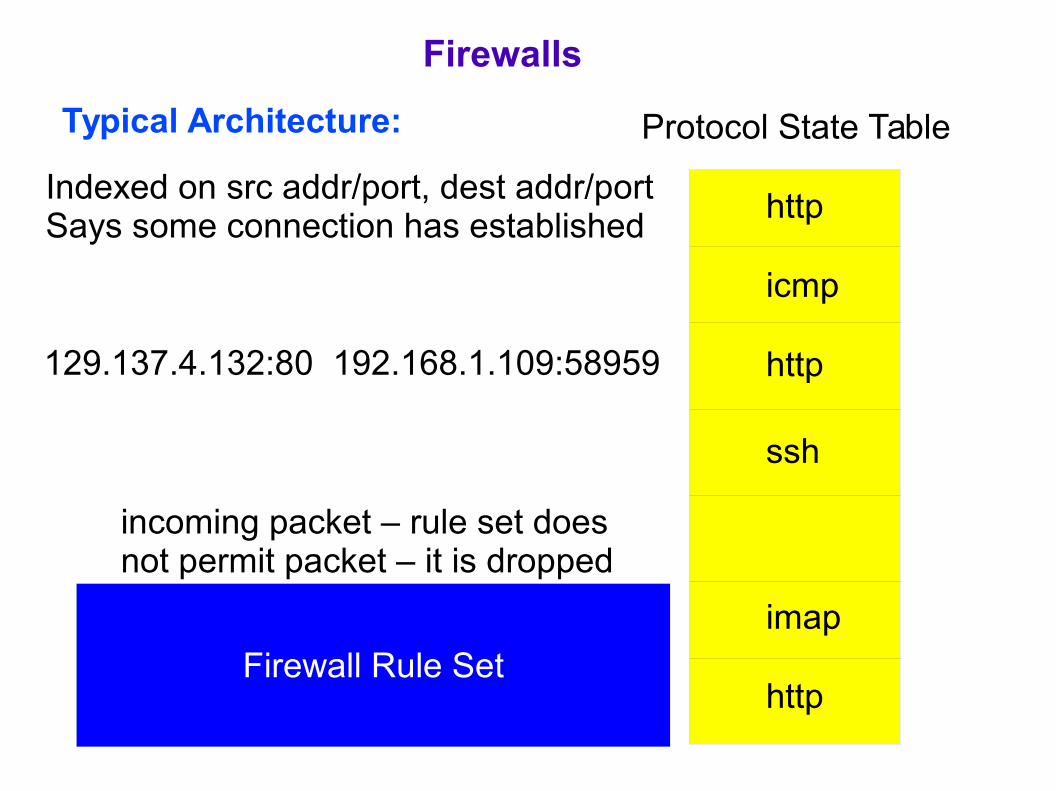
Typical Architecture:
Indexed on src addr/port, dest addr/portSays some connection has established
Protocol State Table
http
http
http
icmp
ssh
imap
129.137.4.132:80 192.168.1.109:58959
incoming packet – rule set does not permit packet – it is dropped
Firewall Rule Set
Firewalls
Typical Architecture:
Indexed on src addr/port, dest addr/portSays some connection has established
Protocol State Table
http
http
http
icmp
ssh
imap
129.137.4.132:80 192.168.1.109:58959
consider a full table
Firewall Rule Set
ssh
Firewalls

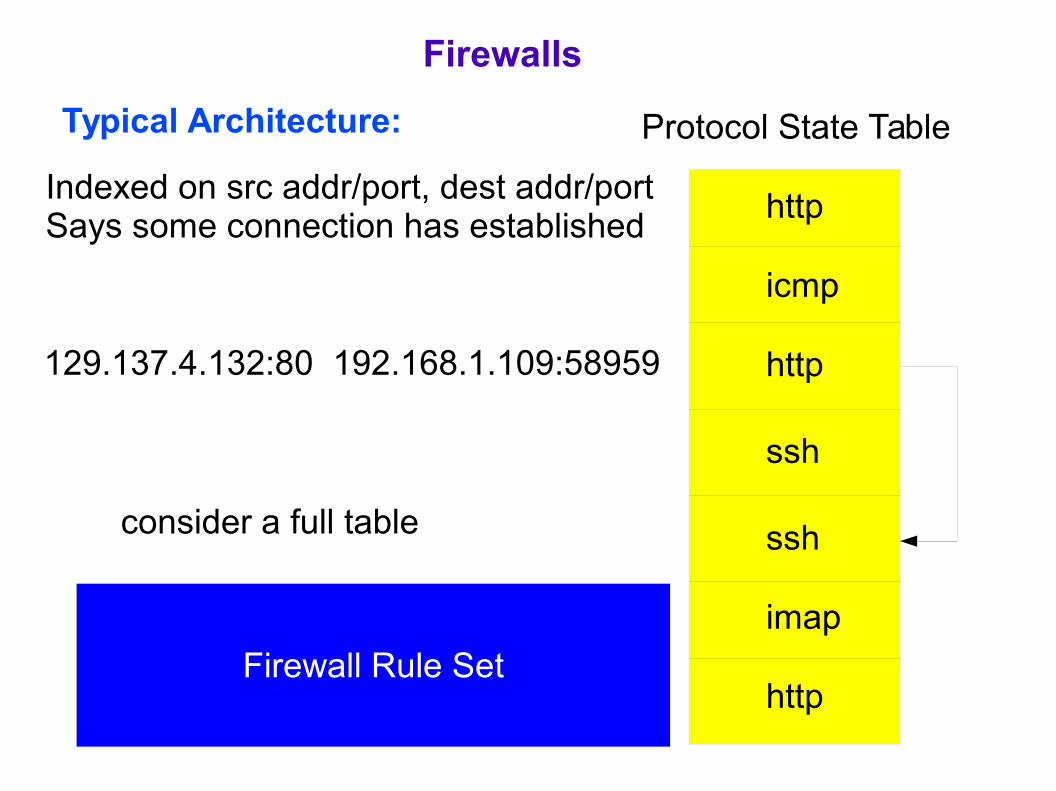
Typical Architecture:
Indexed on src addr/port, dest addr/portSays some connection has established
Protocol State Table
http
http
http
icmp
ssh
imap
129.137.4.132:80 192.168.1.109:58959
incoming packet – must drop – noroom for a new connection in table
Firewall Rule Set
ssh
129.137.4.132:80 192.168.1.110:57959 http
Firewalls
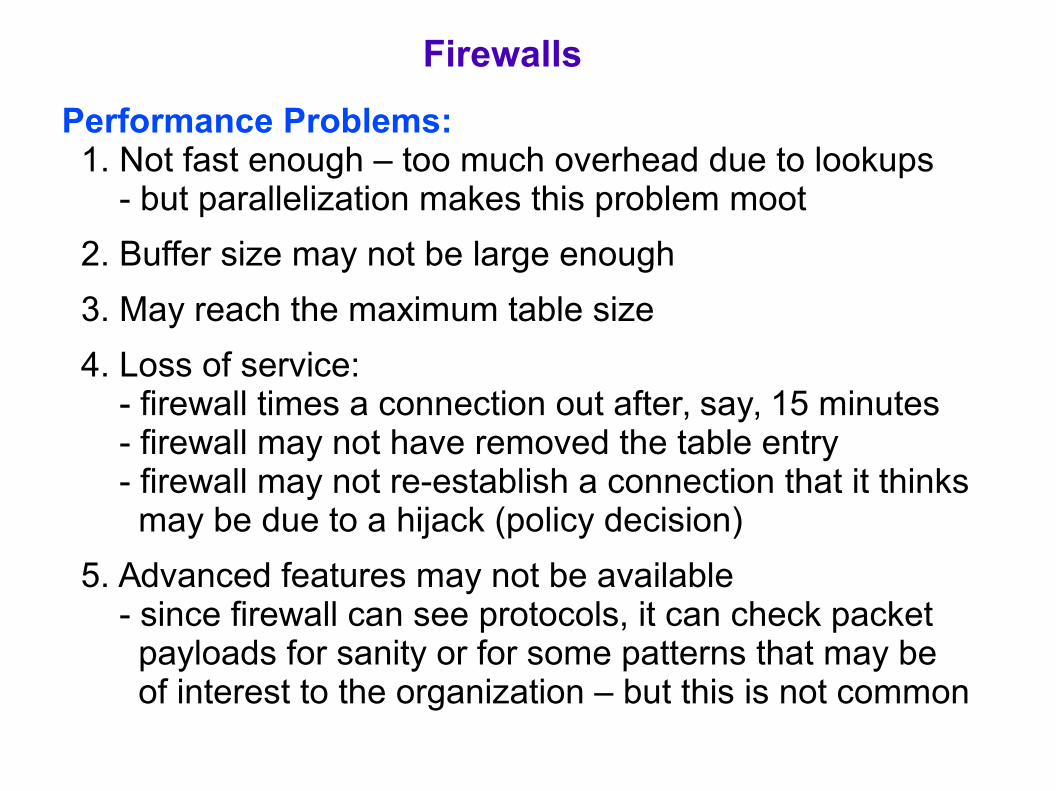
Performance Problems: 1. Not fast enough – too much overhead due to lookups - but parallelization makes this problem moot
2. Buffer size may not be large enough
3. May reach the maximum table size
4. Loss of service: - firewall times a connection out after, say, 15 minutes - firewall may not have removed the table entry - firewall may not re-establish a connection that it thinks may be due to a hijack (policy decision)
5. Advanced features may not be available - since firewall can see protocols, it can check packet payloads for sanity or for some patterns that may be of interest to the organization – but this is not common
Firewalls
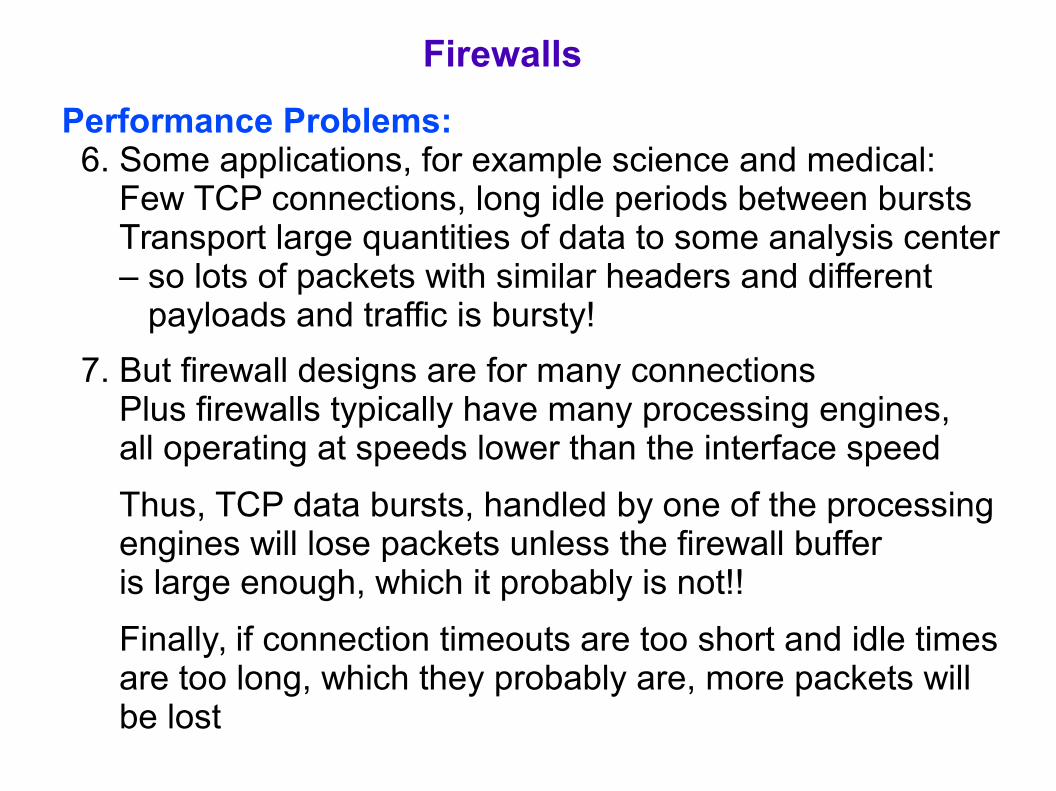
Performance Problems: 6. Some applications, for example science and medical: Few TCP connections, long idle periods between bursts Transport large quantities of data to some analysis center – so lots of packets with similar headers and different payloads and traffic is bursty!
7. But firewall designs are for many connections Plus firewalls typically have many processing engines, all operating at speeds lower than the interface speed
Thus, TCP data bursts, handled by one of the processing engines will lose packets unless the firewall buffer is large enough, which it probably is not!!
Finally, if connection timeouts are too short and idle times are too long, which they probably are, more packets will be lost
Firewalls

Performance Problems: Example: traffic between two points, top figure with firewall bottom figure bypasses firewall
Firewalls
Network Performance Tool
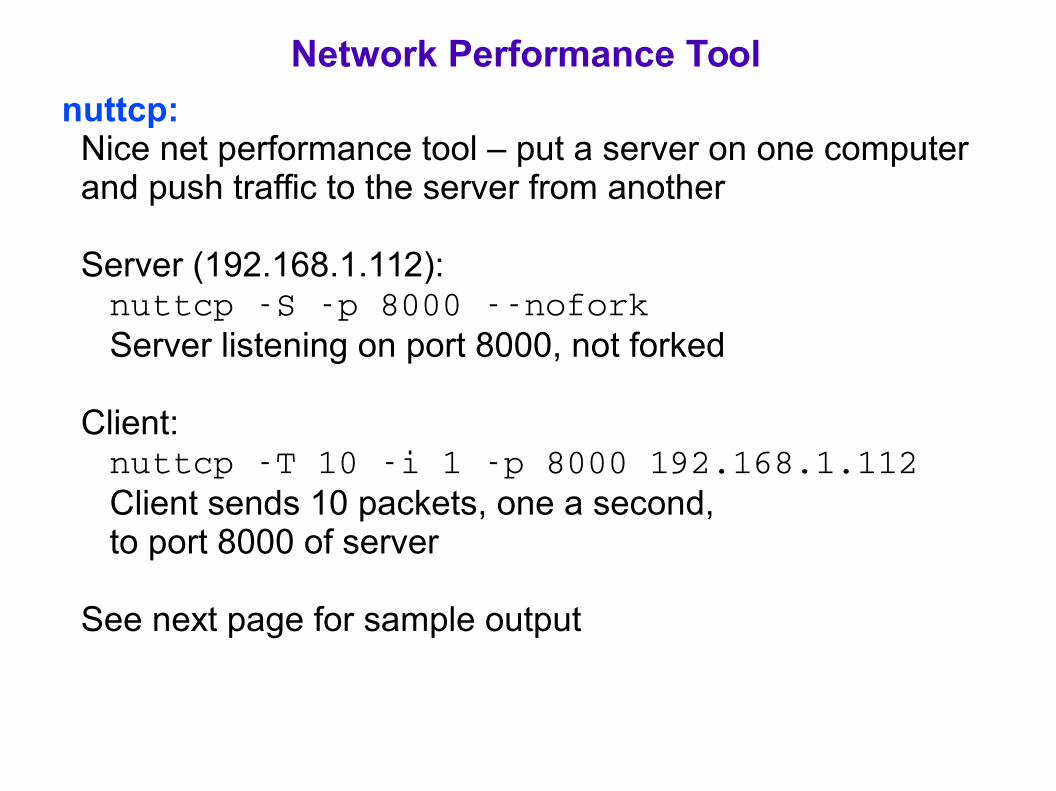
nuttcp: Nice net performance tool – put a server on one computer and push traffic to the server from another
Server (192.168.1.112): nuttcp S p 8000 nofork Server listening on port 8000, not forked
Client: nuttcp T 10 i 1 p 8000 192.168.1.112 Client sends 10 packets, one a second, to port 8000 of server
See next page for sample output
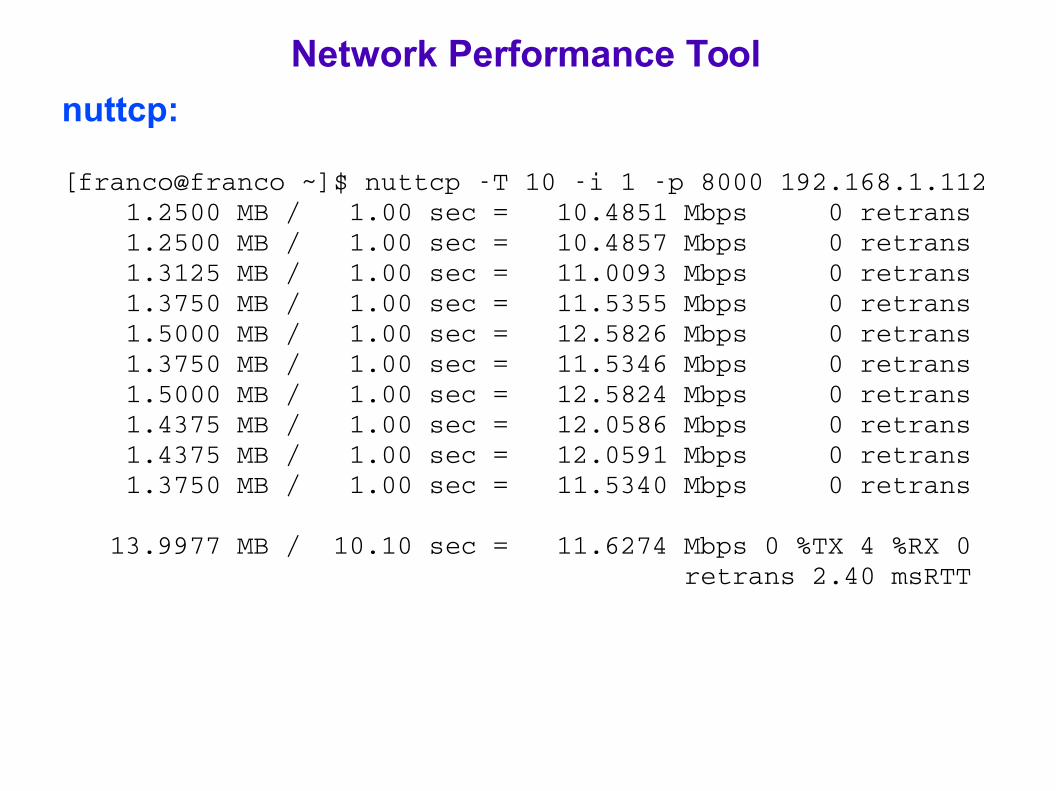
nuttcp: [franco@franco ~]$ nuttcp T 10 i 1 p 8000 192.168.1.112 1.2500 MB / 1.00 sec = 10.4851 Mbps 0 retrans 1.2500 MB / 1.00 sec = 10.4857 Mbps 0 retrans 1.3125 MB / 1.00 sec = 11.0093 Mbps 0 retrans 1.3750 MB / 1.00 sec = 11.5355 Mbps 0 retrans 1.5000 MB / 1.00 sec = 12.5826 Mbps 0 retrans 1.3750 MB / 1.00 sec = 11.5346 Mbps 0 retrans 1.5000 MB / 1.00 sec = 12.5824 Mbps 0 retrans 1.4375 MB / 1.00 sec = 12.0586 Mbps 0 retrans 1.4375 MB / 1.00 sec = 12.0591 Mbps 0 retrans 1.3750 MB / 1.00 sec = 11.5340 Mbps 0 retrans
13.9977 MB / 10.10 sec = 11.6274 Mbps 0 %TX 4 %RX 0 retrans 2.40 msRTT
Network Performance Tool
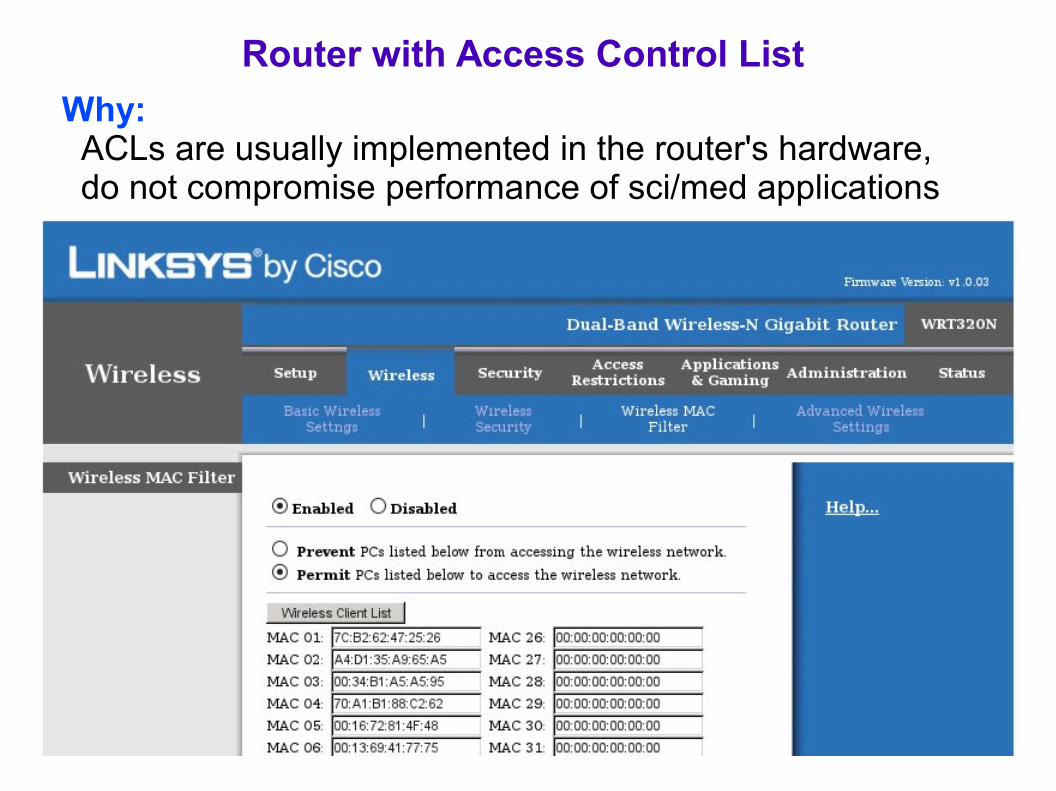
Router with Access Control List
Why: ACLs are usually implemented in the router's hardware, do not compromise performance of sci/med applications
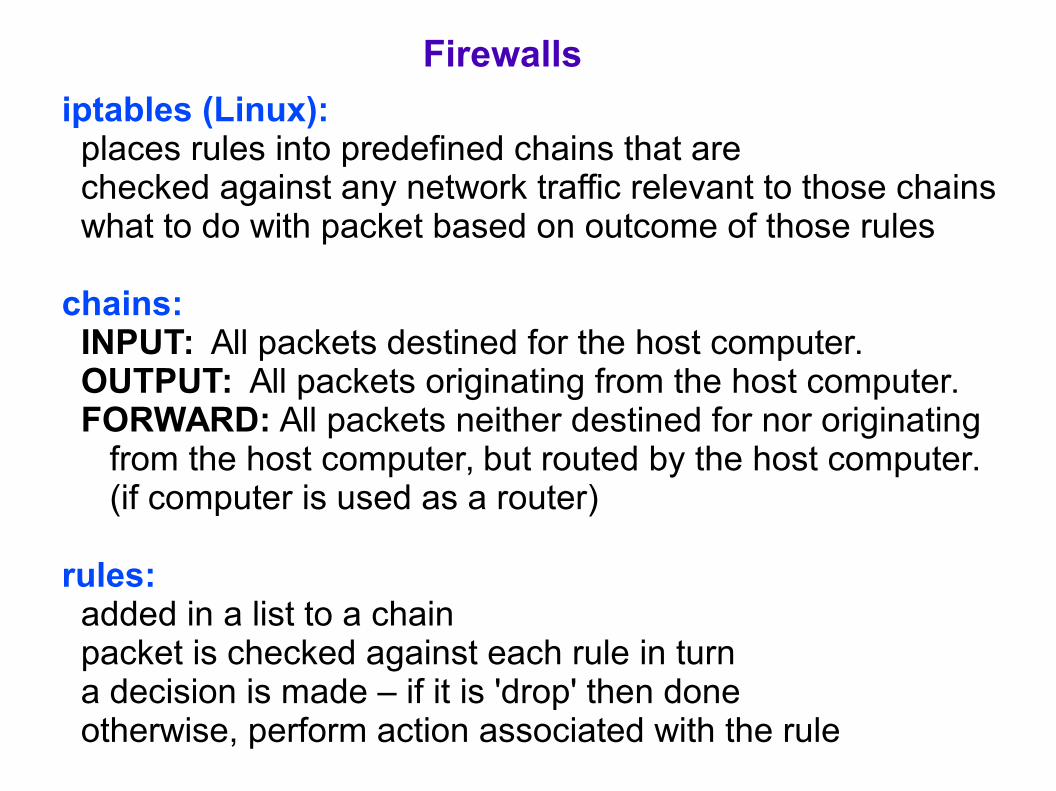
iptables (Linux): places rules into predefined chains that are checked against any network traffic relevant to those chains what to do with packet based on outcome of those rules
chains: INPUT: All packets destined for the host computer. OUTPUT: All packets originating from the host computer. FORWARD: All packets neither destined for nor originating from the host computer, but routed by the host computer. (if computer is used as a router)
rules: added in a list to a chain packet is checked against each rule in turn a decision is made – if it is 'drop' then done otherwise, perform action associated with the rule
Firewalls
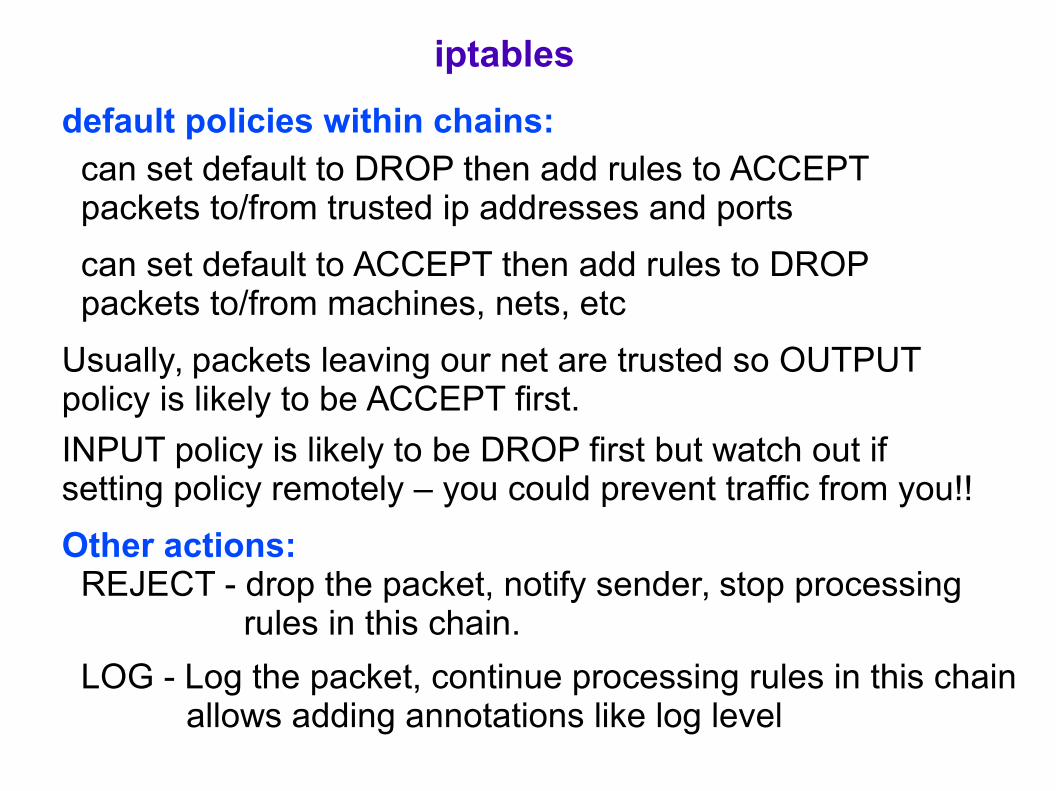
default policies within chains: can set default to DROP then add rules to ACCEPT packets to/from trusted ip addresses and ports
can set default to ACCEPT then add rules to DROP packets to/from machines, nets, etc
Usually, packets leaving our net are trusted so OUTPUTpolicy is likely to be ACCEPT first.
INPUT policy is likely to be DROP first but watch out ifsetting policy remotely – you could prevent traffic from you!!
Other actions: REJECT - drop the packet, notify sender, stop processing rules in this chain.
LOG - Log the packet, continue processing rules in this chain allows adding annotations like log level
iptables
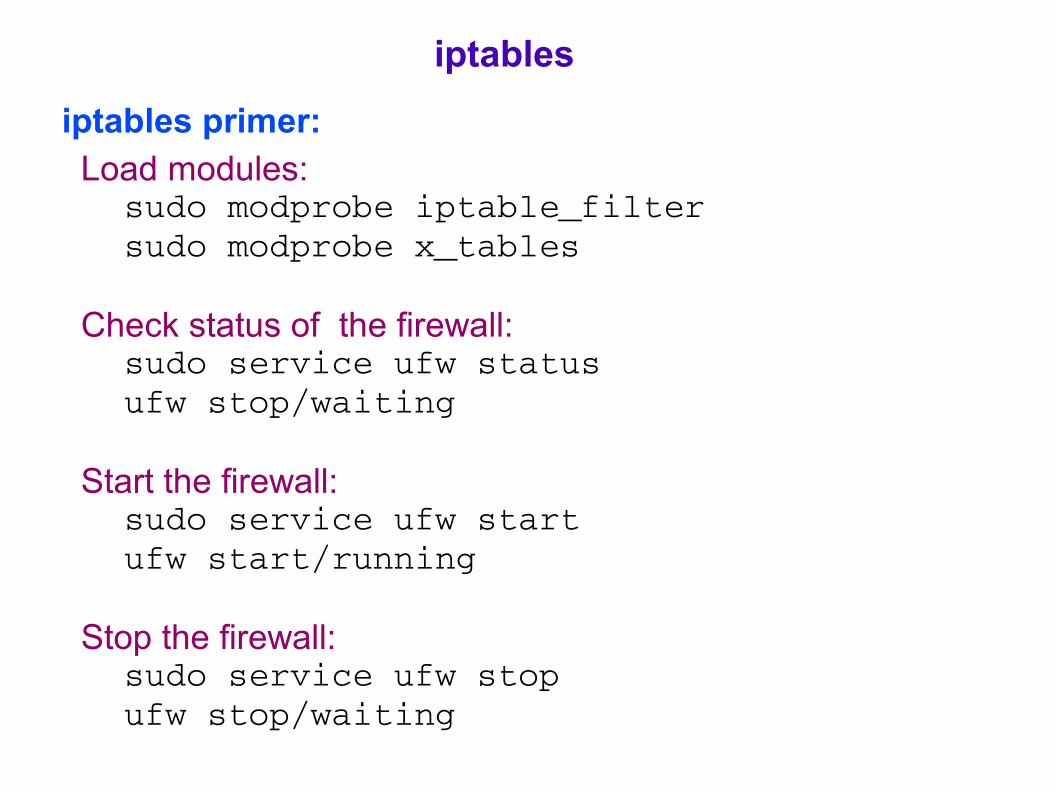
iptables primer: Load modules: sudo modprobe iptable_filter sudo modprobe x_tables Check status of the firewall: sudo service ufw status ufw stop/waiting
Start the firewall: sudo service ufw start ufw start/running
Stop the firewall: sudo service ufw stop ufw stop/waiting
iptables
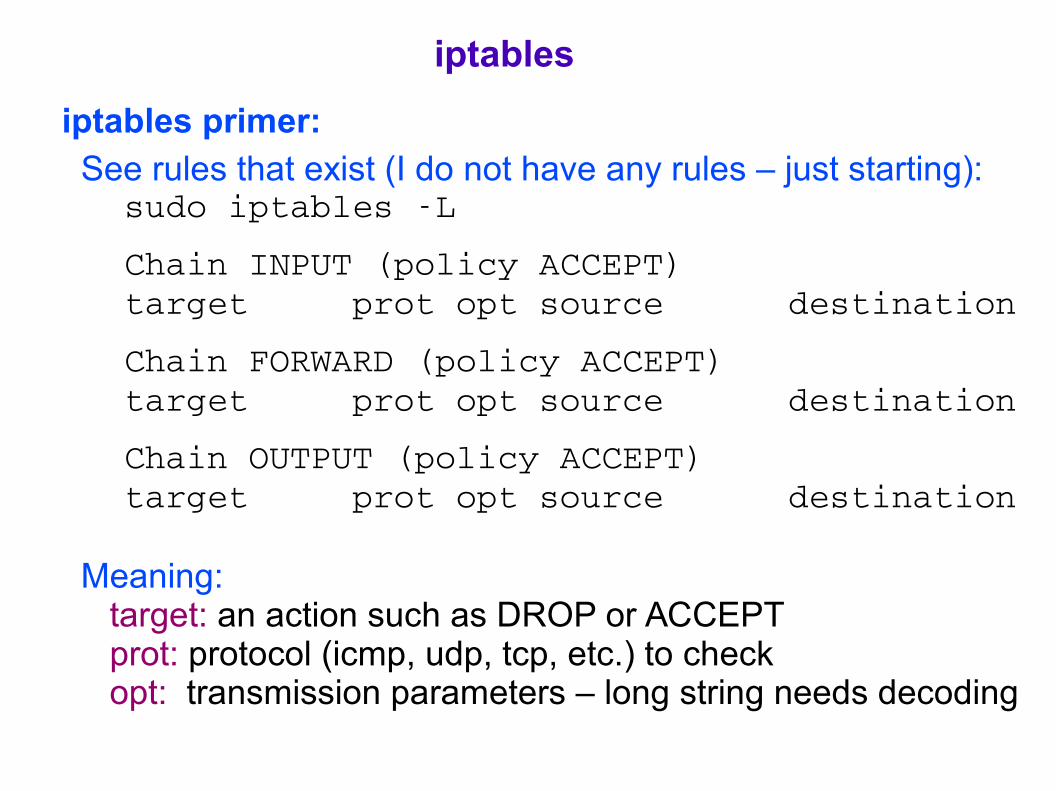
iptables primer: See rules that exist (I do not have any rules – just starting): sudo iptables L
Chain INPUT (policy ACCEPT) target prot opt source destination
Chain FORWARD (policy ACCEPT) target prot opt source destination
Chain OUTPUT (policy ACCEPT) target prot opt source destination Meaning: target: an action such as DROP or ACCEPT prot: protocol (icmp, udp, tcp, etc.) to check opt: transmission parameters – long string needs decoding
iptables
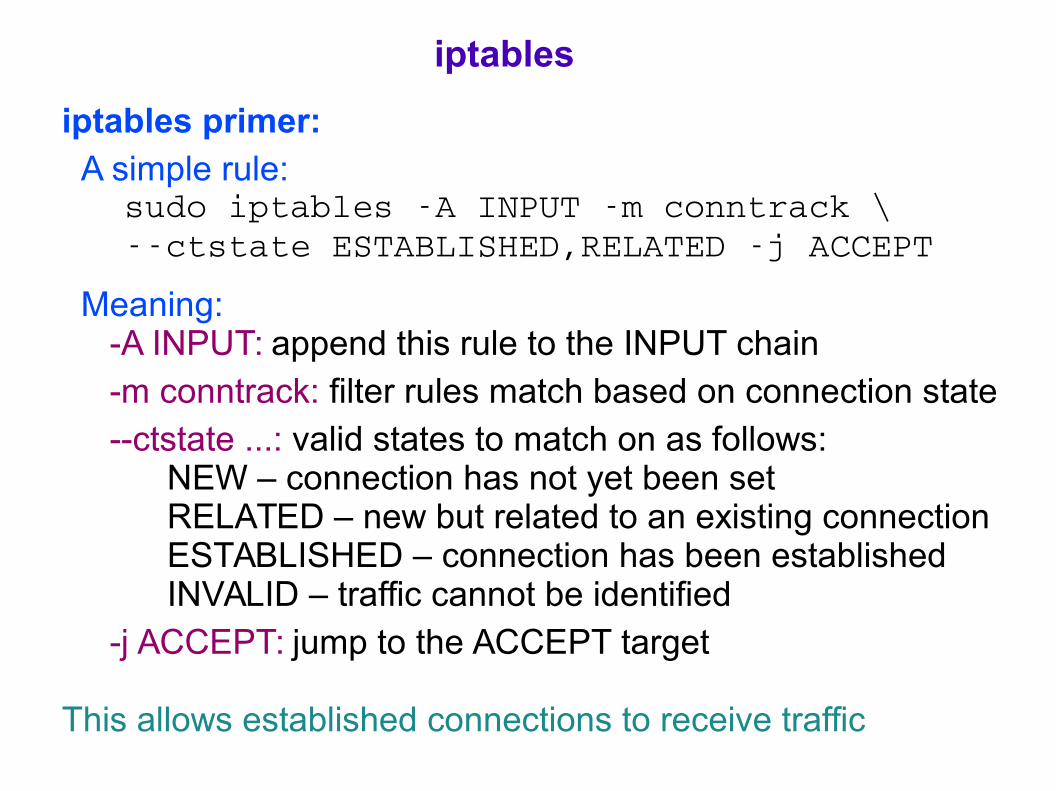
iptables primer: A simple rule: sudo iptables A INPUT m conntrack \ ctstate ESTABLISHED,RELATED j ACCEPT
Meaning: -A INPUT: append this rule to the INPUT chain -m conntrack: filter rules match based on connection state --ctstate ...: valid states to match on as follows: NEW – connection has not yet been set RELATED – new but related to an existing connection ESTABLISHED – connection has been established INVALID – traffic cannot be identified -j ACCEPT: jump to the ACCEPT target
This allows established connections to receive traffic
iptables
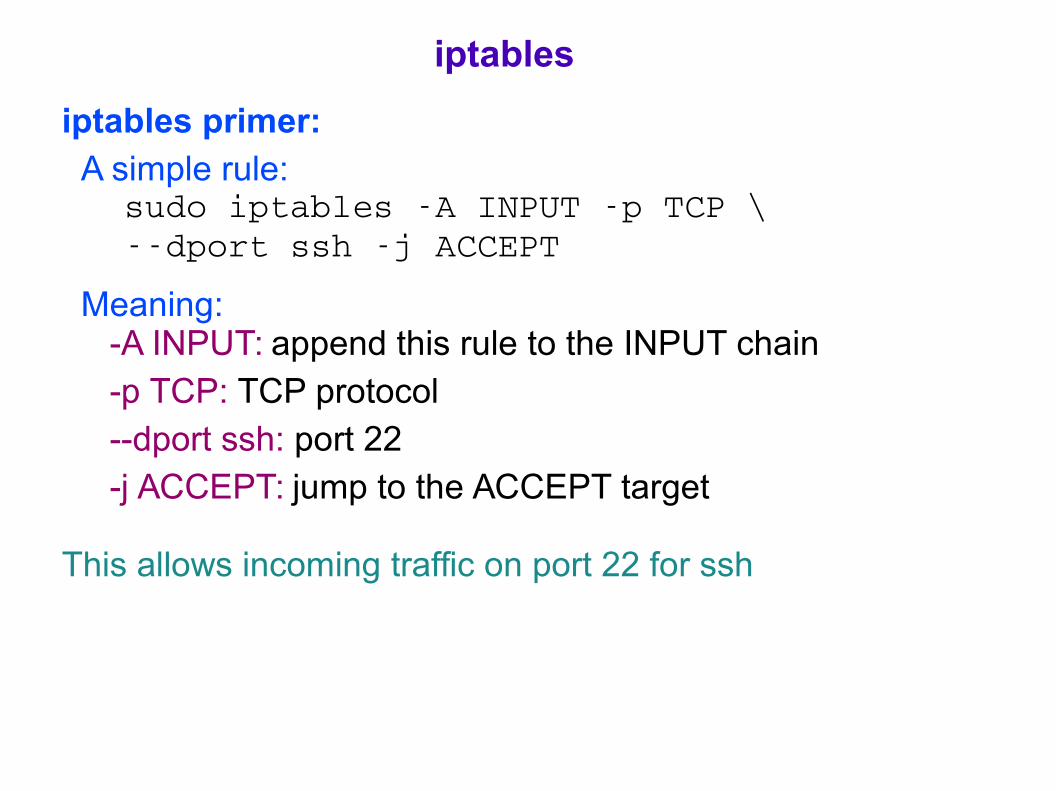
iptables primer: A simple rule: sudo iptables A INPUT p TCP \ dport ssh j ACCEPT
Meaning: -A INPUT: append this rule to the INPUT chain -p TCP: TCP protocol --dport ssh: port 22 -j ACCEPT: jump to the ACCEPT target
This allows incoming traffic on port 22 for ssh
iptables
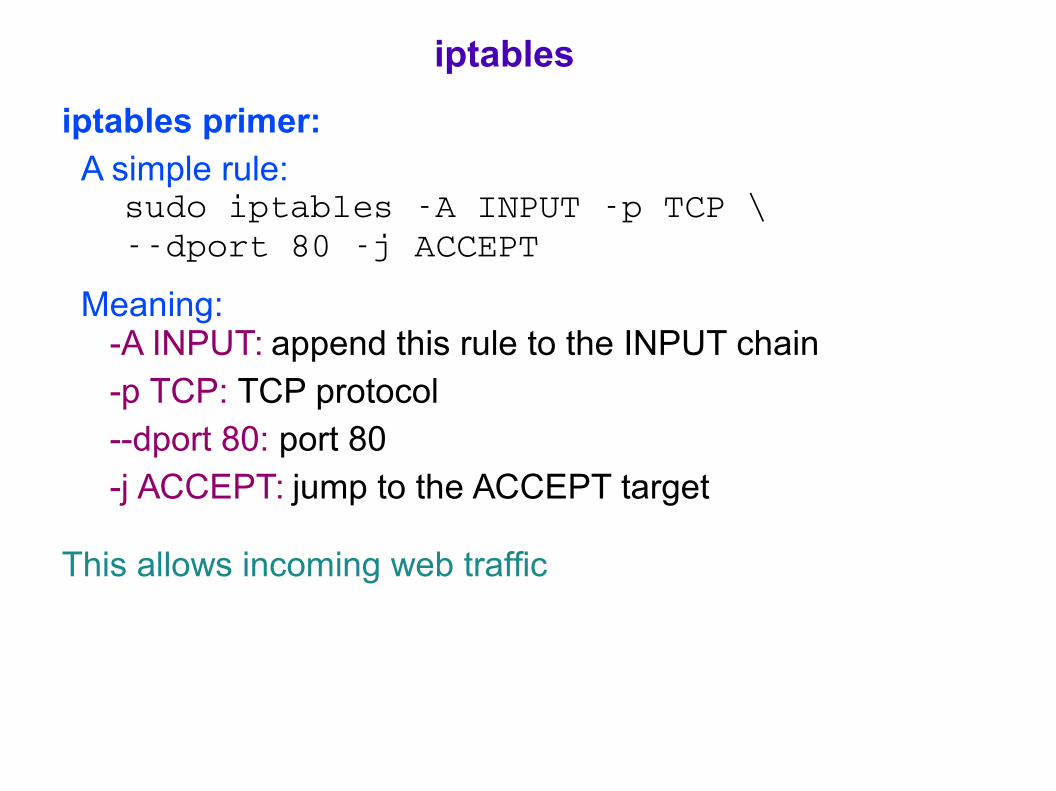
iptables primer: A simple rule: sudo iptables A INPUT p TCP \ dport 80 j ACCEPT
Meaning: -A INPUT: append this rule to the INPUT chain -p TCP: TCP protocol --dport 80: port 80 -j ACCEPT: jump to the ACCEPT target
This allows incoming web traffic
iptables
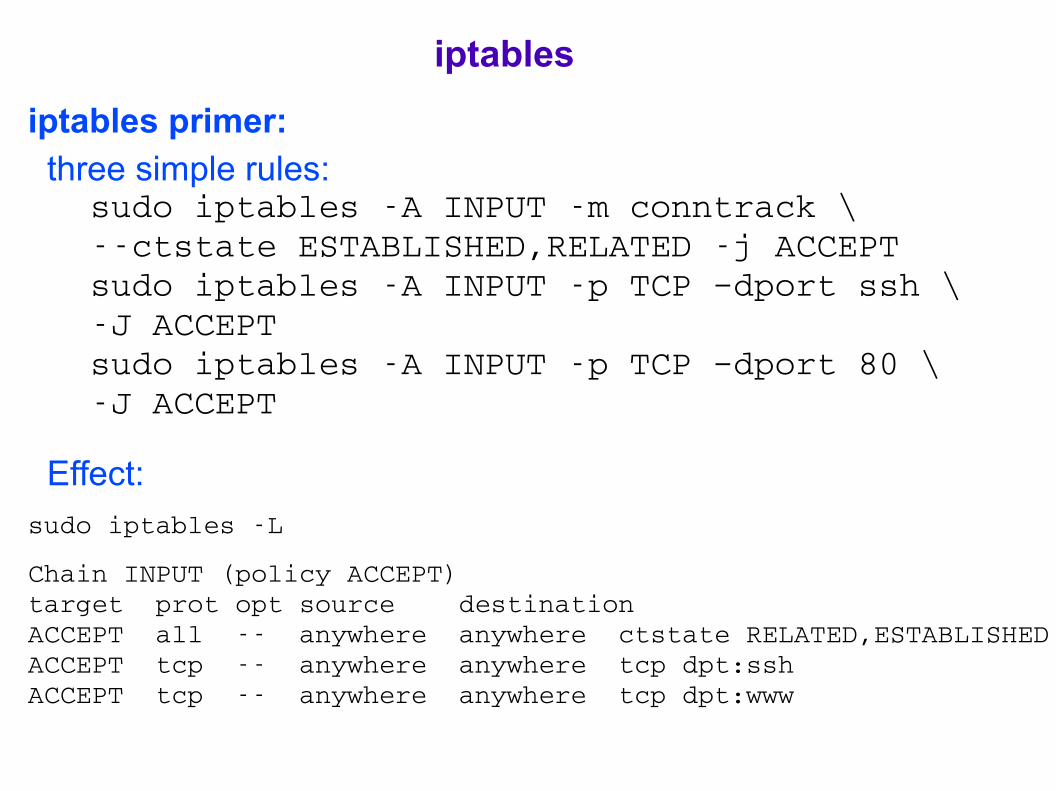
iptables primer: three simple rules: sudo iptables A INPUT m conntrack \ ctstate ESTABLISHED,RELATED j ACCEPT sudo iptables A INPUT p TCP –dport ssh \ J ACCEPT sudo iptables A INPUT p TCP –dport 80 \ J ACCEPT
Effect:sudo iptables L
Chain INPUT (policy ACCEPT)target prot opt source destination ACCEPT all anywhere anywhere ctstate RELATED,ESTABLISHEDACCEPT tcp anywhere anywhere tcp dpt:sshACCEPT tcp anywhere anywhere tcp dpt:www
iptables
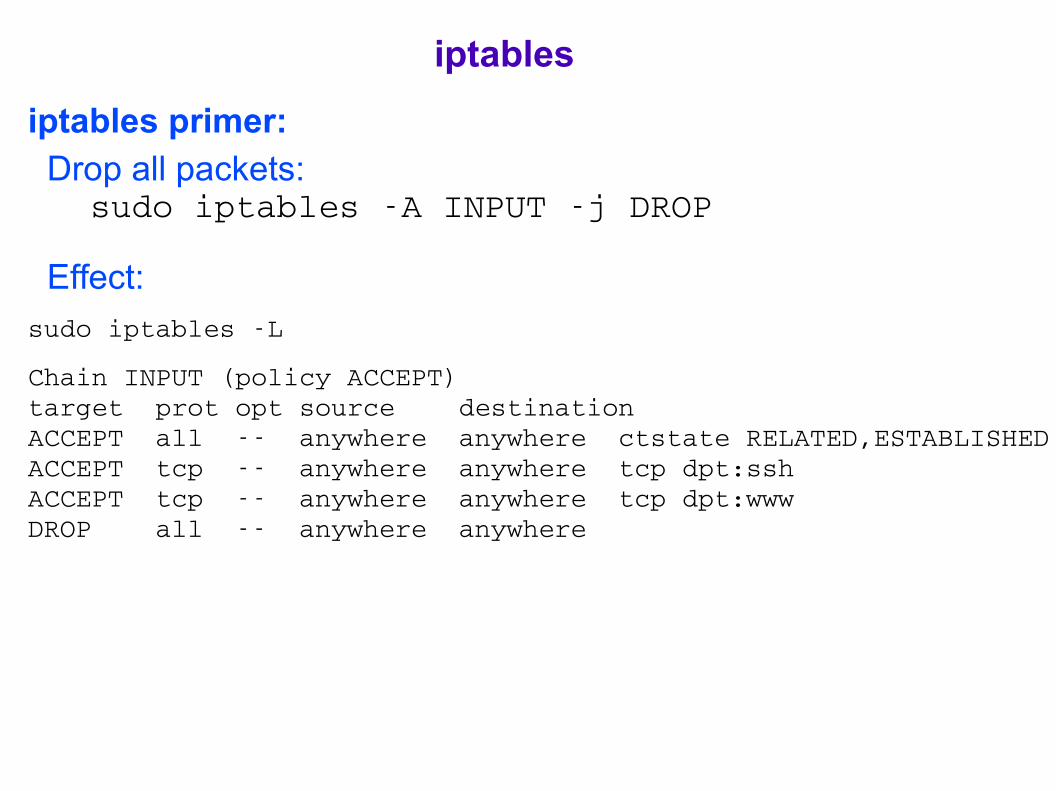
iptables primer: Drop all packets: sudo iptables A INPUT j DROP
Effect:sudo iptables L
Chain INPUT (policy ACCEPT)target prot opt source destination ACCEPT all anywhere anywhere ctstate RELATED,ESTABLISHEDACCEPT tcp anywhere anywhere tcp dpt:sshACCEPT tcp anywhere anywhere tcp dpt:wwwDROP all anywhere anywhere
iptables
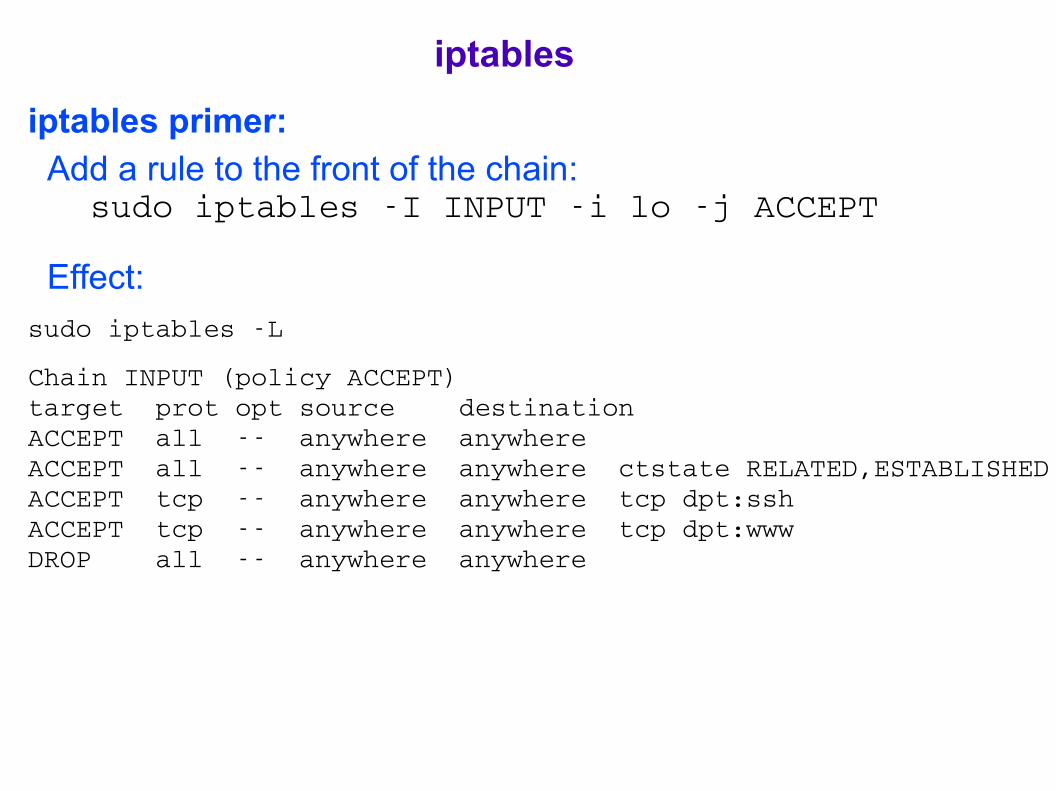
iptables primer: Add a rule to the front of the chain: sudo iptables I INPUT i lo j ACCEPT
Effect:sudo iptables L
Chain INPUT (policy ACCEPT)target prot opt source destination ACCEPT all anywhere anywhere ACCEPT all anywhere anywhere ctstate RELATED,ESTABLISHEDACCEPT tcp anywhere anywhere tcp dpt:sshACCEPT tcp anywhere anywhere tcp dpt:wwwDROP all anywhere anywhere
iptables
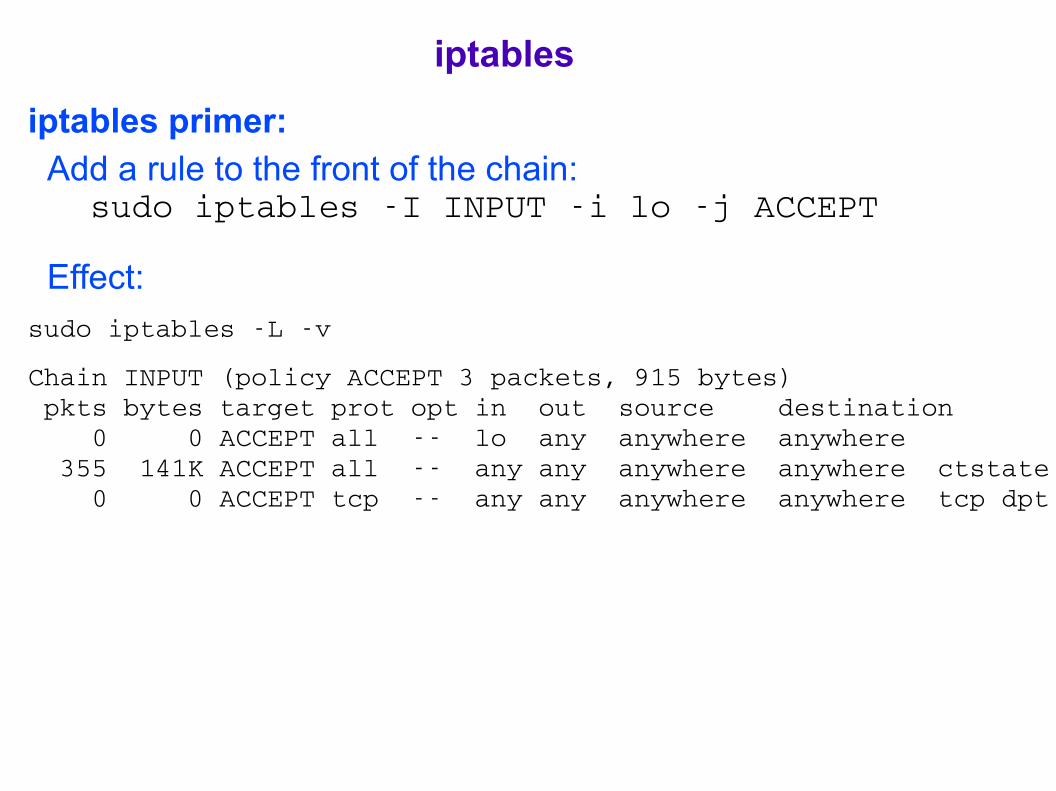
iptables primer: Add a rule to the front of the chain: sudo iptables I INPUT i lo j ACCEPT
Effect:sudo iptables L v
Chain INPUT (policy ACCEPT 3 packets, 915 bytes) pkts bytes target prot opt in out source destination 0 0 ACCEPT all lo any anywhere anywhere 355 141K ACCEPT all any any anywhere anywhere ctstate RELATED,ESTABLISHED 0 0 ACCEPT tcp any any anywhere anywhere tcp dpt:ssh
iptables
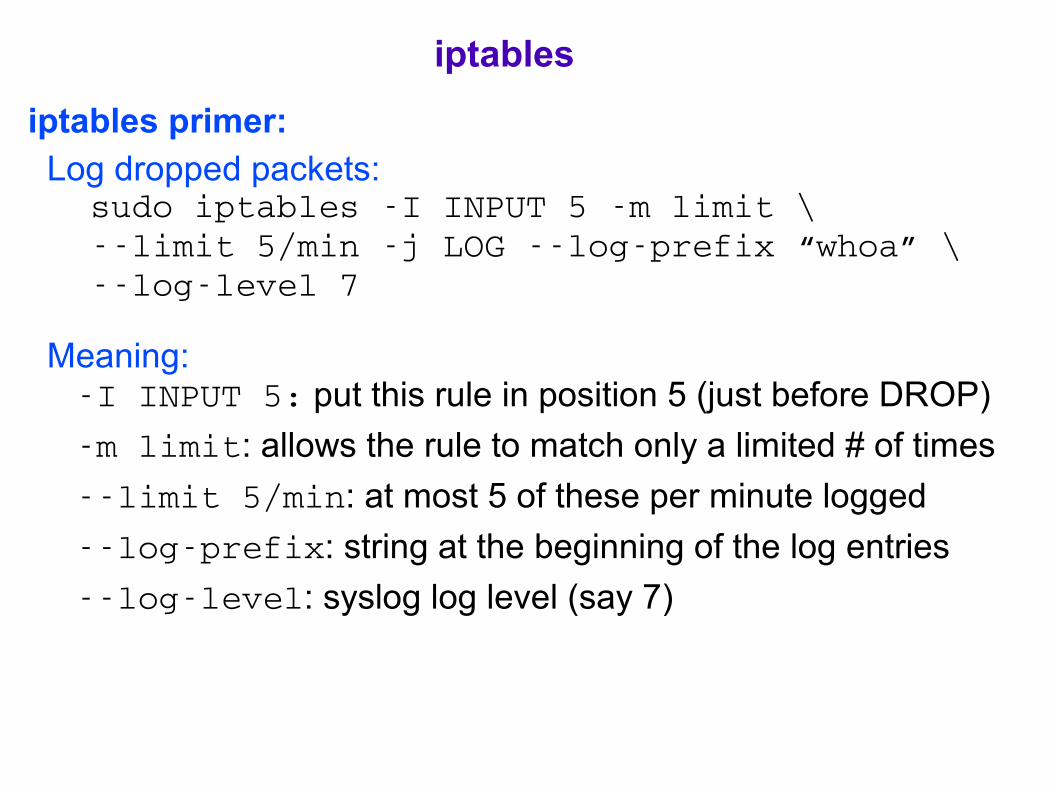
iptables primer: Log dropped packets: sudo iptables I INPUT 5 m limit \ limit 5/min j LOG logprefix “whoa” \ loglevel 7
Meaning: I INPUT 5: put this rule in position 5 (just before DROP)
m limit: allows the rule to match only a limited # of times
limit 5/min: at most 5 of these per minute logged
logprefix: string at the beginning of the log entries
loglevel: syslog log level (say 7)
iptables
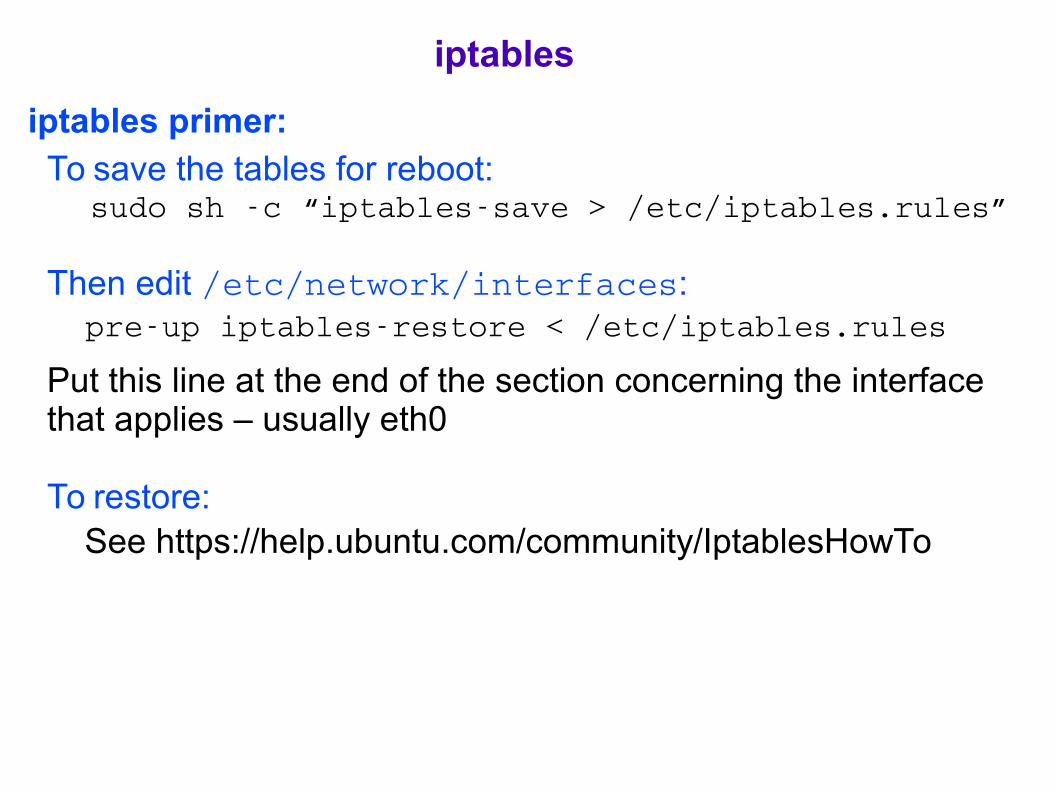
iptables primer: To save the tables for reboot: sudo sh c “iptablessave > /etc/iptables.rules”
Then edit /etc/network/interfaces: preup iptablesrestore < /etc/iptables.rules
Put this line at the end of the section concerning the interface that applies – usually eth0
To restore: See https://help.ubuntu.com/community/IptablesHowTo
iptables

iptables primer: Another example: iptables P INPUT ACCEPT iptables F iptables A INPUT p TCP dport 6881 j ACCEPT iptables A INPUT p TCP dport 6881:6890 j ACCEPT iptables A INPUT p tcp dport 22 j ACCEPT iptables A INPUT s 192.168.1.0/24 j ACCEPT iptables A INPUT s 192.168.1.23 m mac \ macsource xx:xx:xx:xx:xx:xx j ACCEPT iptables P OUTPUT ACCEPT
1st line: set policy to INPUT chain to ACCEPT2nd line: flush all the rules – with 1st line can connect remotely3rd line: accept bittorrent packets4th line: range of ports
iptables
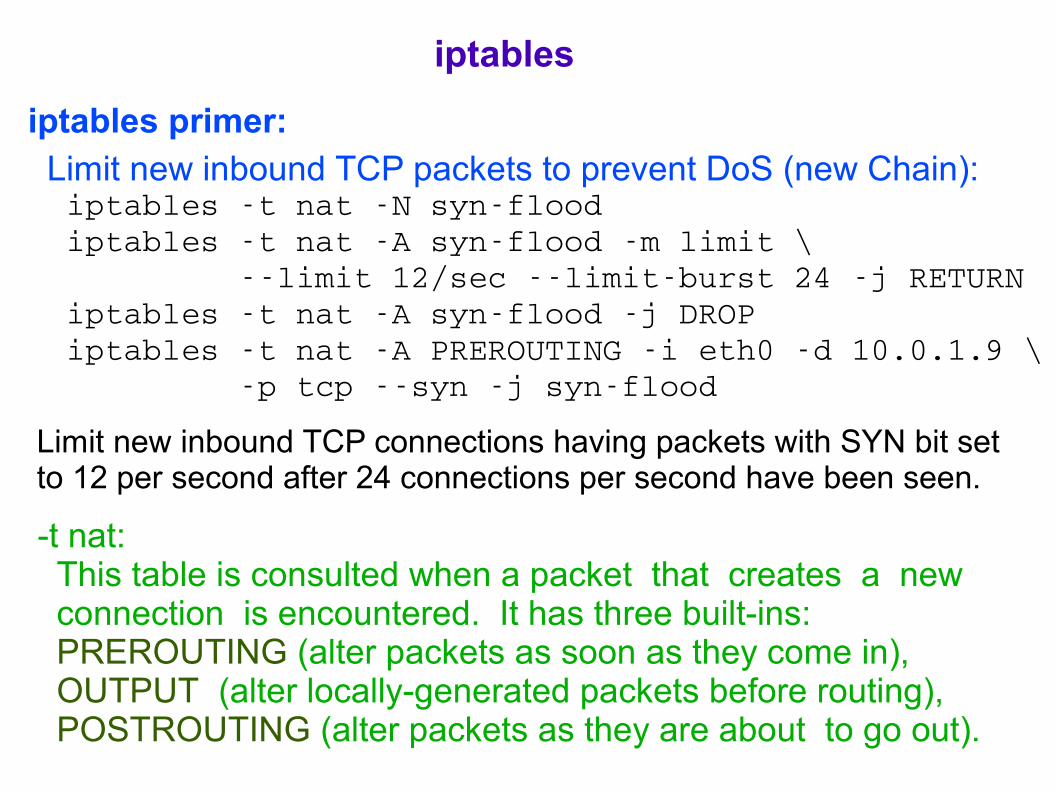
iptables primer: Limit new inbound TCP packets to prevent DoS (new Chain): iptables t nat N synflood iptables t nat A synflood m limit \ limit 12/sec limitburst 24 j RETURN iptables t nat A synflood j DROP iptables t nat A PREROUTING i eth0 d 10.0.1.9 \ p tcp syn j synflood
Limit new inbound TCP connections having packets with SYN bit set to 12 per second after 24 connections per second have been seen.
-t nat: This table is consulted when a packet that creates a new connection is encountered. It has three built-ins: PREROUTING (alter packets as soon as they come in), OUTPUT (alter locally-generated packets before routing), POSTROUTING (alter packets as they are about to go out).
iptables
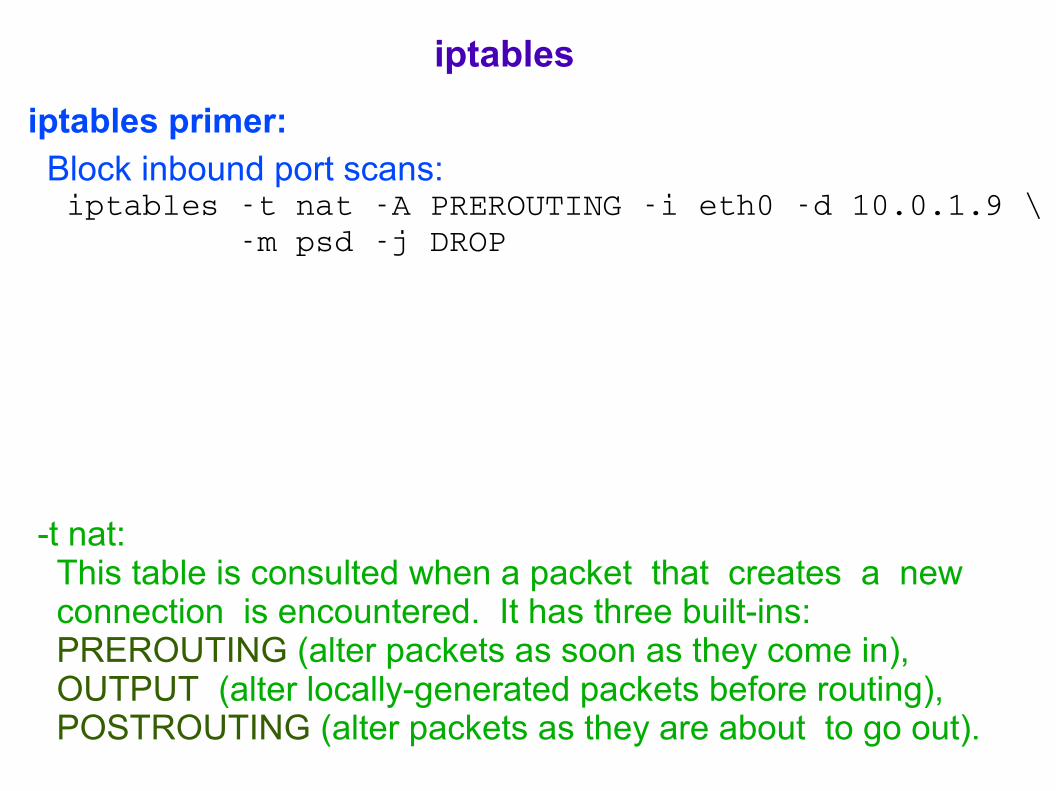
iptables primer: Block inbound port scans: iptables t nat A PREROUTING i eth0 d 10.0.1.9 \ m psd j DROP
-t nat: This table is consulted when a packet that creates a new connection is encountered. It has three built-ins: PREROUTING (alter packets as soon as they come in), OUTPUT (alter locally-generated packets before routing), POSTROUTING (alter packets as they are about to go out).
iptables
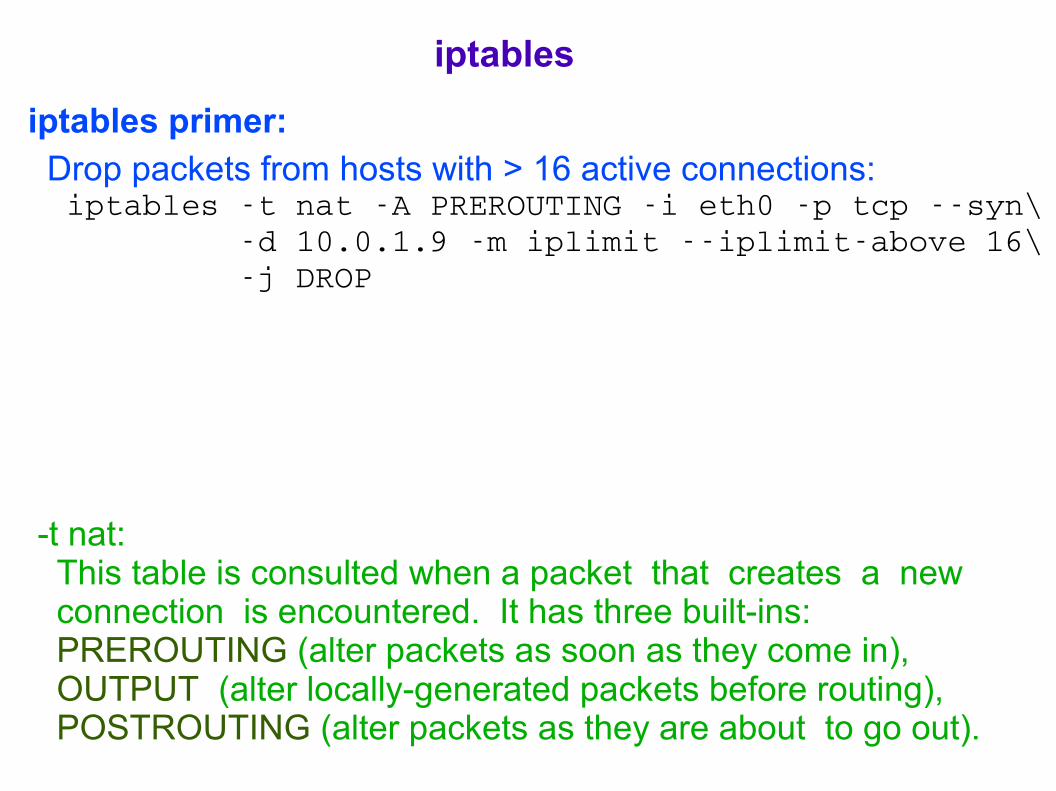
iptables primer: Drop packets from hosts with > 16 active connections: iptables t nat A PREROUTING i eth0 p tcp syn\ d 10.0.1.9 m iplimit iplimitabove 16\ j DROP
-t nat: This table is consulted when a packet that creates a new connection is encountered. It has three built-ins: PREROUTING (alter packets as soon as they come in), OUTPUT (alter locally-generated packets before routing), POSTROUTING (alter packets as they are about to go out).
iptables
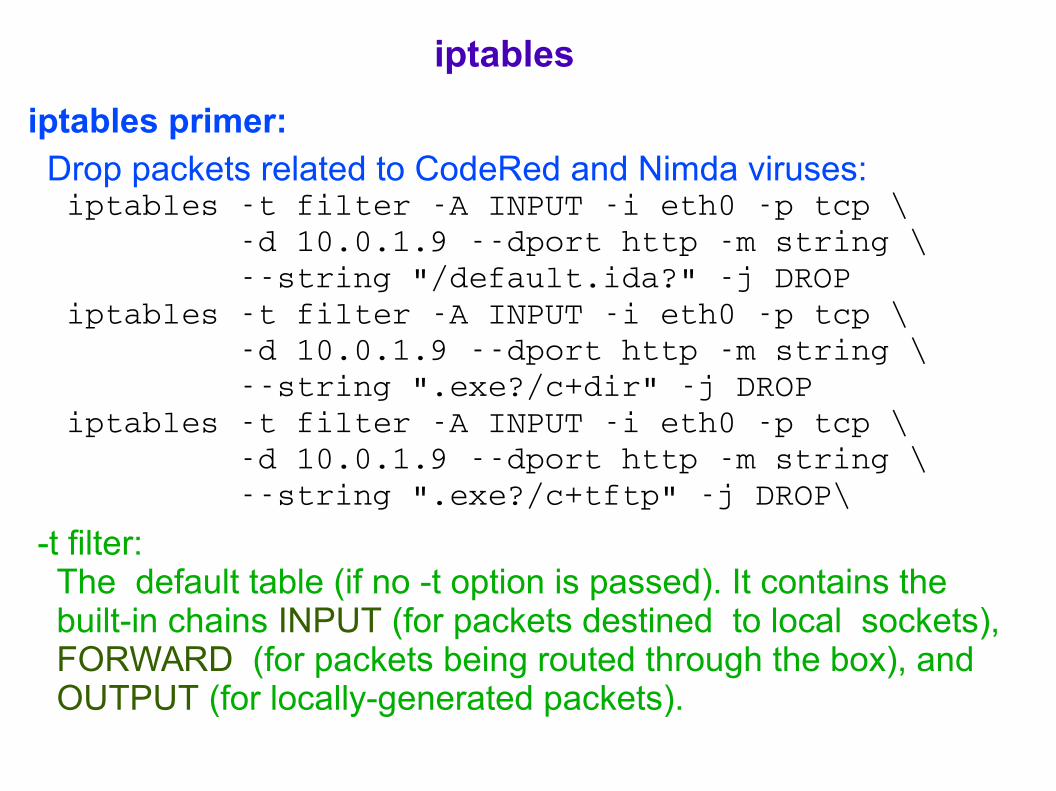
iptables primer: Drop packets related to CodeRed and Nimda viruses: iptables t filter A INPUT i eth0 p tcp \ d 10.0.1.9 dport http m string \ string "/default.ida?" j DROP iptables t filter A INPUT i eth0 p tcp \ d 10.0.1.9 dport http m string \ string ".exe?/c+dir" j DROP iptables t filter A INPUT i eth0 p tcp \ d 10.0.1.9 dport http m string \ string ".exe?/c+tftp" j DROP\
-t filter: The default table (if no -t option is passed). It contains the built-in chains INPUT (for packets destined to local sockets), FORWARD (for packets being routed through the box), and OUTPUT (for locally-generated packets).
iptables
Intended to detect and deflect, even counteract intruder activitiesthat would otherwise be directed against the org's network
Looks like something an intruder can hack – contains data andother items of interest to an intruder and seems to be a partof the org's network but is actually isolated from the network
Thus, honeypots are typically located in the network's DMZ
Designed to deceive intruders and to learn about their tools,methods, and motives without actually compromising thesecurity of the networkSuspicious traffic is diverted to the honeypot by the firewallHoneypot has numeorus vulnerabilities such as SQL injection
Honeypots