Embed Size (px)
Citation preview
INVESTIGATE WELDING PARAMETER OPTIMIZATION FOR WELD BEAD
SURFACE QUALITY USING MIG TECHNOLOGY
GARY ANAK JOHN
A project report submitted in partial fulfillment of the requirement for the award of
the
Degree of Master in Mechanical Engineering
Faculty of Mechanical and Manufacturing Engineering
University Tun Hussein Onn Malaysia
JANUARY 2014
v
ABSTRACT
Investigation of MIG welding parameter optimization for surface quality is
very important to improve the technology of MIG 3D welding application. Weld
bead size and shape are one of important considerations for design and
manufacturing engineers. These welding parameters affecting the arc and welding
bath should be estimated and their changing conditions during process must be
known before in order to obtain optimum results, in this case the quality surface of
overlap weld beads. The process parameters such as welding voltage, welding travel
speed and wire feet rate were studied. The experiments were conducted based on a
Three-factor, three-level and L9 using Taguchi method.
Taguchi methods applied to improve the quality of welding bead. Carbon
steel plate AISI 1015 is used as the work piece material for carrying out the
experimentation to optimize the surface quality and hardness value. Taguchi
orthogonal array is designed with three levels of welding parameters with the help of
software Minitab 16. Nine run experiments of single beads and nine runs for overlap
weld beads are performed, surface quality and hardness is calculated using the
minitap 16 software.
The surface roughness was considered as the quality characteristic with the
concept of "the smaller-the-better" and hardness “the larger-the-better. It is also
predicted that Taguchi method is a good method for optimization of various input
parameters as it reduces the number of experiments.
vi
ABSTRAK
Kajian kimpalan MIG dalam pengoptimuman parameter proses kimpalan
untuk kualiti permukaan adalah sangat penting dalam memperbaiki dan
meningkatkan teknologi kimpalan MIG khususnya dalam bidang kimpalan 3D. Saiz
kumai dan bentuk kumai adalah pertimbangan yang penting untuk rekabentuk dan
pembuatan kejuruteraan. Parameter proses kimpalan yang memberi kesan kepada
arka dan kumai harus dianggarkan dan perubahan keadaan semasa proses juga perlu
diketahui. Usaha sekarang adalah untuk mendapatkan hasil yang optimum untuk
kualiti permukaan kumai bertindih kimpalan. Parameter proses kimpalan seperti
voltan, kelajuan kimpalan dan kadar kemasukan wayar telah dikaji. Kajian ini telah
dijalankan berdasarkan tiga faktor, tiga peringkat dan L9 menggunakan kaedah
Taguchi.
Kaedah Taguchi digunakan dalam kajian untuk meningkatkan kualiti kumai.
Plat keluli karbon AISI 1015 digunakan sebagai bahan benda kerja bagi menjalankan
ujikaji dalam pengoptimuman kualiti permukaan dan nilai kekerasan. Pelbagai
ortogon Taguchi direka untuk tiga tahap parameter kimpalan dengan bantuan
perisian Minitab 16. Sembilan ujikaji dilakukan dalam kumai lurus sementara
sembilan lagi untuk kumai bertindih kimpalan. Kualiti permukaan dan kekerasan
dikira menggunakan perisian MINITAB 16.
Kekasaran permukaan dianggap sebagai ciri kualiti dengan konsep "yang
lebih kecil-lebih baik" dan kekerasan kumai "yang lebih besar-lebih baik. Kaedah
Taguchi adalah kaedah yang baik untuk pengoptimuman pelbagai parameter input
kerana ia mengurangkan bilangan uji kaji.
vii
CONTENTS
TITLE i
DECLARATION ii
DEDICATION iii
ACKNOWLEDGEMENT iv
ABSTRACT v
CONTENTS vii
LIST OF TABLES xi
LIST OF FIGURES xiv
CHAPTER 1 INTRODUCTION 1
1.1 Metal Inert Gas welding (MIG) 1
1.2 Background of the study 2
1.3 Problem Statement 3
1.4 Research Objectives 4
1.5 Scope of Study 4
1.6 Dissertation Summary 4
CHAPTER 2 LITERATURE REVIEW 6
2.1 3-D Welding 6
2.2 Welding Parameter 7
2.3 Weld Bead Geometry 11
2.4 Taguchi Optimization Method 12
viii
CHAPTER 3 METHODOLOGY 15
3.1 Introduction 15
3.2 Research methodology 17
3.3 Design of Experiment (DOE) 17
3.4 Conduct Experiment and Data Collection 18
3.5 Data Validation and Optimization 19
3.6 Project Sample 20
3.6 Validation of the Sample 21
3.7 Laboratory Testing 22
3.7.1 Surface Roughness Test 22
3.7.3 Hardness Test 24
3.8 Data Analysis and Interpretation 26
3.9 Summary 28
CHAPTER 4 EXPERIMENTAL SETUP 29
4.1 Based Metal 29
4.2 MIG Welding Machine 31
4.3 Customized semi-automated MIG welding 33
4.4 Welding Input Parameter Sample Setup 38
4.5 Inspection for Validation 40
4.6 Summary 40
CHAPTER 5 RESULT AND DISCUSSION 41
5.1 Surface Roughness and Hardness of Single
Weld Bead 41
5.1.1 Graph Input Parameter Versus Surface Roughness 44
and Hardness Rockwell For Single Weld Bead
Analysis
5.1.2 Single Bead Weld Bead Surface Visual 47
Observation
ix
5.1.3 Taguchi Analysis by Minitab software for Means 53
of Surface Roughness and Hardness Rockwell for
Single Bead Welding
5.1.3.1 Surface Roughness Of Single Weld Bead 53
5.1.3.2 Hardness of Single Weld Bead 57
5.2 Surface Roughness and Hardness of Overlap Weld Bead 60
5.2.1 Graph Input Parameter versus Surface Roughness 64
and Hardness Rockwell for Overlap Weld Bead
Analysis
5.2.2 Overlap Weld Bead Sample Surface Visual 68
Observation
5.2.3 Taguchi Analysis by Minitab software for Means 73
of Surface Roughness and Hardness Rockwell for
Overlap Weld Bead
5.2.3.1 Vertical Direction Surface Roughness of 73
Overlap Weld Bead Sample
5.2.3.2 Longitudinal Direction Surface Roughness 77
of Overlap Weld Bead Sample
5.2.3.3 Surface Roughness Of Overall Direction 80
Overlap Weld Bead Sample
5.2.3.4 Hardness Value of Overlap Welding Bead 83
5.3 Summary and Discussion of the Result 86
CHAPTER 6 CONCLUSION AND RECOMMENDATIONS 89
6.1 Novelty of the Research 89
6.1.1 Develop the Overlapping model 89
6.2 Conclusion 91
6.3 Recommendation 92
REFERENCES 93
APPENDIX I 97
APPENDIX II 102

x
APPENDIX III 105
APPENDIX IV 110
xi
LIST OF TABLES
TABLE NO. TITLE PAGE
2.1 Effect on measured variable 9
3.1 Welding parameters and their level 18
3.2 Taguchi design L9(3**3) for input value parameter setting 18
of single bead
3.3 Taguchi design L9(3**3) for input value parameter setting of 19
overlap welding bead
3.5 Prepared Data Table of Surface roughness Ra and Hardness 26
Rockwell A for single weld bead
3.6 Prepared Data Table of Surface roughness Ra and Hardness 27
Rockwell A for overlap weld bead
4.1 Composition of carbon steel plate AISI 1015 (Budinski,1999) 29
4.2 Properties of carbon steel plate AISI 1015 (Budinski,1999) 29
4.3 Specification of MIG welding machine (Ltd, 2012) 31
4.4 Specification composition of wire ER70S-6 32
4.5 Constant parameter 38
4.6 Input Parameter and range 39
4.7 Defined parameter 39
4.8 Input parameter setting for welding process for single and 39
overlap weld bead samples
5.1 Input variables for 9 runs; 3 levels and 4 factors 41
5.2 Constant factor considered in single weld bead 42
xii
5.3 Surface roughness Ra and Hardness Rockwell scale A 43
Result
5.4 Response table for signal to noise ratios of surface 53
roughness
5.5 Response table for means 54
5.6 Optimum factor value for single weld bead surface 56
roughness
5.7 Response Table for Signal to Noise Ratios of Hardness 57
Single weld bead
5.8 Response table for Means of single weld bead hardness 57
5.9 Input parameter’s rank in impact on hardness of single 58
weld bead
5.10 Optimum input parameter value for hardness of single 60
bead weld bead
5.11 Constant parameters which were considered in overlapping 61
weld bead
5.12 Input variables for 9Runs, 3Levels and 3 Factors 61
5.13 Surface Roughness RA for vertical and longitudinal 63
direction of weld bead and Hardness Rockwell A scale
results
5.14 Response table for Signal to Noise Ratios of vertical 73
direction surface roughness for overlap weld bead
5.15 Response table for Means of vertical direction surface 74
roughness for overlap welding bead
5.16 Optimum parameter value for vertical direction surface 76
roughness of overlap welding bead
5.17 Response Table for Signal to Noise Ratios of Longitudinal 77
direction Surface Roughness for overlap weld bead
5.18 Response Table for Means of Longitudinal direction Surface 77
Roughness for overlap welding bead
5.19 Optimum factor value for longitudinal direction surface roughness 79
of overlap welding bead
5.20 Response table for signal to noise ratios of overall surface 80
xiii
roughness for overlap weld bead
5.21 Response table for Means of overall surface roughness for overlap 80
weld bead
5.22 Optimum factor value for overall surface roughness of overlap 83
welding bead
5.23 Response Table for Signal to Noise Ratios of Hardness Overlap 83
Welding Bead.
5.24 Response Table for Means of Hardness Overlap Welding Bead 84
5.25 Factor’s rank of impact on hardness HRA of overlap welding bead 84
5.26 Optimum factor value for hardness of overlap welding surface 86
xiv
LIST OF FIGURES
FIGURE NO. TITLE PAGE
2.1 Square box formation by 3D formation (Dr P M Dickens) 7
2.2 Simple overlapping parabolic pattern 11
2.3 Multi bead profile in the initial model 11
2.4 Sketch of overlapping model by yong Cao et al 12
3.1 Single weld bead sample 21
3.2 Overlap weld bead sample 21
3.3 TWI Welding Gauge (Cambridge Gauge) (GAU/0002) 22
3.4 Vertical and longitudinal surface roughness measurement 23
direction
3.5 Trail of surface roughness indenter on the weld bead peak 23
3.6 Mitutoyo SJ-400 machine 24
3.7 Wilson Rockwell hardness tester machine using Rockwell A scale 25
3.8 Hardness test indenter point on the weld bead peak 25
4.1 Based metal cleaned by wire brush grinder 30
4.2 Based metal of the weldment sample 30
4.3 Uni-Arc MIG-200A welding machine 31
4.4 Specification composition of wire ER70S-6 32
xv
4.4 Travel car used in the customized semi-automated MIG welding 33
4.5 Torch mounted at control car arm 33
4.6 Torch position and angle 34
4.7 Torch angle and nozzle to plate distance 34
4.8 Welding process on the based metal for single weld bead sample 35
4.9 Three runs for every sample 35
4.10 Overlap welding bead sample 36
4.11 Torch angle for 1st run of overlap weld bead sample 36
4.12 Overlapping weld bead torch angle from end view of work angle 37
4.13 Torch push technique 37
5.1 Single bead welding for nine (9) samples 42
5.2 Comparison of wire speed rate and response at the voltage 18.7V 45
for single weld bead
5.3 Comparison of wire speed rate and response at the voltage 19.8V 46
for single weld bead
5.4 Comparison of wire speed rate and response at the voltage 20.9V 47
for single weld bead
5.5 Sample A 48
5.6 Sample B 48
5.7 Sample C 49
5.8 Sample D 49
5.9 Sample E 50
5.10 Sample F 50
.
5.11 Sample G 51
5.12 Sample H 52
5.13 Sample I 52
xvi
5.14 Main effect plot for S/N ratios of surface roughness single 55
weld bead
5.15 Main effect plot for means of surface roughness single weld bead 55
5.16 Main Effect Plot for S/N ratios of Hardness Single Bead Welding 59
Surface
5.17 Main Effect Plot for Means of Hardness Single Bead Welding 59
Surface
5.18 Overlapping welding bead for 9 samples runs 62
5.19 Surface roughness reading direction 63
5.20 Comparison of wire speed rate, surface roughness and hardness 65
with the voltage at 18V for overlap weld bead
5.21 Comparison of wire speed rate, surface roughness and hardness 66
with the voltage at 19.8V for overlap weld bead
5.22 Comparison of wire speed rate, surface roughness and hardness 67
with the voltage at 20.9V for overlap weld bead
5.23 Sample 1 68
5.24 Sample 2 69
5.25 Sample 3 69
5.26 Sample 4 70
5.27 Sample 5 70
5.28 Sample 6 71
5.29 Sample 7 71
5.30 Sample 8 72
5.31 Sample 9 72
5.32 Main Effect Plot for S/N ratios of Surface Roughness 75
Vertical direction Surface Roughness for overlap welding bead
5.33 Main Effect Plot for Means of Surface Roughness Vertical 75
direction Surface Roughness for overlap welding bead
5.34 Main Effect Plot for S/N ratios of longitudinal direction 78
xvii
surface roughness for overlap welding bead
5.35 Main effect plot for Means of longitudinal direction surface 78
roughness for overlap weld bead
5.36 Main Effect Plot for S/N ratios of Surface Roughness for 81
overlap welding bead
5.37 Main Effect Plot for Means of Surface Roughness overall 82
direction for overlap welding bead
5.38 Main effect plot for S/N ratios of hardness overlap welding bead 85
5.39 Main effect plot for means of hardness overlap welding bead 85
5.34 Single weld bead sample welded using setting of optimization 87
result for surface roughness by Taguchi analysis Minitap 16
5.35 Overlap weld bead sample welded using setting of optimization 88
result for surface roughness by Taguchi analysis Minitap 16
6.1 cross section of weld bead 90
6.2 Scan spacing of overlap bead, where: a. big overlaps bead scan 90
spacing b. small overlaps bead scan spacing c. perfect overlaps
bead scan spacing
6.3 Torch angle from front view of the cross section bead 91
CHAPTER 1
INTRODUCTION
1.1 Metal Inert Gas welding (MIG)
Metal inert gas welding (MIG) is one of the welding types of gas metal arc welding
(GMAW). It is a welding process in which an electric arc forms between a
consumable wire electrode and the metal work piece. In this welding process, the
heat be will generate through the jumping current of the gap of wire electrode and the
work piece metal, causing them to melt, and join. A shielding gas feeds through the
welding gun along with the wire electrode. This shielding gas shields the melting
metal from contaminants in the atmosphere air.
This welding method is a semi-automatic welding process which is
continuous and consumable wire electrode. In Metal Inert Gas welding, a constant
voltage, direct current power source is most commonly used with GMAW, but
constant current systems, as well as alternating current, can be used (Ajit Hooda1*,
2012). Investigation of MIG welding parameter optimization for surface quality is
very important in improvement of the 3D MIG welding technology application.
Weld bead size and shape are important considerations for design and manufacturing
engineers. These welding parameters affecting the arc and welding bath should be
estimated and their changing conditions during process must be known before in
order to obtain the optimum results, in this case the quality surface of layered weld
bead.
2
1.2 Background of the study
In welding process, there are parameters need to be consider in concern to obtain the
objective characteristic of weld bead. To develop 3-D welding technology, two
characteristics of weld bead need to be improve, surface quality and mechanical
strength. The shape and dimensions of the weld bead are very important in the use of
3-D welding as a Rapid Prototyping system, these will determine the strength of wall
and shape produced product and this characteristic will influence the quality of the
surface finish. To obtain this, optimization parameter in this MIG welding need to be
study. These parameters affecting the arc and welding bath should be estimated and
their changing conditions during process must be determine in order to obtain
optimum results. A perfect arc can be achieved when all the parameters are in
conformity. In MIG welding process, there is several important parameters need to
concern. These parameters are arc voltage welding current, amperage, travel speed,
wire feed speed, torch angle, free wire length, nozzle distance, welding direction,
electrode extension, welding position and the flow rate of gas. However, wire
electrode diameter and its composition, type of protective gas are the defined
parameters before starting welding and cannot be changed during the process
(Olabi).
Theoretical studies of a complex physical problem like MIG welding process
are made based on a number of assumptions, to make the model simpler and as a
result of which, it might be difficult to determine its input–output relationships
accurately. Difficulties associated with the above theoretical studies will arise, some
researchers have tried to establish input–output relationships of a process through
statistical analysis of the parameter effect. The properties such as weld-bead
geometry, mechanical properties can define the quality of weld bead. Generally, all
welding processes are used with the aim of obtaining a welded joint and the weld
bead with the desired parameters, excellent mechanical properties with quality
surface. In order to determine the welding input parameters that lead to the desired
weld quality, application of Design of Experiment (DOE), through Taguchi method
are widely used to develop a mathematical relationship between the welding process
input parameters and the output variables of the weld joint (Cary, 1989).
3
1.3 Problem Statement
Surface quality comes together with good mechanical properties is very important
aspect in development of 3-D welding technology. This study will focus on overlap
weld bead. By obtaining this good surface quality characters mean will save cost and
production time of the production welding printing. The good surface quality of
welding bead will lead to reduction of finishing process of the product by means the
process of the milling process can be skip. The present work aim is to determine the
input–output relationships of a MIG welding process. Without the optimization
parameter to obtain best surface quality of weld bead, these two aspects will hard to
be developed. Investigation in this project is to establish relations between the
process parameters (inputs) and responses (outputs) for overlap welding bead in MIG
welding process (Y.S. Tarng, 1998). This researcher tried to obtain the optimized
weld bead geometry in GTAW by using the modified Taguchi method. The modified
Taguchi method allowed the simultaneous consideration of all the weld pool
geometry quality characteristics for optimization. In Tarng research, overlap surface
roughness were not been determine.
In a related research (Wurikaixi Aiyiti, 2006), a simplified overlapping model
between deposited tracks was established to investigate the relationships among the
overlapping parameters, such as the ratio of width to height of the deposited track
cross-section , scan spacing and overlapping ratio were studied and the finding was
the overlapped surface smoothness, tensile strength and elongation of the parts built
with larger width bead were better than those built with smaller width bead. The
researcher was not study the welding process guideline to obtain the smoothness
overlap weld bead in term of the angle setting of welding torch of overall overlap
weld bead welding process. The combination between the process parameters
(inputs) and responses (outputs) for overlap welding bead in MIG welding process
are complete if there is no welding process technique being applied on the
overlapping process such the setting of the torch angle and also the interval break
time for every stringer bead.
4
1.4 Research Objectives
There are three (3) objectives in this research. The objectives are:
i. To investigate optimization parameter in MIG welding technology for surface
quality of overlap welding beads.
ii. Evaluation the surface quality of overlap weld bead using the Taguchi
method.
iii. To propose welding process guidance for having good surface finish of weld
bead.
1.5 Scope of Study
There are several scopes of study in this investigation. The scopes are:
i. Study focus on welding parameter of Voltage, travel speed, and wire feed
rate.
ii. The carbon steel metal wire feeler ER70S-6 used in this experimental work
for investigates the optimization parameter of the overlap and single weld
bead surface quality.
iii. Carbon steel plate AISI 1015 with the dimension of 50 X 100 X 5 mm was
selected as subtract for as based metal for the samples of weld bead.
iv. Investigation focus on single weld bead and overlap weld bead.
1.6 Dissertation Summary
Investigation of MIG welding parameter optimization for surface quality is very
important improvement the technology of MIG welding in 3D welding application.
Weld bead size and shape are important considerations for design and manufacturing
engineers. These welding parameters affecting the arc and welding bath should be
estimated and their changing conditions during process must be known before in
order to obtain optimum results, in this case the quality surface of overlap weld
beads. The process parameters such as welding voltage, welding travel speed and
5
wire feet rate were studied. The experiments were conducted based on a Three-
factor, three-level and L9 using Taguchi method.
Taguchi methods applied to improve the quality of welding bead and
engineering development of designs for studying variation. Carbon steel plate AISI
1015 is used as the work piece material for carrying out the experimentation to
optimize the surface quality and hardness value for single and overlap weld bead.
Different experiments are done by varying one parameter and keeping other two
fixed so maximum value of each parameter was obtained. The combination between
the process parameters (inputs) and responses (outputs) for overlap welding bead in
MIG welding process are complete if there is no welding process technique being
applied on the overlapping process such the setting of the torch angle and also the
interval break time for every stringer bead.
6
CHAPTER 2
LITERATURE REVIEW
This chapter is presented the literature review of selected journal, articles, reference
book, thesis and online source. Keywords of this study are welding parameter, weld
bead geometry and Taguchi optimization.
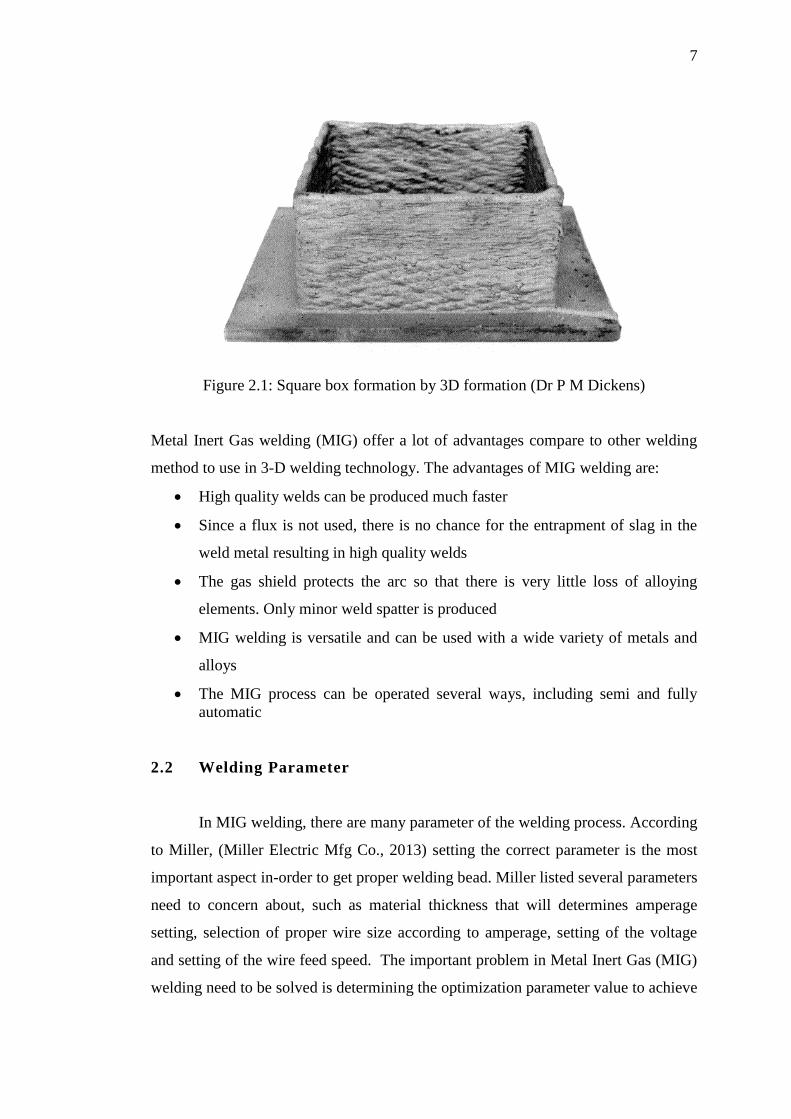
2.1 3-D Welding
Rapid Prototyping systems based on 3D welding are now being attraction to
some researcher groups because it can directly build fully dense metal components
with relatively lower costs. As a production technique, 3-D welding offers significant
advantages over conventional processing, these include the potential for robot control
of the welding torch allowing large variation in part dimensions and geometry. This
technique also can be highly automated system. Parts produce by 3-D welding will
provide consistent properties with rapid processing times, hence vastly reduced
development times besides efficient use of materials. Through the mass transfer by
direct melting the welding electrode, direct production of a metal part are the most
unique amongst current Rapid Prototyping (J.P. Ganjigatti).
7
Figure 2.1: Square box formation by 3D formation (Dr P M Dickens)
Metal Inert Gas welding (MIG) offer a lot of advantages compare to other welding
method to use in 3-D welding technology. The advantages of MIG welding are:
High quality welds can be produced much faster
Since a flux is not used, there is no chance for the entrapment of slag in the
weld metal resulting in high quality welds
The gas shield protects the arc so that there is very little loss of alloying
elements. Only minor weld spatter is produced
MIG welding is versatile and can be used with a wide variety of metals and
alloys
The MIG process can be operated several ways, including semi and fully
automatic
2.2 Welding Parameter
In MIG welding, there are many parameter of the welding process. According
to Miller, (Miller Electric Mfg Co., 2013) setting the correct parameter is the most
important aspect in-order to get proper welding bead. Miller listed several parameters
need to concern about, such as material thickness that will determines amperage
setting, selection of proper wire size according to amperage, setting of the voltage
and setting of the wire feed speed. The important problem in Metal Inert Gas (MIG)
welding need to be solved is determining the optimization parameter value to achieve
8
desire characteristic aspect of weld bead. According to Miller, setting the correct
parameter is the most important aspect in-order to get proper weld bead. Miller listed
several parameters need to concern about, such as material thickness that will
determines amperage setting, selection of proper wire size according to amperage,
setting of the voltage and setting of the wire feed speed.
Regarding to ugur etc, (Ugur Esme, Melih Bayramoglu, Yugut Kazancoglu,
Sueda Ozgun, 2009) in similar research, affecting parameters on the arc and welding
bath should be estimated and their changing conditions during process must be
known before in order to obtain optimum results; in fact a perfect arc can be
achieved when all the parameters are in conformity. These are combined in two
groups as first order adjustable and second order adjustable parameters defined
before welding process. Former are welding current, arc voltage and welding speed,
and later are torch angle, free wire length, nozzle distance, welding direction,
position and the flow rate of gas. However, wire electrode diameter and its
composition, type of protective gas are the defined parameters before starting
welding and cannot be changed during the process.
A common problem that has faced the manufacturer is the control of the
process input parameters to obtain a good welded joint with the required bead
geometry and weld quality with minimal detrimental residual stresses and distortion.
It has been necessary to determine the weld input parameters for every new welded
product to obtain a welded joint with the required specifications (Olabi). There are
four primary methods of metal transfer in GMAW, called globular, short-circuiting,
spray, and pulsed-spray, each of which has distinct properties and corresponding
advantages and limitations (Radaj, 1992).
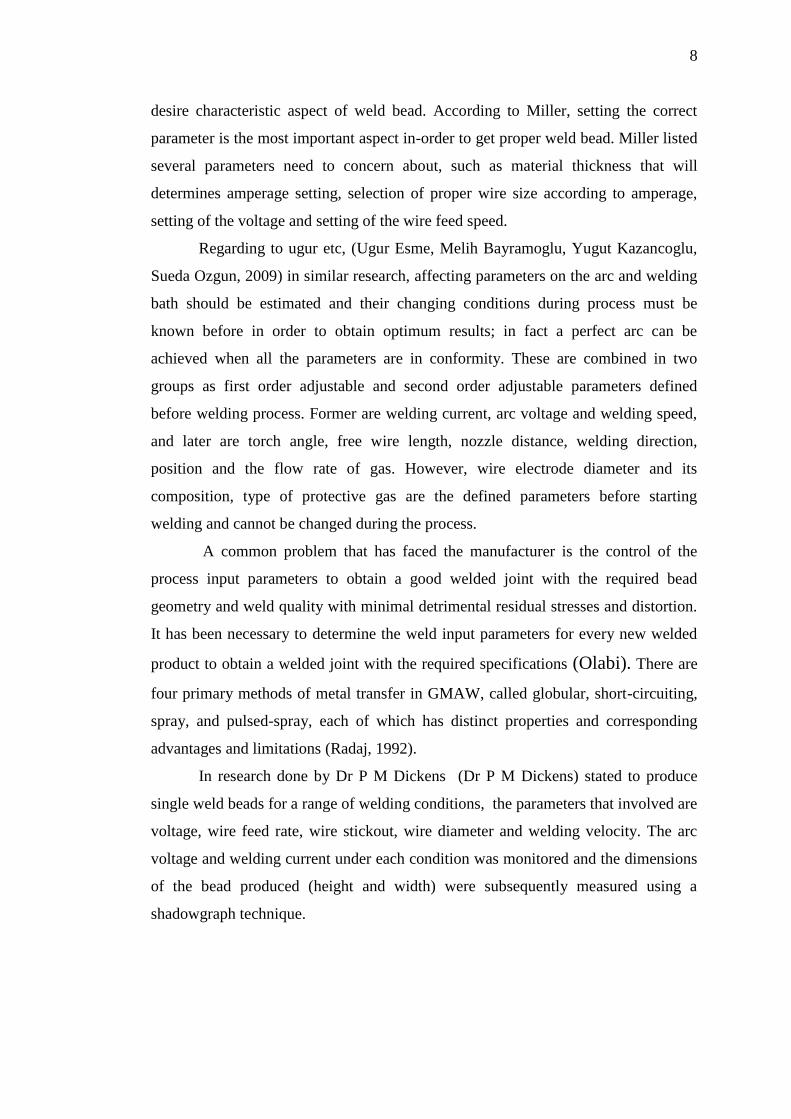
In research done by Dr P M Dickens (Dr P M Dickens) stated to produce
single weld beads for a range of welding conditions, the parameters that involved are
voltage, wire feed rate, wire stickout, wire diameter and welding velocity. The arc
voltage and welding current under each condition was monitored and the dimensions
of the bead produced (height and width) were subsequently measured using a
shadowgraph technique.
9
Table 2.1: Effect on measured variable (Dr P M Dickens).
Voltage determines height and width of bead. There is a relationship between
arc voltage and arc length. A short arc decreases voltage and yields a narrow, "ropey"
bead. A longer arc (more voltage) produces a flatter, wider bead. Too much arc
length produces a very flat bead and a possibility of an undercut (Miller Electric Mfg
Co. , 2013)
There are several types of metal transfer modes in MIG welding. There are
globular, short-circuiting, spray and pulse-spray metal transfer mode. In Globular
mode, it produces high heat, a poor weld surface, and spatter. Welding speeds of up
to 110 mm/s (250 in/min) allowing will high deposition rate in short-circuiting mode.
The lower current than that is for the globular method. Lower current also makes the
heat input for the short-arc variation considerably reduced, making it possible to
weld thinner materials while decreasing the amount of distortion and residual stress
in the weld area. Globular and short-circuiting metal transfer modes can only be used
on ferrous metals. Short-circuiting metal transfer provides better weld quality and
fewer spatters than the globular variation. To maintaining a stable arc, the setting of
weld process parameters such as volts, amps and wire feed rate within a relatively
narrow band is critical, generally between 100 to 200 amperes at 17 to 22 volts for
most applications. The disadvantages of using short-arc transfer mode will lead to
lack of fusion and insufficient penetration when welding thicker materials. This is
due to the lower arc energy and rapidly freezing weld pool.
The other mode of metal transfer in MIG welding is spray mode. This mode
well-suited to welding aluminum and stainless steel while employing an inert
10
shielding gas. In MIG welding process, the weld electrode metal is rapidly passed
along the stable electric arc from the electrode to the work piece, essentially
eliminating spatter and resulting in a high-quality weld finish. Vaporized spray
transfer mode in welding process requires higher voltage and current than short
circuit transfer. This transfer mode commonly used only on work pieces of
thicknesses above about 6.4 mm. Apart of that, the large weld pool in this mode
often limit to weld the flat and horizontal welding positions and sometimes also used
for vertical-down welds. The last metal transfer modes in MIG welding is pulse-
spray mode. This mode is based on the principles of spray transfer but uses a pulsing
current to melt the filler wire and allow one small molten droplet to fall with each
pulse. During the welding process, the pulses allow the average current to be lower,
decreasing the overall heat input. The lower heat input decreasing the size of the
weld pool and heat-affected zone. This makes it possible to weld thin work pieces
and provides a stable arc and no spatter, since no short-circuiting takes place.
The selection of shielding gas in MIG welding affected the welding bead.
Referring to mig_handbook by Welding Guns Of Australia PTY LTD Pty Ltd there
are four types of shielding gas of MIG welding process can be selected by depending
on what purpose and type of material to be weld. Selection of shielding gas also
affects the characteristic of weld bead. Pure inert gases such as argon and helium are
only used for nonferrous welding. If the gas being used to weld steel, argon do not
provide adequate weld penetration and can cause an erratic arc and while with
helium it will encourage spatter (Ltd, 2012). Pure carbon dioxide allows for deep
penetration welds but encourages oxide formation, which adversely affect the
mechanical properties of the weld. Spatter is unavoidable and welding thin materials
is difficult. As a result, argon and carbon dioxide are frequently mixed in a 75%/25%
to 90%/10% mixture. Generally, in short circuit GMAW, higher carbon dioxide
content increases the weld heat and energy when all other weld parameters (volts,
current, electrode type and diameter) are held the same. As the carbon dioxide
content increases over 20%, spray transfer GMAW becomes increasingly
problematic, especially with smaller electrode diameters.
The mixtures gas of argon, carbon dioxide and oxygen are marketed for
welding steels. Other mixtures add a small amount of helium to argon-oxygen
combinations, these mixtures are claimed to allow higher arc voltages and welding
11
speed. Helium is less dense than air, thus it is less effective at shielding the weld than
argon—which is denser than air. It also can lead to arc stability and penetration
issues, and increased spatter, due to its much more energetic arc plasma.
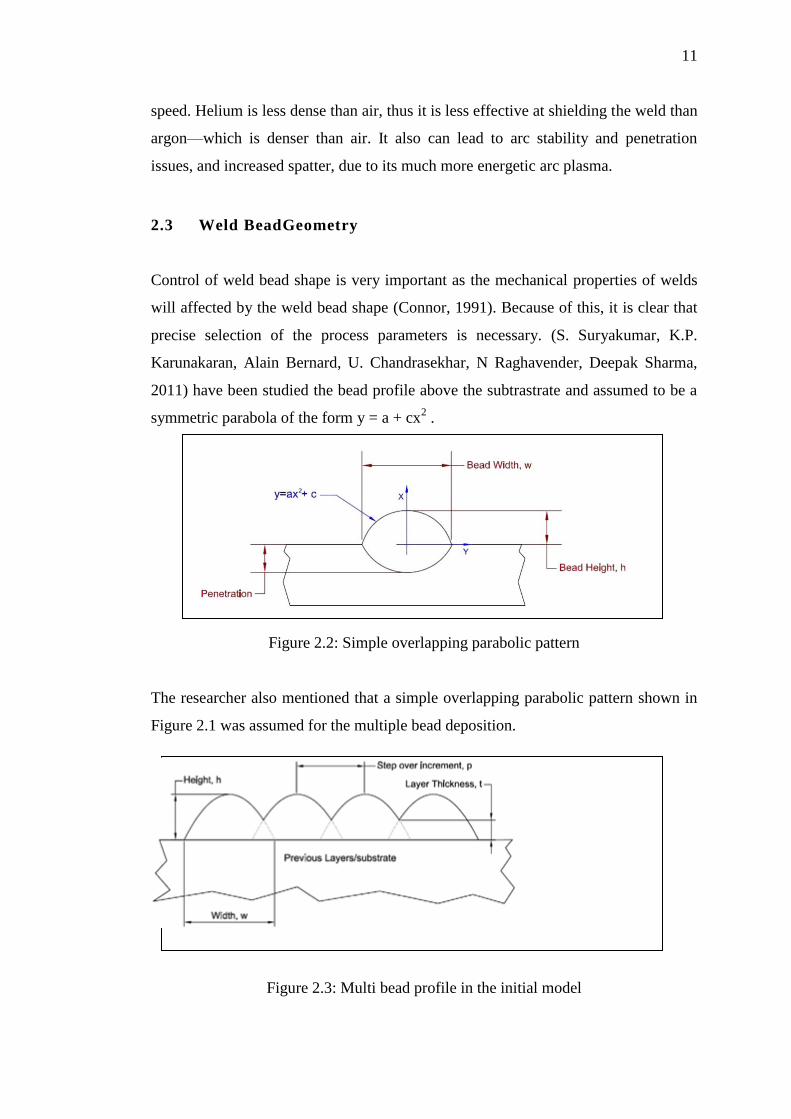
2.3 Weld BeadGeometry
Control of weld bead shape is very important as the mechanical properties of welds
will affected by the weld bead shape (Connor, 1991). Because of this, it is clear that
precise selection of the process parameters is necessary. (S. Suryakumar, K.P.
Karunakaran, Alain Bernard, U. Chandrasekhar, N Raghavender, Deepak Sharma,
2011) have been studied the bead profile above the subtrastrate and assumed to be a
symmetric parabola of the form y = a + cx2 .
Figure 2.2: Simple overlapping parabolic pattern
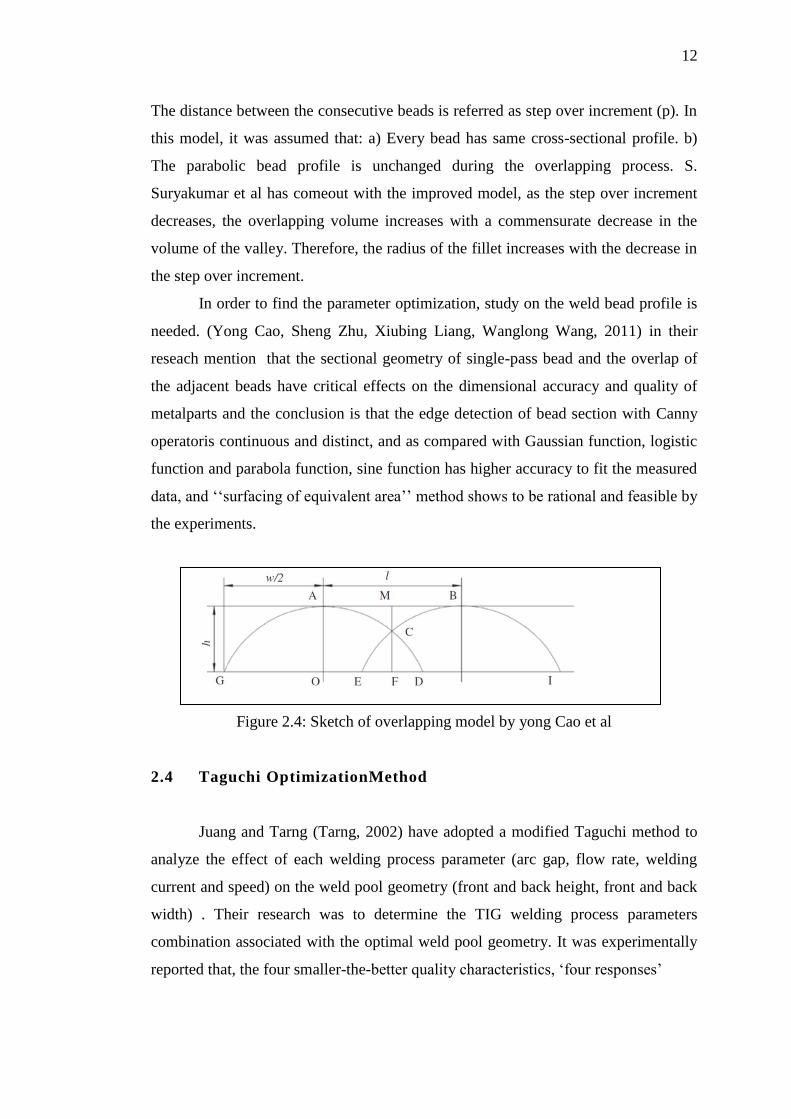
The researcher also mentioned that a simple overlapping parabolic pattern shown in
Figure 2.1 was assumed for the multiple bead deposition.
Figure 2.3: Multi bead profile in the initial model
12
The distance between the consecutive beads is referred as step over increment (p). In
this model, it was assumed that: a) Every bead has same cross-sectional profile. b)
The parabolic bead profile is unchanged during the overlapping process. S.
Suryakumar et al has comeout with the improved model, as the step over increment
decreases, the overlapping volume increases with a commensurate decrease in the
volume of the valley. Therefore, the radius of the fillet increases with the decrease in
the step over increment.
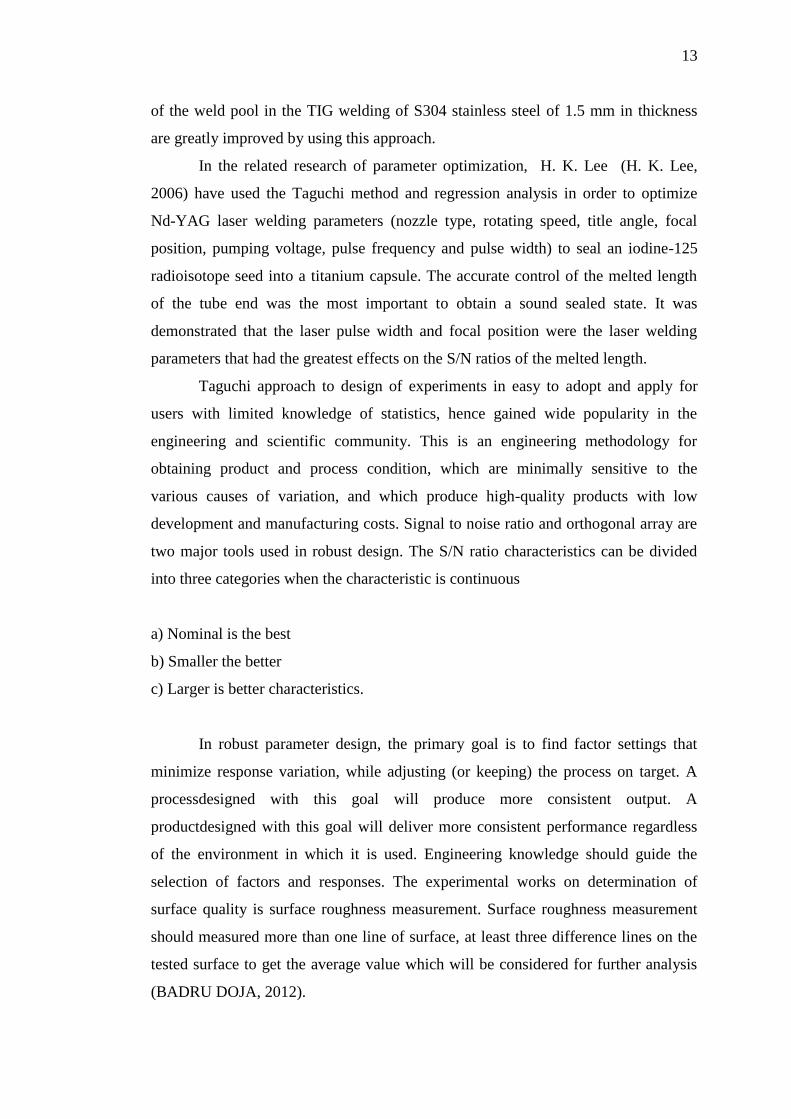
In order to find the parameter optimization, study on the weld bead profile is
needed. (Yong Cao, Sheng Zhu, Xiubing Liang, Wanglong Wang, 2011) in their
reseach mention that the sectional geometry of single-pass bead and the overlap of
the adjacent beads have critical effects on the dimensional accuracy and quality of
metalparts and the conclusion is that the edge detection of bead section with Canny
operatoris continuous and distinct, and as compared with Gaussian function, logistic
function and parabola function, sine function has higher accuracy to fit the measured
data, and ‘‘surfacing of equivalent area’’ method shows to be rational and feasible by
the experiments.
Figure 2.4: Sketch of overlapping model by yong Cao et al
2.4 Taguchi OptimizationMethod
Juang and Tarng (Tarng, 2002) have adopted a modified Taguchi method to
analyze the effect of each welding process parameter (arc gap, flow rate, welding
current and speed) on the weld pool geometry (front and back height, front and back
width) . Their research was to determine the TIG welding process parameters
combination associated with the optimal weld pool geometry. It was experimentally
reported that, the four smaller-the-better quality characteristics, ‘four responses’
13
of the weld pool in the TIG welding of S304 stainless steel of 1.5 mm in thickness
are greatly improved by using this approach.
In the related research of parameter optimization, H. K. Lee (H. K. Lee,
2006) have used the Taguchi method and regression analysis in order to optimize
Nd-YAG laser welding parameters (nozzle type, rotating speed, title angle, focal
position, pumping voltage, pulse frequency and pulse width) to seal an iodine-125
radioisotope seed into a titanium capsule. The accurate control of the melted length
of the tube end was the most important to obtain a sound sealed state. It was
demonstrated that the laser pulse width and focal position were the laser welding
parameters that had the greatest effects on the S/N ratios of the melted length.
Taguchi approach to design of experiments in easy to adopt and apply for
users with limited knowledge of statistics, hence gained wide popularity in the
engineering and scientific community. This is an engineering methodology for
obtaining product and process condition, which are minimally sensitive to the
various causes of variation, and which produce high-quality products with low
development and manufacturing costs. Signal to noise ratio and orthogonal array are
two major tools used in robust design. The S/N ratio characteristics can be divided
into three categories when the characteristic is continuous
a) Nominal is the best
b) Smaller the better
c) Larger is better characteristics.
In robust parameter design, the primary goal is to find factor settings that
minimize response variation, while adjusting (or keeping) the process on target. A
processdesigned with this goal will produce more consistent output. A
productdesigned with this goal will deliver more consistent performance regardless
of the environment in which it is used. Engineering knowledge should guide the
selection of factors and responses. The experimental works on determination of
surface quality is surface roughness measurement. Surface roughness measurement
should measured more than one line of surface, at least three difference lines on the
tested surface to get the average value which will be considered for further analysis
(BADRU DOJA, 2012).

14
In the experimental process, control factors will be being scale and so that
responses interactions are unlikely. If the interactions among control factors are
likely or not well understood, the design that is capable of estimating those
interactions should be choose. The goal of robust experimentation is to find an
optimal combination of control factor settings that achieve robustness against
(insensitivity to) noise factors.
15
CHAPTER 3
METHODOLOGY
This section will discuss on the description of the methods, procedures to obtain and
how the data was analyzed and interpreted.
3.1 Introduction
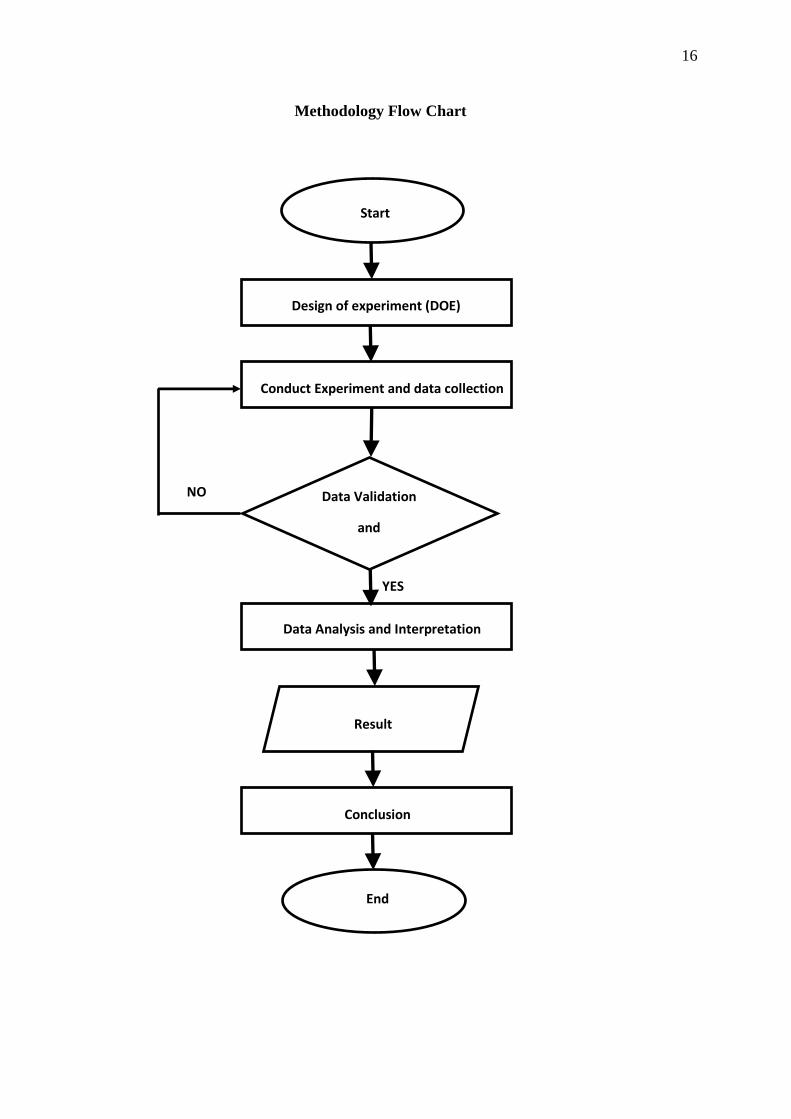
The systematically organization of this study is represented in flow chart. The
investigation of welding parameter optimization for weld bead surface quality using
MIG welding technology started with customize the semi-automated MIG welding
machnine where the welding travel asist by the travel control car. This customize
system to ensure the travel speed of welding process of weld bead experiment
specimen. Semi-automatic mechanized MIG welding is extensively used for making
straight welds. The work pieces are then clamped in a steady position on the working
bench. The filler wire is fed from a unit that controls feed speed and that
compensates automatically for variations in mains voltage and for the friction of the
rollers. The parameters that are machine-controlled are the wire feed speed, the arc
voltage, gas flow rate and the diameter of the wire. During the welding process, the
MIG welding set will adjust the relationship between these parameters. The manual
setting of the process are on the length of the stick out, the angle of the welding gun
and the welding travel speed. In this study works, carbon steel plate AISI 1015 was
chosen as an experimental work piece. Diameter of the wire is 0.8mmtypeER70S-6
and shielding gas used in the process is argon.
16
Methodology Flow Chart
Start
Design of experiment (DOE)
Conduct Experiment and data collection
Data Validation
and
Optimization
Data Analysis and Interpretation
Result
Conclusion
End
YES
NO
17
3.2 Research Methodology
The research project work starts with the implementation concept of Design of
Experiment (DOE). The preliminary result determines the selected parameter levels
selection. After the preliminary results are known, levels of parameter are then
entered into robust design Taguchi Method (Minitab 16) to generate the design
matrix table. Then the experiments are conducted based on input parameter and level
setup.
3.3 Design of Experiment (DOE)
In this project, DOE considers multiple factor interaction effects. The experimental
design simplifies the use of DOE by automating the process of designing
experiments and analyzing the results. The experiment is carried out by running the
complete set of noise factor settings at each combination of control factor settings (at
each run). The response data from each run of the noise factors in the outer array are
aligned in a row, next to the factors settings for that run of the control factors in the
inner array. Taguchi Technique is applied to plan the experiments. The Taguchi
method will provide good improvement productivity during this research and
development, so that high quality of surface quality can be produced quickly and at
low cost. The DOE using Taguchi approach can significantly reduce time required
for experimental investigations. In this investigation, in the first stage, Taguchi's
orthogonal arrays were used to conduct the experiments to find the contributions
ofeach factor and to optimize the parameter settings. Analysis using Taguchi design
L9 (3**3) which REPRESENTS:-
L9 9 RUNS
3 3 LEVELS
3 3FACTORS
The following are the 3 Levels which are considered in Taguchi design
High
Medium
18
Low
The combination Design of Experiments with optimization of welding control
parameters to obtain best results can be achieved in the Taguchi Method and table
3.1 below shows the selected welding parameters and their level.
Table 3.1 Welding parameters and their level.
Welding parameters Level 1 Level 2 Level 3
Voltage (V) 18.7 19.8 20.9
Travel Speed(mm/min) 247.5 312.5 377.5
Wire Feed Rate(m/min) 8.5 9.9 11.3
3.4 Conduct Experiment and Data Collection
Nine set of specimen of welded AISI 1015 work piece with different set of
combination of parameter had been carried out. The distorted specimen due to other
effects had not been considered in the experiment, as the condition was not the result
from any of the specified parameters that had made up. There are 9 runs of single
weld bead and another 9 runs for overlap weld bead are conducted base on L9 3
Level Taguchi Orthogonal Array.
Table 3.2: Taguchi design L9(3**3) for input value parameter setting of single bead
Sample of single weld
bead
Voltage (V) Travel Speed
(mm/min)
Wire Speed rate
(m/min)
A 18.7 247.5 8.5
B 18.7 312.5 9.9
C 18.7 377.5 11.3
D 19.8 247.5 9.9
E 19.8 312.5 11.3
F 19.8 377.5 8.5
G 20.9 247.5 11.3
H 20.9 312.5 8.5
I 20.9 377.5 9.9
19
Table 3.3: Taguchi design L9(3**3) for input value parameter setting of overlap
welding bead
Sample of overlap
weld bead
Voltage (V) Travel Speed
(mm/min)
Wire Speed rate
(m/min)
1 18.7 247.5 8.5
2 18.7 312.5 9.9
3 18.7 377.5 11.3
4 19.8 247.5 9.9
5 19.8 312.5 11.3
6 19.8 377.5 8.5
7 20.9 247.5 11.3
8 20.9 312.5 8.5
9 20.9 377.5 9.9
While the hardness of the welded bead surface was using Hardness Rockwell A
(HRA). The surface roughness of the welded bead surface that showed highest
reading of HRA value was the most preferable criteria. The data was collected were
the surface roughness and the hardness of the welded bead surface. Each test
specimen will be conducted surface roughness test and hardness test. Test data will
be collected and recorded for results observation and data validation and
optimization.
3.5 Data Validation and Optimization
In this stage, the data collection must be through data validation process ensuring
that that a study collect a clean, correct and useful data. Once surface roughness and
hardness of a welding beads experiments been completed results are analyzed by
calculating the signal-to-noise (S/N) ratio for each factor and each level in these
experiments. This ratio is the reciprocal of the variance of the measurement error
which is maximal for the combination of parameter levels that has the minimum
error variance. Calculating the average of S/N value for each factor and plotting them
for each level will reveals the effect of the factor on the variable used to evaluate
these experiments on value of surface roughness and hardness. Analysis of variance
(ANOVA) techniques will be used to study the fractional factorial experiments and
20
identify the significance of each factor. In statistical significance testing, the p-value
is the probability of obtaining a test statistic at least as extreme as the one that was
actually observed, assuming that the null hypothesis is true. The p-value must turn to
be less than a certain significance level 0.05. If the P value above this level, the data
must be recollect again by using difference approach in the same experiment. In this
study would be the method of surface roughness and hardness value.
Optimization of control parameters to obtain best results for surface
roughness and highest value of hardness is achieved by using the Taguchi Method.
In Taguchi method, there are 3 Signal-to-Noise ratios of common interest for
optimization. There are 3 Signal-to-Noise ratios of common interest for optimization
i. Smaller-The-Better:
n = -10 Log10 [mean of sum of squares of measured data]
ii. Larger-The-Better:
n = -10 Log10 [mean of sum squares of reciprocal of measured data]
iii. Nominal-The-Best:
n = 10 Log10 square of mean
variance
3.6 Project Sample
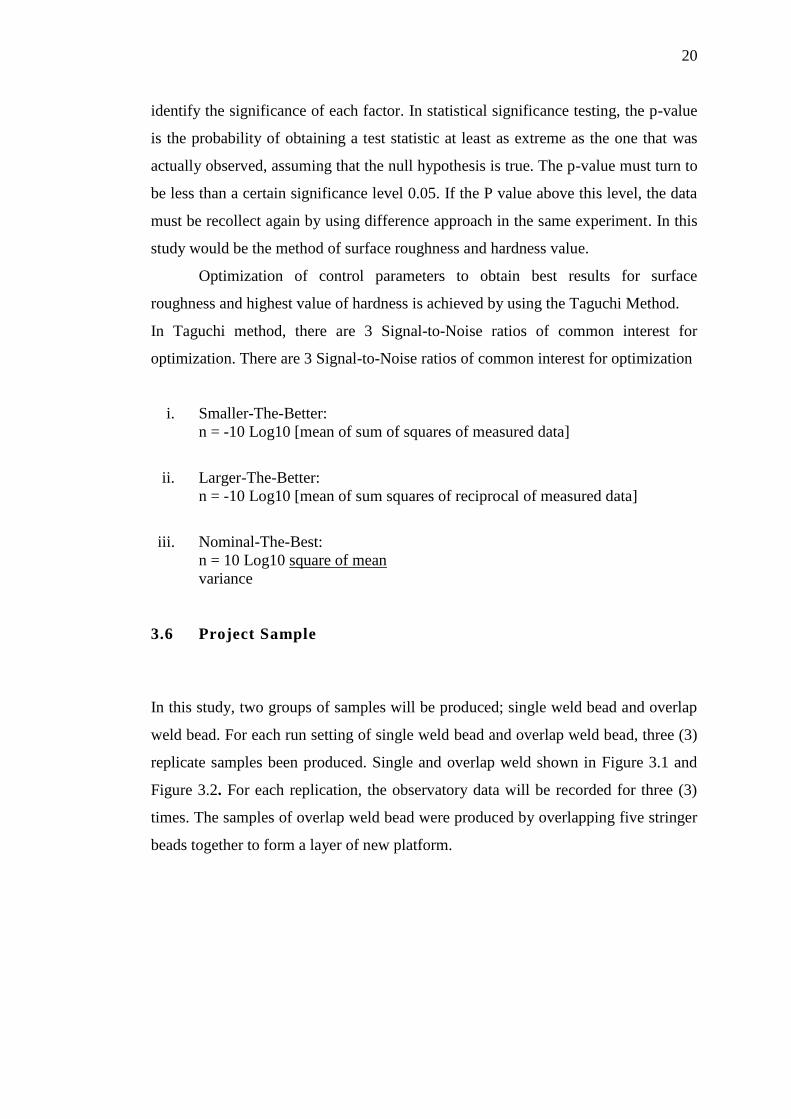
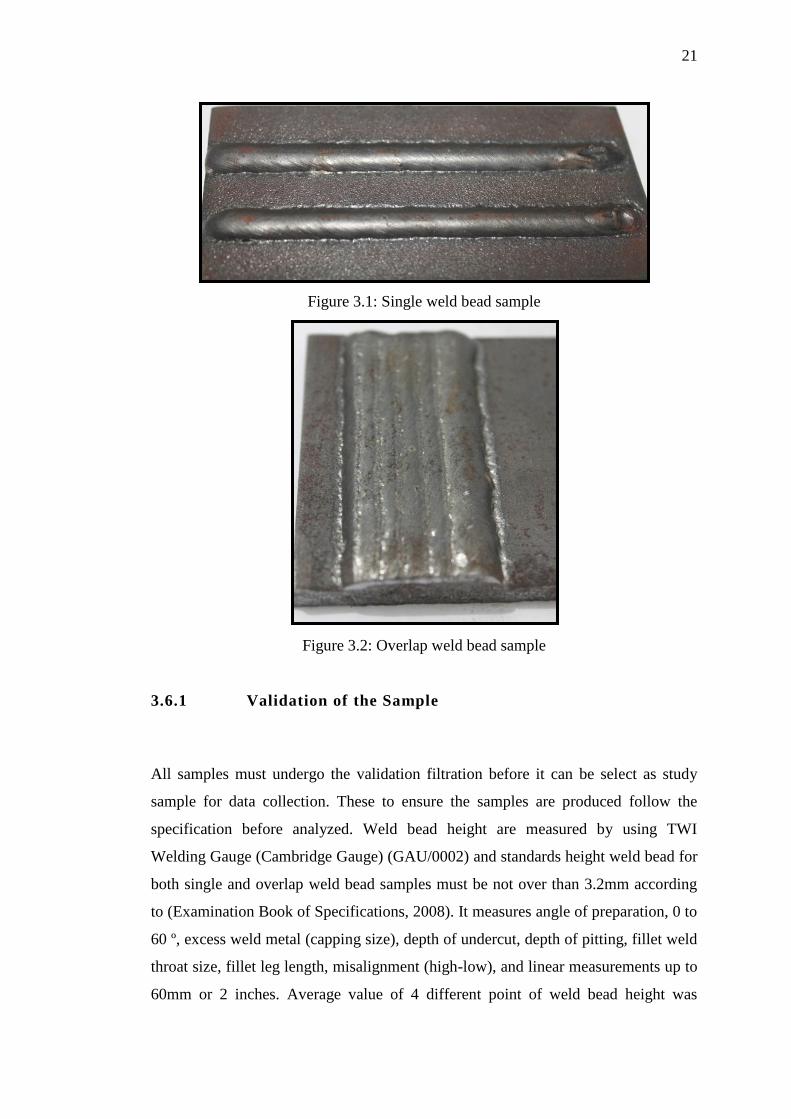
In this study, two groups of samples will be produced; single weld bead and overlap
weld bead. For each run setting of single weld bead and overlap weld bead, three (3)
replicate samples been produced. Single and overlap weld shown in Figure 3.1 and
Figure 3.2. For each replication, the observatory data will be recorded for three (3)
times. The samples of overlap weld bead were produced by overlapping five stringer
beads together to form a layer of new platform.
21
Figure 3.1: Single weld bead sample
Figure 3.2: Overlap weld bead sample
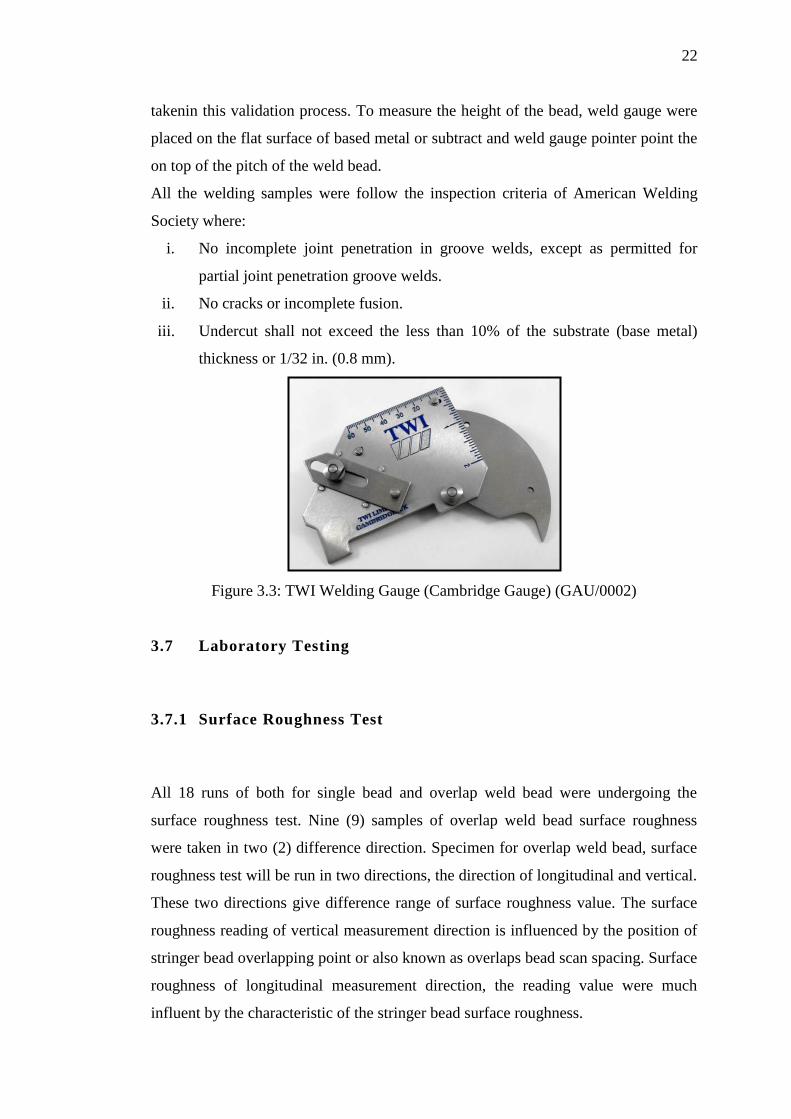
3.6.1 Validation of the Sample
All samples must undergo the validation filtration before it can be select as study
sample for data collection. These to ensure the samples are produced follow the
specification before analyzed. Weld bead height are measured by using TWI
Welding Gauge (Cambridge Gauge) (GAU/0002) and standards height weld bead for
both single and overlap weld bead samples must be not over than 3.2mm according
to (Examination Book of Specifications, 2008). It measures angle of preparation, 0 to
60 º, excess weld metal (capping size), depth of undercut, depth of pitting, fillet weld
throat size, fillet leg length, misalignment (high-low), and linear measurements up to
60mm or 2 inches. Average value of 4 different point of weld bead height was
22
takenin this validation process. To measure the height of the bead, weld gauge were
placed on the flat surface of based metal or subtract and weld gauge pointer point the
on top of the pitch of the weld bead.
All the welding samples were follow the inspection criteria of American Welding
Society where:
i. No incomplete joint penetration in groove welds, except as permitted for
partial joint penetration groove welds.
ii. No cracks or incomplete fusion.
iii. Undercut shall not exceed the less than 10% of the substrate (base metal)
thickness or 1/32 in. (0.8 mm).
Figure 3.3: TWI Welding Gauge (Cambridge Gauge) (GAU/0002)
3.7 Laboratory Testing
3.7.1 Surface Roughness Test
All 18 runs of both for single bead and overlap weld bead were undergoing the
surface roughness test. Nine (9) samples of overlap weld bead surface roughness
were taken in two (2) difference direction. Specimen for overlap weld bead, surface
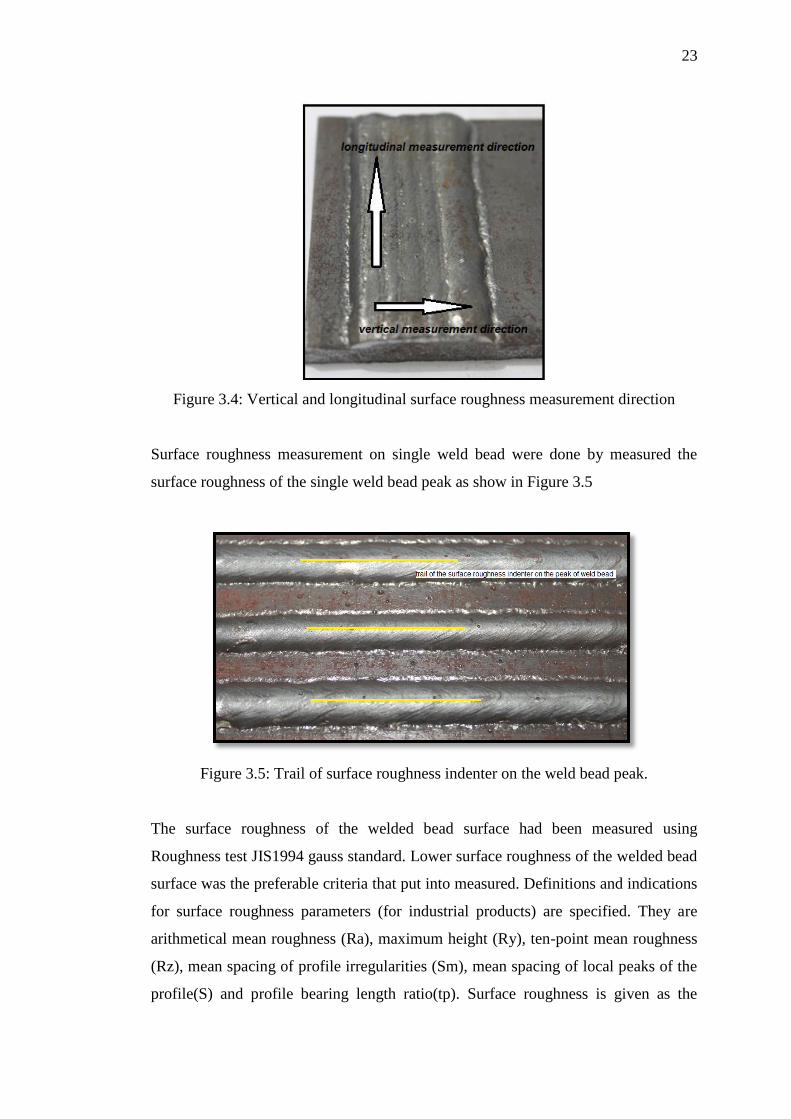
roughness test will be run in two directions, the direction of longitudinal and vertical.
These two directions give difference range of surface roughness value. The surface
roughness reading of vertical measurement direction is influenced by the position of
stringer bead overlapping point or also known as overlaps bead scan spacing. Surface
roughness of longitudinal measurement direction, the reading value were much
influent by the characteristic of the stringer bead surface roughness.
23
Figure 3.4: Vertical and longitudinal surface roughness measurement direction
Surface roughness measurement on single weld bead were done by measured the
surface roughness of the single weld bead peak as show in Figure 3.5
Figure 3.5: Trail of surface roughness indenter on the weld bead peak.
The surface roughness of the welded bead surface had been measured using
Roughness test JIS1994 gauss standard. Lower surface roughness of the welded bead
surface was the preferable criteria that put into measured. Definitions and indications
for surface roughness parameters (for industrial products) are specified. They are
arithmetical mean roughness (Ra), maximum height (Ry), ten-point mean roughness
(Rz), mean spacing of profile irregularities (Sm), mean spacing of local peaks of the
profile(S) and profile bearing length ratio(tp). Surface roughness is given as the
24
arithmetical mean value for a randomly sampled area. Mean center line roughness
(Ra) is defined in the annexes of JIS B 0031 and JIS B 0061. A portion stretching
over a reference length in the direction in which the average line extends is cut out
from the roughness curve.
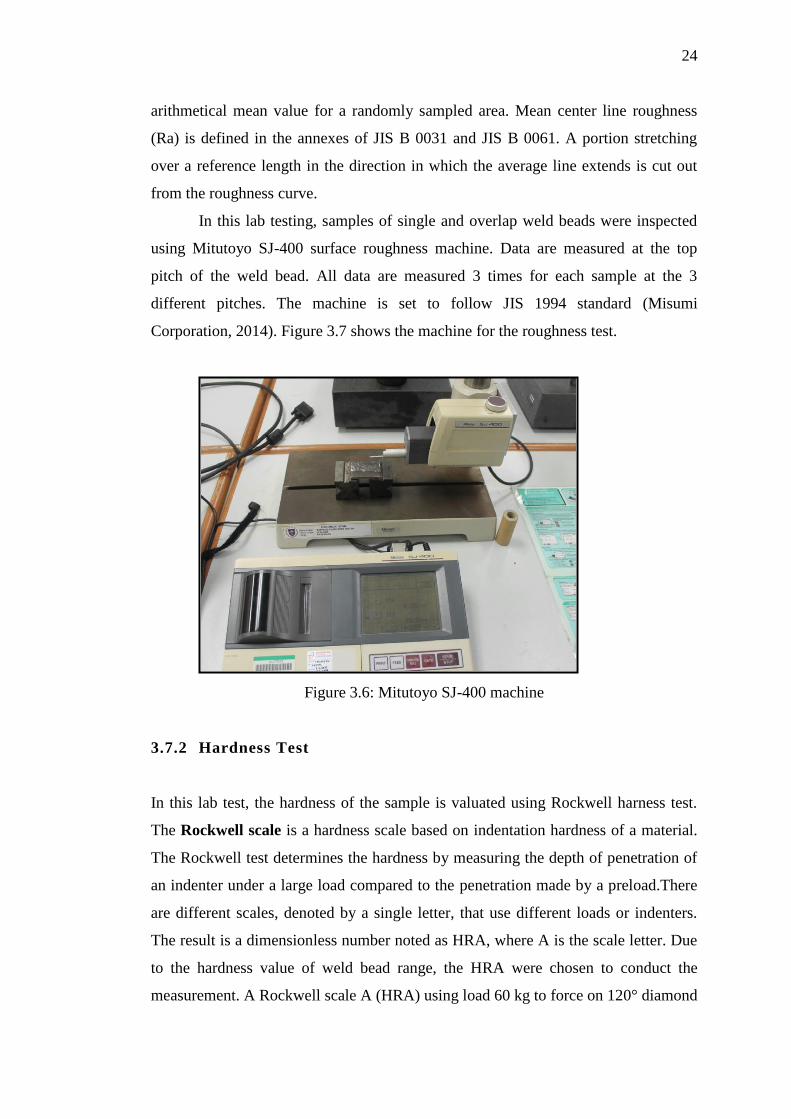
In this lab testing, samples of single and overlap weld beads were inspected
using Mitutoyo SJ-400 surface roughness machine. Data are measured at the top
pitch of the weld bead. All data are measured 3 times for each sample at the 3
different pitches. The machine is set to follow JIS 1994 standard (Misumi
Corporation, 2014). Figure 3.7 shows the machine for the roughness test.
Figure 3.6: Mitutoyo SJ-400 machine
3.7.2 Hardness Test
In this lab test, the hardness of the sample is valuated using Rockwell harness test.
The Rockwell scale is a hardness scale based on indentation hardness of a material.
The Rockwell test determines the hardness by measuring the depth of penetration of
an indenter under a large load compared to the penetration made by a preload.There
are different scales, denoted by a single letter, that use different loads or indenters.
The result is a dimensionless number noted as HRA, where A is the scale letter. Due
to the hardness value of weld bead range, the HRA were chosen to conduct the
measurement. A Rockwell scale A (HRA) using load 60 kg to force on 120° diamond
93
References
Heat effects of welding- temperature field, residual stress and diistortion1992
http://millerwelds.com/resources/improving-your-skills/mig/. http://millerwelds.com2013
11111
A. Bendell, j. Disney, W.A. Pridmore1989Taguchi Methods : Application in World
IndustryUKIFS Publication
A. Tradia, F.Roger, E. Guyot2010Optimal parameter for pulsed gas tungsten arc welding in
partially and fully penetrated weld poolsInternational Journal of Thermal
Sciences491197-1208
Ajit Hooda1*, A. D. (2012). OPTIMIZATION OF MIG WELDING PROCESS PARAMETERS TO
PREDICT MAXIMUM YIELD STRENGTH IN AISI 1040.
C.E. Bull, K.A. Stacey, R. Calcraft1993On line weld monitoring using ultrasonic.
Nondestructive Testing35 (2) 57–64.
Dongjie Li, Shanping Lu, Wenchao Dong, Dianzhiong Li, Yiyi Li20126 Study of the law
between the weld pool shape variations with the welding parameters under two
TIG processesMaterials Procssing Technology128-136
Engineering Materials: Properties and Selection1999Prentice Hall
Global versus cluster-wise regression analyses for prediction of bead geometry in MIG
welding processJournal of Materials Processing Technology 189 (2007) 352–
3662006
Global versus cluster-wise regression analyses for prediction of bead geometry in MIG
welding process2006
Global versus cluster-wise regression analyses for prediction of bead geometry in MIG
welding process2007
http://www.lincolnelectric.com/en-
us/Consumables/Pages/product.aspx?product=Products_Consumable_CutLengthCo
nsumables-Lincoln-LincolnER70S-6(LincolnElectric)2013
Huijun Wang, Radovan KovacevicVariable Polarity GTAW in Rapd Prototyping of Aluminum
Parts369-376Texas
Investigation of the overlapping parameters2005Rapid Prototyping Journal
Investigation of the overlapping parameters of MPAW-based rapid prototyping2006State
Key Lab for Manufacturing Systems Engineering, Xi’an Jiaotong University, Xi’an,
People’s Republic of China
94
MECHANICAL AND MICROSTRUCTURAL INVESTIGATION2008Ghulam Ishaq Khan Institute of
Engineering Sciences and Technology
mig_handbook2012Ltd, Welding Guns Of Australia PTY LTD Pty
Miller Electric Mfg Co. 2013http://millerwelds.com/resources/improving-your-
skills/mig/miller
Modern Welding Technology1989Englewood NJPrentice-Hall
Optimization of different welding processes using statistical and numerical approaches-A
reference guide
OPTIMIZATION OF MIG WELDING PROCESS PARAMETERS TO PREDICT MAXIMUM YIELD
STRENGTH IN AISI 10402012Int. J. Mech. Eng. & Rob. Res. 2012
Optimization of Nd:YAG laser welding parameters for sealing small titanum tube
ends2006material science and engineering
Optimization of the weld bead geometry in gas tungsten arc welding by the Taguchi
method1998Int. J. Adv. Manuf. Technol.14 549–554.
RAPID PROTOTYPING USING 3-D WELDING
S. Suryakumar, K.P. Karunakaran, Alain Bernard, U. Chandrasekhar, N Raghavender, Deepak
Sharma2011Weld bead modeling and process optimization in Hybrid layerd
ManufacturingComputer Aided Design43331-334
S.C. Juang, Y.S. Tang2002Process parameter selection for optimizing the weld pool
geometry in the Tungsten Inert Gas welding of stainless steelJournal of Materials
Processing Technology12233-37
S.C. Juang, Y.S. Tarng, H.R. Lii1998A comparison between the backpropagation and counter-
propagation networks in the modeling of the TIG welding process75 54–62.
Taguchi Method for Optimization of Cutting Parameter in Turning Operation2010Proc. of
Int. Conf. on Advance in Mechanical Engineering
Taguchi Methods: A Hand-on Approach1993MAAddison Wesley
The Haynes Welding Manual: Gas, Arc, MIG, TIG, Plasma Welding and Cutting. (n.d.). Hynes
Manuals.
TIG Handbook for GTAW
Ugur Esme, Melih Bayramoglu, Yugut Kazancoglu, Sueda Ozgun2009OPTIMIZATION OF
WELD BEAD GEOMETRY IN TIG WELDING PROCESS USING GREY RELATION
ANALYSIS AND TAGUCHI METHODMaterials and technology143-149
Weld deposition-based rapid prototyping: a preliminary studySchool of Mechanical and
Manufacturing Eng. Dublin City University, Dublin, Ireland
95
Welding Handbook-welding processes1991American welding Society
X.M. Zeng, J. Lucas, M.T.C. Fang1993Use of neural networks for parameter prediction and
quality inspection in tungsten inert gas welding15 (2) 87–95
Xinhong Xiong, Haiou Zhangb, Guilan Wang2009Metal direct prototyping by using hybrid
plasma deposition and millingMATERIALS PROCESSING TECHNOLOGY209124-130
Y.M. Zhang, R. Kovacevic, L. Li199636 (7) 799–816.
Y.S. Tarng, H.L. Tsai, S.S. Yeh1989Modeling, optimization and classification of weld quality
in TIG weldingInternational Journal of Machine Tools & Manufacture39 (9)1427–
14381427-1438
Yong Cao, Sheng Zhu, Xiubing Liang, Wanglong Wang2011Overlapping model of beads and
curve fitting of bead section for rapid manufacturing by robotic MAG welding
processRobotics and Computer-Integrated manufacturing641-645


![PENGOPTIMUMAN PARAMETER PENGACUAN BAGI …eprints.utm.my/id/eprint/6641/4/KhairurRijalJamaludin2008_Pengoptimum... · adalah dari jenis yang sama digunakan oleh Mohd. Afian Omar [1],](https://img.pdfslide.net/doc/110x75/5d3cac1e88c993fb628d9070/pengoptimuman-parameter-pengacuan-bagi-adalah-dari-jenis-yang-sama-digunakan.jpg)