Embed Size (px)
Citation preview
Original Research
Investigation and Optimization of ParameterAccuracy in Dynamic Contrast-Enhanced MRI
Hai-Ling Margaret Cheng, PhD*
Purpose: To present a modified pharmacokinetic model forimproved parameter accuracy and to investigate the influ-ence of an inaccurate arterial input function (AIF) on dy-namic contrast-enhanced (DCE)-MRI parameter estimatesof the transfer constant (Ktrans), blood volume (vp), andinterstitial volume (ve).
Materials and Methods: Tissue uptake curves were simu-lated over a large range of physiological values and ana-lyzed for different AIF measurement errors and temporalresolutions. The AIF measurement was assumed to be in-accurate in the bolus amplitude (rapid sampling) or sus-ceptible to unknown temporal offsets (slow sampling withbiexponential decay fit).
Results: The modified model adequately reduces errors inparameter estimates arising from transit time effects. Anerror in the AIF bolus amplitude results in an inverselyproportional error in Ktrans and vp; ve remains robust. Moreconsistent error in Ktrans (�20% underestimation) was ob-tained using a biexponential AIF, at the expense of severelyunderestimating vp.
Conclusion: While an accurate, high temporal resolutionAIF is essential for estimating vp, a biexponential AIF ac-quired at low temporal resolution (�20 seconds) providesrobust estimates of ve and results in a Ktrans underestima-tion comparable to that from a 25% error in the initial AIFbolus amplitude.
Key Words: dynamic contrast-enhanced (DCE)-MRI; phar-macokinetic modeling; arterial input function (AIF); bolusarrival delay; mean transit time; parameter accuracy.J. Magn. Reson. Imaging 2008;28:736–743.© 2008 Wiley-Liss, Inc.
DYNAMIC CONTRAST-ENHANCED (DCE)-MRI forcharacterizing tissue uptake of a contrast agent is anestablished method for assessing microcirculationphysiology. It is relevant in studying a wide range ofdiseases and conditions, including cancer (1), ischemia
(2), and inflammation (3). Quantitative parameters di-rectly related to underlying physiological properties,such as vessel permeability, perfusion, and blood vol-ume, may be obtained by applying a pharmacokineticmodel to the DCE-MRI data (4). This physiology-basedinformation is beneficial in a number of ways, fromimproving cancer diagnostic sensitivity and specificityto elucidating microvascular changes that accompanynovel anticancer therapies. However, the degree towhich measured parameters represent true physiologyis influenced by a number of factors, and accurateDCE-MRI quantification remains challenging (5).
A problematic but necessary requirement for quanti-tative DCE-MRI is measurement of the arterial inputfunction (AIF), or contrast agent concentration timecourse in the blood pool. The simplest approach is touse a standard AIF (6), but this may differ from theindividual’s input function, and large errors in pharma-cokinetic parameter estimates have been reported (7).The ideal approach is to obtain individual measure-ments. This, however, is beset by a number of chal-lenges. One challenge is achieving a high temporal res-olution (1 second) to capture rapid changes during theinitial bolus passage, which is believed to be essentialfor reliable DCE-MRI quantification (8). Despite theavailability of faster scanners and parallel imaging, alower temporal resolution is often used due to compet-ing demands for high spatial resolution, coverage, andsignal-to-noise. When the initial bolus cannot be truth-fully represented in such cases, one often fits the ac-quired AIF to a biexponential decay model or adopts ahigh temporal resolution standard AIF. Even whenrapid sampling is achieved, the measured blood con-centration during the initial bolus is not necessarilyaccurate. The reason is that in addition to inflow (9) andpartial volume (10) that affect the entire AIF timecourse, the initial bolus is further affected by saturationeffects and is more sensitive to mis-sampling. Finally, itshould be recognized that regardless of how accuratelyan AIF measurement is made, DCE-MRI quantificationwill be significantly influenced by the delay and disper-sion the AIF undergoes when it reaches the local tissueregion of interest (11), and by the mean capillary transittime for the contrast agent to pass through the vascularbed.
Given the recognized importance of an accurate AIFmeasurement, surprisingly little has been published on
Research Institute, Hospital for Sick Children, Department of Diagnos-tic Imaging, Hospital for Sick Children, Department of Medical Imaging,University of Toronto, Toronto, Canada.*Address reprint requests to: H.-L.M.C., Department of Diagnostic Im-aging, Hospital for Sick Children, 555 University Ave., Toronto, OntarioM5G 1X8 Canada. E-mail: [email protected] February 8, 2008; Accepted June 4, 2008.DOI 10.1002/jmri.21489Published online in Wiley InterScience (www.interscience.wiley.com).
JOURNAL OF MAGNETIC RESONANCE IMAGING 28:736–743 (2008)
© 2008 Wiley-Liss, Inc. 736
its influence on pharmacokinetic parameter accuracy.In fact, our understanding of accurate DCE-MRI pa-rameter estimation in general is very limited, with onlya handful of investigations on the choice of models(12,13) and the effect of temporal sampling (14), all ofwhich assumed an accurate input function. Some in-sight into the impact of AIF errors can be gained fromdynamic susceptibility contrast (DSC)-MRI studies thathave examined the effects of dispersion (11) and partialvolume (15). However, this insight is incomplete, sinceDCE-MRI provides additional physiological informa-tion, such as permeability and interstitial volume, notaccessible by DSC-MRI.
The purpose of this study was to investigate the im-pact of AIF errors on DCE-MRI pharmacokinetic pa-rameter accuracy and to compare a high temporal res-olution AIF versus a more slowly but carefully acquiredbiexponential decay description. Specifically, an ampli-tude error in the initial bolus is considered. This errormay arise from measurement, which is more difficultduring the bolus phase due to high concentrations andrapid signal changes compared to later phases of theAIF. The error may also arise from adopting a standardinput function in the belief that a high temporal reso-lution AIF will necessarily improve DCE-MRI parameterestimation. For the biexponential AIF, temporal resolu-tions (up to 30 seconds) necessitating its use in variousclinical applications (eg, abdominal exams) are evalu-ated. A second purpose of this study was to present amodified pharmacokinetic model for correcting bolusdelay and providing reasonable immunity to typicalmean transit times found in the body. Dispersion wasnot considered due to the complexity of modeling thevasculature (11).
THEORY
According to the adiabatic approximation to the tissuehomogeneity (AATH) model (16), the concentration ofcontrast agent in tissue, Ct(t), is equal to the convolu-tion of the arterial input function, Cp(t), and the impulseresponse H(t):
Ct�t� � Cp�t� � H�t�
where
H�t� � �0 t � 0Fp 0 � t � Tc
EFp exp� � EFp
ve�t � Tc�� t � Tc
[1]
The AATH is more complex than the Tofts model (4)commonly used in data fitting. It accounts for differentcontributions from the plasma flow rate Fp (min�1),extraction fraction through first-passage E, mean cap-illary transit time Tc (min), and interstitial volume frac-tion ve. When there is a delay Td in the arrival of theinput function to the local tissue region, we can showthat:
Ct�t� � Fp�0
Tc
Cp�t � � � Td�d�
� EFp�0
t��Td�Tc�
Cp���exp� � EFp
ve�t � � � �Td � Tc���d�
[2]
The first term can be simplified by invoking the firstmean value theorem for integration:
Ct�t� � vpCp�t � Td � �Tc�
� EFp�0
t��Td�Tc�
Cp���exp� � EFp
ve�t � � � �Td � Tc���d�
[3]
where the fractional plasma volume is vp FpTc and 0 �� � 1. By introducing the standardized notation for theendothelial transfer constant Ktrans EFp and denotingto Td � Tc, the approximation � � 1 results in thefollowing:
Ct�t� � vpCp�t � to� � Ktrans�0
t�to
Cp���
exp� � Ktrans
ve�t � � � to��d� [4]
Equation [4] estimates the combined effect of a bolusdelay Td and mean transit time Tc through a single timeconstant to. This approximation reduces to the exactsolution for zero Tc and any value of Td. With longervalues of Tc, it deviates from Eq. [2] mainly in the first-pass phase.
MATERIALS AND METHODS
Data Simulation
To simulate the time course of contrast agent concen-tration in tissue, an AIF was first generated using thefollowing formulation:
Cp�t� � Cbol�t� � Crec�t� � Cequ�t�
where
Cbol�t� � �bt3exp���bt�
[5]Crec�t� � Cbol�t� � �r�t � �r�exp���r�t � �r��
Cequ�t� � Cbol�t� � ��eexp���et� � �kexp���kt��
The initial bolus, Cbol(t), is described as a gamma-vari-ate function according to Calamante et al (11). Therecirculation peak, Crec(t), is a delayed and dispersedversion of the initial bolus and is described by convo-lution with a delay of 14 seconds (11). The equilibriumterm, Cequ(t), uses Weinmann et al’s biexponential de-
Measurement Accuracy in DCE-MRI 737
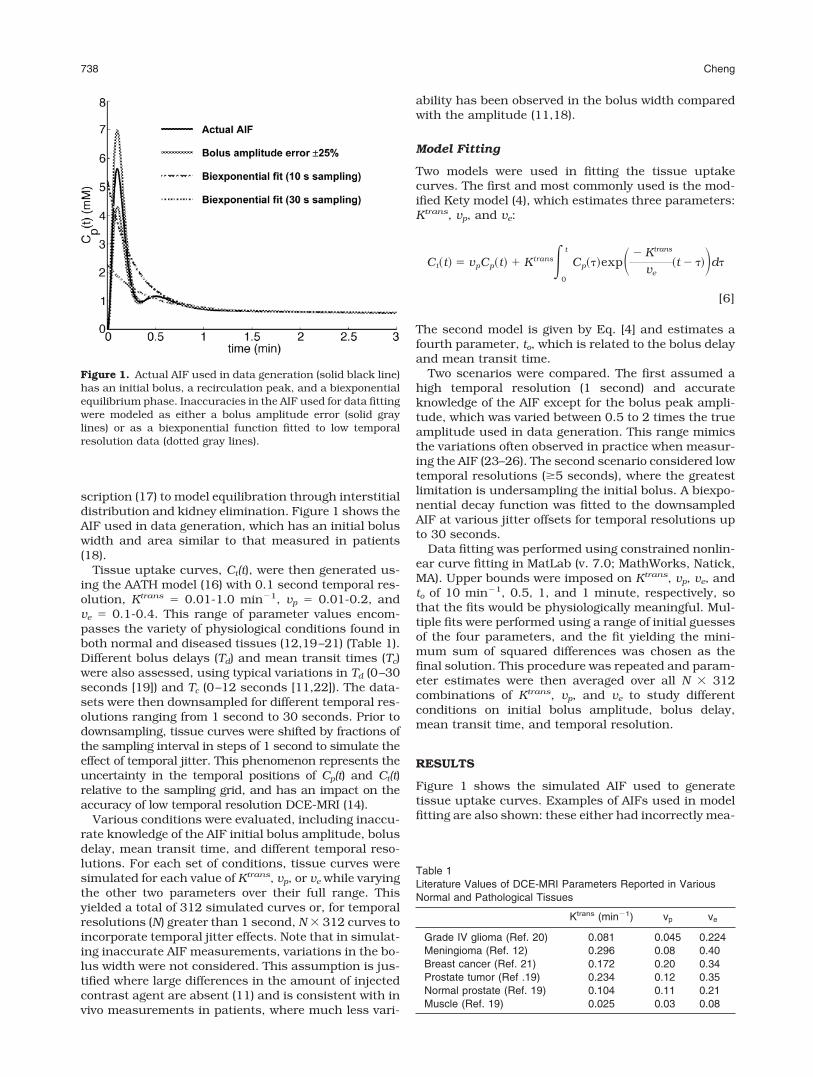
scription (17) to model equilibration through interstitialdistribution and kidney elimination. Figure 1 shows theAIF used in data generation, which has an initial boluswidth and area similar to that measured in patients(18).
Tissue uptake curves, Ct(t), were then generated us-ing the AATH model (16) with 0.1 second temporal res-olution, Ktrans 0.01-1.0 min�1, vp 0.01-0.2, andve 0.1-0.4. This range of parameter values encom-passes the variety of physiological conditions found inboth normal and diseased tissues (12,19–21) (Table 1).Different bolus delays (Td) and mean transit times (Tc)were also assessed, using typical variations in Td (0–30seconds [19]) and Tc (0–12 seconds [11,22]). The data-sets were then downsampled for different temporal res-olutions ranging from 1 second to 30 seconds. Prior todownsampling, tissue curves were shifted by fractions ofthe sampling interval in steps of 1 second to simulate theeffect of temporal jitter. This phenomenon represents theuncertainty in the temporal positions of Cp(t) and Ct(t)relative to the sampling grid, and has an impact on theaccuracy of low temporal resolution DCE-MRI (14).
Various conditions were evaluated, including inaccu-rate knowledge of the AIF initial bolus amplitude, bolusdelay, mean transit time, and different temporal reso-lutions. For each set of conditions, tissue curves weresimulated for each value of Ktrans, vp, or ve while varyingthe other two parameters over their full range. Thisyielded a total of 312 simulated curves or, for temporalresolutions (N) greater than 1 second, N 312 curves toincorporate temporal jitter effects. Note that in simulat-ing inaccurate AIF measurements, variations in the bo-lus width were not considered. This assumption is jus-tified where large differences in the amount of injectedcontrast agent are absent (11) and is consistent with invivo measurements in patients, where much less vari-
ability has been observed in the bolus width comparedwith the amplitude (11,18).
Model Fitting
Two models were used in fitting the tissue uptakecurves. The first and most commonly used is the mod-ified Kety model (4), which estimates three parameters:Ktrans, vp, and ve:
Ct�t� � vpCp�t� � Ktrans�0
t
Cp���exp� � Ktrans
ve�t � ���d�
[6]
The second model is given by Eq. [4] and estimates afourth parameter, to, which is related to the bolus delayand mean transit time.
Two scenarios were compared. The first assumed ahigh temporal resolution (1 second) and accurateknowledge of the AIF except for the bolus peak ampli-tude, which was varied between 0.5 to 2 times the trueamplitude used in data generation. This range mimicsthe variations often observed in practice when measur-ing the AIF (23–26). The second scenario considered lowtemporal resolutions (�5 seconds), where the greatestlimitation is undersampling the initial bolus. A biexpo-nential decay function was fitted to the downsampledAIF at various jitter offsets for temporal resolutions upto 30 seconds.
Data fitting was performed using constrained nonlin-ear curve fitting in MatLab (v. 7.0; MathWorks, Natick,MA). Upper bounds were imposed on Ktrans, vp, ve, andto of 10 min�1, 0.5, 1, and 1 minute, respectively, sothat the fits would be physiologically meaningful. Mul-tiple fits were performed using a range of initial guessesof the four parameters, and the fit yielding the mini-mum sum of squared differences was chosen as thefinal solution. This procedure was repeated and param-eter estimates were then averaged over all N 312combinations of Ktrans, vp, and ve to study differentconditions on initial bolus amplitude, bolus delay,mean transit time, and temporal resolution.
RESULTS
Figure 1 shows the simulated AIF used to generatetissue uptake curves. Examples of AIFs used in modelfitting are also shown: these either had incorrectly mea-
Table 1Literature Values of DCE-MRI Parameters Reported in VariousNormal and Pathological Tissues
Ktrans (min�1) vp ve
Grade IV glioma (Ref. 20) 0.081 0.045 0.224Meningioma (Ref. 12) 0.296 0.08 0.40Breast cancer (Ref. 21) 0.172 0.20 0.34Prostate tumor (Ref .19) 0.234 0.12 0.35Normal prostate (Ref. 19) 0.104 0.11 0.21Muscle (Ref. 19) 0.025 0.03 0.08
Figure 1. Actual AIF used in data generation (solid black line)has an initial bolus, a recirculation peak, and a biexponentialequilibrium phase. Inaccuracies in the AIF used for data fittingwere modeled as either a bolus amplitude error (solid graylines) or as a biexponential function fitted to low temporalresolution data (dotted gray lines).
738 Cheng
sured bolus peak amplitudes or were biexponential fitsto more slowly sampled data.
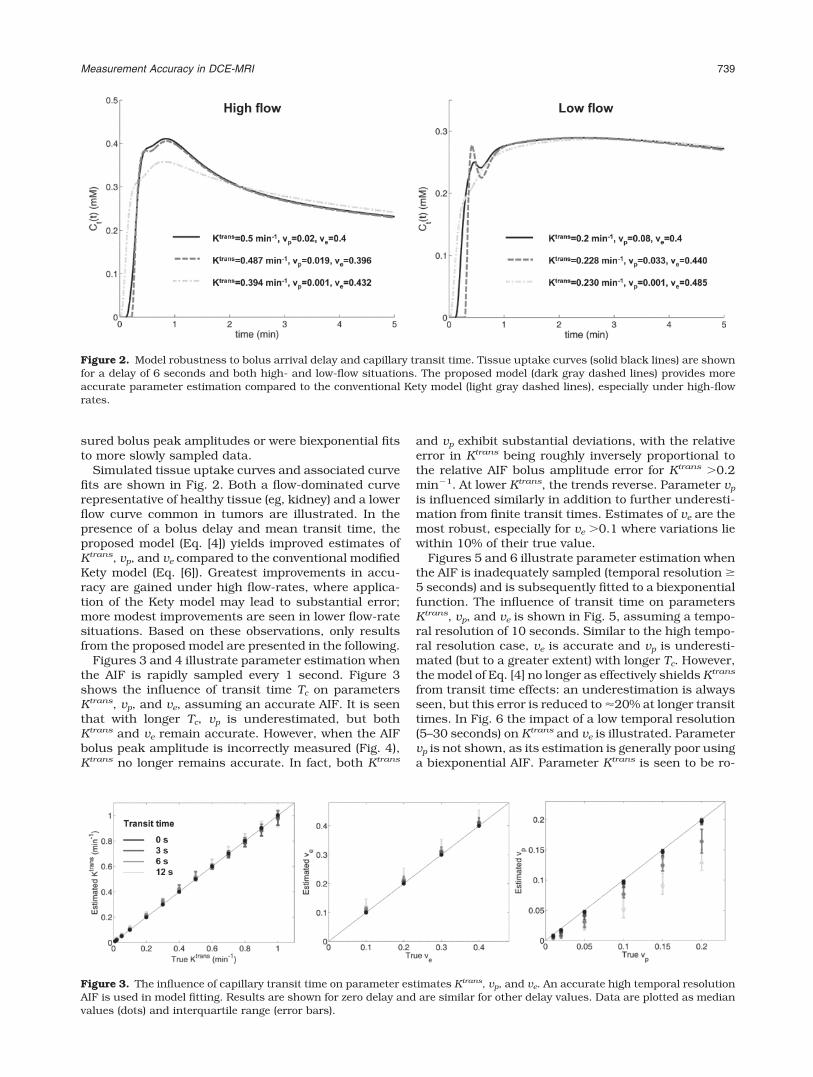
Simulated tissue uptake curves and associated curvefits are shown in Fig. 2. Both a flow-dominated curverepresentative of healthy tissue (eg, kidney) and a lowerflow curve common in tumors are illustrated. In thepresence of a bolus delay and mean transit time, theproposed model (Eq. [4]) yields improved estimates ofKtrans, vp, and ve compared to the conventional modifiedKety model (Eq. [6]). Greatest improvements in accu-racy are gained under high flow-rates, where applica-tion of the Kety model may lead to substantial error;more modest improvements are seen in lower flow-ratesituations. Based on these observations, only resultsfrom the proposed model are presented in the following.
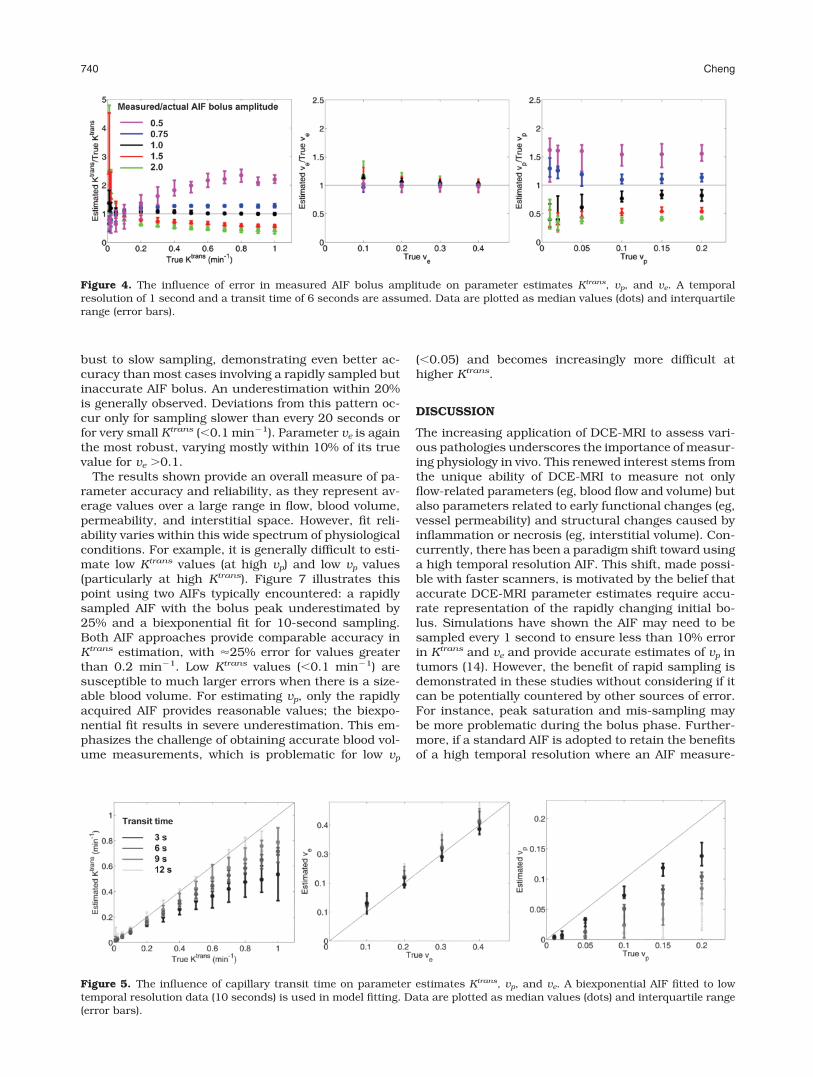
Figures 3 and 4 illustrate parameter estimation whenthe AIF is rapidly sampled every 1 second. Figure 3shows the influence of transit time Tc on parametersKtrans, vp, and ve, assuming an accurate AIF. It is seenthat with longer Tc, vp is underestimated, but bothKtrans and ve remain accurate. However, when the AIFbolus peak amplitude is incorrectly measured (Fig. 4),Ktrans no longer remains accurate. In fact, both Ktrans
and vp exhibit substantial deviations, with the relativeerror in Ktrans being roughly inversely proportional tothe relative AIF bolus amplitude error for Ktrans 0.2min�1. At lower Ktrans, the trends reverse. Parameter vp
is influenced similarly in addition to further underesti-mation from finite transit times. Estimates of ve are themost robust, especially for ve 0.1 where variations liewithin 10% of their true value.
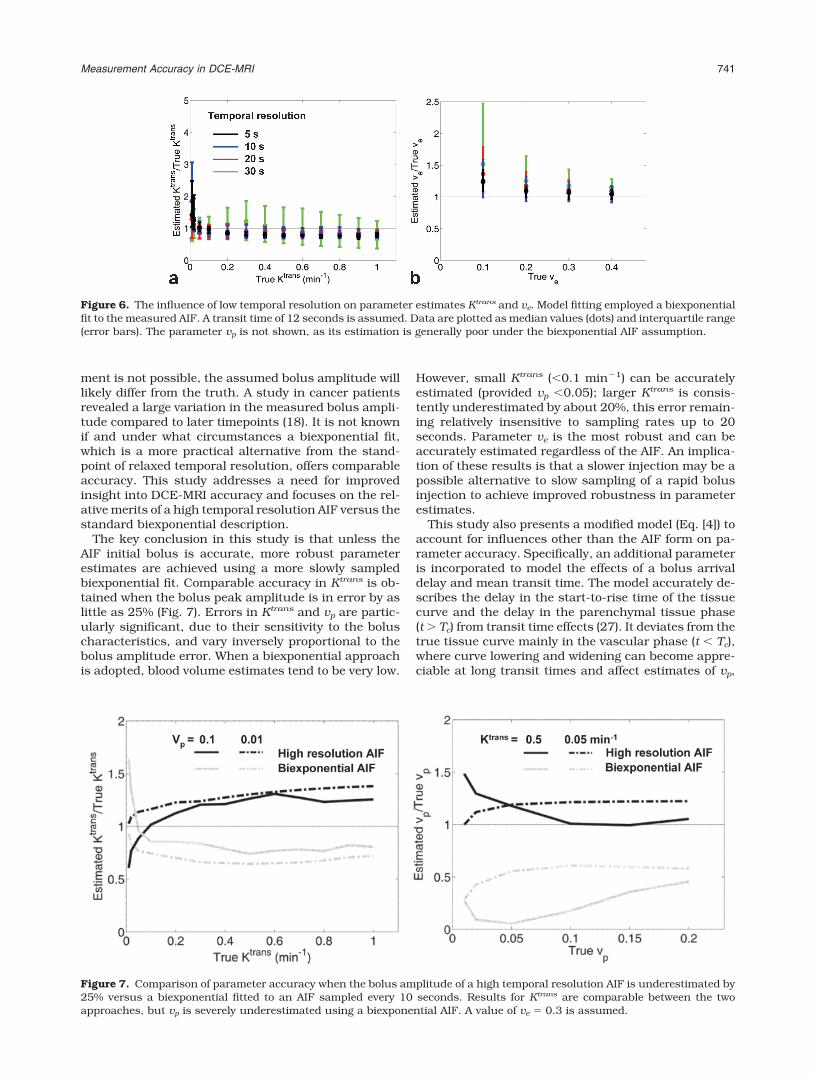
Figures 5 and 6 illustrate parameter estimation whenthe AIF is inadequately sampled (temporal resolution �5 seconds) and is subsequently fitted to a biexponentialfunction. The influence of transit time on parametersKtrans, vp, and ve is shown in Fig. 5, assuming a tempo-ral resolution of 10 seconds. Similar to the high tempo-ral resolution case, ve is accurate and vp is underesti-mated (but to a greater extent) with longer Tc. However,the model of Eq. [4] no longer as effectively shields Ktrans
from transit time effects: an underestimation is alwaysseen, but this error is reduced to �20% at longer transittimes. In Fig. 6 the impact of a low temporal resolution(5–30 seconds) on Ktrans and ve is illustrated. Parametervp is not shown, as its estimation is generally poor usinga biexponential AIF. Parameter Ktrans is seen to be ro-
Figure 2. Model robustness to bolus arrival delay and capillary transit time. Tissue uptake curves (solid black lines) are shownfor a delay of 6 seconds and both high- and low-flow situations. The proposed model (dark gray dashed lines) provides moreaccurate parameter estimation compared to the conventional Kety model (light gray dashed lines), especially under high-flowrates.
Figure 3. The influence of capillary transit time on parameter estimates Ktrans, vp, and ve. An accurate high temporal resolutionAIF is used in model fitting. Results are shown for zero delay and are similar for other delay values. Data are plotted as medianvalues (dots) and interquartile range (error bars).
Measurement Accuracy in DCE-MRI 739
bust to slow sampling, demonstrating even better ac-curacy than most cases involving a rapidly sampled butinaccurate AIF bolus. An underestimation within 20%is generally observed. Deviations from this pattern oc-cur only for sampling slower than every 20 seconds orfor very small Ktrans (�0.1 min�1). Parameter ve is againthe most robust, varying mostly within 10% of its truevalue for ve 0.1.
The results shown provide an overall measure of pa-rameter accuracy and reliability, as they represent av-erage values over a large range in flow, blood volume,permeability, and interstitial space. However, fit reli-ability varies within this wide spectrum of physiologicalconditions. For example, it is generally difficult to esti-mate low Ktrans values (at high vp) and low vp values(particularly at high Ktrans). Figure 7 illustrates thispoint using two AIFs typically encountered: a rapidlysampled AIF with the bolus peak underestimated by25% and a biexponential fit for 10-second sampling.Both AIF approaches provide comparable accuracy inKtrans estimation, with �25% error for values greaterthan 0.2 min�1. Low Ktrans values (�0.1 min�1) aresusceptible to much larger errors when there is a size-able blood volume. For estimating vp, only the rapidlyacquired AIF provides reasonable values; the biexpo-nential fit results in severe underestimation. This em-phasizes the challenge of obtaining accurate blood vol-ume measurements, which is problematic for low vp
(�0.05) and becomes increasingly more difficult athigher Ktrans.
DISCUSSION
The increasing application of DCE-MRI to assess vari-ous pathologies underscores the importance of measur-ing physiology in vivo. This renewed interest stems fromthe unique ability of DCE-MRI to measure not onlyflow-related parameters (eg, blood flow and volume) butalso parameters related to early functional changes (eg,vessel permeability) and structural changes caused byinflammation or necrosis (eg, interstitial volume). Con-currently, there has been a paradigm shift toward usinga high temporal resolution AIF. This shift, made possi-ble with faster scanners, is motivated by the belief thataccurate DCE-MRI parameter estimates require accu-rate representation of the rapidly changing initial bo-lus. Simulations have shown the AIF may need to besampled every 1 second to ensure less than 10% errorin Ktrans and ve and provide accurate estimates of vp intumors (14). However, the benefit of rapid sampling isdemonstrated in these studies without considering if itcan be potentially countered by other sources of error.For instance, peak saturation and mis-sampling maybe more problematic during the bolus phase. Further-more, if a standard AIF is adopted to retain the benefitsof a high temporal resolution where an AIF measure-
Figure 5. The influence of capillary transit time on parameter estimates Ktrans, vp, and ve. A biexponential AIF fitted to lowtemporal resolution data (10 seconds) is used in model fitting. Data are plotted as median values (dots) and interquartile range(error bars).
Figure 4. The influence of error in measured AIF bolus amplitude on parameter estimates Ktrans, vp, and ve. A temporalresolution of 1 second and a transit time of 6 seconds are assumed. Data are plotted as median values (dots) and interquartilerange (error bars).
740 Cheng
ment is not possible, the assumed bolus amplitude willlikely differ from the truth. A study in cancer patientsrevealed a large variation in the measured bolus ampli-tude compared to later timepoints (18). It is not knownif and under what circumstances a biexponential fit,which is a more practical alternative from the stand-point of relaxed temporal resolution, offers comparableaccuracy. This study addresses a need for improvedinsight into DCE-MRI accuracy and focuses on the rel-ative merits of a high temporal resolution AIF versus thestandard biexponential description.
The key conclusion in this study is that unless theAIF initial bolus is accurate, more robust parameterestimates are achieved using a more slowly sampledbiexponential fit. Comparable accuracy in Ktrans is ob-tained when the bolus peak amplitude is in error by aslittle as 25% (Fig. 7). Errors in Ktrans and vp are partic-ularly significant, due to their sensitivity to the boluscharacteristics, and vary inversely proportional to thebolus amplitude error. When a biexponential approachis adopted, blood volume estimates tend to be very low.
However, small Ktrans (�0.1 min�1) can be accuratelyestimated (provided vp �0.05); larger Ktrans is consis-tently underestimated by about 20%, this error remain-ing relatively insensitive to sampling rates up to 20seconds. Parameter ve is the most robust and can beaccurately estimated regardless of the AIF. An implica-tion of these results is that a slower injection may be apossible alternative to slow sampling of a rapid bolusinjection to achieve improved robustness in parameterestimates.
This study also presents a modified model (Eq. [4]) toaccount for influences other than the AIF form on pa-rameter accuracy. Specifically, an additional parameteris incorporated to model the effects of a bolus arrivaldelay and mean transit time. The model accurately de-scribes the delay in the start-to-rise time of the tissuecurve and the delay in the parenchymal tissue phase(t Tc) from transit time effects (27). It deviates from thetrue tissue curve mainly in the vascular phase (t � Tc),where curve lowering and widening can become appre-ciable at long transit times and affect estimates of vp,
Figure 6. The influence of low temporal resolution on parameter estimates Ktrans and ve. Model fitting employed a biexponentialfit to the measured AIF. A transit time of 12 seconds is assumed. Data are plotted as median values (dots) and interquartile range(error bars). The parameter vp is not shown, as its estimation is generally poor under the biexponential AIF assumption.
Figure 7. Comparison of parameter accuracy when the bolus amplitude of a high temporal resolution AIF is underestimated by25% versus a biexponential fitted to an AIF sampled every 10 seconds. Results for Ktrans are comparable between the twoapproaches, but vp is severely underestimated using a biexponential AIF. A value of ve 0.3 is assumed.
Measurement Accuracy in DCE-MRI 741
the parameter most dependent on the initial uptakeprofile. An underestimate in vp is obtained (Figs. 3, 5),consistent with other reports (12,16), and is shown inthis study to arise from transit time effects. ParameterKtrans exhibits errors only if more rapid uptake charac-teristics from very short transit times are inadequatelysampled (Fig. 5). In general, Ktrans and ve remain rela-tively insensitive to transit time effects using Eq. [4], astheir estimation is mainly influenced by characteristicsof the parenchymal tissue phase.
Reliability varies for different parameters, dependingon what portion of the tissue curve the parameter in-fluences and the degree of overlap with other parame-ters under specific physiological and experimental con-ditions. For example, the blood volume vp affects theentire tissue curve but has greatest effect in the first-pass where blood contrast concentration is highest.Thus, vp is very sensitive to an incorrectly or inade-quately measured AIF bolus. The error in vp varies in-versely with the bolus amplitude error (Fig. 4), but isgenerally dominated by a transit time-related underes-timation. Only large blood volumes (vp 0.05), athreshold also reported in Ref. (14), can be accuratelymeasured, due to the presence of a distinct blood con-tribution in the early vascular phase of tissue uptake.
The interstitial volume ve is the most robust to vari-ations in virtually every parameter examined in thisstudy. This can be appreciated from the effect ve has onthe tissue uptake curve, which is to increase the equi-librium amplitude and delay its rise to equilibrium (6).Since the equilibrium phase is separated in time fromthe vascular phase and exhibits much less rapid signalfluctuations, the impact of slow sampling or an error inthe AIF bolus amplitude is minimal. The impact of ad-ditional delays from bolus arrival or transit time is alsonegligible when Eq. [4] is applied.
The transfer constant Ktrans exerts the most complexinfluence on the shape of the tissue curve and, thus,displays varying reliability in estimated values. Gener-ally, a greater Ktrans yields a higher initial peak, ifpresent, and also increases the initial rising slope (fromfaster flow) and the equilibrium concentration and cur-vature about the initial peak (from larger permeability)(12). When this peak is present (generally for Ktrans 0.1 min�1 under appreciable contrast backflux [13]), anerror in the measured AIF bolus amplitude will producean inversely proportional error in Ktrans similar to thatin vp (Fig. 4). At lower Ktrans (�0.2 min�1) the uptakebecomes monotonically rising; the initial peak, if it per-sists, stems mainly from a substantial blood volumecontribution. Thus, at low vp, small Ktrans estimatesremain relatively robust to AIF errors. Only at larger vp
is Ktrans more variable due to parameter coupling (Figs.4, 7), and is slightly overestimated even in the absenceof AIF errors (Fig. 4), as reported also in Refs. (12,13).Slow sampling can have further impact in two scenar-ios. The first is high Ktrans ( 0.1 min�1), where under-estimates similar to Ref. (14) are obtained, becauseinadequate sampling of the initial uptake is erroneouslyinterpreted as a more slowly rising slope. The secondscenario is small Ktrans at high blood volumes, where anaccurate AIF bolus needed to account for the initial
peak dominating the tissue curve is not available froma biexponential AIF description.
This study investigated a subset of the numerousfactors influencing DCE-MRI accuracy and made anumber of assumptions regarding the form of errors.Foremost is that the AIF was separated into a reliableand unreliable part at low and high concentrations,respectively, an approach also adopted in DSC-MRIstudies (23). This assumption is based on the greaterdifficulty in measuring the first passage compared tothe equilibrium phase, particularly at low temporal res-olutions. Also inherent in this assumption is the dom-inance of peak saturation and mis-sampling over otherfactors, such as in-flow, that affect the entire AIF time-course. To mimic blood profiles in human realistically,an AIF similar to that measured in the aorta (18) wasadopted. Measurement error in the AIF was simulatedas a scaling of a gamma variate describing the initialbolus. This scaling is commonly applied to fit experi-mentally derived AIFs, which highlights the pervasive-ness of incorrectly estimating the peak amplitude dueto poor data quality alone. Error sources not consideredin this study include those related to converting signalintensity to contrast agent concentration, covarianceamong parameters, and noise. However, signal noisewas deliberately not incorporated, since the study wasdesigned to assess parameter accuracy, not data qual-ity or other experimental variables. The results repre-sent the best that can be achieved for each type of AIFconsidered. Future work will incorporate reproducibil-ity studies and examine the effect of errors in laterphases of the AIF timecourse.
Several items related to data analysis need to benoted. Foremost, to minimize the number of parame-ters and maintain robust fitting, distinction of flow frompermeability effects, or bolus delay from transit times,was not attempted. Even with four parameters, themodel solution was not always unique and varied withthe initial values for curve fitting. This problem of pa-rameter correlation has been noted elsewhere (12,14)and is a source of variability in the final estimates. Inthis study, a series of initial values were attempted, andthe one yielding the best fit was chosen as the finalsolution. An independent method to estimate the bolusdelay (28) can allow for estimation of the transit timeusing Eq. [2]; however, preliminary studies show thatalthough both Eqs. [2] and [4] estimate four parame-ters, the former is more susceptible to fit instability.
In conclusion, this study attempted to improve ourunderstanding of parameter accuracy in DCE-MRI. Ahigh temporal resolution AIF with a bolus amplitudeerror is shown to introduce significant inaccuraciesin parameters Ktrans and vp. When the bolus ampli-tude error exceeds 25%, more accurate and robustparameter estimation is achieved through fitting abiexponential decay function to a more slowly butaccurately sampled AIF. Other disrupting influenceson parameter estimation are also considered, specif-ically those from bolus delays and transit times. Amodified model is shown to improve parameter accu-racy substantially in the presence of these un-knowns. Results are obtained over a wide range ofphysiological conditions to provide guidelines for de-
742 Cheng
signing DCE-MRI methods appropriate for the dis-ease in question.
REFERENCES
1. Padhani AR. Dynamic contrast-enhanced MRI in clinical oncology:current status and future directions. J Magn Reson Imaging 2002;16:407–422.
2. Beek AM, Kuhl HP, Bondarenko O, et al. Delayed contrast-en-hanced magnetic resonance imaging for the prediction of regionalfunctional improvement after acute myocardial infarction. J AmColl Cardiol 2003;42:895–901.
3. Workie DW, Dardzinski BJ, Graham TB, Laor T, Bommer WA,O’Brien KJ. Quantification of dynamic contrast-enhanced MR im-aging of the knee in children with juvenile rheumatoid arthritisbased on pharmacokinetic modeling. Magn Reson Imaging 2004;22:1201–1210.
4. Tofts PS. Modeling tracer kinetics in dynamic Gd-DTPA MR imag-ing. J Magn Reson Imaging 1997;7:91–101.
5. Parker GJM, Padhani AR. T1-w DCE-MRI: T1-weighted dynamiccontrast-enhanced MRI. In: Tofts PS, ed. Quantitative MRI of thebrain: measuring changes caused by disease. Hoboken, NJ: JohnWiley & Sons; 2003:341–364.
6. Tofts PS, Kermode AG. Measurement of the blood-brain barrierpermeability and leakage space using dynamic MR imaging. 1.Fundamental concepts. Magn Reson Med 1991;17:357–367.
7. Parker GJM, Tanner SF, Leach MO. Pitfalls in the measurement oftissue permeability over short time-scales using multi-compart-ment models with a low temporal resolution blood input function.In: Proc 4th Annual Meeting ISMRM, New York; 1996:1582.
8. Evelhoch JL. Key factors in the acquisition of contrast kinetic datafor oncology. J Magn Reson Imaging 1999;10:254–259.
9. Peeters F, Annet L, Hermoye L, Van Beers BE. Inflow correction ofhepatic perfusion measurements using T1-weighted, fast gradient-echo, contrast-enhanced MRI. Magn Reson Med 2004;51:710–717.
10. Cheng HL. T1 measurement of flowing blood and arterial inputfunction determination for quantitative 3D T1-weighted DCE-MRI.J Magn Reson Imaging 2007;25:1073–1078.
11. Calamante F, Gadian DG, Connelly A. Delay and dispersion effectsin dynamic susceptibility contrast MRI: simulations using singularvalue decomposition. Magn Reson Med 2000;44:466–473.
12. Buckley DL. Uncertainty in the analysis of tracer kinetics usingdynamic contrast-enhanced T1-weighted MRI. Magn Reson Med2002;47:601–606.
13. Li KL, Jackson A. New hybrid technique for accurate and repro-ducible quantitation of dynamic contrast-enhanced MRI data.Magn Reson Med 2003;50:1286–1295.
14. Henderson E, Rutt BK, Lee TY. Temporal sampling requirementsfor the tracer kinetics modeling of breast disease. Magn ResonImaging 1998;16:1057–1073.
15. van Osch MJ, van der Grond J, Bakker CJ. Partial volume effectson arterial input functions: shape and amplitude distortions andtheir correction. J Magn Reson Imaging 2005;22:704–709.
16. St Lawrence KS, Lee TY. An adiabatic approximation to the tissuehomogeneity model for water exchange in the brain: I. Theoreticalderivation. J Cereb Blood Flow Metab 1998;18:1365–1377.
17. Weinmann HJ, Laniado M, Mutzel W. Pharmacokinetics of Gd-DTPA/dimeglumine after intravenous injection into healthy volun-teers. Physiol Chem Phys Med NMR 1984;16:167–172.
18. Parker GJ, Roberts C, Macdonald A, et al. Experimentally-derivedfunctional form for a population-averaged high-temporal-resolu-tion arterial input function for dynamic contrast-enhanced MRI.Magn Reson Med 2006;56:993–1000.
19. Kershaw LE, Buckley DL. Precision in measurements of perfusionand microvascular permeability with T1-weighted dynamic con-trast-enhanced MRI. Magn Reson Med 2006;56:986–992.
20. Ludemann L, Grieger W, Wurm R, Wust P, Zimmer C. Quantitativemeasurement of leakage volume and permeability in gliomas, me-ningiomas and brain metastases with dynamic contrast-enhancedMRI. Magn Reson Imaging 2005;23:833–841.
21. Brix G, Kiessling F, Lucht R, et al. Microcirculation and microvas-culature in breast tumors: pharmacokinetic analysis of dynamicMR image series. Magn Reson Med 2004;52:420–429.
22. Quarles CC, Ward BD, Schmainda KM. Improving the reliability ofobtaining tumor hemodynamic parameters in the presence of con-trast agent extravasation. Magn Reson Med 2005;53:1307–1316.
23. Brunecker P, Villringer A, Schultze J, et al. Correcting saturationeffects of the arterial input function in dynamic susceptibility con-trast-enhanced MRI — a Monte Carlo simulation. Magn ResonImaging 2007;25:1300–1311.
24. Fritz-Hansen T, Rostrup E, Larsson HB, Sondergaard L, Ring P,Henriksen O. Measurement of the arterial concentration of Gd-DTPA using MRI: a step toward quantitative perfusion imaging.Magn Reson Med 1996;36:225–231.
25. Ivancevic MK, Zimine I, Montet X, et al. Inflow effect correction infast gradient-echo perfusion imaging. Magn Reson Med 2003;50:885–891.
26. Ellinger R, Kremser C, Schocke MF, et al. The impact of peaksaturation of the arterial input function on quantitative evaluationof dynamic susceptibility contrast-enhanced MR studies. J Com-put Assist Tomogr 2000;24:942–948.
27. Koh TS, Zeman V, Darko J, et al. The inclusion of capillary distri-bution in the adiabatic tissue homogeneity model of blood flow.Phys Med Biol 2001;46:1519–1538.
28. Cheong LH, Koh TS, Hou Z. An automatic approach for estimatingbolus arrival time in dynamic contrast MRI using piecewise contin-uous regression models. Phys Med Biol 2003;48:N83–88.
Measurement Accuracy in DCE-MRI 743