Embed Size (px)
Citation preview
Fishery Data Series No. 00-43
Investigations of Alternate Sites for Chinook SalmonSonar on the Kenai River
by
Debby Burwen,
James Hasbrouck,
and
Dan Bosch
December 2000
Alaska Department of Fish and Game Division of Sport Fish
Symbols and Abbreviations
The following symbols and abbreviations, and others approved for the Système International d'Unités (SI), are usedin Division of Sport Fish Fishery Manuscripts, Fishery Data Series Reports, Fishery Management Reports, andSpecial Publications without definition. All others must be defined in the text at first mention, as well as in the titlesor footnotes of tables and in figures or figure captions.
Weights and measures (metric)centimeter cmdeciliter dLgram ghectare hakilogram kgkilometer kmliter Lmeter mmetric ton mtmilliliter mlmillimeter mm
Weights and measures (English)cubic feet per second ft3/sfoot ftgallon galinch inmile miounce ozpound lbquart qtyard ydSpell out acre and ton.
Time and temperatureday ddegrees Celsius °Cdegrees Fahrenheit °Fhour (spell out for 24-hour clock) hminute minsecond sSpell out year, month, and week.
Physics and chemistryall atomic symbolsalternating current ACampere Acalorie caldirect current DChertz Hzhorsepower hphydrogen ion activity pHparts per million ppmparts per thousand ppt, ‰volts Vwatts W
GeneralAll commonly accepted
abbreviations.e.g., Mr., Mrs.,a.m., p.m., etc.
All commonly acceptedprofessional titles.
e.g., Dr., Ph.D.,R.N., etc.
and &at @Compass directions:
east Enorth Nsouth Swest W
Copyright Corporate suffixes:
Company Co.Corporation Corp.Incorporated Inc.
Limited Ltd.et alii (and other
people)et al.
et cetera (and so forth) etc.exempli gratia (for
example)e.g.,
id est (that is) i.e.,latitude or longitude lat. or long.monetary symbols
(U.S.)$, ¢
months (tables andfigures): first threeletters
Jan,...,Dec
number (before anumber)
# (e.g., #10)
pounds (after a number) # (e.g., 10#)registered trademark trademark United States
(adjective)U.S.
United States ofAmerica (noun)
USA
U.S. state and Districtof Columbiaabbreviations
use two-letterabbreviations(e.g., AK, DC)
Mathematics, statistics, fisheriesalternate hypothesis HA
base of naturallogarithm
e
catch per unit effort CPUEcoefficient of variation CVcommon test statistics F, t, χ2, etc.confidence interval C.I.correlation coefficient R (multiple)correlation coefficient r (simple)covariance covdegree (angular or
temperature)°
degrees of freedom dfdivided by ÷ or / (in
equations)equals =expected value Efork length FLgreater than >greater than or equal to ≥harvest per unit effort HPUEless than <less than or equal to ≤logarithm (natural) lnlogarithm (base 10) loglogarithm (specify base) log2, etc.mideye-to-fork MEFminute (angular) 'multiplied by xnot significant NSnull hypothesis HO
percent %probability Pprobability of a type I
error (rejection of thenull hypothesis whentrue)
α
probability of a type IIerror (acceptance ofthe null hypothesiswhen false)
β
second (angular) "standard deviation SDstandard error SEstandard length SLtotal length TLvariance Var
FISHERY DATA SERIES NO. 00-43
INVESTIGATIONS OF ALTERNATE SITES FOR CHINOOK SALMONSONAR ON THE KENAI RIVER
by
Debby Burwen and Dan BoschDivision of Sport Fish, Anchorage
andJames Hasbrouck
Division of Sport Fish, Research and Technical Services, Anchorage
Alaska Department of Fish and GameDivision of Sport Fish, Research and Technical Services333 Raspberry Road, Anchorage, Alaska, 99518-1599
December 2000
This investigation was partially financed by the Federal Aid in Sport Fish Restoration Act(16 U.S.C. 777-777K) under project F-10-15, Job No. S-2-28.
The Fishery Data Series was established in 1987 for the publication of technically-oriented results for a singleproject or group of closely related projects. Fishery Data Series reports are intended for fishery and other technicalprofessionals. Fishery Data Series reports are available through the Alaska State Library and on the Internet:http://www.sf.adfg.state.ak.us/statewide/divreports/html/intersearch.cfm This publication has undergone editorialand peer review.
Debby Burwen and Daniel BoschAlaska Department of Fish and Game, Division of Sport Fish
andJames Hasbrouck
Alaska Department of Fish and Game, Division of Sport Fish, Research and Technical Services333 Raspberry Road, Anchorage, Alaska 99518-1599, USA
This document should be cited as:Burwen, D., J. Hasbrouck, and D. Bosch. 2000. Investigations of alternate sites for chinook salmon sonar on the
Kenai River. Alaska Department of Fish and Game, Fishery Data Series No. 00-43, Anchorage.
The Alaska Department of Fish and Game administers all programs and activities free from discrimination based onrace, color, national origin, age, sex, religion, marital status, pregnancy, parenthood, or disability. The departmentadministers all programs and activities in compliance with Title VI of the Civil Rights Act of 1964, Section 504 ofthe Rehabilitation Act of 1973, Title II of the Americans with Disabilities Act of 1990, the Age Discrimination Actof 1975, and Title IX of the Education Amendments of 1972.
If you believe you have been discriminated against in any program, activity, or facility, or if you desire furtherinformation please write to ADF&G, P.O. Box 25526, Juneau, AK 99802-5526; U.S. Fish and Wildlife Service,4040 N. Fairfield Drive, Suite 300, Arlington, VA 22203 or O.E.O., U.S. Department of the Interior, WashingtonDC 20240.
For information on alternative formats for this and other department publications, please contact the departmentADA Coordinator at (voice) 907-465-4120, (TDD) 907-465-3646, or (FAX) 907-465-2440.
TABLE OF CONTENTSPage
i
LIST OF TABLES ............................................................................................................................................................................ii
LIST OF FIGURES ........................................................................................................................................................................ iii
LIST OF APPENDICES................................................................................................................................................................ iv
ABSTRACT.......................................................................................................................................................................................1
INTRODUCTION............................................................................................................................................................................1
METHODS.........................................................................................................................................................................................3
Site Selection .....................................................................................................................................................................................3Hydroacoustic Sampling..................................................................................................................................................................3Net Sampling .....................................................................................................................................................................................3
RESULTS...........................................................................................................................................................................................9
Site Selection .....................................................................................................................................................................................9Hydroacoustic Sampling..................................................................................................................................................................9
Left Bank.......................................................................................................................................................................................9Right Bank..................................................................................................................................................................................11
Net Sampling ...................................................................................................................................................................................11
DISCUSSION..................................................................................................................................................................................22
Hydroacoustics................................................................................................................................................................................22Boat Traffic.................................................................................................................................................................................23Bottom Topography..................................................................................................................................................................24Spawning Fish............................................................................................................................................................................27Other Issues ................................................................................................................................................................................27
Netting ..............................................................................................................................................................................................27Conclusions .....................................................................................................................................................................................27
RECOMMENDATIONS...............................................................................................................................................................30
LITERATURE CITED ..................................................................................................................................................................31
APPENDIX A.-CHARACTERISTICS OF SITES FOR SIDE-LOOKING SONAR........................................................33
APPENDIX B.-SAMPLING SCHEDULE FOR INRIVER NETTING...............................................................................39
APPENDIX C..................................................................................................................................................................................41
ii
LIST OF TABLESTable Page
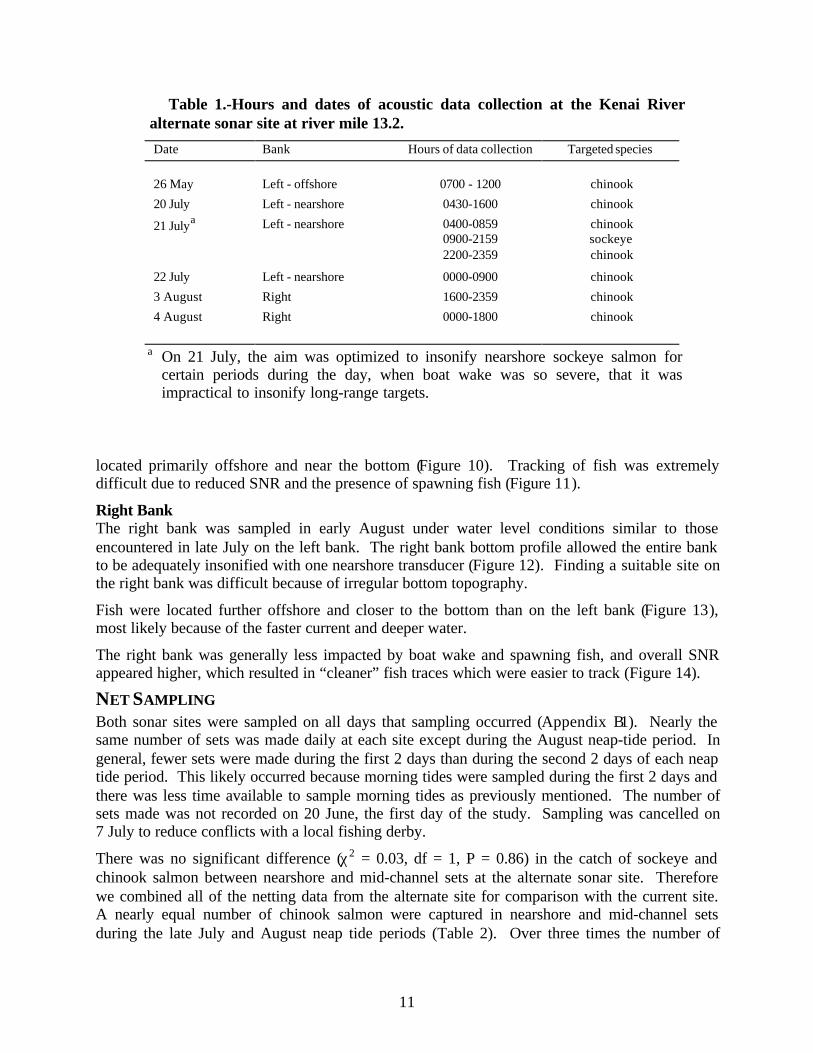
1. Hours and dates of acoustic data collection at the Kenai River alternate sonar site at river mile 13.2............112. Number of sets and catches of chinook and sockeye salmon in 13.5 cm mesh gillnets drifted through
the alternate and current chinook salmon sonar sites on the Kenai River, 1999..................................................213. Log odds and odds ratio statistics comparing catches of chinook and sockeye salmon at the alternate
and current chinook salmon sonar sites on the Kenai River, 1999.........................................................................224. Summary of pros and cons for current chinook sonar site at river mile 8.6. ........................................................235. Summary of pros and cons for alternate chinook sonar site at river mile 13.2....................................................246. Chart contrasting current sonar site at river mile 8.6 with alternate sonar site at river mile 13.2.....................25
iii
LIST OF FIGURESFigure Page
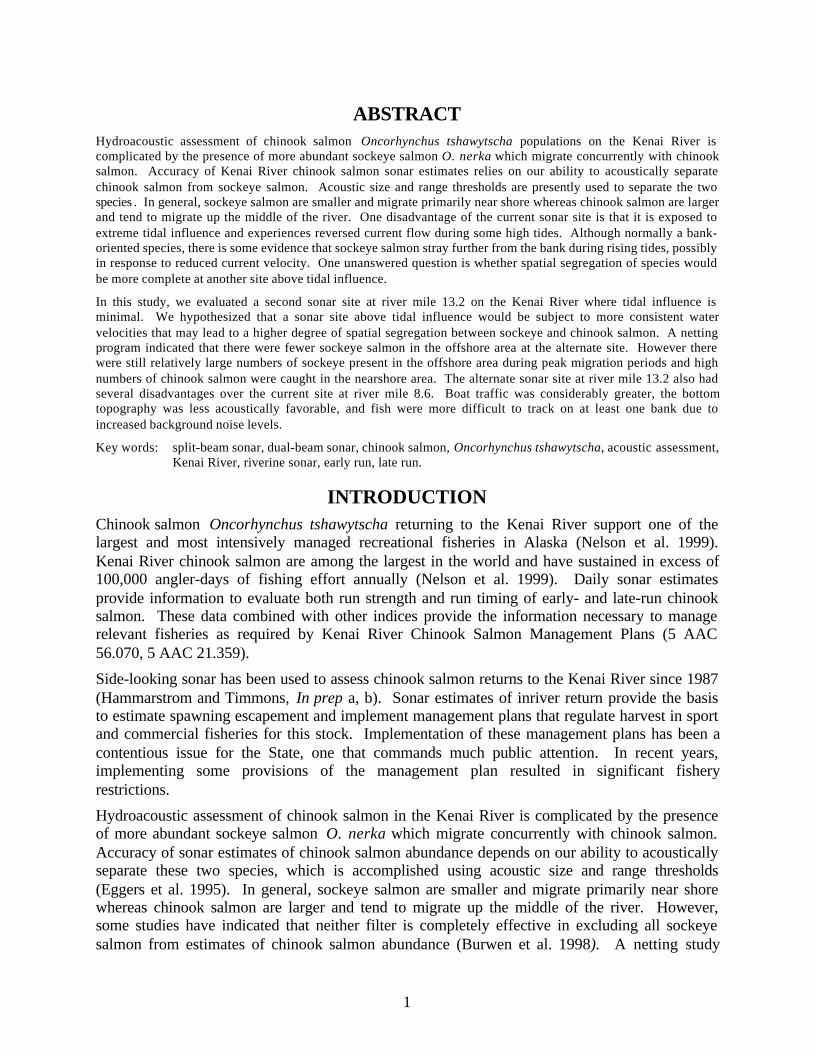
1. Aerial (1:1000) photograph of the Kenai River showing the location of bottom transects between rivermiles 12 and 14 on 4 May 1999. ....................................................................................................................................4
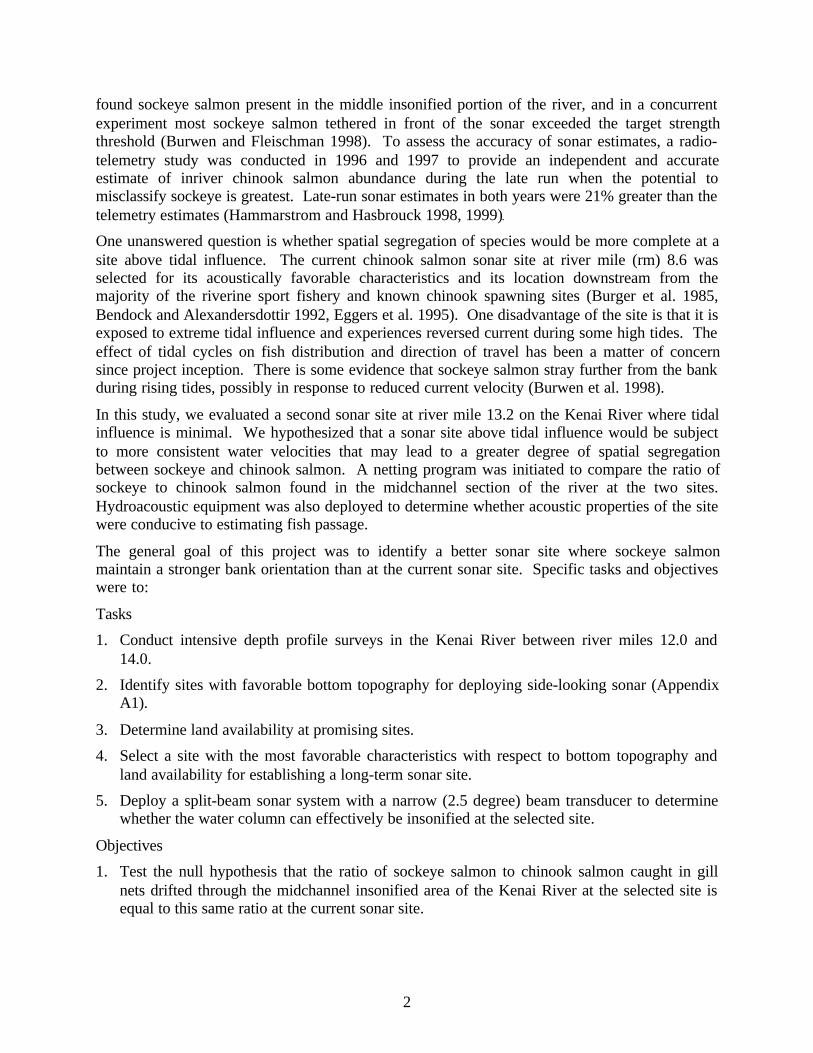
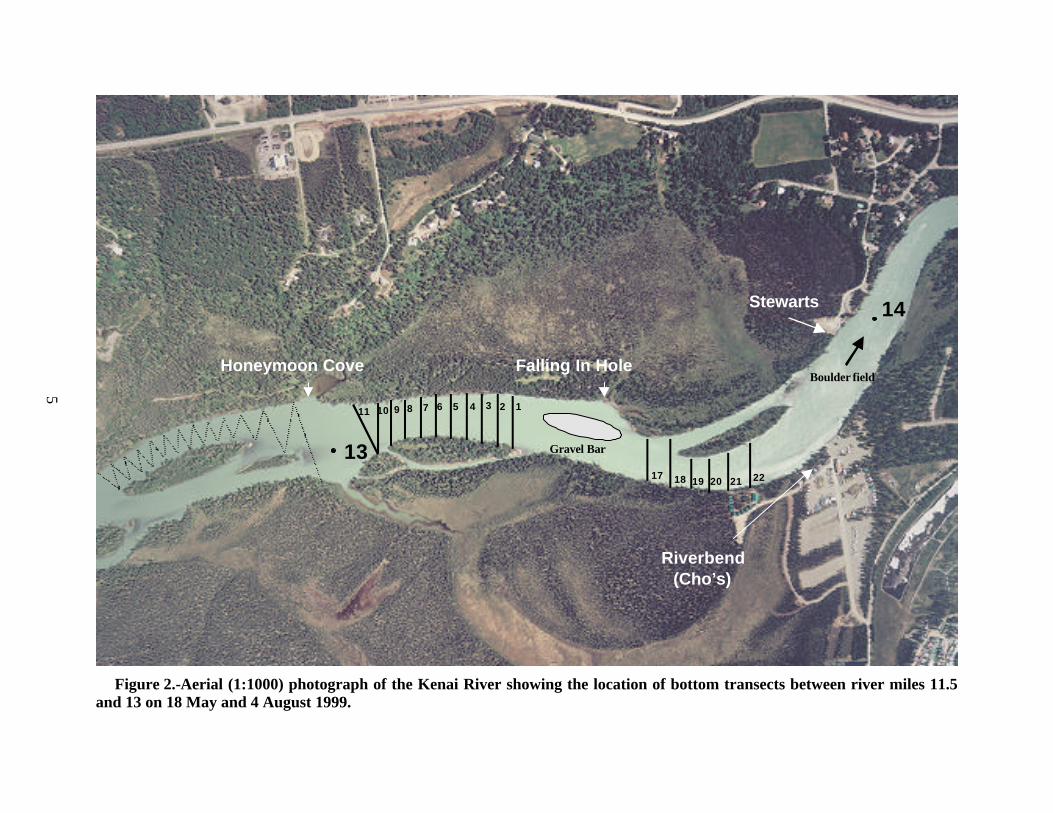
2. Aerial (1:1000) photograph of the Kenai River showing the location of bottom transects between rivermiles 11.5 and 13 on 18 May and 4 August 1999.......................................................................................................5
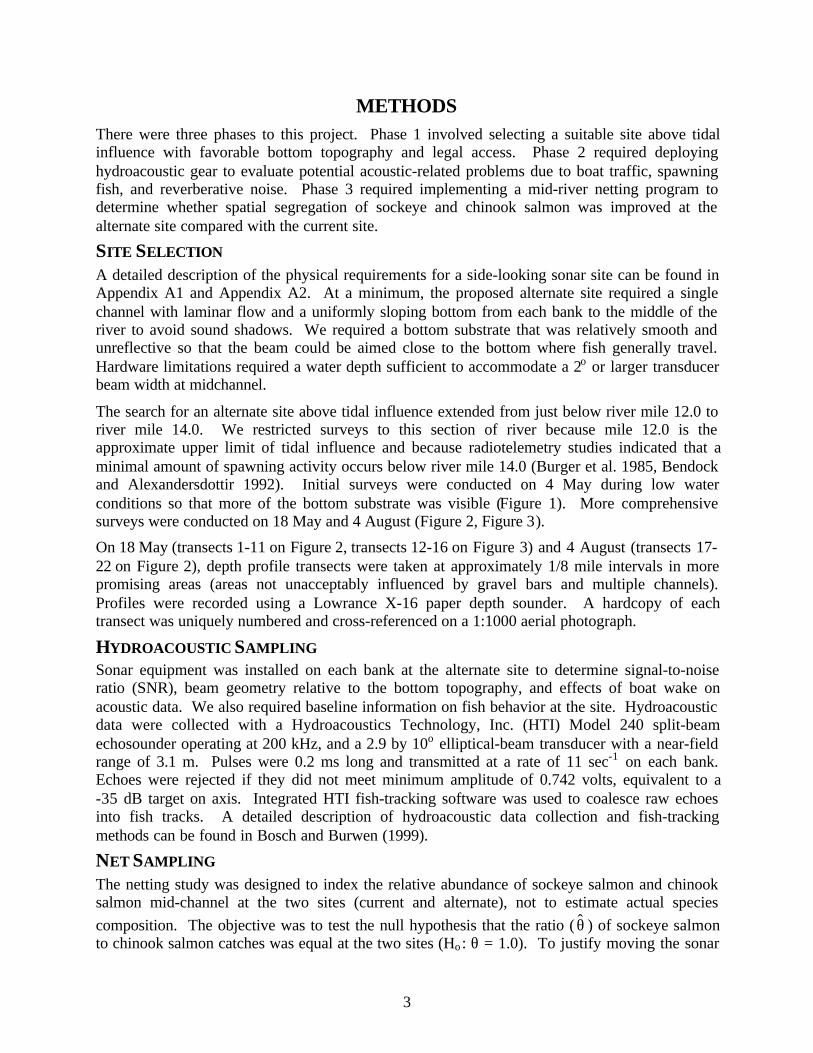
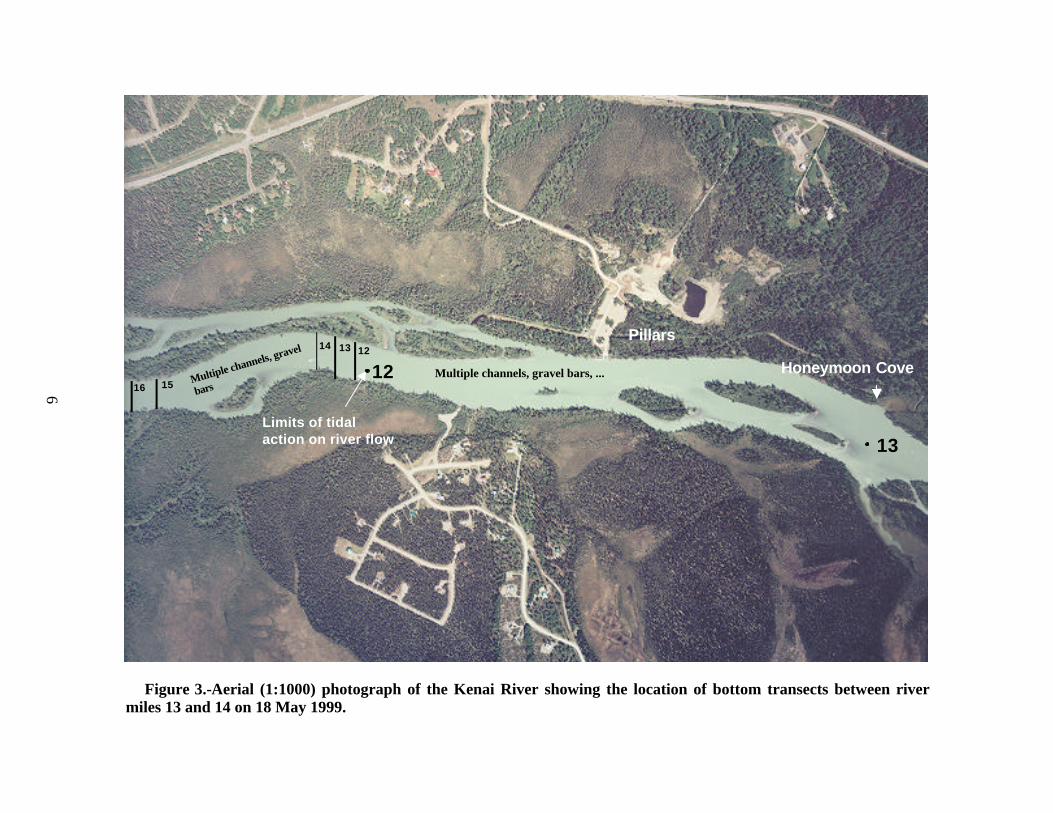
3. Aerial (1:1000) photograph of the Kenai River showing the location of bottom transects between rivermiles 13 and 14 on 18 May 1999. ..................................................................................................................................6
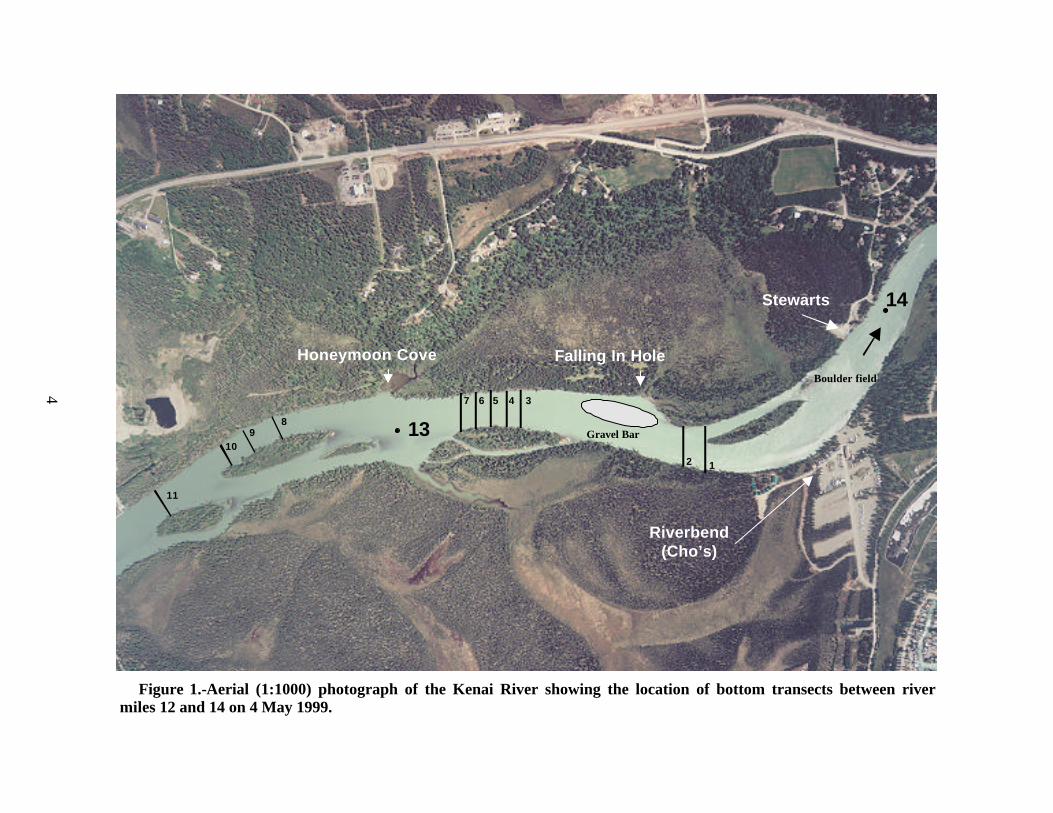
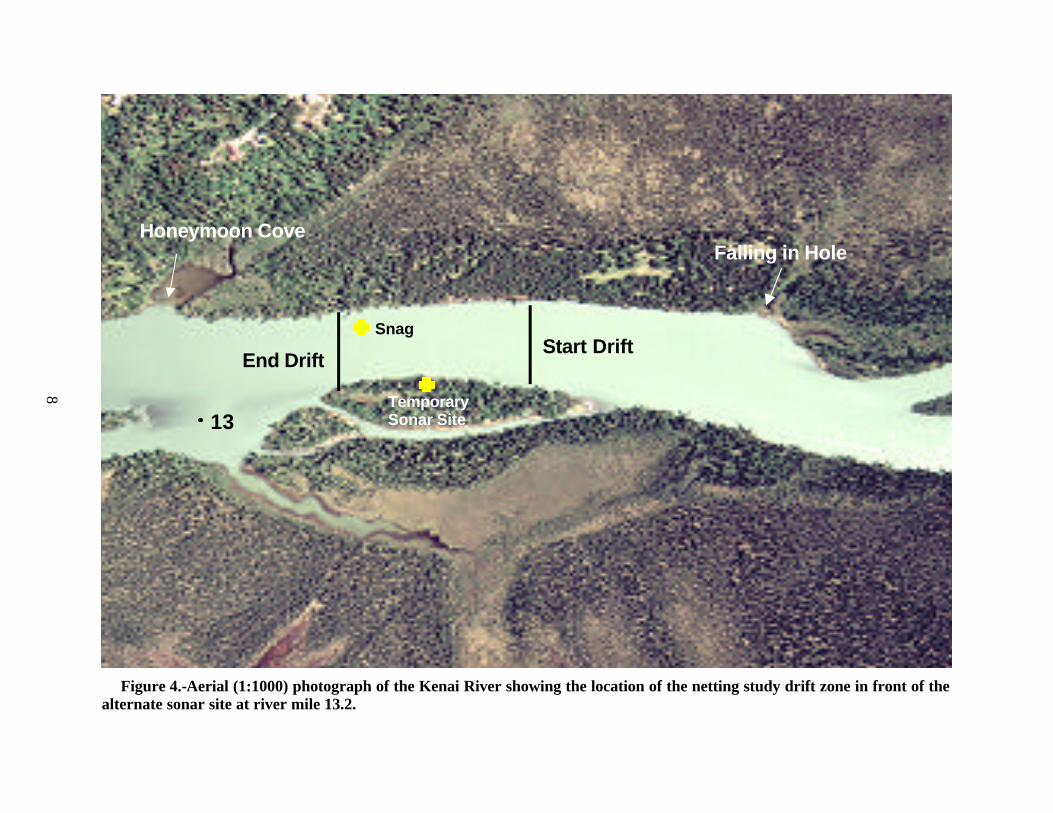
4. Aerial (1:1000) photograph of the Kenai River showing the location of the netting study drift zone infront of the alternate sonar site at river mile 13.2........................................................................................................8
5. Depth profile of alternate sonar site evaluated in 1999 at Kenai river mile 13.2.................................................106. Profile of alternate sonar site at Kenai river mile 13.2 showing the insonified area on the left bank
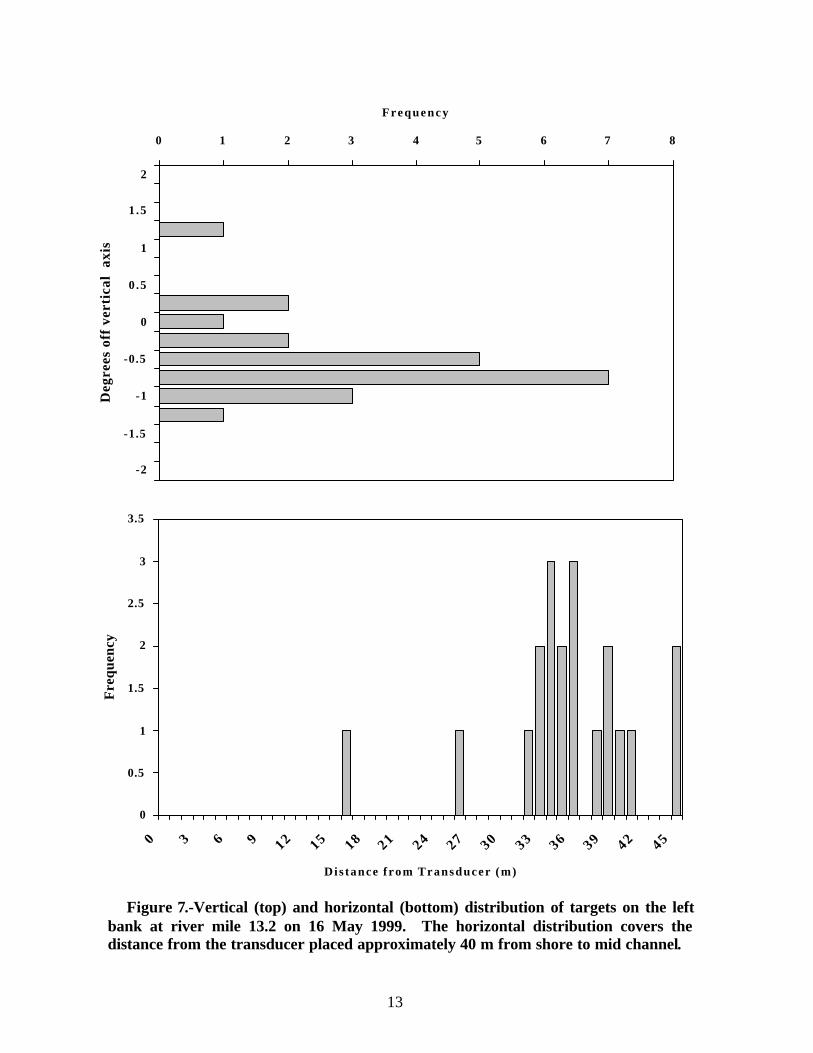
during low water conditions. ........................................................................................................................................127. Vertical (top) and horizontal (bottom) distribution of targets on the left bank at river mile 13.2 on 16
May 1999. The horizontal distribution covers the distance from the transducer placed approximately40 m from shore to mid channel...................................................................................................................................13
8. Electronic chart (with x-y dimension graph insert) from left bank offshore transducer on 26 May 1999showing a typical fish trace. Poor SNR leads to high errors in positional estimates.........................................14
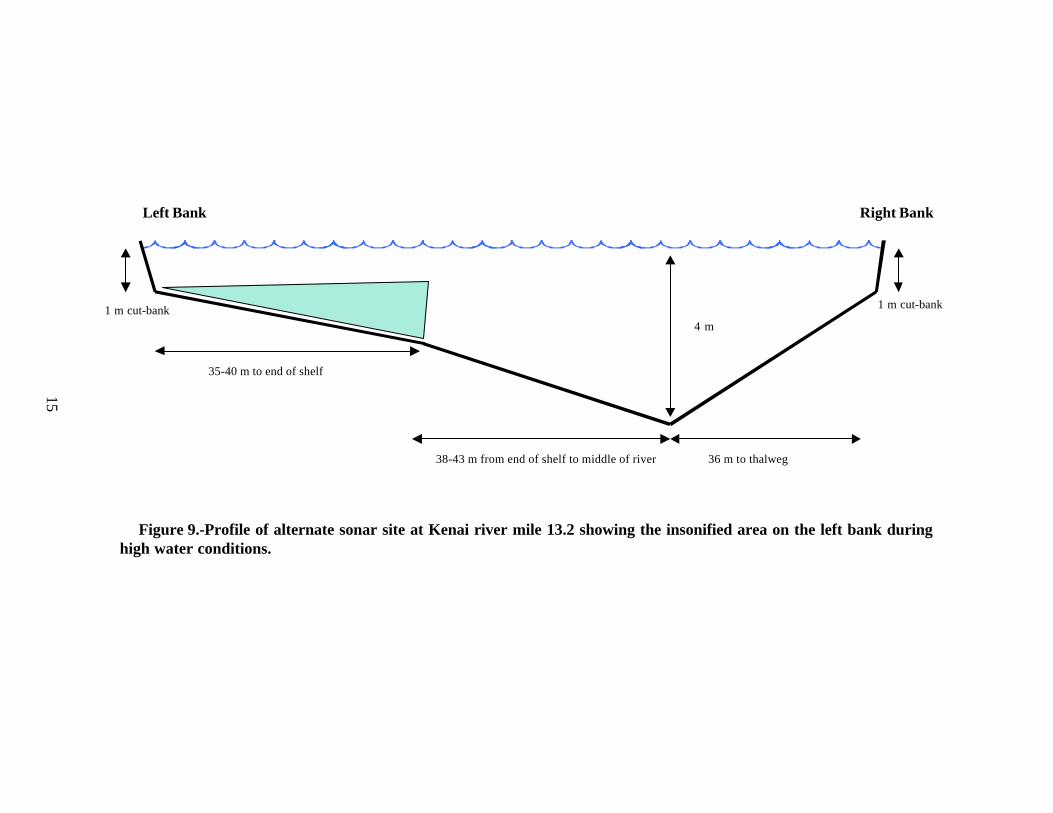
9. Profile of alternate sonar site at Kenai river mile 13.2 showing the insonified area on the left bankduring high water conditions. .......................................................................................................................................15
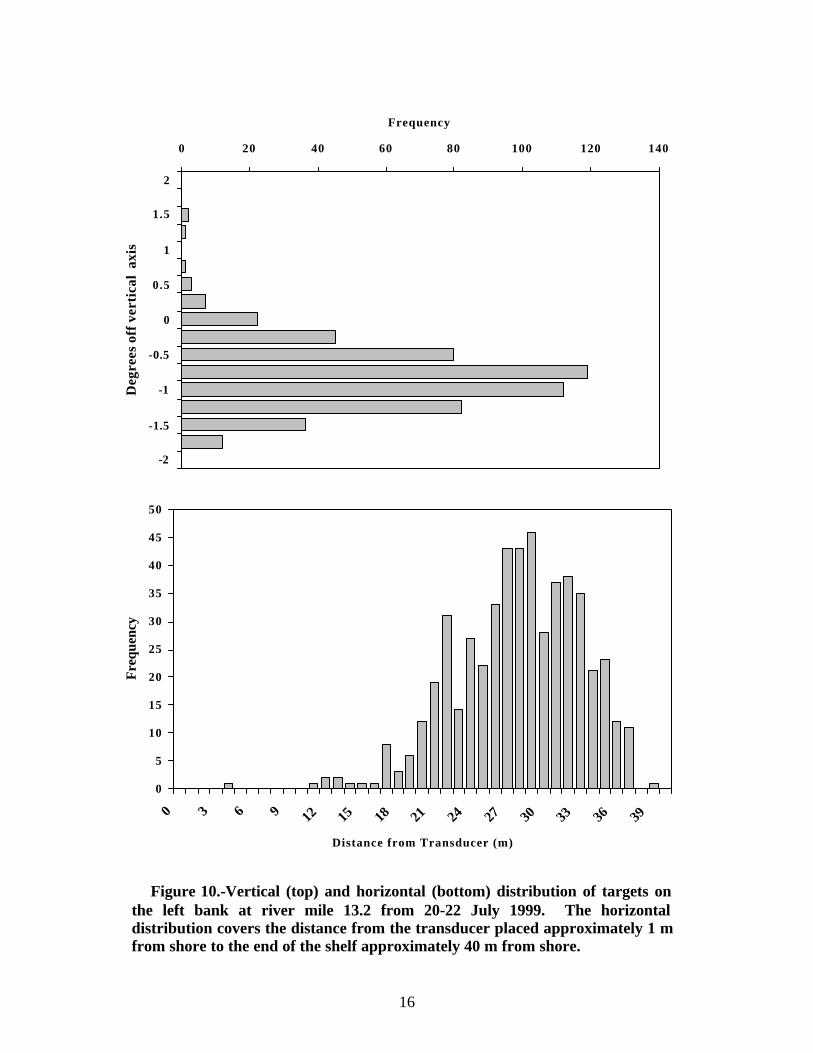
10. Vertical (top) and horizontal (bottom) distribution of targets on the left bank at river mile 13.2 from20-22 July 1999. The horizontal distribution covers the distance from the transducer placedapproximately 1 m from shore to the end of the shelf approximately 40 m from shore. ...................................16
11. Electronic chart from left bank nearshore transducer on 22 July 1999 showing typical faint,overlapping, sinuous traces mixed in with spawning fish traces. Tracking fish is difficult and subjectto inaccuracies under these conditions........................................................................................................................17
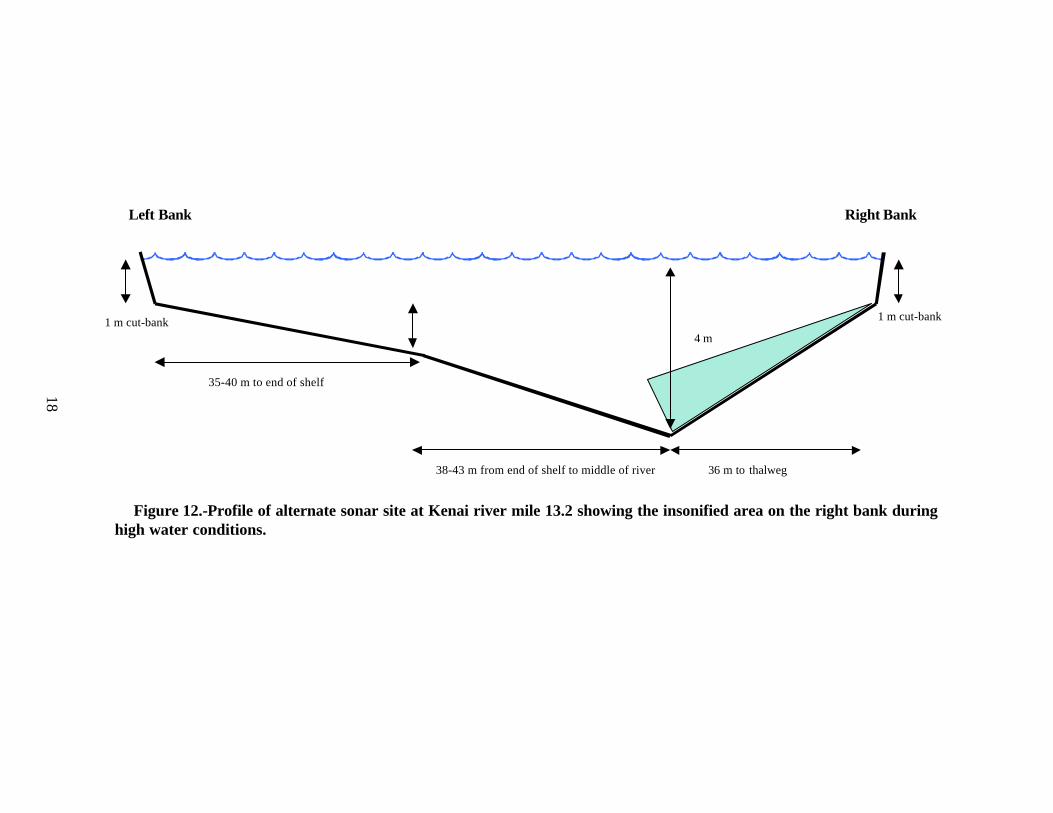
12. Profile of alternate sonar site at Kenai river mile 13.2 showing the insonified area on the right bankduring high water conditions. .......................................................................................................................................18
13. Vertical (top) and horizontal (bottom) distribution of targets on the right bank at river mile 13.2 from3-4 August 1999..............................................................................................................................................................19
14. Electronic chart recording (with 2-d positional graph insert) showing typical tracked fish at the right-bank site on 3 August 1999...........................................................................................................................................20
15. Electronic chart from left bank nearshore transducer on 21 July 1999 showing how entrained air from aboat propeller blocks most of the acoustic signal beyond 25 m. ............................................................................26
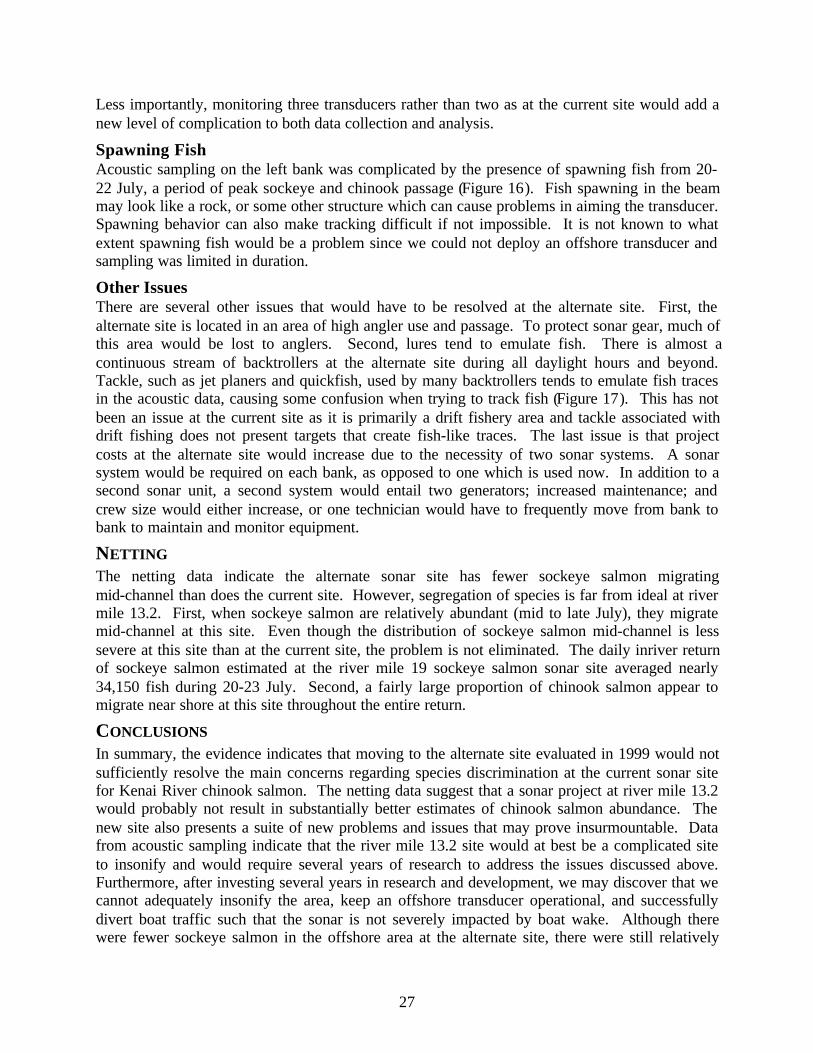
16. Electronic chart recording showing spawning fish behavior at the left-bank site on 21 July. Spawningfish resemble stationary targets such as bottom structure........................................................................................28
17. Electronic chart recording from left bank nearshore transducer on 22 July 1999 showing how two luresor jet planes from a backtroller may emulate fish traces. ........................................................................................29
iv
LIST OF APPENDICESAppendix Page
A1. Characteristics of side-looking fisheries sonar sites.................................................................................................34A2. Example of good (A) and poor (B) sites for insonifying fish in the side-looking configuration. A good
site has a smooth, gradually sloping bottom with no sound shadows and allows the acoustic beam to lieclose to the river bottom where fish typically migrate. A poor site has an uneven bottom which resultsin sound shadows that cannot be insonified by the acoustic beam, allowing some fish to escapedetection...........................................................................................................................................................................36
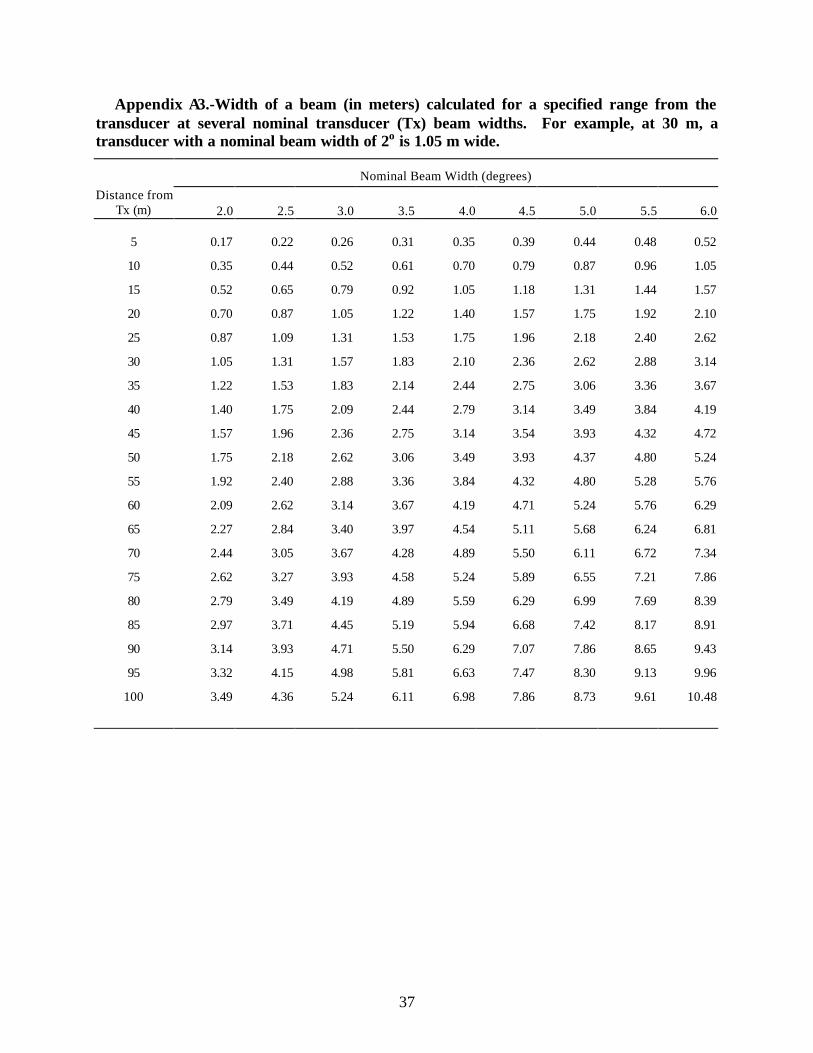
A3. Width of a beam (in meters) calculated for a specified range from the transducer at several nominaltransducer (Tx) beam widths. For example, at 30 m, a transducer with a nominal beam width of 2o is1.05 m wide......................................................................................................................................................................37
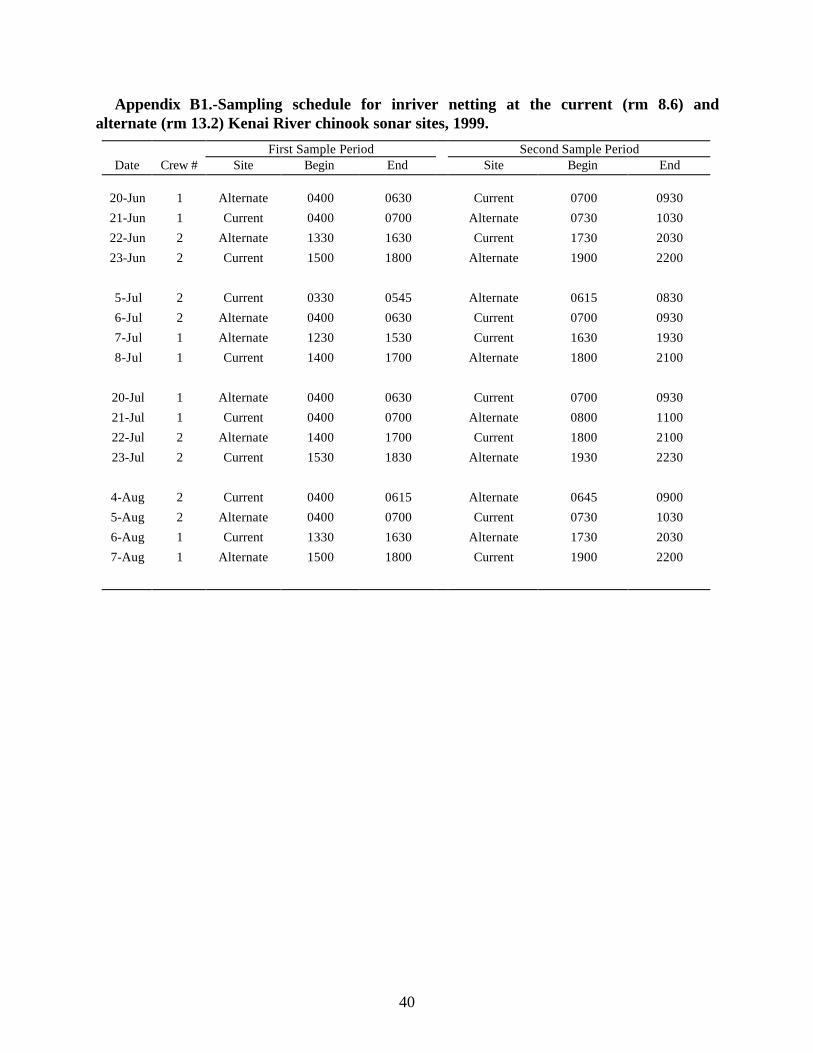
B1. Sampling schedule for inriver netting at the current (rm 8.6) and alternate (rm 13.2) Kenai Riverchinook sonar sites, 1999...............................................................................................................................................40
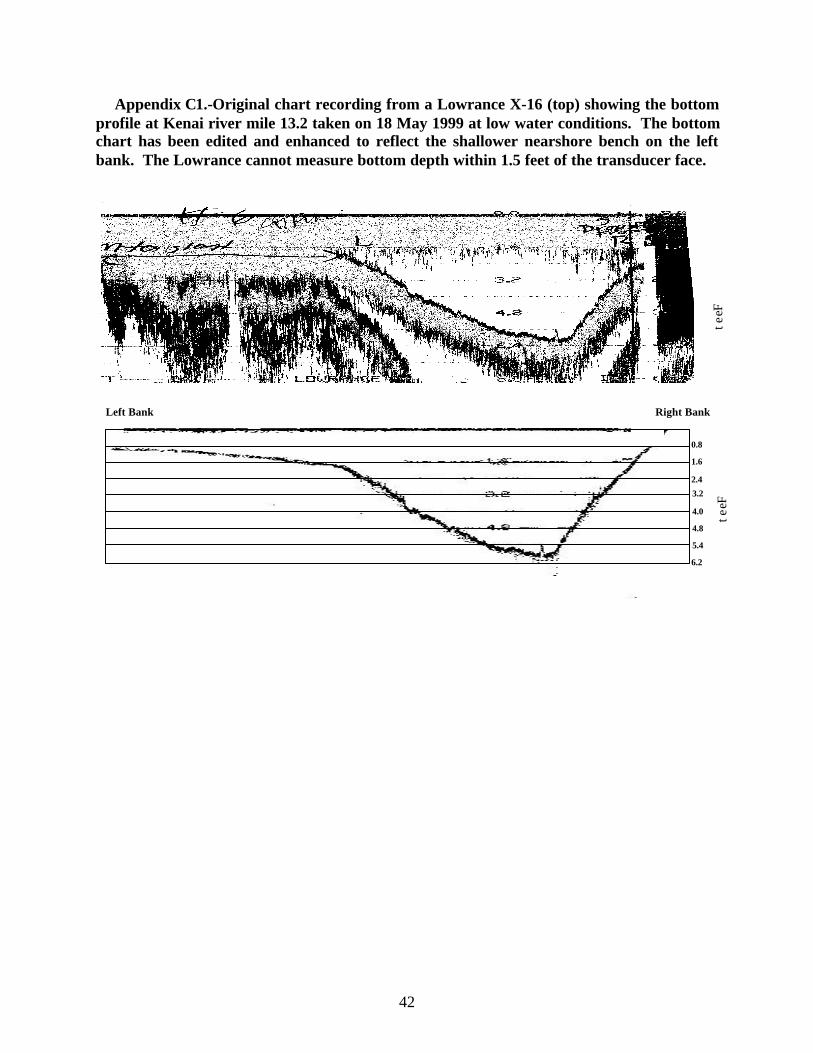
C1. Original chart recording from a Lowrance X-16 (top) showing the bottom profile at Kenai river mile13.2 taken on 18 May 1999 at low water conditions. The bottom chart has been edited and enhancedto reflect the shallower nearshore bench on the left bank. The Lowrance cannot measure bottom depthwithin 1.5 feet of the transducer face. .........................................................................................................................42
1
ABSTRACTHydroacoustic assessment of chinook salmon Oncorhynchus tshawytscha populations on the Kenai River iscomplicated by the presence of more abundant sockeye salmon O. nerka which migrate concurrently with chinooksalmon. Accuracy of Kenai River chinook salmon sonar estimates relies on our ability to acoustically separatechinook salmon from sockeye salmon. Acoustic size and range thresholds are presently used to separate the twospecies . In general, sockeye salmon are smaller and migrate primarily near shore whereas chinook salmon are largerand tend to migrate up the middle of the river. One disadvantage of the current sonar site is that it is exposed toextreme tidal influence and experiences reversed current flow during some high tides. Although normally a bank-oriented species, there is some evidence that sockeye salmon stray further from the bank during rising tides, possiblyin response to reduced current velocity. One unanswered question is whether spatial segregation of species wouldbe more complete at another site above tidal influence.
In this study, we evaluated a second sonar site at river mile 13.2 on the Kenai River where tidal influence isminimal. We hypothesized that a sonar site above tidal influence would be subject to more consistent watervelocities that may lead to a higher degree of spatial segregation between sockeye and chinook salmon. A nettingprogram indicated that there were fewer sockeye salmon in the offshore area at the alternate site. However therewere still relatively large numbers of sockeye present in the offshore area during peak migration periods and highnumbers of chinook salmon were caught in the nearshore area. The alternate sonar site at river mile 13.2 also hadseveral disadvantages over the current site at river mile 8.6. Boat traffic was considerably greater, the bottomtopography was less acoustically favorable, and fish were more difficult to track on at least one bank due toincreased background noise levels.
Key words: split-beam sonar, dual-beam sonar, chinook salmon, Oncorhynchus tshawytscha, acoustic assessment,Kenai River, riverine sonar, early run, late run.
INTRODUCTIONChinook salmon Oncorhynchus tshawytscha returning to the Kenai River support one of thelargest and most intensively managed recreational fisheries in Alaska (Nelson et al. 1999).Kenai River chinook salmon are among the largest in the world and have sustained in excess of100,000 angler-days of fishing effort annually (Nelson et al. 1999). Daily sonar estimatesprovide information to evaluate both run strength and run timing of early- and late-run chinooksalmon. These data combined with other indices provide the information necessary to managerelevant fisheries as required by Kenai River Chinook Salmon Management Plans (5 AAC56.070, 5 AAC 21.359).
Side-looking sonar has been used to assess chinook salmon returns to the Kenai River since 1987(Hammarstrom and Timmons, In prep a, b). Sonar estimates of inriver return provide the basisto estimate spawning escapement and implement management plans that regulate harvest in sportand commercial fisheries for this stock. Implementation of these management plans has been acontentious issue for the State, one that commands much public attention. In recent years,implementing some provisions of the management plan resulted in significant fisheryrestrictions.
Hydroacoustic assessment of chinook salmon in the Kenai River is complicated by the presenceof more abundant sockeye salmon O. nerka which migrate concurrently with chinook salmon.Accuracy of sonar estimates of chinook salmon abundance depends on our ability to acousticallyseparate these two species, which is accomplished using acoustic size and range thresholds(Eggers et al. 1995). In general, sockeye salmon are smaller and migrate primarily near shorewhereas chinook salmon are larger and tend to migrate up the middle of the river. However,some studies have indicated that neither filter is completely effective in excluding all sockeyesalmon from estimates of chinook salmon abundance (Burwen et al. 1998). A netting study
2
found sockeye salmon present in the middle insonified portion of the river, and in a concurrentexperiment most sockeye salmon tethered in front of the sonar exceeded the target strengththreshold (Burwen and Fleischman 1998). To assess the accuracy of sonar estimates, a radio-telemetry study was conducted in 1996 and 1997 to provide an independent and accurateestimate of inriver chinook salmon abundance during the late run when the potential tomisclassify sockeye is greatest. Late-run sonar estimates in both years were 21% greater than thetelemetry estimates (Hammarstrom and Hasbrouck 1998, 1999).
One unanswered question is whether spatial segregation of species would be more complete at asite above tidal influence. The current chinook salmon sonar site at river mile (rm) 8.6 wasselected for its acoustically favorable characteristics and its location downstream from themajority of the riverine sport fishery and known chinook spawning sites (Burger et al. 1985,Bendock and Alexandersdottir 1992, Eggers et al. 1995). One disadvantage of the site is that it isexposed to extreme tidal influence and experiences reversed current during some high tides. Theeffect of tidal cycles on fish distribution and direction of travel has been a matter of concernsince project inception. There is some evidence that sockeye salmon stray further from the bankduring rising tides, possibly in response to reduced current velocity (Burwen et al. 1998).
In this study, we evaluated a second sonar site at river mile 13.2 on the Kenai River where tidalinfluence is minimal. We hypothesized that a sonar site above tidal influence would be subjectto more consistent water velocities that may lead to a greater degree of spatial segregationbetween sockeye and chinook salmon. A netting program was initiated to compare the ratio ofsockeye to chinook salmon found in the midchannel section of the river at the two sites.Hydroacoustic equipment was also deployed to determine whether acoustic properties of the sitewere conducive to estimating fish passage.
The general goal of this project was to identify a better sonar site where sockeye salmonmaintain a stronger bank orientation than at the current sonar site. Specific tasks and objectiveswere to:
Tasks
1. Conduct intensive depth profile surveys in the Kenai River between river miles 12.0 and14.0.
2. Identify sites with favorable bottom topography for deploying side-looking sonar (AppendixA1).
3. Determine land availability at promising sites.
4. Select a site with the most favorable characteristics with respect to bottom topography andland availability for establishing a long-term sonar site.
5. Deploy a split-beam sonar system with a narrow (2.5 degree) beam transducer to determinewhether the water column can effectively be insonified at the selected site.
Objectives
1. Test the null hypothesis that the ratio of sockeye salmon to chinook salmon caught in gillnets drifted through the midchannel insonified area of the Kenai River at the selected site isequal to this same ratio at the current sonar site.
3
METHODSThere were three phases to this project. Phase 1 involved selecting a suitable site above tidalinfluence with favorable bottom topography and legal access. Phase 2 required deployinghydroacoustic gear to evaluate potential acoustic-related problems due to boat traffic, spawningfish, and reverberative noise. Phase 3 required implementing a mid-river netting program todetermine whether spatial segregation of sockeye and chinook salmon was improved at thealternate site compared with the current site.
SITE SELECTION
A detailed description of the physical requirements for a side-looking sonar site can be found inAppendix A1 and Appendix A2. At a minimum, the proposed alternate site required a singlechannel with laminar flow and a uniformly sloping bottom from each bank to the middle of theriver to avoid sound shadows. We required a bottom substrate that was relatively smooth andunreflective so that the beam could be aimed close to the bottom where fish generally travel.Hardware limitations required a water depth sufficient to accommodate a 2o or larger transducerbeam width at midchannel.
The search for an alternate site above tidal influence extended from just below river mile 12.0 toriver mile 14.0. We restricted surveys to this section of river because mile 12.0 is theapproximate upper limit of tidal influence and because radiotelemetry studies indicated that aminimal amount of spawning activity occurs below river mile 14.0 (Burger et al. 1985, Bendockand Alexandersdottir 1992). Initial surveys were conducted on 4 May during low waterconditions so that more of the bottom substrate was visible (Figure 1). More comprehensivesurveys were conducted on 18 May and 4 August (Figure 2, Figure 3).
On 18 May (transects 1-11 on Figure 2, transects 12-16 on Figure 3) and 4 August (transects 17-22 on Figure 2), depth profile transects were taken at approximately 1/8 mile intervals in morepromising areas (areas not unacceptably influenced by gravel bars and multiple channels).Profiles were recorded using a Lowrance X-16 paper depth sounder. A hardcopy of eachtransect was uniquely numbered and cross-referenced on a 1:1000 aerial photograph.
HYDROACOUSTIC SAMPLING
Sonar equipment was installed on each bank at the alternate site to determine signal-to-noiseratio (SNR), beam geometry relative to the bottom topography, and effects of boat wake onacoustic data. We also required baseline information on fish behavior at the site. Hydroacousticdata were collected with a Hydroacoustics Technology, Inc. (HTI) Model 240 split-beamechosounder operating at 200 kHz, and a 2.9 by 10o elliptical-beam transducer with a near-fieldrange of 3.1 m. Pulses were 0.2 ms long and transmitted at a rate of 11 sec-1 on each bank.Echoes were rejected if they did not meet minimum amplitude of 0.742 volts, equivalent to a-35 dB target on axis. Integrated HTI fish-tracking software was used to coalesce raw echoesinto fish tracks. A detailed description of hydroacoustic data collection and fish-trackingmethods can be found in Bosch and Burwen (1999).
NET SAMPLING
The netting study was designed to index the relative abundance of sockeye salmon and chinooksalmon mid-channel at the two sites (current and alternate), not to estimate actual speciescomposition. The objective was to test the null hypothesis that the ratio ( θ̂ ) of sockeye salmonto chinook salmon catches was equal at the two sites (Ho : θ = 1.0). To justify moving the sonar
13
Falling In Hole
14
34567
89
10
11
Gravel Bar
2 1
Boulder field
Honeymoon Cove
Riverbend(Cho’s)
Stewarts
Figure 1.-Aerial (1:1000) photograph of the Kenai River showing the location of bottom transects between rivermiles 12 and 14 on 4 May 1999.
4
Honeymoon Cove
13
Falling In Hole
14
1234567891011
Gravel Bar
17 18 19 20 21 22
Boulder field
Riverbend(Cho’s)
Stewarts
Figure 2.-Aerial (1:1000) photograph of the Kenai River showing the location of bottom transects between river miles 11.5and 13 on 18 May and 4 August 1999.
5
Pillars
12 Honeymoon Cove
Limits of tidalaction on river flow 13
121314
1516Multiple channels, gravel bars, ...Multiple channels, gravel
bars
Figure 3.-Aerial (1:1000) photograph of the Kenai River showing the location of bottom transects between rivermiles 13 and 14 on 18 May 1999.
6
7
site, the ratio of the catch of sockeye salmon to chinook salmon at an alternate site must be muchsmaller than at the current site (Ha: θ << 1.0).
Previous sonar data (Hammarstrom 1994) indicate that higher sonar counts occur during neaptide periods, which occur twice monthly, and in general during rising and falling tides. Bothsites were sampled over 4 days during each of four neap tide periods: 20-23 June, 5-8 July, 20-23July, and 4-7 August (Appendix B1). To avoid interference with an inriver netting programdesigned to assess the age structure of the inriver return, only the tide cycle prior to a morninghigh tide or the tide cycle after an afternoon high tide was sampled.
In planning the study it appeared that 3 hours of sampling per site each day was sufficient toachieve the objective. For all afternoon falling tides the entire 3 hours per site could be sampled.On many of the morning tides it was not possible to sample 3 hours per site due to insufficientdaylight, but on nearly all of these days at least 2.5 hours could be sampled per site. In thesesituations, the total sample time was divided evenly between sites.
Gillnets with 13.5 cm (5.25 inch) stretched-mesh were used. The net was drifted with the currentfor approximately 200 m for each “set,” from 100 m upstream to 100 m downstream of therespective transducers (or likely location of the transducers at the alternate site; Figure 4). Thecrew extended the net in mid-channel upstream of a transducer and drifted through the mainchannel of the river. Alternate banks were fished with each drift. Beginning 23 June, the crewalso made nearshore sets at the alternate sonar site; no such sets were made at the current sonarsite.
The number of sockeye and chinook salmon captured was recorded for each set. All capturedfish were measured for fork length, marked with an adipose finclip, and then releaseddownstream of the respective site.
The analyses of the netting data involved estimating the log odds ratio and its variance as(Agresti 1990):
( )( )( )( )
++++
=θ5.0n5.0n5.0n5.0n
logˆlog2112
2211 , and (1)
( ) ,5.0n
15.0n
15.0n
15.0n
1ˆVar22211211
++
++
++
+=θ (2)
where:
11n = catch of sockeye salmon at the alternate sonar site,
12n = catch of chinook salmon at the alternate sonar site,
21n = catch of sockeye salmon at the current sonar site, and
22n = catch of chinook salmon at the current sonar site.
Falling in HoleHoneymoon Cove
TemporarySonar Site
Start DriftSnag
End Drift
13
Figure 4.-Aerial (1:1000) photograph of the Kenai River showing the location of the netting study drift zone in front of thealternate sonar site at river mile 13.2.
8
9
RESULTSSITE SELECTION
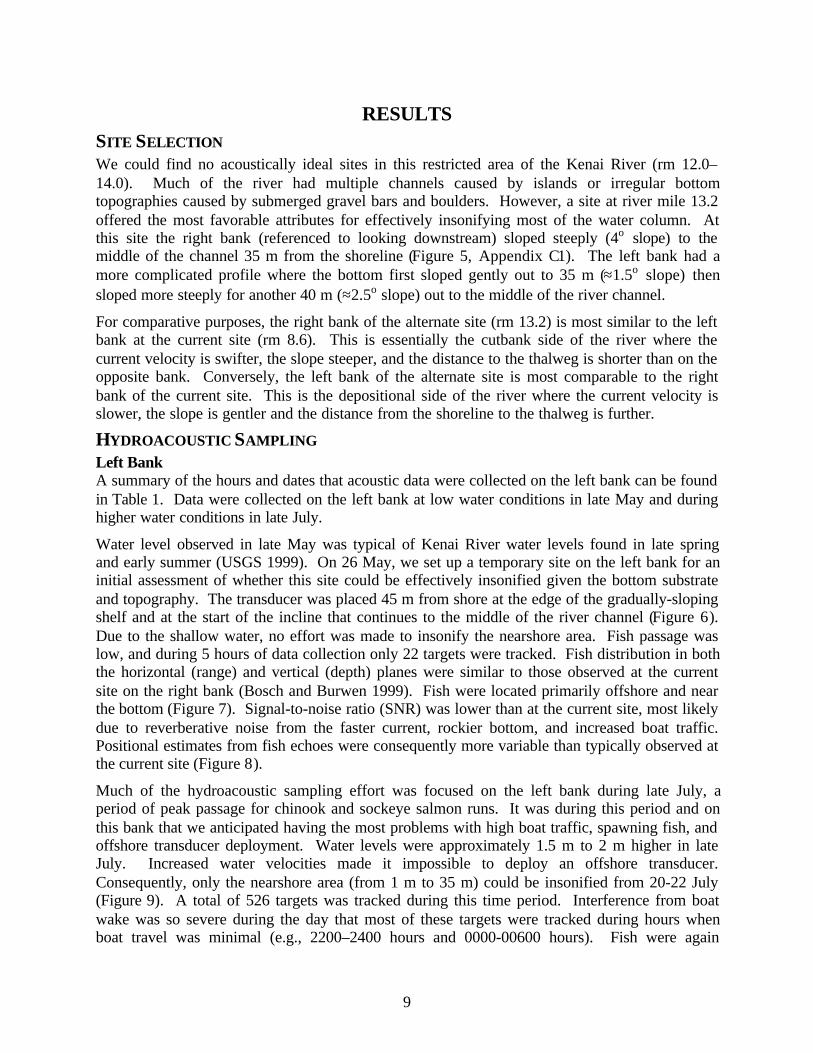
We could find no acoustically ideal sites in this restricted area of the Kenai River (rm 12.0–14.0). Much of the river had multiple channels caused by islands or irregular bottomtopographies caused by submerged gravel bars and boulders. However, a site at river mile 13.2offered the most favorable attributes for effectively insonifying most of the water column. Atthis site the right bank (referenced to looking downstream) sloped steeply (4o slope) to themiddle of the channel 35 m from the shoreline (Figure 5, Appendix C1). The left bank had amore complicated profile where the bottom first sloped gently out to 35 m (≈1.5o slope) thensloped more steeply for another 40 m (≈2.5o slope) out to the middle of the river channel.
For comparative purposes, the right bank of the alternate site (rm 13.2) is most similar to the leftbank at the current site (rm 8.6). This is essentially the cutbank side of the river where thecurrent velocity is swifter, the slope steeper, and the distance to the thalweg is shorter than on theopposite bank. Conversely, the left bank of the alternate site is most comparable to the rightbank of the current site. This is the depositional side of the river where the current velocity isslower, the slope is gentler and the distance from the shoreline to the thalweg is further.
HYDROACOUSTIC SAMPLING
Left BankA summary of the hours and dates that acoustic data were collected on the left bank can be foundin Table 1. Data were collected on the left bank at low water conditions in late May and duringhigher water conditions in late July.
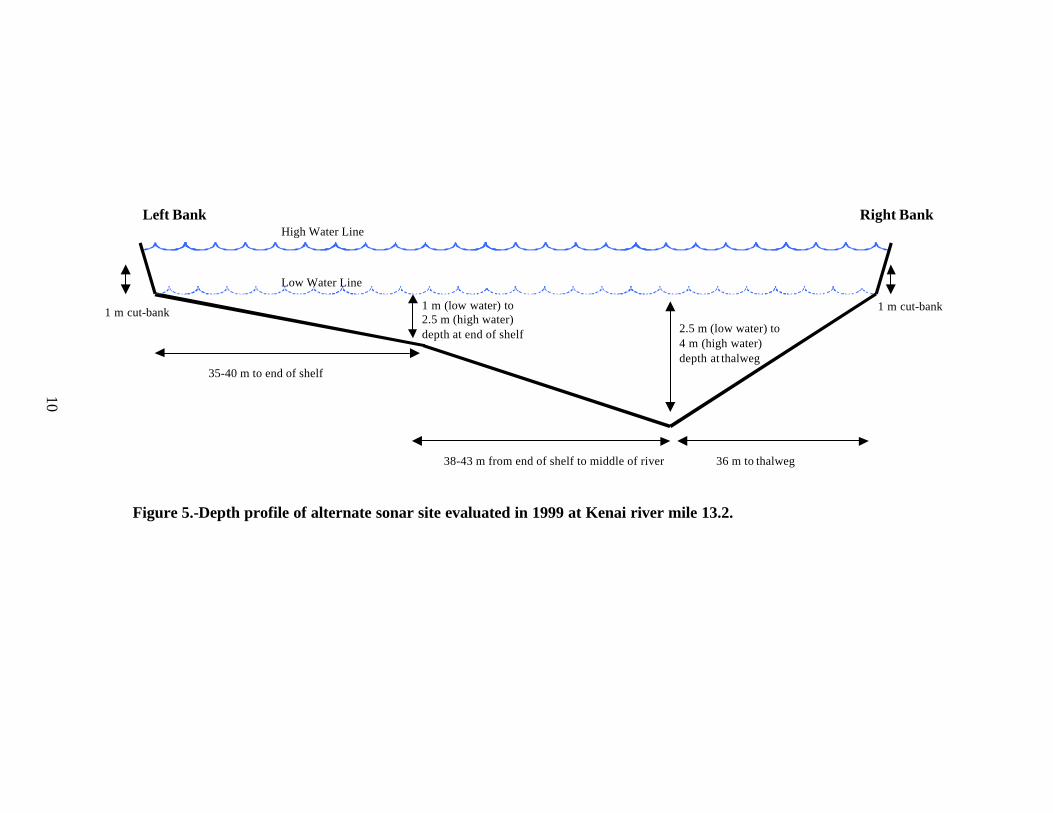
Water level observed in late May was typical of Kenai River water levels found in late springand early summer (USGS 1999). On 26 May, we set up a temporary site on the left bank for aninitial assessment of whether this site could be effectively insonified given the bottom substrateand topography. The transducer was placed 45 m from shore at the edge of the gradually-slopingshelf and at the start of the incline that continues to the middle of the river channel (Figure 6).Due to the shallow water, no effort was made to insonify the nearshore area. Fish passage waslow, and during 5 hours of data collection only 22 targets were tracked. Fish distribution in boththe horizontal (range) and vertical (depth) planes were similar to those observed at the currentsite on the right bank (Bosch and Burwen 1999). Fish were located primarily offshore and nearthe bottom (Figure 7). Signal-to-noise ratio (SNR) was lower than at the current site, most likelydue to reverberative noise from the faster current, rockier bottom, and increased boat traffic.Positional estimates from fish echoes were consequently more variable than typically observed atthe current site (Figure 8).
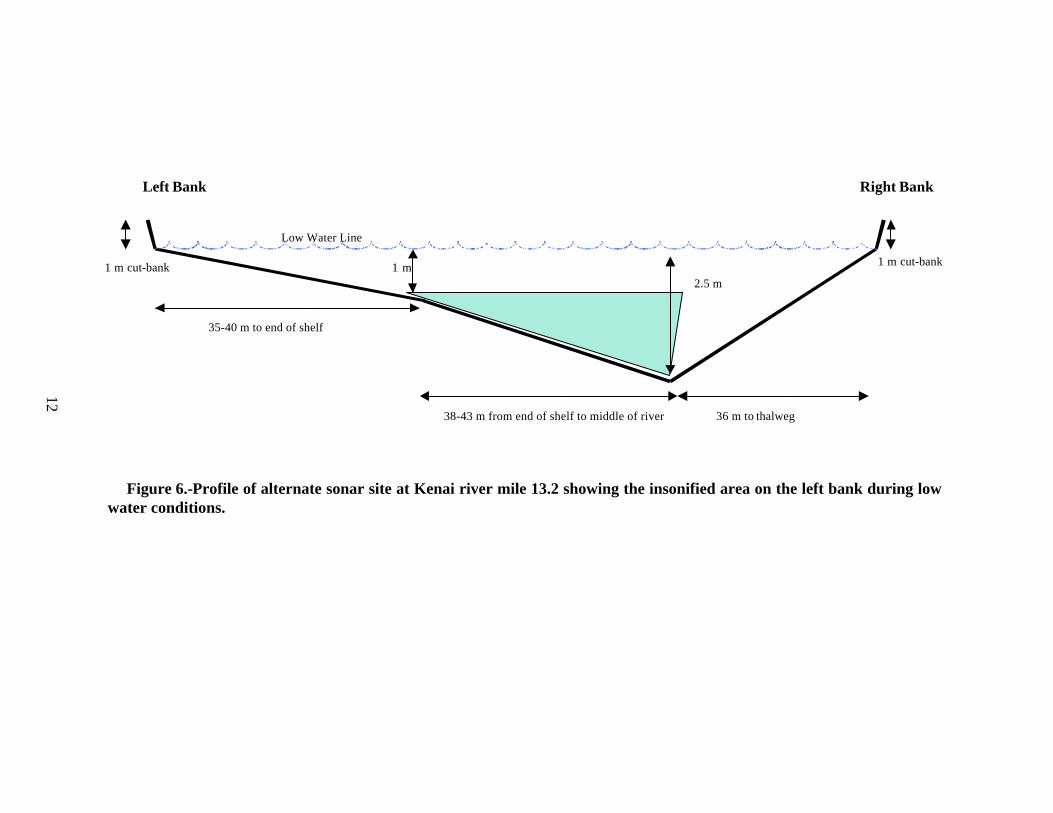
Much of the hydroacoustic sampling effort was focused on the left bank during late July, aperiod of peak passage for chinook and sockeye salmon runs. It was during this period and onthis bank that we anticipated having the most problems with high boat traffic, spawning fish, andoffshore transducer deployment. Water levels were approximately 1.5 m to 2 m higher in lateJuly. Increased water velocities made it impossible to deploy an offshore transducer.Consequently, only the nearshore area (from 1 m to 35 m) could be insonified from 20-22 July(Figure 9). A total of 526 targets was tracked during this time period. Interference from boatwake was so severe during the day that most of these targets were tracked during hours whenboat travel was minimal (e.g., 2200–2400 hours and 0000-00600 hours). Fish were again
1 m cut-bank
35-40 m to end of shelf
38-43 m from end of shelf to middle of river 36 m to thalweg
1 m (low water) to2.5 m (high water)depth at end of shelf
1 m cut-bank2.5 m (low water) to4 m (high water)depth at thalweg
High Water Line
Low Water Line
Right BankLeft Bank
Figure 5.-Depth profile of alternate sonar site evaluated in 1999 at Kenai river mile 13.2.
10
11
Table 1.-Hours and dates of acoustic data collection at the Kenai Riveralternate sonar site at river mile 13.2.
Date Bank Hours of data collection Targeted species
26 May Left - offshore 0700 - 1200 chinook
20 July Left - nearshore 0430-1600 chinook
21 Julya Left - nearshore 0400-08590900-21592200-2359
chinooksockeyechinook
22 July Left - nearshore 0000-0900 chinook
3 August Right 1600-2359 chinook
4 August Right 0000-1800 chinook
a On 21 July, the aim was optimized to insonify nearshore sockeye salmon forcertain periods during the day, when boat wake was so severe, that it wasimpractical to insonify long-range targets.
located primarily offshore and near the bottom (Figure 10). Tracking of fish was extremelydifficult due to reduced SNR and the presence of spawning fish (Figure 11).
Right BankThe right bank was sampled in early August under water level conditions similar to thoseencountered in late July on the left bank. The right bank bottom profile allowed the entire bankto be adequately insonified with one nearshore transducer (Figure 12). Finding a suitable site onthe right bank was difficult because of irregular bottom topography.
Fish were located further offshore and closer to the bottom than on the left bank (Figure 13),most likely because of the faster current and deeper water.
The right bank was generally less impacted by boat wake and spawning fish, and overall SNRappeared higher, which resulted in “cleaner” fish traces which were easier to track (Figure 14).
NET SAMPLING
Both sonar sites were sampled on all days that sampling occurred (Appendix B1). Nearly thesame number of sets was made daily at each site except during the August neap-tide period. Ingeneral, fewer sets were made during the first 2 days than during the second 2 days of each neaptide period. This likely occurred because morning tides were sampled during the first 2 days andthere was less time available to sample morning tides as previously mentioned. The number ofsets made was not recorded on 20 June, the first day of the study. Sampling was cancelled on7 July to reduce conflicts with a local fishing derby.
There was no significant difference (χ2 = 0.03, df = 1, P = 0.86) in the catch of sockeye andchinook salmon between nearshore and mid-channel sets at the alternate sonar site. Thereforewe combined all of the netting data from the alternate site for comparison with the current site.A nearly equal number of chinook salmon were captured in nearshore and mid-channel setsduring the late July and August neap tide periods (Table 2). Over three times the number of
1 m cut-bank
35-40 m to end of shelf
38-43 m from end of shelf to middle of river 36 m to thalweg
1 m1 m cut-bank2.5 m
Low Water Line
Right BankLeft Bank
Figure 6.-Profile of alternate sonar site at Kenai river mile 13.2 showing the insonified area on the left bank during lowwater conditions.
12
13
0 1 2 3 4 5 6 7 8
2
1.5
1
0 .5
0
-0.5
-1
-1.5
-2
Deg
rees
off
ver
tica
l a
xis
Frequency
0
0.5
1
1.5
2
2.5
3
3.5
0 3 6 9 12 15 18 21 24 27 30 33 36 39 42 45
Dis tance f rom Transducer (m)
Fre
qu
ency
Figure 7.-Vertical (top) and horizontal (bottom) distribution of targets on the leftbank at river mile 13.2 on 16 May 1999. The horizontal distribution covers thedistance from the transducer placed approximately 40 m from shore to mid channel.
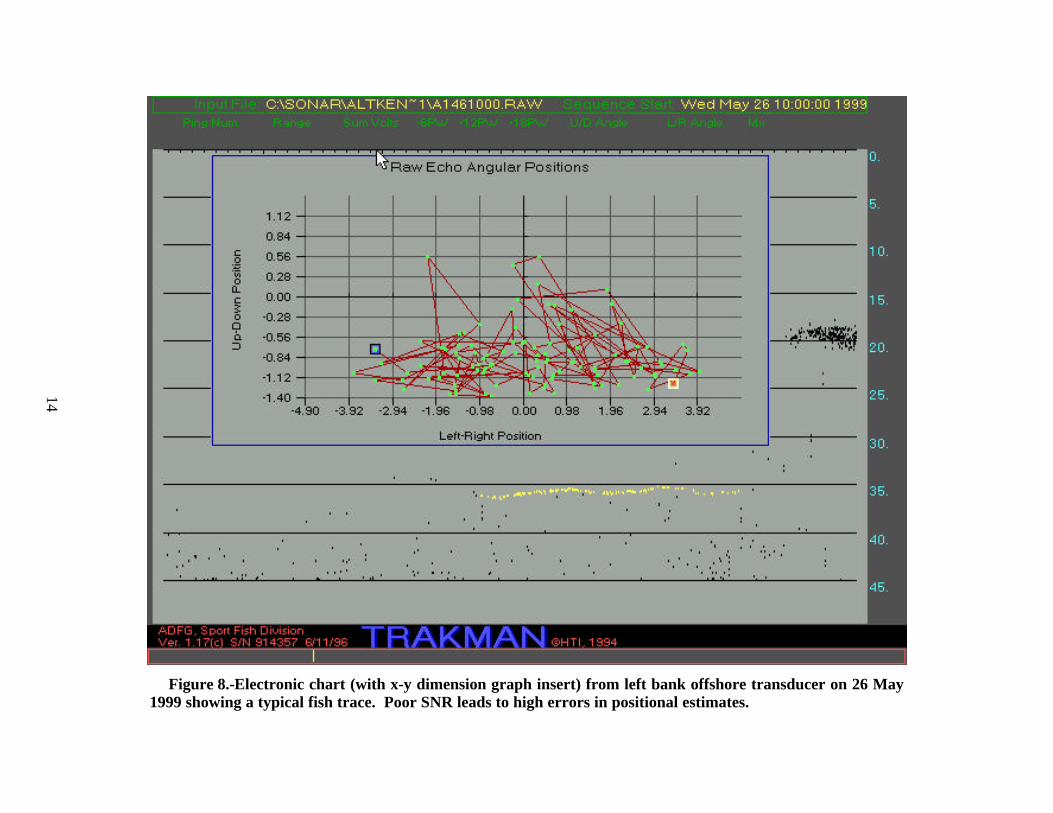
Figure 8.-Electronic chart (with x-y dimension graph insert) from left bank offshore transducer on 26 May1999 showing a typical fish trace. Poor SNR leads to high errors in positional estimates.
14
1 m cut-bank
35-40 m to end of shelf
38-43 m from end of shelf to middle of river 36 m to thalweg
1 m cut-bank
Right BankLeft Bank
4 m
Figure 9.-Profile of alternate sonar site at Kenai river mile 13.2 showing the insonified area on the left bank duringhigh water conditions.
15
16
0 20 40 60 80 100 120 140
2
1.5
1
0.5
0
-0.5
-1
-1.5
-2
Deg
rees
off
ver
tica
l ax
isFrequency
0
5
10
15
20
25
30
35
40
45
50
0 3 6 9 12 15 18 21 24 27 30 33 36 39
Distance from Transducer (m)
Fre
quen
cy
Figure 10.-Vertical (top) and horizontal (bottom) distribution of targets onthe left bank at river mile 13.2 from 20-22 July 1999. The horizontaldistribution covers the distance from the transducer placed approximately 1 mfrom shore to the end of the shelf approximately 40 m from shore.
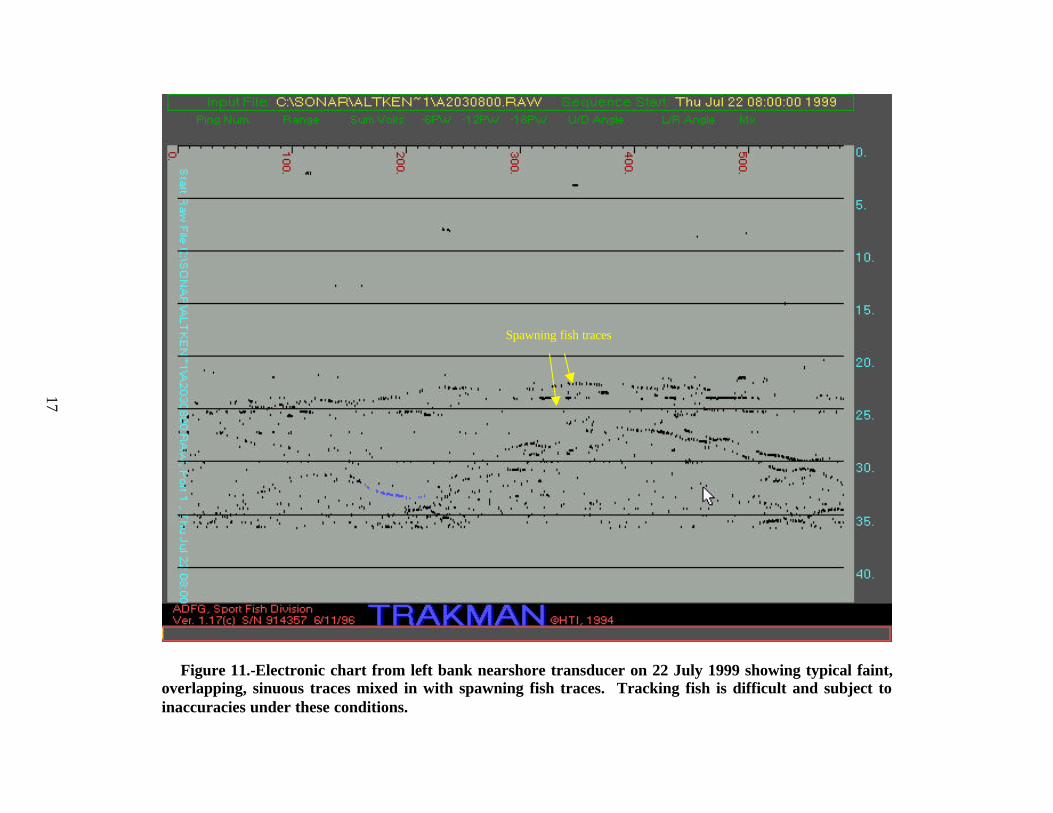
Spawning fish traces
Figure 11.-Electronic chart from left bank nearshore transducer on 22 July 1999 showing typical faint,overlapping, sinuous traces mixed in with spawning fish traces. Tracking fish is difficult and subject toinaccuracies under these conditions.
17
1 m cut-bank
35-40 m to end of shelf
38-43 m from end of shelf to middle of river 36 m to thalweg
1 m cut-bank4 m
Right BankLeft Bank
Figure 12.-Profile of alternate sonar site at Kenai river mile 13.2 showing the insonified area on the right bank duringhigh water conditions.
18

19
0 5 10 15 20 25 30 35 40
2
1.5
1
0.5
0
-0.5
-1
-1.5
-2
Deg
rees
off
ver
tica
l ax
isFrequency
0
5
10
15
20
25
30
35
40
0 2 4 6 8 10 12 14 16 18 20 22 24 26
Distance from Transducer (m)
Fre
quen
cy
Figure 13.-Vertical (top) and horizontal (bottom) distribution of targets onthe right bank at river mile 13.2 from 3-4 August 1999.
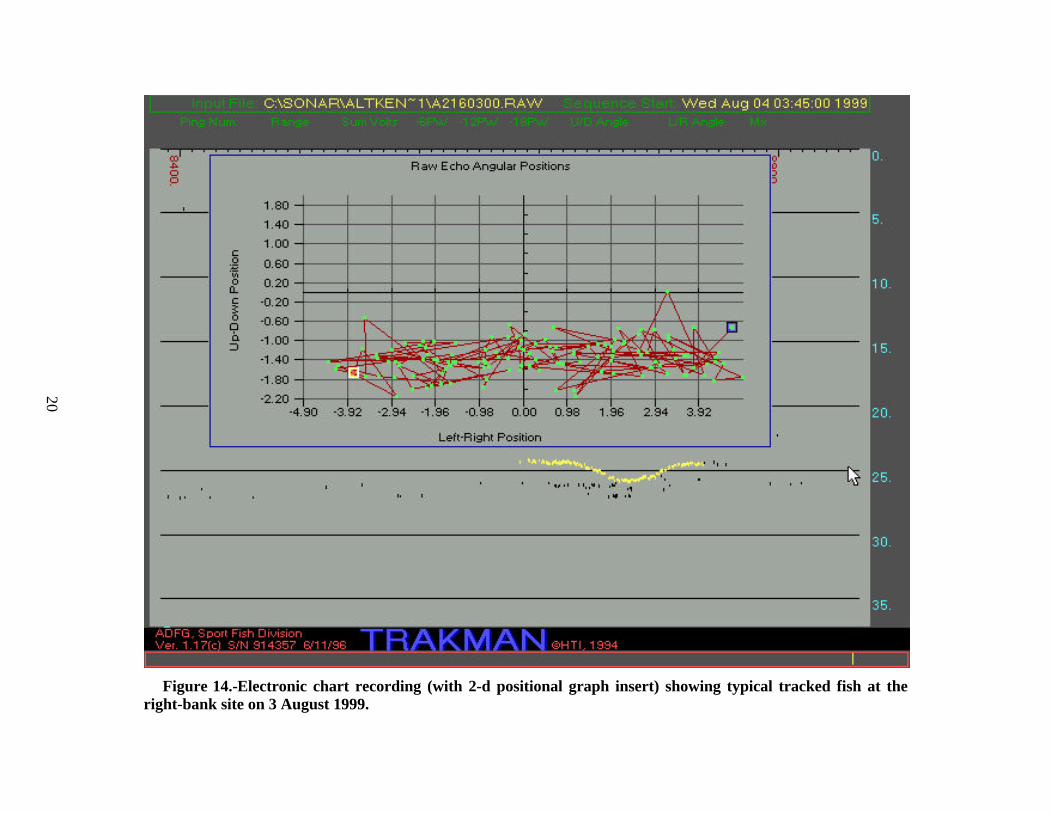
Figure 14.-Electronic chart recording (with 2-d positional graph insert) showing typical tracked fish at theright-bank site on 3 August 1999.
20
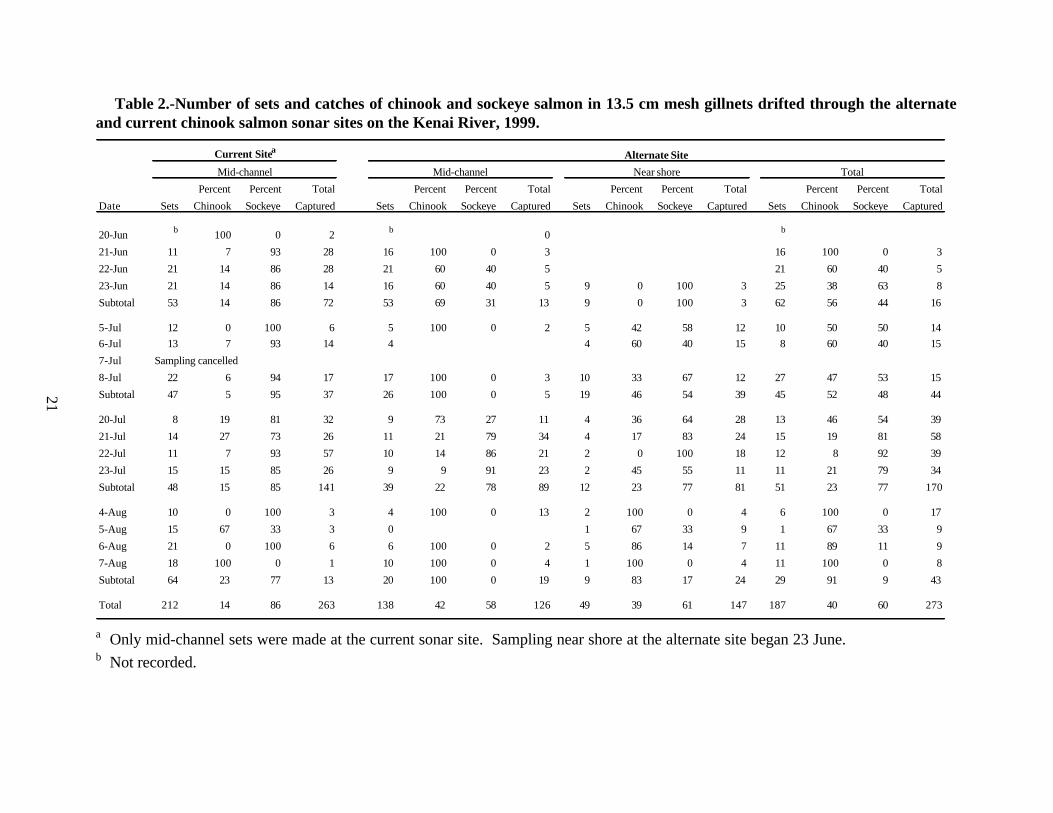
Table 2.-Number of sets and catches of chinook and sockeye salmon in 13.5 cm mesh gillnets drifted through the alternateand current chinook salmon sonar sites on the Kenai River, 1999.
Current Sitea Alternate Site
Mid-channel Mid-channel Near shore Total
Percent Percent Total Percent Percent Total Percent Percent Total Percent Percent Total
Date Sets Chinook Sockeye Captured Sets Chinook Sockeye Captured Sets Chinook Sockeye Captured Sets Chinook Sockeye Captured
20-Jun b 100 0 2 b 0 b
21-Jun 11 7 93 28 16 100 0 3 16 100 0 3
22-Jun 21 14 86 28 21 60 40 5 21 60 40 5
23-Jun 21 14 86 14 16 60 40 5 9 0 100 3 25 38 63 8
Subtotal 53 14 86 72 53 69 31 13 9 0 100 3 62 56 44 16
5-Jul 12 0 100 6 5 100 0 2 5 42 58 12 10 50 50 14
6-Jul 13 7 93 14 4 4 60 40 15 8 60 40 15
7-Jul Sampling cancelled
8-Jul 22 6 94 17 17 100 0 3 10 33 67 12 27 47 53 15
Subtotal 47 5 95 37 26 100 0 5 19 46 54 39 45 52 48 44
20-Jul 8 19 81 32 9 73 27 11 4 36 64 28 13 46 54 39
21-Jul 14 27 73 26 11 21 79 34 4 17 83 24 15 19 81 58
22-Jul 11 7 93 57 10 14 86 21 2 0 100 18 12 8 92 39
23-Jul 15 15 85 26 9 9 91 23 2 45 55 11 11 21 79 34
Subtotal 48 15 85 141 39 22 78 89 12 23 77 81 51 23 77 170
4-Aug 10 0 100 3 4 100 0 13 2 100 0 4 6 100 0 17
5-Aug 15 67 33 3 0 1 67 33 9 1 67 33 9
6-Aug 21 0 100 6 6 100 0 2 5 86 14 7 11 89 11 9
7-Aug 18 100 0 1 10 100 0 4 1 100 0 4 11 100 0 8
Subtotal 64 23 77 13 20 100 0 19 9 83 17 24 29 91 9 43
Total 212 14 86 263 138 42 58 126 49 39 61 147 187 40 60 273
a Only mid-channel sets were made at the current sonar site. Sampling near shore at the alternate site began 23 June.b Not recorded.
21
22
chinook salmon was captured in nearshore sets than in mid-channel sets during early July.Sockeye salmon were captured in nearshore sets during all sample periods but were caught inmid-channel sets only in late June and late July.
Nearly the same number of fish was caught in total at each site (263 fish at the current site and273 fish at the alternate site); however, sockeye salmon comprised 86% of the catch at thecurrent sonar site and 60% of the catch at the alternate site (Table 2). The ratio of sockeyesalmon to chinook salmon caught at the alternate site (1.5) was significantly (P < 0.01) less thanthis ratio (6.3) at the current site.
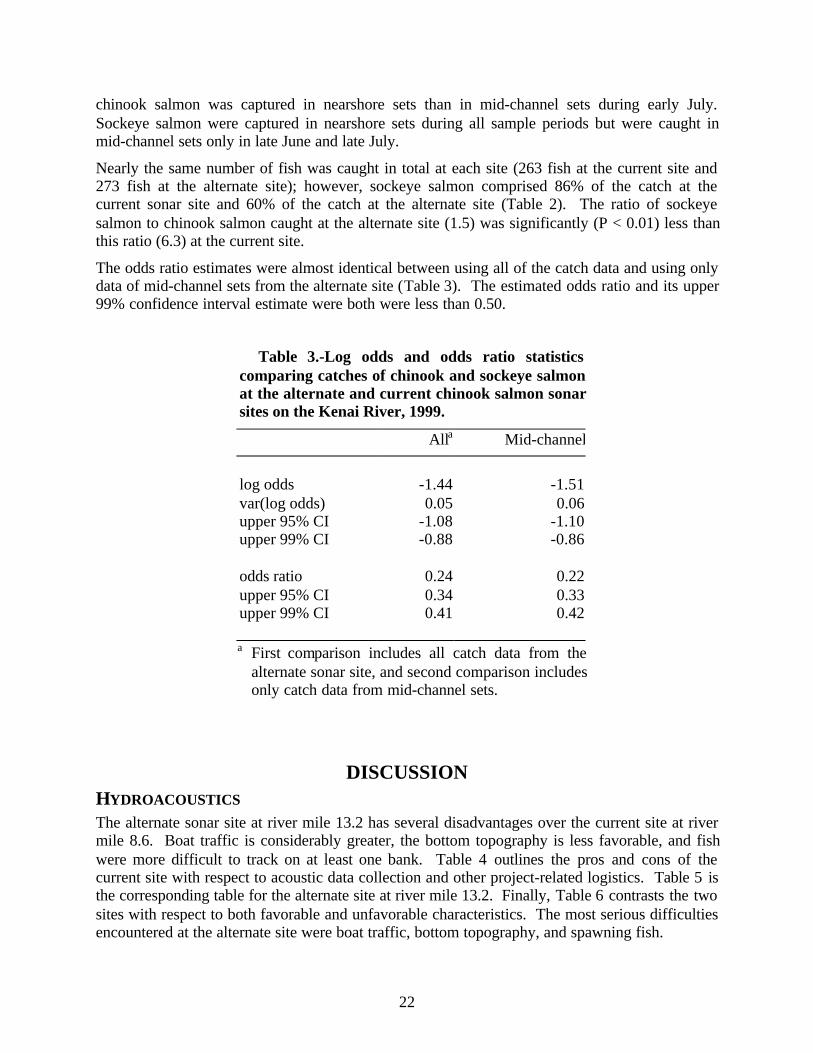
The odds ratio estimates were almost identical between using all of the catch data and using onlydata of mid-channel sets from the alternate site (Table 3). The estimated odds ratio and its upper99% confidence interval estimate were both were less than 0.50.
Table 3.-Log odds and odds ratio statisticscomparing catches of chinook and sockeye salmonat the alternate and current chinook salmon sonarsites on the Kenai River, 1999.
Alla Mid-channel
log odds -1.44 -1.51var(log odds) 0.05 0.06upper 95% CI -1.08 -1.10upper 99% CI -0.88 -0.86
odds ratio 0.24 0.22upper 95% CI 0.34 0.33upper 99% CI 0.41 0.42
a First comparison includes all catch data from thealternate sonar site, and second comparison includesonly catch data from mid-channel sets.
DISCUSSIONHYDROACOUSTICS
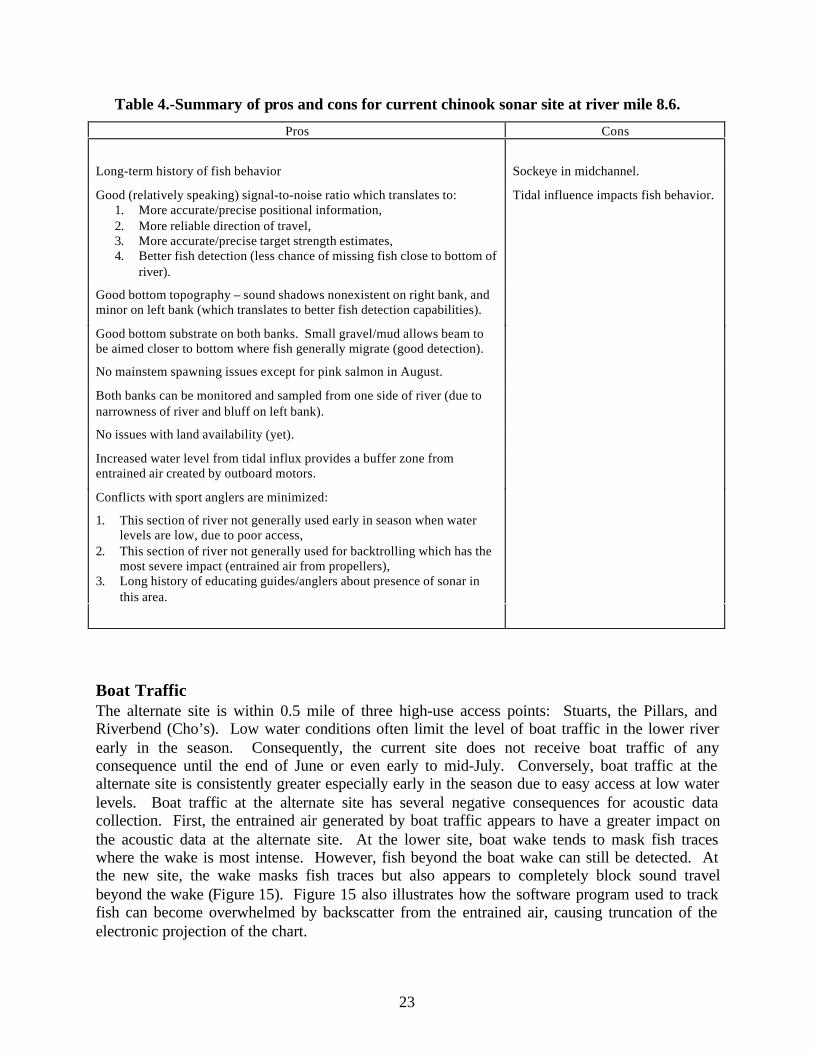
The alternate sonar site at river mile 13.2 has several disadvantages over the current site at rivermile 8.6. Boat traffic is considerably greater, the bottom topography is less favorable, and fishwere more difficult to track on at least one bank. Table 4 outlines the pros and cons of thecurrent site with respect to acoustic data collection and other project-related logistics. Table 5 isthe corresponding table for the alternate site at river mile 13.2. Finally, Table 6 contrasts the twosites with respect to both favorable and unfavorable characteristics. The most serious difficultiesencountered at the alternate site were boat traffic, bottom topography, and spawning fish.
23
Table 4.-Summary of pros and cons for current chinook sonar site at river mile 8.6.
Pros Cons
Long-term history of fish behavior Sockeye in midchannel.
Good (relatively speaking) signal-to-noise ratio which translates to:1. More accurate/precise positional information,2. More reliable direction of travel,3. More accurate/precise target strength estimates,4. Better fish detection (less chance of missing fish close to bottom of
river).
Tidal influence impacts fish behavior.
Good bottom topography – sound shadows nonexistent on right bank, andminor on left bank (which translates to better fish detection capabilities).
Good bottom substrate on both banks. Small gravel/mud allows beam tobe aimed closer to bottom where fish generally migrate (good detection).
No mainstem spawning issues except for pink salmon in August.
Both banks can be monitored and sampled from one side of river (due tonarrowness of river and bluff on left bank).
No issues with land availability (yet).
Increased water level from tidal influx provides a buffer zone fromentrained air created by outboard motors.
Conflicts with sport anglers are minimized:
1. This section of river not generally used early in season when waterlevels are low, due to poor access,
2. This section of river not generally used for backtrolling which has themost severe impact (entrained air from propellers),
3. Long history of educating guides/anglers about presence of sonar inthis area.
Boat TrafficThe alternate site is within 0.5 mile of three high-use access points: Stuarts, the Pillars, andRiverbend (Cho’s). Low water conditions often limit the level of boat traffic in the lower riverearly in the season. Consequently, the current site does not receive boat traffic of anyconsequence until the end of June or even early to mid-July. Conversely, boat traffic at thealternate site is consistently greater especially early in the season due to easy access at low waterlevels. Boat traffic at the alternate site has several negative consequences for acoustic datacollection. First, the entrained air generated by boat traffic appears to have a greater impact onthe acoustic data at the alternate site. At the lower site, boat wake tends to mask fish traceswhere the wake is most intense. However, fish beyond the boat wake can still be detected. Atthe new site, the wake masks fish traces but also appears to completely block sound travelbeyond the wake (Figure 15). Figure 15 also illustrates how the software program used to trackfish can become overwhelmed by backscatter from the entrained air, causing truncation of theelectronic projection of the chart.
24
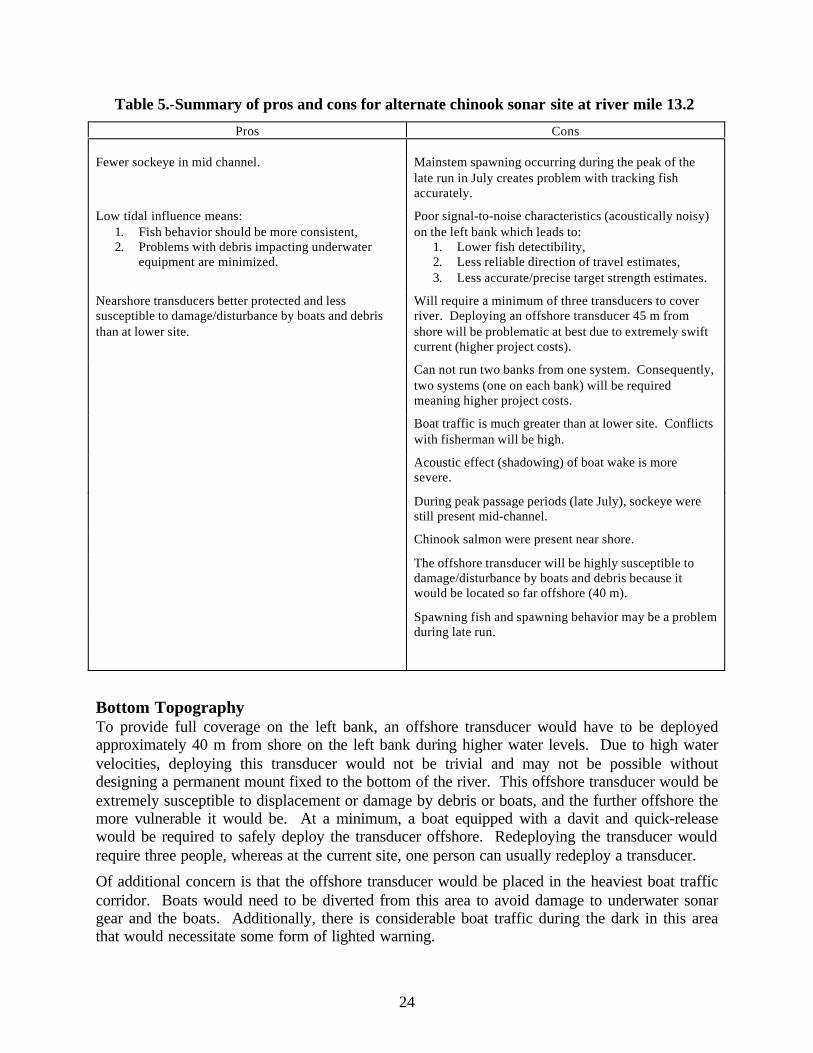
Table 5.-Summary of pros and cons for alternate chinook sonar site at river mile 13.2
Pros Cons
Fewer sockeye in mid channel. Mainstem spawning occurring during the peak of thelate run in July creates problem with tracking fishaccurately.
Low tidal influence means:1. Fish behavior should be more consistent,2. Problems with debris impacting underwater
equipment are minimized.
Poor signal-to-noise characteristics (acoustically noisy)on the left bank which leads to:
1. Lower fish detectibility,2. Less reliable direction of travel estimates,3. Less accurate/precise target strength estimates.
Nearshore transducers better protected and lesssusceptible to damage/disturbance by boats and debristhan at lower site.
Will require a minimum of three transducers to coverriver. Deploying an offshore transducer 45 m fromshore will be problematic at best due to extremely swiftcurrent (higher project costs).
Can not run two banks from one system. Consequently,two systems (one on each bank) will be requiredmeaning higher project costs.
Boat traffic is much greater than at lower site. Conflictswith fisherman will be high.
Acoustic effect (shadowing) of boat wake is moresevere.
During peak passage periods (late July), sockeye werestill present mid-channel.
Chinook salmon were present near shore.
The offshore transducer will be highly susceptible todamage/disturbance by boats and debris because itwould be located so far offshore (40 m).
Spawning fish and spawning behavior may be a problemduring late run.
Bottom TopographyTo provide full coverage on the left bank, an offshore transducer would have to be deployedapproximately 40 m from shore on the left bank during higher water levels. Due to high watervelocities, deploying this transducer would not be trivial and may not be possible withoutdesigning a permanent mount fixed to the bottom of the river. This offshore transducer would beextremely susceptible to displacement or damage by debris or boats, and the further offshore themore vulnerable it would be. At a minimum, a boat equipped with a davit and quick-releasewould be required to safely deploy the transducer offshore. Redeploying the transducer wouldrequire three people, whereas at the current site, one person can usually redeploy a transducer.
Of additional concern is that the offshore transducer would be placed in the heaviest boat trafficcorridor. Boats would need to be diverted from this area to avoid damage to underwater sonargear and the boats. Additionally, there is considerable boat traffic during the dark in this areathat would necessitate some form of lighted warning.
25
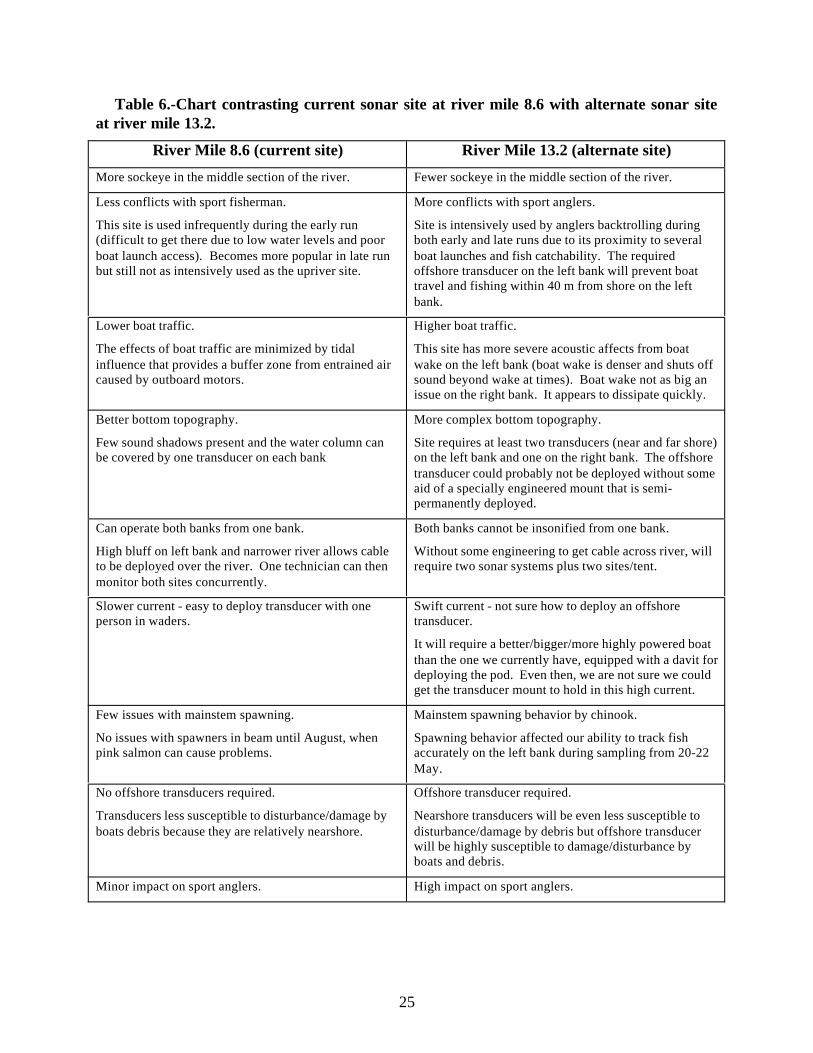
Table 6.-Chart contrasting current sonar site at river mile 8.6 with alternate sonar siteat river mile 13.2.
River Mile 8.6 (current site) River Mile 13.2 (alternate site)
More sockeye in the middle section of the river. Fewer sockeye in the middle section of the river.
Less conflicts with sport fisherman.
This site is used infrequently during the early run(difficult to get there due to low water levels and poorboat launch access). Becomes more popular in late runbut still not as intensively used as the upriver site.
More conflicts with sport anglers.
Site is intensively used by anglers backtrolling duringboth early and late runs due to its proximity to severalboat launches and fish catchability. The requiredoffshore transducer on the left bank will prevent boattravel and fishing within 40 m from shore on the leftbank.
Lower boat traffic.
The effects of boat traffic are minimized by tidalinfluence that provides a buffer zone from entrained aircaused by outboard motors.
Higher boat traffic.
This site has more severe acoustic affects from boatwake on the left bank (boat wake is denser and shuts offsound beyond wake at times). Boat wake not as big anissue on the right bank. It appears to dissipate quickly.
Better bottom topography.
Few sound shadows present and the water column canbe covered by one transducer on each bank
More complex bottom topography.
Site requires at least two transducers (near and far shore)on the left bank and one on the right bank. The offshoretransducer could probably not be deployed without someaid of a specially engineered mount that is semi-permanently deployed.
Can operate both banks from one bank.
High bluff on left bank and narrower river allows cableto be deployed over the river. One technician can thenmonitor both sites concurrently.
Both banks cannot be insonified from one bank.
Without some engineering to get cable across river, willrequire two sonar systems plus two sites/tent.
Slower current - easy to deploy transducer with oneperson in waders.
Swift current - not sure how to deploy an offshoretransducer.
It will require a better/bigger/more highly powered boatthan the one we currently have, equipped with a davit fordeploying the pod. Even then, we are not sure we couldget the transducer mount to hold in this high current.
Few issues with mainstem spawning.
No issues with spawners in beam until August, whenpink salmon can cause problems.
Mainstem spawning behavior by chinook.
Spawning behavior affected our ability to track fishaccurately on the left bank during sampling from 20-22May.
No offshore transducers required.
Transducers less susceptible to disturbance/damage byboats debris because they are relatively nearshore.
Offshore transducer required.
Nearshore transducers will be even less susceptible todisturbance/damage by debris but offshore transducerwill be highly susceptible to damage/disturbance byboats and debris.
Minor impact on sport anglers. High impact on sport anglers.

Nearshore boat wake causes completeblockage of sound at further ranges
Partial screen loss - current tracking program can’t displaymore than 1400 echoes in one screen
Figure 15.-Electronic chart from left bank nearshore transducer on 21 July 1999 showing how entrained airfrom a boat propeller blocks most of the acoustic signal beyond 25 m.
26
27
Less importantly, monitoring three transducers rather than two as at the current site would add anew level of complication to both data collection and analysis.
Spawning FishAcoustic sampling on the left bank was complicated by the presence of spawning fish from 20-22 July, a period of peak sockeye and chinook passage (Figure 16). Fish spawning in the beammay look like a rock, or some other structure which can cause problems in aiming the transducer.Spawning behavior can also make tracking difficult if not impossible. It is not known to whatextent spawning fish would be a problem since we could not deploy an offshore transducer andsampling was limited in duration.
Other IssuesThere are several other issues that would have to be resolved at the alternate site. First, thealternate site is located in an area of high angler use and passage. To protect sonar gear, much ofthis area would be lost to anglers. Second, lures tend to emulate fish. There is almost acontinuous stream of backtrollers at the alternate site during all daylight hours and beyond.Tackle, such as jet planers and quickfish, used by many backtrollers tends to emulate fish tracesin the acoustic data, causing some confusion when trying to track fish (Figure 17). This has notbeen an issue at the current site as it is primarily a drift fishery area and tackle associated withdrift fishing does not present targets that create fish-like traces. The last issue is that projectcosts at the alternate site would increase due to the necessity of two sonar systems. A sonarsystem would be required on each bank, as opposed to one which is used now. In addition to asecond sonar unit, a second system would entail two generators; increased maintenance; andcrew size would either increase, or one technician would have to frequently move from bank tobank to maintain and monitor equipment.
NETTING
The netting data indicate the alternate sonar site has fewer sockeye salmon migratingmid-channel than does the current site. However, segregation of species is far from ideal at rivermile 13.2. First, when sockeye salmon are relatively abundant (mid to late July), they migratemid-channel at this site. Even though the distribution of sockeye salmon mid-channel is lesssevere at this site than at the current site, the problem is not eliminated. The daily inriver returnof sockeye salmon estimated at the river mile 19 sockeye salmon sonar site averaged nearly34,150 fish during 20-23 July. Second, a fairly large proportion of chinook salmon appear tomigrate near shore at this site throughout the entire return.
CONCLUSIONS
In summary, the evidence indicates that moving to the alternate site evaluated in 1999 would notsufficiently resolve the main concerns regarding species discrimination at the current sonar sitefor Kenai River chinook salmon. The netting data suggest that a sonar project at river mile 13.2would probably not result in substantially better estimates of chinook salmon abundance. Thenew site also presents a suite of new problems and issues that may prove insurmountable. Datafrom acoustic sampling indicate that the river mile 13.2 site would at best be a complicated siteto insonify and would require several years of research to address the issues discussed above.Furthermore, after investing several years in research and development, we may discover that wecannot adequately insonify the area, keep an offshore transducer operational, and successfullydivert boat traffic such that the sonar is not severely impacted by boat wake. Although therewere fewer sockeye salmon in the offshore area at the alternate site, there were still relatively
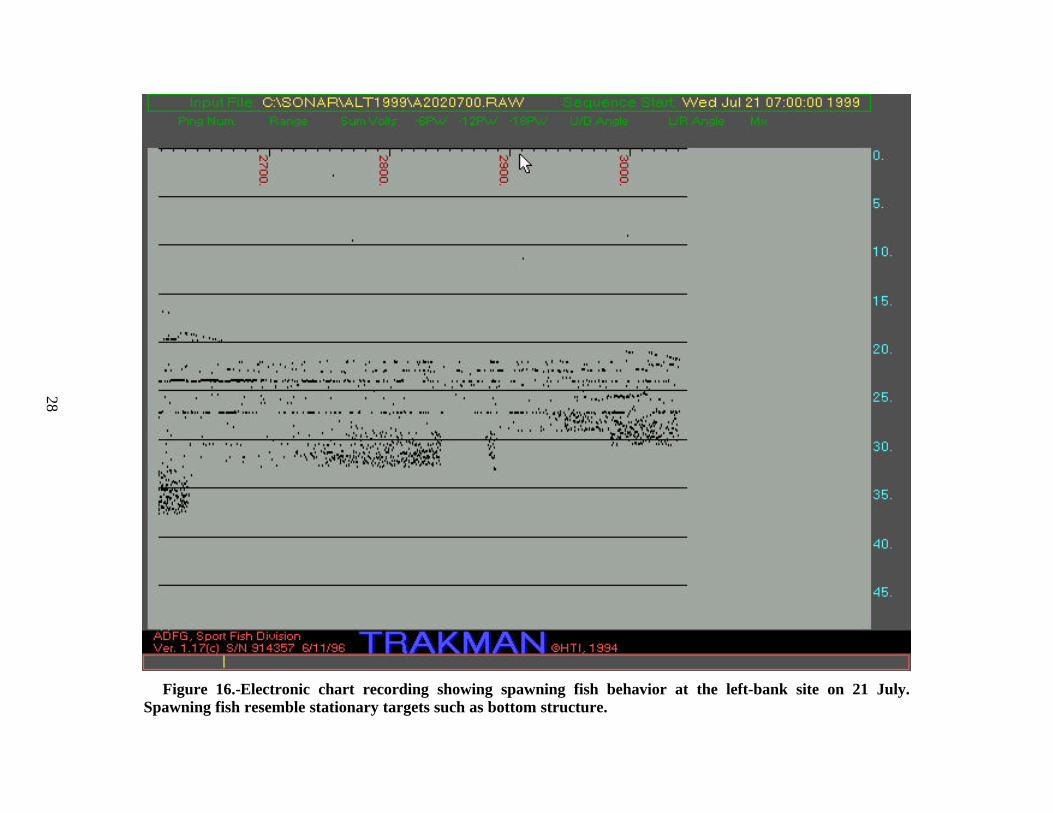
Figure 16.-Electronic chart recording showing spawning fish behavior at the left-bank site on 21 July.Spawning fish resemble stationary targets such as bottom structure.
28
Jet planers used by backtrollers emulatefish traces
Figure 17.-Electronic chart recording from left bank nearshore transducer on 22 July 1999 showing howtwo lures or jet planes from a backtroller may emulate fish traces.
29
30
large numbers of sockeye salmon present in the offshore area during peak migration periods.Additionally, there were high numbers of chinook salmon caught in the nearshore area.
RECOMMENDATIONSWe do not recommend moving the current chinook salmon sonar site at this time. Althoughmoving above tidal influence may improve spatial segregation of species, we do not currentlyhave methods to contend with the high levels of entrained air generated by outboard motors. Theeffect of high boat traffic remains the biggest obstacle to moving the current sonar site upriver.Echoes from entrained air mask fish targets and overload our data processing software.
It may be feasible to investigate using a site further upriver to estimate early-run chinook salmonwhere the potential for missing a large proportion of late-run mainstem spawners in the lowerriver is not an issue. If we move far enough upriver where boat traffic is less intense (e.g., thesockeye salmon sonar counter at river mile 19) then it may be possible to find a site that offersbetter spatial separation without increased boat traffic. We would like to work with theCommercial Fisheries Division in evaluating whether the sockeye salmon sonar site at river mile19 is suitable for detecting and counting early-run chinook salmon.
With respect to late-run chinook salmon estimates, we believe our efforts are better spent in twoareas. First, efforts are in progress to develop a method to model chinook salmon abundanceestimates from our standardized netting program that is conducted immediately downstream ofthe sonar site. Changes in both the location and methodology of the chinook salmon nettingprogram were made starting in 1998 with the hopes that more standardized netting catch per uniteffort (CPUE) data would be able to provide some level of ground truthing for the acousticestimates. We also wanted to determine whether there is some basis for estimating chinooksalmon abundance from the CPUE data during periods of high sockeye salmon abundance whenwe know that accuracy of the sonar estimates are most questionable. If the CPUE estimates canbe calibrated to sonar estimates during periods of low sockeye salmon abundance, then perhaps aCPUE model will provide better estimates of chinook salmon abundance during periods of highsockeye salmon abundance. A preliminary evaluation on the feasibility of using net CPUE tomodel chinook salmon estimates should be completed in 2001.
Second, we should continue to pursue improved techniques for separating chinook and sockeyesalmon using acoustic information. Research efforts into several different aspects of acousticspecies discrimination remain in progress. Results of a tethered fish study indicated that pulsewidth may provide higher discriminatory power than target strength for separating sockeye andchinook salmon (Burwen and Fleischman 1998). The feasibility of using pulse width as anadditional species discriminator at the Kenai River site is still being investigated. We are alsomaking significant progress in our ability to correct for threshold and noise-related bias in targetstrength estimates (Fleischman and Burwen 2001) which will improve the utility of targetstrength for classifying acoustic targets. Additional experiments with multifrequency sonar in1998 showed that information from multiple frequencies substantially improved our model forpredicting fish length (Burwen and Fleischman In prep). Continued research using multiplefrequency sonar is being pursued through a proposal to the Alaska Sea Grant College Program incooperation with the University of Alaska and the University of Washington.
Finally, the department is involved in a joint project with the Department of Fisheries andOceans, Canada to develop new target-tracking and data-editing software. This new approach to

31
target tracking may offer some hope for tracking fish through dense boat wake and managing thelarge files that result from the increased data load. Though significant progress has already beenmade, completion of this software is not anticipated until 2002. If the tracking software is ableto track fish through boat wake, we may want to revisit the idea of moving the sonar site to analternate location.
LITERATURE CITEDAgresti, A. 1990. Categorical data analysis. Wiley and Sons, Inc. New York.
Bendock, T. and M. Alexandersdottir. 1992. Mortality and movement behavior of hook-and-release chinook salmon inthe Kenai River. Alaska Department of Fish and Game, Fishery Manuscript No. 92-2. Anchorage.
Burger, C. V., R. L. Wilmont, and D. B. Wangaard. 1985. Comparison of spawning areas and times for two runs ofchinook salmon (Oncorhynchus tshawytscha) in the Kenai River, Alaska. Canadian Journal of Fisheries andAquatic Sciences 42:693-700.
Bosch, D. and D. L. Burwen. 1999. Estimates of chinook salmon abundance in the Kenai River using split-beamsonar, 1997. Alaska Department of Fish and Game, Fishery Data Series No. 99-3, Anchorage.
Burwen, D., D. Bosch, and S. J. Fleischman. 1998. Evaluation of hydroacoustic assessment techniques for chinooksalmon on the Kenai River, 1995. Alaska Department of Fish and Game, Fishery Data Series No. 98-3,Anchorage.
Burwen, D. L. and S. J. Fleischman. 1998. Evaluation of side-aspect target strength and pulse width ashydroacoustic discriminators of fish species in rivers. Canadian Journal of Fisheries and Aquatic Sciences55:2492-2502.
Burwen, D. L. and S. J. Fleischman. In prep. Evaluation of multifrequency fm-slide sonar for estimating fish size inthe Kenai River. Alaska Department of Fish and Game, Fishery Data Series, Anchorage.
Daum, D. W., and B. M. Osborne. 1996. Enumeration of Chandalar River fall chum salmon using split-beamsonar, 1995. U.S. Fish and Wildlife Service, Fishery Resource Office, Alaska Fisheries Progress Report 96-2,Fairbanks, Alaska.
Eggers, D. M., P. A. Skvorc, and D. L. Burwen. 1995. Abundance estimates of chinook salmon in the Kenai Riverusing dual-beam sonar. Alaska Department of Fish and Game, Alaska Fishery Research Bulletin 2(1):1-22.Juneau.
Enzenhofer, H. J. and G. Cronkite. 2000. Fixed location hydroacoustic estimation of fish migration in the riverineenvironment: An operational manual. Canadian Technical Report of Fisheries and Aquatic Sciences 2312.
Fleischman, S. J. and D. L. Burwen. 2001. Correcting for two sources of position-related bias in estimates of theacoustic backscattering cross-section. Proceedings of the Second International Shallow Water Fisheries SonarConference, Seattle, Washington, September 7-9, 1999. Aquatic Living Resources Volume. 13, No. 5
Hammarstrom, S. L. 1994. Stock assessment of late-run chinook salmon to the Kenai River, 1993. AlaskaDepartment of Fish and Game, Fishery Data Series No. 94-8, Anchorage.
Hammarstrom, S. L., and J. J. Hasbrouck. 1998. Abundance estimate of late-run chinook salmon to the Kenai Riverbased on exploitation rate and harvest, 1996. Alaska Department of Fish and Game, Fishery Data Series No. 98-6, Anchorage.
Hammarstrom, S. L., and J. J. Hasbrouck. 1999. Abundance estimate of late-run chinook salmon to the Kenai Riverbased on exploitation rate and harvest, 1997. Alaska Department of Fish and Game, Fishery Data Series No. 99-8, Anchorage.
Hammarstrom, S. L., and S. L. Timmons. In prep a. Stock assessment of early-run chinook salmon to the KenaiRiver 1997 and 1998. Alaska Department of Fish and Game, Fishery Data Series, Anchorage.
Hammarstrom, S. L., and S. L. Timmons. In prep b. Stock assessment of late-run chinook salmon to the KenaiRiver 1997 and 1998. Alaska Department of Fish and Game, Fishery Data Series, Anchorage.

LITERATURE CITED (Continued)
32
Nelson, D., D. Athons, P. Berkhahn, and S. Sonnichsen. 1999. Area management report for the recreationalfisheries of the Kenai Peninsula, 1995-1997. Alaska Department of Fish and Game, Fishery ManagementReport No. 99-3, Anchorage.
USGS (United States Geological Survey). 1999. Water resources data, Alaska, water year 1998. Website Soldotnagauging station. http://waterdata.usgs.gov/nwis-w/AK/data.components/hist.cgi?statnum=15266300
33
APPENDIX A.-CHARACTERISTICS OF SITESFOR SIDE-LOOKING SONAR
34
Appendix A1.-Characteristics of side-looking fisheries sonar sites.
Characteristics of a site that allow for maximum insonification of the water column are asfollows:
1. A gradual and uniform slope from both banks (no shelves) is required to insonify a largeproportion of the water column without acoustic shadowing effects (Appendix A2). Unevenbottom profiles with multiple slopes can be compensated for to a limited extent by use ofmultiple transducers and/or multiple aims.
2. The water level (depth) must be sufficient to allow use of a 2 degree (or greater) sonar beam.Two degrees is generally the narrowest transducer beam width that is commerciallyavailable.
The appropriate transducer beam width is a function of the slope of the river bottom, waterdepth, and maximum range covered by the sonar beam. The beam can be thought of as atriangle (with nominal beam angle θ) that grows by the formula 2*Range*tan(θ/2) (AppendixA3). For example, to insonify 30 m from the transducer, the river must be at least 1 meterdeep at 30 m to use a 2o transducer. In practice, for a given bottom slope, a transducer with anominal beam-width about 1o to 1.5o less than that slope will generally “fit” withoutexcessive noise from the bottom and surface. In this case we would actually need 1.3 m to1.5 m of water depth. A choppy surface and rocky bottom act as reflective surfaces and cangreatly influence the ability to fit a beam. Even if the beam fits, significant echoes fromreflective surfaces may effectively reduce the depth of the water column. Also, if the site hasan acoustically absorptive bottom of fine silt/sand, it may be possible to aim a portion of thebeam into the bottom allowing the use of a beam width that might otherwise be too large(Daum and Osborne 1996).
If the section of river to be insonified is very deep, the best strategy for insonifying the entirewater column may be to divide the water column into individual strata and use severalnarrow beams (or several aims with a narrow beam) rather than one very wide beam. Thenarrow beam may return less unwanted reverberative noise yielding a higher SNR in a noise-limited application (Enzenhofer and Cronkite 2000).
3. Laminar flow (no riffles) with minimal entrained air is required. Entrained air from riffles isdetected by the sonar and usually creates unacceptable levels of background noise.
4. Optimally, the bottom on both banks should be composed primarily of one of the following:
a. Fine sand, silt, or mud: This is the best substrate, providing an absorptive rather thanreflective surface. This absorptive property improves the signal-to-noise ratio when thebeam is aimed along the bottom. The right (north) bank of the current Kenai Riverchinook salmon sonar site has this substrate.
b. Fine gravel (5 cm or less): This is less advantageous for aiming the beam close to thebottom, but is still often acceptable if other reverberative noise is minimal. The left(south) bank of the current Kenai River chinook salmon sonar site has this substrate.
c. Large gravel (10 cm or less): This substrate is marginal, but may work in some instancesespecially if fish are not oriented closely to the bottom.
5. Large cobble is generally unacceptable substrate for insonifying bottom-oriented fish withoutan artificial substrate, or some site/substrate modification or enhancement.
35
6. Minimal boat travel is essential unless water depth is sufficient to provide a buffer zone forentrained air (such as the current Kenai River chinook salmon sonar site at higher tide levels)generated by boat propellers. This also assumes the fish are bottom oriented andinsonification of the upper water column is not required.
7. There are several fish behavior considerations that need to be evaluated for any potential site:
a. Milling: Because milling behavior can be difficult for any fish-tracking algorithm(depending on fish behavior while swimming through the beam), excessive milling mayintroduce too much uncertainty in estimates.
b. Spawning: Fish spawning in the acoustic beam makes fish-tracking difficult orimpossible.
c. Aspect: Ideally, fish should present a consistent aspect relative to the bank as they swimthrough the sonar beam. Maximum echo strength (and consequently detection probabil-ity) occurs when the fish travels perpendicular to the sonar beam axis (full lateral aspect).Fish that change aspect in the beam may present problems to an automatic trackingalgorithm because echoes from the fish may not be detected with extreme departuresfrom lateral aspect.
36
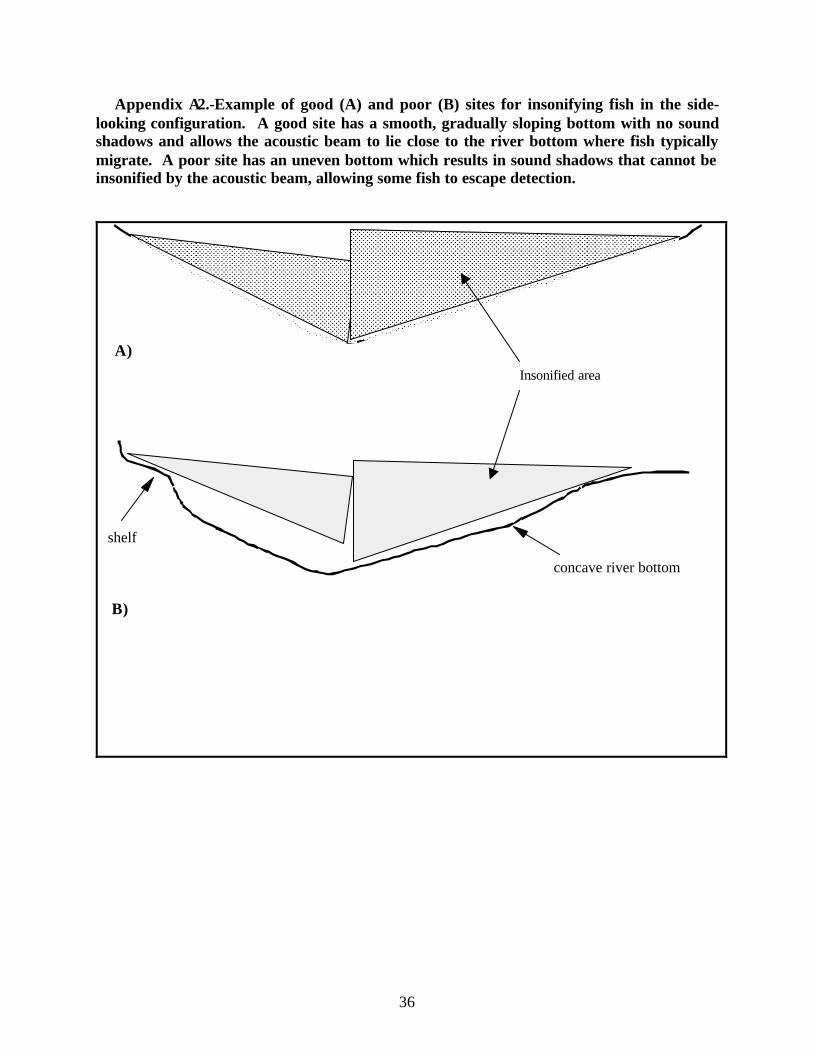
Appendix A2.-Example of good (A) and poor (B) sites for insonifying fish in the side-looking configuration. A good site has a smooth, gradually sloping bottom with no soundshadows and allows the acoustic beam to lie close to the river bottom where fish typicallymigrate. A poor site has an uneven bottom which results in sound shadows that cannot beinsonified by the acoustic beam, allowing some fish to escape detection.
A)
B)
shelf
concave river bottom
Insonified area
37
Appendix A3.-Width of a beam (in meters) calculated for a specified range from thetransducer at several nominal transducer (Tx) beam widths. For example, at 30 m, atransducer with a nominal beam width of 2o is 1.05 m wide.
Nominal Beam Width (degrees)
Distance fromTx (m) 2.0 2.5 3.0 3.5 4.0 4.5 5.0 5.5 6.0
5 0.17 0.22 0.26 0.31 0.35 0.39 0.44 0.48 0.52
10 0.35 0.44 0.52 0.61 0.70 0.79 0.87 0.96 1.05
15 0.52 0.65 0.79 0.92 1.05 1.18 1.31 1.44 1.57
20 0.70 0.87 1.05 1.22 1.40 1.57 1.75 1.92 2.10
25 0.87 1.09 1.31 1.53 1.75 1.96 2.18 2.40 2.62
30 1.05 1.31 1.57 1.83 2.10 2.36 2.62 2.88 3.14
35 1.22 1.53 1.83 2.14 2.44 2.75 3.06 3.36 3.67
40 1.40 1.75 2.09 2.44 2.79 3.14 3.49 3.84 4.19
45 1.57 1.96 2.36 2.75 3.14 3.54 3.93 4.32 4.72
50 1.75 2.18 2.62 3.06 3.49 3.93 4.37 4.80 5.24
55 1.92 2.40 2.88 3.36 3.84 4.32 4.80 5.28 5.76
60 2.09 2.62 3.14 3.67 4.19 4.71 5.24 5.76 6.29
65 2.27 2.84 3.40 3.97 4.54 5.11 5.68 6.24 6.81
70 2.44 3.05 3.67 4.28 4.89 5.50 6.11 6.72 7.34
75 2.62 3.27 3.93 4.58 5.24 5.89 6.55 7.21 7.86
80 2.79 3.49 4.19 4.89 5.59 6.29 6.99 7.69 8.39
85 2.97 3.71 4.45 5.19 5.94 6.68 7.42 8.17 8.91
90 3.14 3.93 4.71 5.50 6.29 7.07 7.86 8.65 9.43
95 3.32 4.15 4.98 5.81 6.63 7.47 8.30 9.13 9.96
100 3.49 4.36 5.24 6.11 6.98 7.86 8.73 9.61 10.48

38

39
APPENDIX B.-SAMPLING SCHEDULE FOR INRIVERNETTING
40
Appendix B1.-Sampling schedule for inriver netting at the current (rm 8.6) andalternate (rm 13.2) Kenai River chinook sonar sites, 1999.
First Sample Period Second Sample PeriodDate Crew # Site Begin End Site Begin End
20-Jun 1 Alternate 0400 0630 Current 0700 0930
21-Jun 1 Current 0400 0700 Alternate 0730 1030
22-Jun 2 Alternate 1330 1630 Current 1730 2030
23-Jun 2 Current 1500 1800 Alternate 1900 2200
5-Jul 2 Current 0330 0545 Alternate 0615 0830
6-Jul 2 Alternate 0400 0630 Current 0700 0930
7-Jul 1 Alternate 1230 1530 Current 1630 1930
8-Jul 1 Current 1400 1700 Alternate 1800 2100
20-Jul 1 Alternate 0400 0630 Current 0700 0930
21-Jul 1 Current 0400 0700 Alternate 0800 1100
22-Jul 2 Alternate 1400 1700 Current 1800 2100
23-Jul 2 Current 1530 1830 Alternate 1930 2230
4-Aug 2 Current 0400 0615 Alternate 0645 0900
5-Aug 2 Alternate 0400 0700 Current 0730 1030
6-Aug 1 Current 1330 1630 Alternate 1730 2030
7-Aug 1 Alternate 1500 1800 Current 1900 2200

41
APPENDIX C
42
Appendix C1.-Original chart recording from a Lowrance X-16 (top) showing the bottomprofile at Kenai river mile 13.2 taken on 18 May 1999 at low water conditions. The bottomchart has been edited and enhanced to reflect the shallower nearshore bench on the leftbank. The Lowrance cannot measure bottom depth within 1.5 feet of the transducer face.
3.2
4.0
4.8
5.4
0.8
1.6
2.4
6.2
Right BankLeft Bank
FeetFeet