Embed Size (px)
Citation preview
INVESTIGATION OF INTENSE PULSED DISCHARGES IN GASES BY MEANS OF
HIGH-SPEED PHOTOGRAPHY*
N. A. B o r z u n o v , D. V. O r l i n s k i l , and S. M. O s o v e t s
A qualitative description is given of the basic processes which occur in the initial stages of intense discharges: this description is based on a comparison of voltage and current oscillograms with photographs of intense pulsed discharges in deuterium and certain inert gases. The experimental data are found to be in basic agreement with the work of M. A. Leontovtch and S. M. Osovets on the "inertia" theory of plasma com- pression.
In the present paper we report the results of an investigation of intense electric discharges in gases (deuterium, neon, argon, krypton, and xenon) carried out by means of high-speed photography. The results presented here pertain to discharges with current strength of greater than 10 5 amp at gas pressures ranging from 0.01 to 1 mm Hg. The basic effects characteristic of discharges of this type have already been described
in [1-4 ].
~0kv
\
Fig. 1. Oscillogram showing the current and voltage in a deuterium discharge (P0 = 0.2 mm Hg).
In Fig. 1 is shown a typical oscilloscope pattern for discharge current and electrode voltage obtained with an initial deuterium pressure of 0.2 mm Hg. The current I (t) in the initial stage of the discharge ex- hibits several discontinuities. Each of these breaks corresponds to a sharp reduction in the voltage between
* This work was carried out in 1953.
195
the electrodes. In what follows the discontinuities in the current curve will be cal led "breaks" while the time between the in i t ia t ion of a discharge and a break will be called the "break t ime . "
In [1] i t was shown that the break t ime and the current at the Instant the break occurs are functions of the in i t ia l gas pressure and the voltage applied to the electrodes. In [4] these properties were explained In terms of the motion of the gas from the periphery to the center under the effect of the e lec t romagnet ic forces. It was shown that the basic force responsible for the compression of the gas Is the Inertia force. Visual obser- vat ion of the discharge, i .e. , photographs at various instants of t ime allows a qual i ta t ive verif icat ion of this in terpreta t ion. In addition, pictures showing the behavior of the discharge in the course of t ime are of Interest in themselves.
The discharge was produced in a glass cyl indr ical chamber with an lflternal d iameter of 18.5 cm and a distance of 97 cm between the electrodes. The current source was a condenser bank with a total capaci ty of 35 /sf which was charged to 40 kv. The discharge current was measured by beams of a pickup coil with w L >> R, thus making it possible to measure the magni tude of the current rather than Its derivat ive, as would be the case if to L < R. The signal from this coil was applied to the def lect ion plates of an OK- 17 oscillo- scope. The max imum current in the first ha l f - cyc le under these conditions was approximately 220 ktloamps.
, ~ 6 t 8 20 ?2 2t, t o t',btsec
�9 ' ' ' ' 1 ' \ . . . . ---
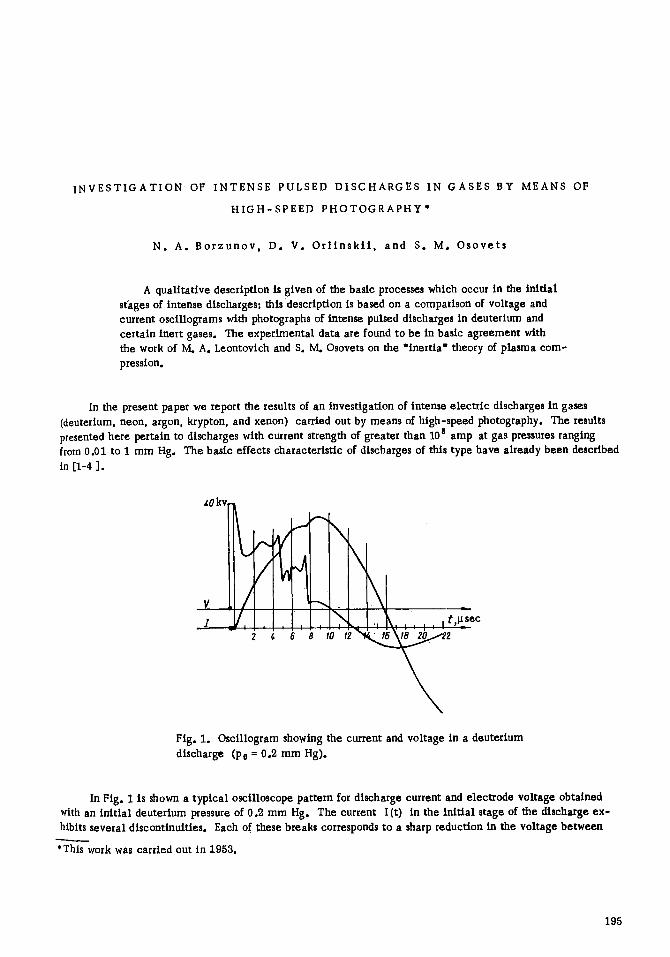
Fig. 2,a. Osciltogram of the current and phasing pulse in a deuterium discharge for P0 = 0o03 mm Hg.
The discharge was photographed with a high-speed camera (SFR) operated in the Wtime-magnification~ mode. This device provides exposure rates up to two mi l l ion frames per second. To de te rmine the phase of the discharge per taining to a g iven frame, the following method was used. An F E U - 1 9 photomul t ip l ier was located direct ly behind the exposed p la te . The cathode of the mul t ip l ie r was covered by a diaphragm in such a way that l ight could reach it only through one of the lenses of the housing in the device . The signal at the output of the photomult ip l ier was fed to a cathode follower and ampli f ier and then applied to a second pair of plates in the oscilloscope (Fig. 2. a ) . The frame whose exposure corresponds to the instant at which light strikes the photomult ipl ier , is denoted by t t . .The neighboring f rame (in position, not t ime) is not exposed (Fig. 2 , b ) . Thus, on the photograph of the discharge we can ascer ta in the f rame which corresponds to the pulse on the oscil loscope. Knowing the rate of rotat ion of the mirror and the t ime scale of the oscilloscope picture, i t is possible to de termine the phase of the deve lopment of the discharge corresponding to a given f rame. The accuracy of this method of phasing depends on the rate of rotat ion of the mirror. With n = -- 60,000 rpm, i .e . , the veloci t ies with which al l photographs in this paper were taken, the error in the de- t e rmina t ion of the phase is less than :~ 0.25 ~ sec.
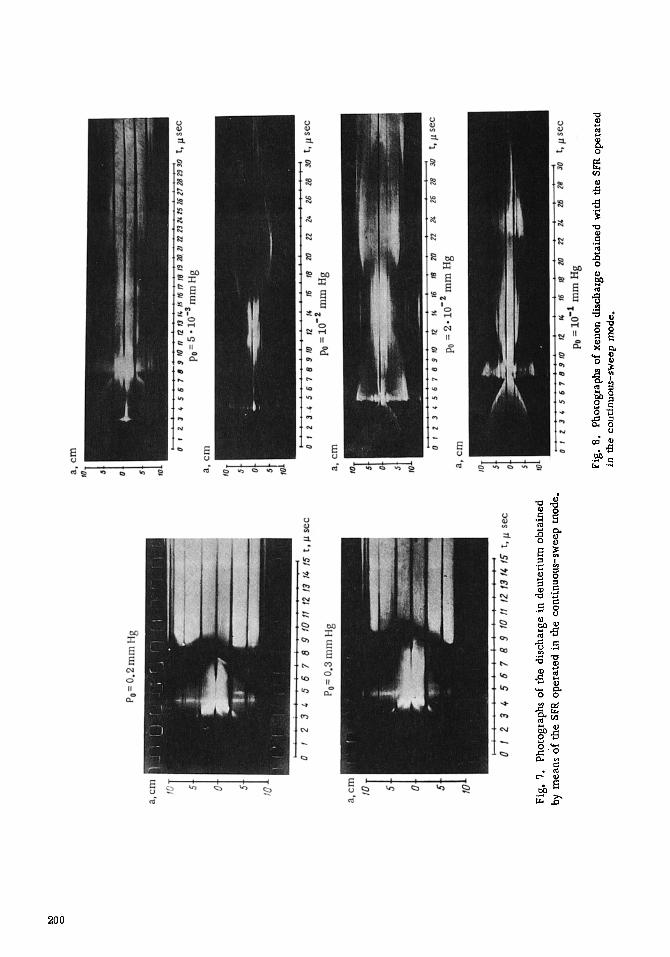
In Figs. 3 -6 are shown Photographs of discharges in deuter ium, neon, argon, and krypton obtained with various values of the in i t ia l gas pressure. In Figs. 7 and 8 are shown photographs of discharges in deuterium and xenon, taken with the same SFR device but operated in the "cont inuous-sweep" mode. In this case there is a slit located between the first and second object ives at the p lane of the In te rmedia te Image . The width of the slit is chosen so that only part of the cyl inder (discharge chamber ) of he ight 1-2 mm is projected on the rotating mirror. As the mirror rotates the image is displaced along the f i lm In the di rect ion of the cylinder axis. Thus, on the f i lm it is possible to obtain a picture of the t ime behavior of a smal l part of the discharge (with n = 60,000 rpm the rate of d i sp lacement of the image along the f i lm is 3 - 1 0 s cm/sec , ) .
196
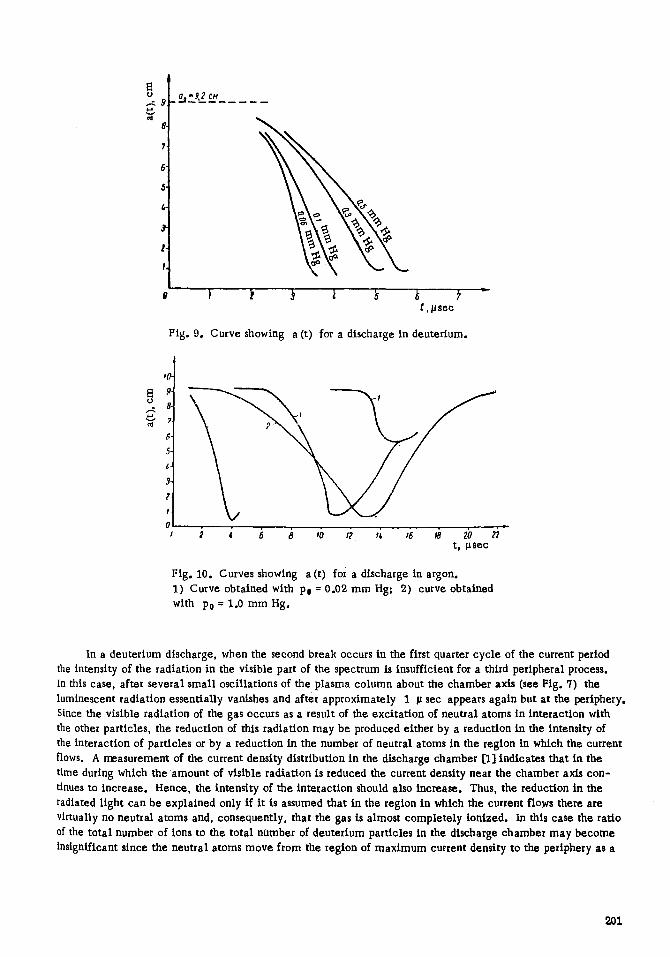
The development of the discharge may be pictured qualitatively as follows. At the initial stage the luminous radiation from the gas is observed only near the walls since in this time period the current flows near the periphery of the discharge chamber because of the skin effect. Then the plasma column starts to contract. The rate of contraction is larger, the smaller the mass of the gas. Curves showing the change in the luminous radius of the plasma column as a function of time in a deuterium discharge are shown in Fig. 9. During the time of contraction the inductance of the column increases; for this reason the discharge-current curve exhibits a marked departure from sinusoidal shape (see Figs. I and 2). During this period the electrode voltage increases. The decay of the luminous radiation (consequently the current at the periphery) is an in- dication that the pressure at the chamber walls is reduced. This means that not only ionized particles but also neutral gas are swept toward the center of the chamber. The measurements described in [3] and [6] in- dicate that in the init ial stage of the discharge the degree of ionization is small. The entrapment of the neutral gas occurs as a result of charge exchange with ions. When an ion collides with a neutral particle the ion is neutralized and continues to move in the same direction, maintaining its momentum, whereas the neutral particle is ionized. The new ion enters into the general motion of the plasma and, along with other charged particles, moves toward the axis of the discharge chamber. The effective cross section for charge exchange is much greater than the cross section for other possible collision processes (neglecting elastic scattering which, in itself, does not play an important role in the process being considered). Thus, the main mass of neutral panicles is swept toward the center of the system. At the end of the contraction process accumulation of neutral particles at the walis of the chamber may start; the momentum of these particles in charge exchange is directed toward the periphery.
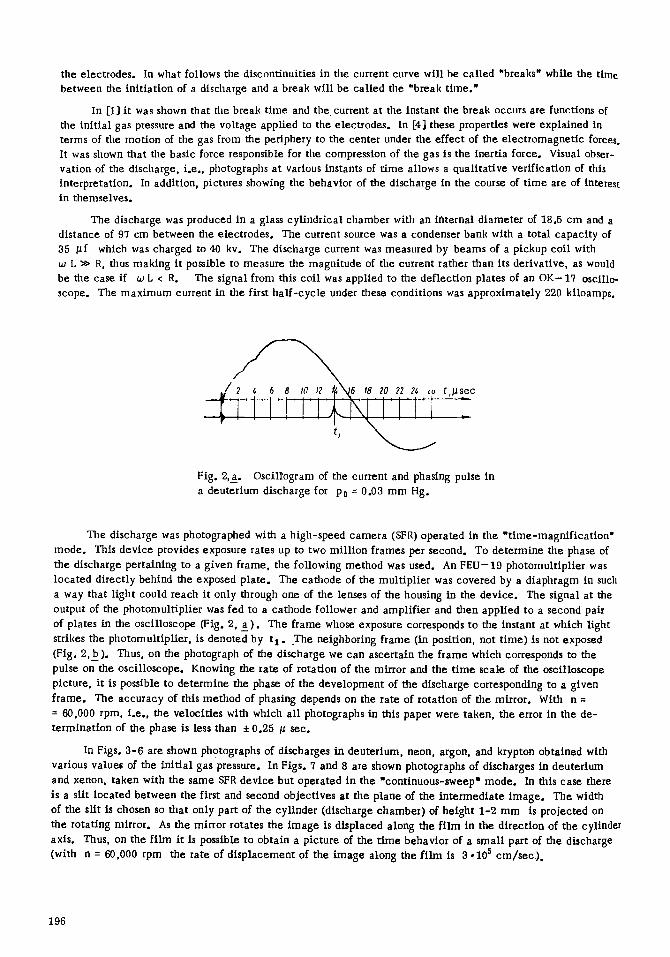
Fig. 2, b . Photograph of the discharge the oscfllogram of which is shown in Fig. 2, _a.
As is apparent from the photographs which have been presented, the plasma column contracts to a fine
(radius a ~ I cm) pinch. The minimum value of the luminescent radius of the pinch is virtually independent of the type of gas and initial pressure. Starting at the instam of time which corresponds to the first break in the currem curve, the gas at the chamber walls once again becomes luminescent. It is apparent that the test gas moves to the walis and a plasma shell is formed. This effect is especially obvious in the photographs of discharges in neon, argon, and krypton (see also Curve I in Figs. 10 and 117. Subsequently, this newly formed plasma shell moves toward the discharge axis. In this case, ff the mass of the gas in the discharge chamber is large enough, the first compression occurs at the end of the first half cycle, when the electrode voltage is small and the process is not repeated. (See Curve 2, Figs. 10 and 11).
At the end of the first contraction of the plasma column short-wave instabilities arise. After the com- pression, when the pinch has already started to expand, the instability becomes stronger. On the photographs can be seen the small unordered vibrations about the pinch axis which increase from frame to frame.
The pinch continues to expand up to the point at which it starts to be compressed along with the second plasma shell moving in from the periphery. If the pressure is low [for example, in the xenon discharge, at a pressure of 0.006 mm Hg (see Fig. 8)] at the instant the second ,break occurs, i.e., at the time of the second contraction, the gas at the walls of the chamber again becomes luminous. If, however, the discharge occurs in a heavy gas at high pressures, then even up to the instant at which the second contraction starts the discharge current is so small that the electromagnetic forces remain extremely weak in the second contraction.
197
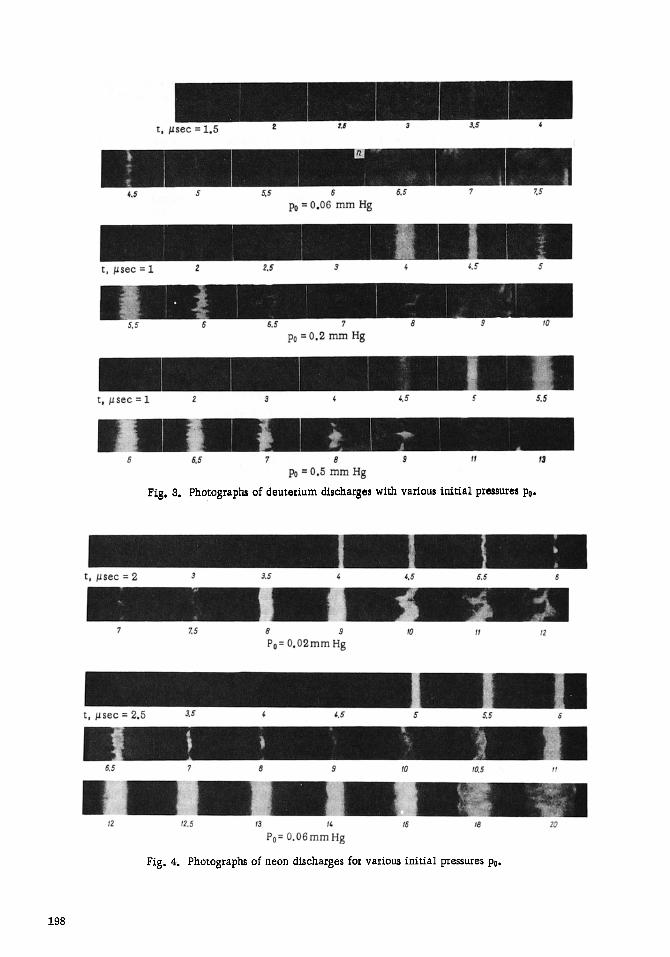
Fi 8. 8. Photographs of deuterium discharges with various initial pressures P0.
Fig. 4. Photographs of neon discharges for various initial pTessures P0.
198
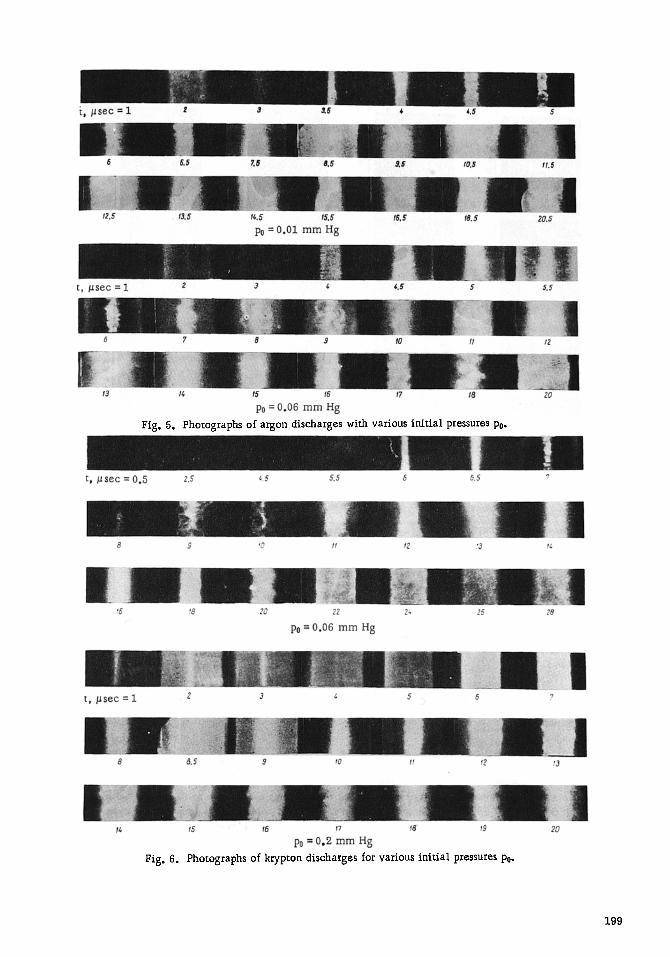
Fig. 5. Photographs of argon discharges with various initial pressures P0.
Fig. 6. Photographs of krypton discharges for various initial pressures P0.
199
o
Fig
. 7.
Ph
otog
raph
s of
the
dis
char
ge i
n de
uter
ium
obt
aine
d by
mea
ns o
f th
e SF
R o
pera
ted
in t
he c
onti
nuou
s-sw
eep
mod
e.
Fig
. 8.
Ph
otog
raph
s of
xen
on d
isch
arge
obt
aine
d w
ith
the
SFR
ope
rate
d in
the
con
tinu
ous-
swee
p m
od
e.
0 ,..=,9
ed
8
0 ,,.e,
_ ~ , - . j , 2 _ c 2 . . . . . .
t,/~sec
Pig. 9. Curve showing a (t) for a discharge in deuterium.
i
t, ~ s e c
Fig. 10. Curves showing a (t) for a discharge in argon. 1) Curve obtained with Po = 0.02 mm Hg; 2) curve obtained with Po = 1.0 mm Hg.
In a deuterium discharge, when the second break occurs in the first quarter cycle of the current period the intensity of the radiation in the visible part of the spectrum is insufficient for a third peripheral process. In this case, after several small oscillations of the plasma column about the chamber axis (see Fig. 7) the luminescent radiation essentially vanishes and after approximately 1 ~ sec appears again but at the periphery. Since the visible radiation of the gas occurs as a result of the excitation of neutral atoms in interaction with the other particles, the reduction of this radiation may be produced either by a reduction in the intensity of the interaction of particles or by a reduction in the number of neutral atoms in the region in which the current flows. A rmasurement of the current density distribution in the discharge chamber [1] indicates that in the time during which the amount of visible radiation is reduced the current density near the chamber axis con- tinues to increase. Hence, the intensity of the interaction should also tncream. Thus, the reduction in the radiated light can be explained only if it is assumed that in the region in which the current flows there are virtually no neutral atoms and, consequently, that the gas is almost completely ionized, in this case the ratio of the total number of ions to the total number of deuterium particles in the discharge chamber may become insignificant since the neutral atoms move from the region of maximum current density to the periphery as a
201
result of charge exchange. The radiation at the periphery appears as a result of the interaction of the plasma with the chamber walls after the plasma column breaks up. In this case atoms of silicon and oxygen enter the discharge region [3]; these atoms emit strongly in the visible part of the spectrum.
Neutron and hard x-ray radiation [9.] are observed before the pinch breaks up. In the photograph of the deuterium discharge with an initial pressure of 0.06 mm Hg (see Fig. 3) the frame corresponding to the neutron pulse is denoted by the letter n .
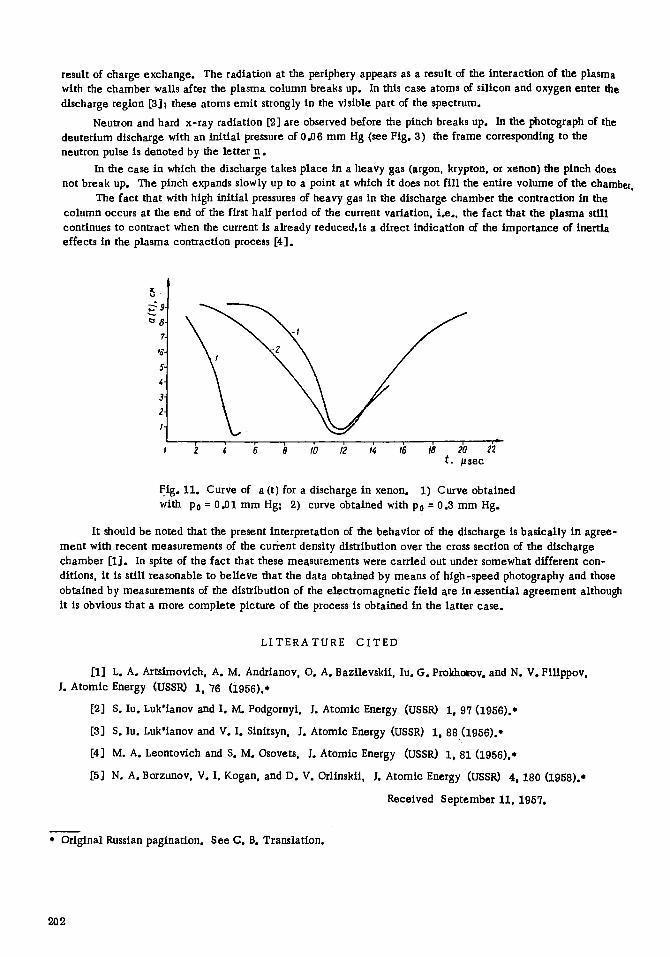
In the case in which the discharge takes place in a heavy gas (argon, krypton, or xenon) the pinch does not break up. The pinch expands siowly up to a point at which it does not fill the entire volume of the chamber.
The fact that with high initial pressures of heavy gas in the discharge chamber the contraction in the column occurs at the end of the first half period of the current variation, i.e., the fact that the plasma still continues to contract when the current is already reduced,is a direct indication of the Importance of inertia effects in the plasma contraction process [4].
Z'9 ,
T
5-
3-
2-
I-
t
t . /~sec
Fig. 11. Curve of a(t) for a discharge in xenon. 1) Curve obtained with P0 = 0.01 mm Hg; 9) curve obtained with P0 = 0.3 mm Hg.
it should be noted that the present interpretation of the behavior of the discharge is basically in agree- ment with recent measurements of the current density distribution over the cross section of the discharge chamber [ lJ . In spite of the fact that these measurements were carried out under somewhat different con- ditions, it is still reasonable to believe that the data obtained by means of high-speed photography and those obtained by measurements of the distribution of the electromagnetic field are in essential agreement although it is obvious that a more complete picture of the process is obtained in the latter case.
LITERATURE CITED
[1] L. A. Artsimovich, A. M. Andrianov, O. A. Bazilevskil, lu. G. Proldaozov. and N. V. Fillppov,
J. Atomic Energy (USSR) I, 76 41956).*
[2] S. lu. Luk'ianov and Io IvL Podgornyl, L Atomic Energy (USSPO 1, 97 (1958).*
[3] S. lu. Luk'ianov and Vo I. Sinitsyn, J. Atomic Energy (USSR) I, 88 (1956).*
[4] M. A. Leontovich and S. M. Osovets, L Atomic Energy (USSR) 1, 81 41956).*
[5] N. A. Borzunov, V. I. Kogan, and D. V. Orlinskli, J. Atomic Energy (USSPO 4, 180 (1958).*
Received September 11, 1957.
* Original Russian pagination. See C. B. Tzamlatinn.
202