Embed Size (px)
Citation preview
Transmitted via Overnight Courier
August 3,2010
Mr. Dean Tagliaferro EPA Project Coordinator c/o Weston Solutions, Inc. 10 Lyman Street Pittsfield, MA 0120 I
Re: GE-PittsfieldlHousatonic River Site Former lOe Oil Pipelines at GE Plant Area (GECDlOO) Investigation, Oil Removal, and Capping Plan
Dear Mr. Tagliaferro:
GE 159 Plastics Avenue Pittsfield, MA 01201 USA
As a follow-up to discussions between the General Electric Company (GE) and the U.S. Environmental Protection Agency (EPA) over the last several months, GE is submitting, for EPA's review and approval, this plan to address celtain pipelines located at GE's Pittsfield, Massachusetts facility. GE's records indicate that this piping formerly distributed 10c mineral oil containing polychlorinated biphenyls (PCBs) at concentrations;:::: 50 parts per million (ppm) at the GE facility before the distribution system was decommissioned in 1964. GE's plan includes the following measures:
i. GE will inspect the piping for the presence or absence of residual oil;
ll. If residual oil is observed during the above-referenced inspection activities, GE will remove and containerize the residual oil for proper disposal at a permitted off-site disposal facility; and
Ill. Following the removal step, GE will cap any pipe openings and fill the in-place piping, to the extent possible, with cement-bentonite slurry, non-shrink grout, and/or high-density polyurethane foam.
EPA has asked that GE seek EPA approval of this plan pursuant to 40 CFR § 761.61(c) - which is part of EPA's regulations under the Toxic Substances Control Act (TSCA) - as a risk-based alternative to the disposal requirements for PCB Remediation Waste set forth in 40 CFR § 761.61(a) & (b). As discussed further below, these pipes are not subject to the requirements of 40 CFR § 761.61, including 40 CFR § 761.61(c). In fact, there is no basis in either the TSCA regulations or the Consent Decree (CD) for this Site to require further cleanup or disposal activities for these pipes, and GE reserves the right to contest such requirements in the future. Nevertheless, GE is submitting this plan to address these pipes and notes that, as a practical matter, the end result will be the same regardless of whether the TSCA regulations apply: the pipes in their current condition do not pose an unreasonable risk of injury to health or the environment and, once GE's plan is implemented, any residual risks will be even further reduced.
Corporate EnVIronmental Programs
Mr. Dean Tagliaferro August 3, 2010
Page 2 of 10
G:\GE\GE_Pittsfield_Other-Misc\Reports and Presentations\Pipeline\2671011324Plan.doc
The piping system being addressed in this plan was decommissioned and taken out of service in 1964. PCB Remediation Waste that was disposed of before the effective dates of the TSCA prohibitions (1978-79) is “presumed not to pose an unreasonable risk of injury to health or the environment.”1 Unless the EPA Regional Administrator specifically finds that “pre-TSCA” PCB Remediation Waste presents an unreasonable risk, such waste does not have to be cleaned up in accordance with 40 CFR § 761.61.2 For example, EPA has stated that there is no obligation to dig up and dispose of electrical equipment disposed of prior to 1978 “unless the EPA Regional Administrator makes a finding that spills, leaks, or other uncontrolled releases or discharges from the site constitute ongoing disposal that may present an unreasonable risk of injury to health or the environment from exposure to PCBs at the site.”3 The EPA Regional Administrator has not made such an unreasonable risk finding regarding the underground pipes at the Pittsfield site. Indeed, the available evidence indicates that these pipes do not present an unreasonable risk. Prior to execution of the CD, GE reported to EPA the existence of the pipes, the PCB concentrations of the associated oil, and the actions previously taken to address the pipes. This information was thus known during the development of the soil- and groundwater-related Performance Standards established in the CD. To the extent that there was or is a risk to human health and the environment due to releases from these pipes, any such potential risk will be addressed by attainment of the Performance Standards in the CD.4 For this reason and other reasons discussed below, the pipes in their current condition do not pose an unreasonable risk to human health and the environment. Nonetheless, GE is voluntarily submitting this plan for EPA’s approval in the interest of cooperation and based on discussions with EPA. Implementing this plan will further reduce any residual risks posed by these pipes, and therefore would meet the unreasonable risk standard of 40 CFR § 761.61(c). The remainder of this letter is organized as follows: A. Summary of Available Information on the Pipeline System
B. Proposed Cleanup Plan
C. Explanation of No Unreasonable Risk
A. SUMMARY OF AVAILABLE INFORMATION ON THE PIPELINE SYSTEM5
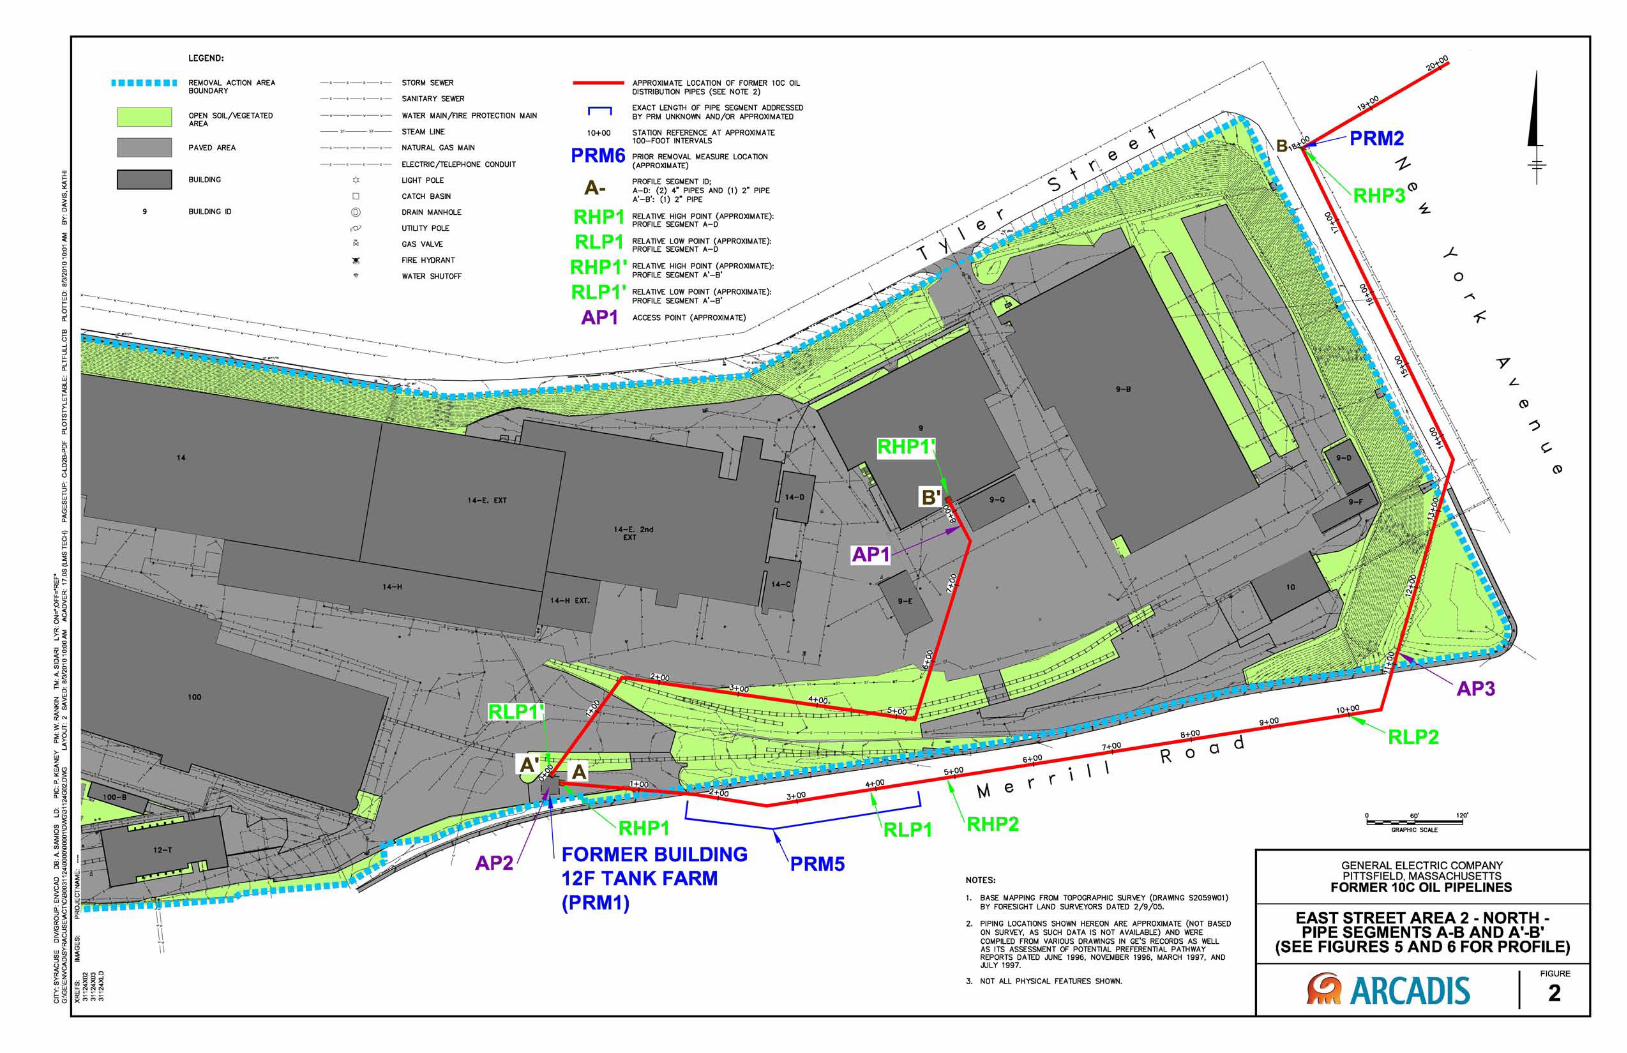
The first system of inactive pipes subject to this plan consists of two 4-inch diameter pipes and one 2-inch diameter pipe. These three pipes originate from the former Building 12F Tank Farm Area, which was located near the southeast corner of Building 100 at the GE Facility. The Building 12F Tank Farm consisted of 14 underground storage tanks (USTs) with capacities ranging from 20,000 to 25,000 gallons, and one above-ground storage tank (AST) with a capacity of 100,000 gallons. The tanks were used for the storage of 10c mineral oil used to support manufacturing operations at the facility. The facility stopped using the pipe system in 1964.
1 40 CFR § 761.50(b)(3)(i)(A). 2 40 CFR § 761.50(b)(3)(i)(B). 3 EPA PCB Questions & Answers at pp. 46-47 (2009). 4 GE also notes that EPA has no administrative authority to compel GE to take any action regarding these pipes under either Section 7 or Section 17 of TSCA, as the U.S. covenants established under the CD (Paragraph 161) preclude such actions. 5 Information presented in this section is based upon a review of GE’s historical records.
Mr. Dean Tagliaferro August 3, 2010
Page 3 of 10
G:\GE\GE_Pittsfield_Other-Misc\Reports and Presentations\Pipeline\2671011324Plan.doc
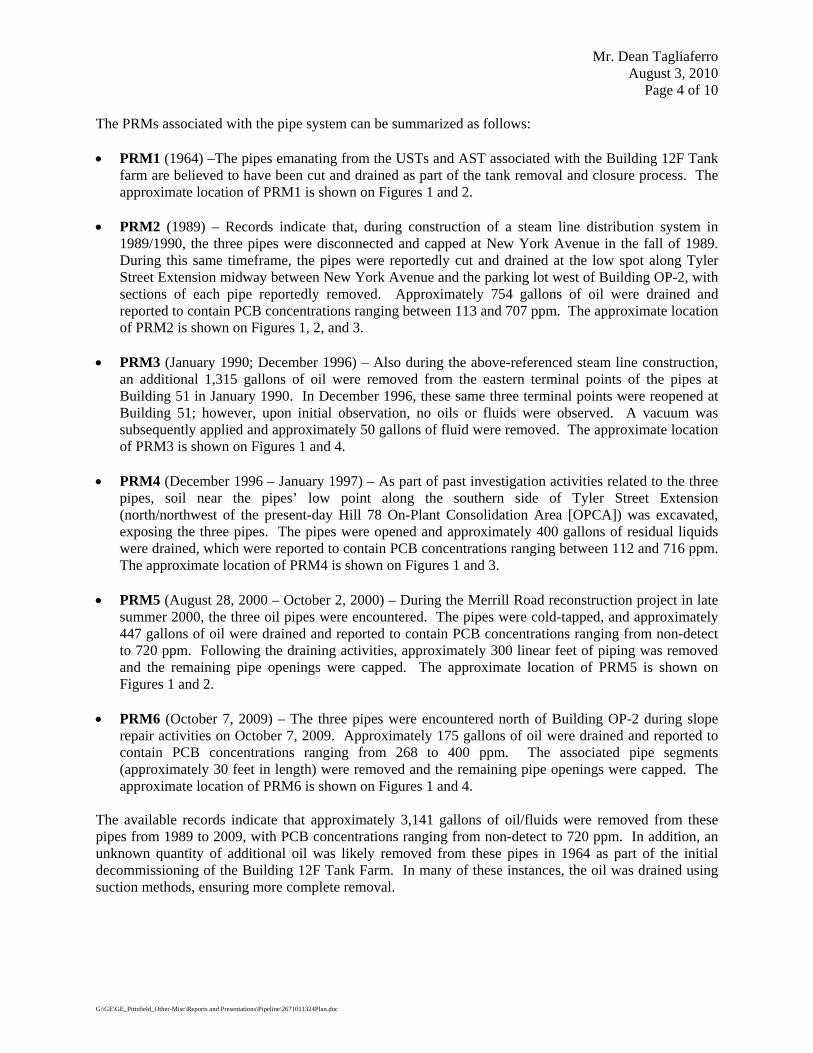
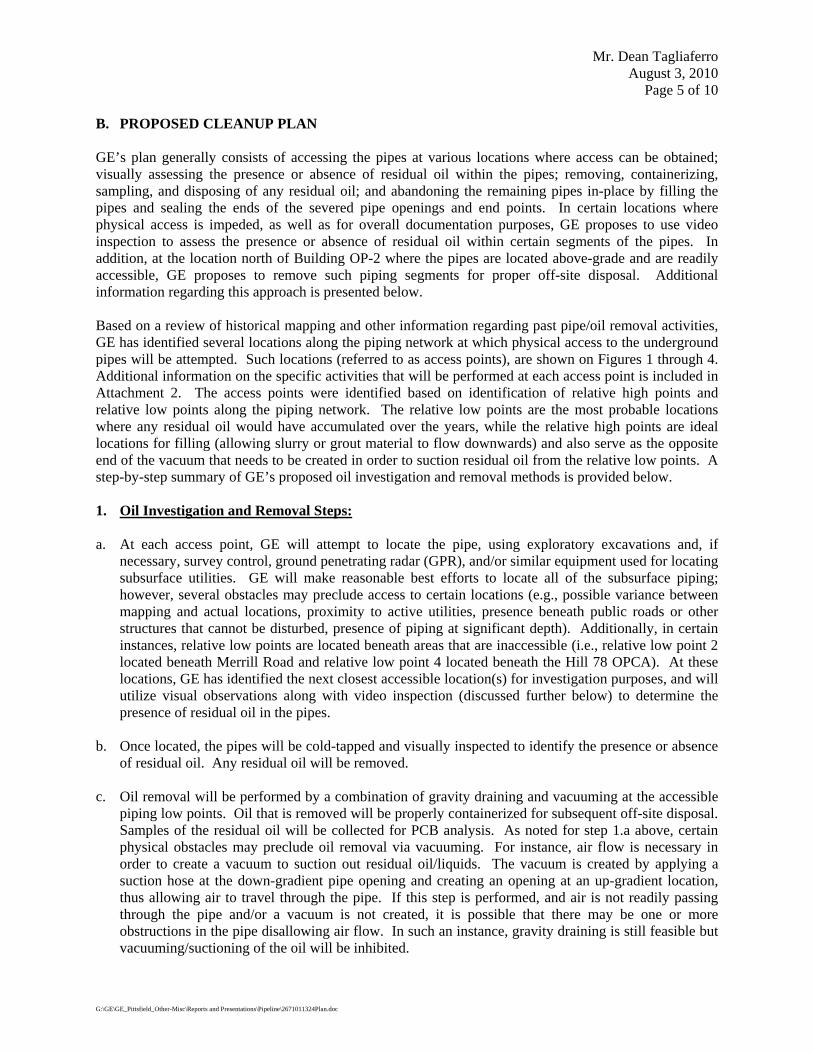
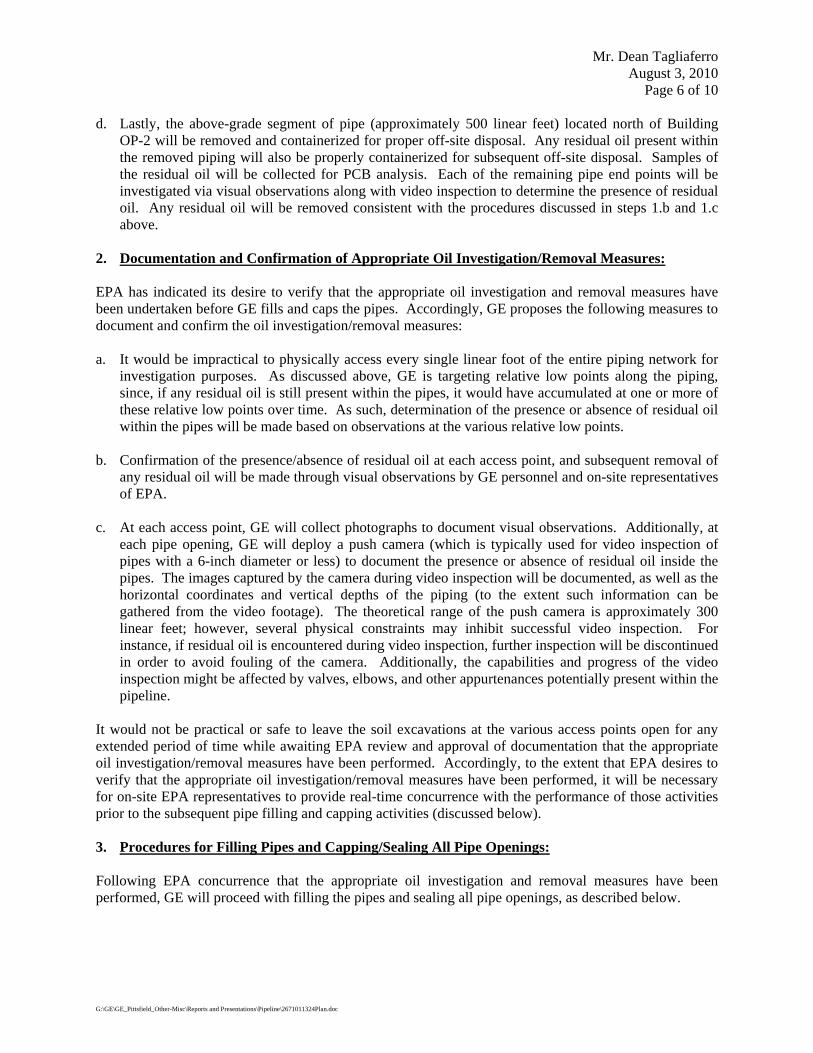
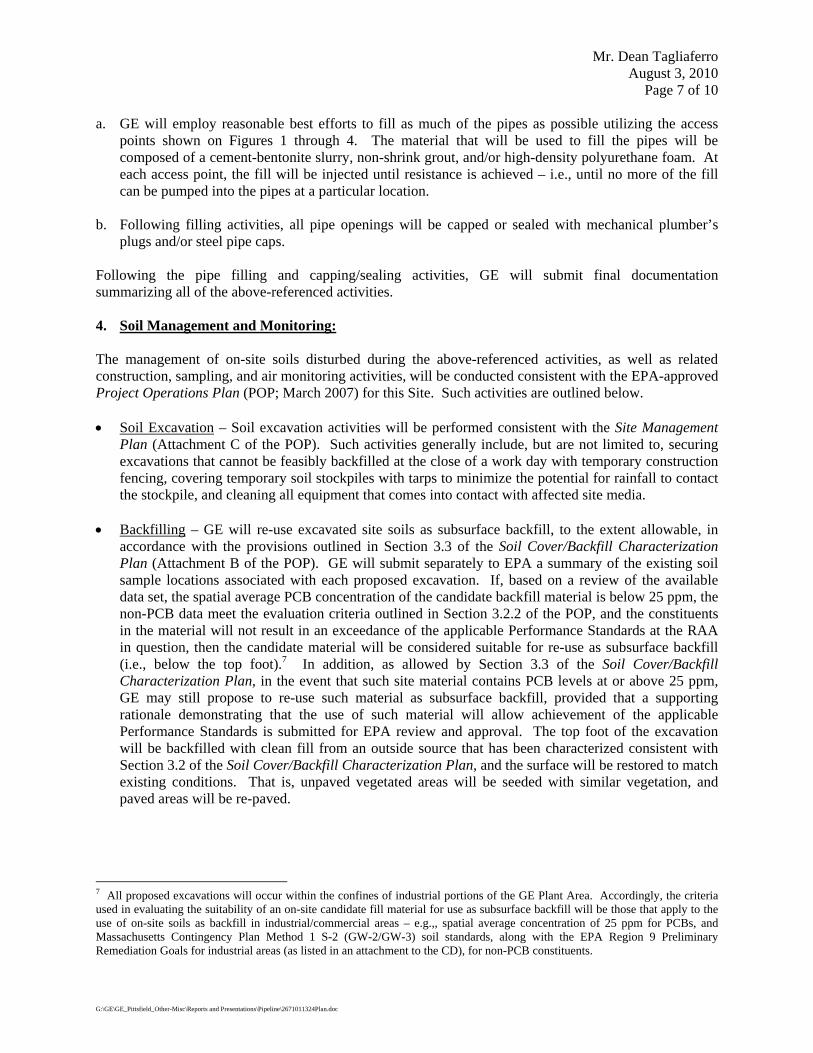
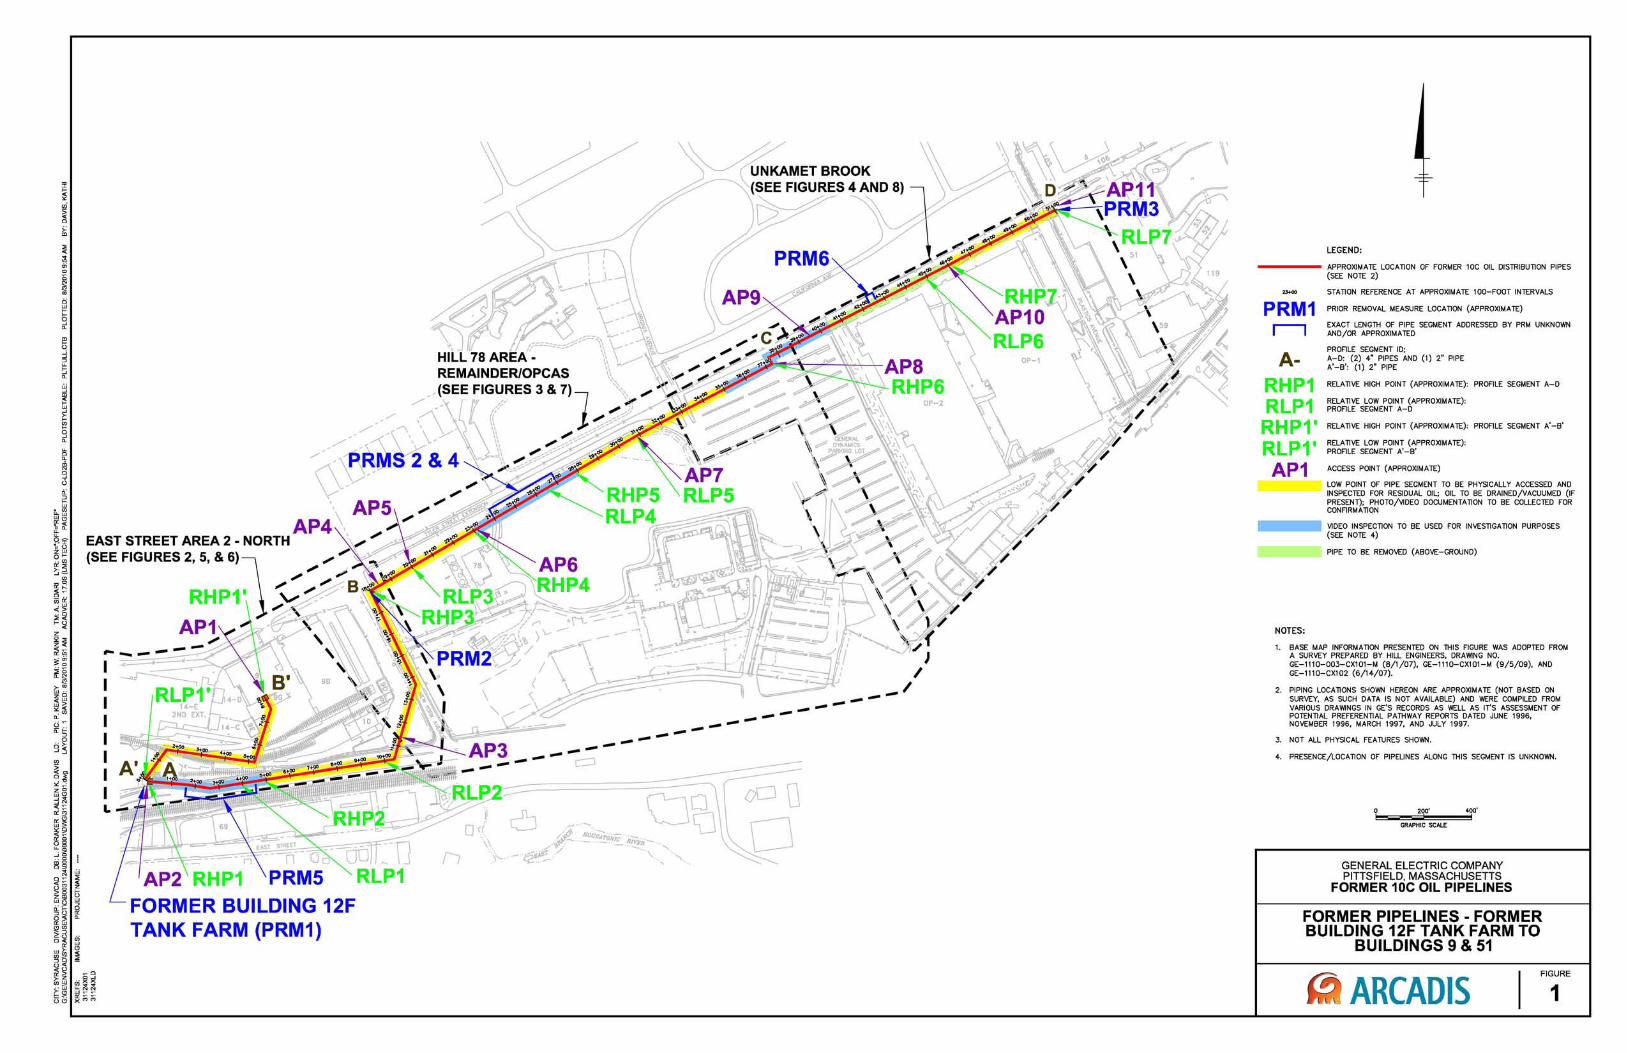
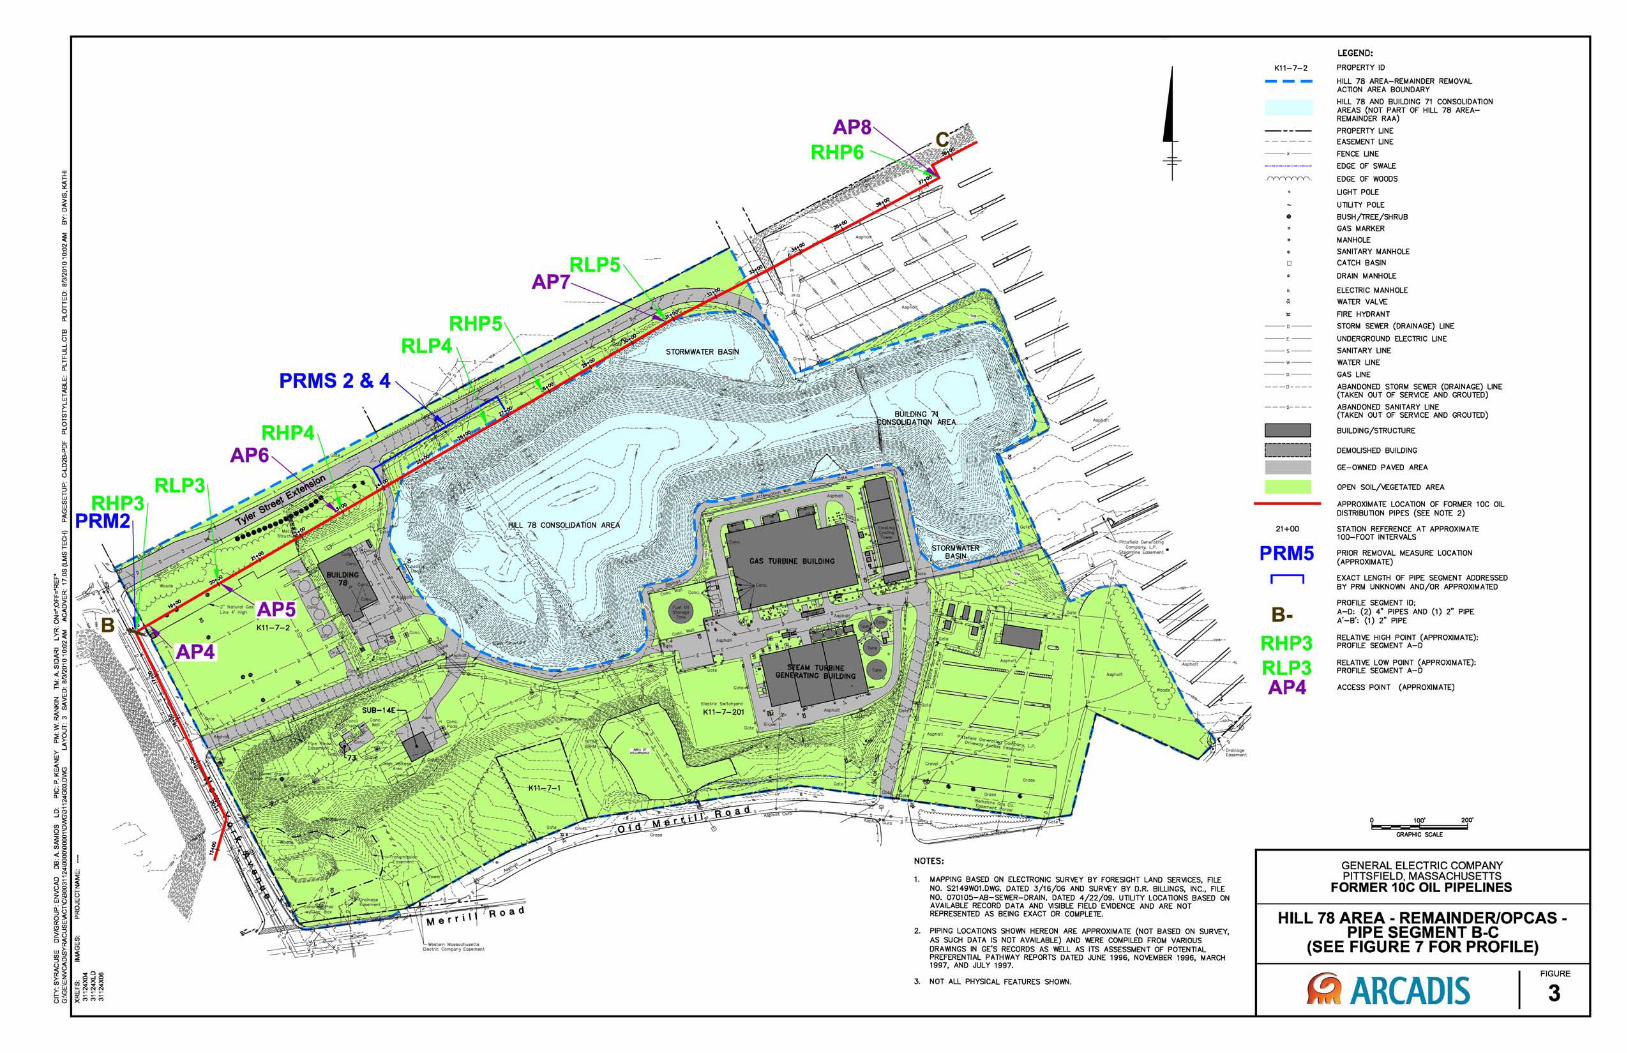
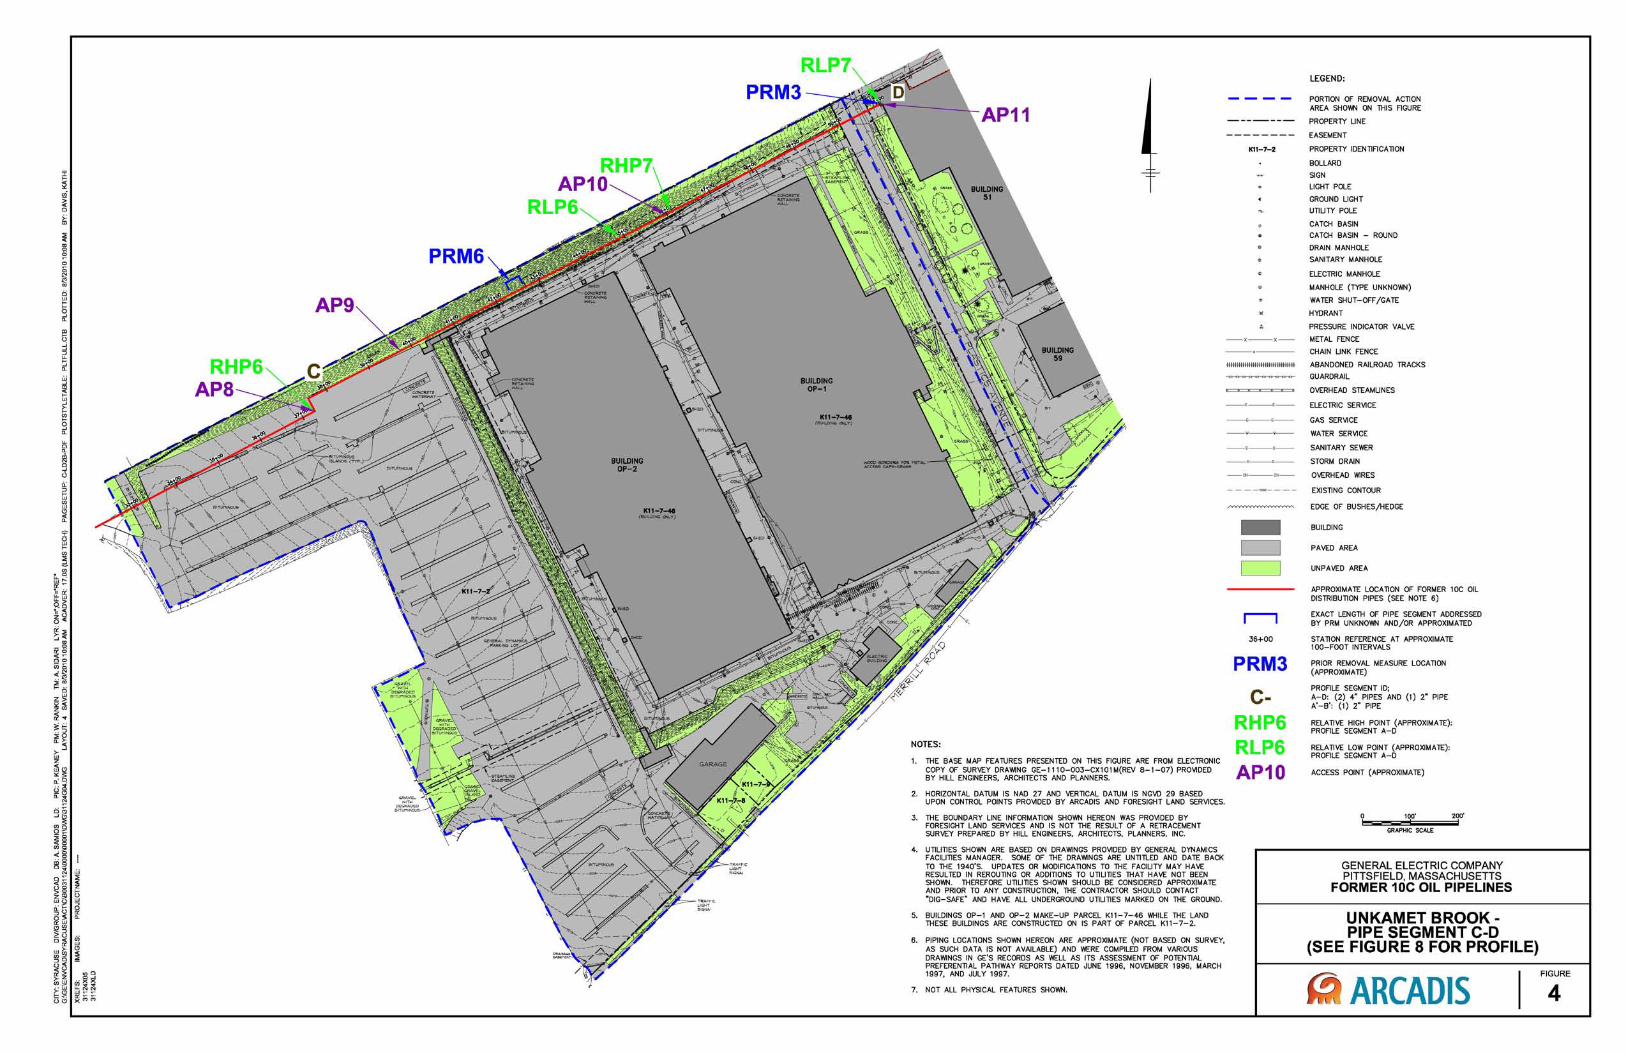
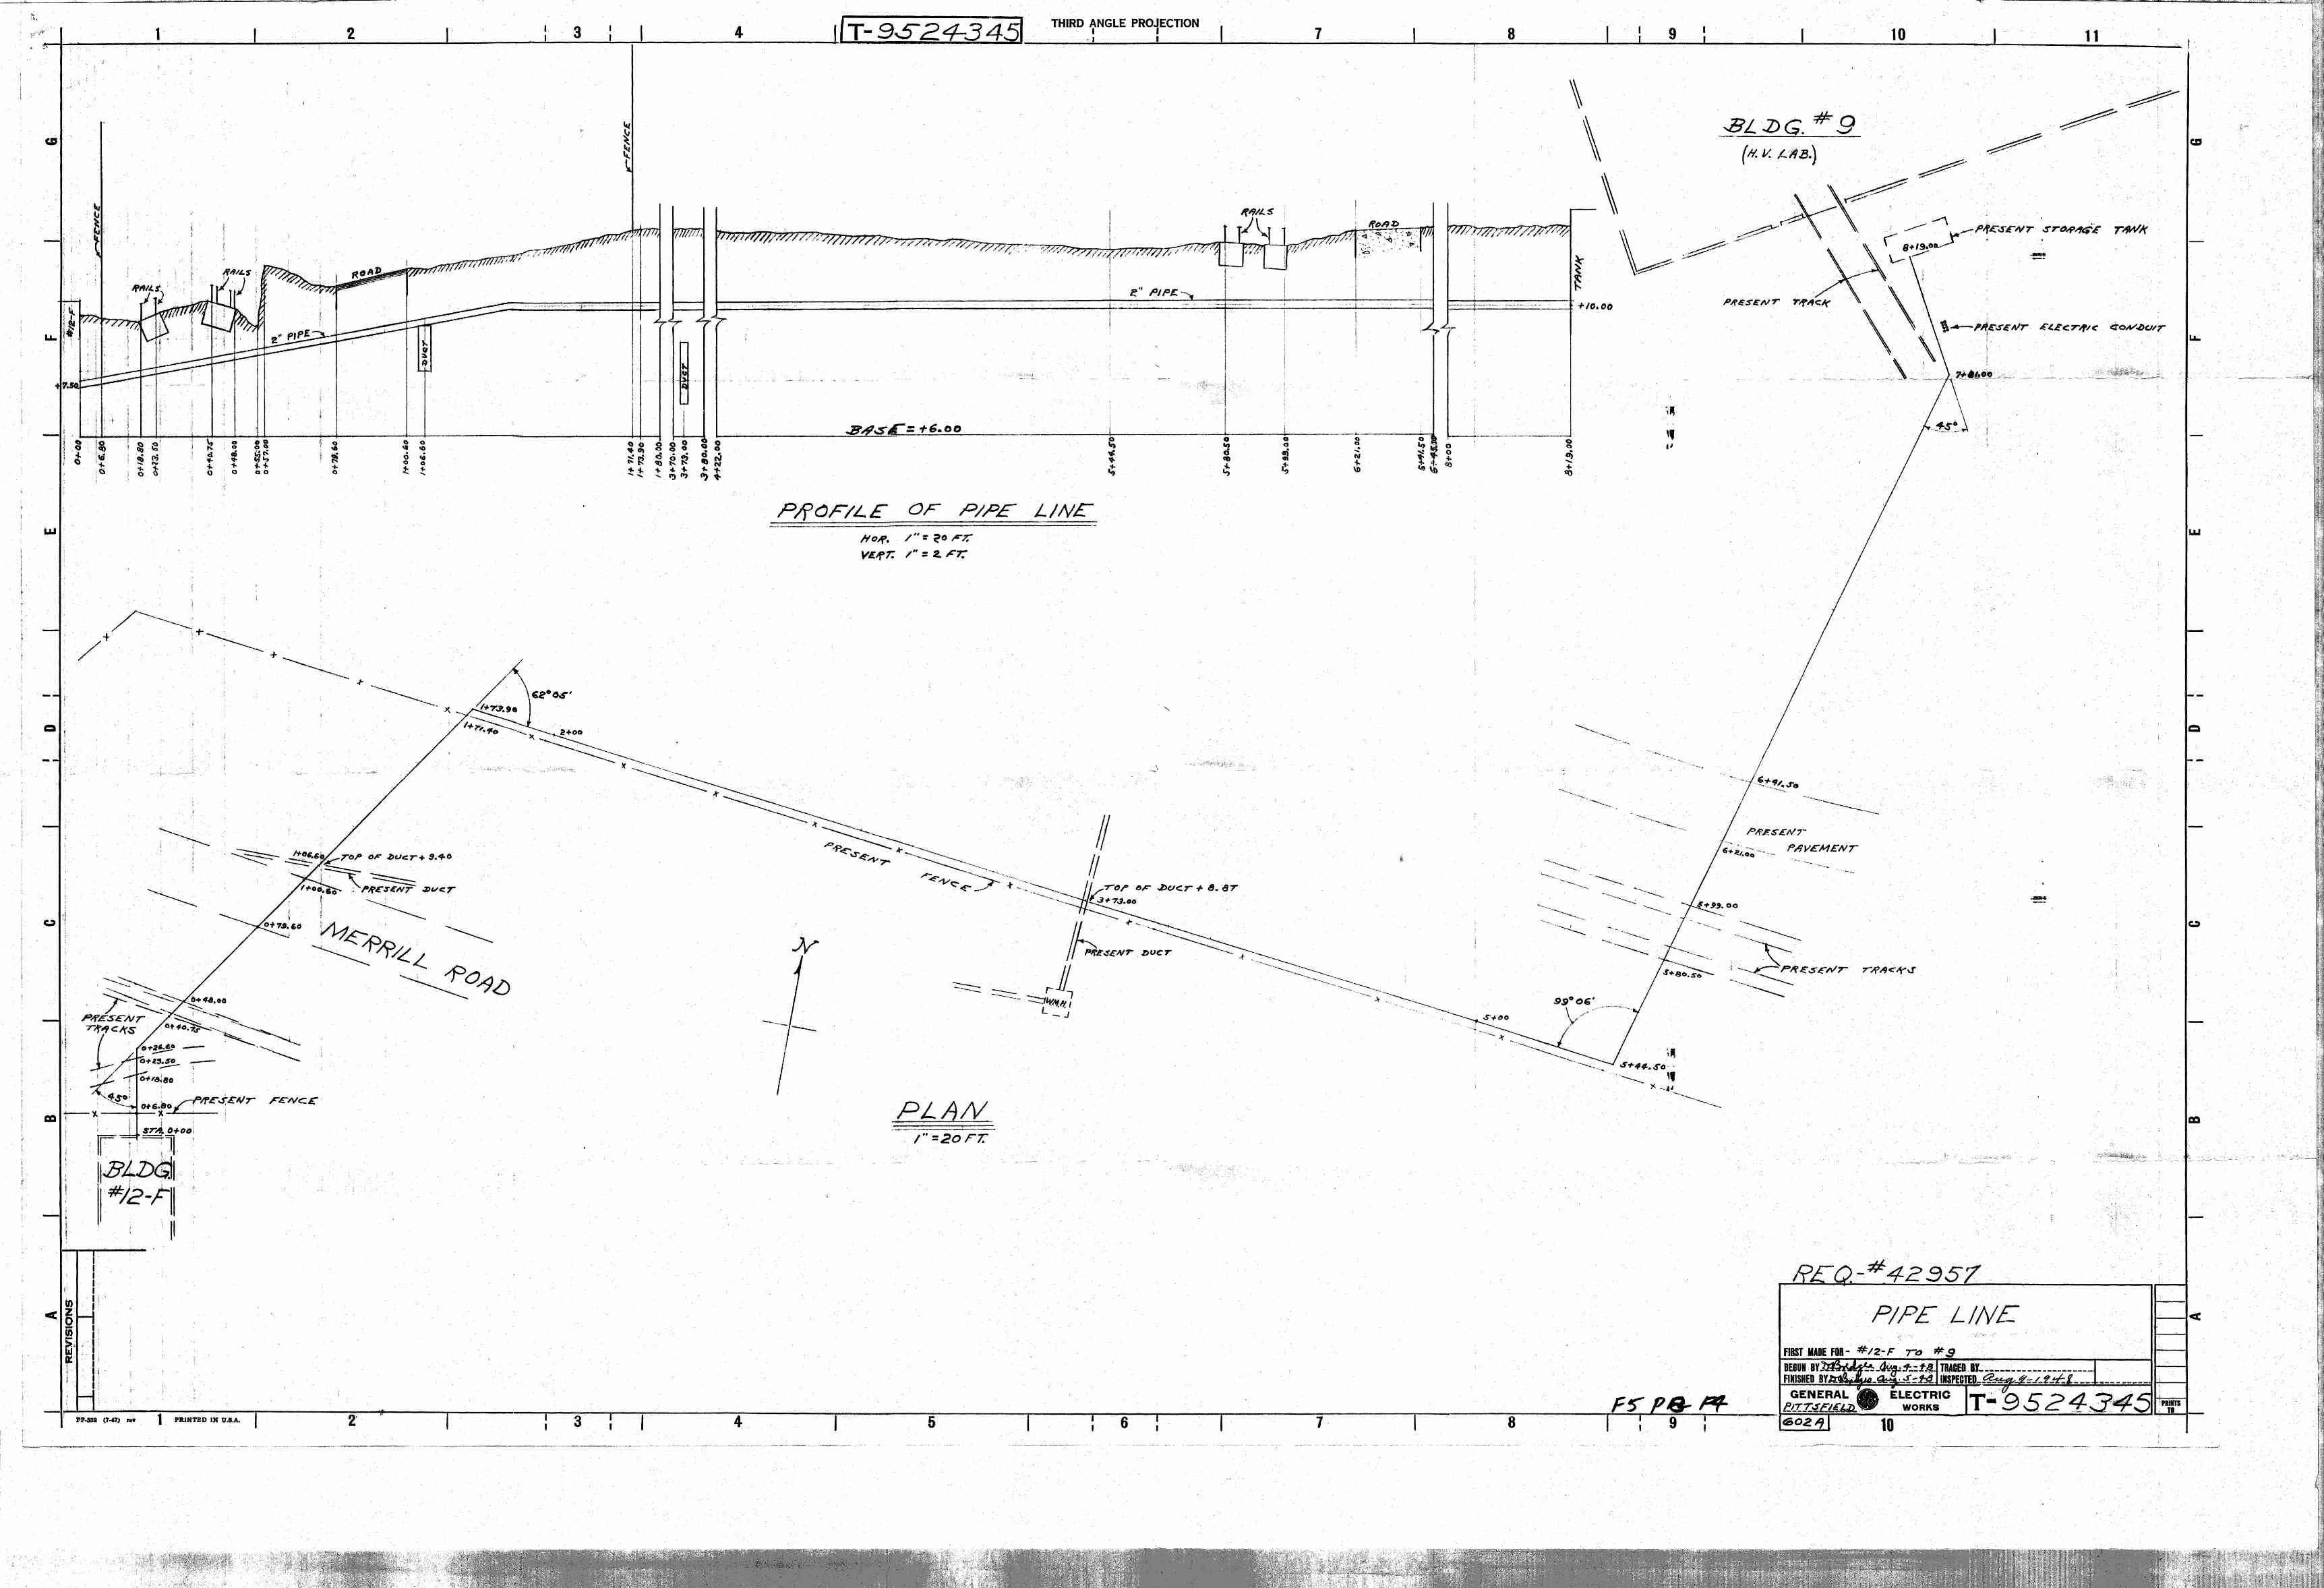
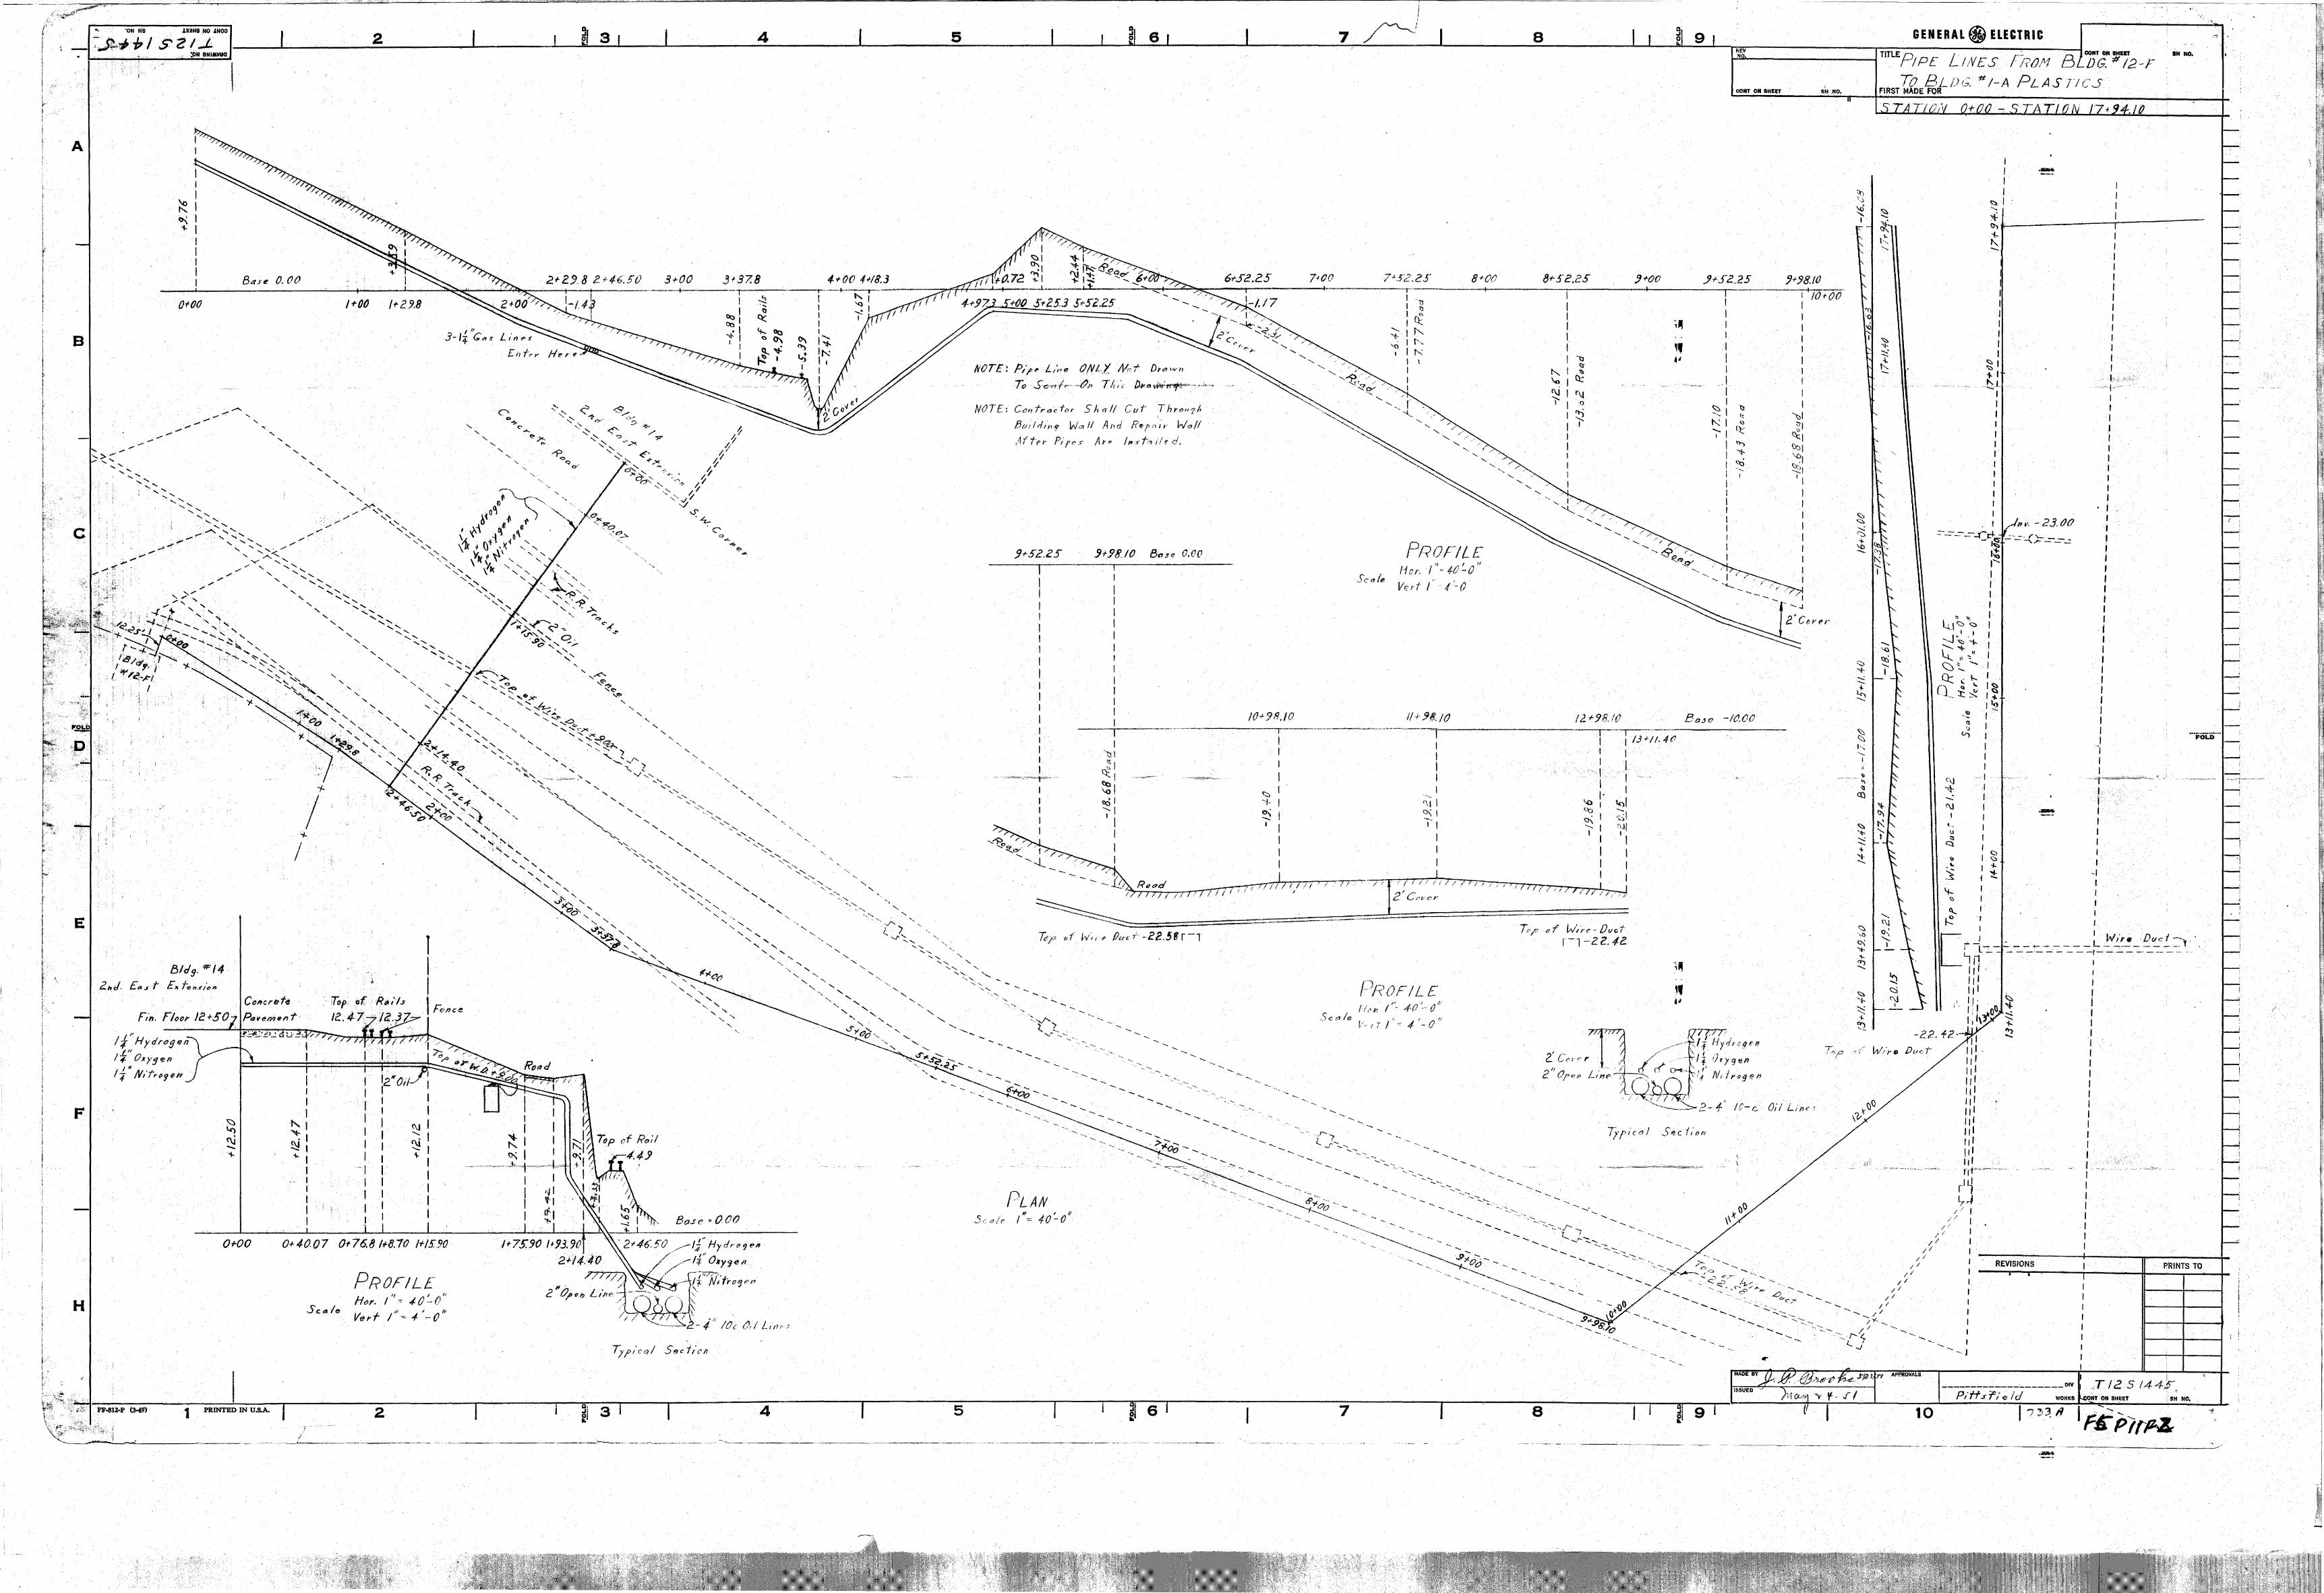
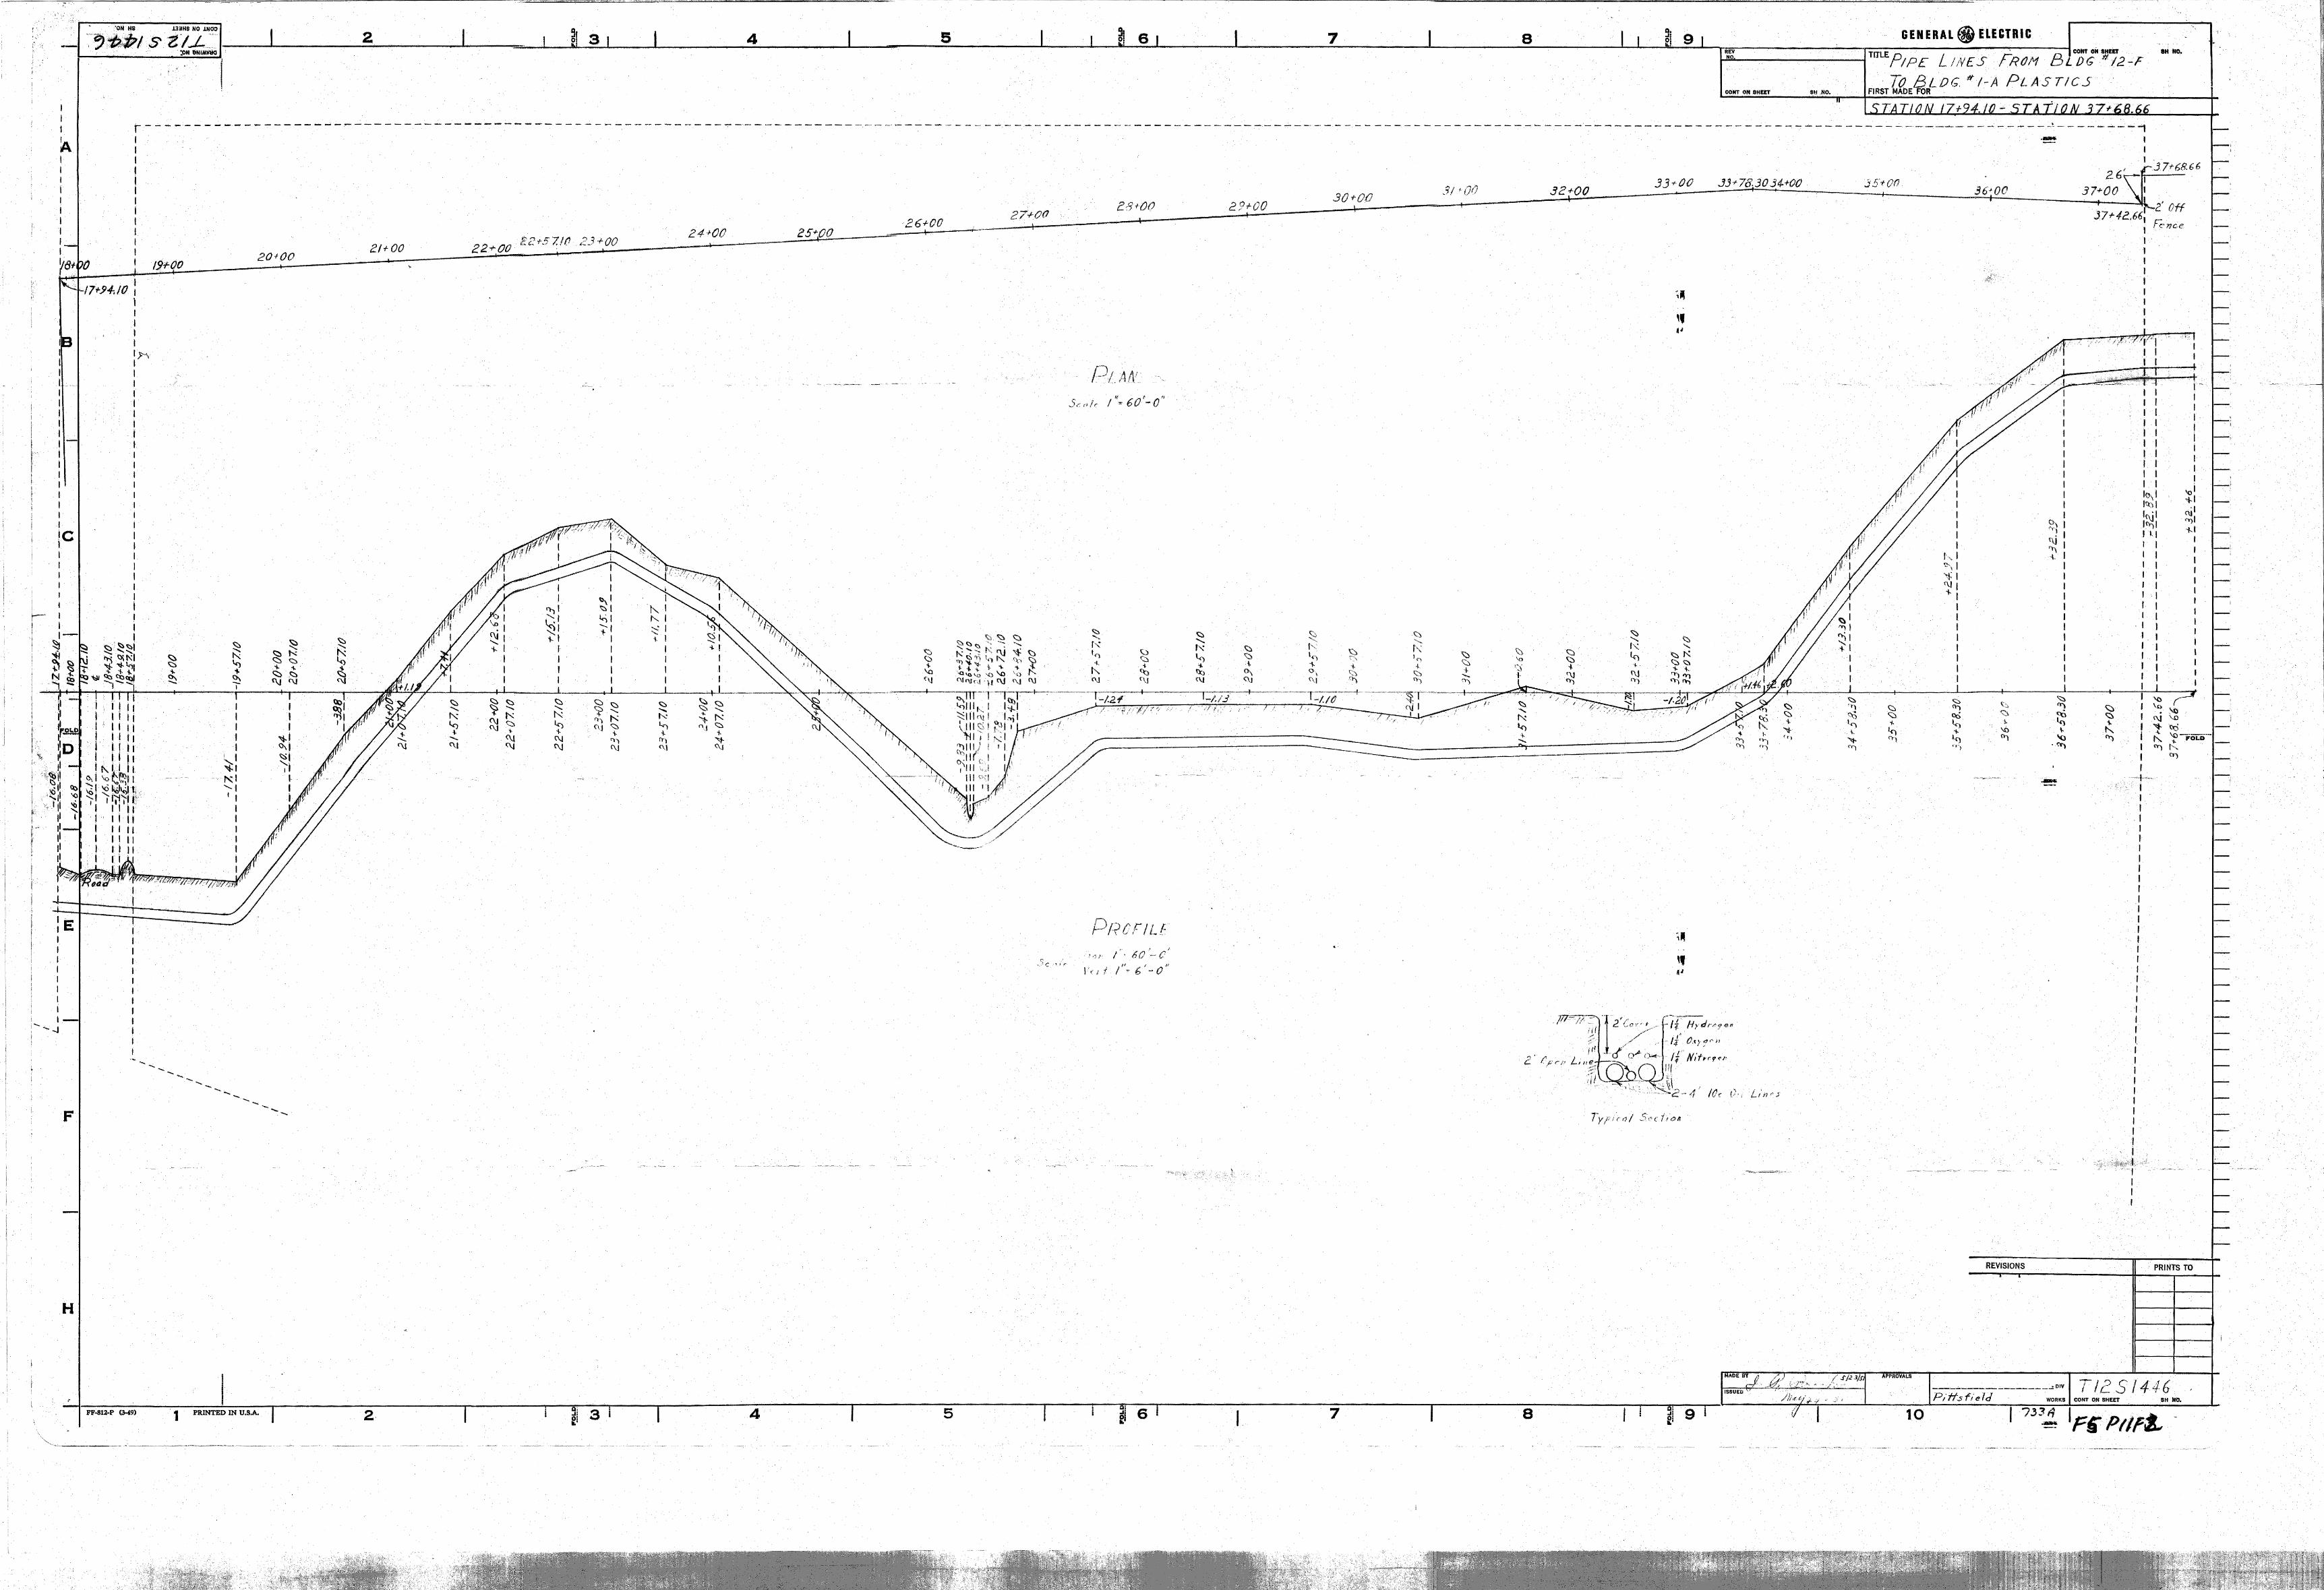
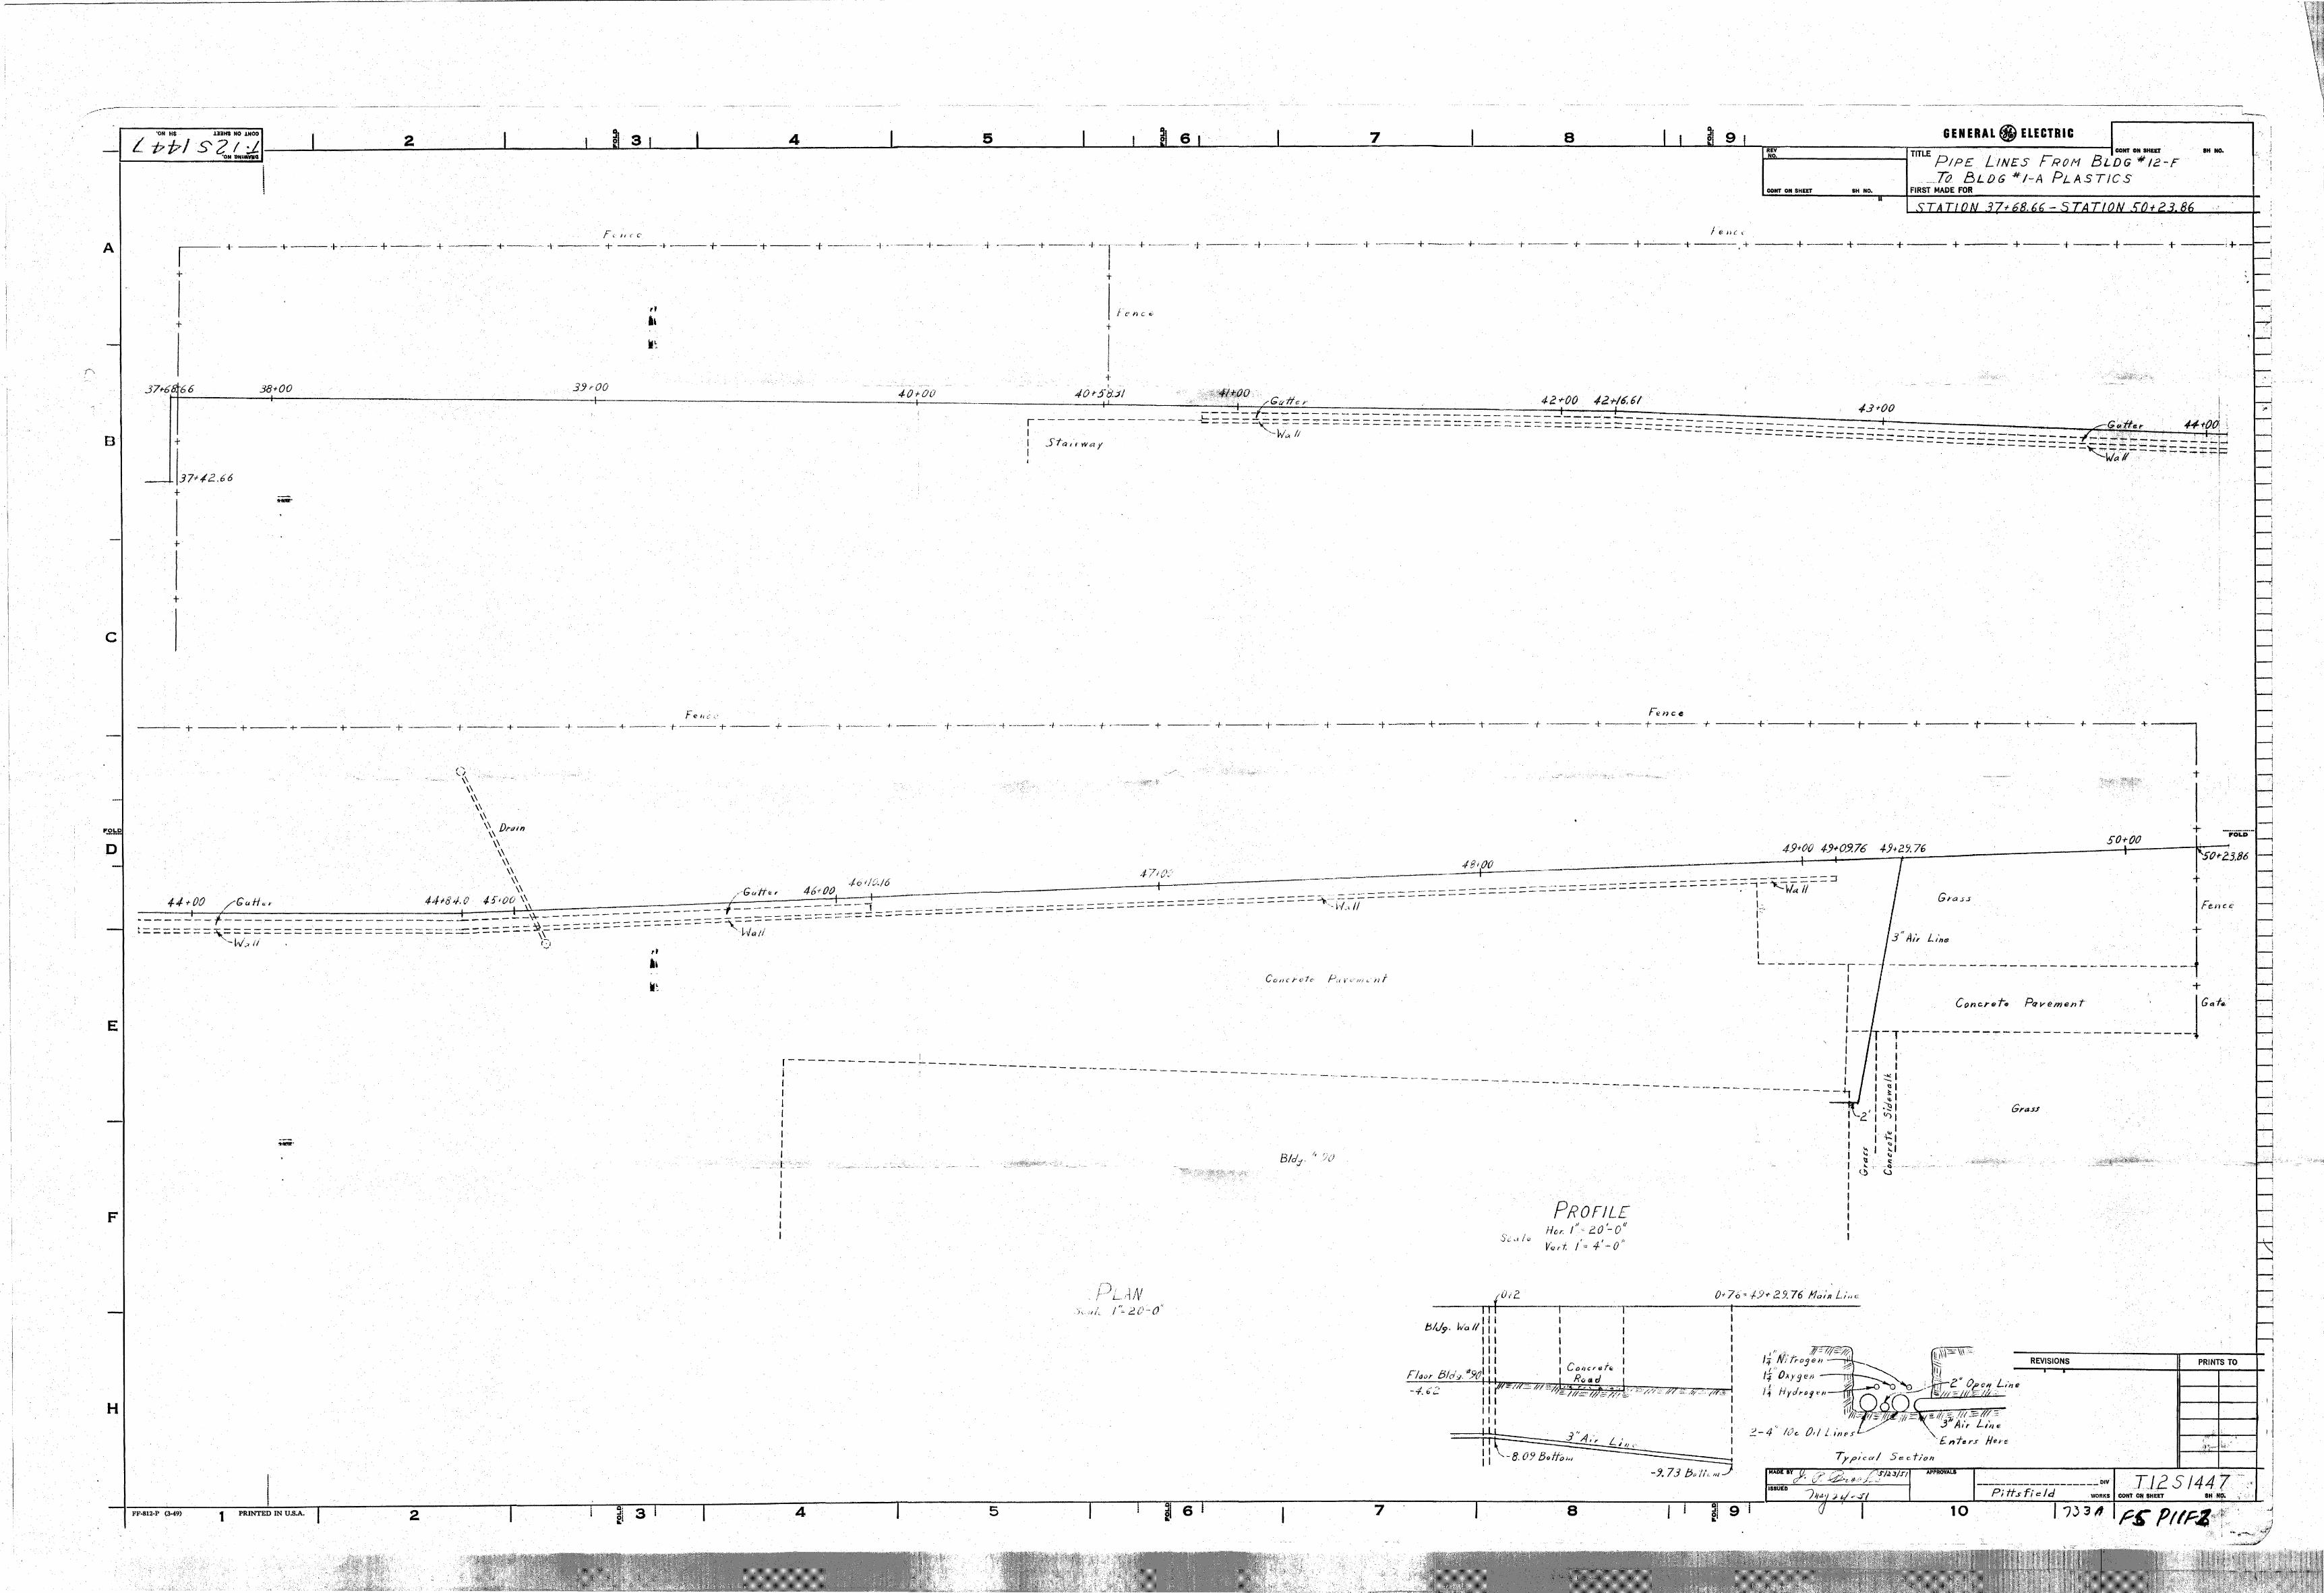
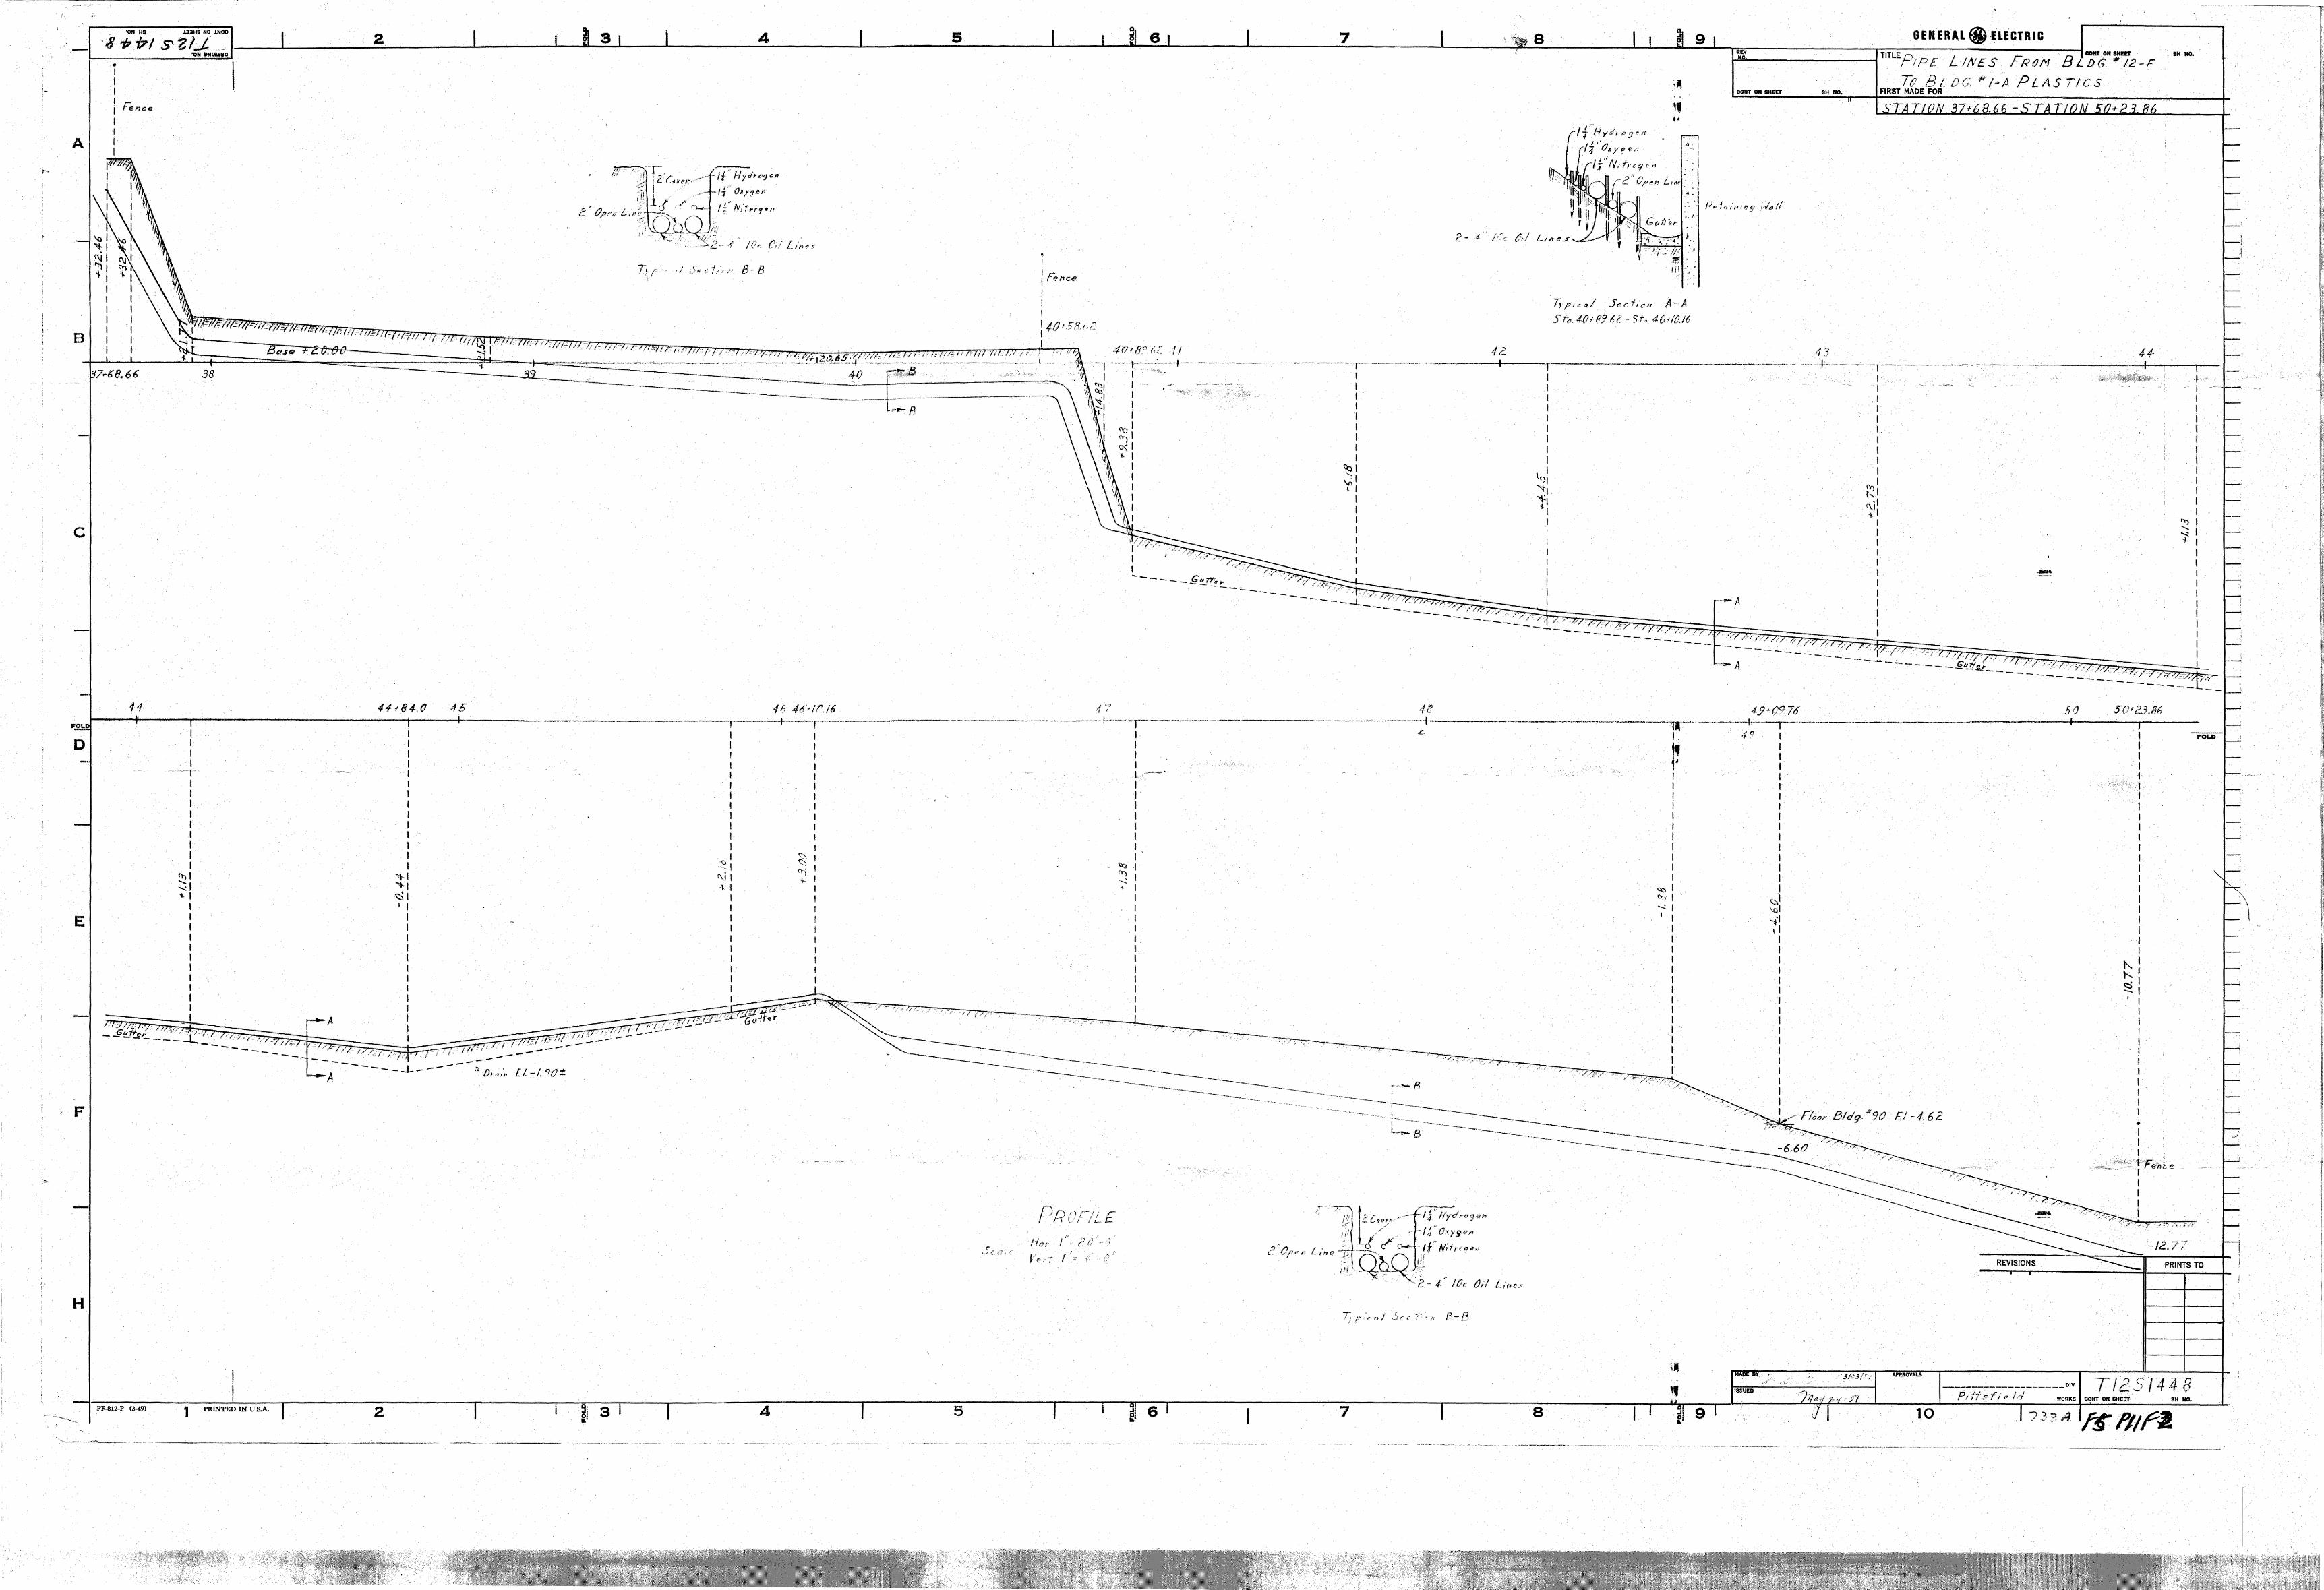
The three pipe system transported 10c mineral oil from the former Building 12F Tank Farm to New York Avenue (along the southern edge of the East Street Area 2-North Removal Action Area [RAA]), then along the west side of New York Avenue to Tyler Street Extension, then along the south side of Tyler Street Extension (along the northern edge of the Hill 78 Area-Remainder RAA), then along the north side of Buildings OP-1 and OP-2, and then traversing beneath Plastics Avenue and terminating at Building 51 (at the Unkamet Brook Area RAA). The material of construction for these pipes is not documented; however, ductile iron was typical for such piping and is consistent with observations of removed piping segments. This entire length of piping spans a horizontal distance of approximately 5,000 feet. In addition to the first system of pipes, there is a 2-inch diameter oil pipe that runs from the former Building 12F Tank Farm Area northeast to Building 9, spanning a horizontal distance of approximately 800 feet. This second segment of pipe is also addressed under this plan. Figures 1 through 8 provide various plan and profile views of the above-referenced pipe routing. For a number of reasons, there is some variation between the piping configuration shown on these Figures and actual locations.6 The operational history and prior removal measures (PRMs) relating to these oil distribution pipes have been previously documented in numerous reports submitted to both EPA and the Massachusetts Department of Environmental Protection (MDEP). These include, but are not necessarily limited to, the following: • MCP Interim Phase II Report and Current Assessment Summary for East Street Area 1/USEPA Area
3 (Blasland, Bouck & Lee [BBL], October 1994); • MCP Interim Phase II Report and Current Assessment Summary for Unkamet Brook Area/USEPA
Area 1 (BBL, January 1995);
• Assessment of Potential Preferential Pathways in East Street Area 1/USEPA Area 3 (BBL, November 1996).
• Assessment of Potential Preferential Pathways in Hill 78 Area/USEPA Area 2 (BBL, March 1997);
• Assessment of Potential Preferential Pathways in Unkamet Brook Area/USEPA Area 1 (BBL, July 1997);
• Letter to EPA from GE dated November 2, 2000 regarding Draining and Removal of Oil Lines – Merrill Road Mass Highway Project;
• Letter to EPA from GE dated October 9, 2009 regarding PCB results associated with oil drained from three pipes located north of Building OP-2.
6 Information regarding the locations and elevations of the piping system was obtained from several original plan/design drawings. These drawings are provided in Attachment 1 for reference. These drawings are plan/design drawings; as-built information associated with these pipes is not available. Thus, the actual location of the installed pipes may have varied slightly from the plan/design drawings, and may have also been modified during subsequent system operations. In certain instances, the pipe locations shown on the plan/design drawings are not consistent with current visual observations. Furthermore, the information provided on these drawings does not provide reference to current horizontal or vertical survey data. Accordingly, the overlay of these piping locations onto existing base map information is an approximation.
Mr. Dean Tagliaferro August 3, 2010
Page 4 of 10
G:\GE\GE_Pittsfield_Other-Misc\Reports and Presentations\Pipeline\2671011324Plan.doc
The PRMs associated with the pipe system can be summarized as follows: • PRM1 (1964) –The pipes emanating from the USTs and AST associated with the Building 12F Tank
farm are believed to have been cut and drained as part of the tank removal and closure process. The approximate location of PRM1 is shown on Figures 1 and 2.
• PRM2 (1989) – Records indicate that, during construction of a steam line distribution system in 1989/1990, the three pipes were disconnected and capped at New York Avenue in the fall of 1989. During this same timeframe, the pipes were reportedly cut and drained at the low spot along Tyler Street Extension midway between New York Avenue and the parking lot west of Building OP-2, with sections of each pipe reportedly removed. Approximately 754 gallons of oil were drained and reported to contain PCB concentrations ranging between 113 and 707 ppm. The approximate location of PRM2 is shown on Figures 1, 2, and 3.
• PRM3 (January 1990; December 1996) – Also during the above-referenced steam line construction,
an additional 1,315 gallons of oil were removed from the eastern terminal points of the pipes at Building 51 in January 1990. In December 1996, these same three terminal points were reopened at Building 51; however, upon initial observation, no oils or fluids were observed. A vacuum was subsequently applied and approximately 50 gallons of fluid were removed. The approximate location of PRM3 is shown on Figures 1 and 4.
• PRM4 (December 1996 – January 1997) – As part of past investigation activities related to the three
pipes, soil near the pipes’ low point along the southern side of Tyler Street Extension (north/northwest of the present-day Hill 78 On-Plant Consolidation Area [OPCA]) was excavated, exposing the three pipes. The pipes were opened and approximately 400 gallons of residual liquids were drained, which were reported to contain PCB concentrations ranging between 112 and 716 ppm. The approximate location of PRM4 is shown on Figures 1 and 3.
• PRM5 (August 28, 2000 – October 2, 2000) – During the Merrill Road reconstruction project in late
summer 2000, the three oil pipes were encountered. The pipes were cold-tapped, and approximately 447 gallons of oil were drained and reported to contain PCB concentrations ranging from non-detect to 720 ppm. Following the draining activities, approximately 300 linear feet of piping was removed and the remaining pipe openings were capped. The approximate location of PRM5 is shown on Figures 1 and 2.
• PRM6 (October 7, 2009) – The three pipes were encountered north of Building OP-2 during slope
repair activities on October 7, 2009. Approximately 175 gallons of oil were drained and reported to contain PCB concentrations ranging from 268 to 400 ppm. The associated pipe segments (approximately 30 feet in length) were removed and the remaining pipe openings were capped. The approximate location of PRM6 is shown on Figures 1 and 4.
The available records indicate that approximately 3,141 gallons of oil/fluids were removed from these pipes from 1989 to 2009, with PCB concentrations ranging from non-detect to 720 ppm. In addition, an unknown quantity of additional oil was likely removed from these pipes in 1964 as part of the initial decommissioning of the Building 12F Tank Farm. In many of these instances, the oil was drained using suction methods, ensuring more complete removal.
Mr. Dean Tagliaferro August 3, 2010
Page 5 of 10
G:\GE\GE_Pittsfield_Other-Misc\Reports and Presentations\Pipeline\2671011324Plan.doc
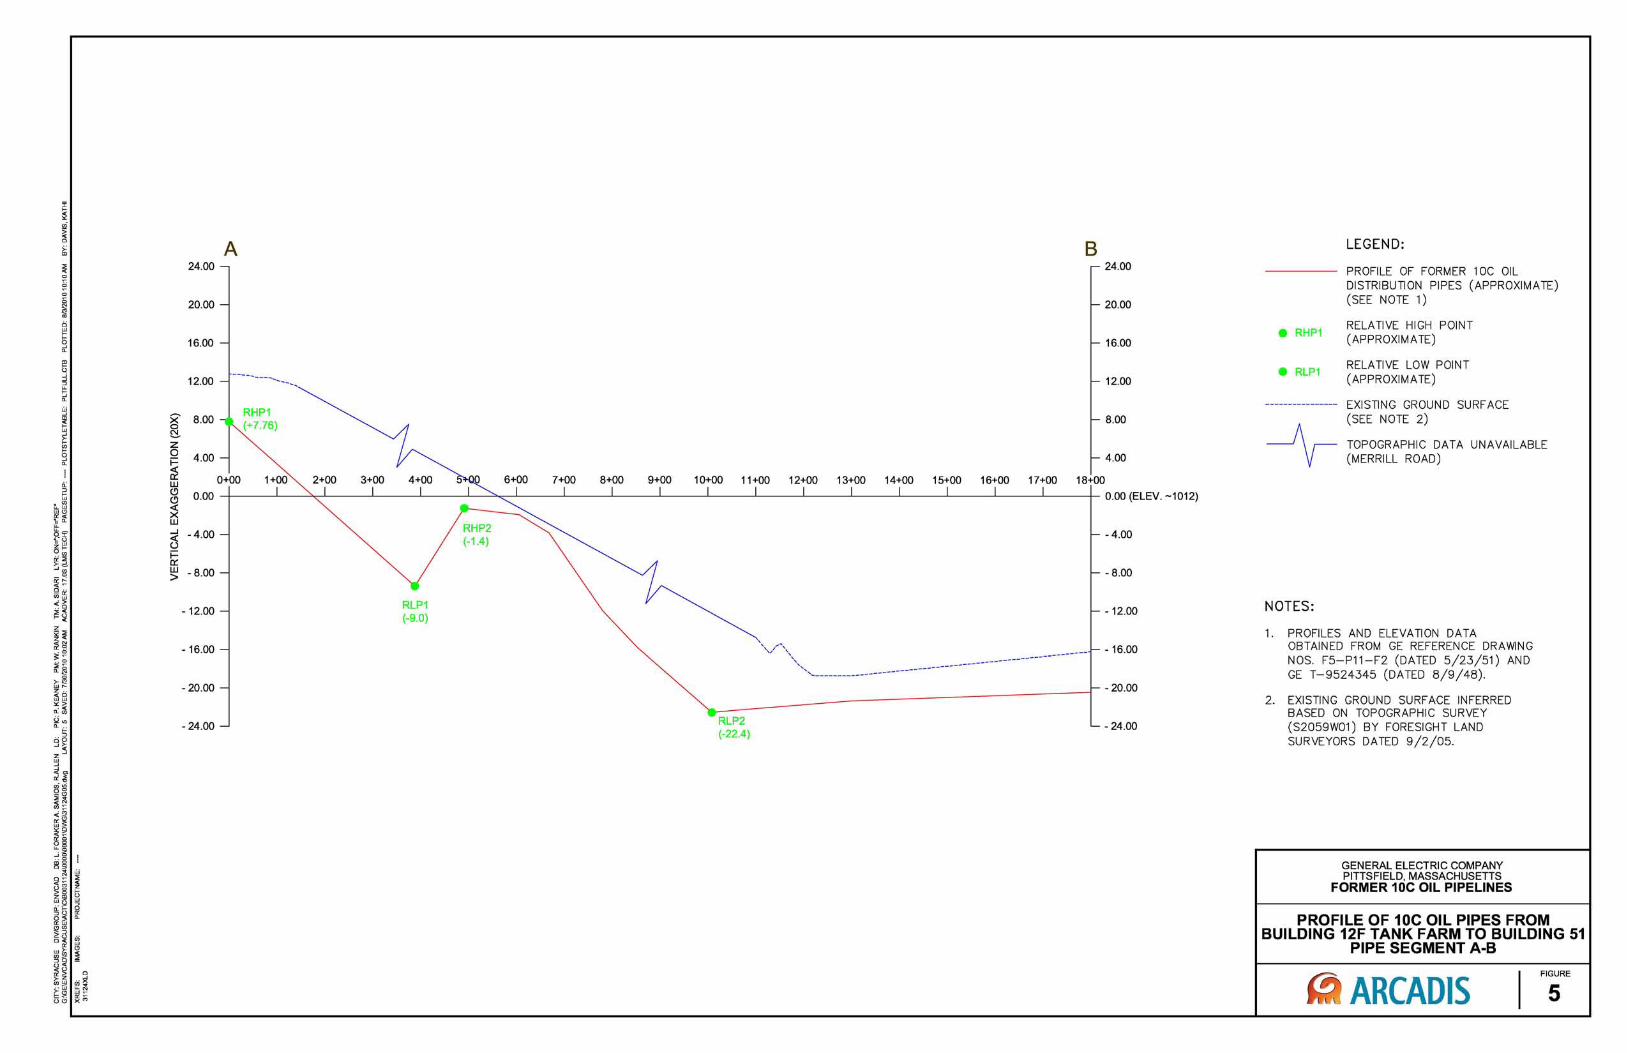
B. PROPOSED CLEANUP PLAN GE’s plan generally consists of accessing the pipes at various locations where access can be obtained; visually assessing the presence or absence of residual oil within the pipes; removing, containerizing, sampling, and disposing of any residual oil; and abandoning the remaining pipes in-place by filling the pipes and sealing the ends of the severed pipe openings and end points. In certain locations where physical access is impeded, as well as for overall documentation purposes, GE proposes to use video inspection to assess the presence or absence of residual oil within certain segments of the pipes. In addition, at the location north of Building OP-2 where the pipes are located above-grade and are readily accessible, GE proposes to remove such piping segments for proper off-site disposal. Additional information regarding this approach is presented below. Based on a review of historical mapping and other information regarding past pipe/oil removal activities, GE has identified several locations along the piping network at which physical access to the underground pipes will be attempted. Such locations (referred to as access points), are shown on Figures 1 through 4. Additional information on the specific activities that will be performed at each access point is included in Attachment 2. The access points were identified based on identification of relative high points and relative low points along the piping network. The relative low points are the most probable locations where any residual oil would have accumulated over the years, while the relative high points are ideal locations for filling (allowing slurry or grout material to flow downwards) and also serve as the opposite end of the vacuum that needs to be created in order to suction residual oil from the relative low points. A step-by-step summary of GE’s proposed oil investigation and removal methods is provided below. 1. Oil Investigation and Removal Steps: a. At each access point, GE will attempt to locate the pipe, using exploratory excavations and, if
necessary, survey control, ground penetrating radar (GPR), and/or similar equipment used for locating subsurface utilities. GE will make reasonable best efforts to locate all of the subsurface piping; however, several obstacles may preclude access to certain locations (e.g., possible variance between mapping and actual locations, proximity to active utilities, presence beneath public roads or other structures that cannot be disturbed, presence of piping at significant depth). Additionally, in certain instances, relative low points are located beneath areas that are inaccessible (i.e., relative low point 2 located beneath Merrill Road and relative low point 4 located beneath the Hill 78 OPCA). At these locations, GE has identified the next closest accessible location(s) for investigation purposes, and will utilize visual observations along with video inspection (discussed further below) to determine the presence of residual oil in the pipes.
b. Once located, the pipes will be cold-tapped and visually inspected to identify the presence or absence
of residual oil. Any residual oil will be removed. c. Oil removal will be performed by a combination of gravity draining and vacuuming at the accessible
piping low points. Oil that is removed will be properly containerized for subsequent off-site disposal. Samples of the residual oil will be collected for PCB analysis. As noted for step 1.a above, certain physical obstacles may preclude oil removal via vacuuming. For instance, air flow is necessary in order to create a vacuum to suction out residual oil/liquids. The vacuum is created by applying a suction hose at the down-gradient pipe opening and creating an opening at an up-gradient location, thus allowing air to travel through the pipe. If this step is performed, and air is not readily passing through the pipe and/or a vacuum is not created, it is possible that there may be one or more obstructions in the pipe disallowing air flow. In such an instance, gravity draining is still feasible but vacuuming/suctioning of the oil will be inhibited.
Mr. Dean Tagliaferro August 3, 2010
Page 6 of 10
G:\GE\GE_Pittsfield_Other-Misc\Reports and Presentations\Pipeline\2671011324Plan.doc
d. Lastly, the above-grade segment of pipe (approximately 500 linear feet) located north of Building OP-2 will be removed and containerized for proper off-site disposal. Any residual oil present within the removed piping will also be properly containerized for subsequent off-site disposal. Samples of the residual oil will be collected for PCB analysis. Each of the remaining pipe end points will be investigated via visual observations along with video inspection to determine the presence of residual oil. Any residual oil will be removed consistent with the procedures discussed in steps 1.b and 1.c above.
2. Documentation and Confirmation of Appropriate Oil Investigation/Removal Measures:
EPA has indicated its desire to verify that the appropriate oil investigation and removal measures have been undertaken before GE fills and caps the pipes. Accordingly, GE proposes the following measures to document and confirm the oil investigation/removal measures:
a. It would be impractical to physically access every single linear foot of the entire piping network for
investigation purposes. As discussed above, GE is targeting relative low points along the piping, since, if any residual oil is still present within the pipes, it would have accumulated at one or more of these relative low points over time. As such, determination of the presence or absence of residual oil within the pipes will be made based on observations at the various relative low points.
b. Confirmation of the presence/absence of residual oil at each access point, and subsequent removal of
any residual oil will be made through visual observations by GE personnel and on-site representatives of EPA.
c. At each access point, GE will collect photographs to document visual observations. Additionally, at
each pipe opening, GE will deploy a push camera (which is typically used for video inspection of pipes with a 6-inch diameter or less) to document the presence or absence of residual oil inside the pipes. The images captured by the camera during video inspection will be documented, as well as the horizontal coordinates and vertical depths of the piping (to the extent such information can be gathered from the video footage). The theoretical range of the push camera is approximately 300 linear feet; however, several physical constraints may inhibit successful video inspection. For instance, if residual oil is encountered during video inspection, further inspection will be discontinued in order to avoid fouling of the camera. Additionally, the capabilities and progress of the video inspection might be affected by valves, elbows, and other appurtenances potentially present within the pipeline.
It would not be practical or safe to leave the soil excavations at the various access points open for any extended period of time while awaiting EPA review and approval of documentation that the appropriate oil investigation/removal measures have been performed. Accordingly, to the extent that EPA desires to verify that the appropriate oil investigation/removal measures have been performed, it will be necessary for on-site EPA representatives to provide real-time concurrence with the performance of those activities prior to the subsequent pipe filling and capping activities (discussed below). 3. Procedures for Filling Pipes and Capping/Sealing All Pipe Openings: Following EPA concurrence that the appropriate oil investigation and removal measures have been performed, GE will proceed with filling the pipes and sealing all pipe openings, as described below.
Mr. Dean Tagliaferro August 3, 2010
Page 7 of 10
G:\GE\GE_Pittsfield_Other-Misc\Reports and Presentations\Pipeline\2671011324Plan.doc
a. GE will employ reasonable best efforts to fill as much of the pipes as possible utilizing the access points shown on Figures 1 through 4. The material that will be used to fill the pipes will be composed of a cement-bentonite slurry, non-shrink grout, and/or high-density polyurethane foam. At each access point, the fill will be injected until resistance is achieved – i.e., until no more of the fill can be pumped into the pipes at a particular location.
b. Following filling activities, all pipe openings will be capped or sealed with mechanical plumber’s
plugs and/or steel pipe caps. Following the pipe filling and capping/sealing activities, GE will submit final documentation summarizing all of the above-referenced activities. 4. Soil Management and Monitoring:
The management of on-site soils disturbed during the above-referenced activities, as well as related construction, sampling, and air monitoring activities, will be conducted consistent with the EPA-approved Project Operations Plan (POP; March 2007) for this Site. Such activities are outlined below. • Soil Excavation – Soil excavation activities will be performed consistent with the Site Management
Plan (Attachment C of the POP). Such activities generally include, but are not limited to, securing excavations that cannot be feasibly backfilled at the close of a work day with temporary construction fencing, covering temporary soil stockpiles with tarps to minimize the potential for rainfall to contact the stockpile, and cleaning all equipment that comes into contact with affected site media.
• Backfilling – GE will re-use excavated site soils as subsurface backfill, to the extent allowable, in accordance with the provisions outlined in Section 3.3 of the Soil Cover/Backfill Characterization Plan (Attachment B of the POP). GE will submit separately to EPA a summary of the existing soil sample locations associated with each proposed excavation. If, based on a review of the available data set, the spatial average PCB concentration of the candidate backfill material is below 25 ppm, the non-PCB data meet the evaluation criteria outlined in Section 3.2.2 of the POP, and the constituents in the material will not result in an exceedance of the applicable Performance Standards at the RAA in question, then the candidate material will be considered suitable for re-use as subsurface backfill (i.e., below the top foot).7 In addition, as allowed by Section 3.3 of the Soil Cover/Backfill Characterization Plan, in the event that such site material contains PCB levels at or above 25 ppm, GE may still propose to re-use such material as subsurface backfill, provided that a supporting rationale demonstrating that the use of such material will allow achievement of the applicable Performance Standards is submitted for EPA review and approval. The top foot of the excavation will be backfilled with clean fill from an outside source that has been characterized consistent with Section 3.2 of the Soil Cover/Backfill Characterization Plan, and the surface will be restored to match existing conditions. That is, unpaved vegetated areas will be seeded with similar vegetation, and paved areas will be re-paved.
7 All proposed excavations will occur within the confines of industrial portions of the GE Plant Area. Accordingly, the criteria used in evaluating the suitability of an on-site candidate fill material for use as subsurface backfill will be those that apply to the use of on-site soils as backfill in industrial/commercial areas – e.g.,, spatial average concentration of 25 ppm for PCBs, and Massachusetts Contingency Plan Method 1 S-2 (GW-2/GW-3) soil standards, along with the EPA Region 9 Preliminary Remediation Goals for industrial areas (as listed in an attachment to the CD), for non-PCB constituents.
Mr. Dean Tagliaferro August 3, 2010
Page 8 of 10
G:\GE\GE_Pittsfield_Other-Misc\Reports and Presentations\Pipeline\2671011324Plan.doc
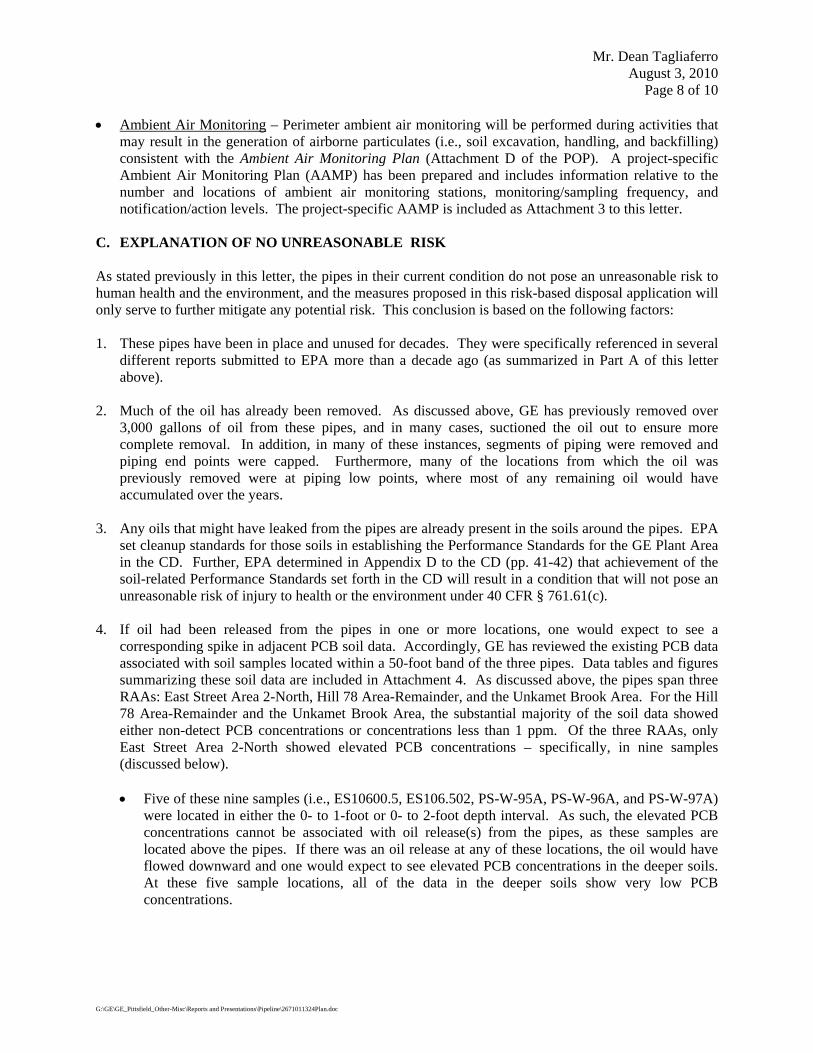
• Ambient Air Monitoring – Perimeter ambient air monitoring will be performed during activities that may result in the generation of airborne particulates (i.e., soil excavation, handling, and backfilling) consistent with the Ambient Air Monitoring Plan (Attachment D of the POP). A project-specific Ambient Air Monitoring Plan (AAMP) has been prepared and includes information relative to the number and locations of ambient air monitoring stations, monitoring/sampling frequency, and notification/action levels. The project-specific AAMP is included as Attachment 3 to this letter.
C. EXPLANATION OF NO UNREASONABLE RISK As stated previously in this letter, the pipes in their current condition do not pose an unreasonable risk to human health and the environment, and the measures proposed in this risk-based disposal application will only serve to further mitigate any potential risk. This conclusion is based on the following factors: 1. These pipes have been in place and unused for decades. They were specifically referenced in several
different reports submitted to EPA more than a decade ago (as summarized in Part A of this letter above).
2. Much of the oil has already been removed. As discussed above, GE has previously removed over 3,000 gallons of oil from these pipes, and in many cases, suctioned the oil out to ensure more complete removal. In addition, in many of these instances, segments of piping were removed and piping end points were capped. Furthermore, many of the locations from which the oil was previously removed were at piping low points, where most of any remaining oil would have accumulated over the years.
3. Any oils that might have leaked from the pipes are already present in the soils around the pipes. EPA set cleanup standards for those soils in establishing the Performance Standards for the GE Plant Area in the CD. Further, EPA determined in Appendix D to the CD (pp. 41-42) that achievement of the soil-related Performance Standards set forth in the CD will result in a condition that will not pose an unreasonable risk of injury to health or the environment under 40 CFR § 761.61(c).
4. If oil had been released from the pipes in one or more locations, one would expect to see a
corresponding spike in adjacent PCB soil data. Accordingly, GE has reviewed the existing PCB data associated with soil samples located within a 50-foot band of the three pipes. Data tables and figures summarizing these soil data are included in Attachment 4. As discussed above, the pipes span three RAAs: East Street Area 2-North, Hill 78 Area-Remainder, and the Unkamet Brook Area. For the Hill 78 Area-Remainder and the Unkamet Brook Area, the substantial majority of the soil data showed either non-detect PCB concentrations or concentrations less than 1 ppm. Of the three RAAs, only East Street Area 2-North showed elevated PCB concentrations – specifically, in nine samples (discussed below).
• Five of these nine samples (i.e., ES10600.5, ES106.502, PS-W-95A, PS-W-96A, and PS-W-97A)
were located in either the 0- to 1-foot or 0- to 2-foot depth interval. As such, the elevated PCB concentrations cannot be associated with oil release(s) from the pipes, as these samples are located above the pipes. If there was an oil release at any of these locations, the oil would have flowed downward and one would expect to see elevated PCB concentrations in the deeper soils. At these five sample locations, all of the data in the deeper soils show very low PCB concentrations.
Mr. Dean Tagliaferro August 3, 2010
Page 9 of 10
G:\GE\GE_Pittsfield_Other-Misc\Reports and Presentations\Pipeline\2671011324Plan.doc
• Of the remaining four samples with elevated PCB concentrations at depth, two (PS-W-95B at the 2- to 6-foot depth interval and PS-W-96C at the 6- to 10-foot depth interval) are located at the outer limits of the 50-foot band (i.e., between approximately 30 and 50 feet from the pipes), while another sample (PS-W-97) located much closer to the pipes, and linearly between the pipes and samples PS-W-95 and PS-W-96, showed only 0.54 ppm and 1.5 ppm in the 2- to 6-foot and 6- to 10-foot depth intervals, respectively. Again, if oil had been released from the pipes, it would have flowed downward. Based on the proximity of these samples to each other and the pipes, the trend in the data shows increasing PCB concentrations moving upward and away from the pipes, which is not a pattern one would expect to see if there had been an oil release in this location. Furthermore, these two samples (PS-W-95B and PS-W-96C) also had overlying surface samples (PS-W-95A and PS-W-96A, both in the 0- to 2-foot depth interval) with PCB concentrations several times higher than the samples at depth. Accordingly, the PCB concentrations in the deeper samples appear to be more attributable to a source emanating from the surface as opposed to the subsurface pipes.
• With respect to the remaining two samples with elevated PCB concentrations (RAA5-G34 and
RAA5-I23), their physical proximity to the pipes does not rule out potential influence by past oil release(s); however, the elevated PCB concentrations were primarily attributable to the presence of Aroclor 1254. The PCB data collected from the oil removed from the three pipes north of Building OP-2 (PRM6; October 7, 2009) showed only detections of Aroclor 1260. The variation in Aroclors indicates that the presence of PCBs is likely from different sources.
In short, a review of the existing PCB soil data along the pipeline corridor does not yield any reliable evidence of past PCB releases from these pipes to adjacent soil.
5. Following implementation of GE’s plan, any residual risk would be even further reduced by the
removal of additional oil (if present), filling of the pipes to further decrease the potential for mobilization of any residual oil, and capping/sealing the pipes to further reduce the potential for releases of any residual oil.
6. Further, even in the highly unlikely event that there were residual quantities of oil remaining
following implementation of GE’s plan and such residual oil were released from the pipes, any resultant impacts to groundwater would be addressed by GE’s ongoing implementation of the long-term groundwater and non-aqueous-phase liquid (NAPL) monitoring programs required by the CD.
7. In developing this plan for addressing these pipes, GE reviewed the TSCA regulations and
determined that the provisions for abandoning natural gas pipelines contaminated with PCBs at concentrations ≥ 50 ppm, as outlined in 40 CFR § 761.60(b)(5), were the most analogous to the present situation. This plan for addressing the pipes is consistent with those provisions – which require, for in-place abandonment of pipes with a nominal inside diameter of 4 inches or less, removal of free-flowing liquids, filling the pipes in place, and capping the pipe ends. EPA concluded that these procedures for abandoning natural gas pipelines pursuant to TSCA do not result in an unreasonable risk. (In addition, the long-term monitoring required by the CD, as referenced in Item 6 above, goes beyond TSCA’s provisions for abandoning natural gas pipelines.)
These factors clearly demonstrate that the pipes do not pose an unreasonable risk in their current state and that implementation of GE’s plan will further mitigate any potential remaining risk.
Please feel free to contact me at (413) 448-5902 with any questions or comments.
Sincerely,
Michael T. Carroll Manager, Pittsfield Remediation Programs
Attachments
cc: T. Conway, EPA H. Inglis, EPA R. Howell, EPA * M. Gorski, MDEP* E. Tor, MDEP* J. Ziegler, MDEP (2 copies) L. Palmieri, Weston (2 copies) R. McLaren, GE* R. Gates, GE J. Bieke, Goodwin Procter C. Bell, Sidley Austin S. Gutter, Sidley Austin J . Nuss, ARCADIS M. Hassett, ARCADIS GE Internal Repositories
(* without attachments)
G:\GE\GE_PillsficJd_ Othcr·Misc\Reports and Prescntalions\Pipelinc\267 to I I 324Plan.doc
Mr. Dean Tagliaferro August 3,2010
Page 10 of 10

Figures
~METBROOK (~S~~ FIGURES 4 AND 8)
\
~
~ .]I '" ° § ~ ti w
5 a'
~ ~ ~ "-w
~ ~ ./
~ 9 "-u. 0 "-~ 0 ~
" a: ::l .... W en w
" < "-
0-i,~5 Zw 0 .... &~ ~d
en
~~ 0 ..
~ffi <> ~5i! .... :/ z H ~;n ~~ I ::Eo "-~ I ~~ <w I w> ~~ "- I ~~
I 0 9; III I >
I ~~
------------- - - c:::J
"'.-'
I ZO w"
~~ "'5:1 ffi~ ~@ ",0 0° ~9 ~g ",0 09
W ~ o~ ::; <~ ':! ,,8
~ t; w (3
"' Gi "-en ::l
" cii < w "' " ~ ~ 1'i <
" ~ :ll ~ 'i2 w
"' " x
LEGEND:
----- APPROXIMATE LOCATION OF FORMER 10C OIL DISTRIBUTION PIPES (SEE NOTE 2)
PRM1 II
ARHP1 RLP1 RHP1' RLP1' AP1
STATION REFERENCE AT APPROXIMATE 100-FOOT INTERVALS
PRIOR REMOVAL MEASURE LOCATION (APPROXIMATE)
EXACT LENGTH OF PIPE SEGMENT ADDRESSED BY PRM UNKNOWN AND/OR APPROXIMATED
PROFlLE SEGMENT 10; A-D: (2) 4" PIPES AND (1) 2" PIPE A'-B': (1) 2" PIPE
RELATIVE HIGH POINT (APPROXIMATE): PROFILE SEGMENT A-D
RELATIVE LOW POINT (APPROXIMATE): PROFlLE SEGMENT A-D
RELATIVE HIGH POINT (APPROXIMATE): PROFILE SEGMENT A'-B'
RELATIVE LOW POINT (APPROXIMATE): PROFlLE SEGMENT A'-B'
ACCESS POINT (APPROXIMATE)
LOW POINT OF PIPE SEGMENT TO BE PHYSICALLY ACCESSED AND INSPECTED FOR RESIDUAL OIL; OIL TO BE DRAINED/VACUUMED (IF PRESENT); PHOTO/VIDEO DOCUMENTATION TO BE COLLECTED FOR CONFIRMATION
• •••• VIDEO INSPECTION TO BE USED FOR INVESTIGATION PURPOSES (SEE NOTE 4)
PIPE TO BE REMOVED (ABOVE-GROUND)
NOTES:
1. BASE MAP INFORMATION PRESENTED ON THIS FIGURE WAS ADOPTED FROM A SURVEY PREPARED BY HILL ENGINEERS, DRAWING NO. GE-lll0-003-CX10l-M (8/1/07), GE-lll0-CX10l-M (9/5/09), AND GE-1110-CX102 (6/14/07).
2. PIPING LOCATIONS SHOWN HEREON ARE APPROXIMATE (NOT BASED ON SURVEY, AS SUCH DATA IS NOT AVAILABLE) AND WERE COMPILED FROM VARIOUS DRAWINGS IN GE'S RECORDS AS WELL AS Irs ASSESSMENT OF POTENTIAL PREFERENTIAL PATHWAY REPORTS DATED JUNE 1996, NOVEMBER 1996, MARCH 1997, AND JULY 1997.
3. NOT ALL PHYSICAL FEATURES SHOWN ,
4. PRESENCE/LOCATION OF PIPEUNES ALONG THIS SEGMENT IS UNKNOWN,
220' 400'
GRAPHIC SCALE
GENERAL ELECTRIC COMPANY PITTSFIELD, MASSACHUSETTS
FORMER 10C OIL PIPELINES
FORMER PIPELINES - FORMER BUILDING 12F TANK FARM TO
BUILDINGS 9 & 51
FIGURE
ARCADIS 1
~ UJ 0: X
LEGEND:
•••• • • •• REMOVAL ACTION AREA BOUNDARY
OPEN SOIL/VEGETATED AREA
PAVED AREA
_ BUILDING
9 BUILDING 10
II
- , - , - , - , - STORM SEWER
- , - , - , - , - SANITARY SEWER
- . - . - . - . - WATER MAIN/FlRE PROTECTION MAIN
-- ,,-- ,,-- STEAM LINE
¢
o @
.:0'
NATURAL GAS MAIN
ELECTRIC/TELEPHONE CONDUIT
LIGHT POLE
CATCH BASIN
DRAIN MANHOLE
UTIUTY POLE
GAS VALVE
FIRE HYDRANT
WA TER SHUTOFF
10+00
PRM6
A-
APPROXIMATE LOCATION OF FORMER 10C OIL DISTRIBUTION PIPES (SEE NOTE 2)
EXACT LENGTH OF PIPE SEGMENT ADDRESSED BY PRM UNKNOWN AND/OR APPROXIMATED
STATION REFlERENCE AT APPROXIMATE 100-FOOT INTERVALS
PRIOR REMOVAL MEASURE LOCATION (APPROXIMA TE)
PROFILE SEGMENT 10; A-D: (2) 4" PIPES AND (I) 2" PIPE A'-B': (I) 2" PIPE
RELATIVE HIGH POINT (APPROXIMATE): PROFILE SEGMENT A-D
RELATIVE LOW POINT (APPROXIMATE): PROFILE SEGMENT A-D
RELATIVE HIGH POINT (APPROXIMATE): PROFILE SEGMENT A' -B'
FORMER BUILDING 12F TANK FARM (PRM1)
PRM5
R . e r \
NOTES:
1. BASE NAPPING FROM TOPOGRAPHIC SURVEY (DRAWING S2059WOI) BY FORESIGHT LAND SURVEYORS DATED 2/9/05.
2. PIPING LOCATIONS SHOWN HEREON ARE APPROXIMATE (NOT BASED ON SURVEY, AS SUCH DATA IS NOT AVAILABLE) AND WERE COMPILED FROM VARIOUS DRAWINGS IN GE'S RECORDS AS WELL AS ITS ASSESSMENT OF POTENTIAL PREFERENTIAL PATHWAY REPORTS DATED JUNE 1996, NOVENBER 1996, MARCH 1997, AND JULY 1997.
3. NOT ALL PHYSICAL FEATURES SHOWN.
RLP2
GRAPHIC SCALE
.J
o
AP3
120' ,
-v L
GENERAL ELECTRIC COMPANY PITTSFIELD, MASSACHUSETTS
FORMER 10C OIL PIPELINES
EAST STREET AREA 2 - NORTH -PIPE SEGMENTS A-B AND A"-B"
(SEE FIGURES 5 AND 6 FOR PROFILE)
ARCADIS FIGURE
2
I t-;:! qj :1( 0
~
~ '" :g 0
§ ~ 0 w
5 a'
~ ~ ~ "-w
~ ~ ~ 9 "-"-0 "-~ 0 ~
" a: ::l t-w en w
" < "-
I " w t-en ~ en
~~ i.1i: "-w "-> qo i! c(
a~ ~~ -'", _C;:! ",0 <~ 00 000 ~~ ~~
w
i~ ~M ;i§i ~~ "-s >-w z
~~ a.:q .. M ,,0 -" O-~
o~ -'~ eng Q~
~§ en9 ..(:5 "0
~~ w 0:= ::; <M ':! ,,0 >0 t; z!!l
~~ w (3
"' 6~ "-
Q~ 2" o~
w~ ~~ "" ~~ ;! ~!!l x
~~ ~
"" M
RHP5 RLP4
PRMS 2 &4
RHP4 AP6
NOTES:
I . MAPPING BASED ON ELECTRONIC SURVEY BY FORESIGHT LAND SERVICES, flUE NO. S2149W01.DWG. DATIED 3/16/06 AND SURVEY BY D.R. BIWNGS, INC .. FILE NO. 070105-AB-SEWER-DRAIN. DATIED 4/22/09. UTILITY LOCATIONS BASED ON AVAILABUE RECORD DATA AND VlSIBUE FlELD EVIDENCE AND ARE NOT REPRESENTIED AS BEING EXACT OR COMPLETIE.
2. PIPING LOCATIONS SHOWN HEREON ARE APPROXIMA TIE (NOT BASED ON SURVEY, AS SUCH DATA IS NOT AVAILABUE) AND WERE COMPILED FROM VARIOUS DRA'MNGS IN GE'S RECORDS AS WELL AS ITS ASSESSMENT OF POTIENTIAL PREFERENTIAL PATHWAY REPORTS DATIED JUNE 1996, NOVEMBER 1996, MARCH 1997, AND JULY 1997.
3. NOT ALL PHYSICAL FEATURES SHOWN.
KII-7-2
•
o
r---------, , I , ,
21+00
PRM5
BRHP3 RLP3 AP4
LEGEND:
PROPERTY 10
HILL 78 AREA-REMAINDER REMOVAL ACTION AREA BOUNDARY
HILL 78 AND BUILDING 71 CONSOLIDATION AREAS (NOT PART OF HILL 78 AREAREMAINDER RAA)
PROPERTY LINE
EASEMENT LINE
FENCE LINE
EDGE OF SWAUE
EDGE OF WOODS
LIGHT POLE
UTILITY POLE
BUSH/TREE/SHRUB
GAS MARKER
MANHOUE
SANITARY MANHOLE
CATCH BASIN
DRAIN MANHOLE
ELECTRIC MANHOLE
WATIER VALVE
FIRE HYDRANT
STORM SEWER (DRAINAGE) LINE
UNDERGROUND EUECTRIC LINE
SANITARY LINE
WATIER LINE
GAS LINE
ABANDONED STORM SEWER (DRAINAGE) LINE (TAKEN OUT OF SERVICE AND GROUTIED)
ABANDONED SANITARY LINE (TAKEN OUT OF SERVICE AND GROUTIED)
BUILDING/STRUCTURE
DEMOLISHED BUILDING
GE-OWNED PAVED AREA
OPEN SOIL/VEGETATIED AREA
APPROXIMATIE LOCATION OF FORMER lac OIL DISTRIBUTION PIPES (SEE NOTIE 2)
STATION REFERENCE AT APPROXIMATIE lOa-FOOT INTIERVALS
PRIOR REMOVAL MEASURE LOCATION (APPROXIMATIE)
EXACT UENGTH OF PIPE SEGMENT ADDRESSED BY PRM UNKNOWN AND/OR APPROXIMA TIED
PROFIUE SEGMENT 10; A-D: (2) 4" PIPES AND (I) 2" PIPE A'-B': (I) 2" PIPE
RELATIVE HIGH POINT (APPROXIMATIE): PROFIUE SEGMENT A-D
RELATIVE LOW POINT (APPROXIMATIE): PROFIUE SEGMENT A-D
ACCESS POINT (APPROXIMATIE)
100' 200'
GRAPHIC SCALE
GENERAL ELECTRIC COMPANY PITTSFIELD, MASSACHUSETTS
FORMER 10C OIL PIPELINES
HILL 78 AREA - REMAINDERIOPCAS PIPE SEGMENT B-C
(SEE FIGURE 7 FOR PROFILE)
ARCADIS FIGLIRE
3
I RHP7 AP10 t-
;:! qj
RLP6 :1( 0
~
~ '" :g 0
§ ~ 0 w
AP9 5 a'
~ ~ ~ "-w
~ ~ ~ 9 "-"-0 "-~ 0 ~
" a: ::l t-w en w
" < "-
I " w t-en ~ en
~~ i.1i: "-w "-> qo il c(
a~ ~~ .... ",
_C;:! ",0 <~ 00 000 ~~ ~~
w
i~ ~ .. ;i§i ~~ "-s >-w z
~~ a.:q Q8 O-~
o~ .... ~ eng Q~
~§ en9 ..(:5 "0
~~ w 0:= ::; <<'> ':! ,,0 >0 t; z!!l
~~ w (3
"' 6~ "-
Q~ 2" o~
w~ ~~ "" ~~ ~!!l ~~ ""
RLP7 PRM3
NOTES:
1. THE BASE MAP FEATURES PRESENTED ON THIS FIGURE ARE FROM EUECTRONIC COPY OF SURVEY DRA'MNG GE-Ill0-003-CX101 M(REV 8-1-07) PROVIDED BY HILL ENGINEERS, ARCHITECTS AND PLANNERS.
2. HORIZONTAL DATUM IS NAD 27 AND VERTICAL DATUM IS NGVO 29 BASED UPON CONTROL POINTS PROVIDED BY ARCADIS AND FORESIGHT LAND SERVICES.
3. THE BOUNDARY LINE INFORMATION SHOWN HEREON WAS PROVIDED BY FORESIGHT LAND SERVICES AND IS NOT THE RESULT OF A RETRACEMENT SURVEY PREPARED BY HILL ENGINEERS, ARCHITECTS, PLANNERS, INC.
4. UTILITIES SHOI'oN ARE BASED ON DRAWINGS PROVIDED BY GENERAL DYNAMICS FACILITIES MANAGER. SOME OF THE DRA'MNGS ARE UNTITLED AND DATE BACK TO THE 1940'S. UPDATES OR MODIFICATIONS TO THE FACIUTY MAY HAVE RESULTED IN REROUTING OR ADDITIONS TO UTILITIES THAT HAVE NOT BEEN SHOI'oN. THEREFORE UTILITIES SHOI'oN SHOULD BE CONSIDERED APPROXIMATE AND PRIOR TO ANY CONSTRUCTION, THE CONTRACTOR SHOULD CONTACT "DIG-SAFE" AND HAVE ALL UNDERGROUND UTIUTIES MARKED ON THE GROUND.
5. BUILDINGS OP-l AND OP-2 MAKE-UP PARCEL KII-7-46 WHILE THE LAND THESE BUILDINGS ARE CONSTRUCTED ON IS PART OF PARCEL KII-7-2.
6. PIPING LOCATIONS SHOI'oN HEREON ARE APPROXIMATE (NOT BASED ON SURVEY, AS SUCH DATA IS NOT AVAILABLE) AND WERE COMPIUED FROM VARIOUS DRAWINGS IN GE'S RECORDS AS WELL AS ITS ASSESSMENT OF POTENTIAL PREFERENTIAL PATHWAY REPORTS DATED JUNE 1996, NOVEMBER 1996, MARCH 1997, AND JULY 1997.
7. NOT ALL PHYSICAL FEATURES SHOI'oN.
K11-7-2
1111 11111 11111 11 11111111 11 11111111
LEGEND:
PORTION OF REMOVAL ACTION AREA SHOI'oN ON THIS FIGURE
PROPERTY UNE
EASEMENT
PROPERTY IDENTIFlCATION
BOLLARD
SIGN
LIGHT POLE
GROUND LIGHT
UTIUTY POUE
CATCH BASIN
CATCH BASIN - ROUND
DRAIN MANHOLE
SANITARY MANHOLE
EUECTRIC MANHOUE
MANHOLE (TYPE UNKNOI'oN)
WATER SHUT-OFF/GATE
HYDRANT
PRESSURE INDICATOR VALVE
METAL FENCE
CHAIN UNK FENCE
ABANDONED RAILROAD TRACKS
GUARDRAIL
OVERHEAD STEAMUNES
EUECTRIC SERVICE
-------<--0-- GAS SERVICE
WATER SERVICE
SANITARY SEWER
STORM DRAIN
-,"--,"- OVERHEAD WIRES
- - - -,~- - - - EXISTING CONTOUR
.~. EDGE OF BUSHES,lHEDGE
36+00
PRM3 c
RHP6 RLP6 AP10
BUILDING
PAVED AREA
UNPAVED AREA
APPROXIMATE LOCATION OF FORMER 10C OIL DISTRIBUTION PIPES (SEE NOTE 6)
EXACT LENGTH OF PIPE SEGMENT ADDRESSED BY PRM UNKNOI'oN AND/OR APPROXIMATED
STA TION REFERENCE AT APPROXIMATE 100-FOOT INTERVALS
PRIOR REMOVAL MEASURE LOCATION (APPROXIMATE)
PROFlUE SEGMENT ID; A-D: (2) 4" PIPES AND (I) 2" PIPE A' -B': (1) 2" PIPE
RELATIVE HIGH POINT (APPROXIMATE): PROFlUE SEGMENT A-D
RELATIVE LOW POINT (APPROXIMATE): PROFlUE SEGMENT A-D
ACCESS POINT (APPROXIMATE)
'00' 200'
GRAPHIC SCALE
GENERAL ELECTRIC COMPANY PITTSFIELD, MASSACHUSETTS
FORMER 10C OIL PIPELINES
UNKAMET BROOKPIPE SEGMENT C-D
(SEE FIGURE 8 FOR PROFILE)
ARCADIS FIGURE
4
24.00
20.00
16.00
12.00
X 8.00 0 ~ z 0 4.00 i= ~ w <9 0.00 <9 « >< w ...J -4.00 « ()
i= 0:: w - 8.00 >
- 12.00
- 16.00
- 20.00
- 24.00
A 8 24.00
20.00
16.00
----... _--- ... 12.00
RHP1 (+7.76) 8.00
4.00
0+00 18+00 -+ __ --'-_~....I....----'-----'------''--.....:::....;:___'----'------'-----'----'---....I....----'-----L..-----'----1.----'------'---_+_ 0.00 (ELEV. -1012)
RLP1 (-9.0)
RHP2 (-1 .4)
RLP2 (-22.4)
, ' ... , .............. ' ......
-4.00
-8.00
- 12.00
- 16.00
"" ......... _--------------------------------------------------
- 20.00
- 24.00
LEGEND:
PROFILE OF FORMER 10C OIL DISTRIBUTION PIPES (APPROXIMATE) (SEE NOTE 1)
• RHP1
• RLP1
NOTES:
RELATIVE HIGH POINT (APPROXIMATE)
RELATIVE LOW POINT (APPROXIMATE)
EXISTING GROUND SURFACE (SEE NOTE 2)
TOPOGRAPHIC DATA UNAVAILABLE (MERRILL ROAD)
1. PROFILES AND ELEVATION DATA OBTAINED FROM GE REFERENCE DRAWING NOS. F5-P11-F2 (DATED 5/23/51) AND GE T-9524345 (DATED 8/9/48) .
2. EXISTING GROUND SURFACE INFERRED BASED ON TOPOGRAPHIC SURVEY (S2059W01) BY FORESIGHT LAND SURVEYORS DATED 9/2/05.
GENERAL ELECTRIC COMPANY PITTSFIELD, MASSACHUSETTS
FORMER 10C OIL PIPELINES
PROFILE OF 10C OIL PIPES FROM BUILDING 12F TANK FARM TO BUILDING 51
PIPE SEGMENT A-B
FIGURE
ARCADIS 5
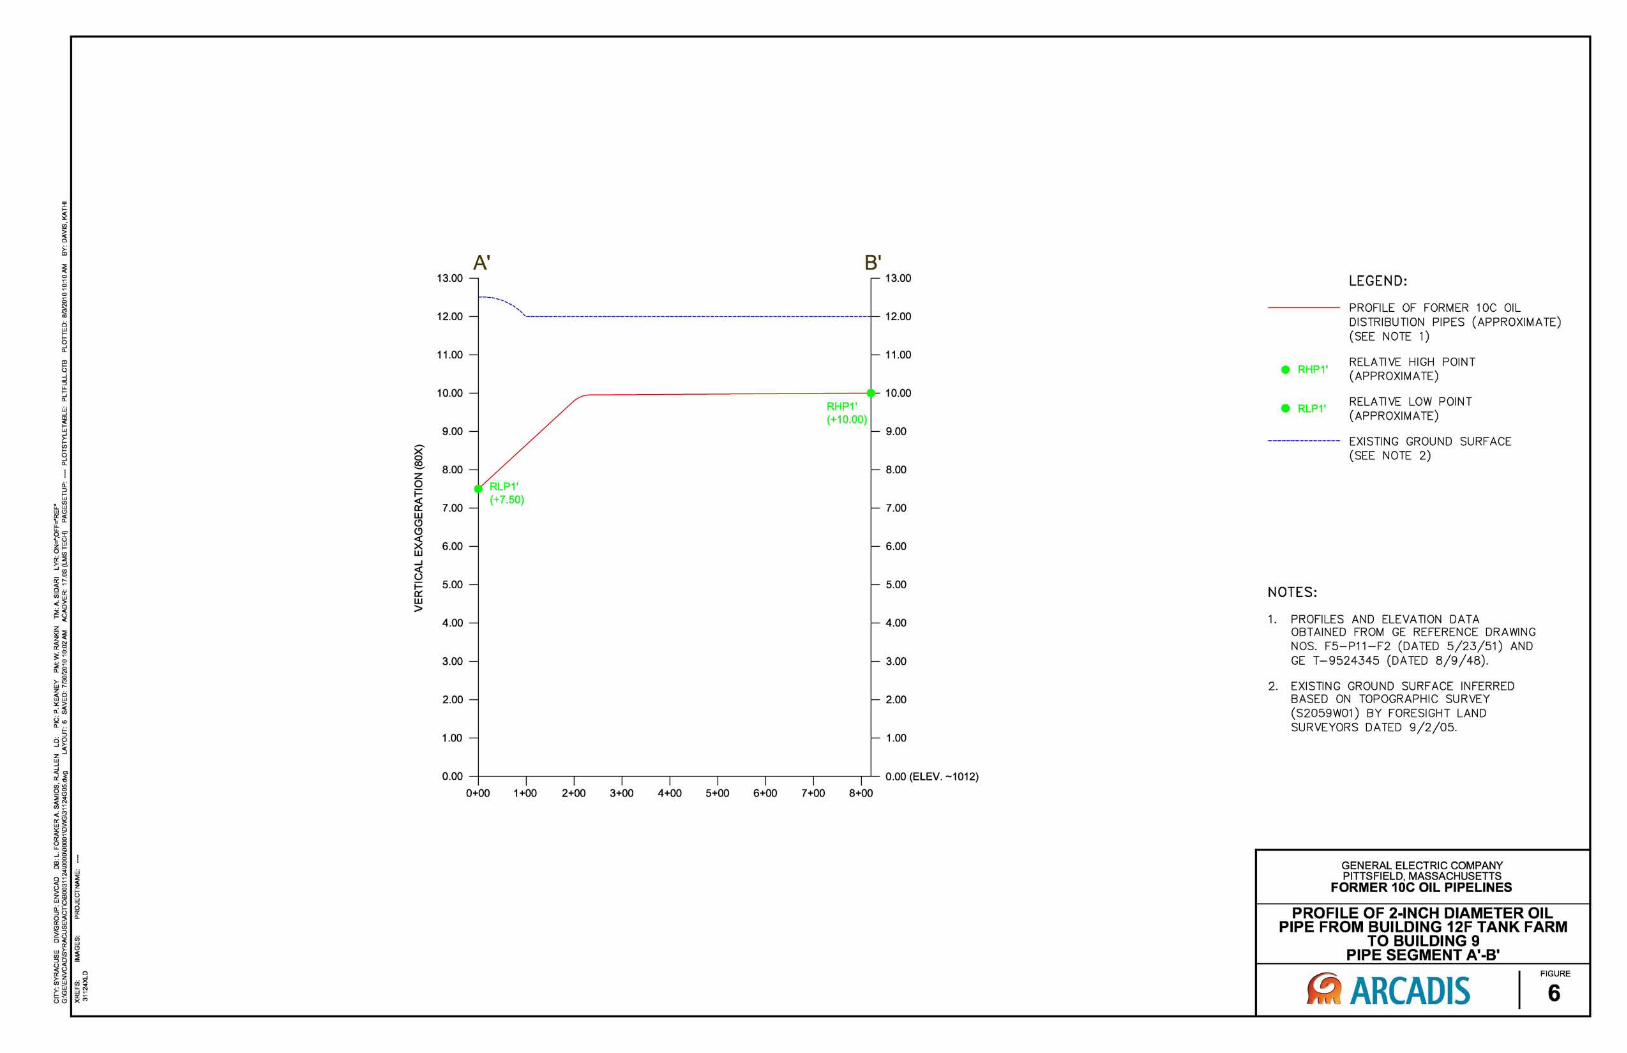
A' 8' 13.00 - - 13.00 LEGEND:
-----.......... " PROFILE OF FORMER 10C OIL
12.00 - ,---------------------------------------------------------------------------- - 12.00 DISTRIBUTION PIPES (APPROXIMATE) (SEE NOTE 1)
11 .00 - - 11 .00 RELATIVE HIGH POINT • RHP1' (APPROXIMATE)
10.00 - 10.00 RHP1' • RLP1'
RELATIVE LOW POINT
(+10.00) (APPROXIMATE) 9.00 - - 9.00
---------------- EXISTING GROUND SURFACE X (SEE NOTE 2) 0 ~ 8.00 - - 8.00 z 0
• RLP1' i= ~ 7.00 -
(+7.50) - 7.00
w <9 <9 «
6.00 - - 6.00 >< W ...J « ()
i= 5.00 - - 5.00 NOTES: a::
w >
4.00 - - 4.00 1. PROFILES AND ELEVATION DATA OBTAINED FROM GE REFERENCE DRAWING NOS. F5-P11-F2 (DATED 5 / 23/51) AND
3.00 - - 3.00 GE T -9524345 (DATED 8/9/48) .
2. EXISTING GROUND SURFACE INFERRED 2.00 - - 2.00 BASED ON TOPOGRAPHIC SURVEY
(S2059W01) BY FORESIGHT LAND
1.00 - - 1.00 SURVEYORS DATED 9/2/05.
0.00 I I I I I I I I 0.00 (ELEV. -1012)
0+00 1+00 2+00 3+00 4+00 5+00 6+00 7+00 8+00
! GENERAL ELECTRIC COMPANY
Ui PITTSFIELD, MASSACHUSETTS ::; ':! FORMER 10C OIL PIPELINES t; UJ
(3 PROFILE OF 2-INCH DIAMETER OIL '" "-
PIPE FROM BUILDING 12F TANK FARM cii TO BUILDING 9 UJ
'" PIPE SEGMENT A'-B' ~
I FIGURE
~ ARCADIS 6 UJ
. '" x
36.00
32.00
~ .;; 0 28.00 § ~ ti
24.00 w
5 a'
~ 20.00 ~ ~ CL
w 16.00
~ ~ X 12.00 ~ 0 9 ~ CL
Z 0 8.00 a: i= ::l ... ~ w en w W " < <9 4.00 CL <9
I « " >< w ... W en ...J 0.00 ~ « gj ()
ii:"": i= <~ a:: Q& w -4.00 enw ..(> > .. 0
~~ z ~~ - 8.00 C:;~ ;i~ .. 0 ::; ~
(L~ - 12.00 >-<1 w .... z .. U'iiil ><> ~~ - 16.00 QI'--CL ••
S "0 9; - 20.00
f :g - 24.00 " ~
~ 9 § @:
i w ::;
M ':!
~ t; w (3
'" Gi CL
en ::l
" cii < w '" ~ " 1'i ~ < " ~ :ll ~ 'i2 w
'" " x
B
SEE NOTE 3
--"" ... -",-""", ",,"-----........... RHP4 ",--",,,,
;' " \ (+12.0) (------'/
: '\ / , , , I "\ !
,/ '\ ,--"''''-----------__ 1 " \\\ . " \ r-----------------, "
/ \ : ',j / \ : " , , , , , , ,
,,/ '\ "
RHP6 (+29.1)
c 36.00
32.00
28.00
24.00
20.00
16.00
12.00
8.00
4.00
I \ ~ -+----,----,-----fT----,I--,------,,------,---'M------r-----.----.---~, --f------,----.----,----,---+.----,------,,------,--_+_ 0.00 (ELEV. -1012)
18+00 28;.00'-'
.... ----, ------------_./
RLP4 (-14.4)
1'-'
RHP5 (-5.1 ) RLP5
(-6.3)
38+00
-4.00
-8.00
- 12.00
- 16.00
- 20.00
- 24.00
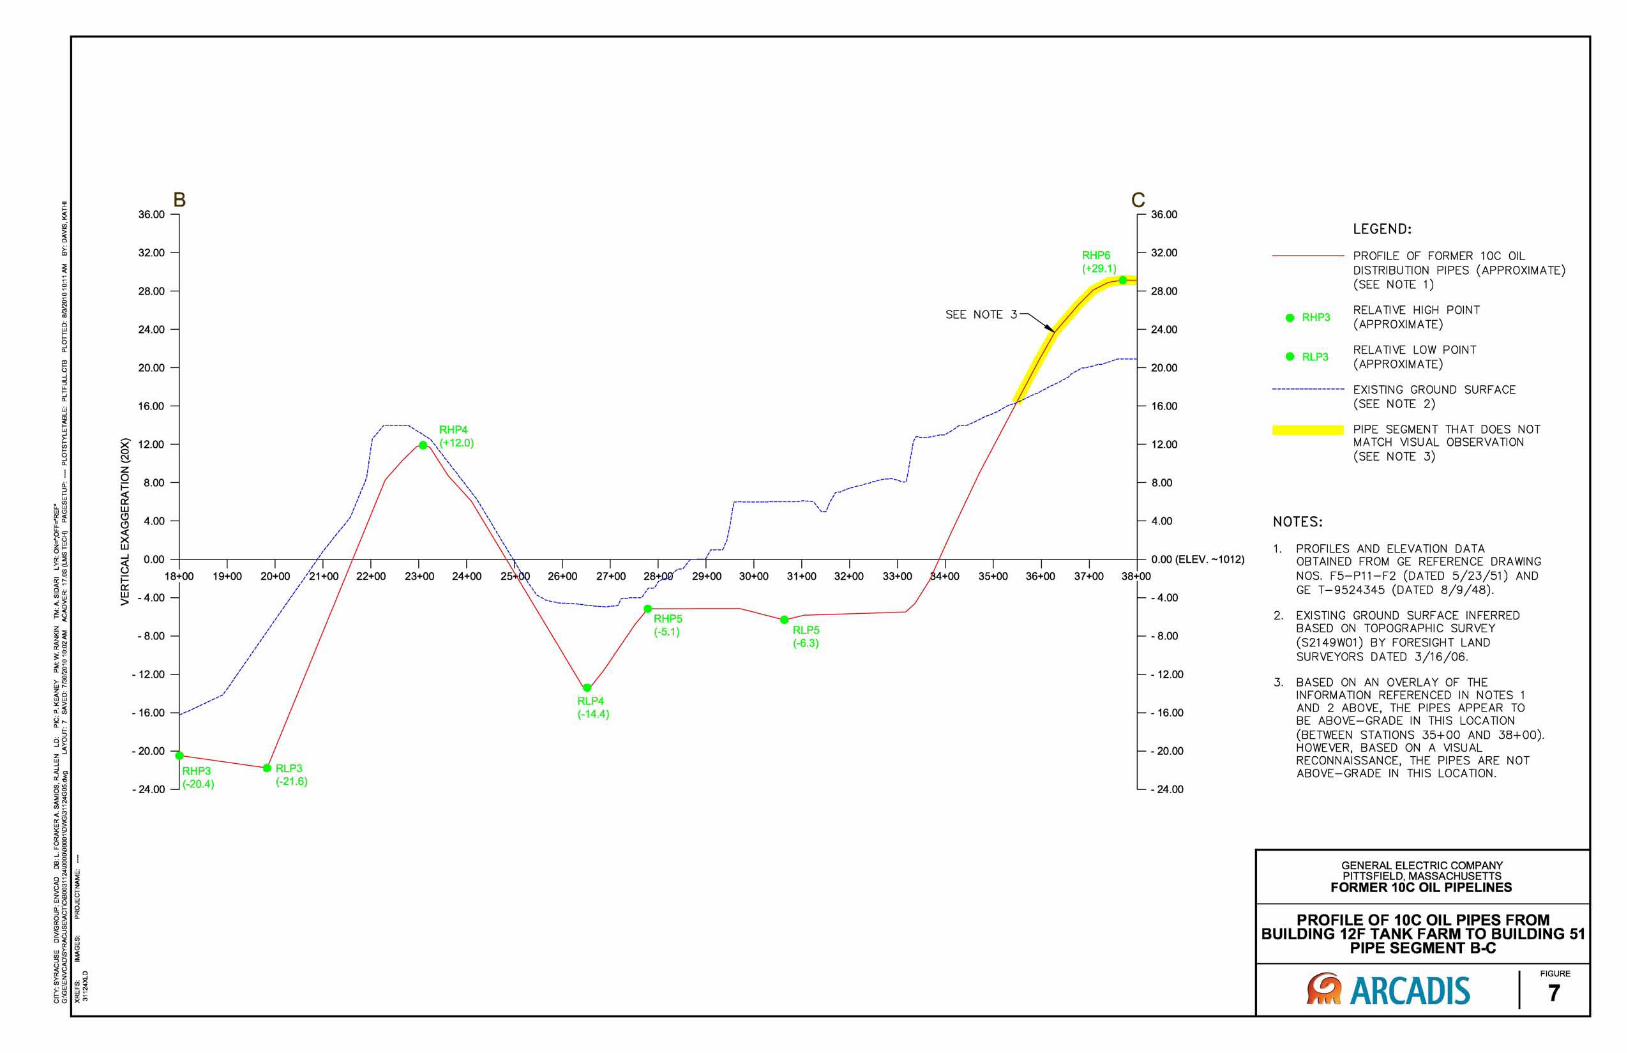
LEGEND:
PROFILE OF FORMER 10C OIL DISTRIBUTION PIPES (APPROXIMATE) (SEE NOTE 1)
• RHP3
• RLP3
NOTES:
RELATIVE HIGH POINT (APPROXIMATE)
RELATIVE LOW POINT (APPROXIMATE)
EXISTING GROUND SURFACE (SEE NOTE 2)
PIPE SEGMENT THAT DOES NOT MATCH VISUAL OBSERVATION (SEE NOTE 3)
1. PROFILES AND ELEVATION DATA OBTAINED FROM GE REFERENCE DRAWING NOS. F5-P11-F2 (DATED 5/23/51) AND GE T -9524345 (DATED 8 / 9 / 48).
2. EXISTING GROUND SURFACE INFERRED BASED ON TOPOGRAPHIC SURVEY (S2149W01) BY FORESIGHT LAND SURVEYORS DATED 3/16/06 .
3. BASED ON AN OVERLAY OF THE INFORMATION REFERENCED IN NOTES 1 AND 2 ABOVE, THE PIPES APPEAR TO BE ABOVE-GRADE IN THIS LOCATION (BETWEEN STATIONS 35+00 AND 38+00) . HOWEVER, BASED ON A VISUAL RECONNAISSANCE, THE PIPES ARE NOT ABOVE-GRADE IN THIS LOCATION.
GENERAL ELECTRIC COMPANY PITTSFIELD, MASSACHUSETTS
FORMER 10C OIL PIPELINES
PROFILE OF 10C OIL PIPES FROM BUILDING 12F TANK FARM TO BUILDING 51
PIPE SEGMENT B-C
ARCADIS FIGURE
7
32.00
28.00
24.00
20.00
X 16.00 & z 0 12.00 i= ~ w <9 8.00 <9 « >< w ...J 4 .00 « ()
i= a::: w 0.00 >
-4.00
- 8.00
- 12.00
- 16.00
c
SEE NOTE 3
--------- ------------....... , I I I I I
SEE NOTE 4
----------::.:::::: -::::~::::::::.-""'-""'--"...~ ~~~ ~~-- ,/', ......
RLP6 - -::::-::::-:! "\ (-0.5) \_
0 32.00
28.00
24.00
20.00
16.00
12.00
8.00
4 .00
-+---.----.---.---.------,,-----r-----"'''''''',,L--------r---'l---.-----c...::,' "<::--.----.---.---t- 0.00 (ELEV. -1012)
38+00 51+00
RLP7 (-13.8)
-4.00
-8.00
- 12.00
- 16.00
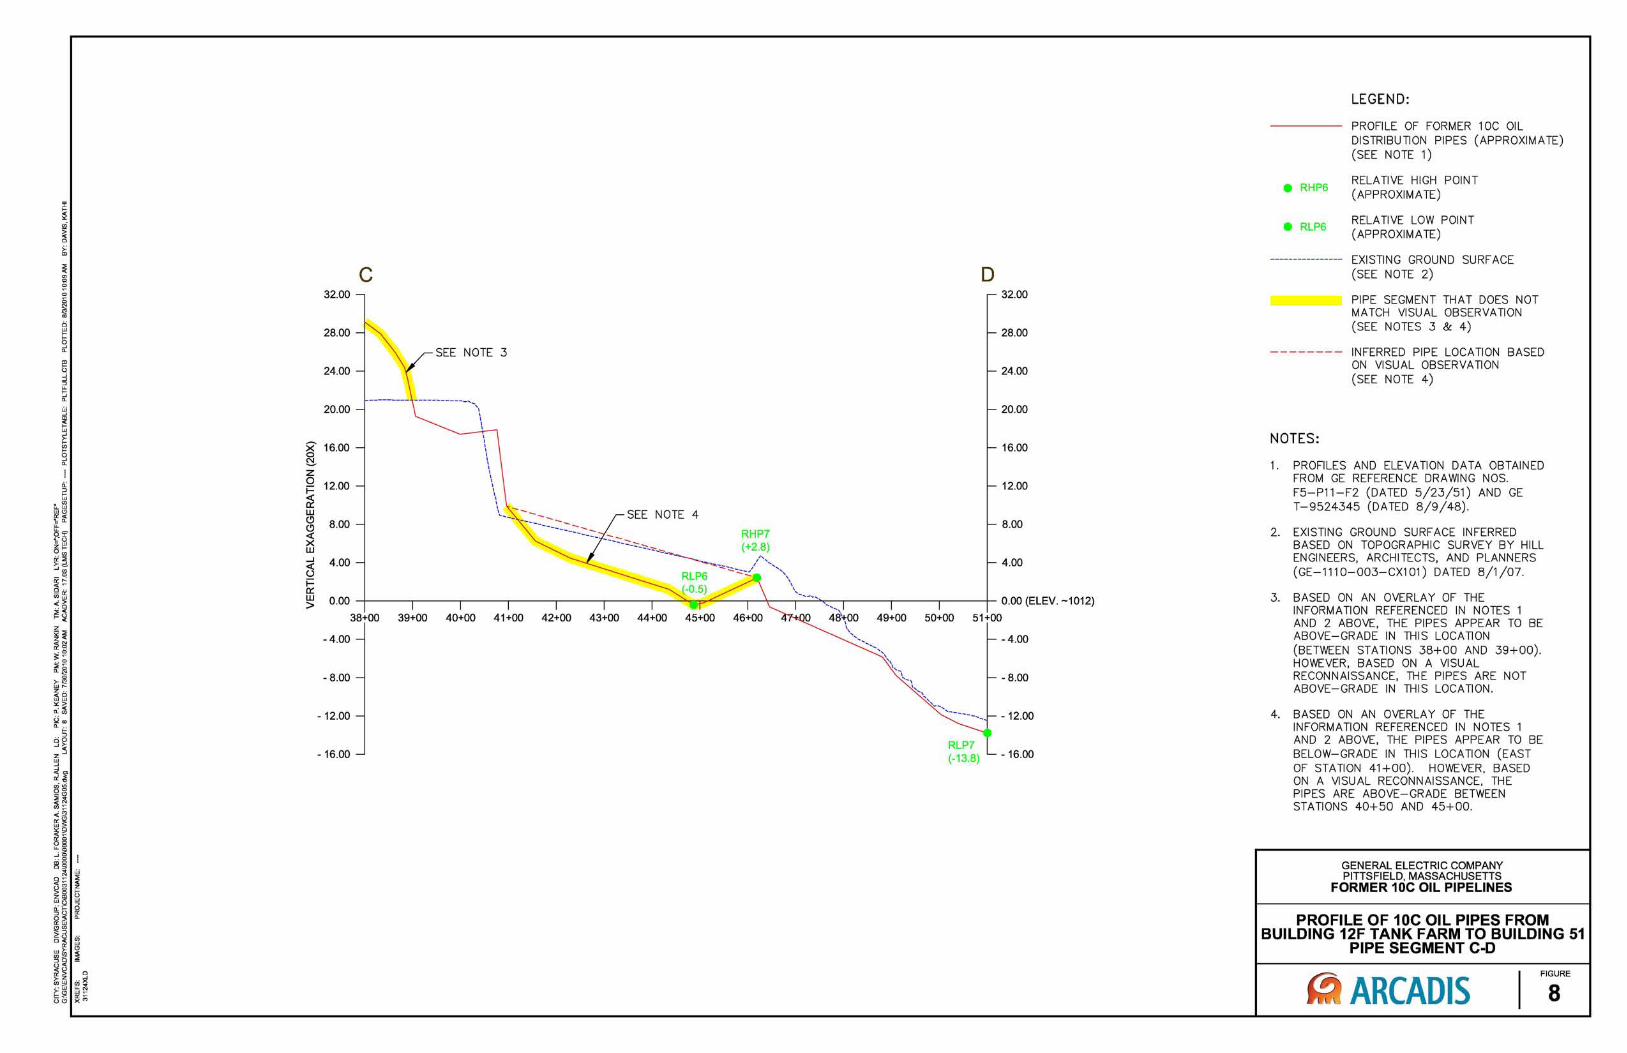
LEGEND:
PROFILE OF FORMER lOC OIL DISTRIBUTION PIPES (APPROXIMATE) (SEE NOTE 1)
• RHP6
• RLP6
RELATIVE HIGH POINT (APPROXIMATE)
RELATIVE LOW POINT (APPROXIMATE)
EXISTING GROUND SURFACE (SEE NOTE 2)
PIPE SEGMENT THAT DOES NOT MATCH VISUAL OBSERVATION (SEE NOTES 3 & 4)
-------- INFERRED PIPE LOCATION BASED ON VISUAL OBSERVATION (SEE NOTE 4)
NOTES:
1. PROFILES AND ELEVATION DATA OBTAINED FROM GE REFERENCE DRAWING NOS. F5-P11-F2 (DATED 5/23/51) AND GE T-9524345 (DATED 8/9/48).
2. EXISTING GROUND SURFACE INFERRED BASED ON TOPOGRAPHIC SURVEY BY HILL ENGINEERS, ARCHITECTS, AND PLANNERS (GE-111 0-003-CX1 01) DATED 8/1/07.
3. BASED ON AN OVERLAY OF THE INFORMATION REFERENCED IN NOTES 1 AND 2 ABOVE, THE PIPES APPEAR TO BE ABOVE-GRADE IN THIS LOCATION (BETWEEN STATIONS 38+00 AND 39+00). HOWEVER, BASED ON A VISUAL RECONNAISSANCE, THE PIPES ARE NOT ABOVE-GRADE IN THIS LOCATION.
4. BASED ON AN OVERLAY OF THE INFORMATION REFERENCED IN NOTES 1 AND 2 ABOVE, THE PIPES APPEAR TO BE BELOW-GRADE IN THIS LOCATION (EAST OF STATION 41+00) . HOWEVER, BASED ON A VISUAL RECONNAISSANCE, THE PIPES ARE ABOVE-GRADE BETWEEN STATIONS 40+50 AND 45+00.
GENERAL ELECTRIC COMPANY PITTSFIELD, MASSACHUSETTS
FORMER 10C OIL PIPELINES
PROFILE OF 10C OIL PIPES FROM BUILDING 12F TANK FARM TO BUILDING 51
PIPE SEGMENT C-D
ARCADIS FIGURE
8

Attachment 1
Historical GE Plan/Design Drawings
-
-
v.
,j !
1
, , i ,
. t 8 i~ ~ ,,' }t .. III ... .. ~ 'Ii ~ 0; d ~ j.St..t
'<j. ~ .. n .(i .. ... ... ...
Q a 0 '" ,,,'
~, + '+-----.
/ • +
I I
I I
, $""'" 0+"". ' r .~l'
IIB4l>~1 #)2-FII
II
2 3
/1
, !
, "
~ .. a .. -0
!Ii g .; .. .. " t ;. ,
---------
2' 3
, " , I
4
4
'''_~~~~;1L1~~", __ T_HI_~~AL:N_G_LE_P_R_~LIEC_T_IO_N~I ________ ~7 ________ L_ __ _:--~8~------~-1--~9--l:--------11-------11!O-------1--------1Dl~ ____ ~
/
e" PIPE.' .....L-;
,I ,
,~--------~~~,-------------,·--~h~----~:b------t ~ ~ ~ ~ ~
P;f'()FILE OF PIPE LINe t'tl>.-f'. /":: CO ;r?;"
V£1'7: ,U = a. "'"'1:
# 1/ v,""""1' 0,1: ,zwC"T" + 8. 87'
3+7".00 '
I PLAN
/" =20 Fr.
I 5 6 7 8
" .,
;11 ' .... -~" ~-, 1$+44. $1)' .
',~ " 'X _.1*
-"-... --.,"
I : 9 :
..BL :.]) G. #" 9 (fi. v. .t.Jf.a.)
PA>FSEIII"T"
.:;.;; . .;.; '. '. f>/tVCM£'NT
PIPE LINE
GENERAL • ELECTRIO po::rSt:L£&lJ " WORK$
E02~ 10
-
-
11---1<
PIIlI1$
,
"
q.; " ~
~ I I
I
i , ,
i
l I I
I I I
I I • I '
I I
I I .
r I' i
, ,
~ ". "" "'_.NO"""" ~ ~I., t1n , _~~'" -b I $' C 1J;. 1 __ -L.. ____ --..::2=-----..,.l----.L--il....:S:.....t...----L----..:.:4:...----..,.l--------=5:...----..,.l----l...--liL..,.;=:...L----'-___ ~7..,.__!::.......... __ -L.;.. __ _'__---!8~ ___ ...L.L...........igbL! ...:9~__rr.;_---__ _r:::;:::_::_G~E:.:.:N..::.:ER~A:.::..l.::WlJl~EL=EC:.:T.:R:.:.tC-~ " "'"'..,.,.."..."..-+ ___ ..... ..::::.:..; ... ::;;:I_:;:::..tJ,·· IiIEV TtTLE -., Ott MiT
1-"'"----------1 PIPE LINES 1/?tJ/'.1 B IJG. '# 12I t .....
A
TO BLDG. tt I-A PLAS l/CS FI RST MAllE FOIl
I I I I I I
~.'A I ~ I ; ~~--------~---------
B
E
F
H
Fin, Fl •• " 12 +50
li r HytlrtJjfi!t1 I"
17 thy:]"n I' 11 Nitroljn,
ol-oa
I I
I I I
"I ""=, ~I "1
1 I I I 1 ,
, r I I I I I I I I 1
i2" 0' I I I
~! 1
~I + 1
I I I 1
0+40,07 0+76.8If8.70 !+ISJO
PROFILE I, ') ,,' H",.. I .. 4. () .. i' Verf I" ~ 4- ' .. (/'
. , //
f&p Gf R",;I
4.4.7
1+7.no 1+'3.9(1 2+14,,4()
".r-. " , ) (""
,'", -"
"
" " "-
NOTE: P,,,,_ L:,.,,, DraWl!
T" Sen /,..67" T 4 ;,
NOT£; Cmd"uiPf Shq/f Cut Th"""rh ilu/ld .. ,,9' Wall lI"d R'I""', hi",!!
I I I I I
I I 1 f I 1 I I I 1 I I I I
!i-J811)
'"\ll
"I ~t ~I ..;1 'I I I
1
I 1
/ F /.
"" " .... ~'" '-.....
" , ,,' " ',,-
"
"
PLAN ". " I ~ 40-0
Ii f . i j i
PROFILr 't f 'f
!Ior, / ,·40-0 Vert I t',O'
ill JII, 10 '"",-~,-~"''''---clt-· --~.
:f"- ..,. i.... ,.f .... _,~
,',
I I I I I
;;'j 1
"'\1
" I 1 I J
"i 1f // ' ///
PROFILE If/~ f", 4(J'" a" I'", 7 I .' - 4. ' .. (! "
..... ':, "
", "
". --,-" ,', "> ~~
" -""::..-", ---"";:.,>.
~--"
-"
"
I 1 I I I I I I I
"I "I ~I \Y01
"':1 \:0;:' -,,(1 , I
1 I I 1
I I I I I
'I- I ~ I
I J I I I I
~I ... , ~J
I I I I I I I 1
1 I I I "y. - 23. (JO
I I I I I I 1 I I I I I I I, 1 I I I I I I I I
::--"" .. :C _-,,;(' r:l: ' , .. r '-- ~ - - -.. wi'- --~:::-...::
I I I I I I ,
'\l I
<,
I::; , .... I t I I I t I I I I I I~ f ... I ~, -,,'!t ,
~ I
"" ! I I I I I I I I I I I", 1<:> I ... It. I I I
II III II' 111 Ii' iii Ii' III III III Iii HI II' fit"" ......
rlY t,.~ " )
I , I 1 I 1 I I I I I 1
R£VISIONS
I I I 1 I I
j I I I j
I I j I I I I I f I I I I 1
'I I I
I i j I , I 1 1
·1
I , j
I I , I 1 , I I I I I I I I I I I I i I I I I I
I I I
""FOiJ)"
I'RINTSTO
,
-
-r , _,
_.. \$$eVEn ,,' ________ -' ____ ~ ______ D!V
;{:·" .•. ~.;:;:,'>i-;FF;;;:; .. ;;1 ... ;:;-(3;;~:;;---;1;-,P;;;;RlNTED:;N:;~JiIN:;-;;U.&A.;:;:-r-------2;;""---.-:..--ijr---....,--T-'iifii-:S;;""ljr--..,.------'--'4.-------:-r1-------;:5;-------T---T--~'l1'-:6;:;"li-------;I--------;:7;-------..,.I-------8=-------.i--i<llI-9::-..,...-l---....:::::.:..:=1l2+:.::...!..~L-__ l"..."O,.l_!.P::.!f!.H:.·!.s!.'f~f:.!·,,:.!:.:·d;..~_,,-~..,:3-,!~~.!; .. ~=~ ... ~""~'ET:!.......;-,-....,!'.~'''~_",J.. ~, _____ ~';,--,' -.t..,_~, _, __ "",, __ , ,,' ____ .. ~. ___ . ' ''_ ~_" " ___ ~,-,,,_--,_, ___ '" , ________ , ___ , ___ ,_~ ___ , ___ , ___ . __ ,,_'__', ",_", __ ._~__. ,'__'__ I flfPli~
TIc 5 1445'.
.-~-~--~-,---'------ ~
-
, --f ,
, , ,
I
-I I
'OH tiS U.fls NO .11\100 ~
"-,.~$;I S tl.h 1-,-_-'--_---'----'-~_~ _ _'___~_.I..____l.a....::::....L._ _ _'_ ___ ...;.4.::.._ ___ ...I..._ ___ ..;;;.5_· ___ -'--_~--""-,_6=__'_ ___ J...._ ___ 7=__ ___ ....L_ ___ _=8:._· ___ _1_..1.._...l!oi~1'___=_9....1_...,., :on MtMWa 1;-
GENERAL 5 ELECTRIC TITLE 'eMf ON tHaT -------1 PIPE LINES FRtJN 8 f)(;ttI2-F
To BLOG . .e I-A Pt.AS TICS FIRST "'A.OE FO~
1 r~~--------------------------------------------------------------------------------------------------------------------------------------------------------------------------------------------~-----~--1 'A 1 .- I ,... I I I I I I I I 33+00 3J<78. 30 34+00 35+00
......
37"68.66
I I ___ ~~~--------=:~~--------~~~------~~~~------=-,~'/~'O~(~1--------~3~~~~:tO~O~--__ --~~~--~~~I~~'~~------~~~---------~3~6~',QOQO--______ ~3~7;+;O:O;';~ I I· 30'1-00,· 1 I C/!fOO 29;00 It Off 1 t 27.;.0(J . 37+42.6"6, .E 6+(l(J
~~~ __ -"J~~~--------~~~------~~~c------"~~~~:i~~~~------~2~4~fo~o~-------g2S~+10~Oc------~-C-,------- I 1 t P"",'''''I(I ~~+OO I I I £/+ 00 22+00 , .. <. " h.' L I
20+00 ~a+ () I /jMO , :
j I IN,ml ;~ I
I I
I " I I I
I I I.. I I I I I I I I I I I I j
I Ie I
, I Ih I I I I I I I I I , I ,
I II II I I I I I , II II 1 I
I I( II I II 11 Il\.tUI
::: 'I ':~: 1 "" . '0 .... '" I' '" ~I ir.i'Ht ~ 'I ,','II 'I lIil
1 .. j.E I I 1 I I I I \ I
F
H
I 'I II I 1 I II I I I 11 I I I .
I I I I I
.... 1 "4-1 /':1 ..... , t I
I j I I 1 I I
1 I J
'1-1 0.,1 ~, ..... , ,
I I I
.. ,1
.'
PI;;CFlU-, "
I 60 - C
LfJ'](';>'
REVISIONS
• •
PRINTS TO
TI251446 _________ .:.... _______ 2 DN
~Sl)ln):
Pdtsfie7d
1 PRINTED IN u.s.A. Q; "' 3 ~I 4 I 5 I
WOFtK!I COftT ON SHEEt SH kt:L
I 7 8 I il 9 10
_f
A
r-,.
B
c
F_
D
E
, j F
H
.... '" " .... """'.. 2 4 7 8 GENEIAL tp ELECTRIC Lpp/ S2/~1~ __ -L ______ ~~ ______ ~ __ -----L--~~ __ --~ ______ -=~----__ ~ __ ----~~------~ __ --L-~~~--__ ~L-------~---------L--------~------~~~~~_n.~----------~TmIT~~----~------~~-~~m 'ON" • t-"""--------i PIPE LINES tROM BLDG #/e-1'
I, _Tb BLDG # I-A PLASTICS CQHf Ofi S+lW 1m 00. FIRST MADE FOR
......
F, J I " c-
I ~-- + --- + ~--+ --- + --- + --- + - __ + --- + ---,+--t-,-
+
t
37+6 66
+
_-'- 37+-12,66 +
t
38+00 3JrOO
" I, II:
F'E' il " ,.'
4th,O(i I
t
~
It/riC ..
-~- + --- +' --- --- +' --- + ---- + ---- .... --.. -. + '. -----. + ,--,,- + ~- f' --- .... ----, i' ---" .... + --- T -- ,.," , .... -- -+ --,-- T ,--- +' ---- + --- T --- ·1
FY·8U·P (,3-49) 1 P:RINTED IN U.S.A. 2 .Ii 3 fl
1[---------------------------------------- ~---~--I [
1 I I I I I j ,
I I I I I I I
4
OJ Iill " L~ __ I 'f
',n, (~2(!"O'
5 6 1
B!d:J
I
Ft:l;cc---- + --- T --~., 'I' .. --~ + ---- t --
PROFILE If " I II
!lor.! ·t,O-O
v..,t /'4'-0"
I A >. *,--:-;ry:i:l?) 11' fill fi-"JeJl ~~
I ' ,
I:fO.r ') ." ~--,TIf--If fiyd"'i,'n-.fitt---:
II '8 ',Qfj ft.'" I II ,L'/ q OM -::::t -J.7} fj, if, "J J
(,
• 7 8 9 1
REVISIONS
____________________ ow
Pi tts fi" 14 wo"". 10 I ?) '311
-, ,
.' , " ,
~--j
t
PRINTS TO.
TI251447 " CQKT Oli $HUT 8"',." ,-'
, -
I
\l
I
, 1 , ,
A
c
E
F
H
.. I i 1 I I Fe"ee I I I I
FF-812-P (3491
1 I 1 ,
-r 1 f I I I I , I ,
'l)1 ::::, ... I
I I I 1 1 I I I I I I I
1 PRlNTED IN u,"-,,-
2
A
I 1 I 1 I I 1 1 I 1 1 1 1 1
'\--1 ""I ~I , 1
1 1 1 I I I 1 I I I I I I
t" ri'.I .-/ ':i./!- 'j.. , .:-- /_:1//' _w_--
J ", I Ii _:--1,/1 oj ~ '_ - -
r /::;- t /,-_------~-/"'-/·,-i r,' (. _----- --
II ------..L------"lhn';' £1-1.90:1:.
2
4 7
. iF Hyd'o~." " lt (}'19·eF1
np.; Ii £ 1"- \" t.- (~
4 5 I 7
;~
TiIlcq/ S,.,. T,c" /I-A Sf", 4{J IF9 t; r' -Sf" 46 -!(J.l6
GENERAL~ UECnlC TITLE B CONT eN SNEEr
!-JIIl"--------1 PI P £ L j /\/£ s F R tJ t1 L /) G, ., 12 - f" ......
coNl Ott .Hn::r To B I. OG:#I-A P LAS TICS
FIRST MADE FOR .
43 4f 42 I ------·--·..,--~-------I---·__r_-------,-------------~-----II-.,.----1"1 -
,~ ::oi:;d 'J
I I I I 1 I I I
I,}! -1'1 ~ .. ' I
1 I I 1 I 1 1 1 I
--------- '/' ---------
8
---A
//- " ,/ -
----- ----A
lS$vto
I __--. t I I I I I I I I
! t I I I I 1 I I I I I
~I I ~I II ~I
I ',> I I ~ I I ~ I , I t I t, ....... I I 1 I 1 1 I I t I I I I
'/ c/' //,/- . '/ "I', - - - - - r' ' '-,' ,?' -~' Y"'
-------- ~£/~ .-
1 1
---.._2'!!.!-e; '~ 1/;"-/ ";"i',:'"":1 ---------- : /' -~-".-;.."':. "
-------- ' 'l"~ -------- --
-/2.77 REVISIONS PRINTS TO
__________________ D1V
Pifi $ ft' t;' Iii WO~KlI T 1251448
COItT ON $IiUT SH NO.
10
, -I
-
-,
-
\

Attachment 2
Summary of Activities to be Performed at each Access Point
G:\GE\GE_Pittsfield_Other-Misc\Reports and Presentations\Pipeline\2671011324Atta2.doc Page 1
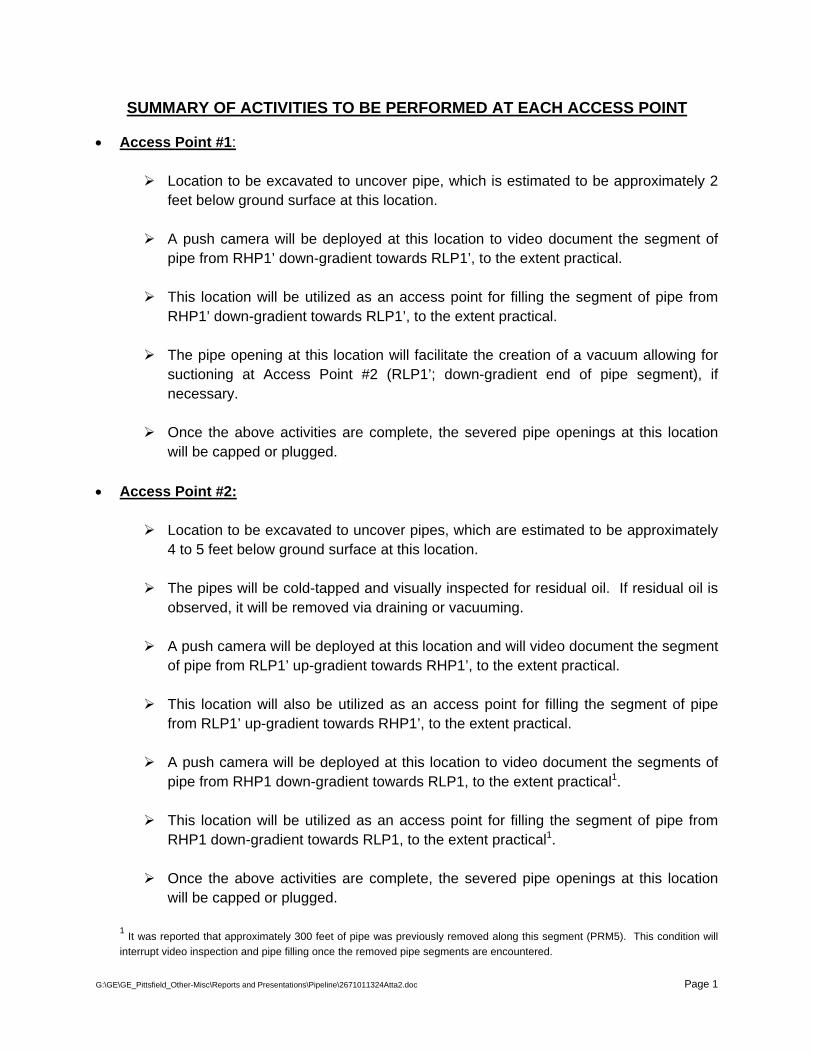
SUMMARY OF ACTIVITIES TO BE PERFORMED AT EACH ACCESS POINT
• Access Point #1:
¾ Location to be excavated to uncover pipe, which is estimated to be approximately 2 feet below ground surface at this location.
¾ A push camera will be deployed at this location to video document the segment of pipe from RHP1’ down-gradient towards RLP1’, to the extent practical.
¾ This location will be utilized as an access point for filling the segment of pipe from RHP1’ down-gradient towards RLP1’, to the extent practical.
¾ The pipe opening at this location will facilitate the creation of a vacuum allowing for suctioning at Access Point #2 (RLP1’; down-gradient end of pipe segment), if necessary.
¾ Once the above activities are complete, the severed pipe openings at this location
will be capped or plugged.
• Access Point #2: ¾ Location to be excavated to uncover pipes, which are estimated to be approximately
4 to 5 feet below ground surface at this location.
¾ The pipes will be cold-tapped and visually inspected for residual oil. If residual oil is observed, it will be removed via draining or vacuuming.
¾ A push camera will be deployed at this location and will video document the segment of pipe from RLP1’ up-gradient towards RHP1’, to the extent practical.
¾ This location will also be utilized as an access point for filling the segment of pipe from RLP1’ up-gradient towards RHP1’, to the extent practical.
¾ A push camera will be deployed at this location to video document the segments of pipe from RHP1 down-gradient towards RLP1, to the extent practical1.
¾ This location will be utilized as an access point for filling the segment of pipe from
RHP1 down-gradient towards RLP1, to the extent practical1.
¾ Once the above activities are complete, the severed pipe openings at this location will be capped or plugged.
1 It was reported that approximately 300 feet of pipe was previously removed along this segment (PRM5). This condition will interrupt video inspection and pipe filling once the removed pipe segments are encountered.
G:\GE\GE_Pittsfield_Other-Misc\Reports and Presentations\Pipeline\2671011324Atta2.doc Page 2
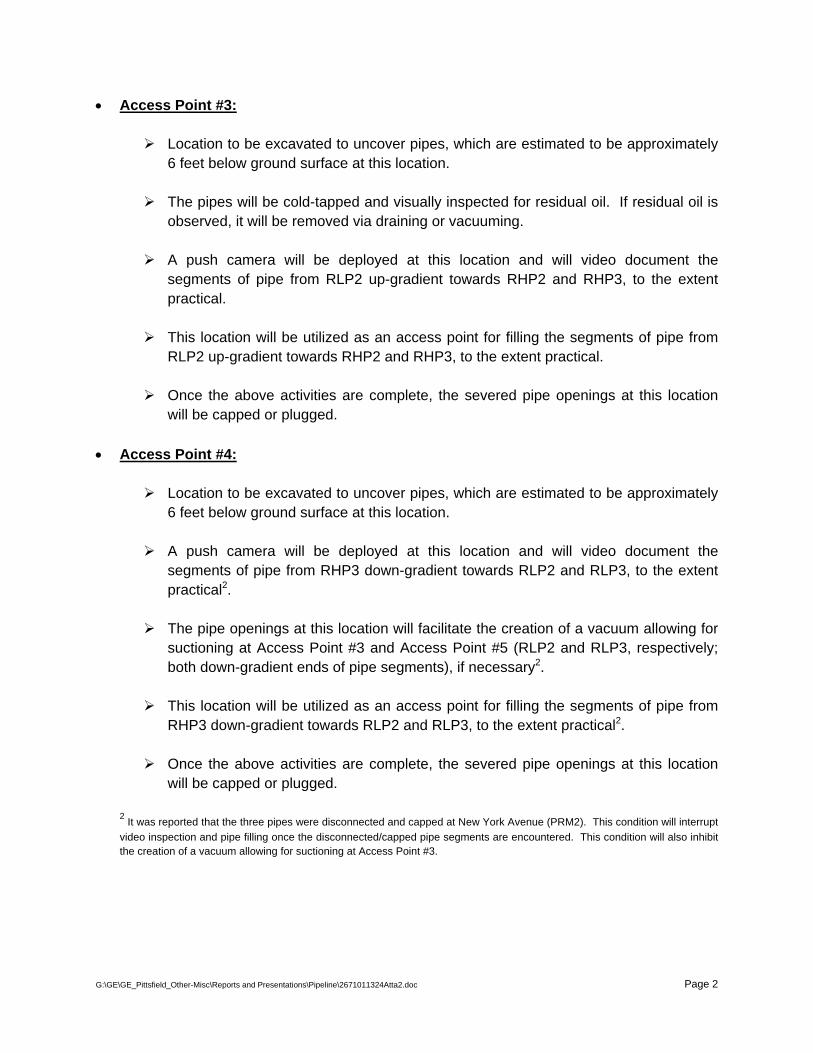
• Access Point #3: ¾ Location to be excavated to uncover pipes, which are estimated to be approximately
6 feet below ground surface at this location.
¾ The pipes will be cold-tapped and visually inspected for residual oil. If residual oil is observed, it will be removed via draining or vacuuming.
¾ A push camera will be deployed at this location and will video document the segments of pipe from RLP2 up-gradient towards RHP2 and RHP3, to the extent practical.
¾ This location will be utilized as an access point for filling the segments of pipe from RLP2 up-gradient towards RHP2 and RHP3, to the extent practical.
¾ Once the above activities are complete, the severed pipe openings at this location
will be capped or plugged.
• Access Point #4: ¾ Location to be excavated to uncover pipes, which are estimated to be approximately
6 feet below ground surface at this location.
¾ A push camera will be deployed at this location and will video document the segments of pipe from RHP3 down-gradient towards RLP2 and RLP3, to the extent practical2.
¾ The pipe openings at this location will facilitate the creation of a vacuum allowing for suctioning at Access Point #3 and Access Point #5 (RLP2 and RLP3, respectively; both down-gradient ends of pipe segments), if necessary2.
¾ This location will be utilized as an access point for filling the segments of pipe from RHP3 down-gradient towards RLP2 and RLP3, to the extent practical2.
¾ Once the above activities are complete, the severed pipe openings at this location
will be capped or plugged. 2 It was reported that the three pipes were disconnected and capped at New York Avenue (PRM2). This condition will interrupt video inspection and pipe filling once the disconnected/capped pipe segments are encountered. This condition will also inhibit the creation of a vacuum allowing for suctioning at Access Point #3.
G:\GE\GE_Pittsfield_Other-Misc\Reports and Presentations\Pipeline\2671011324Atta2.doc Page 3
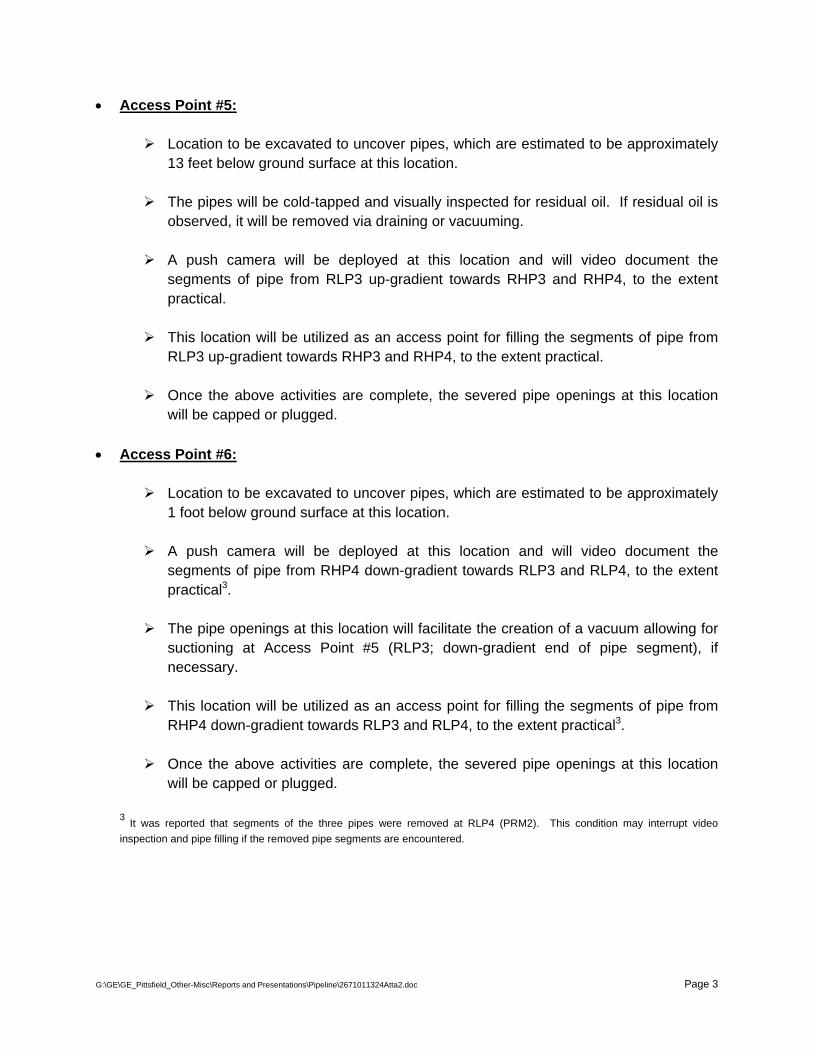
• Access Point #5: ¾ Location to be excavated to uncover pipes, which are estimated to be approximately
13 feet below ground surface at this location.
¾ The pipes will be cold-tapped and visually inspected for residual oil. If residual oil is observed, it will be removed via draining or vacuuming.
¾ A push camera will be deployed at this location and will video document the segments of pipe from RLP3 up-gradient towards RHP3 and RHP4, to the extent practical.
¾ This location will be utilized as an access point for filling the segments of pipe from RLP3 up-gradient towards RHP3 and RHP4, to the extent practical.
¾ Once the above activities are complete, the severed pipe openings at this location
will be capped or plugged.
• Access Point #6: ¾ Location to be excavated to uncover pipes, which are estimated to be approximately
1 foot below ground surface at this location.
¾ A push camera will be deployed at this location and will video document the segments of pipe from RHP4 down-gradient towards RLP3 and RLP4, to the extent practical3.
¾ The pipe openings at this location will facilitate the creation of a vacuum allowing for suctioning at Access Point #5 (RLP3; down-gradient end of pipe segment), if necessary.
¾ This location will be utilized as an access point for filling the segments of pipe from RHP4 down-gradient towards RLP3 and RLP4, to the extent practical3.
¾ Once the above activities are complete, the severed pipe openings at this location
will be capped or plugged. 3 It was reported that segments of the three pipes were removed at RLP4 (PRM2). This condition may interrupt video inspection and pipe filling if the removed pipe segments are encountered.
G:\GE\GE_Pittsfield_Other-Misc\Reports and Presentations\Pipeline\2671011324Atta2.doc Page 4
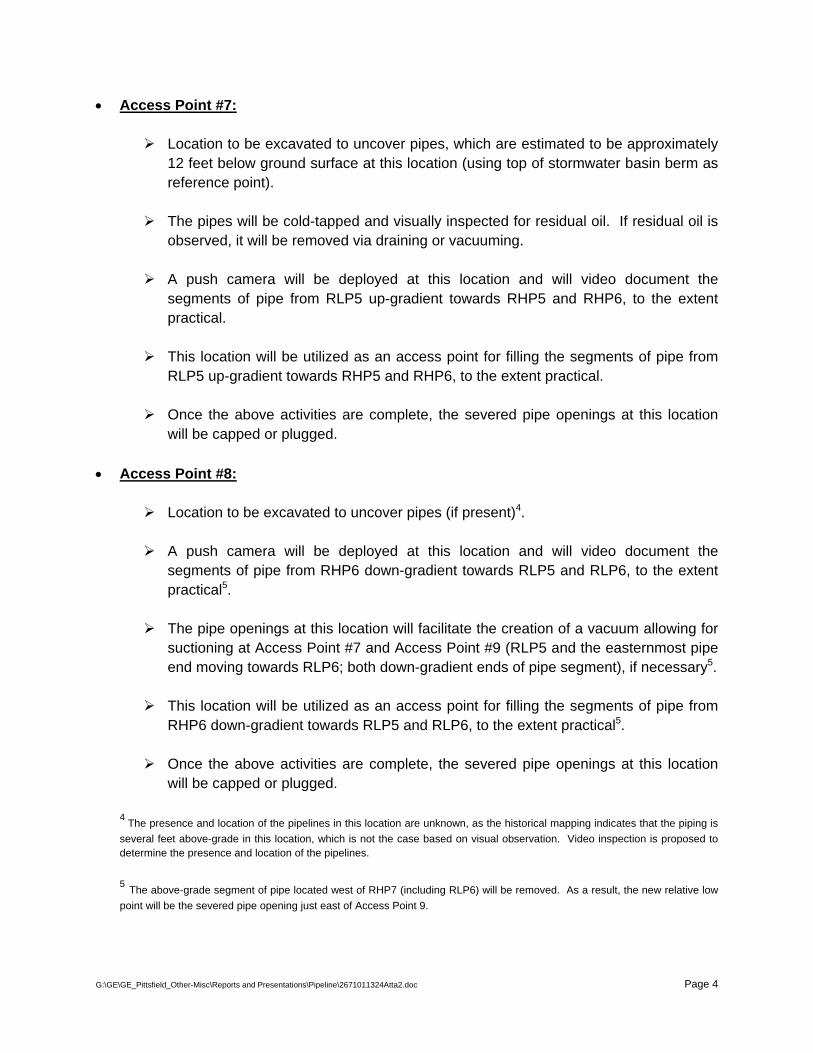
• Access Point #7: ¾ Location to be excavated to uncover pipes, which are estimated to be approximately
12 feet below ground surface at this location (using top of stormwater basin berm as reference point).
¾ The pipes will be cold-tapped and visually inspected for residual oil. If residual oil is observed, it will be removed via draining or vacuuming.
¾ A push camera will be deployed at this location and will video document the segments of pipe from RLP5 up-gradient towards RHP5 and RHP6, to the extent practical.
¾ This location will be utilized as an access point for filling the segments of pipe from RLP5 up-gradient towards RHP5 and RHP6, to the extent practical.
¾ Once the above activities are complete, the severed pipe openings at this location
will be capped or plugged.
• Access Point #8: ¾ Location to be excavated to uncover pipes (if present)4.
¾ A push camera will be deployed at this location and will video document the
segments of pipe from RHP6 down-gradient towards RLP5 and RLP6, to the extent practical5.
¾ The pipe openings at this location will facilitate the creation of a vacuum allowing for suctioning at Access Point #7 and Access Point #9 (RLP5 and the easternmost pipe end moving towards RLP6; both down-gradient ends of pipe segment), if necessary5.
¾ This location will be utilized as an access point for filling the segments of pipe from RHP6 down-gradient towards RLP5 and RLP6, to the extent practical5.
¾ Once the above activities are complete, the severed pipe openings at this location
will be capped or plugged. 4 The presence and location of the pipelines in this location are unknown, as the historical mapping indicates that the piping is several feet above-grade in this location, which is not the case based on visual observation. Video inspection is proposed to determine the presence and location of the pipelines.
5 The above-grade segment of pipe located west of RHP7 (including RLP6) will be removed. As a result, the new relative low point will be the severed pipe opening just east of Access Point 9.
G:\GE\GE_Pittsfield_Other-Misc\Reports and Presentations\Pipeline\2671011324Atta2.doc Page 5
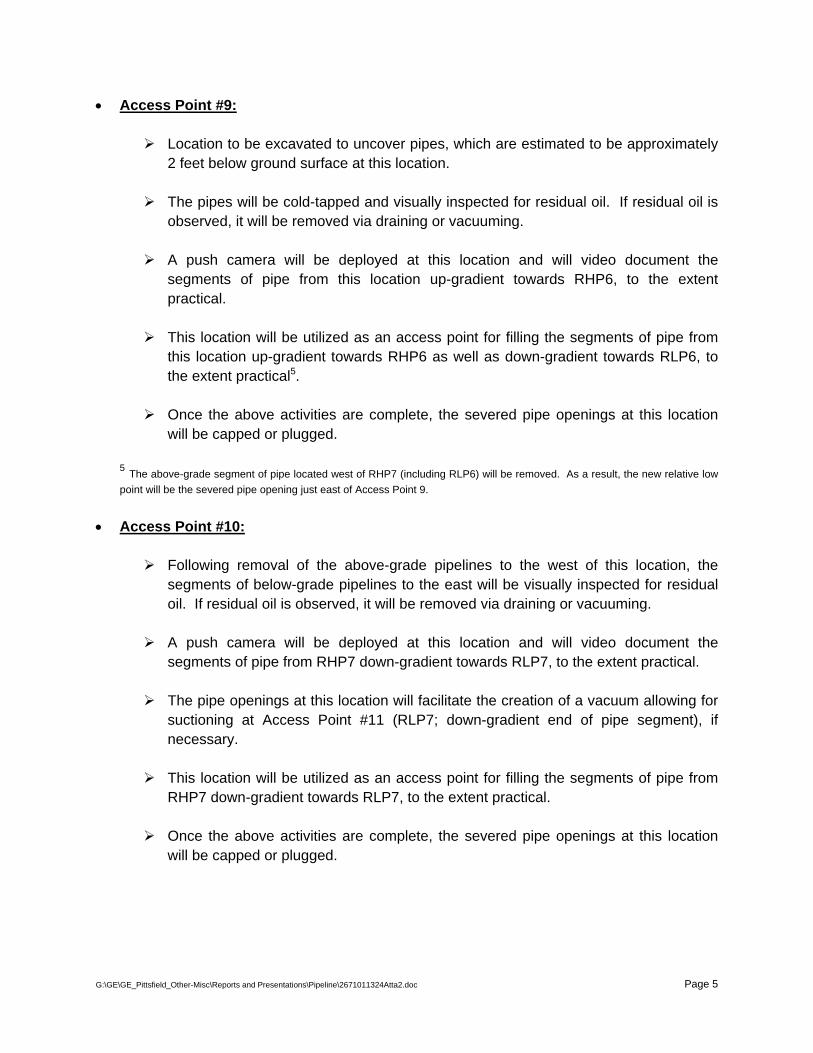
• Access Point #9: ¾ Location to be excavated to uncover pipes, which are estimated to be approximately
2 feet below ground surface at this location.
¾ The pipes will be cold-tapped and visually inspected for residual oil. If residual oil is observed, it will be removed via draining or vacuuming.
¾ A push camera will be deployed at this location and will video document the segments of pipe from this location up-gradient towards RHP6, to the extent practical.
¾ This location will be utilized as an access point for filling the segments of pipe from this location up-gradient towards RHP6 as well as down-gradient towards RLP6, to the extent practical5.
¾ Once the above activities are complete, the severed pipe openings at this location
will be capped or plugged. 5 The above-grade segment of pipe located west of RHP7 (including RLP6) will be removed. As a result, the new relative low point will be the severed pipe opening just east of Access Point 9.
• Access Point #10:
¾ Following removal of the above-grade pipelines to the west of this location, the
segments of below-grade pipelines to the east will be visually inspected for residual oil. If residual oil is observed, it will be removed via draining or vacuuming.
¾ A push camera will be deployed at this location and will video document the segments of pipe from RHP7 down-gradient towards RLP7, to the extent practical.
¾ The pipe openings at this location will facilitate the creation of a vacuum allowing for suctioning at Access Point #11 (RLP7; down-gradient end of pipe segment), if necessary.
¾ This location will be utilized as an access point for filling the segments of pipe from RHP7 down-gradient towards RLP7, to the extent practical.
¾ Once the above activities are complete, the severed pipe openings at this location
will be capped or plugged.
G:\GE\GE_Pittsfield_Other-Misc\Reports and Presentations\Pipeline\2671011324Atta2.doc Page 6
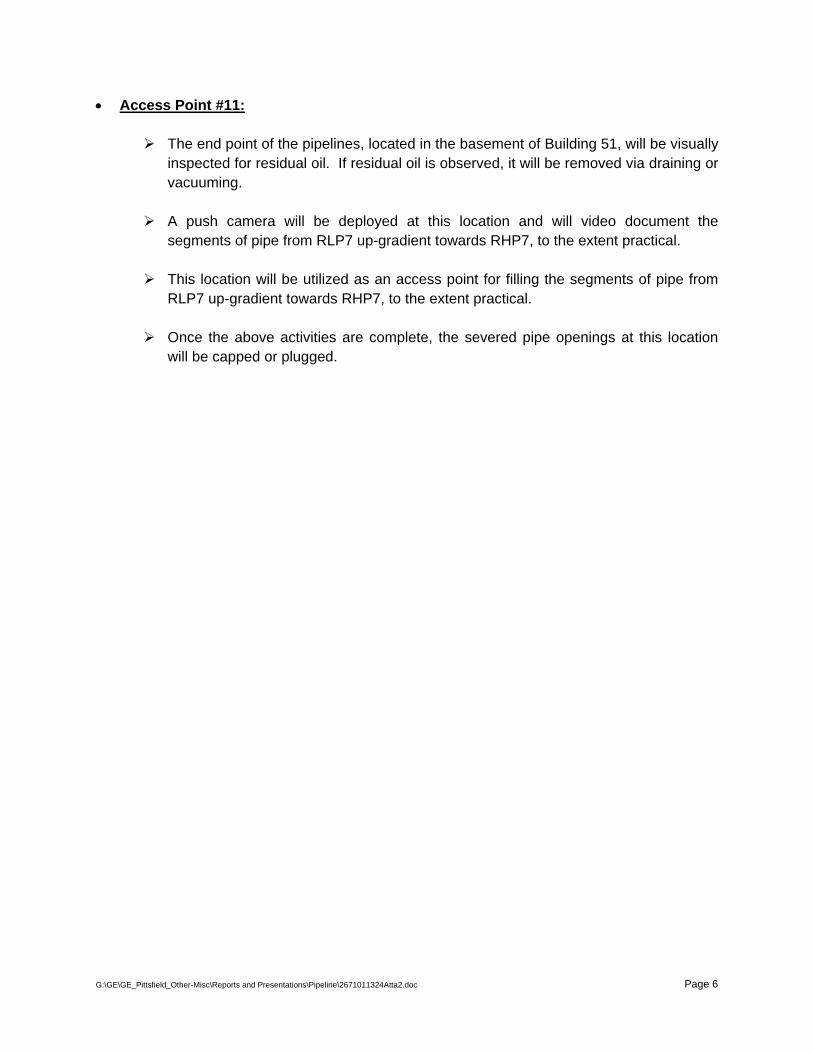
• Access Point #11: ¾ The end point of the pipelines, located in the basement of Building 51, will be visually
inspected for residual oil. If residual oil is observed, it will be removed via draining or vacuuming.
¾ A push camera will be deployed at this location and will video document the segments of pipe from RLP7 up-gradient towards RHP7, to the extent practical.
¾ This location will be utilized as an access point for filling the segments of pipe from RLP7 up-gradient towards RHP7, to the extent practical.
¾ Once the above activities are complete, the severed pipe openings at this location
will be capped or plugged.

Attachment 3
Site-Specific Ambient Air Monitoring Plan
Ambient Air Monitoring Plan for PCBs and Particulate Matter
During Soil Handling Activities as part of Pipeline Project Pittsfield, Massachusetts
General Electric Company Pittsfield, Massachusetts Prepared by Berkshire Environmental Consultants, Inc. 1450 East Street, Suite 6-H Pittsfield, MA 01201
August 2010
TABLE OF CONTENTS _____________ 1.0 Introduction 2.0 Sampling Objectives 3.0 Monitoring Locations 4.0 PCB Monitoring Program 4.1 High Volume PCB Sampling 4.2 Analytical Procedures 5.0 Particulate Monitoring Program 6.0 Quality Assurance and Quality Control Procedures 7.0 PCB Sample Documentation, Handling and Shipment 8.0 Meteorological Monitoring 9.0 Documentation and Reporting 10.0 Notification and Action Levels 10.1 PCBs 10.2 Particulate Matter
Ambient Air Monitoring Plan PCBs & Particulate Matter Soil Handling Activities as part of Pipeline Project August 2010 Page 1 1.0 INTRODUCTION
This plan describes the ambient air monitoring for polychlorinated biphenyls (PCBs) and particulate matter which will be conducted during implementation of GE’s plan, dated August 3, 2010, for addressing certain pipelines at GE’s facility in Pittsfield, Massachusetts that formerly distributed 10c mineral oil. This project (referred to herein as the “Pipeline Project”) will include soil excavation at a number of discrete locations along the course of the pipelines in question. The air monitoring program will consist of ambient air monitoring for PCBs and particulate matter during soil excavation, handling, and backfilling activities (collectively “soil handing activities”) conducted as part of the Pipeline Project. 2.0 SAMPLING OBJECTIVES
The objectives of the sampling program are two-fold: 1. To obtain valid and representative data on ambient levels of PCBs before and
during soil handling activities on the Pipeline Project to ensure that the activities are not causing an unacceptable increase in ambient air concentrations of PCB.
2. To obtain valid and representative data on ambient levels of particulates before
and during soil handling activities on the Pipeline Project to ensure that the remedial activities are not causing an unacceptable increase in ambient air concentrations of particulate matter.
3.0 MONITORING LOCATIONS
The specific monitoring locations for PCBs and particulate matter will be determined prior to the initiation of the soil handling activities. Eleven monitoring locations along or near the course of these pipelines have been preliminarily identified, as indicated on the attached Figure 1. These locations have been selected based on: (a) the location of the soil handling activities; (b) consideration of the predominant wind direction and the location of potential off-site receptors; (c) the presence of obstructions (such as buildings) and other influences (such as truck traffic) that may affect the representativeness of the data; and (d) availability of power, accessibility, and site security. The predominant wind direction is west-northwest (WNW) based on wind rose data from the Albany, NY National Weather Service (NWS) station. Data from the City of Pittsfield Airport meteorological station and the former GE-owned on-site meteorological station also demonstrate a predominant WNW wind direction; however, the data from the local stations also show that the local wind direction and speed vary considerably. Therefore, air monitors have generally been placed in locations that will include good downwind coverage, but also provide coverage between the areas of soil handling and potential off-site receptors.
PCB monitoring will be conducted at three to four on-site monitoring locations during
each PCB sampling event other than the baseline monitoring events, as described in Section 4.
Ambient Air Monitoring Plan PCBs & Particulate Matter Soil Handling Activities as part of Pipeline Project August 2010 Page 2 Particulate monitoring will be conducted at three to four non-background monitoring locations during periods of soil handling activities (see Section 5).
The plan for this project has identified several discrete areas of soil handling. For each area of soil handling, specific monitoring locations have been identified. These monitoring locations are identified on Figure 1. Several of these locations have been used in previous ambient air monitoring programs for remediation or waste consolidation activities at East Street Area 2-North (ESA2-N) or the On-Plant Consolidation Areas (OPCAs). Below is a summary of the monitoring locations that will be used during soil handling activities at the following locations:
Soil Handling Location Nos. 1 and 3
• Former monitoring location ES2N-1 • Former monitoring location ES2N-2(M) • Former monitoring location ES2N-3 • Former monitoring location ES2N-4
Soil Handling Location No. 2
• PLP-1 • PLP-2 • Former monitoring location ES2N-4
Soil Handling Location Nos. 4, 5, and 6
• Former monitoring location ES2N-1 • Former monitoring location ES2N-2(M) • Former monitoring location OPCA-NW • PLP-3 • Allendale Schoolyard monitoring location (may be co-located with U.S.
Environmental Protection Agency’s [EPA’s] existing air monitoring station)
Soil Handling Location No. 7
• Former monitoring location OPCA-NW • Former monitoring location OPCA-SE • Former monitoring location OPCA-N(M) • Allendale Schoolyard monitoring location (may be co-located with EPA’s
existing air monitoring station) Soil Handling Location Nos. 8 and 9
• Former monitoring location OPCA-SE • Former monitoring location OPCA-N(M) • PLP-4 • Allendale Schoolyard monitoring location (may be co-located with EPA’s
existing air monitoring station)

Ambient Air Monitoring Plan PCBs & Particulate Matter Soil Handling Activities as part of Pipeline Project August 2010 Page 3
In addition to the locations listed above, a representative industrial background
monitoring location for both PCBs and particulate matter will be established and operated in a parking lot at the corner of Harvard Street and Tyler Street Extension (BK-4) on GE property in Pittsfield.
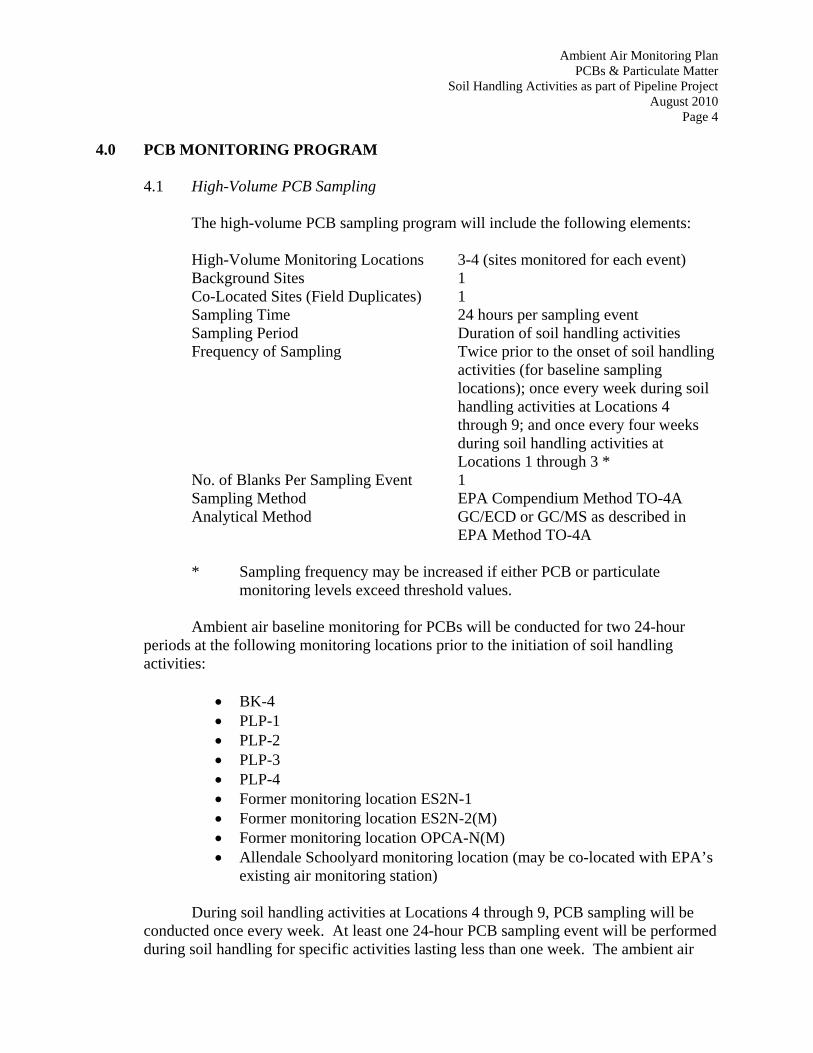
Ambient Air Monitoring Plan PCBs & Particulate Matter Soil Handling Activities as part of Pipeline Project August 2010 Page 4 4.0 PCB MONITORING PROGRAM
4.1 High-Volume PCB Sampling
The high-volume PCB sampling program will include the following elements: High-Volume Monitoring Locations 3-4 (sites monitored for each event) Background Sites 1 Co-Located Sites (Field Duplicates) 1 Sampling Time 24 hours per sampling event Sampling Period Duration of soil handling activities Frequency of Sampling Twice prior to the onset of soil handling
activities (for baseline sampling locations); once every week during soil handling activities at Locations 4 through 9; and once every four weeks during soil handling activities at Locations 1 through 3 *
No. of Blanks Per Sampling Event 1 Sampling Method EPA Compendium Method TO-4A Analytical Method GC/ECD or GC/MS as described in
EPA Method TO-4A
* Sampling frequency may be increased if either PCB or particulate monitoring levels exceed threshold values.
Ambient air baseline monitoring for PCBs will be conducted for two 24-hour
periods at the following monitoring locations prior to the initiation of soil handling activities:
• BK-4 • PLP-1 • PLP-2 • PLP-3 • PLP-4 • Former monitoring location ES2N-1 • Former monitoring location ES2N-2(M) • Former monitoring location OPCA-N(M) • Allendale Schoolyard monitoring location (may be co-located with EPA’s
existing air monitoring station) During soil handling activities at Locations 4 through 9, PCB sampling will be
conducted once every week. At least one 24-hour PCB sampling event will be performed during soil handling for specific activities lasting less than one week. The ambient air
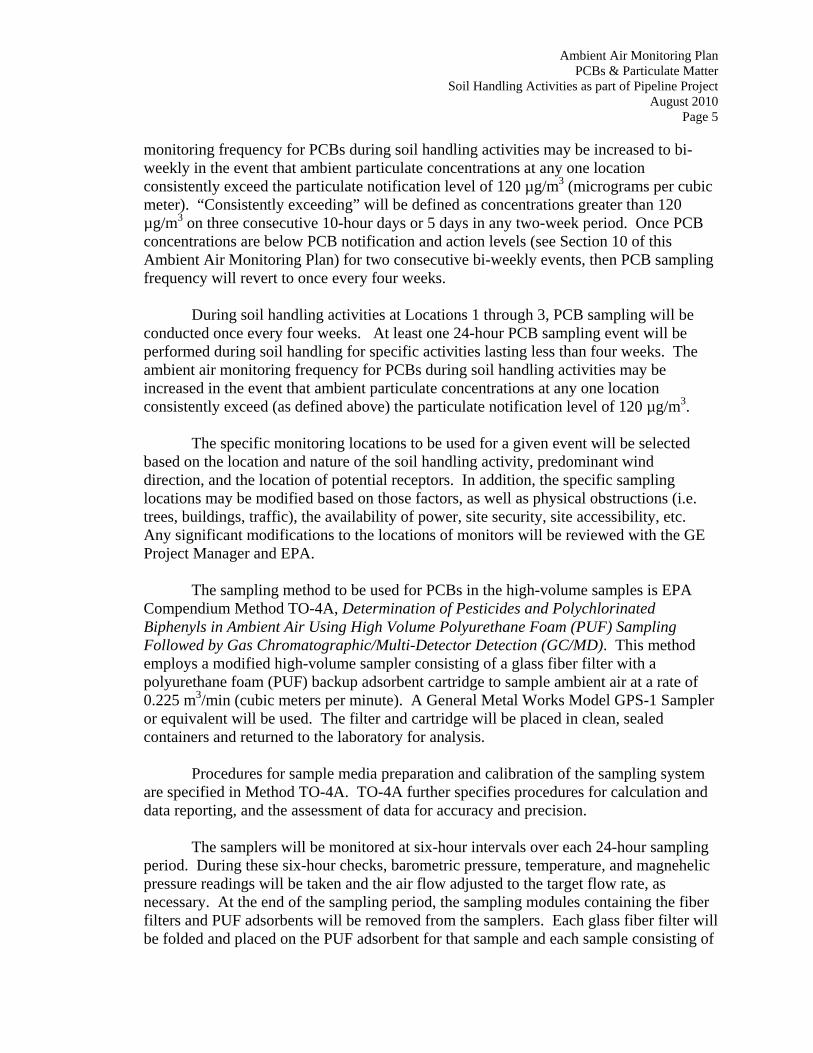
Ambient Air Monitoring Plan PCBs & Particulate Matter Soil Handling Activities as part of Pipeline Project August 2010 Page 5
monitoring frequency for PCBs during soil handling activities may be increased to bi-weekly in the event that ambient particulate concentrations at any one location consistently exceed the particulate notification level of 120 µg/m3 (micrograms per cubic meter). “Consistently exceeding” will be defined as concentrations greater than 120 µg/m3 on three consecutive 10-hour days or 5 days in any two-week period. Once PCB concentrations are below PCB notification and action levels (see Section 10 of this Ambient Air Monitoring Plan) for two consecutive bi-weekly events, then PCB sampling frequency will revert to once every four weeks.
During soil handling activities at Locations 1 through 3, PCB sampling will be
conducted once every four weeks. At least one 24-hour PCB sampling event will be performed during soil handling for specific activities lasting less than four weeks. The ambient air monitoring frequency for PCBs during soil handling activities may be increased in the event that ambient particulate concentrations at any one location consistently exceed (as defined above) the particulate notification level of 120 µg/m3.
The specific monitoring locations to be used for a given event will be selected
based on the location and nature of the soil handling activity, predominant wind direction, and the location of potential receptors. In addition, the specific sampling locations may be modified based on those factors, as well as physical obstructions (i.e. trees, buildings, traffic), the availability of power, site security, site accessibility, etc. Any significant modifications to the locations of monitors will be reviewed with the GE Project Manager and EPA.
The sampling method to be used for PCBs in the high-volume samples is EPA
Compendium Method TO-4A, Determination of Pesticides and Polychlorinated Biphenyls in Ambient Air Using High Volume Polyurethane Foam (PUF) Sampling Followed by Gas Chromatographic/Multi-Detector Detection (GC/MD). This method employs a modified high-volume sampler consisting of a glass fiber filter with a polyurethane foam (PUF) backup adsorbent cartridge to sample ambient air at a rate of 0.225 m3/min (cubic meters per minute). A General Metal Works Model GPS-1 Sampler or equivalent will be used. The filter and cartridge will be placed in clean, sealed containers and returned to the laboratory for analysis.
Procedures for sample media preparation and calibration of the sampling system
are specified in Method TO-4A. TO-4A further specifies procedures for calculation and data reporting, and the assessment of data for accuracy and precision.
The samplers will be monitored at six-hour intervals over each 24-hour sampling
period. During these six-hour checks, barometric pressure, temperature, and magnehelic pressure readings will be taken and the air flow adjusted to the target flow rate, as necessary. At the end of the sampling period, the sampling modules containing the fiber filters and PUF adsorbents will be removed from the samplers. Each glass fiber filter will be folded and placed on the PUF adsorbent for that sample and each sample consisting of
Ambient Air Monitoring Plan PCBs & Particulate Matter Soil Handling Activities as part of Pipeline Project August 2010 Page 6
a fiber filter and PUF adsorbent (inside a glass cartridge) will be wrapped in hexane rinsed aluminum foil. Each fiber filter and PUF adsorbent set will be labeled as one sample. The samples will be wrapped, packaged in ice and sent under chain-of-custody to the laboratory for analysis.
The PCB sampling probe height for all high-volume monitors will be approximately 2.0 meters above the ground. This height is adequate to represent the breathing zone and to be above the influence of ground activity around the monitor. The location of the samplers will be in conformance, to the extent practical, with the siting requirements for ambient monitors in Ambient Monitoring Guidelines for Prevention of Significant Deterioration (PSD) (U.S. EPA. May, 1987). 4.2 Analytical Procedures
In the high-volume samples, the PCBs on the PUF and filter will be recovered by
the sample extraction procedures described in TO-4A. The extracts will be reduced in volume using concentration techniques as described in TO-4A and subjected to column chromatographic cleanup. The extracts will be analyzed for PCBs using gas chromatography with either electron capture detection (GC/ECD) or mass spectrometry detection (GC/MS) as described TO-4A.
The samples will be analyzed for the following PCB Aroclors:
PCB-1016 PCB-1221 PCB-1232 PCB-1242 PCB-1248 PCB-1254 PCB-1260
The detection limit (DL) for PCB analysis of the high-volume samples will be
0.0003 µg/m3, in consideration of the following:
Avg. Sampling Rate 0.225 m3/min. Avg. Sample Volume 324 m3/PUF Analytical DL 0.1 µg/PUF Project DL 0.0003 µg/m3
5.0 PARTICULATE MONITORING PROGRAM
Real-time particulate monitoring will be conducted during the soil handling activities conducted as part of the Pipeline Project. Monitoring will be conducted daily during the hours of soil handling activities. It is anticipated that the particulate monitoring will be conducted for approximately 10 hours a day, from 7:00 a.m. to 5:00 p.m. Particulate monitoring will occur throughout the period of soil handling activities.
Ambient Air Monitoring Plan PCBs & Particulate Matter Soil Handling Activities as part of Pipeline Project August 2010 Page 7
Particulate monitoring will be conducted using a MetOne E-BAM monitor or a MIE dataRAM real-time airborne particulate monitor, Model DR-4000 or Model pDR-1000, or equivalent. The MetOne E-BAM uses beta attenuation as a measurement technique. The mass of suspended particulate is measured by the decrease in the number of beta particles passed over a particulate filtering medium due to absorption by the particulate. The EBAM monitors have a measurement range of -0.005 to 65.530 mg/m3. The Model DR-4000 dataRAM monitor is equipped with a temperature conditioning heater and in-line impactor head in addition to a light scattering photometer to measure particulate concentrations with a mean diameter less than 10 micrometers (PM10). The Model pDR-1000 dataRAM monitor uses a passive sampling technique and light scattering photometer to determine particulate concentrations. These MIE monitors have a measurement range of 0.0001 to 400 mg/m3.
For all monitors, particulate data will be averaged and recorded for each 15-minute
interval during the sampling day by the instrument's datalogger. An overall daily average will be calculated and recorded by the instrument’s datalogger (if the instrument has the capability) or using a spreadsheet. The particulate monitoring results will be reported as PM10 (particulate matter with a mean diameter of 10 micrometers or less).
Calibrations and maintenance will be conducted at the frequency and in accordance with the procedures recommended by the manufacturer. All calibrations will be recorded.
The MIE Models 4000 and pDR-1000 monitors have an inherent sensitivity to moisture and readings taken under very high humidity conditions are unreliable. GE may, at times, use the professional engineering judgment of its environmental consultants to determine the reliability and usability of data collected during very high humidity conditions. Data summaries will exclude the time period when moisture is clearly a factor. The raw data file will be marked and maintained to indicate what data are included in the average.
Eleven preliminary monitoring locations have been identified as indicated on Figure 1. As noted in Section 3, for each (or each set of) discrete soil handling location(s), three to four specific monitoring locations have been identified. As required and at the discretion of Berkshire Environmental Consultants (BEC), GE, and the Soil Handling Contractor, additional monitors may be operated to adequately assess ambient particulate concentrations. The specific monitoring locations to be used on a given day will be established based on the following: location of soil handling activities, truck and vehicle traffic on-site, obstructions, accessibility, and receptors. As soil handling proceeds and conditions change during activities on the Pipeline Project, the monitoring locations may be moved. In addition to the eleven monitoring locations described above, an industrial background particulate monitor will be installed in the parking lot at the corner of Harvard Street and Tyler Street Extension (BK-4) on GE property in Pittsfield. Data from this station will be used in evaluating ambient particulate concentrations during the remediation.
Ambient Air Monitoring Plan PCBs & Particulate Matter Soil Handling Activities as part of Pipeline Project August 2010 Page 8 6.0 QUALITY ASSURANCE AND QUALITY CONTROL PROCEDURES
Quality assurance and quality control (QA/QC) procedures for the air sampling program will follow those described in GE’s approved Field Sampling Plan/Quality Assurance Project Plan (FSP/QAPP), prepared by Blasland, Bouck & Lee, Inc., February 2006, with any subsequent modifications agreed upon by GE and EPA. Additional specific quality assurance and quality control for the monitors will be based on manufacturer's recommendations. 7.0 PCB SAMPLE DOCUMENTATION, HANDLING AND SHIPMENT
Each filter holder and PUF cartridge holder will be pre-marked with a permanent identification number. As each sample is collected, it will be recorded on a field data form along with the date, time and location of collection.
All samples will be securely wrapped for shipment. PCB samples will be preserved at 4oC and shipped on ice. Samples will be shipped under chain-of-custody by commercial overnight carrier or courier to the analytical laboratory. Complete details on the PCB sample shipment procedures are contained in the FSP/QAPP. 8.0 METEOROLOGICAL MONITORING
Hourly meteorological data from the Automated Surface Observation System (ASOS) Monitor operated at the Pittsfield Municipal Airport in Pittsfield, Massachusetts will be evaluated for each sampling period. A summary of the wind directional data for the sampling period will be included with the sampling results. This ASOS Monitor is operated by the National Weather Service, Federal Aviation Administration, and the Department of Defense. The ASOS Monitor measures and records wind speed, wind direction, precipitation, temperature, sky conditions, barometric pressure, and relative humidity. 9.0 DOCUMENTATION AND REPORTING
PCB and particulate data will be summarized and reported to the GE Project Manager and the ARCADIS Project Manager. If there is an exceedance of a reporting threshold, GE will be notified as soon as possible. All field and laboratory data recorded during ambient monitoring will be documented according to the procedures in the FSP/QAPP. A written report summarizing the results will be provided to GE and ARCADIS after the conclusion of sampling and will include the following:
Date and Time of Sampling Sampling Locations Calibration and Maintenance Activities Pollutants Monitored Number of Samples Collected Analytical Results
Ambient Air Monitoring Plan PCBs & Particulate Matter Soil Handling Activities as part of Pipeline Project August 2010 Page 9
Quality Assurance Assessment Meteorological Data Summary Discussion of Problems or Disruptions
10.0 NOTIFICATION AND ACTION LEVELS
10.1 PCBs
The notification and action levels for PCB concentrations in ambient air are 0.05
µg/m3 (24-hour average) and 0.1 µg/m3 (24-hour average), respectively. These are the same levels established by EPA for remediation activities at the GE-Pittsfield/Housatonic River Site.
If the 0.05 µg/m3 notification level is exceeded, GE will notify EPA as soon as
practical, but no later than 24 hours after receipt of the data showing such an exceedance, and will implement response actions, in consultation with EPA, to prevent exceedances of the action level. The actions to be considered in such circumstances will include those previously implemented by GE at other areas at the GE-Pittsfield/Housatonic River Site (e.g., increased frequency of monitoring, establishment of additional monitoring locations, increased use of dust suppression measures, modifications to dust-producing activities, and/or other appropriate response actions). In addition, GE will provide written notice of the exceedance to EPA within 72 hours following receipt of the data showing the exceedance.
If the action level of 0.1 µg/m3 is exceeded, GE will: (a) notify EPA immediately
of the exceedance within 24 hours after receipt of the data showing the exceedance; (b) temporarily cease ongoing soil handling activities; (c) discuss with EPA appropriate immediate or short-term response actions to address the exceedance; and (d) provide written notice of the exceedance to EPA within 72 hours following receipt of the data showing the exceedance. In addition, GE will evaluate the cause of the exceedance and the need for additional engineering controls, discuss that evaluation with EPA, and if warranted, propose to EPA appropriate engineering controls or other corrective actions. EPA approval of appropriate response actions and engineering controls, if proposed, will be required before GE resumes soil handling activities.
10.2 Particulate Matter
The notification and action levels for PM10 concentrations in ambient air are 120
µg/m3 (10-hour average) and 150 µg/m3 (10-hour average), respectively. These are the same levels established by EPA for remediation activities at the GE-Pittsfield/Housatonic River Site.
Ambient Air Monitoring Plan PCBs & Particulate Matter Soil Handling Activities as part of Pipeline Project August 2010 Page 10
If the 10-hour average PM10 concentration at any non-background monitor exceeds the notification level of 120 ug/m3, regardless of background levels, the exceedance will be reported to EPA as soon as practical, but no later than 24 hours following receipt of the data showing the exceedance. GE will take appropriate steps to prevent an exceedance of the action level and will discuss with EPA the need for and type of additional response actions. The actions to be considered will include those previously implemented by GE at the other areas at the GE-Pittsfield/Housatonic River Site (e.g., increased frequency of monitoring, additional monitoring locations, increased use of dust suppression measures, modifications to dust-producing activities, and/or other appropriate response actions). In addition, GE will provide written notice of the exceedance to EPA within 72 hours following receipt of the data showing the exceedance.
If the 10-hour average PM10 concentration at any non-background monitor
exceeds the action level of 150 ug/m3, regardless of background level, GE will: (a) report such exceedance to EPA immediately within 24 hours following receipt of data showing the exceedance; (b) temporarily cease ongoing soil handling activities; (c) discuss with EPA appropriate immediate or short-term response actions to address the exceedance; and (d) provide written notice of the exceedance to EPA within 72 hours following receipt of the data showing the exceedance. In addition, GE will evaluate the cause of the exceedance and the need for additional engineering controls, discuss that evaluation with EPA, and propose to EPA appropriate engineering controls or other corrective actions. EPA approval of appropriate response actions and engineering controls, if proposed, will be required before GE resumes soil handling activities.
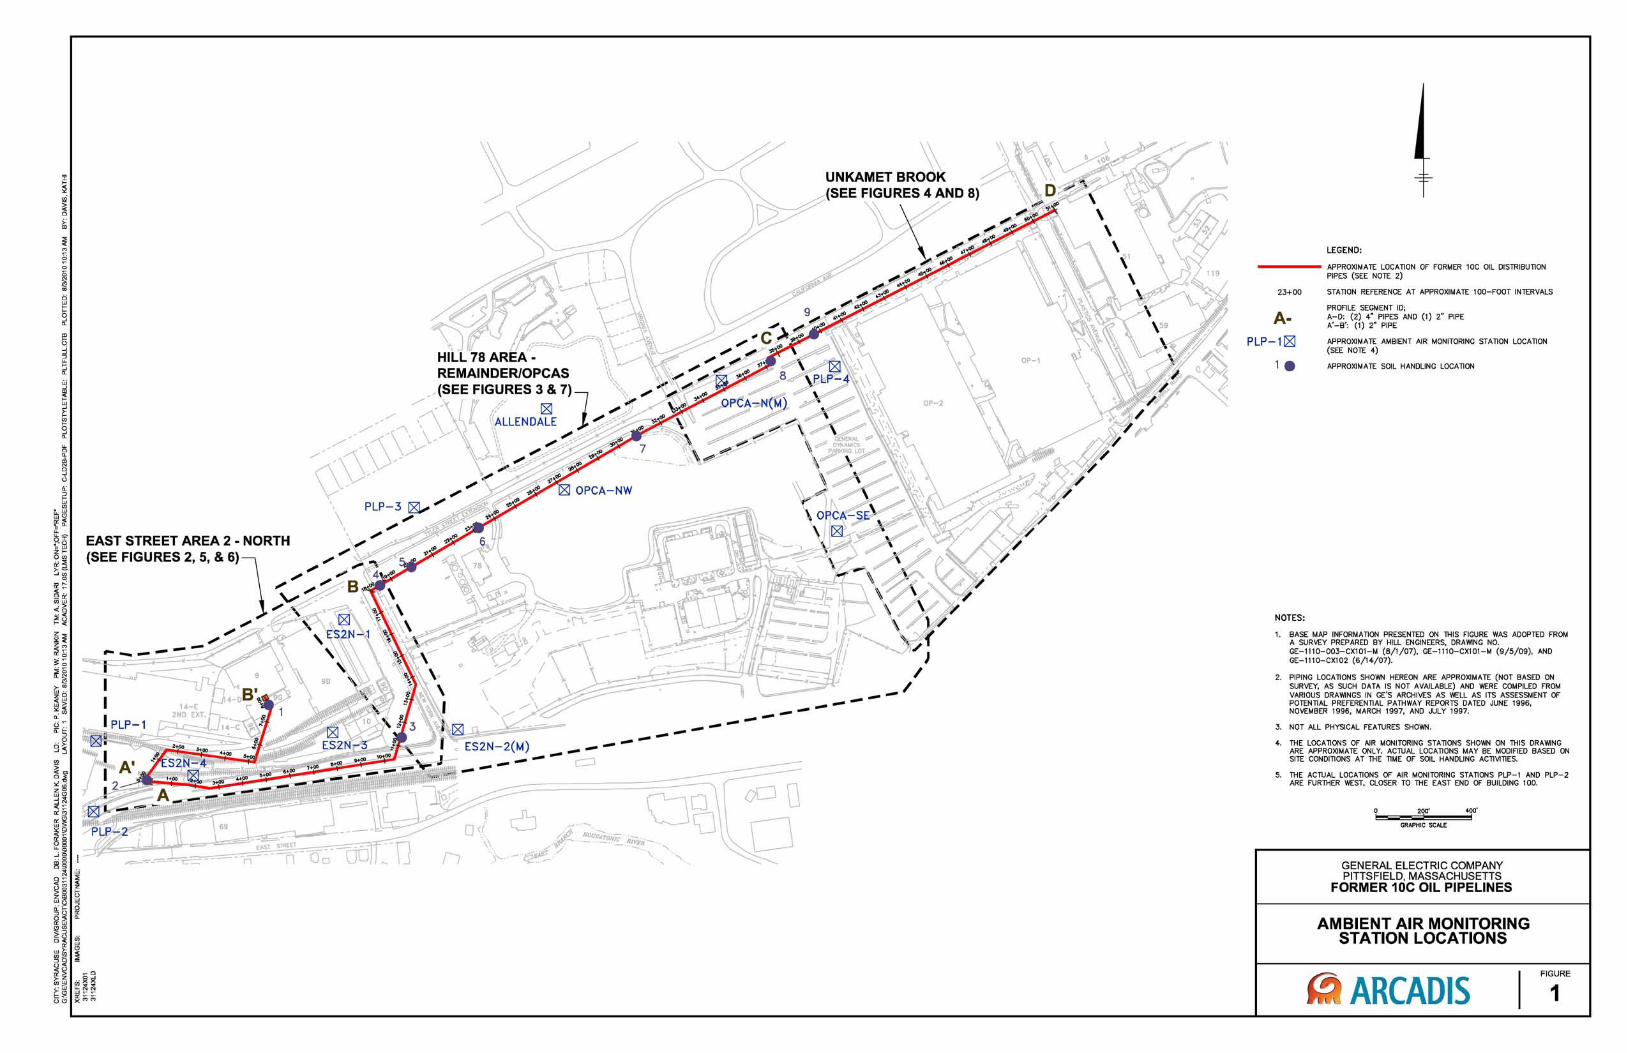
~ '" ~ 0
§ ~ ti w
5 a'
~ ~ ~ "-w
~ ~ ~ 9 "-u. 0 "-~ 0 ~
" a: ::l .... W en w
" < "-
I " w .... en ~ ~
~~ 9& enw ..(~ ~(§ .... <
~~ ~~ ;:;; ::Eo "-~
~~ <w w> ~~ "-
~~ 0 9;
f :g " ~
~ 9 § @:
i w ::;
'" ':!
~ t; w (3
'" Gi "-en ::l
" cii < w '" ~ " 1'i ~ <
" ~ :ll ~ 'i2 w
'" " x
, , \
EAST STREET AREA 2 - NORTH {SEE FIGURES 2,5, & 6)1 ".'"
". ,? ". ". ". ". -B
".V
".
". ".
~ UNKAMET BROOK
./\~. __ FIGURES 4 AND 8)
_/ ------------------------c:::J
\., "-"
LEGEND:
----- APPROXIMATE LOCATION OF FORMER 10C OIL DISTRIBUTION
23+00
APLP-1 C8J 1.
NOTES:
PIPES (SEE NOTE 2)
STATION REFERENCE AT APPROXIMATE 100-FOOT INTERVALS
PROFlLE SEGMENT 10; A-D: (2) 4" PIPES AND (1) 2" PIPE A'-B': (1) 2" PIPE
APPROXIMATE AMBIENT AIR MONITORING STATION LOCATION (SEE NOTE 4)
APPROXIMATE SOIL HANDLING LOCATION
1. BASE MAP INFORMATION PRESENTED ON THIS FIGURE WAS ADOPTED FROM A SURVEY PREPARED BY HILL ENGINEERS, DRAWING NO. GE-lll0-003-CX101-M (8/1/07), GE-lll0-CX10l-M (9/5/09), AND GE-1110-CX102 (6/14/07).
2. PIPING LOCATIONS SHOWN HEREON ARE APPROXIMATE (NOT BASED ON SURVEY, AS SUCH DATA IS NOT AVAILABLE) AND WERE COMPILED FROM VARIOUS DRAWINGS IN GE'S ARCHIVES AS WELL AS ITS ASSESSMENT OF POTENTIAL PREFERENTIAL PATHWAY REPORTS DATED JUNE 1996, NOVEMBER 1996, MARCH 1997, AND JULY 1997.
3. NOT ALL PHYSICAL FEATURES SHOWN.
4. THE LOCATIONS OF AIR MONITORING STATIONS SHOWN ON THIS DRA'MNG ARE APPROXIMATE ONLY. ACTUAL LOCATIONS MAY BE MODIFIED BASED ON SITE CONDITIONS AT THE TIME OF SOIL HANDLING ACTIVITIES.
5. THE ACTUAL LOCATIONS OF AIR MONITORING STATIONS PLP-l AND PLP-2 ARE FURTHER WEST, CLOSER TO THE EAST END OF BUILDING 100.
220' 400'
GRAPHIC SCALE
GENERAL ELECTRIC COMPANY PITTSFIELD, MASSACHUSETTS
FORMER 10C OIL PIPELINES
AMBIENT AIR MONITORING STATION LOCATIONS
ARCADIS FIGURE
1
Attachment 4
PCB Soil Data and Figures – Existing Samples Located within 50-Foot Band along Pipelines
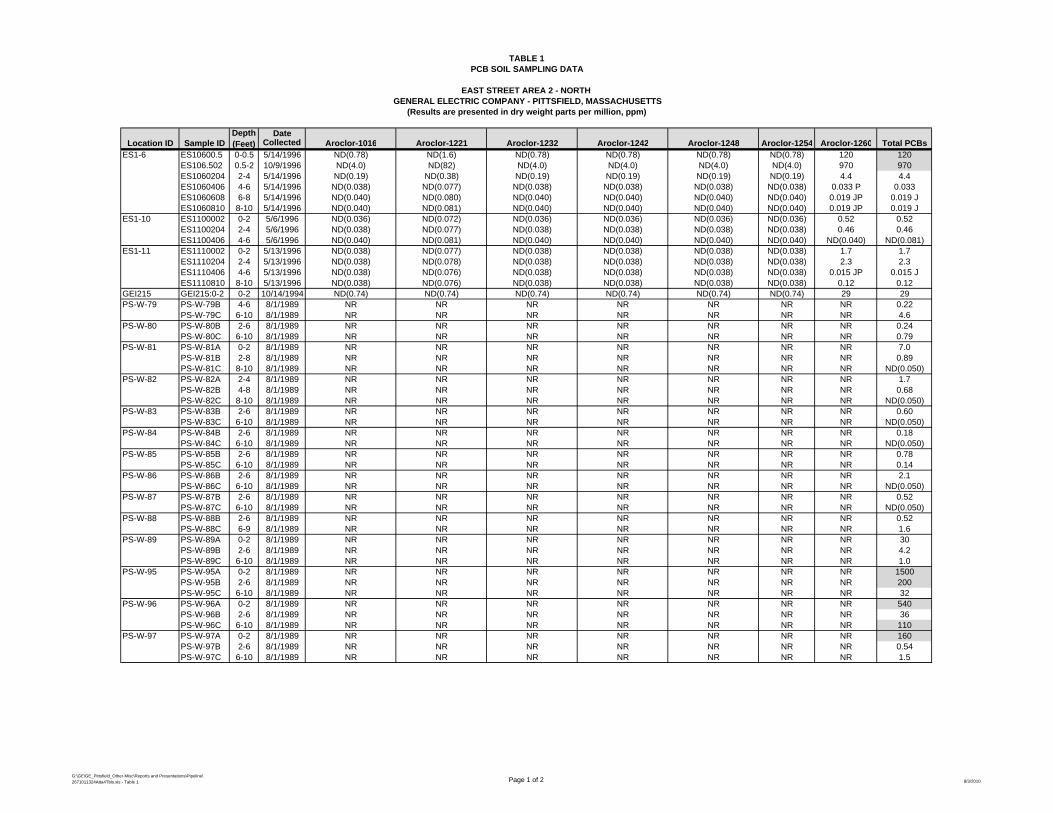
DateLocation ID Sample ID Collected Aroclor-1016 Aroclor-1221 Aroclor-1232 Aroclor-1242 Aroclor-1248 Aroclor-1254 Aroclor-1260 Total PCBs
ES1-6 ES10600.5 0-0.5 5/14/1996 ND(0.78) ND(1.6) ND(0.78) ND(0.78) ND(0.78) ND(0.78) 120 120ES106.502 0.5-2 10/9/1996 ND(4.0) ND(82) ND(4.0) ND(4.0) ND(4.0) ND(4.0) 970 970ES1060204 2-4 5/14/1996 ND(0.19) ND(0.38) ND(0.19) ND(0.19) ND(0.19) ND(0.19) 4.4 4.4ES1060406 4-6 5/14/1996 ND(0.038) ND(0.077) ND(0.038) ND(0.038) ND(0.038) ND(0.038) 0.033 P 0.033ES1060608 6-8 5/14/1996 ND(0.040) ND(0.080) ND(0.040) ND(0.040) ND(0.040) ND(0.040) 0.019 JP 0.019 JES1060810 8-10 5/14/1996 ND(0.040) ND(0.081) ND(0.040) ND(0.040) ND(0.040) ND(0.040) 0.019 JP 0.019 J
ES1-10 ES1100002 0-2 5/6/1996 ND(0.036) ND(0.072) ND(0.036) ND(0.036) ND(0.036) ND(0.036) 0.52 0.52ES1100204 2-4 5/6/1996 ND(0.038) ND(0.077) ND(0.038) ND(0.038) ND(0.038) ND(0.038) 0.46 0.46ES1100406 4-6 5/6/1996 ND(0.040) ND(0.081) ND(0.040) ND(0.040) ND(0.040) ND(0.040) ND(0.040) ND(0.081)
ES1-11 ES1110002 0-2 5/13/1996 ND(0.038) ND(0.077) ND(0.038) ND(0.038) ND(0.038) ND(0.038) 1.7 1.7ES1110204 2-4 5/13/1996 ND(0.038) ND(0.078) ND(0.038) ND(0.038) ND(0.038) ND(0.038) 2.3 2.3ES1110406 4-6 5/13/1996 ND(0.038) ND(0.076) ND(0.038) ND(0.038) ND(0.038) ND(0.038) 0.015 JP 0.015 JES1110810 8-10 5/13/1996 ND(0.038) ND(0.076) ND(0.038) ND(0.038) ND(0.038) ND(0.038) 0.12 0.12
GEI215 GEI215:0-2 0-2 10/14/1994 ND(0.74) ND(0.74) ND(0.74) ND(0.74) ND(0.74) ND(0.74) 29 29PS-W-79 PS-W-79B 4-6 8/1/1989 NR NR NR NR NR NR NR 0.22
PS-W-79C 6-10 8/1/1989 NR NR NR NR NR NR NR 4.6PS-W-80 PS-W-80B 2-6 8/1/1989 NR NR NR NR NR NR NR 0.24
PS-W-80C 6-10 8/1/1989 NR NR NR NR NR NR NR 0.79PS-W-81 PS-W-81A 0-2 8/1/1989 NR NR NR NR NR NR NR 7.0
PS-W-81B 2-8 8/1/1989 NR NR NR NR NR NR NR 0.89PS-W-81C 8-10 8/1/1989 NR NR NR NR NR NR NR ND(0.050)
PS-W-82 PS-W-82A 2-4 8/1/1989 NR NR NR NR NR NR NR 1.7PS-W-82B 4-8 8/1/1989 NR NR NR NR NR NR NR 0.68PS-W-82C 8-10 8/1/1989 NR NR NR NR NR NR NR ND(0.050)
PS-W-83 PS-W-83B 2-6 8/1/1989 NR NR NR NR NR NR NR 0.60PS-W-83C 6-10 8/1/1989 NR NR NR NR NR NR NR ND(0.050)
PS-W-84 PS-W-84B 2-6 8/1/1989 NR NR NR NR NR NR NR 0.18PS-W-84C 6-10 8/1/1989 NR NR NR NR NR NR NR ND(0.050)
PS-W-85 PS-W-85B 2-6 8/1/1989 NR NR NR NR NR NR NR 0.78PS-W-85C 6-10 8/1/1989 NR NR NR NR NR NR NR 0.14
PS-W-86 PS-W-86B 2-6 8/1/1989 NR NR NR NR NR NR NR 2.1PS-W-86C 6-10 8/1/1989 NR NR NR NR NR NR NR ND(0.050)
PS-W-87 PS-W-87B 2-6 8/1/1989 NR NR NR NR NR NR NR 0.52PS-W-87C 6-10 8/1/1989 NR NR NR NR NR NR NR ND(0.050)
PS-W-88 PS-W-88B 2-6 8/1/1989 NR NR NR NR NR NR NR 0.52PS-W-88C 6-9 8/1/1989 NR NR NR NR NR NR NR 1.6
PS-W-89 PS-W-89A 0-2 8/1/1989 NR NR NR NR NR NR NR 30PS-W-89B 2-6 8/1/1989 NR NR NR NR NR NR NR 4.2PS-W-89C 6-10 8/1/1989 NR NR NR NR NR NR NR 1.0
PS-W-95 PS-W-95A 0-2 8/1/1989 NR NR NR NR NR NR NR 1500PS-W-95B 2-6 8/1/1989 NR NR NR NR NR NR NR 200PS-W-95C 6-10 8/1/1989 NR NR NR NR NR NR NR 32
PS-W-96 PS-W-96A 0-2 8/1/1989 NR NR NR NR NR NR NR 540PS-W-96B 2-6 8/1/1989 NR NR NR NR NR NR NR 36PS-W-96C 6-10 8/1/1989 NR NR NR NR NR NR NR 110
PS-W-97 PS-W-97A 0-2 8/1/1989 NR NR NR NR NR NR NR 160PS-W-97B 2-6 8/1/1989 NR NR NR NR NR NR NR 0.54PS-W-97C 6-10 8/1/1989 NR NR NR NR NR NR NR 1.5
Depth(Feet)
(Results are presented in dry weight parts per million, ppm)GENERAL ELECTRIC COMPANY - PITTSFIELD, MASSACHUSETTS
EAST STREET AREA 2 - NORTH
PCB SOIL SAMPLING DATATABLE 1
G:\GE\GE_Pittsfield_Other-Misc\Reports and Presentations\Pipeline\2671011324Atta4Tbls.xls - Table 1 Page 1 of 2 8/3/2010
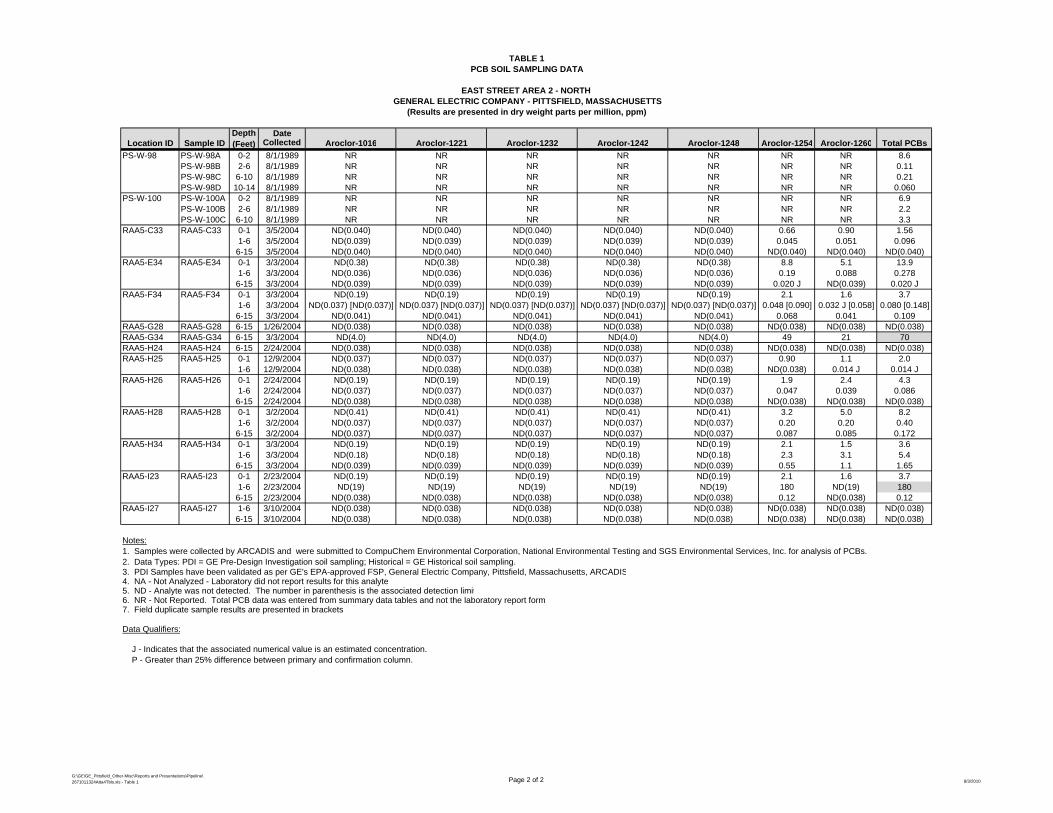
DateLocation ID Sample ID Collected Aroclor-1016 Aroclor-1221 Aroclor-1232 Aroclor-1242 Aroclor-1248 Aroclor-1254 Aroclor-1260 Total PCBs
Depth(Feet)
(Results are presented in dry weight parts per million, ppm)GENERAL ELECTRIC COMPANY - PITTSFIELD, MASSACHUSETTS
EAST STREET AREA 2 - NORTH
PCB SOIL SAMPLING DATATABLE 1
PS-W-98 PS-W-98A 0-2 8/1/1989 NR NR NR NR NR NR NR 8.6PS-W-98B 2-6 8/1/1989 NR NR NR NR NR NR NR 0.11PS-W-98C 6-10 8/1/1989 NR NR NR NR NR NR NR 0.21PS-W-98D 10-14 8/1/1989 NR NR NR NR NR NR NR 0.060
PS-W-100 PS-W-100A 0-2 8/1/1989 NR NR NR NR NR NR NR 6.9PS-W-100B 2-6 8/1/1989 NR NR NR NR NR NR NR 2.2PS-W-100C 6-10 8/1/1989 NR NR NR NR NR NR NR 3.3
RAA5-C33 RAA5-C33 0-1 3/5/2004 ND(0.040) ND(0.040) ND(0.040) ND(0.040) ND(0.040) 0.66 0.90 1.561-6 3/5/2004 ND(0.039) ND(0.039) ND(0.039) ND(0.039) ND(0.039) 0.045 0.051 0.096
6-15 3/5/2004 ND(0.040) ND(0.040) ND(0.040) ND(0.040) ND(0.040) ND(0.040) ND(0.040) ND(0.040)RAA5-E34 RAA5-E34 0-1 3/3/2004 ND(0.38) ND(0.38) ND(0.38) ND(0.38) ND(0.38) 8.8 5.1 13.9
1-6 3/3/2004 ND(0.036) ND(0.036) ND(0.036) ND(0.036) ND(0.036) 0.19 0.088 0.2786-15 3/3/2004 ND(0.039) ND(0.039) ND(0.039) ND(0.039) ND(0.039) 0.020 J ND(0.039) 0.020 J
RAA5-F34 RAA5-F34 0-1 3/3/2004 ND(0.19) ND(0.19) ND(0.19) ND(0.19) ND(0.19) 2.1 1.6 3.71-6 3/3/2004 ND(0.037) [ND(0.037)] ND(0.037) [ND(0.037)] ND(0.037) [ND(0.037)] ND(0.037) [ND(0.037)] ND(0.037) [ND(0.037)] 0.048 [0.090] 0.032 J [0.058] 0.080 [0.148]
6-15 3/3/2004 ND(0.041) ND(0.041) ND(0.041) ND(0.041) ND(0.041) 0.068 0.041 0.109RAA5-G28 RAA5-G28 6-15 1/26/2004 ND(0.038) ND(0.038) ND(0.038) ND(0.038) ND(0.038) ND(0.038) ND(0.038) ND(0.038)RAA5-G34 RAA5-G34 6-15 3/3/2004 ND(4.0) ND(4.0) ND(4.0) ND(4.0) ND(4.0) 49 21 70RAA5-H24 RAA5-H24 6-15 2/24/2004 ND(0.038) ND(0.038) ND(0.038) ND(0.038) ND(0.038) ND(0.038) ND(0.038) ND(0.038)RAA5-H25 RAA5-H25 0-1 12/9/2004 ND(0.037) ND(0.037) ND(0.037) ND(0.037) ND(0.037) 0.90 1.1 2.0
1-6 12/9/2004 ND(0.038) ND(0.038) ND(0.038) ND(0.038) ND(0.038) ND(0.038) 0.014 J 0.014 JRAA5-H26 RAA5-H26 0-1 2/24/2004 ND(0.19) ND(0.19) ND(0.19) ND(0.19) ND(0.19) 1.9 2.4 4.3
1-6 2/24/2004 ND(0.037) ND(0.037) ND(0.037) ND(0.037) ND(0.037) 0.047 0.039 0.0866-15 2/24/2004 ND(0.038) ND(0.038) ND(0.038) ND(0.038) ND(0.038) ND(0.038) ND(0.038) ND(0.038)
RAA5-H28 RAA5-H28 0-1 3/2/2004 ND(0.41) ND(0.41) ND(0.41) ND(0.41) ND(0.41) 3.2 5.0 8.21-6 3/2/2004 ND(0.037) ND(0.037) ND(0.037) ND(0.037) ND(0.037) 0.20 0.20 0.40
6-15 3/2/2004 ND(0.037) ND(0.037) ND(0.037) ND(0.037) ND(0.037) 0.087 0.085 0.172RAA5-H34 RAA5-H34 0-1 3/3/2004 ND(0.19) ND(0.19) ND(0.19) ND(0.19) ND(0.19) 2.1 1.5 3.6
1-6 3/3/2004 ND(0.18) ND(0.18) ND(0.18) ND(0.18) ND(0.18) 2.3 3.1 5.46-15 3/3/2004 ND(0.039) ND(0.039) ND(0.039) ND(0.039) ND(0.039) 0.55 1.1 1.65
RAA5-I23 RAA5-I23 0-1 2/23/2004 ND(0.19) ND(0.19) ND(0.19) ND(0.19) ND(0.19) 2.1 1.6 3.71-6 2/23/2004 ND(19) ND(19) ND(19) ND(19) ND(19) 180 ND(19) 180
6-15 2/23/2004 ND(0.038) ND(0.038) ND(0.038) ND(0.038) ND(0.038) 0.12 ND(0.038) 0.12RAA5-I27 RAA5-I27 1-6 3/10/2004 ND(0.038) ND(0.038) ND(0.038) ND(0.038) ND(0.038) ND(0.038) ND(0.038) ND(0.038)
6-15 3/10/2004 ND(0.038) ND(0.038) ND(0.038) ND(0.038) ND(0.038) ND(0.038) ND(0.038) ND(0.038)
Notes:1. Samples were collected by ARCADIS and were submitted to CompuChem Environmental Corporation, National Environmental Testing and SGS Environmental Services, Inc. for analysis of PCBs. 2. Data Types: PDI = GE Pre-Design Investigation soil sampling; Historical = GE Historical soil sampling.3. PDI Samples have been validated as per GE's EPA-approved FSP, General Electric Company, Pittsfield, Massachusetts, ARCADIS4. NA - Not Analyzed - Laboratory did not report results for this analyte5. ND - Analyte was not detected. The number in parenthesis is the associated detection limit6. NR - Not Reported. Total PCB data was entered from summary data tables and not the laboratory report form7. Field duplicate sample results are presented in brackets
Data Qualifiers: J - Indicates that the associated numerical value is an estimated concentration. P - Greater than 25% difference between primary and confirmation column.
G:\GE\GE_Pittsfield_Other-Misc\Reports and Presentations\Pipeline\2671011324Atta4Tbls.xls - Table 1 Page 2 of 2 8/3/2010
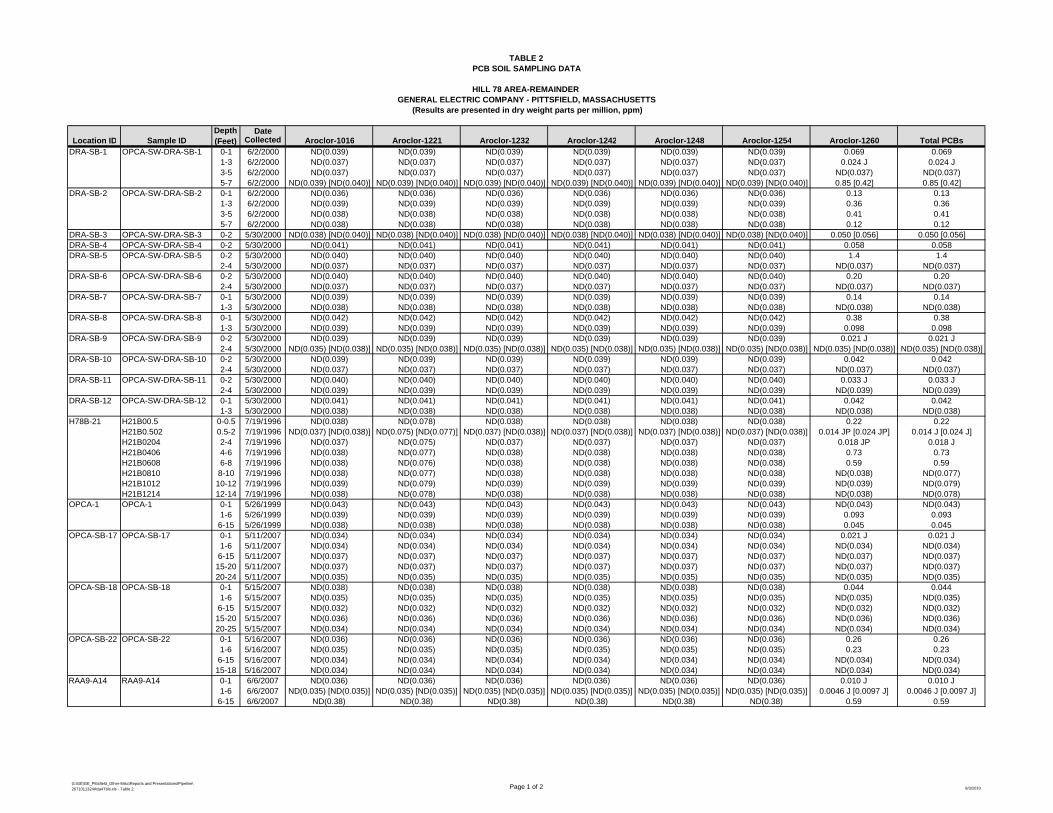
DateLocation ID Sample ID Collected Aroclor-1016 Aroclor-1221 Aroclor-1232 Aroclor-1242 Aroclor-1248 Aroclor-1254 Aroclor-1260 Total PCBs
DRA-SB-1 OPCA-SW-DRA-SB-1 0-1 6/2/2000 ND(0.039) ND(0.039) ND(0.039) ND(0.039) ND(0.039) ND(0.039) 0.069 0.0691-3 6/2/2000 ND(0.037) ND(0.037) ND(0.037) ND(0.037) ND(0.037) ND(0.037) 0.024 J 0.024 J3-5 6/2/2000 ND(0.037) ND(0.037) ND(0.037) ND(0.037) ND(0.037) ND(0.037) ND(0.037) ND(0.037)5-7 6/2/2000 ND(0.039) [ND(0.040)] ND(0.039) [ND(0.040)] ND(0.039) [ND(0.040)] ND(0.039) [ND(0.040)] ND(0.039) [ND(0.040)] ND(0.039) [ND(0.040)] 0.85 [0.42] 0.85 [0.42]
DRA-SB-2 OPCA-SW-DRA-SB-2 0-1 6/2/2000 ND(0.036) ND(0.036) ND(0.036) ND(0.036) ND(0.036) ND(0.036) 0.13 0.131-3 6/2/2000 ND(0.039) ND(0.039) ND(0.039) ND(0.039) ND(0.039) ND(0.039) 0.36 0.363-5 6/2/2000 ND(0.038) ND(0.038) ND(0.038) ND(0.038) ND(0.038) ND(0.038) 0.41 0.415-7 6/2/2000 ND(0.038) ND(0.038) ND(0.038) ND(0.038) ND(0.038) ND(0.038) 0.12 0.12
DRA-SB-3 OPCA-SW-DRA-SB-3 0-2 5/30/2000 ND(0.038) [ND(0.040)] ND(0.038) [ND(0.040)] ND(0.038) [ND(0.040)] ND(0.038) [ND(0.040)] ND(0.038) [ND(0.040)] ND(0.038) [ND(0.040)] 0.050 [0.056] 0.050 [0.056]DRA-SB-4 OPCA-SW-DRA-SB-4 0-2 5/30/2000 ND(0.041) ND(0.041) ND(0.041) ND(0.041) ND(0.041) ND(0.041) 0.058 0.058DRA-SB-5 OPCA-SW-DRA-SB-5 0-2 5/30/2000 ND(0.040) ND(0.040) ND(0.040) ND(0.040) ND(0.040) ND(0.040) 1.4 1.4
2-4 5/30/2000 ND(0.037) ND(0.037) ND(0.037) ND(0.037) ND(0.037) ND(0.037) ND(0.037) ND(0.037)DRA-SB-6 OPCA-SW-DRA-SB-6 0-2 5/30/2000 ND(0.040) ND(0.040) ND(0.040) ND(0.040) ND(0.040) ND(0.040) 0.20 0.20
2-4 5/30/2000 ND(0.037) ND(0.037) ND(0.037) ND(0.037) ND(0.037) ND(0.037) ND(0.037) ND(0.037)DRA-SB-7 OPCA-SW-DRA-SB-7 0-1 5/30/2000 ND(0.039) ND(0.039) ND(0.039) ND(0.039) ND(0.039) ND(0.039) 0.14 0.14
1-3 5/30/2000 ND(0.038) ND(0.038) ND(0.038) ND(0.038) ND(0.038) ND(0.038) ND(0.038) ND(0.038)DRA-SB-8 OPCA-SW-DRA-SB-8 0-1 5/30/2000 ND(0.042) ND(0.042) ND(0.042) ND(0.042) ND(0.042) ND(0.042) 0.38 0.38
1-3 5/30/2000 ND(0.039) ND(0.039) ND(0.039) ND(0.039) ND(0.039) ND(0.039) 0.098 0.098DRA-SB-9 OPCA-SW-DRA-SB-9 0-2 5/30/2000 ND(0.039) ND(0.039) ND(0.039) ND(0.039) ND(0.039) ND(0.039) 0.021 J 0.021 J
2-4 5/30/2000 ND(0.035) [ND(0.038)] ND(0.035) [ND(0.038)] ND(0.035) [ND(0.038)] ND(0.035) [ND(0.038)] ND(0.035) [ND(0.038)] ND(0.035) [ND(0.038)] ND(0.035) [ND(0.038)] ND(0.035) [ND(0.038)]DRA-SB-10 OPCA-SW-DRA-SB-10 0-2 5/30/2000 ND(0.039) ND(0.039) ND(0.039) ND(0.039) ND(0.039) ND(0.039) 0.042 0.042
2-4 5/30/2000 ND(0.037) ND(0.037) ND(0.037) ND(0.037) ND(0.037) ND(0.037) ND(0.037) ND(0.037)DRA-SB-11 OPCA-SW-DRA-SB-11 0-2 5/30/2000 ND(0.040) ND(0.040) ND(0.040) ND(0.040) ND(0.040) ND(0.040) 0.033 J 0.033 J
2-4 5/30/2000 ND(0.039) ND(0.039) ND(0.039) ND(0.039) ND(0.039) ND(0.039) ND(0.039) ND(0.039)DRA-SB-12 OPCA-SW-DRA-SB-12 0-1 5/30/2000 ND(0.041) ND(0.041) ND(0.041) ND(0.041) ND(0.041) ND(0.041) 0.042 0.042
1-3 5/30/2000 ND(0.038) ND(0.038) ND(0.038) ND(0.038) ND(0.038) ND(0.038) ND(0.038) ND(0.038)H78B-21 H21B00.5 0-0.5 7/19/1996 ND(0.038) ND(0.078) ND(0.038) ND(0.038) ND(0.038) ND(0.038) 0.22 0.22
H21B0.502 0.5-2 7/19/1996 ND(0.037) [ND(0.038)] ND(0.075) [ND(0.077)] ND(0.037) [ND(0.038)] ND(0.037) [ND(0.038)] ND(0.037) [ND(0.038)] ND(0.037) [ND(0.038)] 0.014 JP [0.024 JP] 0.014 J [0.024 J]H21B0204 2-4 7/19/1996 ND(0.037) ND(0.075) ND(0.037) ND(0.037) ND(0.037) ND(0.037) 0.018 JP 0.018 JH21B0406 4-6 7/19/1996 ND(0.038) ND(0.077) ND(0.038) ND(0.038) ND(0.038) ND(0.038) 0.73 0.73H21B0608 6-8 7/19/1996 ND(0.038) ND(0.076) ND(0.038) ND(0.038) ND(0.038) ND(0.038) 0.59 0.59H21B0810 8-10 7/19/1996 ND(0.038) ND(0.077) ND(0.038) ND(0.038) ND(0.038) ND(0.038) ND(0.038) ND(0.077)H21B1012 10-12 7/19/1996 ND(0.039) ND(0.079) ND(0.039) ND(0.039) ND(0.039) ND(0.039) ND(0.039) ND(0.079)H21B1214 12-14 7/19/1996 ND(0.038) ND(0.078) ND(0.038) ND(0.038) ND(0.038) ND(0.038) ND(0.038) ND(0.078)
OPCA-1 OPCA-1 0-1 5/26/1999 ND(0.043) ND(0.043) ND(0.043) ND(0.043) ND(0.043) ND(0.043) ND(0.043) ND(0.043)1-6 5/26/1999 ND(0.039) ND(0.039) ND(0.039) ND(0.039) ND(0.039) ND(0.039) 0.093 0.0936-15 5/26/1999 ND(0.038) ND(0.038) ND(0.038) ND(0.038) ND(0.038) ND(0.038) 0.045 0.045
OPCA-SB-17 OPCA-SB-17 0-1 5/11/2007 ND(0.034) ND(0.034) ND(0.034) ND(0.034) ND(0.034) ND(0.034) 0.021 J 0.021 J1-6 5/11/2007 ND(0.034) ND(0.034) ND(0.034) ND(0.034) ND(0.034) ND(0.034) ND(0.034) ND(0.034)6-15 5/11/2007 ND(0.037) ND(0.037) ND(0.037) ND(0.037) ND(0.037) ND(0.037) ND(0.037) ND(0.037)15-20 5/11/2007 ND(0.037) ND(0.037) ND(0.037) ND(0.037) ND(0.037) ND(0.037) ND(0.037) ND(0.037)20-24 5/11/2007 ND(0.035) ND(0.035) ND(0.035) ND(0.035) ND(0.035) ND(0.035) ND(0.035) ND(0.035)
OPCA-SB-18 OPCA-SB-18 0-1 5/15/2007 ND(0.038) ND(0.038) ND(0.038) ND(0.038) ND(0.038) ND(0.038) 0.044 0.0441-6 5/15/2007 ND(0.035) ND(0.035) ND(0.035) ND(0.035) ND(0.035) ND(0.035) ND(0.035) ND(0.035)6-15 5/15/2007 ND(0.032) ND(0.032) ND(0.032) ND(0.032) ND(0.032) ND(0.032) ND(0.032) ND(0.032)15-20 5/15/2007 ND(0.036) ND(0.036) ND(0.036) ND(0.036) ND(0.036) ND(0.036) ND(0.036) ND(0.036)20-25 5/15/2007 ND(0.034) ND(0.034) ND(0.034) ND(0.034) ND(0.034) ND(0.034) ND(0.034) ND(0.034)
OPCA-SB-22 OPCA-SB-22 0-1 5/16/2007 ND(0.036) ND(0.036) ND(0.036) ND(0.036) ND(0.036) ND(0.036) 0.26 0.261-6 5/16/2007 ND(0.035) ND(0.035) ND(0.035) ND(0.035) ND(0.035) ND(0.035) 0.23 0.236-15 5/16/2007 ND(0.034) ND(0.034) ND(0.034) ND(0.034) ND(0.034) ND(0.034) ND(0.034) ND(0.034)15-18 5/16/2007 ND(0.034) ND(0.034) ND(0.034) ND(0.034) ND(0.034) ND(0.034) ND(0.034) ND(0.034)
RAA9-A14 RAA9-A14 0-1 6/6/2007 ND(0.036) ND(0.036) ND(0.036) ND(0.036) ND(0.036) ND(0.036) 0.010 J 0.010 J1-6 6/6/2007 ND(0.035) [ND(0.035)] ND(0.035) [ND(0.035)] ND(0.035) [ND(0.035)] ND(0.035) [ND(0.035)] ND(0.035) [ND(0.035)] ND(0.035) [ND(0.035)] 0.0046 J [0.0097 J] 0.0046 J [0.0097 J]6-15 6/6/2007 ND(0.38) ND(0.38) ND(0.38) ND(0.38) ND(0.38) ND(0.38) 0.59 0.59
TABLE 2
Depth(Feet)
(Results are presented in dry weight parts per million, ppm)GENERAL ELECTRIC COMPANY - PITTSFIELD, MASSACHUSETTS
HILL 78 AREA-REMAINDER
PCB SOIL SAMPLING DATA
G:\GE\GE_Pittsfield_Other-Misc\Reports and Presentations\Pipeline\2671011324Atta4Tbls.xls - Table 2 Page 1 of 2 8/3/2010
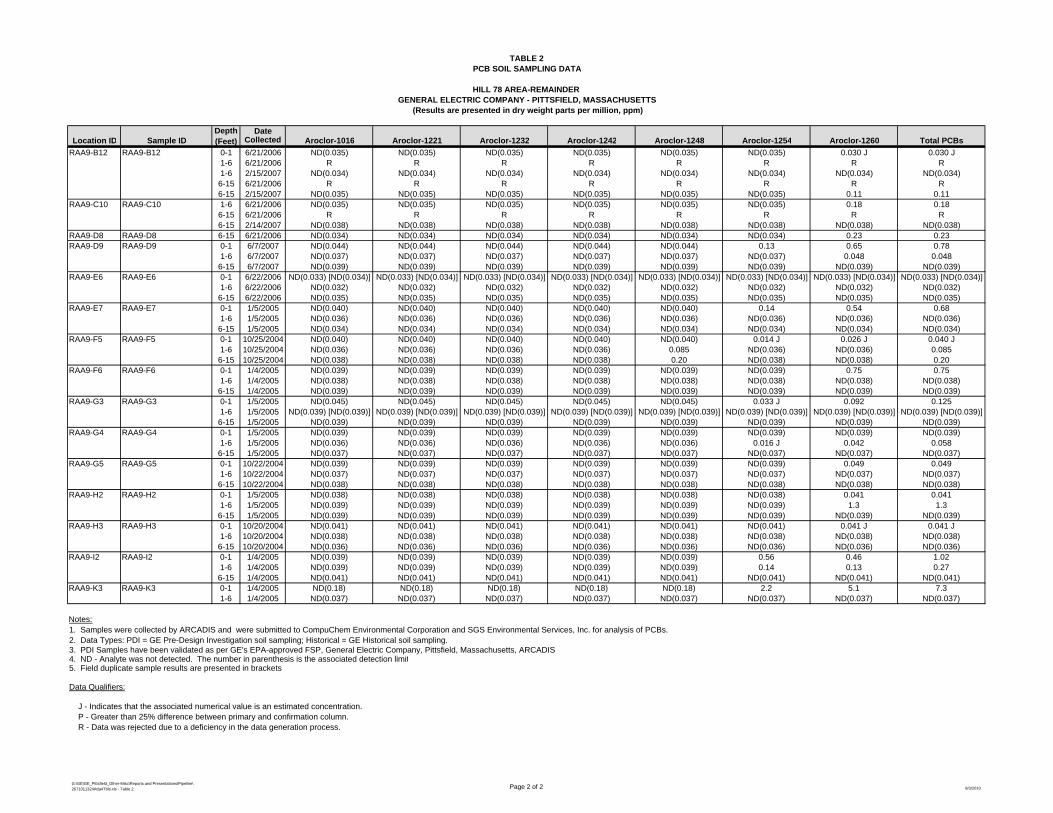
DateLocation ID Sample ID Collected Aroclor-1016 Aroclor-1221 Aroclor-1232 Aroclor-1242 Aroclor-1248 Aroclor-1254 Aroclor-1260 Total PCBs
TABLE 2
Depth(Feet)
(Results are presented in dry weight parts per million, ppm)GENERAL ELECTRIC COMPANY - PITTSFIELD, MASSACHUSETTS
HILL 78 AREA-REMAINDER
PCB SOIL SAMPLING DATA
RAA9-B12 RAA9-B12 0-1 6/21/2006 ND(0.035) ND(0.035) ND(0.035) ND(0.035) ND(0.035) ND(0.035) 0.030 J 0.030 J1-6 6/21/2006 R R R R R R R R1-6 2/15/2007 ND(0.034) ND(0.034) ND(0.034) ND(0.034) ND(0.034) ND(0.034) ND(0.034) ND(0.034)6-15 6/21/2006 R R R R R R R R6-15 2/15/2007 ND(0.035) ND(0.035) ND(0.035) ND(0.035) ND(0.035) ND(0.035) 0.11 0.11
RAA9-C10 RAA9-C10 1-6 6/21/2006 ND(0.035) ND(0.035) ND(0.035) ND(0.035) ND(0.035) ND(0.035) 0.18 0.186-15 6/21/2006 R R R R R R R R6-15 2/14/2007 ND(0.038) ND(0.038) ND(0.038) ND(0.038) ND(0.038) ND(0.038) ND(0.038) ND(0.038)
RAA9-D8 RAA9-D8 6-15 6/21/2006 ND(0.034) ND(0.034) ND(0.034) ND(0.034) ND(0.034) ND(0.034) 0.23 0.23RAA9-D9 RAA9-D9 0-1 6/7/2007 ND(0.044) ND(0.044) ND(0.044) ND(0.044) ND(0.044) 0.13 0.65 0.78
1-6 6/7/2007 ND(0.037) ND(0.037) ND(0.037) ND(0.037) ND(0.037) ND(0.037) 0.048 0.0486-15 6/7/2007 ND(0.039) ND(0.039) ND(0.039) ND(0.039) ND(0.039) ND(0.039) ND(0.039) ND(0.039)
RAA9-E6 RAA9-E6 0-1 6/22/2006 ND(0.033) [ND(0.034)] ND(0.033) [ND(0.034)] ND(0.033) [ND(0.034)] ND(0.033) [ND(0.034)] ND(0.033) [ND(0.034)] ND(0.033) [ND(0.034)] ND(0.033) [ND(0.034)] ND(0.033) [ND(0.034)]1-6 6/22/2006 ND(0.032) ND(0.032) ND(0.032) ND(0.032) ND(0.032) ND(0.032) ND(0.032) ND(0.032)6-15 6/22/2006 ND(0.035) ND(0.035) ND(0.035) ND(0.035) ND(0.035) ND(0.035) ND(0.035) ND(0.035)
RAA9-E7 RAA9-E7 0-1 1/5/2005 ND(0.040) ND(0.040) ND(0.040) ND(0.040) ND(0.040) 0.14 0.54 0.681-6 1/5/2005 ND(0.036) ND(0.036) ND(0.036) ND(0.036) ND(0.036) ND(0.036) ND(0.036) ND(0.036)6-15 1/5/2005 ND(0.034) ND(0.034) ND(0.034) ND(0.034) ND(0.034) ND(0.034) ND(0.034) ND(0.034)
RAA9-F5 RAA9-F5 0-1 10/25/2004 ND(0.040) ND(0.040) ND(0.040) ND(0.040) ND(0.040) 0.014 J 0.026 J 0.040 J1-6 10/25/2004 ND(0.036) ND(0.036) ND(0.036) ND(0.036) 0.085 ND(0.036) ND(0.036) 0.0856-15 10/25/2004 ND(0.038) ND(0.038) ND(0.038) ND(0.038) 0.20 ND(0.038) ND(0.038) 0.20
RAA9-F6 RAA9-F6 0-1 1/4/2005 ND(0.039) ND(0.039) ND(0.039) ND(0.039) ND(0.039) ND(0.039) 0.75 0.751-6 1/4/2005 ND(0.038) ND(0.038) ND(0.038) ND(0.038) ND(0.038) ND(0.038) ND(0.038) ND(0.038)6-15 1/4/2005 ND(0.039) ND(0.039) ND(0.039) ND(0.039) ND(0.039) ND(0.039) ND(0.039) ND(0.039)
RAA9-G3 RAA9-G3 0-1 1/5/2005 ND(0.045) ND(0.045) ND(0.045) ND(0.045) ND(0.045) 0.033 J 0.092 0.1251-6 1/5/2005 ND(0.039) [ND(0.039)] ND(0.039) [ND(0.039)] ND(0.039) [ND(0.039)] ND(0.039) [ND(0.039)] ND(0.039) [ND(0.039)] ND(0.039) [ND(0.039)] ND(0.039) [ND(0.039)] ND(0.039) [ND(0.039)]6-15 1/5/2005 ND(0.039) ND(0.039) ND(0.039) ND(0.039) ND(0.039) ND(0.039) ND(0.039) ND(0.039)
RAA9-G4 RAA9-G4 0-1 1/5/2005 ND(0.039) ND(0.039) ND(0.039) ND(0.039) ND(0.039) ND(0.039) ND(0.039) ND(0.039)1-6 1/5/2005 ND(0.036) ND(0.036) ND(0.036) ND(0.036) ND(0.036) 0.016 J 0.042 0.0586-15 1/5/2005 ND(0.037) ND(0.037) ND(0.037) ND(0.037) ND(0.037) ND(0.037) ND(0.037) ND(0.037)
RAA9-G5 RAA9-G5 0-1 10/22/2004 ND(0.039) ND(0.039) ND(0.039) ND(0.039) ND(0.039) ND(0.039) 0.049 0.0491-6 10/22/2004 ND(0.037) ND(0.037) ND(0.037) ND(0.037) ND(0.037) ND(0.037) ND(0.037) ND(0.037)6-15 10/22/2004 ND(0.038) ND(0.038) ND(0.038) ND(0.038) ND(0.038) ND(0.038) ND(0.038) ND(0.038)
RAA9-H2 RAA9-H2 0-1 1/5/2005 ND(0.038) ND(0.038) ND(0.038) ND(0.038) ND(0.038) ND(0.038) 0.041 0.0411-6 1/5/2005 ND(0.039) ND(0.039) ND(0.039) ND(0.039) ND(0.039) ND(0.039) 1.3 1.36-15 1/5/2005 ND(0.039) ND(0.039) ND(0.039) ND(0.039) ND(0.039) ND(0.039) ND(0.039) ND(0.039)
RAA9-H3 RAA9-H3 0-1 10/20/2004 ND(0.041) ND(0.041) ND(0.041) ND(0.041) ND(0.041) ND(0.041) 0.041 J 0.041 J1-6 10/20/2004 ND(0.038) ND(0.038) ND(0.038) ND(0.038) ND(0.038) ND(0.038) ND(0.038) ND(0.038)6-15 10/20/2004 ND(0.036) ND(0.036) ND(0.036) ND(0.036) ND(0.036) ND(0.036) ND(0.036) ND(0.036)
RAA9-I2 RAA9-I2 0-1 1/4/2005 ND(0.039) ND(0.039) ND(0.039) ND(0.039) ND(0.039) 0.56 0.46 1.021-6 1/4/2005 ND(0.039) ND(0.039) ND(0.039) ND(0.039) ND(0.039) 0.14 0.13 0.276-15 1/4/2005 ND(0.041) ND(0.041) ND(0.041) ND(0.041) ND(0.041) ND(0.041) ND(0.041) ND(0.041)
RAA9-K3 RAA9-K3 0-1 1/4/2005 ND(0.18) ND(0.18) ND(0.18) ND(0.18) ND(0.18) 2.2 5.1 7.31-6 1/4/2005 ND(0.037) ND(0.037) ND(0.037) ND(0.037) ND(0.037) ND(0.037) ND(0.037) ND(0.037)
Notes:1. Samples were collected by ARCADIS and were submitted to CompuChem Environmental Corporation and SGS Environmental Services, Inc. for analysis of PCBs. 2. Data Types: PDI = GE Pre-Design Investigation soil sampling; Historical = GE Historical soil sampling.3. PDI Samples have been validated as per GE's EPA-approved FSP, General Electric Company, Pittsfield, Massachusetts, ARCADIS4. ND - Analyte was not detected. The number in parenthesis is the associated detection limit5. Field duplicate sample results are presented in brackets
Data Qualifiers: J - Indicates that the associated numerical value is an estimated concentration. P - Greater than 25% difference between primary and confirmation column. R - Data was rejected due to a deficiency in the data generation process.
G:\GE\GE_Pittsfield_Other-Misc\Reports and Presentations\Pipeline\2671011324Atta4Tbls.xls - Table 2 Page 2 of 2 8/3/2010
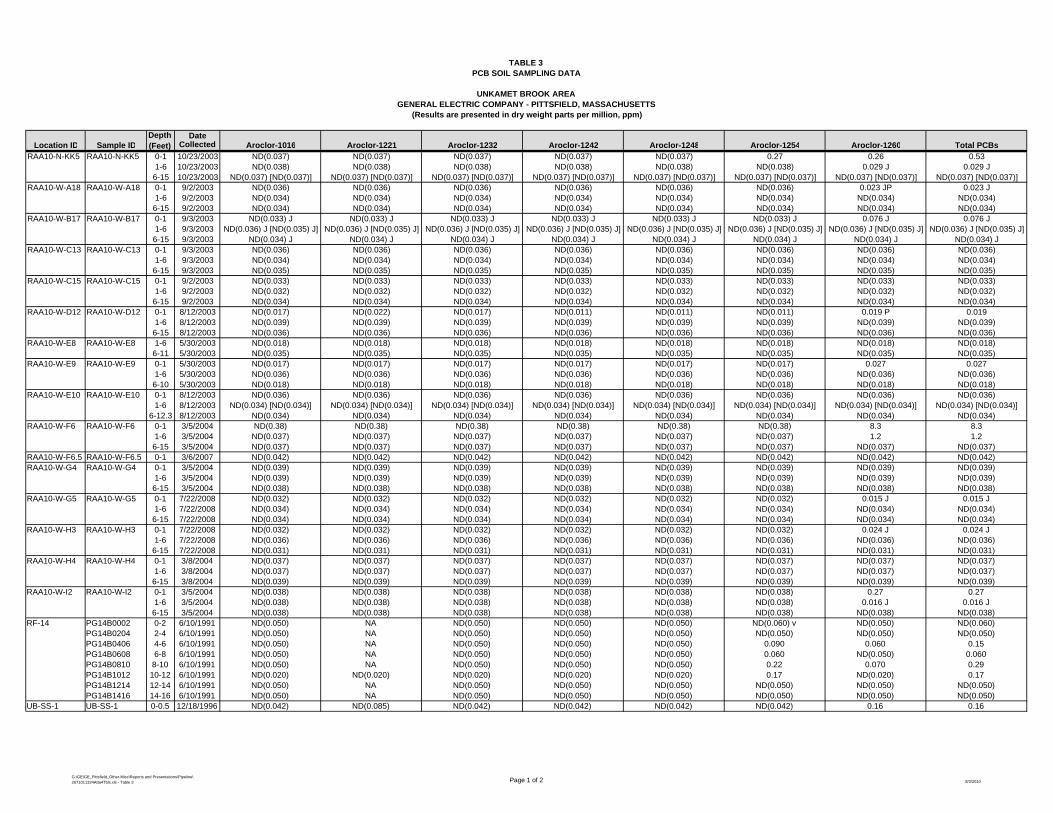
DateLocation ID Sample ID Collected Aroclor-1016 Aroclor-1221 Aroclor-1232 Aroclor-1242 Aroclor-1248 Aroclor-1254 Aroclor-1260 Total PCBs
RAA10-N-KK5 RAA10-N-KK5 0-1 10/23/2003 ND(0.037) ND(0.037) ND(0.037) ND(0.037) ND(0.037) 0.27 0.26 0.531-6 10/23/2003 ND(0.038) ND(0.038) ND(0.038) ND(0.038) ND(0.038) ND(0.038) 0.029 J 0.029 J6-15 10/23/2003 ND(0.037) [ND(0.037)] ND(0.037) [ND(0.037)] ND(0.037) [ND(0.037)] ND(0.037) [ND(0.037)] ND(0.037) [ND(0.037)] ND(0.037) [ND(0.037)] ND(0.037) [ND(0.037)] ND(0.037) [ND(0.037)]
RAA10-W-A18 RAA10-W-A18 0-1 9/2/2003 ND(0.036) ND(0.036) ND(0.036) ND(0.036) ND(0.036) ND(0.036) 0.023 JP 0.023 J1-6 9/2/2003 ND(0.034) ND(0.034) ND(0.034) ND(0.034) ND(0.034) ND(0.034) ND(0.034) ND(0.034)6-15 9/2/2003 ND(0.034) ND(0.034) ND(0.034) ND(0.034) ND(0.034) ND(0.034) ND(0.034) ND(0.034)
RAA10-W-B17 RAA10-W-B17 0-1 9/3/2003 ND(0.033) J ND(0.033) J ND(0.033) J ND(0.033) J ND(0.033) J ND(0.033) J 0.076 J 0.076 J1-6 9/3/2003 ND(0.036) J [ND(0.035) J] ND(0.036) J [ND(0.035) J] ND(0.036) J [ND(0.035) J] ND(0.036) J [ND(0.035) J] ND(0.036) J [ND(0.035) J] ND(0.036) J [ND(0.035) J] ND(0.036) J [ND(0.035) J] ND(0.036) J [ND(0.035) J]6-15 9/3/2003 ND(0.034) J ND(0.034) J ND(0.034) J ND(0.034) J ND(0.034) J ND(0.034) J ND(0.034) J ND(0.034) J
RAA10-W-C13 RAA10-W-C13 0-1 9/3/2003 ND(0.036) ND(0.036) ND(0.036) ND(0.036) ND(0.036) ND(0.036) ND(0.036) ND(0.036)1-6 9/3/2003 ND(0.034) ND(0.034) ND(0.034) ND(0.034) ND(0.034) ND(0.034) ND(0.034) ND(0.034)6-15 9/3/2003 ND(0.035) ND(0.035) ND(0.035) ND(0.035) ND(0.035) ND(0.035) ND(0.035) ND(0.035)
RAA10-W-C15 RAA10-W-C15 0-1 9/2/2003 ND(0.033) ND(0.033) ND(0.033) ND(0.033) ND(0.033) ND(0.033) ND(0.033) ND(0.033)1-6 9/2/2003 ND(0.032) ND(0.032) ND(0.032) ND(0.032) ND(0.032) ND(0.032) ND(0.032) ND(0.032)6-15 9/2/2003 ND(0.034) ND(0.034) ND(0.034) ND(0.034) ND(0.034) ND(0.034) ND(0.034) ND(0.034)
RAA10-W-D12 RAA10-W-D12 0-1 8/12/2003 ND(0.017) ND(0.022) ND(0.017) ND(0.011) ND(0.011) ND(0.011) 0.019 P 0.0191-6 8/12/2003 ND(0.039) ND(0.039) ND(0.039) ND(0.039) ND(0.039) ND(0.039) ND(0.039) ND(0.039)6-15 8/12/2003 ND(0.036) ND(0.036) ND(0.036) ND(0.036) ND(0.036) ND(0.036) ND(0.036) ND(0.036)
RAA10-W-E8 RAA10-W-E8 1-6 5/30/2003 ND(0.018) ND(0.018) ND(0.018) ND(0.018) ND(0.018) ND(0.018) ND(0.018) ND(0.018)6-11 5/30/2003 ND(0.035) ND(0.035) ND(0.035) ND(0.035) ND(0.035) ND(0.035) ND(0.035) ND(0.035)
RAA10-W-E9 RAA10-W-E9 0-1 5/30/2003 ND(0.017) ND(0.017) ND(0.017) ND(0.017) ND(0.017) ND(0.017) 0.027 0.0271-6 5/30/2003 ND(0.036) ND(0.036) ND(0.036) ND(0.036) ND(0.036) ND(0.036) ND(0.036) ND(0.036)6-10 5/30/2003 ND(0.018) ND(0.018) ND(0.018) ND(0.018) ND(0.018) ND(0.018) ND(0.018) ND(0.018)
RAA10-W-E10 RAA10-W-E10 0-1 8/12/2003 ND(0.036) ND(0.036) ND(0.036) ND(0.036) ND(0.036) ND(0.036) ND(0.036) ND(0.036)1-6 8/12/2003 ND(0.034) [ND(0.034)] ND(0.034) [ND(0.034)] ND(0.034) [ND(0.034)] ND(0.034) [ND(0.034)] ND(0.034) [ND(0.034)] ND(0.034) [ND(0.034)] ND(0.034) [ND(0.034)] ND(0.034) [ND(0.034)]
6-12.3 8/12/2003 ND(0.034) ND(0.034) ND(0.034) ND(0.034) ND(0.034) ND(0.034) ND(0.034) ND(0.034)RAA10-W-F6 RAA10-W-F6 0-1 3/5/2004 ND(0.38) ND(0.38) ND(0.38) ND(0.38) ND(0.38) ND(0.38) 8.3 8.3
1-6 3/5/2004 ND(0.037) ND(0.037) ND(0.037) ND(0.037) ND(0.037) ND(0.037) 1.2 1.26-15 3/5/2004 ND(0.037) ND(0.037) ND(0.037) ND(0.037) ND(0.037) ND(0.037) ND(0.037) ND(0.037)
RAA10-W-F6.5 RAA10-W-F6.5 0-1 3/6/2007 ND(0.042) ND(0.042) ND(0.042) ND(0.042) ND(0.042) ND(0.042) ND(0.042) ND(0.042)RAA10-W-G4 RAA10-W-G4 0-1 3/5/2004 ND(0.039) ND(0.039) ND(0.039) ND(0.039) ND(0.039) ND(0.039) ND(0.039) ND(0.039)
1-6 3/5/2004 ND(0.039) ND(0.039) ND(0.039) ND(0.039) ND(0.039) ND(0.039) ND(0.039) ND(0.039)6-15 3/5/2004 ND(0.038) ND(0.038) ND(0.038) ND(0.038) ND(0.038) ND(0.038) ND(0.038) ND(0.038)
RAA10-W-G5 RAA10-W-G5 0-1 7/22/2008 ND(0.032) ND(0.032) ND(0.032) ND(0.032) ND(0.032) ND(0.032) 0.015 J 0.015 J1-6 7/22/2008 ND(0.034) ND(0.034) ND(0.034) ND(0.034) ND(0.034) ND(0.034) ND(0.034) ND(0.034)6-15 7/22/2008 ND(0.034) ND(0.034) ND(0.034) ND(0.034) ND(0.034) ND(0.034) ND(0.034) ND(0.034)
RAA10-W-H3 RAA10-W-H3 0-1 7/22/2008 ND(0.032) ND(0.032) ND(0.032) ND(0.032) ND(0.032) ND(0.032) 0.024 J 0.024 J1-6 7/22/2008 ND(0.036) ND(0.036) ND(0.036) ND(0.036) ND(0.036) ND(0.036) ND(0.036) ND(0.036)6-15 7/22/2008 ND(0.031) ND(0.031) ND(0.031) ND(0.031) ND(0.031) ND(0.031) ND(0.031) ND(0.031)
RAA10-W-H4 RAA10-W-H4 0-1 3/8/2004 ND(0.037) ND(0.037) ND(0.037) ND(0.037) ND(0.037) ND(0.037) ND(0.037) ND(0.037)1-6 3/8/2004 ND(0.037) ND(0.037) ND(0.037) ND(0.037) ND(0.037) ND(0.037) ND(0.037) ND(0.037)6-15 3/8/2004 ND(0.039) ND(0.039) ND(0.039) ND(0.039) ND(0.039) ND(0.039) ND(0.039) ND(0.039)
RAA10-W-I2 RAA10-W-I2 0-1 3/5/2004 ND(0.038) ND(0.038) ND(0.038) ND(0.038) ND(0.038) ND(0.038) 0.27 0.271-6 3/5/2004 ND(0.038) ND(0.038) ND(0.038) ND(0.038) ND(0.038) ND(0.038) 0.016 J 0.016 J6-15 3/5/2004 ND(0.038) ND(0.038) ND(0.038) ND(0.038) ND(0.038) ND(0.038) ND(0.038) ND(0.038)
RF-14 PG14B0002 0-2 6/10/1991 ND(0.050) NA ND(0.050) ND(0.050) ND(0.050) ND(0.060) v ND(0.050) ND(0.060)PG14B0204 2-4 6/10/1991 ND(0.050) NA ND(0.050) ND(0.050) ND(0.050) ND(0.050) ND(0.050) ND(0.050)PG14B0406 4-6 6/10/1991 ND(0.050) NA ND(0.050) ND(0.050) ND(0.050) 0.090 0.060 0.15PG14B0608 6-8 6/10/1991 ND(0.050) NA ND(0.050) ND(0.050) ND(0.050) 0.060 ND(0.050) 0.060PG14B0810 8-10 6/10/1991 ND(0.050) NA ND(0.050) ND(0.050) ND(0.050) 0.22 0.070 0.29PG14B1012 10-12 6/10/1991 ND(0.020) ND(0.020) ND(0.020) ND(0.020) ND(0.020) 0.17 ND(0.020) 0.17PG14B1214 12-14 6/10/1991 ND(0.050) NA ND(0.050) ND(0.050) ND(0.050) ND(0.050) ND(0.050) ND(0.050)PG14B1416 14-16 6/10/1991 ND(0.050) NA ND(0.050) ND(0.050) ND(0.050) ND(0.050) ND(0.050) ND(0.050)
UB-SS-1 UB-SS-1 0-0.5 12/18/1996 ND(0.042) ND(0.085) ND(0.042) ND(0.042) ND(0.042) ND(0.042) 0.16 0.16
Depth(Feet)
(Results are presented in dry weight parts per million, ppm)GENERAL ELECTRIC COMPANY - PITTSFIELD, MASSACHUSETTS
UNKAMET BROOK AREA
PCB SOIL SAMPLING DATATABLE 3
G:\GE\GE_Pittsfield_Other-Misc\Reports and Presentations\Pipeline\2671011324Atta4Tbls.xls - Table 3 Page 1 of 2 8/3/2010
(Results are presented in dry weight parts per million, ppm)GENERAL ELECTRIC COMPANY - PITTSFIELD, MASSACHUSETTS
UNKAMET BROOK AREA
PCB SOIL SAMPLING DATATABLE 3
Notes:1. Samples were collected by ARCADIS and were submitted to CompuChem Environmental Corporation, IT Analytical Services and SGS Environmental Services, Inc. for analysis of PCBs. 2. Data Types: PDI = GE Pre-Design Investigation soil sampling; Historical = GE Historical soil sampling3. PDI Samples have been validated as per GE's EPA-approved FSP, General Electric Company, Pittsfield, Massachusetts, ARCADIS4. NA - Not Analyzed - Laboratory did not report results for this analyte5. ND - Analyte was not detected. The number in parenthesis is the associated detection limit6. Field duplicate sample results are presented in brackets
Data Qualifiers: J - Indicates that the associated numerical value is an estimated concentration. P - Greater than 25% difference between primary and confirmation column. v - Indicates an elevated detection limit due to chemical interference.
G:\GE\GE_Pittsfield_Other-Misc\Reports and Presentations\Pipeline\2671011324Atta4Tbls.xls - Table 3 Page 2 of 2 8/3/2010
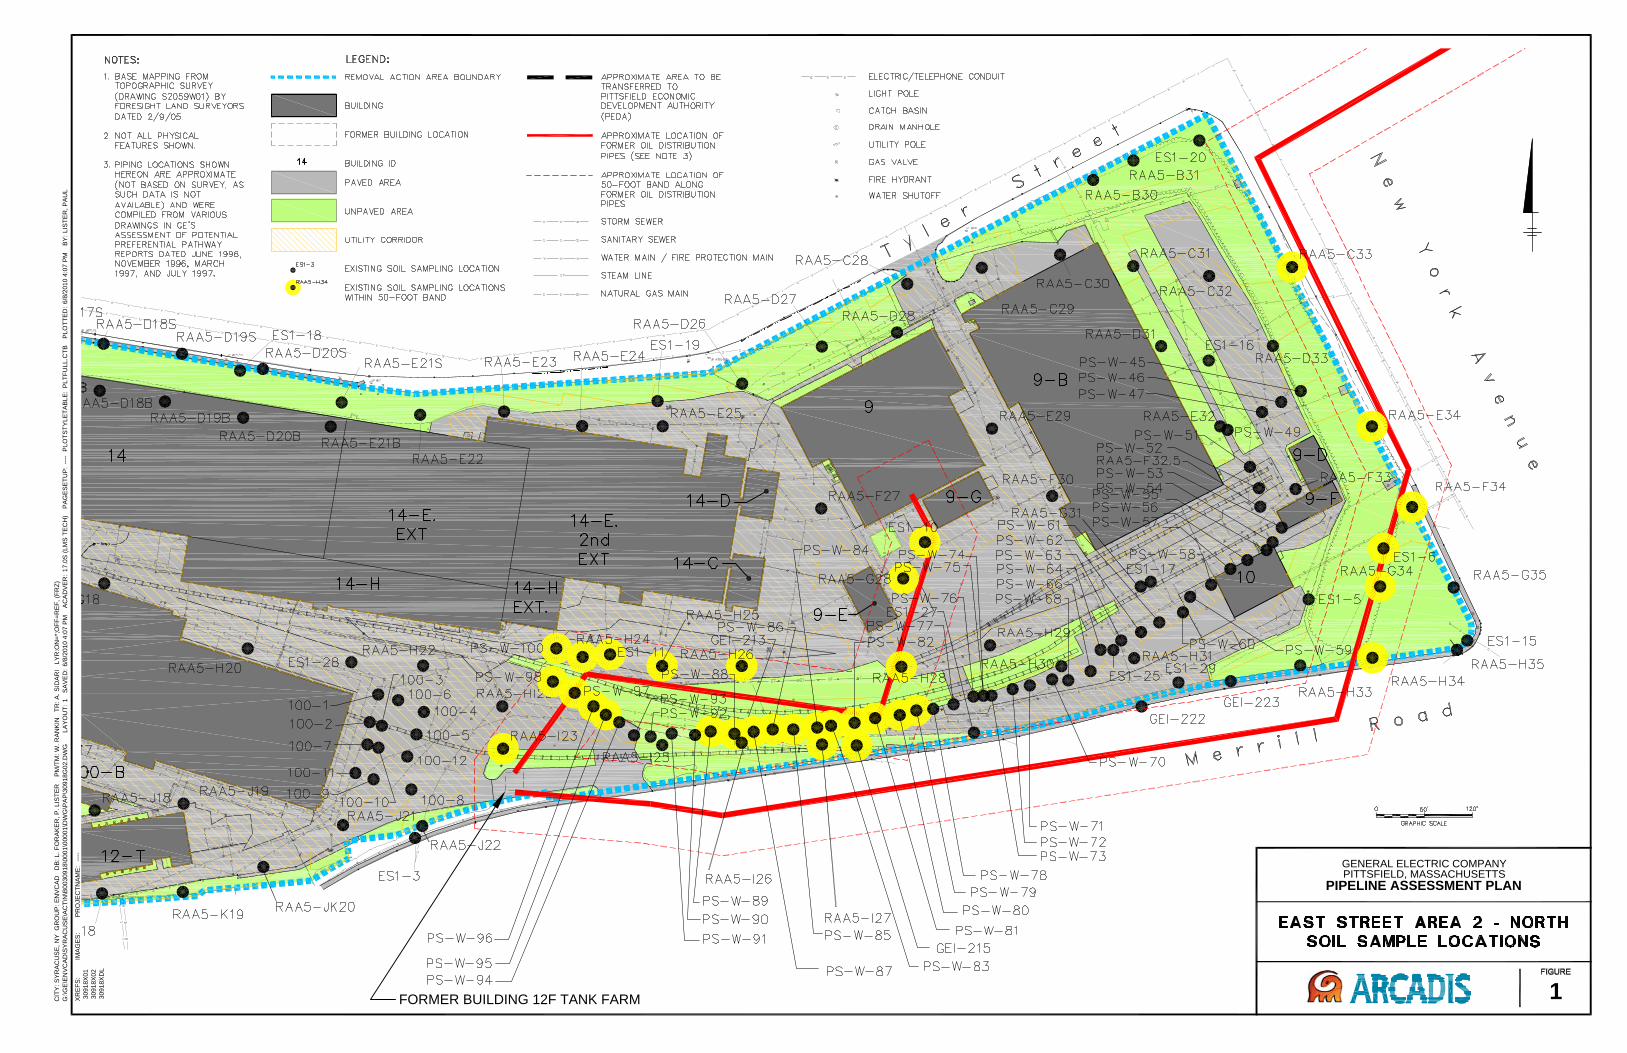
FORMER BUILDING 12F TANK FARM
GENERAL ELECTRIC COMPANYPITTSFIELD, MASSACHUSETTS
PIPELINE ASSESSMENT PLAN
1
IMA
GE
S:
XR
EF
S:
30918X
01
30918X
02
30918X
DL
PR
OJE
CT
NA
ME
: -
---
CIT
Y:
SY
RA
CU
SE
, N
Y
GR
OU
P:
EN
VC
AD
D
B:
L.
FO
RA
KE
R,
P.
LIS
TE
R
P
M/T
M:
W.
RA
NK
IN
TR
: A
. S
IDA
RI
LY
R:O
N=
*;O
FF
=R
EF
, (F
RZ
)
G:\G
E\E
NV
CA
D\S
YR
AC
US
E\A
CT
\N\B
0030918\0
001\0
0001\D
WG
\PA
P\3
0918G
02.D
WG
LA
YO
UT
: 1
SA
VE
D:
6/8
/2010 4
:07 P
MA
CA
DV
ER
: 1
7.0
S (
LM
S T
EC
H)
PA
GE
SE
TU
P:
----
PLO
TS
TY
LE
TA
BLE
: P
LT
FU
LL.C
TB
PLO
TT
ED
: 6/8
/2010 4
:07 P
MB
Y:
LIS
TE
R, P
AU
L
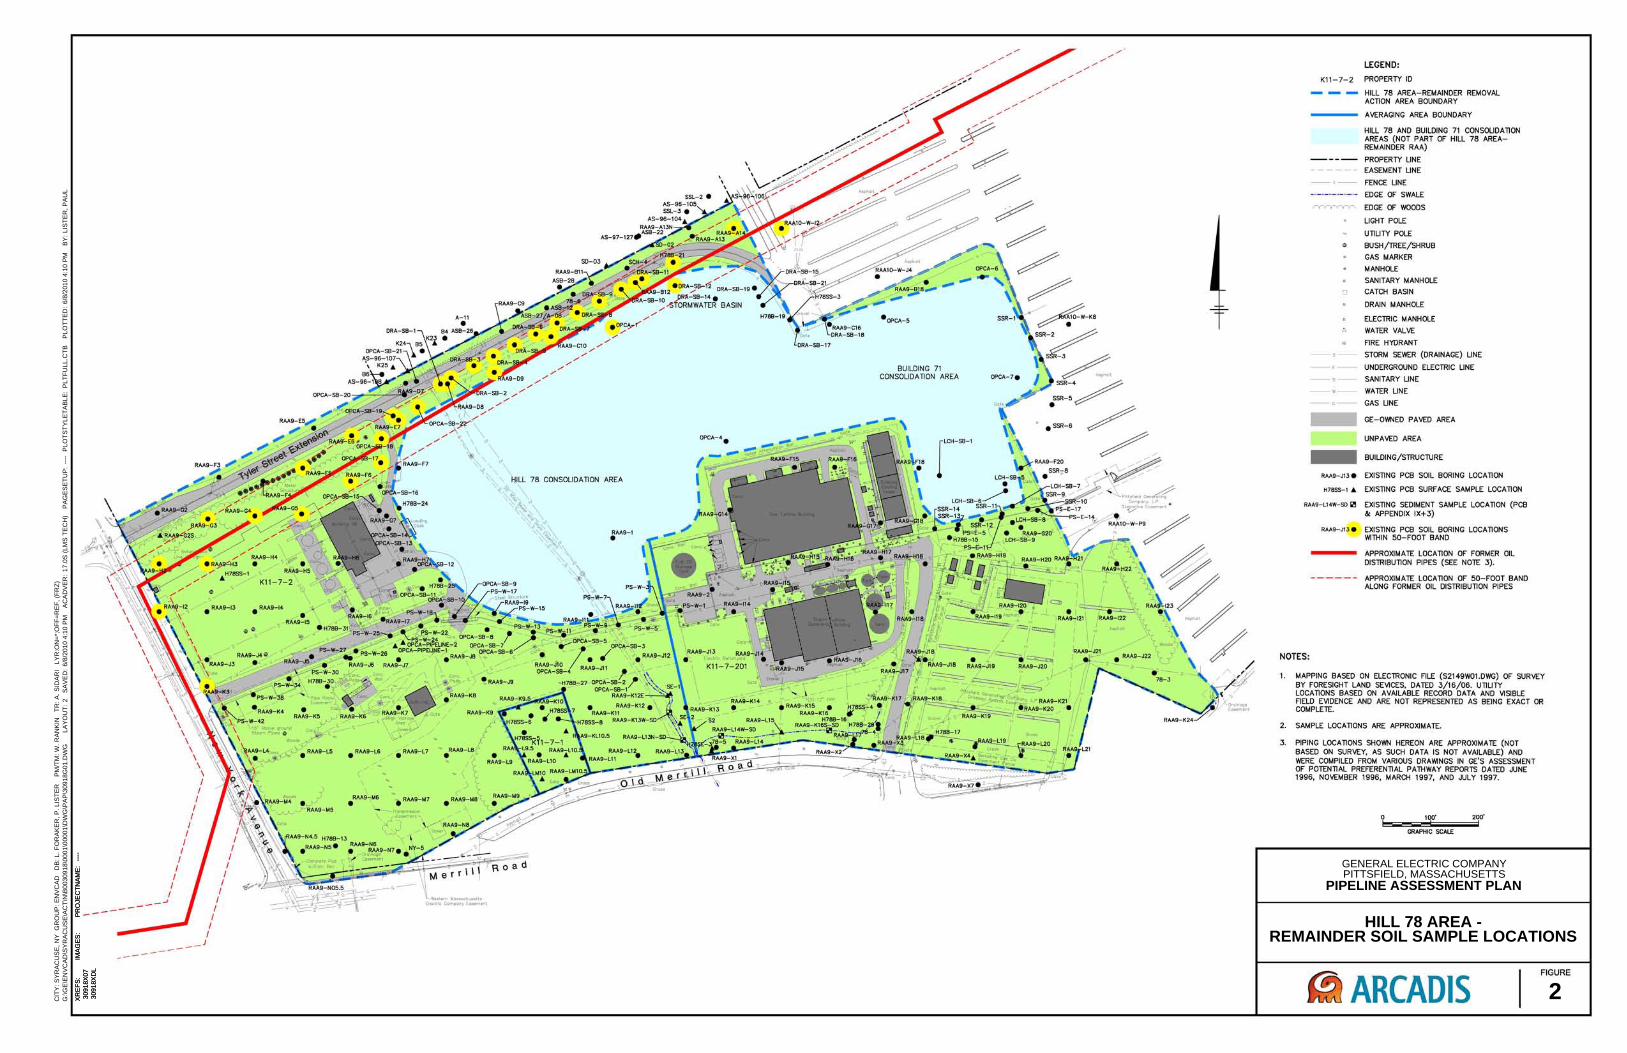
GENERAL ELECTRIC COMPANYPITTSFIELD, MASSACHUSETTS
PIPELINE ASSESSMENT PLAN
2
IMA
GE
S:
XR
EF
S:
30918X
07
30918X
DL
PR
OJE
CT
NA
ME
: -
---
IMA
GE
S:
XR
EF
S:
30918X
07
30918X
DL
PR
OJE
CT
NA
ME
: -
---
CIT
Y:
SY
RA
CU
SE
, N
Y
GR
OU
P:
EN
VC
AD
D
B:
L.
FO
RA
KE
R,
P.
LIS
TE
R
P
M/T
M:
W.
RA
NK
IN
TR
: A
. S
IDA
RI
LY
R:O
N=
*;O
FF
=R
EF
, (F
RZ
)
G:\G
E\E
NV
CA
D\S
YR
AC
US
E\A
CT
\N\B
0030918\0
001\0
0001\D
WG
\PA
P\3
0918G
01.D
WG
LA
YO
UT
: 2
SA
VE
D:
6/8
/2010 4
:10 P
MA
CA
DV
ER
: 1
7.0
S (
LM
S T
EC
H)
PA
GE
SE
TU
P:
----
PLO
TS
TY
LE
TA
BLE
: P
LT
FU
LL.C
TB
PLO
TT
ED
: 6/8
/2010 4
:10 P
MB
Y:
LIS
TE
R, P
AU
L
HILL 78 AREA -REMAINDER SOIL SAMPLE LOCATIONS
\ \ "'\~~.lf~~V \
\ .RAA9-13
\ \ \
\ \ \ \
\ \ \
\ \ \ \ \ \ \ I
I I
I I
I I I
I I
I I I
I ---------
/ 'lioI~"AA<I-08 / /
/
/ /
/
Road
/ /
/ /
/ /
/ /
eOf'Cy<" /
/ /
/
/ /
-/ /
eORA:J6--12 OR"_SiR_'. e
"'p~-S8-14.
/ -5TORMWATER BASIN
BUILDING 71 CONSOLIDATION AREA
LEGEND:
KI'-7-2 PROPERTY ID
- - - HILL 78 AREA-REMAINDER REMOVAL ACTION AREA BOUNDARY
AVERAGING AREA BOUNDARY
HILL 78 AND BUILDING 71 CONSOUDA TlON AREAS (NOT PART OF HILL 78 AREAREMAINDER RAA)
PROPERTY LINE
EASEMENT LINE
FENCE LINE
EDGE OF SWALIE
EDGE OF WOODS
LIGHT POLIE
UTILITY POLIE
e BUSH/TREE/SHRUB
GAS MARKER
MANHOLIE
SANITARY MANHOLE
D CATCH BASIN
DRAIN MANHOLIE
ELIECTRIC MANHOLE
WATIER VALVE
FIRE HYDRANT
--,-- STORM SEWER (DRAINAGE) LINE
--,-- UNDERGROUND ELECTRIC LINE
--, -- SANITARY LINE
--w-- WATIER LINE
--, -- GAS LINE
GE-OWNED PAVED AREA
UNPAVED AREA
BUILDING/STRUCTURE
RAA9-J13 e EXISTING PCB SOIL BORING LOCATION
H78SS-'", EXISTING PCB SURFACE SAMPLE LOCATION
RAA9-L14W-SO 11'1 EXISTING SEDIMENT SAMPLE LOCATION (PCB & APPENDIX IX+3)
NOTES:
RAA9-J13 e EXISTING PCB SOIL BORING LOCATIONS WITHIN 50-FOOT BAND
APPROXIMATIE LOCATION OF FORMER OIL DISTRIBUTION PIPES (SEE NOTIE 3).
------ APPROXIMATIE LOCATION OF 50-FOOT BAND ALONG FORMER OIL DISTRIBUTION PIPES
1. MAPPING BASED ON ELIECTRONIC FILIE (S2149W01.DWG) OF SURVEY BY FORESIGHT LAND SEVICES, DATIED 3/16/06. UTILITY LOCATIONS BASED ON AVAILABLE RECORD DATA AND VISIBLE FIELD EVIDENCE AND ARE NOT REPRESENTIED AS BEING EXACT OR COMPLETIE.
2. SAMPLE LOCATIONS ARE APPROXIMA TIE.
3. PIPING LOCATIONS SHOWN HEREON ARE APPROXIMA TIE (NOT BASED ON SURVEY, AS SUCH DATA IS NOT AVAILABLE) AND WERE COMPILED FROM VARIOUS DRAWINGS IN GE'S ASSESSMENT OF POTIENTIAL PREFERENTIAL PATHWAY REPORTS DATIED JUNE ,996, NOVEMBER 1996, MARCH 1997, AND JULY 1997.
100' 200' , ,
GRAPHIC SCALE
ARCADIS FIGURE
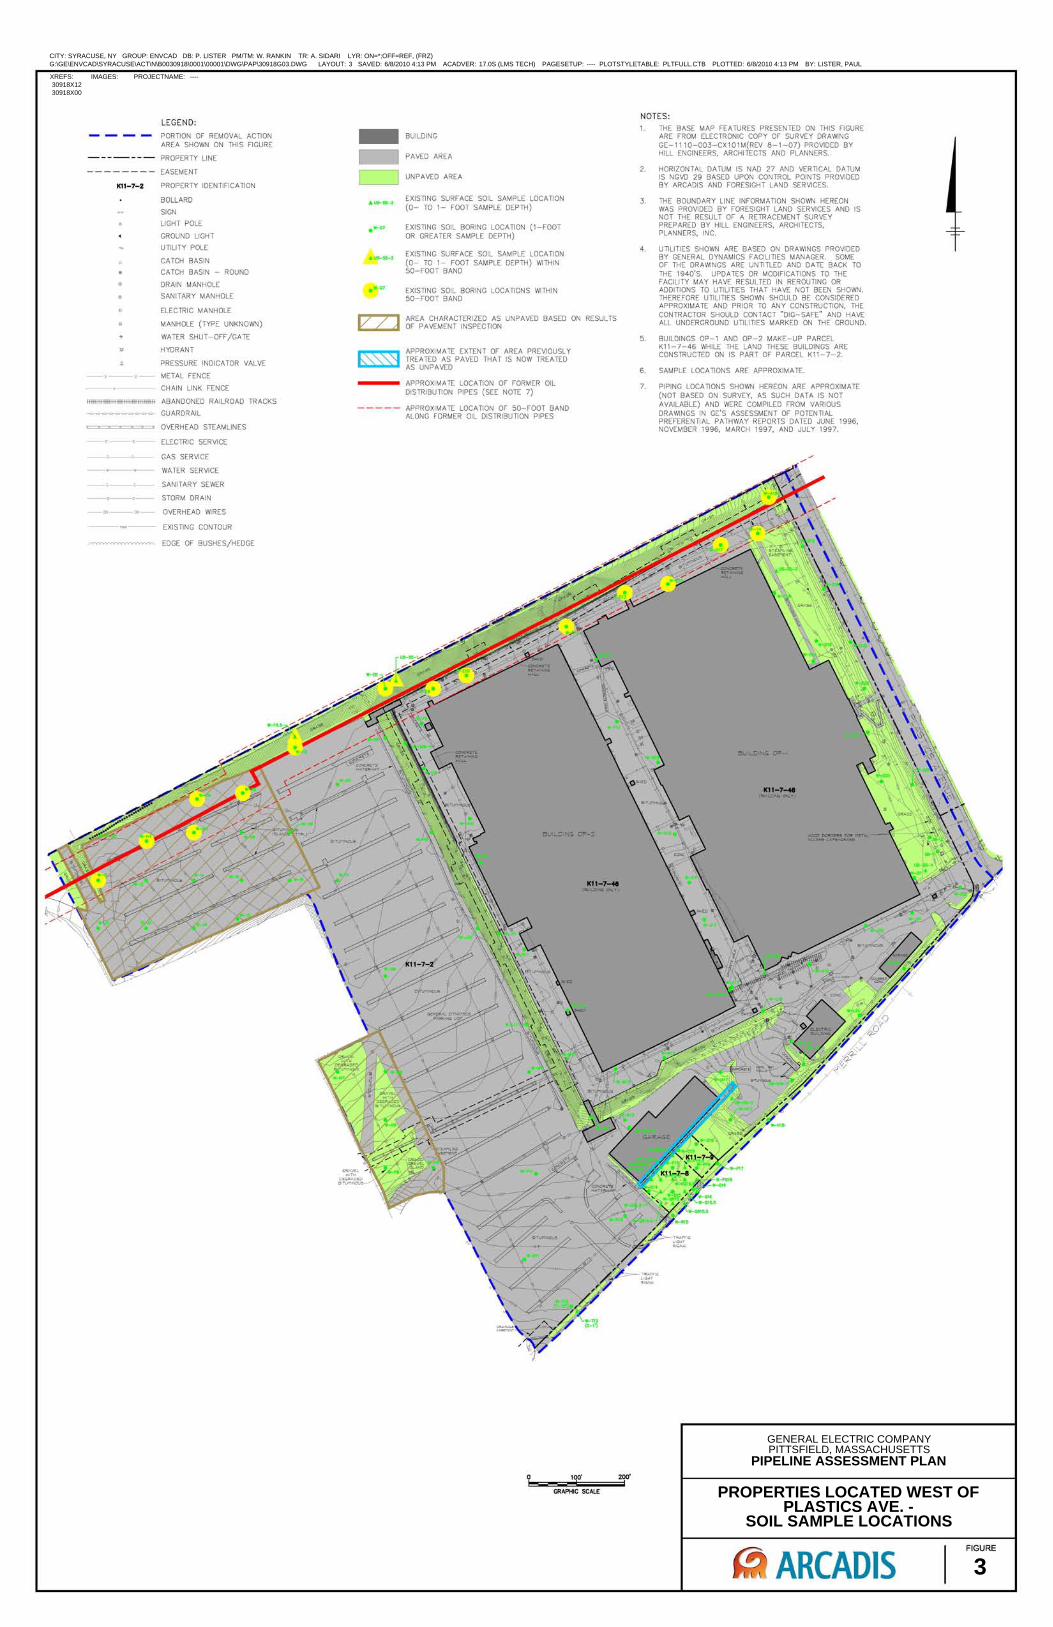
GENERAL ELECTRIC COMPANYPITTSFIELD, MASSACHUSETTS
PIPELINE ASSESSMENT PLAN
3
IMAGES:XREFS:
30918X12
30918X00
PROJECTNAME: ----
PROPERTIES LOCATED WEST OFPLASTICS AVE. -
SOIL SAMPLE LOCATIONS
CITY: SYRACUSE, NY GROUP: ENVCAD DB: P. LISTER PM/TM: W. RANKIN TR: A. SIDARI LYR: ON=*;OFF=REF, (FRZ)
G:\GE\ENVCAD\SYRACUSE\ACT\N\B0030918\0001\00001\DWG\PAP\30918G03.DWG LAYOUT: 3 SAVED: 6/8/2010 4:13 PM ACADVER: 17.0S (LMS TECH) PAGESETUP: ---- PLOTSTYLETABLE: PLTFULL.CTB PLOTTED: 6/8/2010 4:13 PM BY: LISTER, PAUL
LEGEN D:
- - - - PORTI ON OF REMOVAL AC TION AREA SHOWN ON TH IS FIGURE
-------- PROPER TY LINE
-------- EASEMENT
Kl1-7-2 PROPERTY IDENTIFICATION
BOLLARD
SIGN
LI GHT POLE
GROUND LI GHT
UTILI TY POLE
CATCH BASIN
CATCH BASIN - ROUND
DRAIN MAN HOLE
SAN ITAR Y MANHOLE
ELECTR IC MANHOLE
MANHOLE (TYPE UN KNOWN)
WA TER SHUT- OFF/GATE
HYDRAN T
PRESSURE IN DICATOR VALVE
--x--x-- METAL FENCE
1111111111111111111111111111111111
CHAIN LIN K FENCE
ABANDONED RAILROAD TR ACKS
GUARDRAIL
OVERHEAD STEAMLI NES
--c--c-- ELECTR IC SERVICE
--c--c-- GAS SERVICE
--,--,-- WA TER SERVICE
--,--,-- SAN ITARY SEWER
--c--c-- STORM DRAIN
-~--c,,- OVERH EAD WIRES
---,~--- EXISTI NG CONTOUR
~~~~~~ EDGE OF BUSH ES/HEDGE
_ BU ILDI NG
_ PAVED AR EA
c=J UNPAVED AREA
4UB-S5-2
.W-G7
J.UB-SS-2
• W-G7
EX ISTIN G SURFACE SOIL SAMPLE LOCATION (0- TO 1- FOOT SAMP LE DEPTH)
EXISTIN G SOIL BOR ING LOCATION (1 - FOOT OR GREATER SAMPLE DEPTH)
EXISTIN G SURFACE SOIL SAMPLE LOCATION (0- TO 1- FOOT SAMPLE DEPTH) WITHI N 50 - FOOT BAND
EXISTIN G SOIL BOR ING LOCATIONS WITH IN 50 - FOOT BAND
vZl AREA CHARACTER IZED AS UNPAVED BASED ON RESU LTS OF PAVEMENT IN SPECTION
APPRO XIMATE EXTEN T OF AREA PREVIOUSLY TR EATED AS PAVED THAT IS NOW TRE ATED AS UNPAVED
APPRO XIMATE LOCATION OF FORM ER OIL DISTR IBUTION PIPES (SEE NOTE 7)
----- APPROXIMATE LOCA TI ON OF 50- FOOT BAND ALONG FORMER OIL DISTR IBUTION PIPES
BUILDI NG OP - :2
1C11-7-48 (1Ioi.iII.DJ~~"T)
100' 200' , ,
GRAPHIC SCALE
NOTES:
TH E BASE MAP FEATURES PR ESENTED ON TH IS FIGURE ARE FROM ELECTRONI C COPY OF SURVEY DRAWING GE- 11 10 - 003 - CX 101M(REV 8 - 1- 07) PROVI DED BY HI LL ENGINEERS, ARCH ITECTS AND PLANNERS.
2. HORIZONTAL DATUM IS NAD 27 AND VERTICAL DATUM IS NGVD 29 BASED UPON CONTROL POINTS PROVI DED BY ARCAD IS AND FORESIGH T LAND SERVICES.
3.
4.
5.
6.
7.
TH E BOUNDARY LI NE IN FORMATION SHOWN HEREON WAS PROVIDED BY FORESIGH T LAND SERVICES AND IS NOT TH E RESULT OF A RETRACEMENT SURVEY PREPARED BY HILL ENGI NEERS, ARCHI TECTS, PLAN NERS, INC.
UTILI TIE S SHOWN ARE BASED ON DRA~NGS PROVIDED BY GENERAL DYNAMICS FACILITIES MANAGER. SOME OF THE DRAWINGS ARE UNTITLED AND DATE BACK TO TH E 19 40' S. UPDATES OR MODIFI CATI ONS TO TH E FACILI TY MAY HAVE RESULTED IN REROUTING OR ADDITI ONS TO UTILI TI ES TH AT HAVE NOT BEEN SHOWN . TH EREFORE UTILI TI ES SHOWN SHOULD BE CONSIDERED APPROXIMATE AND PR IOR TO ANY CONSTR UCTI ON, THE CONTRACTOR SHOULD CONTACT "D IG- SAFE" AND HAVE ALL UN DERGROU ND UTI LI TI ES MAR KED ON TH E GROUND.
BU ILDINGS OP-1 AND OP- 2 MAKE- UP PARCEL K11-7- 46 WHI LE THE LAND TH ESE BU ILDINGS AR E CONSTRUCTED ON IS PART OF PARCE L K11 - 7 - 2.
SAMPLE LOCATIONS AR E APP ROXIMATE.
PIPING LOCATIONS SHOWN HER EON ARE APPROXIMATE (NOT BASED ON SURVEY, AS SUCH DATA IS NOT AVAILABLE) AND WERE COMP ILED FROM VAR IOUS DRAWINGS IN GE'S ASSESSM ENT OF POTEN TIAL PREFERENTIAL PATH WAY REPORTS DATED JUNE 1996 , NOVEMB ER 1996, MARCH 199 7, AN D JULY 1997.
BUILDI NG OP-I
1C11-7-48 ("""'I-DINrO Cffi.T)
ARCADIS FIGURE
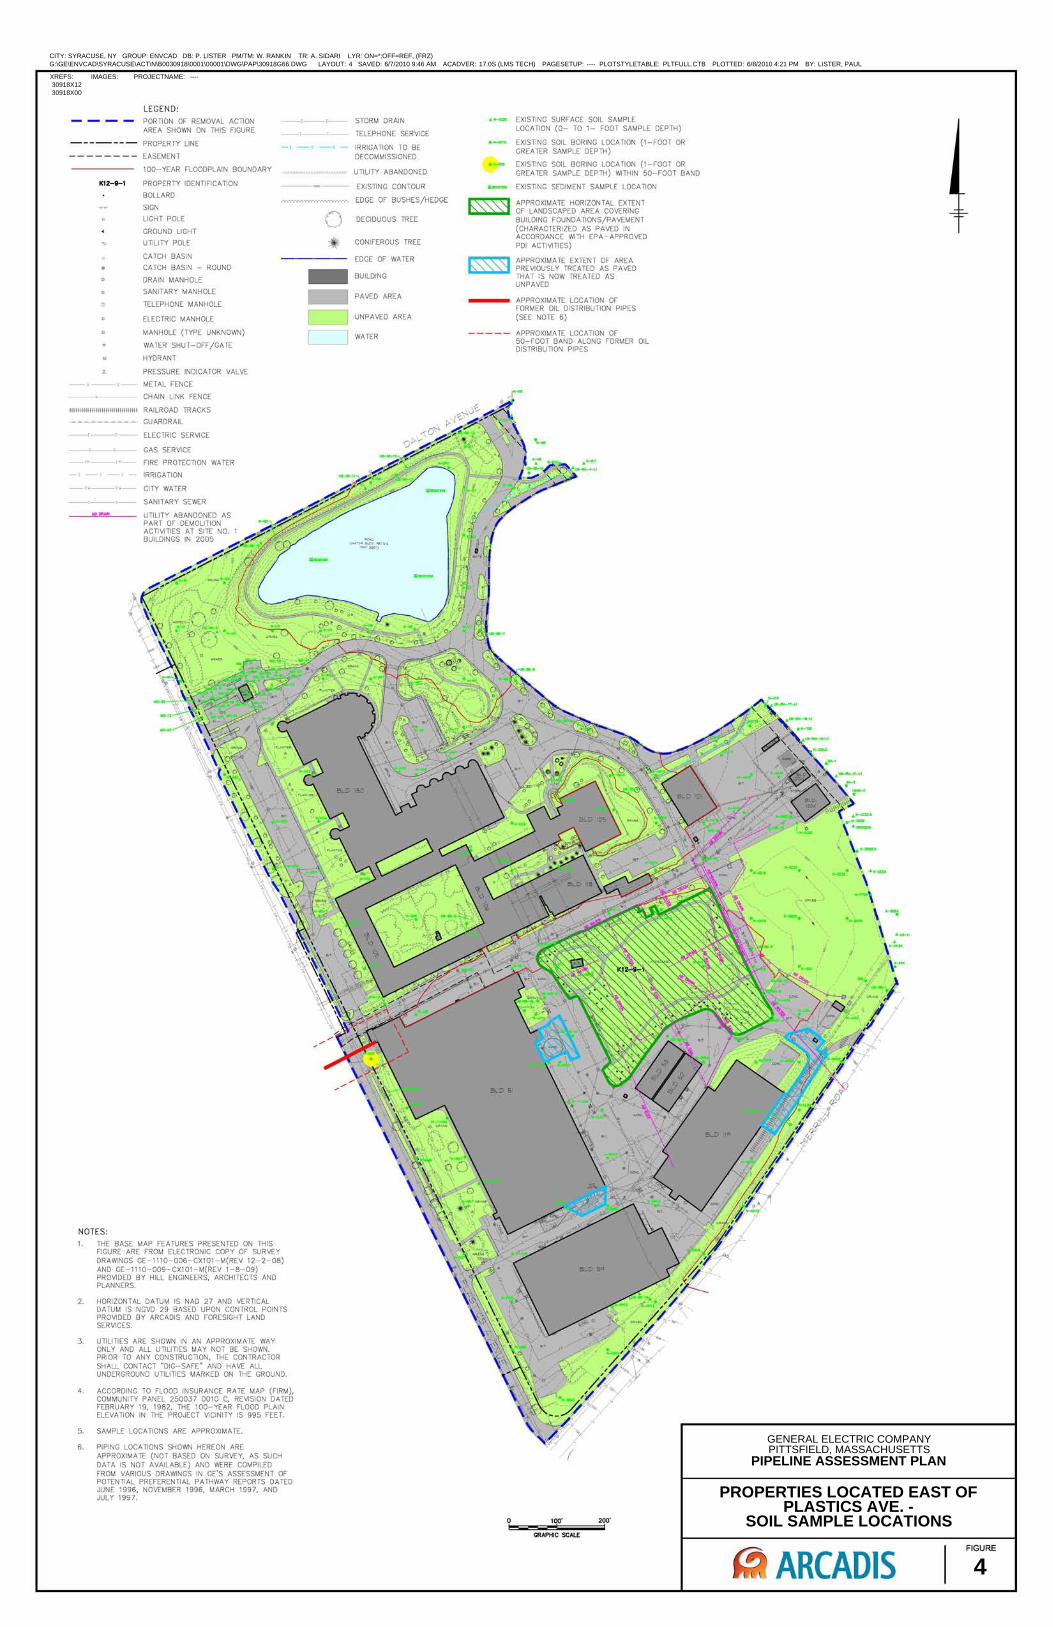
GENERAL ELECTRIC COMPANYPITTSFIELD, MASSACHUSETTS
PIPELINE ASSESSMENT PLAN
4
IMAGES:XREFS:
30918X12
30918X00
PROJECTNAME: ----
CITY: SYRACUSE, NY GROUP: ENVCAD DB: P. LISTER PM/TM: W. RANKIN TR: A. SIDARI LYR: ON=*;OFF=REF, (FRZ)
G:\GE\ENVCAD\SYRACUSE\ACT\N\B0030918\0001\00001\DWG\PAP\30918G66.DWG LAYOUT: 4 SAVED: 6/7/2010 9:46 AM ACADVER: 17.0S (LMS TECH) PAGESETUP: ---- PLOTSTYLETABLE: PLTFULL.CTB PLOTTED: 6/8/2010 4:21 PM BY: LISTER, PAUL
PROPERTIES LOCATED EAST OFPLASTICS AVE. -
SOIL SAMPLE LOCATIONS
LEGEND:
PORTION OF REMOVAL ACTION AREA SHOWN ON THI S FI GU RE
PROPER TY LI NE
EASEMENT
STORM DR AIN
TELEPHONE SERVICE
IRRIG ATI ON TO BE DECOMM ISSIONED
100-YEAR FLOODPLAIN BOUNDARY ",,,,,,,,,,,,,,,,,,,,,,,,,,,,,,,,,,,,, UTILITY ABANDONED
KI2-8-1 PROPER TY IDENTIFICATION
BOLLARD
SIGN
LIGHT POLE
GROU ND LIGH T
UTI LITY POLE
CATCH BASIN
CATCH BASIN - ROU ND
DRAI N MAN HOLE
SAN ITARY MANHOLE
TELEPH ON E MANHOLE
ELECTR IC MANHOLE
MAN HOLE (TYPE UNKNOWN)
WA TER SHUT- OFF/GATE
HYDRANT
PRESSURE INDICATOR VALVE
--x--x-- METAL FENCE
___ 0 ____ CHAIN LI NK FENCE
1111111111111111111111111111111111 RAILROAD TR ACKS
GUARDR AIL
--c--c-- ELECTRIC SERVICE
__ c __ c__ GAS SERVICE
-'0--"- FIRE PROTECTION WATER
-I -I -1 - IRR IGATION
-"--CI/- CITY WATER
--,--,-- SAN ITARY SEWER
UTILI TY ABANDONED AS PART OF DEMOLI TION ACTIVITIES AT SITE NO. BU ILD INGS IN 2005
NOTES:
THE BASE MAP FEATU RES PRESENTED ON TH IS FI GURE ARE FROM ELECTRONIC COPY OF SURVEY DRAWI NGS GE - 111 0 - 006 - CXl 0 1- M(REV 12- 2- 08) AN D GE-11 10 - 009- CX10 l - M(REV 1-8- 09) PROVIDED BY HILL ENGINE ERS. ARCH ITECTS AND PLAN NERS.
2 . HORIZONTAL DATUM IS NAD 27 AND VERTICAL DATUM IS NGVD 29 BASED UPON CONTR OL POINTS PROVIDED BY ARCAD IS AND FORESIGH T LAN D SERVICE S.
3 . UTILI TIES ARE SHOWN IN AN APPROXIMATE WAY ON LY AND ALL UTILITIES MAY NOT BE SHOWN . PRIOR TO AN Y CONSTRUCTION, THE CONTRACTOR SHALL CON TACT " DIG-SAFE" AND HAVE ALL UN DERGROU ND UTI LITIES MARKED ON TH E GROUND.
4 . ACCORD ING TO FLOOD INSURANCE RA TE MAP (FIRM) , COMMUN ITY PAN EL 250037 0010 C, REVISION DATED FE BRU AR Y 19, 1982, THE 100- YEAR FLOOD PLAIN ELEVATION IN TH E PROJECT VICI NITY IS 995 FEET.
5 . SAMPLE LOCATIONS ARE APPROXIMATE.
6 . PIPI NG LOCATIONS SHOWN HEREON ARE APPROXIMATE ( NOT BASED ON SURVEY, AS SUCH DATA IS NOT AVAILABLE) AND WERE COM PILED FROM VARIOUS DR AWINGS IN GE'S ASSESSMEN T OF POTENTIAL PREFERENTIAL PATHWAY REPORTS DATED JUNE 1996 , NOVEM BER 1996, MARCH 199 7, AND JULY 1997.
EXISTING CONTOUR
EDGE OF BUSH ES/HEDGE
DECIDU OUS TREE
CONIFEROUS TREE
ED GE OF WA TER - BUILDING - PAVED AREA
c=J UN PAVED AREA
c=J WATER
EXISTING SURFACE SOIL SAMPLE LOCATION (0 - TO 1- FOOT SAM PLE DEPTH)
EXISTIN G SOIL BORING LOCATION (l - FOOT OR GR EATER SAMPLE DEPTH)
EXISTING SOIL BOR ING LOCATI ON (l - FOOT OR GREATER SAMPLE DEPTH) WITHIN 50 - FOOT BAND
EXISTIN G SEDIM ENT SAMPLE LOCA TI ON
APPROXIMATE HORIZONTAL EXTENT OF LAN DSCAPED AREA COVERIN G BU ILD ING FOUNDATIONS/PAVEMENT (CHARACTERIZED AS PAVED IN ACCORDANCE ~TH EPA- APPROVED PDI AC TI VITIES)
APPROXIMATE EXTEN T OF AREA PREVIOUSLY TREATED AS PAVED THAT IS NOW TR EATED AS UNP AVED
APPR OXIMATE LOCATION OF FORMER OIL DISTRI BU TI ON PIPES (SEE NOTE 6)
APPROXIMATE LOCATION OF 50- FOOT BAND ALONG FORMER OIL DI STRI BU TION PIPES
100' 200'
GRAPHIC SCALE
ARCADIS FIGURE