Embed Size (px)
Citation preview
Investigations on Acoustic On-LineMonitoring of IR Laser Ablation of
Burned SkinKester Nahen, MS* and Alfred Vogel, PhD
Medical Laser Center Lubeck, 23562 Lubeck, Germany
Backround and Objective: In burn surgery necrotic tissue has tobe removed prior to grafting. Tangential excision causes highblood loss and destruction of viable tissue. Pulsed infrared laserablation can overcome both problems because of its high preci-sion and the superficial coagulation of the remaining tissue. Weinvestigated the ablation noise to realize an acoustic feedbacksystem for a selective removal of necrotic tissue.Materials and Methods: We studied free-running Er:YAG laserablation of gelatin and burned skin. Schlieren laser flash pho-tography was used to investigate the ablation dynamics gener-ating the ablation noise. Acoustic signals were detected by acondenser microphone and a piezoelectric airborne transducer.Tissue discrimination was based on the evaluation of the nor-malized acoustic energy.Results: The ablation noise is mainly generated by shock waveemission and fast vaporization during the first part of the laserpulse. Frequency components of the ablation noise above 200kHz are only detectable with the piezoelectric transducer. Thenormalized acoustic energy differs significantly between gela-tin samples of different water content and between necrotic andvital tissue.Conclusions: Large bandwidth transducers are essential for anacoustic on-line monitoring of free-running Er:YAG laser abla-tion of burned skin. The normalized acoustic energy is a suit-able parameter for the discrimination between necrotic and vi-tal tissue. Lasers Surg. Med. 25:69–78, 1999.© 1999 Wiley-Liss, Inc.
Key words: acoustic transients; burn debridement; acoustic feedback
INTRODUCTION
For the treatment of severe burns the ne-crotic tissue has to be removed to minimize toxiceffects on the patients organism and to prepare avascularized burn wound for skin grafting. Thevital tissue underlying the zone of necrosis needsto be preserved as well as possible because dermalcomponents are essential for a fast skin graft takeand a high stability of the graft. Today, tangentialexcision is the standard treatment for deep der-mal burns [1]. In tangential burn eschar excision,tissue is shaved until pinpoint bleeding is ob-served and a viable base is reached. This treat-ment goes along with a high amount of blood lossand a considerable loss of viable tissue limiting
the tangential method to burns of less than 30% oftotal body surface area [2].
The burn debridement can be improved byusing pulsed laser tissue ablation. Pulsed infra-red lasers like the CO2 and Er:YAG laser allow aprecise and effective removal of necrotic tissue[2,3]. The superficial coagulation of the remaining
Contract grant sponsor: The State of Schleswig-Holstein, Ger-many.
*Correspondence to: Kester Nahen, Medical Laser CenterLubeck, Peter-Monnik-Weg 4, D-23562 Lubeck, Germany.E-mail: [email protected]
Accepted 4 March 1999
Lasers in Surgery and Medicine 25:69–78 (1999)
© 1999 Wiley-Liss, Inc.
tissue prevents bleeding during the treatmentand does not appreciably affect skin graft take[3,4]. The consumption of blood conserves isthereby reduced and larger burn areas can betreated during one operation improving the prog-nosis of the patient. For a fast and selective de-bridement of large area burns the laser beam hasto be scanned and controlled by a system thatdifferentiates between necrotic and vital tissue.By this way, unnecessarily deep excisions can beavoided.
The monitoring system for tissue discrimina-tion should be a noncontact technique working inreal time during the tissue ablation. Our ap-proach is to realize a feedback system based onthe analysis of the ablation noise. The ablationnoise is generated by the explosive evaporation ofthe tissue water, which is the main chromophorefor the infrared laser wavelengths used. Differentdegrees of hydration in different tissue layers aswell as differences in the strength of the tissuematrix should thus be reflected in the acousticsignal.
Although pulsed laser ablation has beenstudied for a long period of time, only a few inves-tigations evaluated the potential of the ablationnoise analysis for material discrimination andprocess control. Leung et al. [5], Grad and Mozina[6], and Stauter et al. [7] investigated Excimerand Nd:YAG laser ablation of ceramics and founda correlation between the ablation rate and theamplitude and energy of the acoustic signal.Acoustic measurements during tissue ablationwere only performed by Bende and Jean [8,9] byusing Excimer laser pulses and by Altshuler et al.[10,11] and Grad et al. [12] by using a free-running Er:YAG laser for the ablation of dentalmaterials. The possibility of a photoacoustic dis-crimination of burned skin layers or other softtissues has not been investigated to date. Onewould expect that the ablation dynamics duringthe removal of necrotic and vital tissue differs be-cause of the different biomechanical propertiesand water content of the two layers [13]. This dif-ference should correspond to different character-istics of the generated ablation noise.
Previous investigations of the ablation noise[8–12] were performed with condenser micro-phones limited to a bandwidth of 200 kHz. Thebandwidth limitation reduces the potential of thetechnique, because one would expect the acousticsignal to contain frequency components of up to 1MHz and beyond due to the short duration of thelaser pulses used for ablation. We therefore ex-
tended the detectable frequency range to 1 MHzby use of a piezoelectric airborne transducer. Thistechnique makes it possible to detect the high fre-quency components generated by shock waveemission and fast ejection of ablation products.We performed Schlieren laser flash photographyin order to get an understanding of the kinetics ofthe ablation process generating the ablationnoise. The investigations indicated that most ofthe ablation takes place during the beginning ofthe laser pulse. The corresponding acoustic mea-surements also demonstrated that the maximumpressure amplitudes are generated during thisinitial phase. By evaluating the initial phase ofthe acoustic signal we could show that the acous-tic energy is a tissue-specific parameter suitableto discriminate between tissue layers of differentwater content like necrotic and vital tissue.
MATERIALS AND METHODS
Irradiated Samples
We irradiated gelatin samples with differentwater content as well as excised specimens ofburned skin. Burned skin was modeled usinggelatin samples of different water content in orderto create reproducible experimental conditions.The water content of vital epidermis is 70%[14,15]. Burn injuries cause an increase in capil-lary permeability with subsequent plasma leak-age into the interstitial space, resulting in exces-sive edema formation in the remaining vital tis-sue [16]. The total water content of the skinincreases by about 12% [17] as measured 24 hourspost burn for full thickness skin samples includ-ing both necrotic and vital tissue components. Theabove value is an average over the full thicknessof the skin. The water content in the dried andshrunk nectrotic tissue layer is considerably lessthan the water content in the underlying vitaltissue. We chose gelatin samples containing 90%water to model the edematous vital tissue andsamples with 70% water content to model the ne-crotic tissue. The actual water content of necrotictissue may be even lower than 70%. Besidessingle layered samples we used stacked gelatinsamples with a top layer of 70% and bottom layerof 90% water content as a model for burned skin.The stacked gelatin layers were separated by afilm of acrylic spray lacquer (Dupli-Color, Vogel-sang, Hassmersheim, Germany) to inhibit waterdiffusion between the layers. The samples werestored in a refrigerator until use.
70 Nahen and Vogel
The model experiments with tissue phan-toms were followed by in vitro measurements onfreshly excised second degree burned human skin.The full thickness samples were excised duringconventional burn surgery and irradiated within60 minutes after excision. To avoid desiccation,the specimens were stored in a closed plastic bagat 7°C until use.
Laser Irradiation
We used a free-running Er:YAG laser (LISALaser Products, Katlenburg, Germany) deliveringpulses with a maximum pulse energy of 400 mJ at300 ms pulse duration. The laser was operated at10 Hz repetition rate. The Er:YAG laser radiationwas combined with an He:Ne aiming laser beamusing a dichroic mirror (Fig. 1). The laser energycould be varied by means of two rotatable quartzplates, which were mechanically coupled to rotatein opposite direction. This allowed the variation ofthe energy without changing the pump energy,which would otherwise alter the pulse durationand beam profile. The pulse energy was measuredby using a pyroelectric probe (DigiRad P-444,Terahertz Technologies, Oriskany, NY). The tem-poral laser pulse shape was detected by a GaAsphotodiode (EG&G Judson J125AP-R02M, Mont-gomeryville, PA; rise time 10 ns) connected to anoscilloscope (Tektronix, Wilsonville, DE, TDS-540). The laser beam was focused onto the samplewith a 100 mm planoconvex lens giving rise to aspot diameter of 450 mm.
Laser Flash Photography
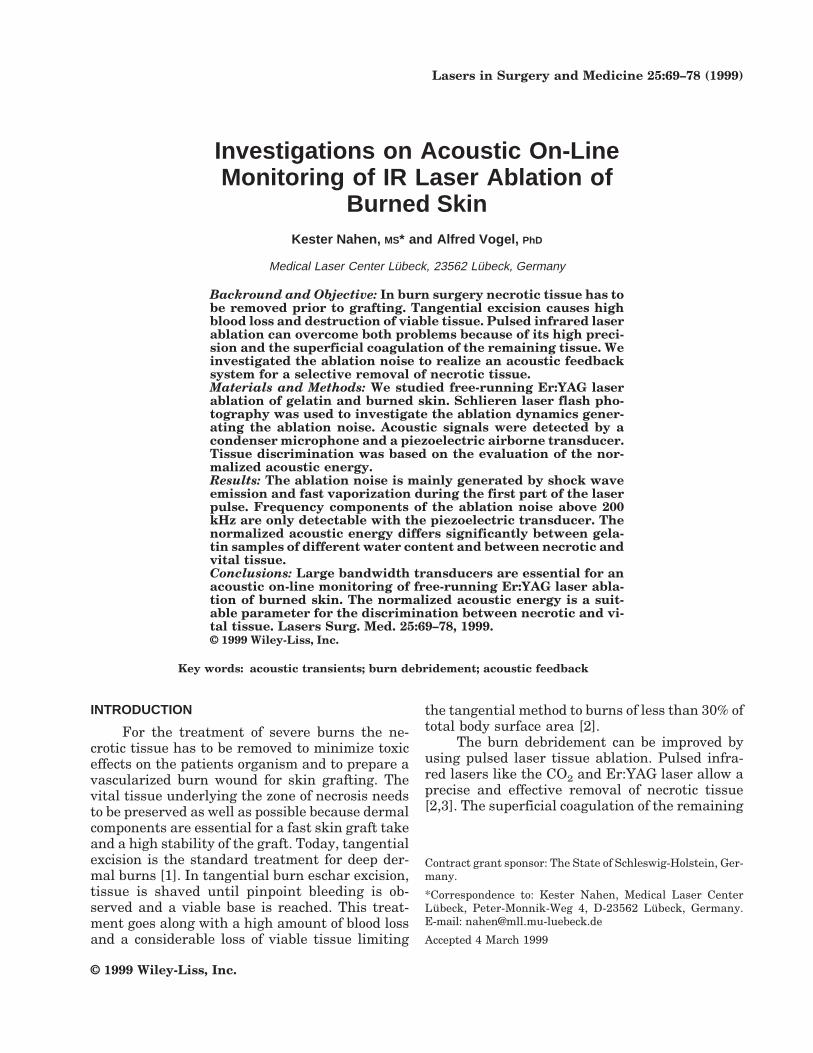
Laser flash photography of the ablation dy-namics was performed using a dark fieldSchlieren arrangement (Fig. 2). The Schlierentechnique was employed for the detection of shockwaves and of gaseous ablation products, whichare hard to identify with conventional photogra-
phy. For illumination we used 6-ns pulses from adye laser (Rhodamin 6G) pumped by a frequencydoubled Nd:YAG laser. The dye laser was em-ployed to achieve spectral broadening leading toreduced speckle. Spatial frequency filtering forthe detection of phase objects was performed us-ing a wire blocking out the image of a slit locatedin the illumination beam path. Wire and slit areorientated perpendicular to the sample surfacegiving a maximum sensitivity to refractive indexchanges parallel to the sample surface. Photo-graphs with different delays between the Er:YAGlaser pulse and the illuminating laser pulse weretaken on Kodak TMAX 400 film (Eastman Kodak,Rochester, NY).
Acoustic Investigations
The ablation noise was detected using a con-denser microphone (Bruel & Kjaer, Naerum, Den-mark, 4138) with a bandwidth of 6.5 Hz–200 kHz(−5 dB), and a piezoelectric airborne transducer(PCB, 132A42) with a bandwidth of 5 kHz–1MHz. The microphone signals were recorded witha digital oscilloscope (Tektronix TDS 540) andread out into a PC to perform signal analysis.Hanning time window FFT analysis was imple-mented using IDL (Interactive Data Language).All measurements were performed simulta-neously with both microphones. The microphoneswere oriented under an angle of 35° to the opticalaxis of the laser beam at a distance of 30 mm fromthe sample surface.
RESULTSLaser Flash Photography
Figure 3 shows the Er:YAG laser ablation ofgelatin at various times after the first laser spike.The times when the photographs were taken withrespect to the laser pulse are indicated in Figure4. The ablation was performed using a radiantexposures of 21 J/cm2 (ablation threshold for skin1.2 J/cm2 [18]).
The picture taken 4 ms after the first laserspike shows the emission of a hemispherical
Fig. 1. Experimental setup for acoustic on-line monitoring ofEr:YAG laser ablation.
Fig. 2. Dark field Schlieren arrangement for laser flash pho-tography.
Acoustic Monitoring of IR Laser Ablation of Burned Skin 71
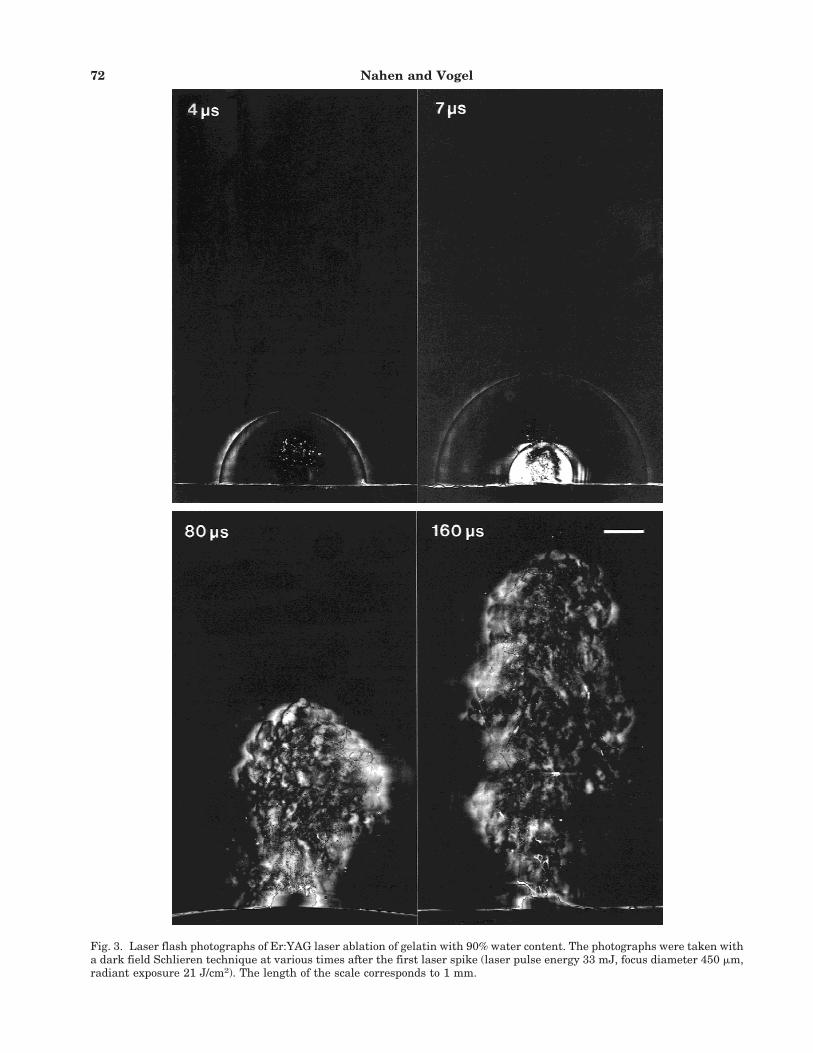
Fig. 3. Laser flash photographs of Er:YAG laser ablation of gelatin with 90% water content. The photographs were taken witha dark field Schlieren technique at various times after the first laser spike (laser pulse energy 33 mJ, focus diameter 450 mm,radiant exposure 21 J/cm2). The length of the scale corresponds to 1 mm.
72 Nahen and Vogel
shock wave as well as the ejection of water vaporand some ablation products out of the rupturedsample surface. After 7 ms the first shock wavehas propagated radially and a second shock wavehas been generated. Figure 4 demonstrates thatthe two shock waves correspond to the first twospikes of the Er:YAG laser pulse. The amount ofablation products ejected after the second laserspike is larger than after the first spike. After 80ms an ablation plume consisting of water vapor,water droplets, and gelatin fragments has beenformed. A hump is visible at the sample surface,which probably consists of a wall formed aroundthe crater from which the material is ejected. Atlater times (160 ms) the ablation plume continuesto expand vertically, but the particle and vapordensity near the sample surface decrease. Thisdecrease occurs already at a time when the inci-dent laser power is still close to its maximumvalue (see Fig. 4).
Acoustic Signals
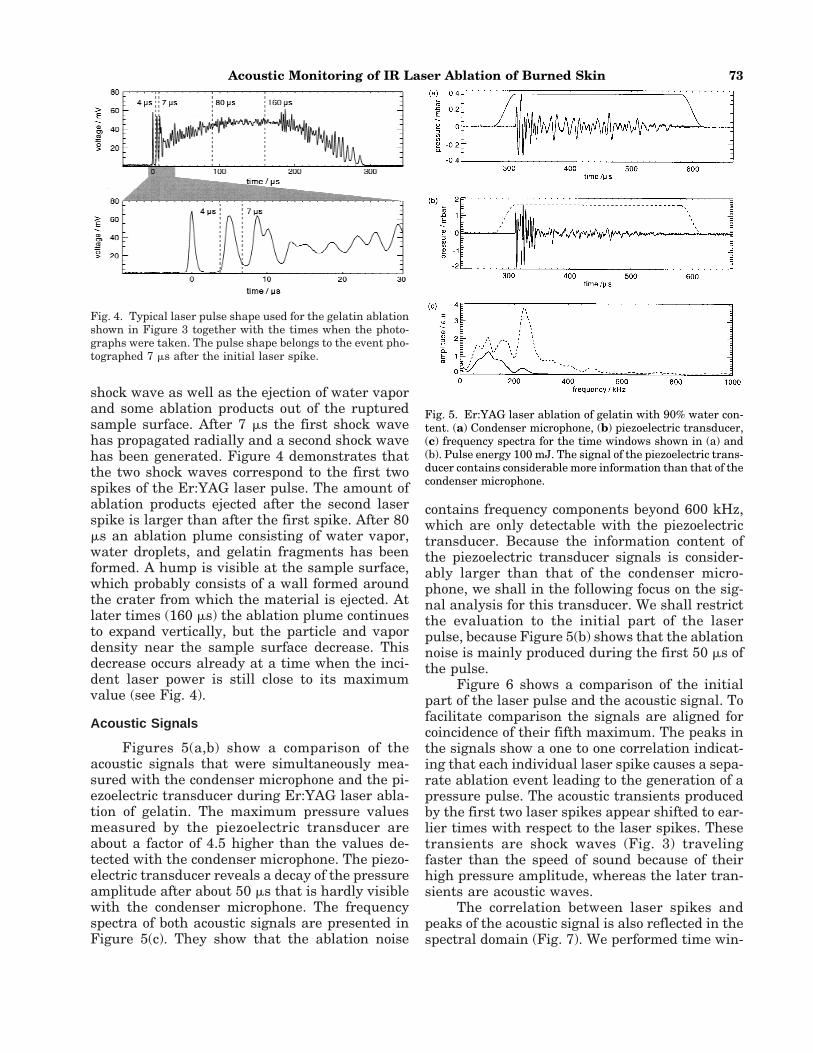
Figures 5(a,b) show a comparison of theacoustic signals that were simultaneously mea-sured with the condenser microphone and the pi-ezoelectric transducer during Er:YAG laser abla-tion of gelatin. The maximum pressure valuesmeasured by the piezoelectric transducer areabout a factor of 4.5 higher than the values de-tected with the condenser microphone. The piezo-electric transducer reveals a decay of the pressureamplitude after about 50 ms that is hardly visiblewith the condenser microphone. The frequencyspectra of both acoustic signals are presented inFigure 5(c). They show that the ablation noise
contains frequency components beyond 600 kHz,which are only detectable with the piezoelectrictransducer. Because the information content ofthe piezoelectric transducer signals is consider-ably larger than that of the condenser micro-phone, we shall in the following focus on the sig-nal analysis for this transducer. We shall restrictthe evaluation to the initial part of the laserpulse, because Figure 5(b) shows that the ablationnoise is mainly produced during the first 50 ms ofthe pulse.
Figure 6 shows a comparison of the initialpart of the laser pulse and the acoustic signal. Tofacilitate comparison the signals are aligned forcoincidence of their fifth maximum. The peaks inthe signals show a one to one correlation indicat-ing that each individual laser spike causes a sepa-rate ablation event leading to the generation of apressure pulse. The acoustic transients producedby the first two laser spikes appear shifted to ear-lier times with respect to the laser spikes. Thesetransients are shock waves (Fig. 3) travelingfaster than the speed of sound because of theirhigh pressure amplitude, whereas the later tran-sients are acoustic waves.
The correlation between laser spikes andpeaks of the acoustic signal is also reflected in thespectral domain (Fig. 7). We performed time win-
Fig. 4. Typical laser pulse shape used for the gelatin ablationshown in Figure 3 together with the times when the photo-graphs were taken. The pulse shape belongs to the event pho-tographed 7 ms after the initial laser spike.
Fig. 5. Er:YAG laser ablation of gelatin with 90% water con-tent. (a) Condenser microphone, (b) piezoelectric transducer,(c) frequency spectra for the time windows shown in (a) and(b). Pulse energy 100 mJ. The signal of the piezoelectric trans-ducer contains considerable more information than that of thecondenser microphone.
Acoustic Monitoring of IR Laser Ablation of Burned Skin 73
dow FFT analysis of the initial part of the laserpulse [Fig. 7(a)] and of the corresponding trans-ducer signal [Fig. 7(b)]. Figure 7(c) shows that themaxima of both spectra coincide in the frequencyrange between 130 and 350 kHz. At lower andhigher frequencies no correlation was observed.
Tissue Discrimination
We used the acoustic energy E 4 ∫ p2(t) d t asa characteristic parameter for tissue discrimina-
tion. The acoustic signals where integrated overthe first 50 ms of the laser pulse where they ex-hibit the highest amplitudes and thus the highesttissue specificity is expected [Fig. 5(b)]. Theacoustic energy was normalized to the laser pulseenergy incident on the sample during the sameperiod of time to take account of the variations ofthe pulse energy.
For the gelatin samples of 70% and 90% wa-ter content, we obtained values of 1.39 ± 0.65 and3.35 ± 1.44 (arb. units) when the acoustic energywas determined with the piezoelectric transducer(mean and standard deviation). The respectivevalues for the condenser microphone were 0.62 ±0.46 and 1.77 ± 1.14 (arb. units). The values wereaveraged over 30 laser pulses, with each pulseaimed at a new unexposed ablation site. The av-eraged acoustic energy is, hence, three timeslarger for the sample with the higher water con-tent. The difference can be used for sample dis-crimination in the case of the piezoelectric trans-ducer, because the error intervals do not overlap.For the condenser microphone however, the errorintervals do overlap, probably because of the lim-ited bandwidth of the transducer. The mean val-ues for both microphones differ statistically sig-nificantly (P 4 0.99 in Student t-test).
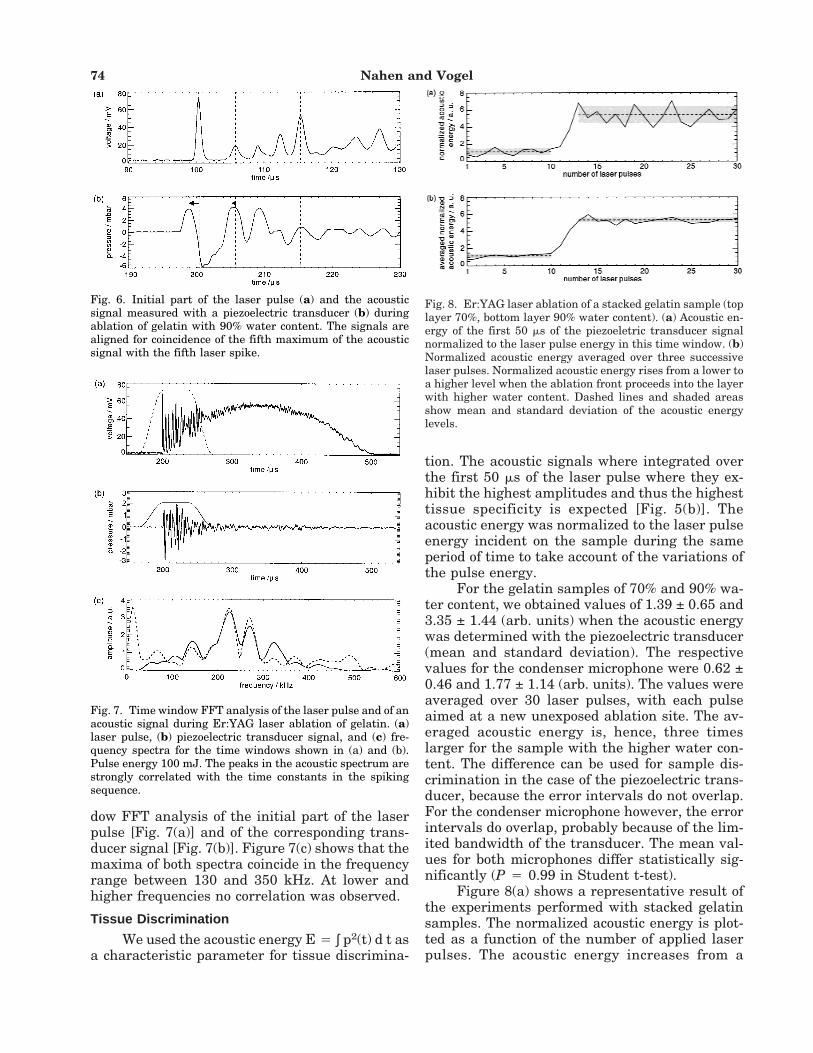
Figure 8(a) shows a representative result ofthe experiments performed with stacked gelatinsamples. The normalized acoustic energy is plot-ted as a function of the number of applied laserpulses. The acoustic energy increases from a
Fig. 6. Initial part of the laser pulse (a) and the acousticsignal measured with a piezoelectric transducer (b) duringablation of gelatin with 90% water content. The signals arealigned for coincidence of the fifth maximum of the acousticsignal with the fifth laser spike.
Fig. 7. Time window FFT analysis of the laser pulse and of anacoustic signal during Er:YAG laser ablation of gelatin. (a)laser pulse, (b) piezoelectric transducer signal, and (c) fre-quency spectra for the time windows shown in (a) and (b).Pulse energy 100 mJ. The peaks in the acoustic spectrum arestrongly correlated with the time constants in the spikingsequence.
Fig. 8. Er:YAG laser ablation of a stacked gelatin sample (toplayer 70%, bottom layer 90% water content). (a) Acoustic en-ergy of the first 50 ms of the piezoeletric transducer signalnormalized to the laser pulse energy in this time window. (b)Normalized acoustic energy averaged over three successivelaser pulses. Normalized acoustic energy rises from a lower toa higher level when the ablation front proceeds into the layerwith higher water content. Dashed lines and shaded areasshow mean and standard deviation of the acoustic energylevels.
74 Nahen and Vogel
lower to a higher level when the ablation frontpropagates into the sample. Microscopic observa-tions confirmed that the two energy levels are cor-related to the two sample layers with differentwater content.
The energy levels in Figure 8(a) differ by afactor of 4.6. For the ablation of 10 different siteson the same sample the ratio of the energy levelswas 5.0 ± 1.3, and the energy levels were repro-ducible with a standard deviation of 20%.
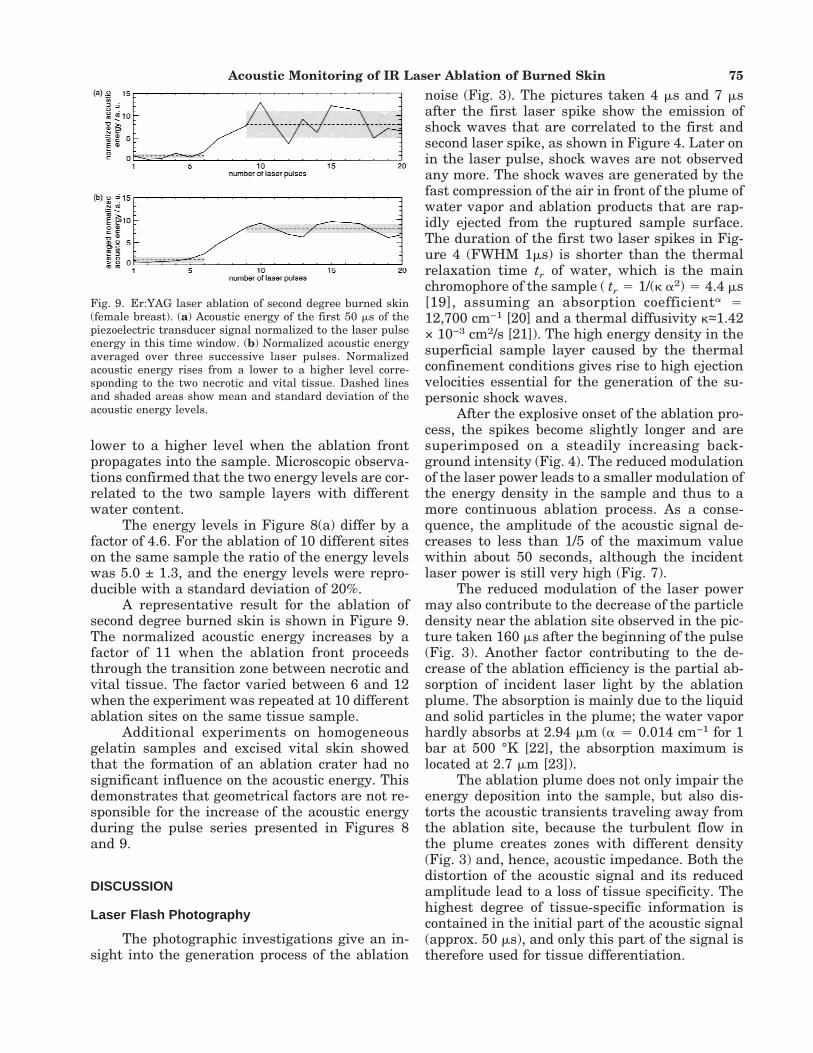
A representative result for the ablation ofsecond degree burned skin is shown in Figure 9.The normalized acoustic energy increases by afactor of 11 when the ablation front proceedsthrough the transition zone between necrotic andvital tissue. The factor varied between 6 and 12when the experiment was repeated at 10 differentablation sites on the same tissue sample.
Additional experiments on homogeneousgelatin samples and excised vital skin showedthat the formation of an ablation crater had nosignificant influence on the acoustic energy. Thisdemonstrates that geometrical factors are not re-sponsible for the increase of the acoustic energyduring the pulse series presented in Figures 8and 9.
DISCUSSION
Laser Flash Photography
The photographic investigations give an in-sight into the generation process of the ablation
noise (Fig. 3). The pictures taken 4 ms and 7 msafter the first laser spike show the emission ofshock waves that are correlated to the first andsecond laser spike, as shown in Figure 4. Later onin the laser pulse, shock waves are not observedany more. The shock waves are generated by thefast compression of the air in front of the plume ofwater vapor and ablation products that are rap-idly ejected from the ruptured sample surface.The duration of the first two laser spikes in Fig-ure 4 (FWHM 1ms) is shorter than the thermalrelaxation time tr of water, which is the mainchromophore of the sample ( tr 4 1/(k a2) 4 4.4 ms[19], assuming an absorption coefficienta 412,700 cm−1 [20] and a thermal diffusivity k≈1.42× 10⁻³ cm2/s [21]). The high energy density in thesuperficial sample layer caused by the thermalconfinement conditions gives rise to high ejectionvelocities essential for the generation of the su-personic shock waves.
After the explosive onset of the ablation pro-cess, the spikes become slightly longer and aresuperimposed on a steadily increasing back-ground intensity (Fig. 4). The reduced modulationof the laser power leads to a smaller modulation ofthe energy density in the sample and thus to amore continuous ablation process. As a conse-quence, the amplitude of the acoustic signal de-creases to less than 1/5 of the maximum valuewithin about 50 seconds, although the incidentlaser power is still very high (Fig. 7).
The reduced modulation of the laser powermay also contribute to the decrease of the particledensity near the ablation site observed in the pic-ture taken 160 ms after the beginning of the pulse(Fig. 3). Another factor contributing to the de-crease of the ablation efficiency is the partial ab-sorption of incident laser light by the ablationplume. The absorption is mainly due to the liquidand solid particles in the plume; the water vaporhardly absorbs at 2.94 mm (a 4 0.014 cm−1 for 1bar at 500 °K [22], the absorption maximum islocated at 2.7 mm [23]).
The ablation plume does not only impair theenergy deposition into the sample, but also dis-torts the acoustic transients traveling away fromthe ablation site, because the turbulent flow inthe plume creates zones with different density(Fig. 3) and, hence, acoustic impedance. Both thedistortion of the acoustic signal and its reducedamplitude lead to a loss of tissue specificity. Thehighest degree of tissue-specific information iscontained in the initial part of the acoustic signal(approx. 50 ms), and only this part of the signal istherefore used for tissue differentiation.
Fig. 9. Er:YAG laser ablation of second degree burned skin(female breast). (a) Acoustic energy of the first 50 ms of thepiezoelectric transducer signal normalized to the laser pulseenergy in this time window. (b) Normalized acoustic energyaveraged over three successive laser pulses. Normalizedacoustic energy rises from a lower to a higher level corre-sponding to the two necrotic and vital tissue. Dashed linesand shaded areas show mean and standard deviation of theacoustic energy levels.
Acoustic Monitoring of IR Laser Ablation of Burned Skin 75
Acoustic InvestigationsMicrophone comparison. The micro-
phone used for the detection of the ablation noiseshould have a sensitivity and bandwidth largeenough to resolve the tissue-specific componentsof the acoustic signals. Figure 5(c) shows that fre-quencies beyond 600 kHz are contained in the ab-lation noise. These high frequency componentsare generated by the fast ablation dynamics dur-ing the initial phase of the ablation process lead-ing to shock wave emission. They could only bedetected by the piezoelectric transducer but notby the condenser microphone with a bandwidth ofonly 200 kHz.
Figure 6 suggests that for a complete tempo-ral and amplitude resolution of the shock wavescontaining the highest frequency components ofthe ablation noise, the transducer bandwidthneeds to be even larger than 1 MHz. The firstshock wave travels at a considerably higher speedthan the second shock wave (Fig. 6). This indi-cates that the amplitude of the first shock wave islarger, as would also be expected from the inten-sity ratio of the first two laser spikes. The differ-ence in the amplitude is, however, not visible inthe measured acoustic signal. This observationcan be explained if the duration of the first shockwave is shorter than that of the second shockwave, and both are shorter than the rise time ofthe microphone. In this case, the amplitude ofboth shock waves would be detected too low [24],but the error would be larger for the first, stron-ger shock wave. The limitation of the microphonebandwidth thus leads to a distortion of the rela-tive amplitude of successive peaks in the initialhigh frequency acoustic signal. An extension ofthe microphone bandwidth beyond 1 MHz wouldbe desirable.
To estimate the range for a useful bandwidthextension, one needs to consider the strong damp-ing of high frequency acoustic waves in air (∼ f 2
[25]). The propagation distance where the ampli-tude is damped to 1/e is 8.7 cm at 1 MHz, and 8.7mm at 3 MHz [25]. At a distance of 30 mm fromthe ablation site, where the microphone wasplaced in our study, frequencies of up to 2 MHzshould be detectable. Further high frequencycomponents are permanently generated by non-linear effects during shock wave propagation.These components, however, have no strong cor-relation to the tissue-specific generation processof the ablation noise and are therefore only of mi-nor interest for an on-line monitoring.
Time domain analysis. The duration of
the acoustic signals was found to be similar to thelaser pulse duration. The highest pressure ampli-tudes were generated during the first 50 ms of thelaser pulse by explosive evaporation events givingrise to shock wave emission. Later on, a more con-tinues ablation process took place, which gener-ated only small pressure amplitudes.
During the first 30 ms of the laser pulse, eachlaser spike generated an individual acoustic tran-sient (Fig. 6). A one to one correlation between theEr:YAG laser spikes and the ejection of ablationparticles was also observed by other researchersusing a pump probe technique [26,27]. In spite ofthe correlation between laser spikes and acousticsignal, a direct evaluation of the acoustic signal inthe time domain does not seem to be very prom-ising for a tissue discrimination because of thelarge pulse to pulse variations of the laser pulseshape. A normalization of the pressure ampli-tudes by the laser pulse shape cannot easily solvethis problem, because the acoustic signal is dis-torted in an unknown way by the limited band-width of the transducer.
Frequency domain analysis. The strongcorrelation between the laser pulse shape and theacoustic signal during the initial phase of the ab-lation process leads to a coincidence of themaxima of the spectra of the laser pulse and theacoustic signal in the range between 130 and 350kHz [Fig. 7(c)]. This means that most features ofthe acoustic spectrum are not tissue-specific butjust a reflection of the spiking sequence in thelaser pulse. We could not identify tissue-specificproperties of the spectral amplitudes in any par-ticular frequency range. This is not very surpris-ing because the variations of the laser pulse shapeimpair the spectral analysis in a similar way asalready discussed for the time domain analysis.To overcome these limitations, we focused on theanalysis of integral properties of the acoustic sig-nal, particularly the acoustic energy.
Tissue Discrimination
The results of our model experiments usinggelatin samples of different water content demon-strate that the normalized acoustic energy is asuitable parameter to discriminate betweensamples of 70% and 90% water content. Theacoustic energy increases with an increasing wa-ter content of the sample. This observation can beexplained by the dependence of the acoustic en-ergy on the volumetric energy density of thesound source, which is determined by the optical
76 Nahen and Vogel
penetration depth of the laser radiation. In thecase of infrared laser ablation, the optical pen-etration depth is a function of the tissue watercontent. A high water content causes a largeracoustic energy because the laser energy is con-fined in a small tissue volume producing a moreviolent ablation. It is not yet fully understood,however, why a difference in the sample watercontent of only 20% leads to a threefold increase ofthe normalized acoustic energy, which is muchhigher than the increase of 20% one would expecttaking only the different optical penetrationdepth into account. A possible reason may begiven by different mechanical properties of thesamples.
A tissue discrimination by analysis of abso-lute values of the normalized acoustic energy isnot practicable because the water content andthus the acoustic energy varies within a burnarea, and the acoustic energy depends also onother parameters beside the tissue water content(for example, the distance between microphoneand ablation site). The transition between differ-ent layers can, however, be identified by monitor-ing the relative change of the acoustic energy dur-ing ablation.
The change of the acoustic energy must belarger than the statistical pulse to pulse varia-tions in order to define a threshold value demar-cating a tissue boundary. To overcome the statis-tical uncertainties, the normalized acoustic en-ergy was averaged over three consecutive shots.Figures 8(b) and 9(b) show that this results in aconsiderably standard deviation of the energy val-ues corresponding to each layer. A disadvantageof the averaging technique is the broadening ofthe transition zone between the two levels.
The width of the transition zone between thetwo levels of the acoustic energy for gelatin abla-tion (Fig. 8) is caused by inhomogeneities in thelaser beam profile. Nonuniform ablation leads tocontributions of both gelatin types to the charac-teristics of the acoustic signal when the ablationfront passes the boundary between the layers.Top hat beam profiles should lead to a more ho-mogeneous tissue ablation and thus to a fasterincrease of the acoustic energy. This would im-prove the spatial selectivity of the on-line moni-toring. In the case of burned skin ablation (Fig. 9)the transition zone is moreover a consequence ofthe finite width of the transition zone between thenecrotic and vital tissue layers.
The maximum possible depth resolution ofthe acoustic on-line control is given by the abla-
tion depth of the laser if the transition zone be-tween nectrotic and vital tissue is very sharp. Inmost practical cases, however, the transition zoneis thicker than the single shot ablation depth, andthe depth resolution is given by the thickness ofthe transition zone.
The normalized acoustic energy increased bya factor of 5 in the case of the stacked gelatinsample (Fig. 8) whereas it increased by a factor of6 to 12 for the burned tissue (Fig. 9). These resultssuggest that the difference between the watercontent of necrotic and vital tissue is larger thanthe difference of 20% between the gelatin layers.It is unlikely that the edematous tissue containsmuch more than 90% water, but it seems quitereasonable that the water content of the necrotictissue is less than 70%, i.e., less then the hydra-tion of vital epidermis.
Measurements during gelatin ablation usingthe condenser microphone showed overlapping er-ror intervals for the averaged acoustic energy ofthe samples with 70% and 90% water content.These results confirm that a significant part ofthe tissue-specific information is contained in thehigh frequency components of the ablation noiseand that large bandwidth transducers are essen-tial for the discrimination between soft tissues.
The present investigations are a first steptowards an on-line control of laser necrectomy.Further studies have to investigate the influenceof the kind of burn injury and its treatment priorto laser ablation on the water content of the tissuelayers and the acoustic signal in order to deter-mine reliable thresholds for the discriminationbetween necrotic and vital tissue. These data setsshould allow the design of on-line controlled scan-ning laser systems for fast laser necrectomy oflarge area burns.
CONCLUSIONS
Our investigations showed that a discrimi-nation between necrotic and vital tissue duringinfrared laser ablation of burned skin is possiblethrough an evaluation of the normalized acousticenergy of the ablation noise. Large bandwidthacoustic transducers (1 MHz) are essential for thedetection of the tissue-specific high frequencycomponents, which are generated during the ini-tial phase of the ablation process.
ACKNOWLEDGMENTS
The authors appreciate helpful discussionswith J. Noack and thank W. Eisenbeiß for many
Acoustic Monitoring of IR Laser Ablation of Burned Skin 77
stimulating discussions and for providing the tis-sue samples.
REFERENCES
1. Jackson DM, Stone FRCS, Stone PA. Tangential excisionand grafting of burns. Brit J Plast Surg 1972;25:416–426.
2. Green HA, Domankevitz Y, Nishioka NS. Pulsed carbondioxide laser ablation of burned skin: In vitro and in vivoanalysis. Lasers Surg Med 1990;10:476–484.
3. Green HA, Burd EE, Nishioka NS, Compton CC. Skingraft take and healing following 193-nm excimer, con-tinuous-wave carbon dioxide (CO2), pulsed CO2, orpulsed Holmium:YAG laser ablation of graft bed. ArchDermatol 1993;129:979–988.
4. Green HA, Burd E, Nishioka NS. Middermal wound heal-ing. Arch Dermatol 1992;128:639–645.
5. Leung WP, Tam AC. Noncontact monitoring of laser ab-lation using a miniature piezoelectric probe to detect pho-toacoustic pulses in air. Appl Phys Lett 1992;60(1):23–25.
6. Ladislav G, Mozina J. Acoustic in situ monitoring of ex-cimer laser ablation of different ceramics. Applied Sur-face Science 1993;69:370–375.
7. Stauter C, Gerard P, Fontaine J, Engel T. Laser ablationacoustical monitoring. Appl Surf Sci 1997;109/110:174–178.
8. Bende T, Matallana M, Kleffner B, Jean B. Noncontactphotoacoustic spectroscopy during photoablation: a steptowards the smart laser? Ophthalmic Technologies V,SPIE 1995;2293:111–119.
9. Jean B, Bende T, Matallana M. Noncontact photoacousticspectroscopy during photoablation with a 193-nm ex-cimer laser. German J Ophthalmol 1993;2:404–408.
10. Altshuler GB, Belikov AV, Boiko KN, Erofeev AV, VitiazIV. Acoustic response of hard dental tissues to pulsedlaser action. Dental Applications of Lasers, SPIE1993;2080:97–103.
11. Altshuler GB, Belinkov AV, Erofeev AV, Scrypnik AV.Research of hard tooth tissue acoustic response undercontact YAG:Er laser radiation processing. Laser Appli-cations in Medicine and Dentistry, SPIE 1996;2922:228–232.
12. Grad L, Mozina J, Sustercic D, Funduk N, Skaleric U,Lukac M, Cencic S, Nemes K. Optoacoustic studies ofEr:YAG laser ablation in hard dental tissue. Laser Sur-
gery: Advanced characterization, Therapeutics, and sys-tems IV, SPIE 1994;2128:456–465.
13. Demling RH, Mazess RB, Witt RM, Wolberg WH. Thestudy of burn wound edema using dichromatic absorpti-ometry. J Trauma 1978;18(2):124–128.
14. Warner RR, Mark C, Myers BS, Taylor DA. Electronprobe analysis of human skin: Determination of the wa-ter concentration profile. J Invest Dermatol 1988;90:218–224.
15. Knox FS, Wachtel TL, McCahan GR, Knapp SC. Thermalproperties calculated from measured water content as afunction of depth in porcine skin. Burns 1986;12(8):556–562.
16. Arturson G. Pathophysiology of the burn wound. AnnChirug Gynaecol 1980;69:178–190.
17. Matsuda T, Tanaka H, Shimazaki S, Matsuda H, Abcar-ian H, Reyes H, Hanumadass M. High-dose vitamin Ctherapy for extensive deep dermal burns. Burns 1992;18(2):127–131.
18. Hibst R, Kaufmann R. Vergleich verschiedener Mittelin-frarot-Laser fur die Ablation der Haut. Lasermedizin1995;11:19–26.
19. Carslaw HS, Jaeger JC. Conduction of heat in solids. Ox-ford: Clarendon Press; 1947.
20. Hale GM, Querry MR. Optical constants of water in the200-nm to 200-mm wavelength region. Appl Opt 1973;12(3):555–563.
21. Welch AJ, van Gemert MCJ, editors. Optical-ThermalResponse of Laser-Irradiated Tissue. Lasers, Photonics,and Electro-Optics. New York: Plenum Press; 1995.
22. Young JS. Evaluation of nonisothermal band model forH2O J Quant Spectrosc Radiat Transfer 1977;18:29–45.
23. Wolfe WL, Zissis GJ. The infrared handbook, chapter 5.Third edition. Washington, DC: Office of Naval Research;1989.
24. Vogel A, Lauterborn W. Acoustic transient generation bylaser-produced cavitation bubbles near solid boundaries.J Acoust Soc Am 1988;84(2):719–731.
25. Kuttruff H. Physik und Technik des Ultraschalls. Hirzel;1988. p 199.
26. Walsh JT, Deutsch TF. Measurement of Er:YAG laserablation plume dynamics. Appl Phys B 1991;52:217–224.
27. Frenz M, Zweig AD, Romano V, Weber HP, Chapliev NI,Silenoc AS. Dynamics in laser cutting of soft tissue. La-ser-Tissue Interaction, SPIE 1990;1202:22–33.
78 Nahen and Vogel