Embed Size (px)
Citation preview
INVESTING IN INDONESIA’S EDUCATION
ALLOCATION, EQUITY, AND EFFICIENCY OF PUBLIC EXPENDITURES
January 2007 Bank Dunia | The World Bank Poverty Reduction and Economic Management Unit East Asia and Pacific Region
i
38778 v. 2
Pub
lic D
iscl
osur
e A
utho
rized
Pub
lic D
iscl
osur
e A
utho
rized
Pub
lic D
iscl
osur
e A
utho
rized
Pub
lic D
iscl
osur
e A
utho
rized
THE WORLD BANK OFFICE JAKARTA
Jakarta Stock Exchange Building Tower II/12th Fl. Jl. Jend. Sudirman Kav. 52-53 Jakarta 12910 Tel: (6221) 5299-3000 Fax: (6221) 5299-3111 Website: www.worldbank.or.id THE WORLD BANK
1818 H Street N.W. Washington, D.C. 20433, U.S.A. Tel: (202) 458-1876 Fax: (202) 522-1557/1560 Email: [email protected] Website: www.worldbank.org Printed in January 2007. This volume is a product of staff of the World Bank. The findings, interpretations, and conclusions expressed herein do not necessarily reflect the views of the Board of Executive Directors of the World Bank or the governments they represent. The World Bank does not guarantee the accuracy of the data included in this work. The boundaries, colors, denominations, and other information shown on any map in this work do not imply any judgment on the part of the World Bank concerning the legal status of any territory or the endorsement of acceptance of such boundaries.
ii
Investing in Indonesia’s Education Allocation, Equity and Efficiency of Public Expenditures
ACKNOWLEDGMENTS This report has been prepared by the Initiative for Public Expenditure Analysis (IPEA), a joint initiative between the Government of Indonesia and the World Bank, which is supported by the World Bank-Dutch Trust Fund. The main authors of the report are Francisco Javier Arze del Granado, Wolfgang Fengler, Andrew B Ragatz and Elif Yavuz. The team would like to thank the IPEA Steering Committee for enabling this research as well as for their inputs, assistance and technical advice. The Steering Committee’s main members include: Askolani, Bambang Jasminto, Bambang Koesoemanto, Boediarso, Kadjatmiko, Heru Subiantoro (Ministry of Finance), Leonard Tampubolon, Wismana A. Suryabrata (Bappenas), Mohammad Ikhsan, Bobby Rafinus (Coordinator Ministry of Economy). The team would like to especially thank Soekarno Wirokartono (World Bank, Senior Advisor) for his professional advice and inputs, and his efforts in coordinating and leading the consultative meetings with the Steering Committee. Mae Chu Chang, Vicente B. Paqueo, Steen S. Andersen, Soren Davidsen, Melanie Juwono, and Abbas Ghozali have supported this project, advised the team and provided valuable input. Overall guidance was provided by Andrew Steer (World Bank Country Director, Indonesia). The peer reviewer was Prof. Guenther Schulze (University of Freiburg, Germany). Alicia J. Hetzner was the principal editor. Indra Irnawan designed the cover page. This report benefited significantly from the comments and insights of many more leaders and experts who attended the various consultative meetings that were organized during the preparation of this report. In particular we would like to acknowledge the following staff of Bappenas: Dedi M. M. Riyadi, Taufik Hanafi, and Nina Sardjunani, and the following staff of MoNE: Dr. Fasli Jalal, Dr. Hamid Muhammad, Dr. Agung Purwadi and the Balitbang team. To all of the contributors the team would like to express their deepest thanks and appreciation. Any follow-up questions or requests for additional information should be directed to Wolfgang Fengler ([email protected]).
iii
TABLE OF CONTENTS EXECUTIVE SUMMARY ............................................................................................................................... 1
CHAPTER 1 EDUCATION IN INDONESIA: PROGRESS AND CHALLENGES ................................................. 5 CHAPTER 2 PUBLIC SPENDING.................................................................................................................. 9
Trends ..........................................................................................................................................................................................................................................................9 Economic Composition by Level of Government ........................................................................................................................................................ 12 Spending and Efficiency by Education Sub-sector ...................................................................................................................................................... 13 Allocations to the School Level ................................................................................................................................................................................................ 16
CHAPTER 3 EDUCATION PUBLIC EXPENDITURES AND EQUITY............................................................... 21
Equity in Enrollment Rates across Levels and Regions.............................................................................................................................................. 21 Equity of Spending Across Districts ....................................................................................................................................................................................... 24 Increasing Access: ............................................................................................................................................................................................................................. 25 Cost Implications of Quality Education for All................................................................................................................................................................. 25
CHAPTER 4 EDUCATION PUBLIC EXPENDITURES, EFFICIENCY, AND OUTCOMES.................................. 27
Efficiency in Personnel Management: Teacher Distribution .................................................................................................................................. 28 Teacher Salaries, Incentives, and Education Quality.................................................................................................................................................... 31 Education Outcomes: Student Performance and Test Scores.............................................................................................................................. 35
ANNEXES .................................................................................................................................................. 37
Annex 1 Estimating Education Expenditures .................................................................................................................................................................. 38 Annex 2 Computing Social Rates of Return to Investments in Education.................................................................................................... 39 Annex 3 Determinants of Net Enrollment Rate in Indonesia................................................................................................................................. 41 Annex 4 Estimating the Financial Implications of the New Teacher Law...................................................................................................... 43 Annex 5 Methodological Note on the Computation of Unit Costs of Education .................................................................................... 44 Annex 6 Estimating the Financial Implications of Teacher Oversupply.......................................................................................................... 45 Annex 7 Characteristics of Education Personnel in Indonesia.............................................................................................................................. 47 Annex 8 Teacher Earnings in Indonesia: Econometric Analysis ........................................................................................................................... 48 Annex 9 Interpretations of the 20 percent “Rule” ......................................................................................................................................................... 51
REFERENCES ........................................................................................................................................... 52 LIST OF TABLES
Table 1.1 Gross & Net Enrollment Rates for Different Levels of Education in Indonesia 1995–2004...............................................6 Table 2.1 National Public Expenditure on Education (Central + Province + District) for 2001 to 2004...................................... 10 Table 2.2 Education Public Expenditure in Indonesia's Neighboring Countries ....................................................................................... 12 Table 2.3 Nominal Education Expenditures per Level of Government 2001–04 ...................................................................................... 12 Table 2.4 Share of Development and Routine Expenditures by Level of Government ........................................................................ 12 Table 2.5 Routine Expenditure Distribution by Level of Sub-National Government 2002–04......................................................... 13 Table 2.6 Social Returns to Education per Level of Education 2004 ................................................................................................................. 14 Table 2.7 Expenditure on Educational Institutions per Student per Level of Education...................................................................... 16 Table 2.8 Operational Aid to Schools per Level of Education 2006................................................................................................................... 16 Table 2.9 Education Spending as Percentage of Central Sub-National and National Spending ................................................... 19 Table 3.2 District Expenditures on Education per Poverty Quintile................................................................................................................... 24 Table 3.3 Cost Estimates for Education for All (EFA).................................................................................................................................................... 25 Table A2.1 Mean Annual Earnings at Different Age Groups .................................................................................................................................. 39 Table A2.2 Investment Costs: Direct and Indirect Costs of Education ............................................................................................................. 39 Table A2.3 Unit Costs of Education by Education Level and Spending Unit............................................................................................... 40 Table A3.1 Determinants of Education Net Enrollment............................................................................................................................................ 42 Table A6.1 Comparative Costs Based on Current Situation and Proposed Option................................................................................. 46 Table A7.1 Number and Percent of Part-Time and Full-Time Teachers in Secondary Education................................................... 47 Table A7.2 Number and Percent of Primary Teachers Per Responsibility...................................................................................................... 47 Table A8.1 Average Monthly Earnings and Hours Worked by Teachers and Non-Teachers by Level of Education........... 48 Table A8.2 Difference in Earnings: Sample of Paid Workers with Secondary Schooling or More Education.......................... 48 Table A8.3 Determinants of Hourly Earnings. .................................................................................................................................................................. 49 Table A8.4 Differences in Monthly Earnings: After Controlling for Individual Characteristics ......................................................... 50
iv
Investing in Indonesia’s Education Allocation, Equity and Efficiency of Public Expenditures
LIST OF FIGURES
Figure 1.1 Enrollment Rates by Income Groups - Primary and Junior Secondary Education ..............................................................7 Figure 2.1 National Education Expenditures Trend 2001–2007........................................................................................................................... 11 Figure 2.2 International Comparison of Education Expenditures....................................................................................................................... 11 Figure 2.3 Education Spending by Economic Classification, Level of Government, and District Spending Routine Composition ......................................................................................................................................................................................................................................... 13 Figure 2.4 Education Spending per Program and Level of Government....................................................................................................... 15 Figure 2.5 Central and Sub-National Budget Allocations to the Education Sector ................................................................................. 19 Figure 3.1 Net Enrollment Rates Time Trend ................................................................................................................................................................... 22 Figure 3.2 Primary Education: District Enrollment Rates within Provinces.................................................................................................... 23 Figure 3.3 Percent of District Expenditure on Education by District Poverty Quintile........................................................................... 25 Figure 4.1 Primary and Secondary School Student -Teacher Ratios by Selected Countries, 2003 ................................................ 28 Figure 4.2 Percent of Primary Schools with Oversupply, Undersupply by Region .................................................................................. 29 Figure 4.3 Primary and Junior Secondary School Teacher Earnings vs. Hours Worked ........................................................................ 30 Figure 4.4 Estimated Financial Cost of Teacher Salary and New Stipulated Incentives........................................................................ 34 Figure 4.5 Students at Each Level of Proficiency on the Mathematics Overall Scale (%)..................................................................... 35 Figure 4.6 Trend in Reading and Mathematics Test Scores in PISA International Standardized Test .......................................... 36
LIST OF BOXES Box 2.1 What can “BOS Funds” be used for?..................................................................................................................................................................... 17 Box 2.2 Legal background of Indonesia’s “20 percent rule” ................................................................................................................................... 18 Box 4.1 Responsibilities for employment and deployment of teachers......................................................................................................... 31 Box 4.2 Types of Teachers in Indonesia .............................................................................................................................................................................. 32
v
Glossary of Terms
ABT Additional Expenditure (Anggaran Belanja Tambahan)
ADB Asian Development Bank
Bappeda Development Planning Agency at Sub-National Level (Badan Perencanaan Pembangunan Daerah)
Bappenas National Development Planning Board (Badan Perencanaan Pembangunan Nasional)
BI Central Bank (Bank Indonesia)
BKM Scholarship program for poor student (Bantuan Khusus Murid)
BKN National Civil Service Agency (Badan Kepegawaian Negara)
BOS Operational Aid to School Program (Bantuan Operasional Sekolah)
BPKP Badan Pengawasan Keuangan dan Pembangunan
BPM Community Development Agency (Badan Pemberdayaan Masyarakat)
BPS Statistics Indonesia (Badan Pusat Statistik)
Bupati District Head
CGI Consultative Group for Indonesia
CPI Consumer Price Index
CY Calendar Year
DAU General Allocation Grant (Dana Alokasi Umum)
Desa Village
Dinas Provincial Sub-Project Management
DIPA Issuance of spending authority (Daftar Isian Proyek Anggaran)
DPPHLN Directorate General Treasury (Direktorat Jenderal Perbendaharaan Negara)
EFA Education for All
GDP Gross Domestic Product
GDS Governance and Decentralization Survey
GOI Government of Indonesia
GRDP Gross Regional Domestic Product
HDI Human Development Index
IMF International Monetary’s fund
INPRES Presidential Instruction (Instruksi Presiden)
Kabupaten District
Kecamatan Sub-District
Kelurahan Village
Kota City District
KPK Anti-Corruption Commission (Komite Pemberantasan Korupsi)
KPPN State Treasury Offices (Kantor Pelayanan Perbendaharaan Negara)
MDG Millenium Development Goal
MOE Ministry of Environment
MOHA Ministry of Home Affairs
MONE Ministry of National Education
MORA Ministry of Religious Affairs
MPR People Consultative Assembly (Majelis Permusyawaratan Rakyat)
MPW Ministry of Public Works
MTEF Medium-term Expenditure Framework
vi
Investing in Indonesia’s Education Allocation, Equity and Efficiency of Public Expenditures
OECD Organization for Economic Co-operation and Development
PC Per capita
PDAM Local Water Supply Enterprise (Perusahaan Daerah Air Minum)
PEFA Public Expenditure and Financial Accountability
Perda Local Regulation (Peraturan Daerah)
Perpu Regulation in Lieu of Law (Peraturan Pemerintah Pengganti Undang Undang)
PGRI National Teacher Association (Persatuan Guru Republik Indonesia)
PISA Program for International Student Association
PKPS-BBM Compensation Program to Reduce Fuel Subsidy (Program Kompensasi Pengurangan Subsidi BBM)
Podes The Village Potential Statistics (Potensi Desa)
RAPBN Draft budget presented to the parliament (Rencana Pendapatan Belanja Negara)
RenjaKL Annual Work Plans (Rencana Kerja Tahunan Kementrian/Lembaga)
Renstra KL Ministry and Agency Medium Term Strategic Plan (Rencana Strategis Kementerian/Lembaga)
RKA-KL Ministry Work Plan and Budget (Rencana Kerja dan Anggaran Kementerian/Lembaga)
RKP Government Work Plan (Rencana Kerja Pemerintah)
Rp Indonesian Rupiah
Sakernas Labor Force Survey (Survey Tenaga Kerja Nasional)
SD Primary School (Sekolah Dasar)
SLA Subsidiary Loan Agreements
SMERU Independent institution for research and public policy studies
STR Student – Teacher Ratios
TIMSS Third International Mathematic Science Study
TSA Treasury Single Account
WDI World Development Indicators
WEI World Education Indicator
vii

viii
EXECUTIVE SUMMARY Indonesia is close to achieving universal primary education enrollment. Providing access to primary school education is no longer the main development challenge, although it remains vital to target the remaining 8 percent of children not yet in primary school. The government is rightly addressing the investment gaps in primary education, but going forward, the focus should turn towards improving the quality of education and increasing enrollments in junior secondary schools. In coming years, Indonesia will have the resources to further improve education outcomes. Indonesia will likely experience substantially growing fiscal space due to higher revenues, lower debt service payments and reduced subsidies. Since the reduction in fuel subsidies in 2005, Indonesia has freed up US$ 10 billion that it can spend on development projects, and the education sector has already benefited from recent budget increases.1 Investing in Education Indonesia spends 16.5 percent of its budget on education. This level is almost on par with both other developing countries and with Organization for Economic Co-operation and Development (OECD) nations. However, Indonesia’s spending level is still relatively low compared to its East Asian neighbors, and since the 1980s Indonesia has spent comparatively less in education, resulting in a deterioration of school buildings and contributing to persistently low learning outcomes by students. Spending on education has been rising steadily and is expected to increase further. This is one indication of the government’s commitment to improve services. Public expenditure on education has increased rapidly, from 2.5 percent of GDP in 2001 to an estimated 3.5 percent in 2006. As a result, education spending as a share of total expenditures is now comparable to levels in other middle income countries, and even some OECD countries. However, some of the countries in the immediate region (Malaysia, Thailand, and Philippines) tend to spend more on education, up to 28 percent of their budgets. There is a structural inconsistency in the central-local spending composition. Local governments provide the bulk of the financing (70 percent) for education, but it is almost entirely devoted to teacher salaries and salary scales are fixed by the central government. In contrast, the central government dominates the investment budget, although local governments are in charge of running, building and rehabilitating schools. Implementing the 20 percent education mandate in its current definition, and maintaining the exclusion of teachers’ salaries from this benchmark, is unrealistic and problematic. It is close to impossible to reach 20 percent at both the central and the local level, particularly if salaries are excluded. Sub-national governments tend to spend most of their education budgets on salaries. In order to reach the 20 percent benchmark within the current definition, sub-national spending on education would need to increase from the current 28 percent (which is mainly on salaries) to at least 45 percent. The central government would also need to more than double existing spending levels, and spend the incremental on non-salary expenditures. Increasing resources at the central level to 20 percent goes against the logic of decentralization by encouraging more central spending on decentralized sectors. The current definition also creates an adverse incentive in classifying salary top-ups as non-current expenditures.
1 For a full analysis of Indonesia’s growing fiscal space, see the forthcoming Public Expenditure Review 2006 (Spending for Development: Making the Most
of Indonesia’s New Opportunities) World Bank, Jakarta.
1
Investing in Indonesia’s Education Allocation, Equity and Efficiency of Public Expenditures
In order to translate rising education expenditures into better services, Indonesia needs to address three main challenges:
• Improving the spending mix, within education sectors, and between sectors; • Making education expenditures more equitable; and • Improving the efficiency of education expenditures. Improving the Spending Mix Since net enrollment rates at the primary level are already close to the Government’s 100 percent target, the focus at this level should be on investing in rehabilitating existing education infrastructure and improving the quality of instruction. A focus should still be placed upon improving access to primary schools in selected remote regions. Nevertheless, 100 percent enrollment rates may not contribute to poverty reduction and growth if the quality of primary education is poor. Many primary schools lack adequate infrastructure and have teachers who do not have the minimum teaching requirements. The spending mix among programs should be altered in favor of infrastructure rehabilitation, teacher training and quality inputs. Allocating additional resources to junior secondary schools is desirable because enrollment rates are still low, particularly for the poorest quintile of the population. Allocations to junior secondary education are only 24 percent of total education spending – low compared to the allocations for primary education. Allocating additional resources to the junior secondary level of education would have a high rate of return, even higher than in primary education. The government is rightly addressing the investment gaps in primary education, and going forward, the focus can now turn more towards improving the quality of education and increasing enrollment rates in junior secondary schools. 2 Allocating additional resources to junior secondary schools is desirable because enrollment rates are still low, particularly for the poorest quintile of the population. Allocations to junior secondary education are only 15 percent of total education spending – similar to the allocations for senior secondary and tertiary education. Allocating additional resources to the junior secondary level of education would have a high rate of return, even higher than in primary education. The government is rightly addressing the investment gaps in primary education, but going forward, the focus should now turn more towards improving the quality of education and increasing enrollment rates in junior secondary schools.
Making Education Expenditures More Equitable Regional discrepancies in access and quality can be reduced through better targeting. Because there are significant differences in educational access and quality across the country, the government could allocate educational funds to provide these lagging districts and provinces sufficient resources to catch up to better performing regions. Poorer local governments tend to spend more than 35 percent of their budgets on the education sector, but their absolute spending levels are low in comparison with wealthier regions. Central government transfers should ensure that spending results in more equitable access to services. The new Operational Aid to Schools (BOS) program represents a new approach to education finance, and could be an important instrument for improving affordability, although there are areas for improvement. BOS funds represent 12 percent of the total consolidated education budget. Three main issues should be considered when designing similar future programs: • While the direct transfer of funds to schools might diminish leakage, at the same time, monitoring and tracking
of money is required to prevent potential misuse and misallocation of these resources. • Because the size of the grant is determined based on the number of students, schools have an incentive to
inflate enrollment figures if no adequate control mechanism is in place. • The grant program does not require performance measures or significant budget transparency conditions for
schools, making it difficult to assess the program’s impact on school fees and teaching quality.
2 The Ministry of Education recognizes the need for increased spending at the secondary level, and states in its medium-term development plan (Renstra) the intention to increase the budget to 8.9 trillion Rupiah in 2009, with the intention, to fund strategic programs included the theme of educational expansion and equity, as well as quality improvement and relevance. See Renstra, MoNE, 2005
2
Investing in Indonesia’s Education Allocation, Equity and Efficiency of Public Expenditures
While most of the poorest have access to primary education, they are lagging behind in secondary and tertiary education. Indonesia should focus on improving the enrollment of the poor, particularly at the level of junior secondary education, where high drop-out rates and low enrollment occur. Higher enrollments of the poor in junior secondary education would be a stepping stone for higher education. Targeted programs could address this challenge in two ways: • Address the demand side by reducing households’ out-of-pocket spending or mitigating foregone earnings
through mechanisms such as cash transfers. • Address supply side constraints, particularly the potential shortage of education infrastructure, through the
conversion of some primary schools to lower secondary schools, construction of new schools, or both.
Improving the Efficiency of Education Expenditures Teacher Supply and Distribution The current allocation formula encourages an oversupply of teachers in many schools, amounting to almost 10 percent of the total education budget. Schools submit their teacher supply requirements to the district office, and the districts then request the number of additional teachers required from the central education office. The central office then allocates teachers to districts and provides the additional teacher salaries through the DAU. Under this system, the schools and districts have a strong incentive to request additional (and largely free) resources, and have little incentive to use teacher resources efficiently. While the implementation of an effective transfer policy will more equitably deploy teachers, reducing the excess supply of teachers is the greatest challenge at present. Given that teachers are civil servants, there are few options other than attrition or “pay outs” to reduce overall numbers, and the latter solution would be expensive in the short-tem. An important complementary strategy would be to limit the intake of prospective teachers into training institutions and to reorient primary teachers to Early Childhood Development Programs, an area that has received comparably little attention to date, or to secondary education, where expansion in enrollment is expected to take place. Teachers are very unevenly distributed in Indonesia. Approximately 55 percent of schools have an oversupply of teachers, while 34 percent are undersupplied. Most urban, and a large share of rural schools, have too many teachers, while 66 percent of schools in remote areas have teacher shortages. The government’s new policy of providing an additional financial incentive for teachers working in remote schools is a first step in the right direction, but it will only improve the quality of services if strong monitoring systems are in place– ideally by local communities. Teachers would be distributed more equally if the entitlement formula that allocates teachers to schools were to be changed. Currently, each school receives a standard allocation of teachers, depending on the number of classes, irrespective of the class size. The distribution of teachers would improve if staffing was determined by the number of students, with an additional weighting for smaller schools. This reform could be accompanied by allowing greater flexibility in the range of subjects that teachers are required to teach. Teacher Remuneration and the New Teacher Law Teachers earnings are lower than those of other workers and civil servants with similar education levels and do not adequately compensate secondary school teachers and teachers working in remote areas. Although wage differentials are smaller when analyzing actual hourly earnings, teachers tend to earn less then their non-teaching civil servant colleagues. In addition, the wide-spread employment of contractual teachers whose wages are negotiated at the district level leads to regional wage disparities and complicate the redistribution of teaching personnel. 3
3 At the time of this report, no detailed data on central government payroll of teachers and other civil servants, or district’s contractual teachers, was available to conduct a more complete analysis of the features of the civil servant’s compensation structure. The conclusions presented are based on data on earnings reported by respondents of the National Labor Survey (Sakernas) 2006.
3
Investing in Indonesia’s Education Allocation, Equity and Efficiency of Public Expenditures
The new teacher certification program addresses some of these problems by increasing teachers’ base salaries for those teachers that have higher qualification levels, better performance and/or are located in remote areas. Yet the new teacher law will increase education expenditures substantially, since the new allowances over the next 5 years will increase the national education budget by more than 50 percent. The significantly large costs imposed by the new law could be partially offset by a simultaneous reduction of the teacher oversupply and the number of part-time teachers. This would entail gradual deployment of newly certified teachers during the next 5 to 10 years when a large number of teachers will be retiring.
4
Investing in Indonesia’s Education Allocation, Equity and Efficiency of Public Expenditures
CHAPTER 1 EDUCATION IN INDONESIA: PROGRESS AND CHALLENGES
5
Investing in Indonesia’s Education Allocation, Equity and Efficiency of Public Expenditures
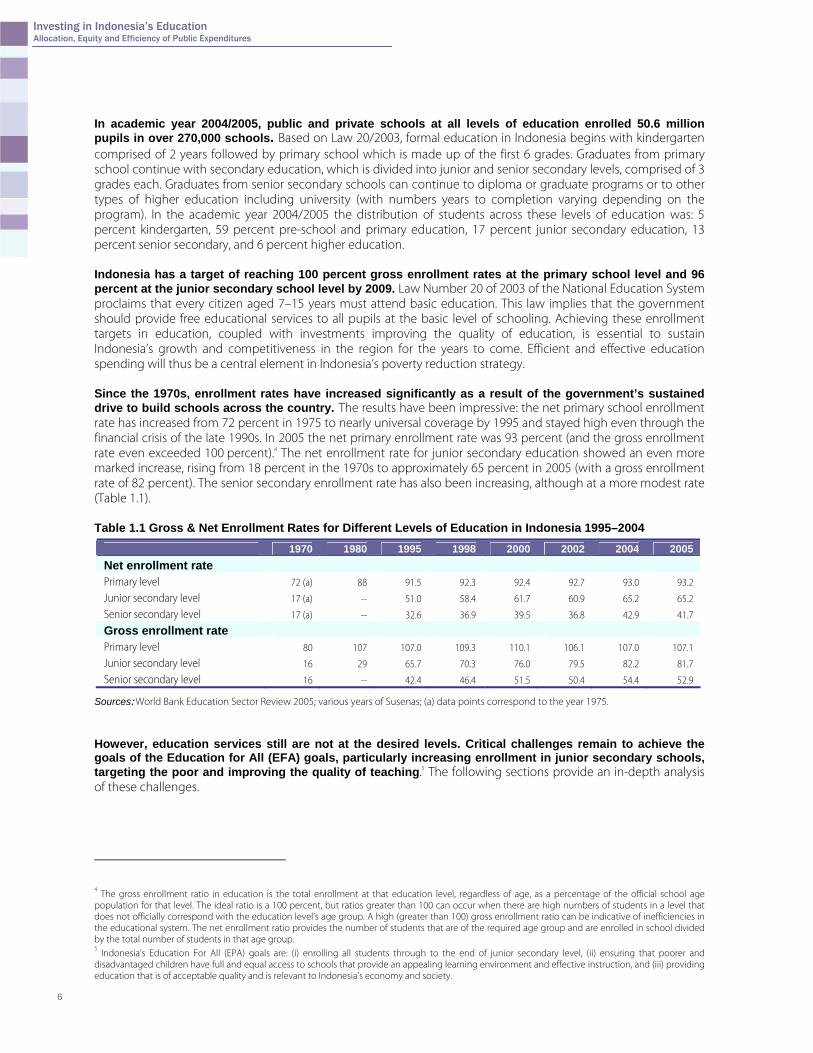
In academic year 2004/2005, public and private schools at all levels of education enrolled 50.6 million pupils in over 270,000 schools. Based on Law 20/2003, formal education in Indonesia begins with kindergarten comprised of 2 years followed by primary school which is made up of the first 6 grades. Graduates from primary school continue with secondary education, which is divided into junior and senior secondary levels, comprised of 3 grades each. Graduates from senior secondary schools can continue to diploma or graduate programs or to other types of higher education including university (with numbers years to completion varying depending on the program). In the academic year 2004/2005 the distribution of students across these levels of education was: 5 percent kindergarten, 59 percent pre-school and primary education, 17 percent junior secondary education, 13 percent senior secondary, and 6 percent higher education. Indonesia has a target of reaching 100 percent gross enrollment rates at the primary school level and 96 percent at the junior secondary school level by 2009. Law Number 20 of 2003 of the National Education System proclaims that every citizen aged 7–15 years must attend basic education. This law implies that the government should provide free educational services to all pupils at the basic level of schooling. Achieving these enrollment targets in education, coupled with investments improving the quality of education, is essential to sustain Indonesia’s growth and competitiveness in the region for the years to come. Efficient and effective education spending will thus be a central element in Indonesia’s poverty reduction strategy. Since the 1970s, enrollment rates have increased significantly as a result of the government’s sustained drive to build schools across the country. The results have been impressive: the net primary school enrollment rate has increased from 72 percent in 1975 to nearly universal coverage by 1995 and stayed high even through the financial crisis of the late 1990s. In 2005 the net primary enrollment rate was 93 percent (and the gross enrollment rate even exceeded 100 percent).4 The net enrollment rate for junior secondary education showed an even more marked increase, rising from 18 percent in the 1970s to approximately 65 percent in 2005 (with a gross enrollment rate of 82 percent). The senior secondary enrollment rate has also been increasing, although at a more modest rate (Table 1.1). Table 1.1 Gross & Net Enrollment Rates for Different Levels of Education in Indonesia 1995–2004
1970 1980 1995 1998 2000 2002 2004 2005 Net enrollment rate Primary level 72 (a) 88 91.5 92.3 92.4 92.7 93.0 93.2
Junior secondary level 17 (a) -- 51.0 58.4 61.7 60.9 65.2 65.2
Senior secondary level 17 (a) -- 32.6 36.9 39.5 36.8 42.9 41.7
Gross enrollment rate Primary level 80 107 107.0 109.3 110.1 106.1 107.0 107.1
Junior secondary level 16 29 65.7 70.3 76.0 79.5 82.2 81.7
Senior secondary level 16 -- 42.4 46.4 51.5 50.4 54.4 52.9
Sources: World Bank Education Sector Review 2005; various years of Susenas; (a) data points correspond to the year 1975.
However, education services still are not at the desired levels. Critical challenges remain to achieve the goals of the Education for All (EFA) goals, particularly increasing enrollment in junior secondary schools, targeting the poor and improving the quality of teaching.5 The following sections provide an in-depth analysis of these challenges.
4 The gross enrollment ratio in education is the total enrollment at that education level, regardless of age, as a percentage of the official school age
population for that level. The ideal ratio is a 100 percent, but ratios greater than 100 can occur when there are high numbers of students in a level that does not officially correspond with the education level’s age group. A high (greater than 100) gross enrollment ratio can be indicative of inefficiencies in the educational system. The net enrollment ratio provides the number of students that are of the required age group and are enrolled in school divided by the total number of students in that age group. 5 Indonesia’s Education For All (EPA) goals are: (i) enrolling all students through to the end of junior secondary level, (ii) ensuring that poorer and
disadvantaged children have full and equal access to schools that provide an appealing learning environment and effective instruction, and (iii) providing education that is of acceptable quality and is relevant to Indonesia’s economy and society.
6
Investing in Indonesia’s Education Allocation, Equity and Efficiency of Public Expenditures
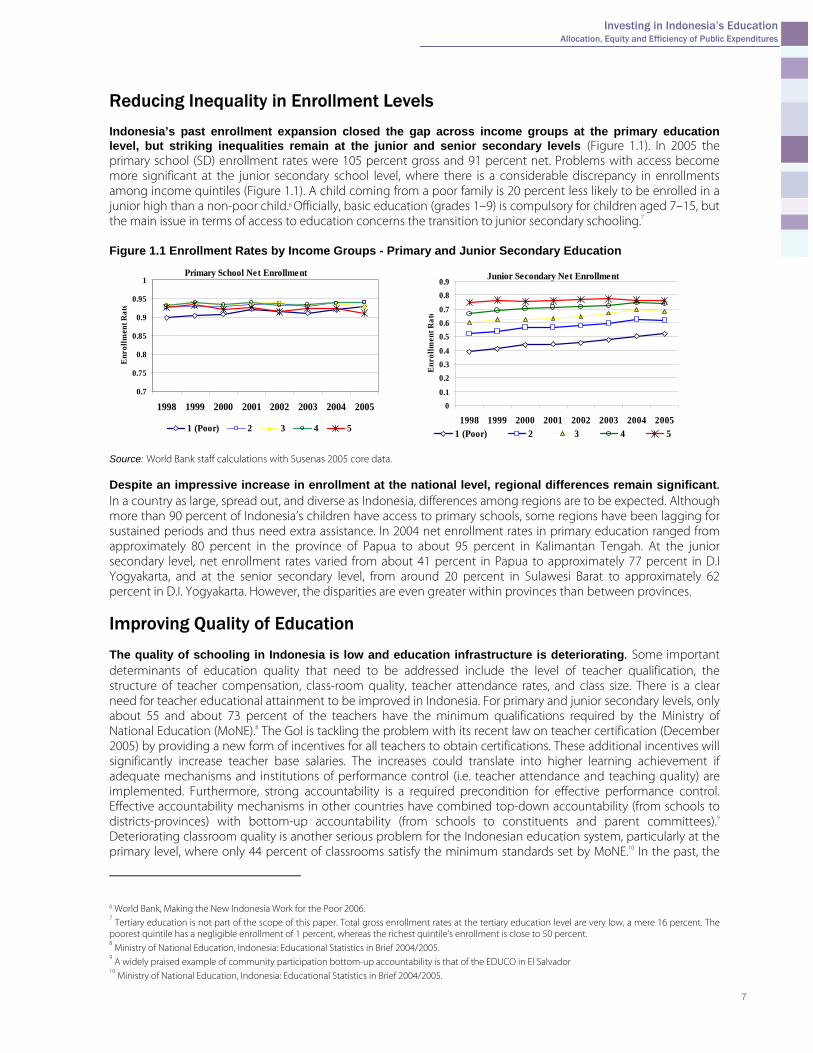
Reducing Inequality in Enrollment Levels Indonesia’s past enrollment expansion closed the gap across income groups at the primary education level, but striking inequalities remain at the junior and senior secondary levels (Figure 1.1). In 2005 the primary school (SD) enrollment rates were 105 percent gross and 91 percent net. Problems with access become more significant at the junior secondary school level, where there is a considerable discrepancy in enrollments among income quintiles (Figure 1.1). A child coming from a poor family is 20 percent less likely to be enrolled in a junior high than a non-poor child.6 Officially, basic education (grades 1–9) is compulsory for children aged 7–15, but the main issue in terms of access to education concerns the transition to junior secondary schooling.7 Figure 1.1 Enrollment Rates by Income Groups - Primary and Junior Secondary Education
Primary School Net Enrollment
0.7
0.75
0.8
0.85
0.9
0.95
1
1998 1999 2000 2001 2002 2003 2004 2005
Enr
ollm
ent R
ate
1 (Poor) 2 3 4 5
Junior Secondary Net Enrollment
00.1
0.20.30.4
0.50.60.7
0.80.9
1998 1999 2000 2001 2002 2003 2004 2005E
nrol
lmen
t Rat
e1 (Poor) 2 3 4 5
Source: World Bank staff calculations with Susenas 2005 core data. Despite an impressive increase in enrollment at the national level, regional differences remain significant. In a country as large, spread out, and diverse as Indonesia, differences among regions are to be expected. Although more than 90 percent of Indonesia’s children have access to primary schools, some regions have been lagging for sustained periods and thus need extra assistance. In 2004 net enrollment rates in primary education ranged from approximately 80 percent in the province of Papua to about 95 percent in Kalimantan Tengah. At the junior secondary level, net enrollment rates varied from about 41 percent in Papua to approximately 77 percent in D.I Yogyakarta, and at the senior secondary level, from around 20 percent in Sulawesi Barat to approximately 62 percent in D.I. Yogyakarta. However, the disparities are even greater within provinces than between provinces. Improving Quality of Education The quality of schooling in Indonesia is low and education infrastructure is deteriorating. Some important determinants of education quality that need to be addressed include the level of teacher qualification, the structure of teacher compensation, class-room quality, teacher attendance rates, and class size. There is a clear need for teacher educational attainment to be improved in Indonesia. For primary and junior secondary levels, only about 55 and about 73 percent of the teachers have the minimum qualifications required by the Ministry of National Education (MoNE).8 The GoI is tackling the problem with its recent law on teacher certification (December 2005) by providing a new form of incentives for all teachers to obtain certifications. These additional incentives will significantly increase teacher base salaries. The increases could translate into higher learning achievement if adequate mechanisms and institutions of performance control (i.e. teacher attendance and teaching quality) are implemented. Furthermore, strong accountability is a required precondition for effective performance control. Effective accountability mechanisms in other countries have combined top-down accountability (from schools to districts-provinces) with bottom-up accountability (from schools to constituents and parent committees).9 Deteriorating classroom quality is another serious problem for the Indonesian education system, particularly at the primary level, where only 44 percent of classrooms satisfy the minimum standards set by MoNE.10 In the past, the
6 World Bank, Making the New Indonesia Work for the Poor 2006. 7 Tertiary education is not part of the scope of this paper. Total gross enrollment rates at the tertiary education level are very low, a mere 16 percent. The
poorest quintile has a negligible enrollment of 1 percent, whereas the richest quintile’s enrollment is close to 50 percent. 8 Ministry of National Education, Indonesia: Educational Statistics in Brief 2004/2005.
9 A widely praised example of community participation bottom-up accountability is that of the EDUCO in El Salvador
10 Ministry of National Education, Indonesia: Educational Statistics in Brief 2004/2005.
7
Investing in Indonesia’s Education Allocation, Equity and Efficiency of Public Expenditures
government’s education strategy has favored access at the expense of quality. Finally, although the student-teacher ratio is low, the fact that there are large numbers of part-time and absent teachers still leads to a high student-class ratio. Moreover, the Indonesian education system does not produce enough students with the knowledge and skills required to work in economic sectors with high growth potential. Indonesian newspapers report frequently on the gap between what schools offer, and the needs of civil society for an engaged electorate, as well as the demands of the enterprise sector for employees and entrepreneurs with imagination and problem-solving skills. The results of the 2002 examinations show that out of a possible 10 points for each subject area, the more than 2.2 million students from nearly 20,000 schools who took the tests averaged scores of 5.79 for math, 5.11 for Bahasa Indonesia, and 5.29 for English. Figures for 2005/2006 indicate a significant increase in scores, now averaging 7.13 for math, 7.46 for Bahasa Indonesia, and 6.62 for English.11 The reliability of the test results is debatable however, and comparing test-scores across years is only valid if the test-designs do not change substantially.
11 Ministry of National Education, Data from the Assessment Center.
8
Investing in Indonesia’s Education Allocation, Equity and Efficiency of Public Expenditures
CHAPTER 2 PUBLIC SPENDING
9
Investing in Indonesia’s Education Allocation, Equity and Efficiency of Public Expenditures
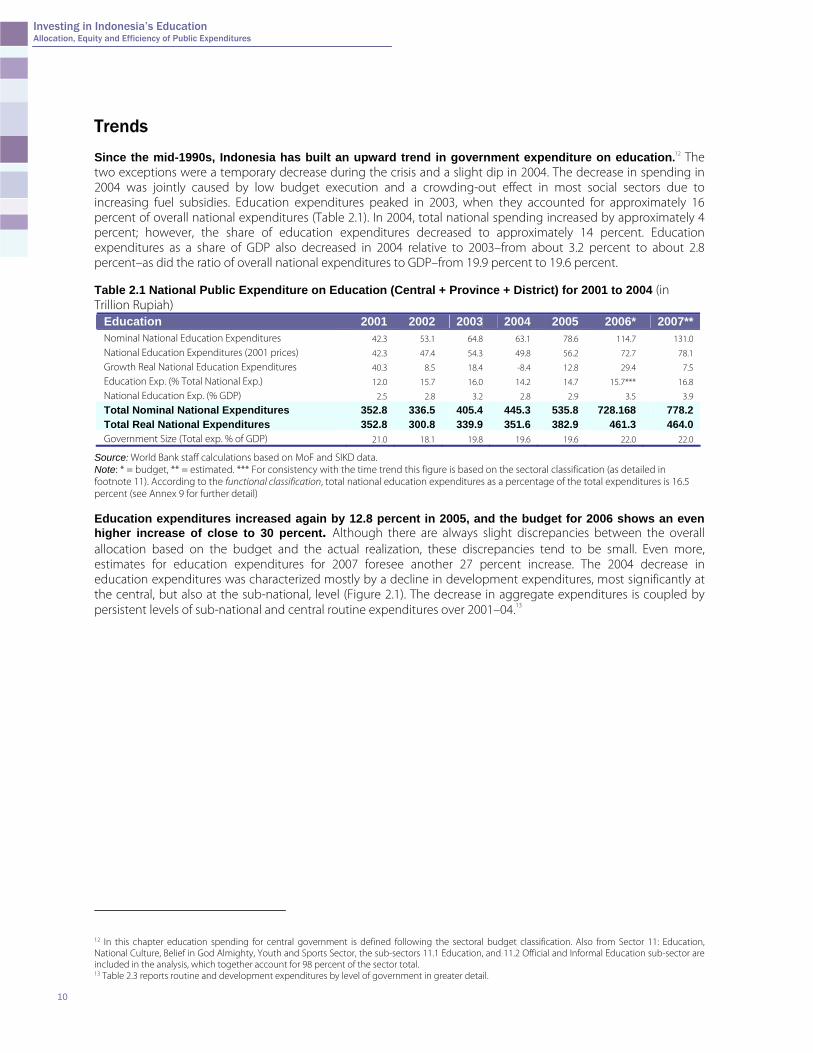
Trends Since the mid-1990s, Indonesia has built an upward trend in government expenditure on education.12 The two exceptions were a temporary decrease during the crisis and a slight dip in 2004. The decrease in spending in 2004 was jointly caused by low budget execution and a crowding-out effect in most social sectors due to increasing fuel subsidies. Education expenditures peaked in 2003, when they accounted for approximately 16 percent of overall national expenditures (Table 2.1). In 2004, total national spending increased by approximately 4 percent; however, the share of education expenditures decreased to approximately 14 percent. Education expenditures as a share of GDP also decreased in 2004 relative to 2003–from about 3.2 percent to about 2.8 percent–as did the ratio of overall national expenditures to GDP–from 19.9 percent to 19.6 percent. Table 2.1 National Public Expenditure on Education (Central + Province + District) for 2001 to 2004 (in Trillion Rupiah)
Education 2001 2002 2003 2004 2005 2006* 2007** Nominal National Education Expenditures 42.3 53.1 64.8 63.1 78.6 114.7 131.0
National Education Expenditures (2001 prices) 42.3 47.4 54.3 49.8 56.2 72.7 78.1
Growth Real National Education Expenditures 40.3 8.5 18.4 -8.4 12.8 29.4 7.5
Education Exp. (% Total National Exp.) 12.0 15.7 16.0 14.2 14.7 15.7*** 16.8
National Education Exp. (% GDP) 2.5 2.8 3.2 2.8 2.9 3.5 3.9
Total Nominal National Expenditures 352.8 336.5 405.4 445.3 535.8 728.168 778.2 Total Real National Expenditures 352.8 300.8 339.9 351.6 382.9 461.3 464.0 Government Size (Total exp. % of GDP) 21.0 18.1 19.8 19.6 19.6 22.0 22.0
Source: World Bank staff calculations based on MoF and SIKD data. Note: * = budget, ** = estimated. *** For consistency with the time trend this figure is based on the sectoral classification (as detailed in footnote 11). According to the functional classification, total national education expenditures as a percentage of the total expenditures is 16.5 percent (see Annex 9 for further detail) Education expenditures increased again by 12.8 percent in 2005, and the budget for 2006 shows an even higher increase of close to 30 percent. Although there are always slight discrepancies between the overall allocation based on the budget and the actual realization, these discrepancies tend to be small. Even more, estimates for education expenditures for 2007 foresee another 27 percent increase. The 2004 decrease in education expenditures was characterized mostly by a decline in development expenditures, most significantly at the central, but also at the sub-national, level (Figure 2.1). The decrease in aggregate expenditures is coupled by persistent levels of sub-national and central routine expenditures over 2001–04.13
12 In this chapter education spending for central government is defined following the sectoral budget classification. Also from Sector 11: Education, National Culture, Belief in God Almighty, Youth and Sports Sector, the sub-sectors 11.1 Education, and 11.2 Official and Informal Education sub-sector are included in the analysis, which together account for 98 percent of the sector total. 13 Table 2.3 reports routine and development expenditures by level of government in greater detail.
10
Investing in Indonesia’s Education Allocation, Equity and Efficiency of Public Expenditures
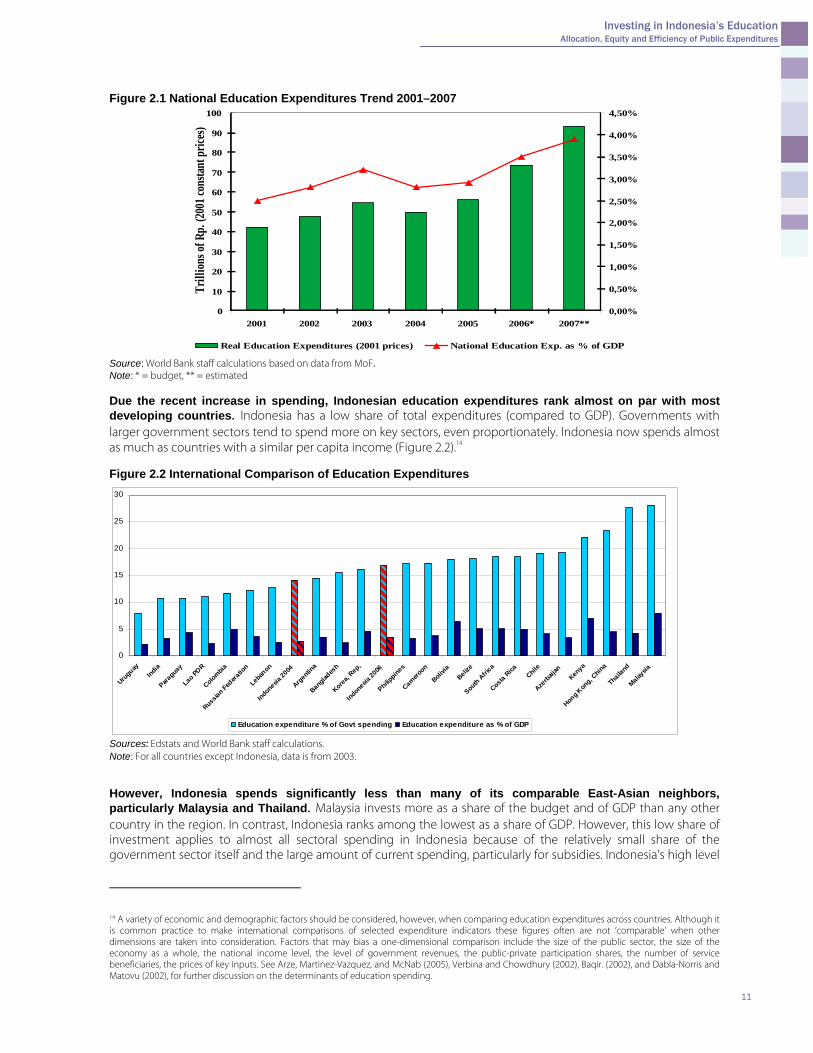
Figure 2.1 National Education Expenditures Trend 2001–2007
0
10
20
30
40
50
60
70
80
90
100
2001 2002 2003 2004 2005 2006* 2007**
Trill
ionso
fRp.
(2001
cons
tant p
rices
)
0,00%
0,50%
1,00%
1,50%
2,00%
2,50%
3,00%
3,50%
4,00%
4,50%
Real Education Expenditures (2001 prices) National Education Exp. as % of GDP Source: World Bank staff calculations based on data from MoF. Note: * = budget, ** = estimated Due the recent increase in spending, Indonesian education expenditures rank almost on par with most developing countries. Indonesia has a low share of total expenditures (compared to GDP). Governments with larger government sectors tend to spend more on key sectors, even proportionately. Indonesia now spends almost as much as countries with a similar per capita income (Figure 2.2).14 Figure 2.2 International Comparison of Education Expenditures
0
5
10
15
20
25
30
Uruguay
India
Paragua
y
Lao PDR
Colombia
Russian Fed
eratio
n
Lebanon
Indonesia 2004
Argentin
a
Banglades
h
Korea,
Rep,
Indonesia
2006
Philippines
Camero
on
Bolivia
Belize
South Afri
ca
Costa Rica
Chile
Azerb
aijan
Kenya
Hong Kon
g, China
Thailand
Malaysia
Education expenditure % of Govt spending Education expenditure as % of GDP
Sources: Edstats and World Bank staff calculations. Note: For all countries except Indonesia, data is from 2003. However, Indonesia spends significantly less than many of its comparable East-Asian neighbors, particularly Malaysia and Thailand. Malaysia invests more as a share of the budget and of GDP than any other country in the region. In contrast, Indonesia ranks among the lowest as a share of GDP. However, this low share of investment applies to almost all sectoral spending in Indonesia because of the relatively small share of the government sector itself and the large amount of current spending, particularly for subsidies. Indonesia’s high level
14 A variety of economic and demographic factors should be considered, however, when comparing education expenditures across countries. Although it is common practice to make international comparisons of selected expenditure indicators these figures often are not ‘comparable’ when other dimensions are taken into consideration. Factors that may bias a one-dimensional comparison include the size of the public sector, the size of the economy as a whole, the national income level, the level of government revenues, the public-private participation shares, the number of service beneficiaries, the prices of key inputs. See Arze, Martinez-Vazquez, and McNab (2005), Verbina and Chowdhury (2002), Baqir. (2002), and Dabla-Norris and Matovu (2002), for further discussion on the determinants of education spending.
11
Investing in Indonesia’s Education Allocation, Equity and Efficiency of Public Expenditures
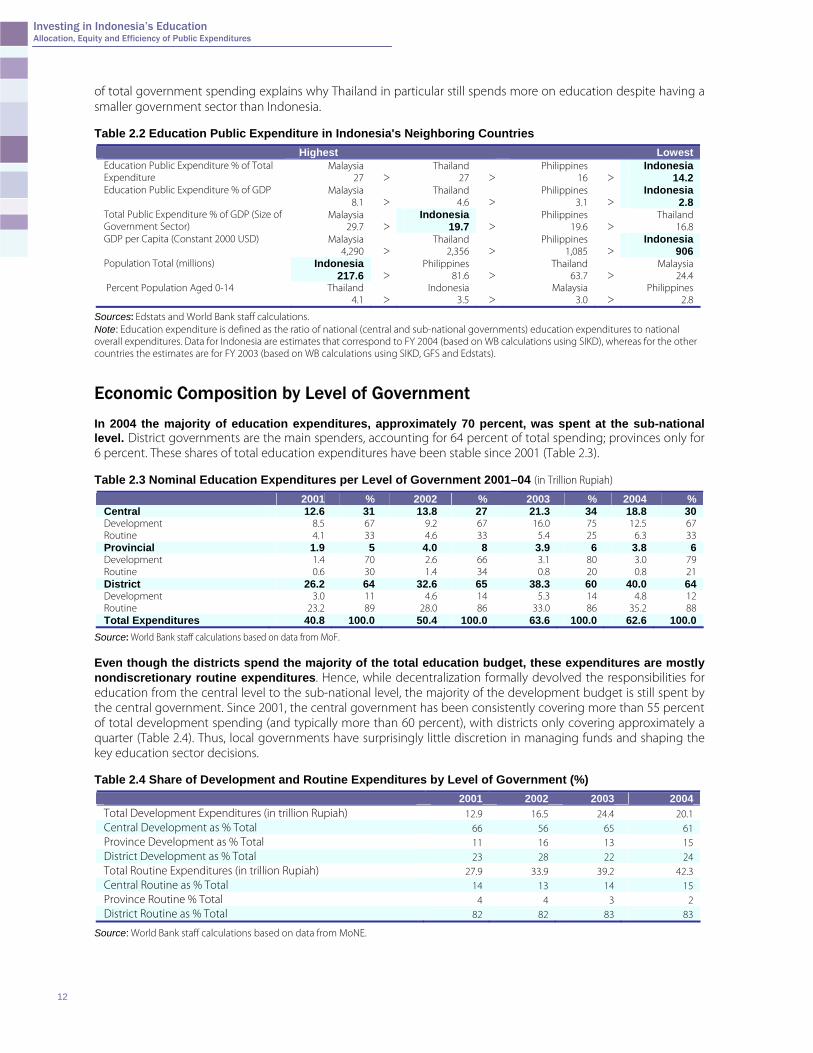
of total government spending explains why Thailand in particular still spends more on education despite having a smaller government sector than Indonesia. Table 2.2 Education Public Expenditure in Indonesia's Neighboring Countries
Highest Lowest Education Public Expenditure % of Total Expenditure
Malaysia 27 >
Thailand 27 >
Philippines 16 >
Indonesia 14.2
Education Public Expenditure % of GDP Malaysia 8.1 >
Thailand 4.6 >
Philippines 3.1 >
Indonesia 2.8
Total Public Expenditure % of GDP (Size of Government Sector)
Malaysia 29.7 >
Indonesia 19.7 >
Philippines 19.6 >
Thailand 16.8
GDP per Capita (Constant 2000 USD) Malaysia 4,290 >
Thailand 2,356 >
Philippines 1,085 >
Indonesia 906
Population Total (millions) Indonesia 217.6 >
Philippines 81.6 >
Thailand 63.7 >
Malaysia 24.4
Percent Population Aged 0-14 Thailand 4.1 >
Indonesia 3.5 >
Malaysia 3.0 >
Philippines 2.8
Sources: Edstats and World Bank staff calculations. Note: Education expenditure is defined as the ratio of national (central and sub-national governments) education expenditures to national overall expenditures. Data for Indonesia are estimates that correspond to FY 2004 (based on WB calculations using SIKD), whereas for the other countries the estimates are for FY 2003 (based on WB calculations using SIKD, GFS and Edstats).
Economic Composition by Level of Government In 2004 the majority of education expenditures, approximately 70 percent, was spent at the sub-national level. District governments are the main spenders, accounting for 64 percent of total spending; provinces only for 6 percent. These shares of total education expenditures have been stable since 2001 (Table 2.3). Table 2.3 Nominal Education Expenditures per Level of Government 2001–04 (in Trillion Rupiah)
2001 % 2002 % 2003 % 2004 % Central 12.6 31 13.8 27 21.3 34 18.8 30 Development 8.5 67 9.2 67 16.0 75 12.5 67 Routine 4.1 33 4.6 33 5.4 25 6.3 33 Provincial 1.9 5 4.0 8 3.9 6 3.8 6 Development 1.4 70 2.6 66 3.1 80 3.0 79 Routine 0.6 30 1.4 34 0.8 20 0.8 21 District 26.2 64 32.6 65 38.3 60 40.0 64 Development 3.0 11 4.6 14 5.3 14 4.8 12 Routine 23.2 89 28.0 86 33.0 86 35.2 88 Total Expenditures 40.8 100.0 50.4 100.0 63.6 100.0 62.6 100.0
Source: World Bank staff calculations based on data from MoF. Even though the districts spend the majority of the total education budget, these expenditures are mostly nondiscretionary routine expenditures. Hence, while decentralization formally devolved the responsibilities for education from the central level to the sub-national level, the majority of the development budget is still spent by the central government. Since 2001, the central government has been consistently covering more than 55 percent of total development spending (and typically more than 60 percent), with districts only covering approximately a quarter (Table 2.4). Thus, local governments have surprisingly little discretion in managing funds and shaping the key education sector decisions. Table 2.4 Share of Development and Routine Expenditures by Level of Government (%)
2001 2002 2003 2004 Total Development Expenditures (in trillion Rupiah) 12.9 16.5 24.4 20.1 Central Development as % Total 66 56 65 61 Province Development as % Total 11 16 13 15 District Development as % Total 23 28 22 24 Total Routine Expenditures (in trillion Rupiah) 27.9 33.9 39.2 42.3 Central Routine as % Total 14 13 14 15 Province Routine % Total 4 4 3 2 District Routine as % Total 82 82 83 83
Source: World Bank staff calculations based on data from MoNE.
12
Investing in Indonesia’s Education Allocation, Equity and Efficiency of Public Expenditures
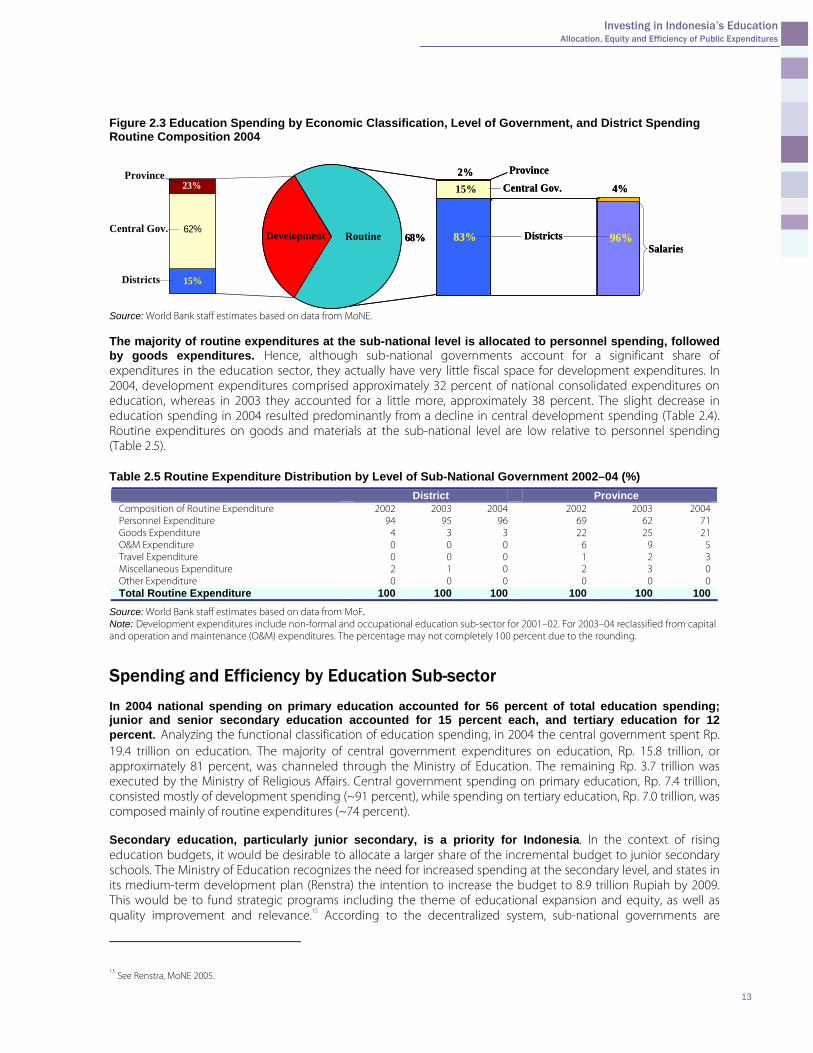
Figure 2.3 Education Spending by Economic Classification, Level of Government, and District Spending Routine Composition 2004
68% 83% 96%
2%15% 4%
SalariesRoutineDevelopment
Province
Central Gov.
Districts68% 83% 96%
2%15% 4%
SalariesRoutineDevelopment
Province
Central Gov.
Districts62%
15%
23%
Districts
Central Gov.
Province
Source: World Bank staff estimates based on data from MoNE. The majority of routine expenditures at the sub-national level is allocated to personnel spending, followed by goods expenditures. Hence, although sub-national governments account for a significant share of expenditures in the education sector, they actually have very little fiscal space for development expenditures. In 2004, development expenditures comprised approximately 32 percent of national consolidated expenditures on education, whereas in 2003 they accounted for a little more, approximately 38 percent. The slight decrease in education spending in 2004 resulted predominantly from a decline in central development spending (Table 2.4). Routine expenditures on goods and materials at the sub-national level are low relative to personnel spending (Table 2.5).
Table 2.5 Routine Expenditure Distribution by Level of Sub-National Government 2002–04 (%) District Province Composition of Routine Expenditure 2002 2003 2004 2002 2003 2004 Personnel Expenditure 94 95 96 69 62 71 Goods Expenditure 4 3 3 22 25 21 O&M Expenditure 0 0 0 6 9 5 Travel Expenditure 0 0 0 1 2 3 Miscellaneous Expenditure 2 1 0 2 3 0 Other Expenditure 0 0 0 0 0 0 Total Routine Expenditure 100 100 100 100 100 100
Source: World Bank staff estimates based on data from MoF. Note: Development expenditures include non-formal and occupational education sub-sector for 2001–02. For 2003–04 reclassified from capital and operation and maintenance (O&M) expenditures. The percentage may not completely 100 percent due to the rounding.
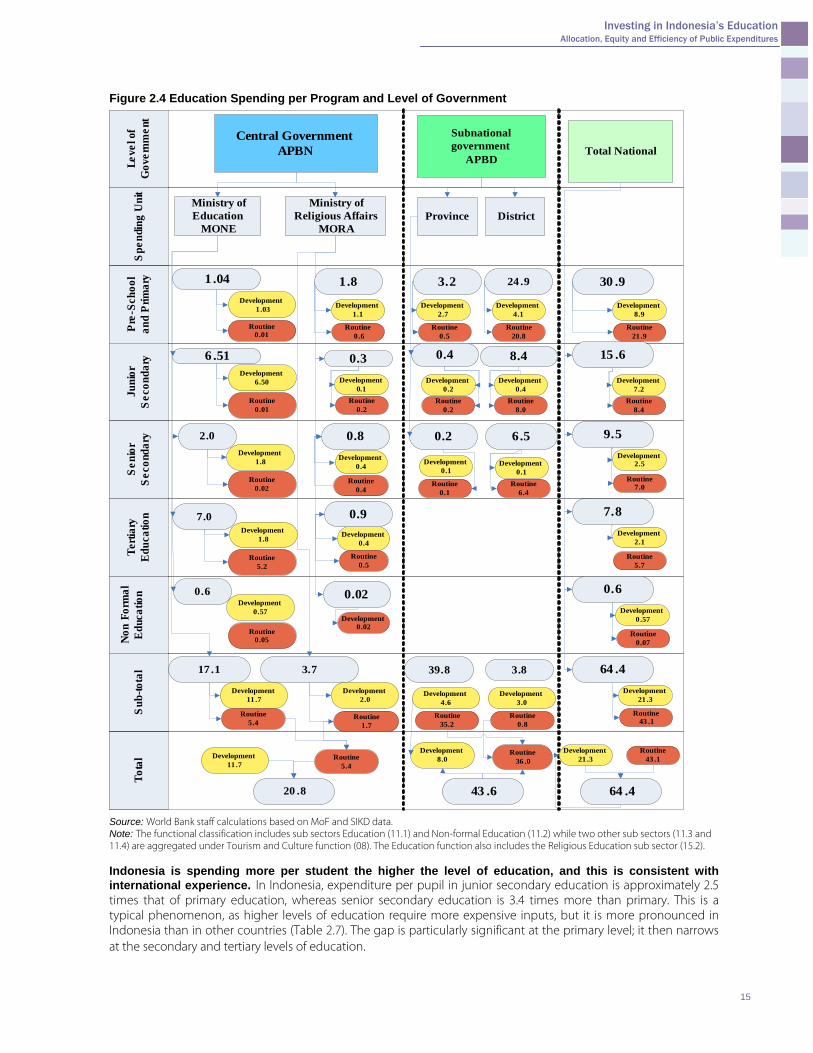
Spending and Efficiency by Education Sub-sector In 2004 national spending on primary education accounted for 56 percent of total education spending; junior and senior secondary education accounted for 15 percent each, and tertiary education for 12 percent. Analyzing the functional classification of education spending, in 2004 the central government spent Rp. 19.4 trillion on education. The majority of central government expenditures on education, Rp. 15.8 trillion, or approximately 81 percent, was channeled through the Ministry of Education. The remaining Rp. 3.7 trillion was executed by the Ministry of Religious Affairs. Central government spending on primary education, Rp. 7.4 trillion, consisted mostly of development spending (~91 percent), while spending on tertiary education, Rp. 7.0 trillion, was composed mainly of routine expenditures (~74 percent).
Secondary education, particularly junior secondary, is a priority for Indonesia. In the context of rising education budgets, it would be desirable to allocate a larger share of the incremental budget to junior secondary schools. The Ministry of Education recognizes the need for increased spending at the secondary level, and states in its medium-term development plan (Renstra) the intention to increase the budget to 8.9 trillion Rupiah by 2009. This would be to fund strategic programs including the theme of educational expansion and equity, as well as quality improvement and relevance.15 According to the decentralized system, sub-national governments are
15
See Renstra, MoNE 2005.
13
Investing in Indonesia’s Education Allocation, Equity and Efficiency of Public Expenditures
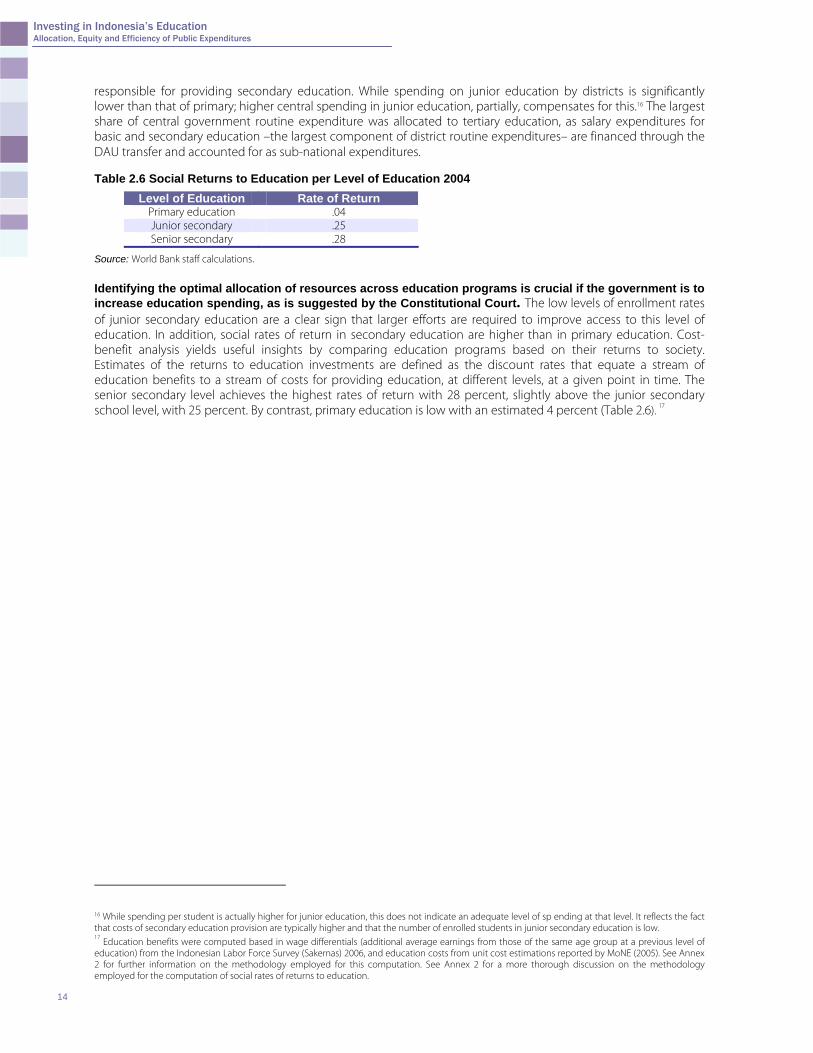
responsible for providing secondary education. While spending on junior education by districts is significantly lower than that of primary; higher central spending in junior education, partially, compensates for this.16 The largest share of central government routine expenditure was allocated to tertiary education, as salary expenditures for basic and secondary education –the largest component of district routine expenditures– are financed through the DAU transfer and accounted for as sub-national expenditures. Table 2.6 Social Returns to Education per Level of Education 2004
Level of Education Rate of ReturnPrimary education .04 Junior secondary .25 Senior secondary .28
Source: World Bank staff calculations.
Identifying the optimal allocation of resources across education programs is crucial if the government is to increase education spending, as is suggested by the Constitutional Court. The low levels of enrollment rates of junior secondary education are a clear sign that larger efforts are required to improve access to this level of education. In addition, social rates of return in secondary education are higher than in primary education. Cost-benefit analysis yields useful insights by comparing education programs based on their returns to society. Estimates of the returns to education investments are defined as the discount rates that equate a stream of education benefits to a stream of costs for providing education, at different levels, at a given point in time. The senior secondary level achieves the highest rates of return with 28 percent, slightly above the junior secondary school level, with 25 percent. By contrast, primary education is low with an estimated 4 percent (Table 2.6). 17
16 While spending per student is actually higher for junior education, this does not indicate an adequate level of sp ending at that level. It reflects the fact that costs of secondary education provision are typically higher and that the number of enrolled students in junior secondary education is low. 17
Education benefits were computed based in wage differentials (additional average earnings from those of the same age group at a previous level of education) from the Indonesian Labor Force Survey (Sakernas) 2006, and education costs from unit cost estimations reported by MoNE (2005). See Annex 2 for further information on the methodology employed for this computation. See Annex 2 for a more thorough discussion on the methodology employed for the computation of social rates of returns to education.
14
Investing in Indonesia’s Education Allocation, Equity and Efficiency of Public Expenditures
Figure 2.4 Education Spending per Program and Level of Government
Tota
lPr
e-Sc
hool
and
Prim
ary
Terti
ary
Educ
atio
nSu
b-to
tal
Spe
ndin
gU
nit
Juni
orS
econ
dary
Seni
orSe
cond
ary
Non
Form
alE
duca
tion
Leve
lof
Gov
ernm
ent
Central GovernmentAPBN
Subnationalgovernment
APBD
Ministry ofEducation
MONE
Ministry ofReligious Affairs
MORA
6.51Development
6.50
Routine0.01
Development0.1
Routine0.2
0.3
2.0
7.0
17 .1
0.8
0.020.6
Development0.4
Routine0.4
Development0.4
Routine0.5
0.9
Development0.02
3.7
Development1.8
Routine0.02
Routine5.2
Routine0.05
Development1.8
Development0.57
Total National
0.4 8.4
Province District
Development0.2
Development0.4
Routine0.2
Routine8.0
Routine0.1
Routine6.4
Development0.1
Development0.1
0.2 6.5
15 .6
Development7.2
Routine8.4
9.5
7.8
0.6
64 .4
Development2.5
Development2.1
Development0.57
Development21 .3
Routine7.0
Routine5.7
Routine0.07
Routine43 .1
Development11 .7
Development2.0
Routine5.4
Routine1.7
1 .04Development
1.03
Routine0.01
1.8
Development1.1
Routine0.6
24 .93.2
Development2.7
Routine0.5
Development4.1
Routine20.8
30 .9
Development8.9
Routine21 .9
Routine43 .1
43 .6
Development21 .3
Routine36 .0
Development11 .7
Routine5.4
Development8.0
64 .420 .8
39.8
Development4.6
Development3.0
Routine35.2
Routine0.8
3.8
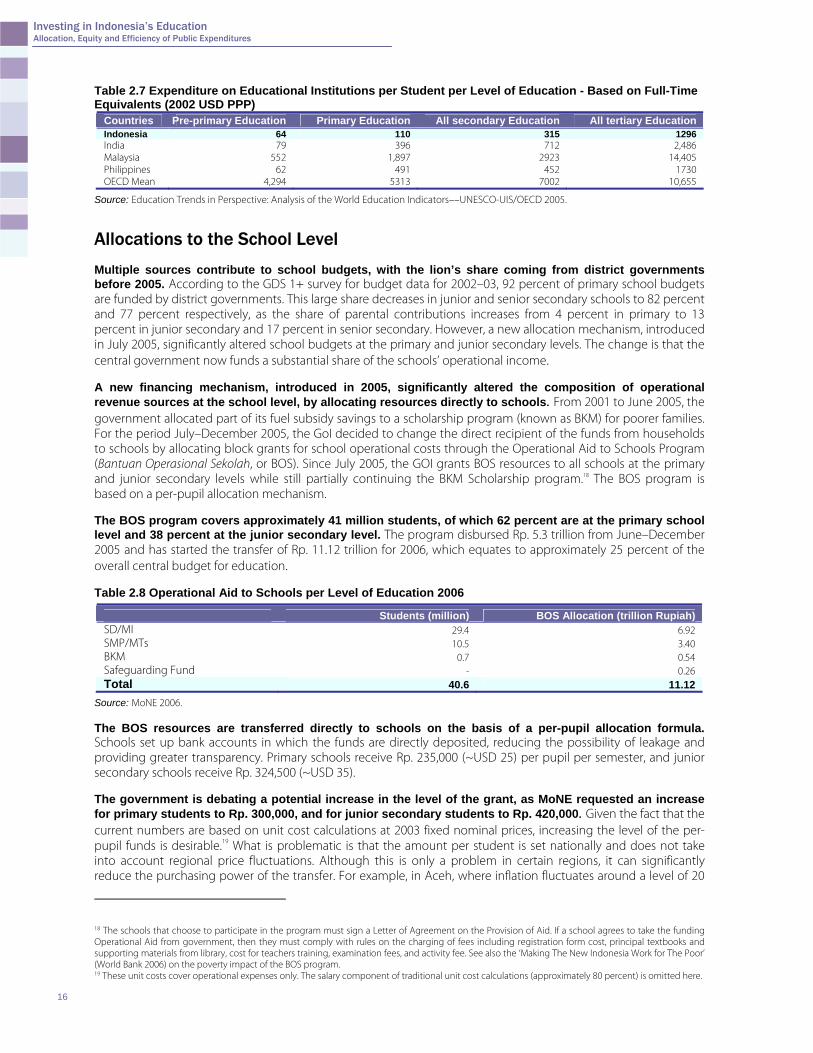
Source: World Bank staff calculations based on MoF and SIKD data. Note: The functional classification includes sub sectors Education (11.1) and Non-formal Education (11.2) while two other sub sectors (11.3 and 11.4) are aggregated under Tourism and Culture function (08). The Education function also includes the Religious Education sub sector (15.2). Indonesia is spending more per student the higher the level of education, and this is consistent with international experience. In Indonesia, expenditure per pupil in junior secondary education is approximately 2.5 times that of primary education, whereas senior secondary education is 3.4 times more than primary. This is a typical phenomenon, as higher levels of education require more expensive inputs, but it is more pronounced in Indonesia than in other countries (Table 2.7). The gap is particularly significant at the primary level; it then narrows at the secondary and tertiary levels of education.
15
Investing in Indonesia’s Education Allocation, Equity and Efficiency of Public Expenditures
Table 2.7 Expenditure on Educational Institutions per Student per Level of Education - Based on Full-Time Equivalents (2002 USD PPP)
Countries Pre-primary Education Primary Education All secondary Education All tertiary Education Indonesia 64 110 315 1296 India 79 396 712 2,486 Malaysia 552 1,897 2923 14,405 Philippines 62 491 452 1730 OECD Mean 4,294 5313 7002 10,655
Source: Education Trends in Perspective: Analysis of the World Education Indicators––UNESCO-UIS/OECD 2005.
Allocations to the School Level Multiple sources contribute to school budgets, with the lion’s share coming from district governments before 2005. According to the GDS 1+ survey for budget data for 2002–03, 92 percent of primary school budgets are funded by district governments. This large share decreases in junior and senior secondary schools to 82 percent and 77 percent respectively, as the share of parental contributions increases from 4 percent in primary to 13 percent in junior secondary and 17 percent in senior secondary. However, a new allocation mechanism, introduced in July 2005, significantly altered school budgets at the primary and junior secondary levels. The change is that the central government now funds a substantial share of the schools’ operational income. A new financing mechanism, introduced in 2005, significantly altered the composition of operational revenue sources at the school level, by allocating resources directly to schools. From 2001 to June 2005, the government allocated part of its fuel subsidy savings to a scholarship program (known as BKM) for poorer families. For the period July–December 2005, the GoI decided to change the direct recipient of the funds from households to schools by allocating block grants for school operational costs through the Operational Aid to Schools Program (Bantuan Operasional Sekolah, or BOS). Since July 2005, the GOI grants BOS resources to all schools at the primary and junior secondary levels while still partially continuing the BKM Scholarship program.18 The BOS program is based on a per-pupil allocation mechanism. The BOS program covers approximately 41 million students, of which 62 percent are at the primary school level and 38 percent at the junior secondary level. The program disbursed Rp. 5.3 trillion from June–December 2005 and has started the transfer of Rp. 11.12 trillion for 2006, which equates to approximately 25 percent of the overall central budget for education. Table 2.8 Operational Aid to Schools per Level of Education 2006
Students (million) BOS Allocation (trillion Rupiah) SD/MI 29.4 6.92 SMP/MTs 10.5 3.40 BKM 0.7 0.54 Safeguarding Fund - 0.26 Total 40.6 11.12
Source: MoNE 2006. The BOS resources are transferred directly to schools on the basis of a per-pupil allocation formula. Schools set up bank accounts in which the funds are directly deposited, reducing the possibility of leakage and providing greater transparency. Primary schools receive Rp. 235,000 (~USD 25) per pupil per semester, and junior secondary schools receive Rp. 324,500 (~USD 35). The government is debating a potential increase in the level of the grant, as MoNE requested an increase for primary students to Rp. 300,000, and for junior secondary students to Rp. 420,000. Given the fact that the current numbers are based on unit cost calculations at 2003 fixed nominal prices, increasing the level of the per-pupil funds is desirable.19 What is problematic is that the amount per student is set nationally and does not take into account regional price fluctuations. Although this is only a problem in certain regions, it can significantly reduce the purchasing power of the transfer. For example, in Aceh, where inflation fluctuates around a level of 20
18 The schools that choose to participate in the program must sign a Letter of Agreement on the Provision of Aid. If a school agrees to take the funding Operational Aid from government, then they must comply with rules on the charging of fees including registration form cost, principal textbooks and supporting materials from library, cost for teachers training, examination fees, and activity fee. See also the ‘Making The New Indonesia Work for The Poor’ (World Bank 2006) on the poverty impact of the BOS program. 19 These unit costs cover operational expenses only. The salary component of traditional unit cost calculations (approximately 80 percent) is omitted here.
16
Investing in Indonesia’s Education Allocation, Equity and Efficiency of Public Expenditures
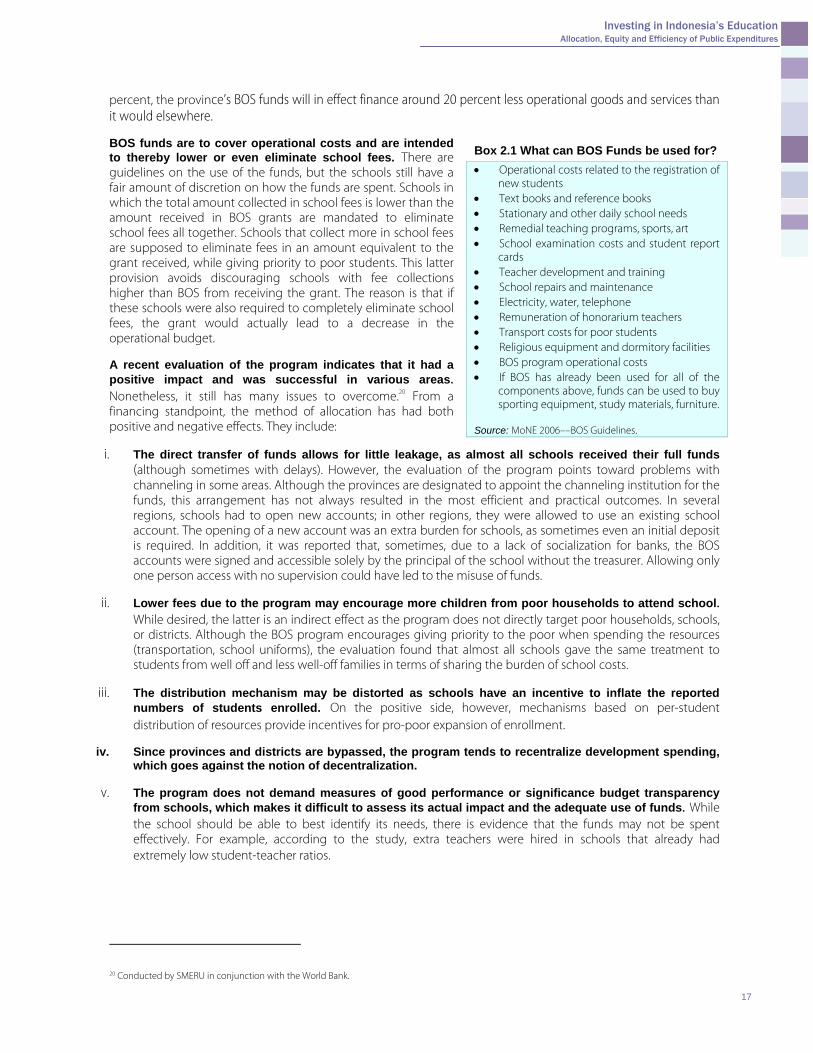
percent, the province’s BOS funds will in effect finance around 20 percent less operational goods and services than it would elsewhere. BOS funds are to cover operational costs and are intended to thereby lower or even eliminate school fees. There are guidelines on the use of the funds, but the schools still have a fair amount of discretion on how the funds are spent. Schools in which the total amount collected in school fees is lower than the amount received in BOS grants are mandated to eliminate school fees all together. Schools that collect more in school fees are supposed to eliminate fees in an amount equivalent to the grant received, while giving priority to poor students. This latter provision avoids discouraging schools with fee collections higher than BOS from receiving the grant. The reason is that if these schools were also required to completely eliminate school fees, the grant would actually lead to a decrease in the operational budget.
Box 2.1 What can BOS Funds be used for?• Operational costs related to the registration of
new students • Text books and reference books • Stationary and other daily school needs • Remedial teaching programs, sports, art • School examination costs and student report
cards • Teacher development and training • School repairs and maintenance • Electricity, water, telephone • Remuneration of honorarium teachers • Transport costs for poor students • Religious equipment and dormitory facilities • BOS program operational costs • If BOS has already been used for all of the
components above, funds can be used to buy sporting equipment, study materials, furniture.
Source: MoNE 2006––BOS Guidelines.
A recent evaluation of the program indicates that it had a positive impact and was successful in various areas. Nonetheless, it still has many issues to overcome.20 From a financing standpoint, the method of allocation has had both positive and negative effects. They include:
i. The direct transfer of funds allows for little leakage, as almost all schools received their full funds (although sometimes with delays). However, the evaluation of the program points toward problems with channeling in some areas. Although the provinces are designated to appoint the channeling institution for the funds, this arrangement has not always resulted in the most efficient and practical outcomes. In several regions, schools had to open new accounts; in other regions, they were allowed to use an existing school account. The opening of a new account was an extra burden for schools, as sometimes even an initial deposit is required. In addition, it was reported that, sometimes, due to a lack of socialization for banks, the BOS accounts were signed and accessible solely by the principal of the school without the treasurer. Allowing only one person access with no supervision could have led to the misuse of funds.
ii. Lower fees due to the program may encourage more children from poor households to attend school.
While desired, the latter is an indirect effect as the program does not directly target poor households, schools, or districts. Although the BOS program encourages giving priority to the poor when spending the resources (transportation, school uniforms), the evaluation found that almost all schools gave the same treatment to students from well off and less well-off families in terms of sharing the burden of school costs.
iii. The distribution mechanism may be distorted as schools have an incentive to inflate the reported numbers of students enrolled. On the positive side, however, mechanisms based on per-student distribution of resources provide incentives for pro-poor expansion of enrollment.
iv. Since provinces and districts are bypassed, the program tends to recentralize development spending,
which goes against the notion of decentralization.
v. The program does not demand measures of good performance or significance budget transparency from schools, which makes it difficult to assess its actual impact and the adequate use of funds. While the school should be able to best identify its needs, there is evidence that the funds may not be spent effectively. For example, according to the study, extra teachers were hired in schools that already had extremely low student-teacher ratios.
20 Conducted by SMERU in conjunction with the World Bank.
17
Investing in Indonesia’s Education Allocation, Equity and Efficiency of Public Expenditures
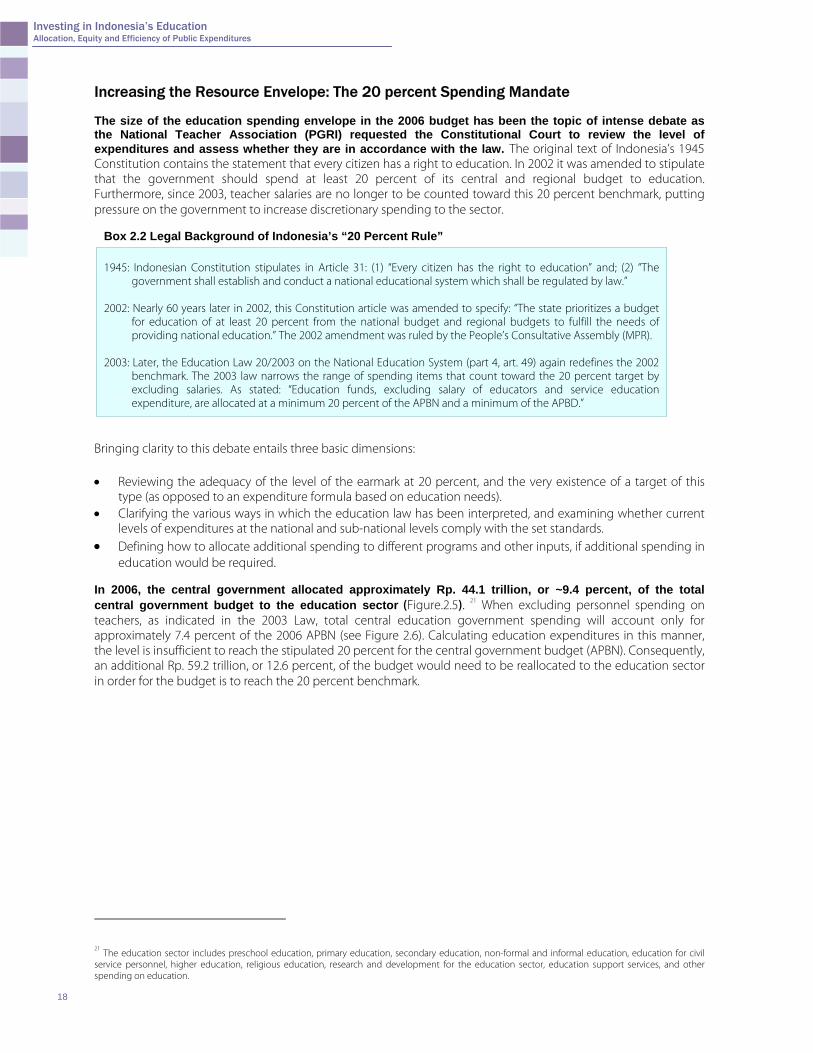
Increasing the Resource Envelope: The 20 percent Spending Mandate The size of the education spending envelope in the 2006 budget has been the topic of intense debate as the National Teacher Association (PGRI) requested the Constitutional Court to review the level of expenditures and assess whether they are in accordance with the law. The original text of Indonesia’s 1945 Constitution contains the statement that every citizen has a right to education. In 2002 it was amended to stipulate that the government should spend at least 20 percent of its central and regional budget to education. Furthermore, since 2003, teacher salaries are no longer to be counted toward this 20 percent benchmark, putting pressure on the government to increase discretionary spending to the sector.
Box 2.2 Legal Background of Indonesia’s “20 Percent Rule” 1945: Indonesian Constitution stipulates in Article 31: (1) “Every citizen has the right to education” and; (2) “The
government shall establish and conduct a national educational system which shall be regulated by law.” 2002: Nearly 60 years later in 2002, this Constitution article was amended to specify: “The state prioritizes a budget
for education of at least 20 percent from the national budget and regional budgets to fulfill the needs of providing national education.” The 2002 amendment was ruled by the People’s Consultative Assembly (MPR).
2003: Later, the Education Law 20/2003 on the National Education System (part 4, art. 49) again redefines the 2002
benchmark. The 2003 law narrows the range of spending items that count toward the 20 percent target by excluding salaries. As stated: “Education funds, excluding salary of educators and service education expenditure, are allocated at a minimum 20 percent of the APBN and a minimum of the APBD.”
Bringing clarity to this debate entails three basic dimensions: • Reviewing the adequacy of the level of the earmark at 20 percent, and the very existence of a target of this
type (as opposed to an expenditure formula based on education needs). • Clarifying the various ways in which the education law has been interpreted, and examining whether current
levels of expenditures at the national and sub-national levels comply with the set standards. • Defining how to allocate additional spending to different programs and other inputs, if additional spending in
education would be required. In 2006, the central government allocated approximately Rp. 44.1 trillion, or ~9.4 percent, of the total central government budget to the education sector (Figure.2.5). 21 When excluding personnel spending on teachers, as indicated in the 2003 Law, total central education government spending will account only for approximately 7.4 percent of the 2006 APBN (see Figure 2.6). Calculating education expenditures in this manner, the level is insufficient to reach the stipulated 20 percent for the central government budget (APBN). Consequently, an additional Rp. 59.2 trillion, or 12.6 percent, of the budget would need to be reallocated to the education sector in order for the budget is to reach the 20 percent benchmark.
21
The education sector includes preschool education, primary education, secondary education, non-formal and informal education, education for civil service personnel, higher education, religious education, research and development for the education sector, education support services, and other spending on education.
18
Investing in Indonesia’s Education Allocation, Equity and Efficiency of Public Expenditures
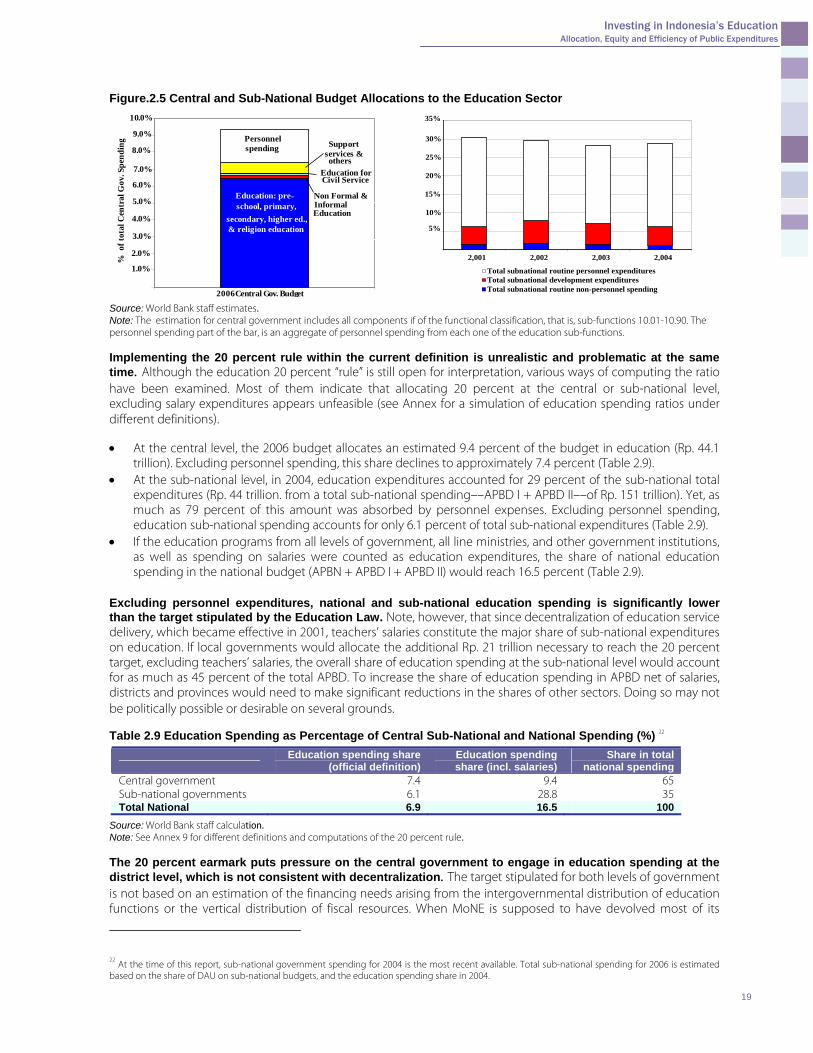
Figure.2.5 Central and Sub-National Budget Allocations to the Education Sector
1.0%
2.0%
3.0%
4.0%
5.0%
6.0%
7.0%
8.0%
9.0%
10.0%
2006Central Gov. Budget
%of
tota
lCen
tral
Gov
.Spe
ndin
g Personnelspending
Education: pre-school, primary,
secondary, higher ed.,& religion education
Supportservices &others
Education forCivil Service
Non Formal &InformalEducation
5%
10%
15%
20%
25%
30%
35%
2,001 2,002 2,003 2,004
Total subnational routine personnel expendituresTotal subnational development expendituresTotal subnational routine non-personnel spending
Source: World Bank staff estimates. Note: The estimation for central government includes all components if of the functional classification, that is, sub-functions 10.01-10.90. The personnel spending part of the bar, is an aggregate of personnel spending from each one of the education sub-functions. Implementing the 20 percent rule within the current definition is unrealistic and problematic at the same time. Although the education 20 percent “rule” is still open for interpretation, various ways of computing the ratio have been examined. Most of them indicate that allocating 20 percent at the central or sub-national level, excluding salary expenditures appears unfeasible (see Annex for a simulation of education spending ratios under different definitions).
• At the central level, the 2006 budget allocates an estimated 9.4 percent of the budget in education (Rp. 44.1 trillion). Excluding personnel spending, this share declines to approximately 7.4 percent (Table 2.9).
• At the sub-national level, in 2004, education expenditures accounted for 29 percent of the sub-national total expenditures (Rp. 44 trillion. from a total sub-national spending––APBD I + APBD II––of Rp. 151 trillion). Yet, as much as 79 percent of this amount was absorbed by personnel expenses. Excluding personnel spending, education sub-national spending accounts for only 6.1 percent of total sub-national expenditures (Table 2.9).
• If the education programs from all levels of government, all line ministries, and other government institutions, as well as spending on salaries were counted as education expenditures, the share of national education spending in the national budget (APBN + APBD I + APBD II) would reach 16.5 percent (Table 2.9).
Excluding personnel expenditures, national and sub-national education spending is significantly lower than the target stipulated by the Education Law. Note, however, that since decentralization of education service delivery, which became effective in 2001, teachers’ salaries constitute the major share of sub-national expenditures on education. If local governments would allocate the additional Rp. 21 trillion necessary to reach the 20 percent target, excluding teachers’ salaries, the overall share of education spending at the sub-national level would account for as much as 45 percent of the total APBD. To increase the share of education spending in APBD net of salaries, districts and provinces would need to make significant reductions in the shares of other sectors. Doing so may not be politically possible or desirable on several grounds. Table 2.9 Education Spending as Percentage of Central Sub-National and National Spending (%) 22
Education spending share
(official definition) Education spending share (incl. salaries)
Share in total national spending
Central government 7.4 9.4 65 Sub-national governments 6.1 28.8 35 Total National 6.9 16.5 100
Source: World Bank staff calculation. Note: See Annex 9 for different definitions and computations of the 20 percent rule. The 20 percent earmark puts pressure on the central government to engage in education spending at the district level, which is not consistent with decentralization. The target stipulated for both levels of government is not based on an estimation of the financing needs arising from the intergovernmental distribution of education functions or the vertical distribution of fiscal resources. When MoNE is supposed to have devolved most of its
22
At the time of this report, sub-national government spending for 2004 is the most recent available. Total sub-national spending for 2006 is estimated based on the share of DAU on sub-national budgets, and the education spending share in 2004.
19
Investing in Indonesia’s Education Allocation, Equity and Efficiency of Public Expenditures
functions to local governments, earmarking 20 percent of the APBN may be well intentioned but has disadvantages. Earmarking forces MoNE to develop its own spending programs in the regions. This dynamic implies that most of the capital investments in education would be centralized and outside the control of district governments.
20
Investing in Indonesia’s Education Allocation, Equity and Efficiency of Public Expenditures
CHAPTER 3 EDUCATION PUBLIC EXPENDITURES AND EQUITY
21
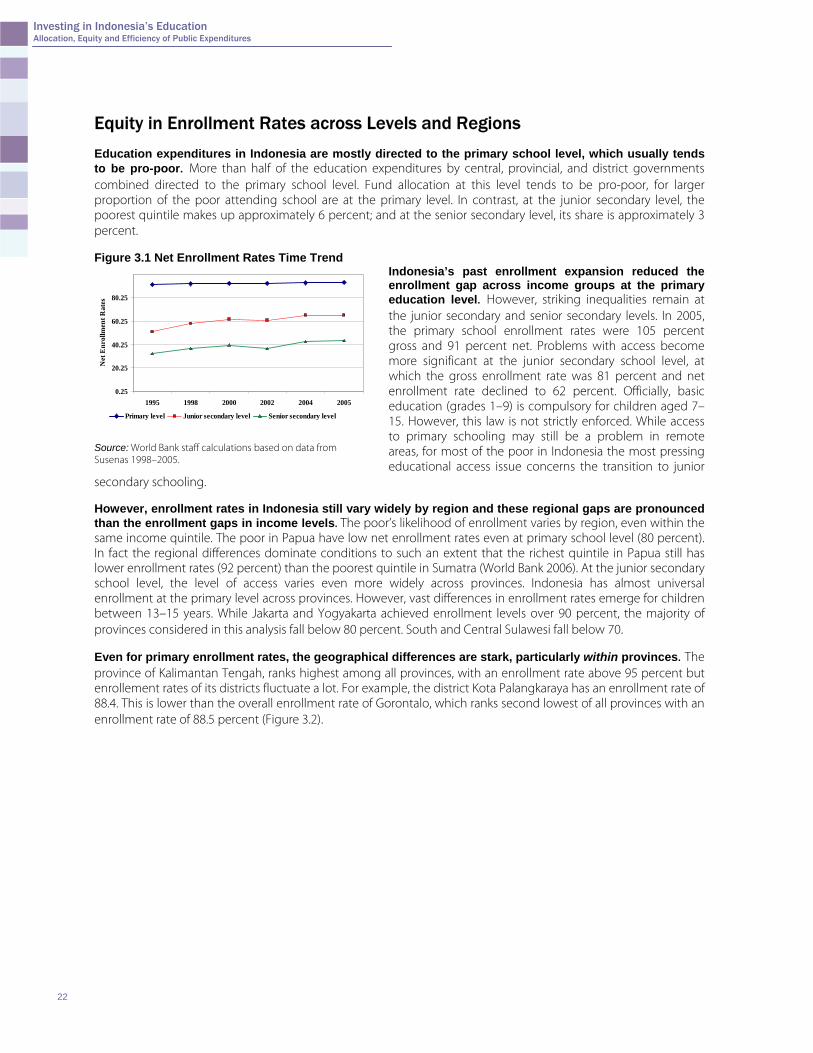
Investing in Indonesia’s Education Allocation, Equity and Efficiency of Public Expenditures
Equity in Enrollment Rates across Levels and Regions Education expenditures in Indonesia are mostly directed to the primary school level, which usually tends to be pro-poor. More than half of the education expenditures by central, provincial, and district governments combined directed to the primary school level. Fund allocation at this level tends to be pro-poor, for larger proportion of the poor attending school are at the primary level. In contrast, at the junior secondary level, the poorest quintile makes up approximately 6 percent; and at the senior secondary level, its share is approximately 3 percent. Figure 3.1 Net Enrollment Rates Time Trend
Indonesia’s past enrollment expansion reduced the enrollment gap across income groups at the primary education level. However, striking inequalities remain at the junior secondary and senior secondary levels. In 2005, the primary school enrollment rates were 105 percent gross and 91 percent net. Problems with access become more significant at the junior secondary school level, at which the gross enrollment rate was 81 percent and net enrollment rate declined to 62 percent. Officially, basic education (grades 1–9) is compulsory for children aged 7–15. However, this law is not strictly enforced. While access to primary schooling may still be a problem in remote areas, for most of the poor in Indonesia the most pressing educational access issue concerns the transition to junior
secondary schooling.
0.25
20.25
40.25
60.25
80.25
1995 1998 2000 2002 2004 2005
Net
Enr
ollm
ent R
ates
Primary level Junior secondary level Senior secondary level
Source: World Bank staff calculations based on data from Susenas 1998–2005.
However, enrollment rates in Indonesia still vary widely by region and these regional gaps are pronounced than the enrollment gaps in income levels. The poor’s likelihood of enrollment varies by region, even within the same income quintile. The poor in Papua have low net enrollment rates even at primary school level (80 percent). In fact the regional differences dominate conditions to such an extent that the richest quintile in Papua still has lower enrollment rates (92 percent) than the poorest quintile in Sumatra (World Bank 2006). At the junior secondary school level, the level of access varies even more widely across provinces. Indonesia has almost universal enrollment at the primary level across provinces. However, vast differences in enrollment rates emerge for children between 13–15 years. While Jakarta and Yogyakarta achieved enrollment levels over 90 percent, the majority of provinces considered in this analysis fall below 80 percent. South and Central Sulawesi fall below 70. Even for primary enrollment rates, the geographical differences are stark, particularly within provinces. The province of Kalimantan Tengah, ranks highest among all provinces, with an enrollment rate above 95 percent but enrollement rates of its districts fluctuate a lot. For example, the district Kota Palangkaraya has an enrollment rate of 88.4. This is lower than the overall enrollment rate of Gorontalo, which ranks second lowest of all provinces with an enrollment rate of 88.5 percent (Figure 3.2).
22
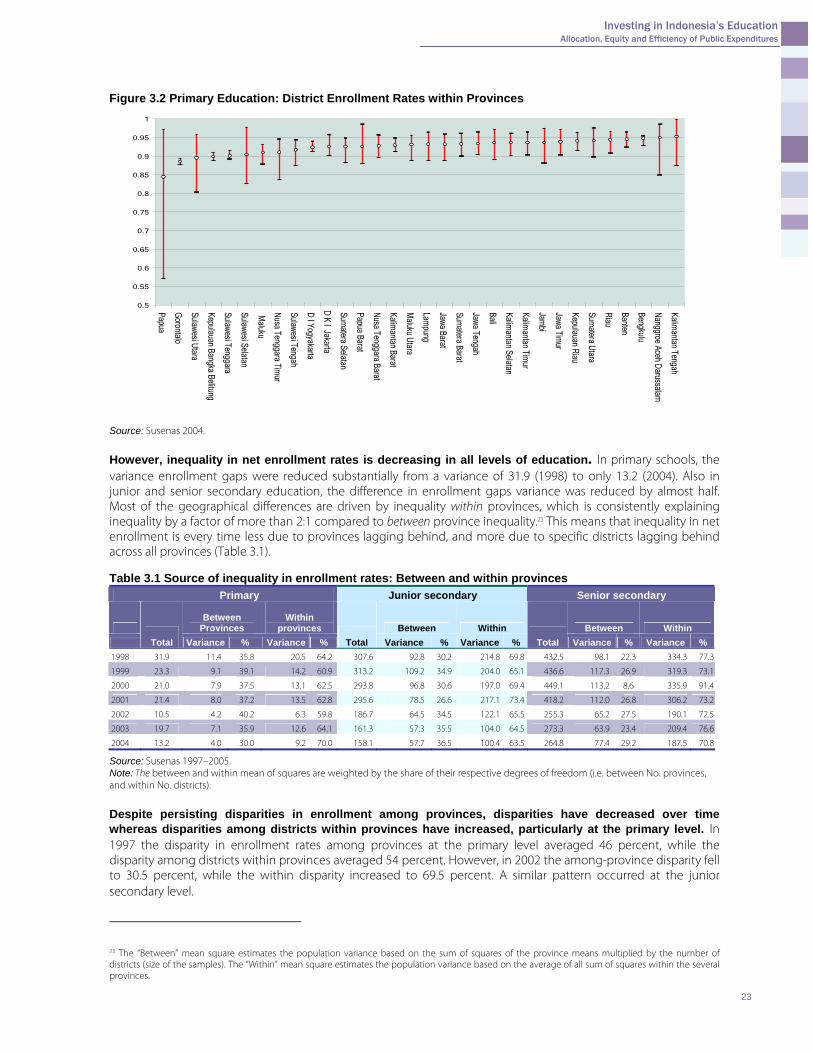
Investing in Indonesia’s Education Allocation, Equity and Efficiency of Public Expenditures
Figure 3.2 Primary Education: District Enrollment Rates within Provinces
0.5
0.55
0.6
0.65
0.7
0.75
0.8
0.85
0.9
0.95
1
Papua
Gorontalo
SulawesiUtara
KepulauanBangka
Belitung
SulawesiTenggara
SulawesiSelatan
Maluku
NusaTenggara
Timur
SulawesiTengah
DIYogyakarta
DK
I Jakarta
Sumatera
Selatan
PapuaBarat
NusaTenggara
Barat
Kalimantan
Barat
Maluku
Utara
Lampung
JawaBarat
Sumatera
Barat
JawaTengah
Bali
Kalimantan
Selatan
Kalimantan
Timur
Jambi
JawaTim
ur
KepulauanRiau
Sumatera
Utara
Riau
Banten
Bengkulu
NanggroeAceh
Darussalam
Kalimantan
Tengah
Source: Susenas 2004. However, inequality in net enrollment rates is decreasing in all levels of education. In primary schools, the variance enrollment gaps were reduced substantially from a variance of 31.9 (1998) to only 13.2 (2004). Also in junior and senior secondary education, the difference in enrollment gaps variance was reduced by almost half. Most of the geographical differences are driven by inequality within provinces, which is consistently explaining inequality by a factor of more than 2:1 compared to between province inequality.23 This means that inequality in net enrollment is every time less due to provinces lagging behind, and more due to specific districts lagging behind across all provinces (Table 3.1). Table 3.1 Source of inequality in enrollment rates: Between and within provinces
Primary Junior secondary Senior secondary
Between
Provinces
Within
provinces Between Within Between Within
Total Variance % Variance % Total Variance % Variance % Total Variance % Variance %
1998 31.9 11.4 35.8 20.5 64.2 307.6 92.8 30.2 214.8 69.8 432.5 98.1 22.3 334.3 77.3
1999 23.3 9.1 39.1 14.2 60.9 313.2 109.2 34.9 204.0 65.1 436.6 117.3 26.9 319.3 73.1
2000 21.0 7.9 37.5 13.1 62.5 293.8 96.8 30.6 197.0 69.4 449.1 113.2 8.6 335.9 91.4
2001 21.4 8.0 37.2 13.5 62.8 295.6 78.5 26.6 217.1 73.4 418.2 112.0 26.8 306.2 73.2
2002 10.5 4.2 40.2 6.3 59.8 186.7 64.5 34.5 122.1 65.5 255.3 65.2 27.5 190.1 72.5
2003 19.7 7.1 35.9 12.6 64.1 161.3 57.3 35.5 104.0 64.5 273.3 63.9 23.4 209.4 76.6
2004 13.2 4.0 30.0 9.2 70.0 158.1 57.7 36.5 100.4 63.5 264.8 77.4 29.2 187.5 70.8
Source: Susenas 1997–2005. Note: The between and within mean of squares are weighted by the share of their respective degrees of freedom (i.e. between No. provinces, and within No. districts).
Despite persisting disparities in enrollment among provinces, disparities have decreased over time whereas disparities among districts within provinces have increased, particularly at the primary level. In 1997 the disparity in enrollment rates among provinces at the primary level averaged 46 percent, while the disparity among districts within provinces averaged 54 percent. However, in 2002 the among-province disparity fell to 30.5 percent, while the within disparity increased to 69.5 percent. A similar pattern occurred at the junior secondary level.
23 The “Between” mean square estimates the population variance based on the sum of squares of the province means multiplied by the number of districts (size of the samples). The “Within” mean square estimates the population variance based on the average of all sum of squares within the several provinces.
23
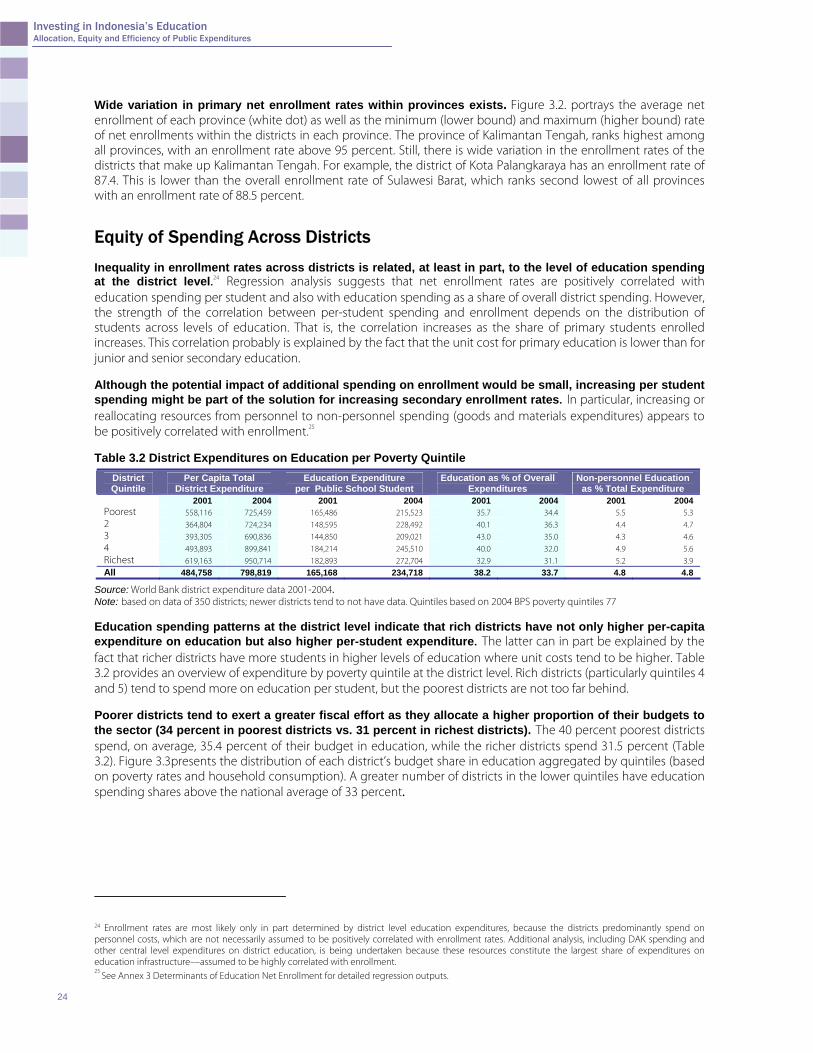
Investing in Indonesia’s Education Allocation, Equity and Efficiency of Public Expenditures
Wide variation in primary net enrollment rates within provinces exists. Figure 3.2. portrays the average net enrollment of each province (white dot) as well as the minimum (lower bound) and maximum (higher bound) rate of net enrollments within the districts in each province. The province of Kalimantan Tengah, ranks highest among all provinces, with an enrollment rate above 95 percent. Still, there is wide variation in the enrollment rates of the districts that make up Kalimantan Tengah. For example, the district of Kota Palangkaraya has an enrollment rate of 87.4. This is lower than the overall enrollment rate of Sulawesi Barat, which ranks second lowest of all provinces with an enrollment rate of 88.5 percent.
Equity of Spending Across Districts Inequality in enrollment rates across districts is related, at least in part, to the level of education spending at the district level.24 Regression analysis suggests that net enrollment rates are positively correlated with education spending per student and also with education spending as a share of overall district spending. However, the strength of the correlation between per-student spending and enrollment depends on the distribution of students across levels of education. That is, the correlation increases as the share of primary students enrolled increases. This correlation probably is explained by the fact that the unit cost for primary education is lower than for junior and senior secondary education. Although the potential impact of additional spending on enrollment would be small, increasing per student spending might be part of the solution for increasing secondary enrollment rates. In particular, increasing or reallocating resources from personnel to non-personnel spending (goods and materials expenditures) appears to be positively correlated with enrollment.25 Table 3.2 District Expenditures on Education per Poverty Quintile
District Quintile
Per Capita Total District Expenditure
Education Expenditure per Public School Student
Education as % of Overall Expenditures
Non-personnel Education as % Total Expenditure
2001 2004 2001 2004 2001 2004 2001 2004 Poorest 558,116 725,459 165,486 215,523 35.7 34.4 5.5 5.3 2 364,804 724,234 148,595 228,492 40.1 36.3 4.4 4.7 3 393,305 690,836 144,850 209,021 43.0 35.0 4.3 4.6 4 493,893 899,841 184,214 245,510 40.0 32.0 4.9 5.6 Richest 619,163 950,714 182,893 272,704 32.9 31.1 5.2 3.9 All 484,758 798,819 165,168 234,718 38.2 33.7 4.8 4.8
Source: World Bank district expenditure data 2001-2004. Note: based on data of 350 districts; newer districts tend to not have data. Quintiles based on 2004 BPS poverty quintiles 77 Education spending patterns at the district level indicate that rich districts have not only higher per-capita expenditure on education but also higher per-student expenditure. The latter can in part be explained by the fact that richer districts have more students in higher levels of education where unit costs tend to be higher. Table 3.2 provides an overview of expenditure by poverty quintile at the district level. Rich districts (particularly quintiles 4 and 5) tend to spend more on education per student, but the poorest districts are not too far behind. Poorer districts tend to exert a greater fiscal effort as they allocate a higher proportion of their budgets to the sector (34 percent in poorest districts vs. 31 percent in richest districts). The 40 percent poorest districts spend, on average, 35.4 percent of their budget in education, while the richer districts spend 31.5 percent (Table 3.2). Figure 3.3presents the distribution of each district’s budget share in education aggregated by quintiles (based on poverty rates and household consumption). A greater number of districts in the lower quintiles have education spending shares above the national average of 33 percent.
24 Enrollment rates are most likely only in part determined by district level education expenditures, because the districts predominantly spend on personnel costs, which are not necessarily assumed to be positively correlated with enrollment rates. Additional analysis, including DAK spending and other central level expenditures on district education, is being undertaken because these resources constitute the largest share of expenditures on education infrastructure––assumed to be highly correlated with enrollment. 25 See Annex 3 Determinants of Education Net Enrollment for detailed regression outputs.
24
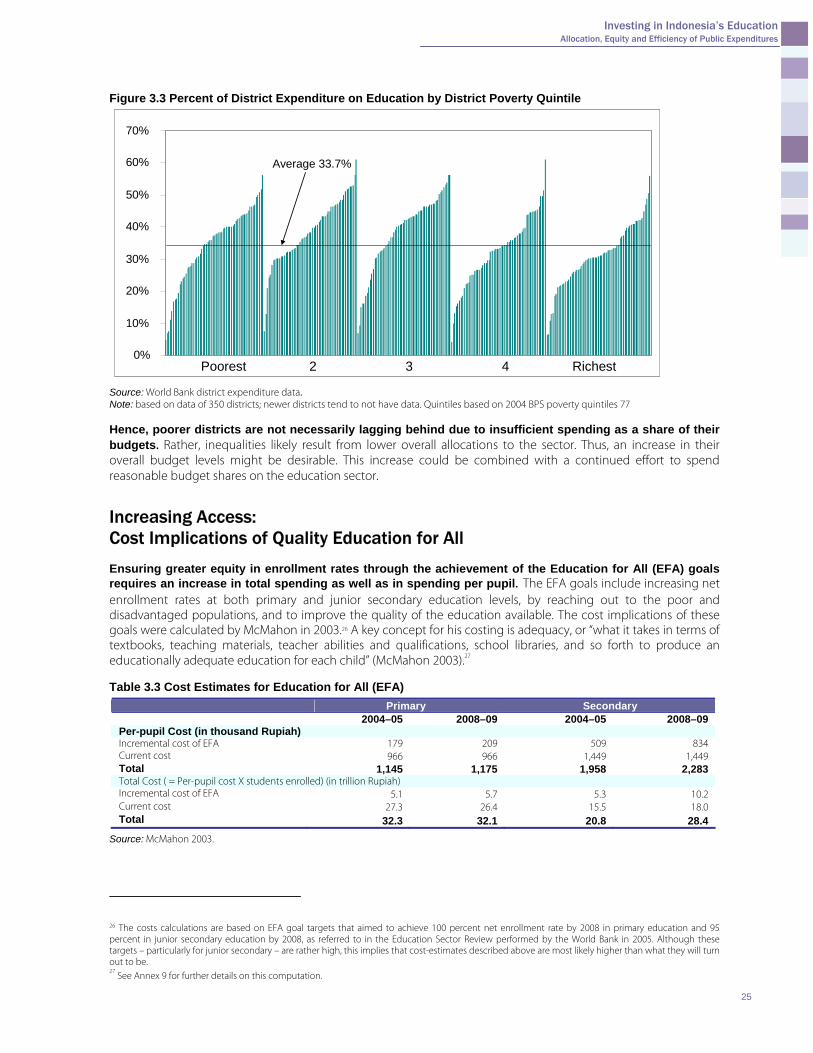
Investing in Indonesia’s Education Allocation, Equity and Efficiency of Public Expenditures
Figure 3.3 Percent of District Expenditure on Education by District Poverty Quintile
0%
10%
20%
30%
40%
50%
60%
70%
Poorest 2 3 4 Richest
Average 33.7%
0%
10%
20%
30%
40%
50%
60%
70%
Poorest 2 3 4 Richest
Average 33.7%
Source: World Bank district expenditure data. Note: based on data of 350 districts; newer districts tend to not have data. Quintiles based on 2004 BPS poverty quintiles 77 Hence, poorer districts are not necessarily lagging behind due to insufficient spending as a share of their budgets. Rather, inequalities likely result from lower overall allocations to the sector. Thus, an increase in their overall budget levels might be desirable. This increase could be combined with a continued effort to spend reasonable budget shares on the education sector.
Increasing Access: Cost Implications of Quality Education for All Ensuring greater equity in enrollment rates through the achievement of the Education for All (EFA) goals requires an increase in total spending as well as in spending per pupil. The EFA goals include increasing net enrollment rates at both primary and junior secondary education levels, by reaching out to the poor and disadvantaged populations, and to improve the quality of the education available. The cost implications of these goals were calculated by McMahon in 2003.26 A key concept for his costing is adequacy, or “what it takes in terms of textbooks, teaching materials, teacher abilities and qualifications, school libraries, and so forth to produce an educationally adequate education for each child” (McMahon 2003).27 Table 3.3 Cost Estimates for Education for All (EFA)
Primary Secondary 2004–05 2008–09 2004–05 2008–09 Per-pupil Cost (in thousand Rupiah) Incremental cost of EFA 179 209 509 834 Current cost 966 966 1,449 1,449 Total 1,145 1,175 1,958 2,283 Total Cost ( = Per-pupil cost X students enrolled) (in trillion Rupiah) Incremental cost of EFA 5.1 5.7 5.3 10.2 Current cost 27.3 26.4 15.5 18.0 Total 32.3 32.1 20.8 28.4
Source: McMahon 2003.
26 The costs calculations are based on EFA goal targets that aimed to achieve 100 percent net enrollment rate by 2008 in primary education and 95 percent in junior secondary education by 2008, as referred to in the Education Sector Review performed by the World Bank in 2005. Although these targets – particularly for junior secondary – are rather high, this implies that cost-estimates described above are most likely higher than what they will turn out to be. 27
See Annex 9 for further details on this computation.
25
Investing in Indonesia’s Education Allocation, Equity and Efficiency of Public Expenditures
Incremental costs associated with EFA per pupil for 2004–05 are 18 percent of the 2004 per-pupil cost for primary education, and 35 percent for junior secondary education. These represent costs that are much higher than what was actually spent at the sub-national level per student. Primary and junior secondary costs should have totaled Rp. 53 trillion in 2004 (Table 2.3). However, expenditures at the sub-national level were approximately only Rp. 43 trillion. For 2008–09 the total estimated expenditures will need to be nearly Rp. 60 trillion for Indonesia’s education system to fulfill its enrollment targets. Given the GOI’s intention to increase spending on education, it might be feasible to close this financing gap to reach the necessary per-pupil expenditure levels. Nevertheless, solely increasing spending will by no means guarantee the achievement of the EFA goals. Costing EFA is an important step in understanding what is required to fulfill this national commitment, but more resources are not enough. To increase enrollment levels sufficiently, changes in the management of schools and the education system as whole are necessary. Desirable changes for the improvement of education quality, along with access for all, are discussed in the next chapter.
26
Investing in Indonesia’s Education Allocation, Equity and Efficiency of Public Expenditures
CHAPTER 4 EDUCATION PUBLIC EXPENDITURES, EFFICIENCY, AND OUTCOMES
27
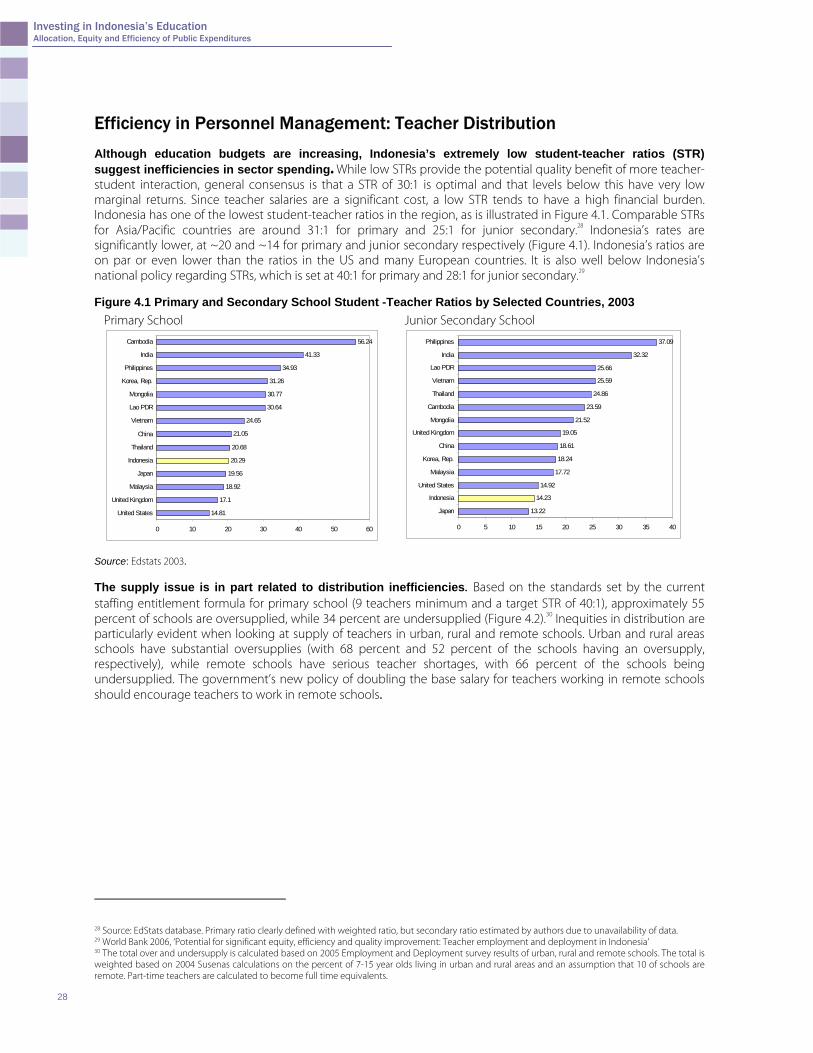
Investing in Indonesia’s Education Allocation, Equity and Efficiency of Public Expenditures
Efficiency in Personnel Management: Teacher Distribution Although education budgets are increasing, Indonesia’s extremely low student-teacher ratios (STR) suggest inefficiencies in sector spending. While low STRs provide the potential quality benefit of more teacher-student interaction, general consensus is that a STR of 30:1 is optimal and that levels below this have very low marginal returns. Since teacher salaries are a significant cost, a low STR tends to have a high financial burden. Indonesia has one of the lowest student-teacher ratios in the region, as is illustrated in Figure 4.1. Comparable STRs for Asia/Pacific countries are around 31:1 for primary and 25:1 for junior secondary.28 Indonesia’s rates are significantly lower, at ~20 and ~14 for primary and junior secondary respectively (Figure 4.1). Indonesia’s ratios are on par or even lower than the ratios in the US and many European countries. It is also well below Indonesia’s national policy regarding STRs, which is set at 40:1 for primary and 28:1 for junior secondary.29 Figure 4.1 Primary and Secondary School Student -Teacher Ratios by Selected Countries, 2003
Primary School
14.81
17.1
18.92
19.56
20.29
20.68
21.05
24.65
30.64
30.77
31.26
34.93
41.33
56.24
0 10 20 30 40 50 6
United States
United Kingdom
Malaysia
Japan
Indonesia
Thailand
China
Vietnam
Lao PDR
Mongolia
Korea, Rep.
Philippines
India
Cambodia
0
Junior Secondary School
13.22
14.23
14.92
17.72
18.24
18.61
19.05
21.52
23.59
24.86
25.59
25.66
32.32
37.09
0 5 10 15 20 25 30 35 40
Japan
Indonesia
United States
Malaysia
Korea, Rep.
China
United Kingdom
Mongolia
Cambodia
Thailand
Vietnam
Lao PDR
India
Philippines
Source: Edstats 2003. The supply issue is in part related to distribution inefficiencies. Based on the standards set by the current staffing entitlement formula for primary school (9 teachers minimum and a target STR of 40:1), approximately 55 percent of schools are oversupplied, while 34 percent are undersupplied (Figure 4.2).30 Inequities in distribution are particularly evident when looking at supply of teachers in urban, rural and remote schools. Urban and rural areas schools have substantial oversupplies (with 68 percent and 52 percent of the schools having an oversupply, respectively), while remote schools have serious teacher shortages, with 66 percent of the schools being undersupplied. The government’s new policy of doubling the base salary for teachers working in remote schools should encourage teachers to work in remote schools.
28 Source: EdStats database. Primary ratio clearly defined with weighted ratio, but secondary ratio estimated by authors due to unavailability of data. 29 World Bank 2006, ‘Potential for significant equity, efficiency and quality improvement: Teacher employment and deployment in Indonesia’ 30 The total over and undersupply is calculated based on 2005 Employment and Deployment survey results of urban, rural and remote schools. The total is weighted based on 2004 Susenas calculations on the percent of 7-15 year olds living in urban and rural areas and an assumption that 10 of schools are remote. Part-time teachers are calculated to become full time equivalents.
28
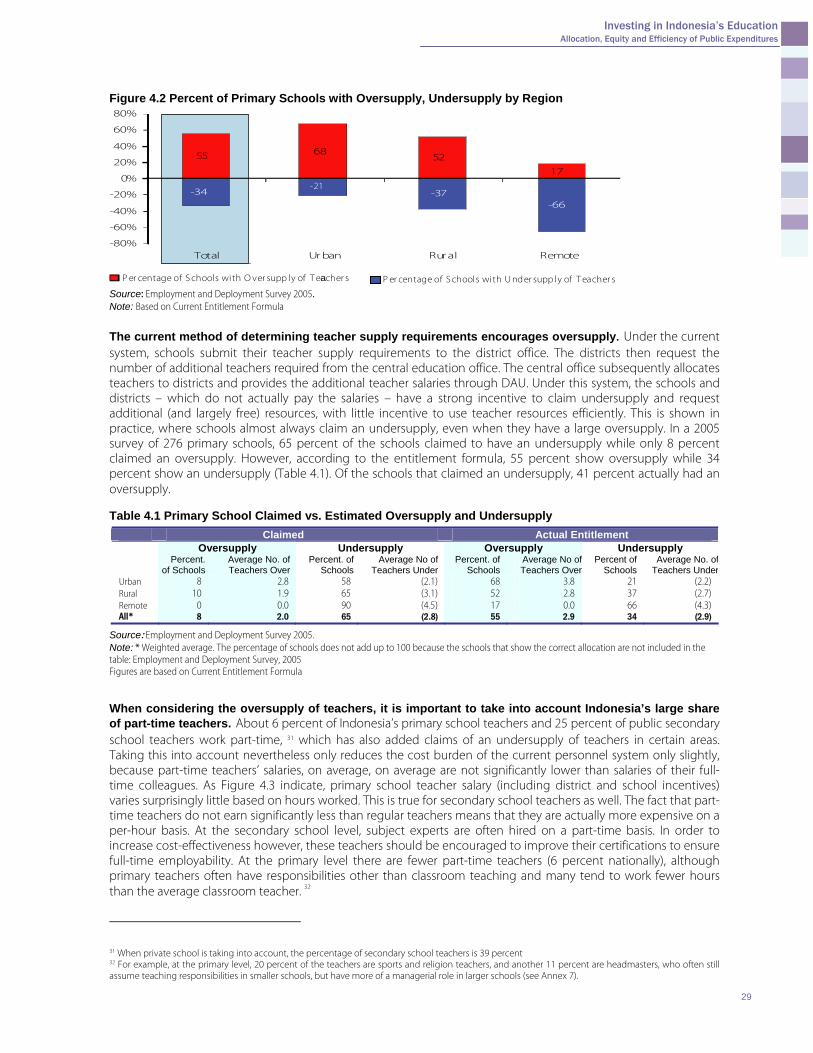
Investing in Indonesia’s Education Allocation, Equity and Efficiency of Public Expenditures
Figure 4.2 Percent of Primary Schools with Oversupply, Undersupply by Region
55 6852
17
-34 -37-66
-80%
-60%
-40%
-20%
0%
20%
40%
60%
80%
Total Ur ban Rural Remote
P er centage of S chools with O ver supp ly of T eacher s P er centage of S chools with U nder supp ly of T eacher s
-21
Source: Employment and Deployment Survey 2005. Note: Based on Current Entitlement Formula
The current method of determining teacher supply requirements encourages oversupply. Under the current system, schools submit their teacher supply requirements to the district office. The districts then request the number of additional teachers required from the central education office. The central office subsequently allocates teachers to districts and provides the additional teacher salaries through DAU. Under this system, the schools and districts – which do not actually pay the salaries – have a strong incentive to claim undersupply and request additional (and largely free) resources, with little incentive to use teacher resources efficiently. This is shown in practice, where schools almost always claim an undersupply, even when they have a large oversupply. In a 2005 survey of 276 primary schools, 65 percent of the schools claimed to have an undersupply while only 8 percent claimed an oversupply. However, according to the entitlement formula, 55 percent show oversupply while 34 percent show an undersupply (Table 4.1). Of the schools that claimed an undersupply, 41 percent actually had an oversupply. Table 4.1 Primary School Claimed vs. Estimated Oversupply and Undersupply
Claimed Actual Entitlement Oversupply Undersupply Oversupply Undersupply
Percent. of Schools
Average No. of Teachers Over
Percent. of Schools
Average No of Teachers Under
Percent. of Schools
Average No of Teachers Over
Percent of Schools
Average No. of Teachers Under
Urban 8 2.8 58 (2.1) 68 3.8 21 (2.2) Rural 10 1.9 65 (3.1) 52 2.8 37 (2.7) Remote 0 0.0 90 (4.5) 17 0.0 66 (4.3) All* 8 2.0 65 (2.8) 55 2.9 34 (2.9)
Source: Employment and Deployment Survey 2005. Note: * Weighted average. The percentage of schools does not add up to 100 because the schools that show the correct allocation are not included in the table: Employment and Deployment Survey, 2005 Figures are based on Current Entitlement Formula When considering the oversupply of teachers, it is important to take into account Indonesia’s large share of part-time teachers. About 6 percent of Indonesia’s primary school teachers and 25 percent of public secondary school teachers work part-time, 31 which has also added claims of an undersupply of teachers in certain areas. Taking this into account nevertheless only reduces the cost burden of the current personnel system only slightly, because part-time teachers’ salaries, on average, on average are not significantly lower than salaries of their full-time colleagues. As Figure 4.3 indicate, primary school teacher salary (including district and school incentives) varies surprisingly little based on hours worked. This is true for secondary school teachers as well. The fact that part-time teachers do not earn significantly less than regular teachers means that they are actually more expensive on a per-hour basis. At the secondary school level, subject experts are often hired on a part-time basis. In order to increase cost-effectiveness however, these teachers should be encouraged to improve their certifications to ensure full-time employability. At the primary level there are fewer part-time teachers (6 percent nationally), although primary teachers often have responsibilities other than classroom teaching and many tend to work fewer hours than the average classroom teacher. 32
31 When private school is taking into account, the percentage of secondary school teachers is 39 percent 32 For example, at the primary level, 20 percent of the teachers are sports and religion teachers, and another 11 percent are headmasters, who often still assume teaching responsibilities in smaller schools, but have more of a managerial role in larger schools (see Annex 7).
29
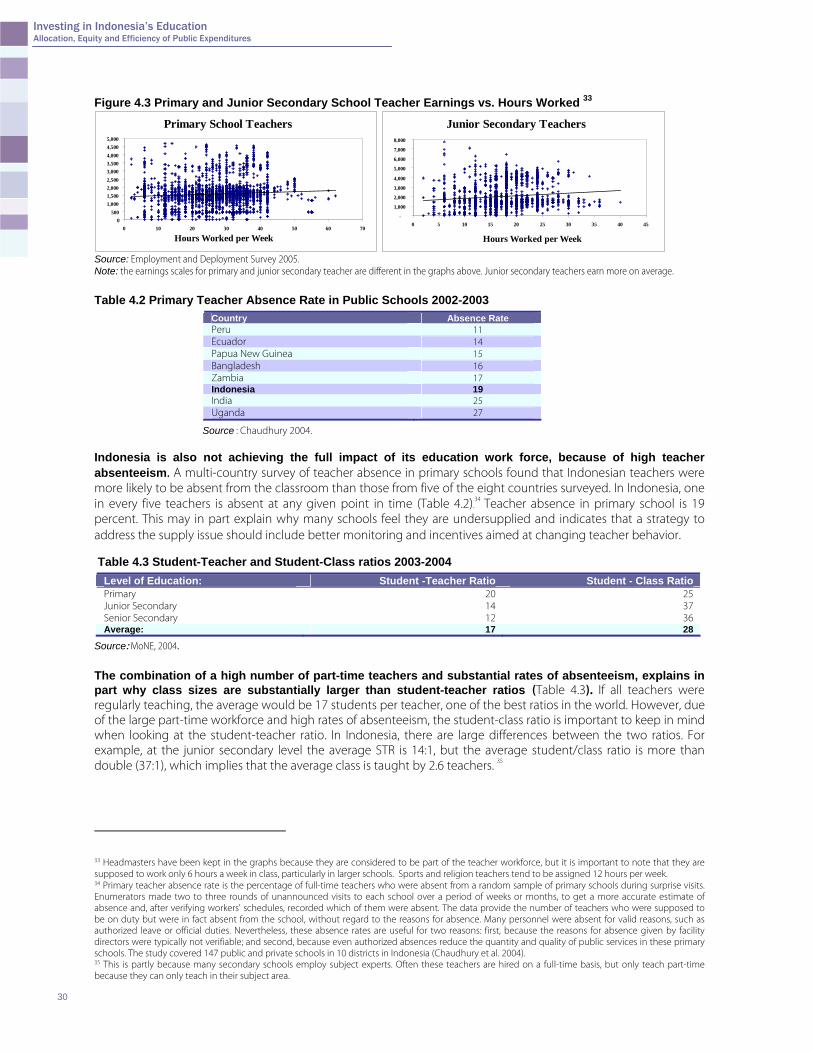
Investing in Indonesia’s Education Allocation, Equity and Efficiency of Public Expenditures
33Figure 4.3 Primary and Junior Secondary School Teacher Earnings vs. Hours Worked
Primary School Teachers
0500
1,0001,5002,0002,5003,0003,5004,0004,5005,000
0 10 20 30 40 50 60 70
Junior Secondary Teachers
-
1,000
2,000
3,000
4,000
5,000
6,000
7,000
8,000
0 5 10 15 20 25 30 35 40 45
Hours Worked per Week Hours Worked per Week
Source: Employment and Deployment Survey 2005. Note: the earnings scales for primary and junior secondary teacher are different in the graphs above. Junior secondary teachers earn more on average.
Table 4.2 Primary Te bsence Rate in Public Schools 20
acher A 02-2003 Country Abse Rate nce Peru 11 Ecuador 14 Papua New Guinea 15 Bangladesh 16 Zambia 17 Indonesia 19 India 25 Uganda 27
Source : Chaudhury 2004.
to ddress the supply issue should include better monitoring and incentives aimed at changing teacher behavior.
Indonesia is also not achieving the full impact of its education work force, because of high teacher absenteeism. A multi-country survey of teacher absence in primary schools found that Indonesian teachers were more likely to be absent from the classroom than those from five of the eight countries surveyed. In Indonesia, one in every five teachers is absent at any given point in time (Table 4.2).
34 Teacher absence in primary school is 19
percent. This may in part explain why many schools feel they are undersupplied and indicates that a strategya T eacher and Student-Class ratiable 4.3 Student-T os 2003-2004
Level of Education: Student -Teacher Ratio Student - Class Ratio Primary 20 25 Junior Secondary 14 37 Senior Secondary 12 36 Average: 17 28
Source: MoNE, 2004.
ge student/class ratio is more than ouble (37:1), which implies that the average class is taught by 2.6 teachers.
The combination of a high number of part-time teachers and substantial rates of absenteeism, explains in part why class sizes are substantially larger than student-teacher ratios (Table 4.3). If all teachers were regularly teaching, the average would be 17 students per teacher, one of the best ratios in the world. However, due of the large part-time workforce and high rates of absenteeism, the student-class ratio is important to keep in mind when looking at the student-teacher ratio. In Indonesia, there are large differences between the two ratios. For example, at the junior secondary level the average STR is 14:1, but the avera
35d
33 Headmasters have been kept in the graphs because they are considered to be part of the teacher workforce, but it is important to note that they are supposed to work only 6 hours a week in class, particularly in larger schools. Sports and religion teachers tend to be assigned 12 hours per week. 34 Primary teacher absence rate is the percentage of full-time teachers who were absent from a random sample of primary schools during surprise visits. Enumerators made two to three rounds of unannounced visits to each school over a period of weeks or months, to get a more accurate estimate of absence and, after verifying workers' schedules, recorded which of them were absent. The data provide the number of teachers who were supposed to be on duty but were in fact absent from the school, without regard to the reasons for absence. Many personnel were absent for valid reasons, such as authorized leave or official duties. Nevertheless, these absence rates are useful for two reasons: first, because the reasons for absence given by facility directors were typically not verifiable; and second, because even authorized absences reduce the quantity and quality of public services in these primary schools. The study covered 147 public and private schools in 10 districts in Indonesia (Chaudhury et al. 2004). 35 This is partly because many secondary schools employ subject experts. Often these teachers are hired on a full-time basis, but only teach part-time because they can only teach in their subject area.
30
Investing in Indonesia’s Education Allocation, Equity and Efficiency of Public Expenditures
The bottom line from a financing perspective is that the oversupply presents a significant cost-burden. Using realistic STRs 36 that follow international best practice and are in line with the regional average, Indonesia shows a teacher oversupply of approximately 21 percent (Annex 6) Even when using a conservative estimate and taking into account the large part-time teacher workforce, the cost for primary and junior secondary schools alone reaches over Rp. 5 trillion, or approximately 8 percent of the total education budget. This cost will be exacerbated when teacher wages are significantly increased due new incentives specified in the 2005 Teacher Law (discussed in detail in the next section). A more efficient teacher supply method in the longer term may be to provide funds to schools on a per pupil basis and then allow the schools to hire the number of teachers they believe are required. While the current method of providing teacher salaries through the DAU encourages schools and districts to request more teachers from the central government, having the teacher salary come out of the school’s budget would encourage schools to be efficient in the number of teachers hired. It would help in creating a more equitable distribution since salaries would only be available at the school level. It would also in part address issues of teacher absenteeism and hiring of part-time teachers, because schools would have the incentive to use their resources efficiently and ensure that their teachers are performing their assigned tasks. This mechanism, however, bypasses district governments and might make local responsibilities in terms of providing educational services more diffused. Schools would also require additional financial and administrative capacity. Box 4.1 Responsibilities for Employment and Deployment of Teachers Since decentralization, districts are responsible for employing all public school teachers except those in religious schools. These include all civil service teachers in public and private schools as well as honorary teachers, who previously were hired and paid by the government. Currently, wages for public teachers are transferred to the districts’ budgets as part of the DAU transfer from central government. Even though district governments are responsible for hiring teachers and paying their salaries, ambiguities persist. For example, religious school teachers who are civil servants are managed by the education unit in the Ministry of Religious Affairs (MoRA), not by the districts. In addition, the salary levels and promotional and reward systems for civil servants are set centrally, although many districts provide teachers within their jurisdictions with supplementary benefits and incentives. Moreover, it is still not clear whether districts can reduce the teaching force by dismissing some civil service teachers, as they might want to do if they were to rationalize their student-teacher ratios. This problem is significant given that the majority of teachers at the primary and junior secondary levels are civil servants. Table 4.4 Civil and Non-Civil-Servant Teachers by Level of Education
2004–2005 Civil servants % Non-civil servants % Primary 1,108,436 83 226,650 17 Junior Secondary 308,346 57 234,245 43 Senior Secondary 170,381 39 265,085 61
Currently, many teachers are under the impression that they cannot apply for vacancies in other districts, but this perception may have arisen because districts often want to retain the civil servants whom they already employ. Nor are there any good mechanisms by which schools and districts can advertise teaching vacancies beyond district boundaries to recruit the teachers who may be the best suited to that particular school. Sources: World Bank Education Sector Review 2005; WB-MoNE staff estimates.
Teacher Salaries, Incentives, and Education Quality With the introduction of a new Teacher Law in December 2005, the GoI introduced a new teacher certification requirement which increases teacher remuneration, while also improving level of qualifications. Designing teacher salaries and incentive structures that attract and retain the best and the brightest candidates to the teaching profession is a complex task. This fact is particularly true for Indonesia, whose teacher salaries are considered relatively low. Low pay is likely a main reason that teachers perform poorly, have low morale, and tend to be poorly qualified. The level of teacher salaries in Indonesia, adjusted for purchasing power, is significantly lower than that of other countries.37
36 A proposed entitlement is a minimum of 4 teachers in every primary school and a target STR of 32:1 in primary and a minimum of 7 teachers in every junior secondary school and a target STR of 28:1, which results in an actual STR of 26:1 and 22:1 respectively. 37
See UNESCO-UIS/OECD 2005.
31
Investing in Indonesia’s Education Allocation, Equity and Efficiency of Public Expenditures
Box 4.2 Types of Teachers in Indonesia:
Indonesia has four types of teachers: • Public teachers are civil servants who have minimum teacher qualifications. • Contract teachers are fixed-term teachers who usually are employed through (donor-funded) projects and have the
same qualifications as public teachers. • Permanent teachers are engaged by foundations to teach in private schools. These teachers’ qualifications vary by the
quality of the school. • Temporary teachers work in private and public schools and are paid by foundations. These teachers vary widely in their
qualifications, and their wages can be very low (less than Rp. 100,000 a month). Sources: World Bank Education Sector Review 2005, p.101 and MoNE data.
Table 4.5 reports teacher salaries from a sample of World Education Indicator (WEI) participant countries. It shows that Indonesian teachers have one of the lowest salaries among these countries and for all scales and levels of education. Cross-country comparisons can be problematic, as some countries may offer additional incentives that are not captured in the comparison. Nevertheless, the results seem to indicate that Indonesian teachers are relatively poorly paid. Doubling teachers’ payments through the country’s extensive incentive structure still would leave salaries below the rest of sampled WEI countries other than Egypt. Table 4.5 Comparison of Teacher Salaries in Selected World Education Indicator (WEI) Participant Countries
Primary Education Junior Secondary Education
Senior Secondary Education
Year Starting salary
Salary at top scale
Starting salary
Salary at top scale
Starting salary Salary at top scale
Chile 2003 11,709 18,437 11,709 18,473 11,709 19,302 Egypt 2002/03 1,046 … 1,046 ,… … … Indonesia 2002/03 1,002 3,022 1,002 3,022 1,042 3,022 Malaysia 2002 9,230 17,470 13,480 29,151 13,480 29,151 Paraguay 2002 7,950 7,950 12,400 12,400 12,400 12,400 Philippines 2002/03 9,890 11,756 9,890 11,756 9,890 11,765 Sri Lanka 2002 3,100 3,945 3,100 4,509 3,945 5,073 Thailand 2003/04 6,048 28,345 6,048 28,345 6,048 28,345 Uruguay 2002 4,850 7,017 4,850 7,017 5,278 7,444 OECD mean 2003 24,287 40,539 26,241 43,477 27,455 45,948
Source: UNESCO-UIS/OECD 2005 Education Trends in Perspective: Analysis of the World Education Indicators. Note: Figures are in USD Nationally, however, when comparing wage levels of teachers to salaries of others with equivalent education, salaries turn out to vary by level of education and actually decrease as education increases. An analysis of Indonesia’s 2004 Labor Force Survey (Sakernas) reveals that the monthly earnings of primary teachers with qualifications below the diploma level (approximately 40 percent of teachers), are 16 percent higher than the earnings of other paid workers. This differential decreases to 6 percent for teachers with a first- or second-level diploma (approximately 32 percent of teachers) but becomes negative for primary teachers with higher education. In particular, teachers with a third-level diploma (approximately 8 percent) or a university degree (approximately 19 percent) earn 21 percent and 35 percent less, respectively, than other workers with equivalent levels of education. These results suggest that teachers with relatively low levels of education are comparatively overpaid, while those with higher levels of education are relatively underpaid. It is noteworthy that these earnings trends create a disincentive for under-qualified teachers to attain additional education, because their wage relative to others with similar qualifications would decrease (Annex 8). Teacher earnings are 21 percent lower than those of other paid workers with equivalent qualifications, and 26 percent lower than those of other civil servants.38 Further disaggregating teachers into those that teach primary and those that teach non-primary levels, the estimation results suggest that primary teachers are paid 6 to 18 percent less per month than other paid workers or civil servants, whereas the earnings differential for non-primary teachers is as high as 33 percent 39 (Table 4.6).
38 These estimates control for gender, age, urban or rural residence, and level of teacher education. 39 These results are consistent with previous empirical studies based on the same data source; such as Filmer 2002, with a slight increase in the wage differential estimated for primary school teachers compared to other workers, changing from 2.5 to 6 percent (Annex 8).
32
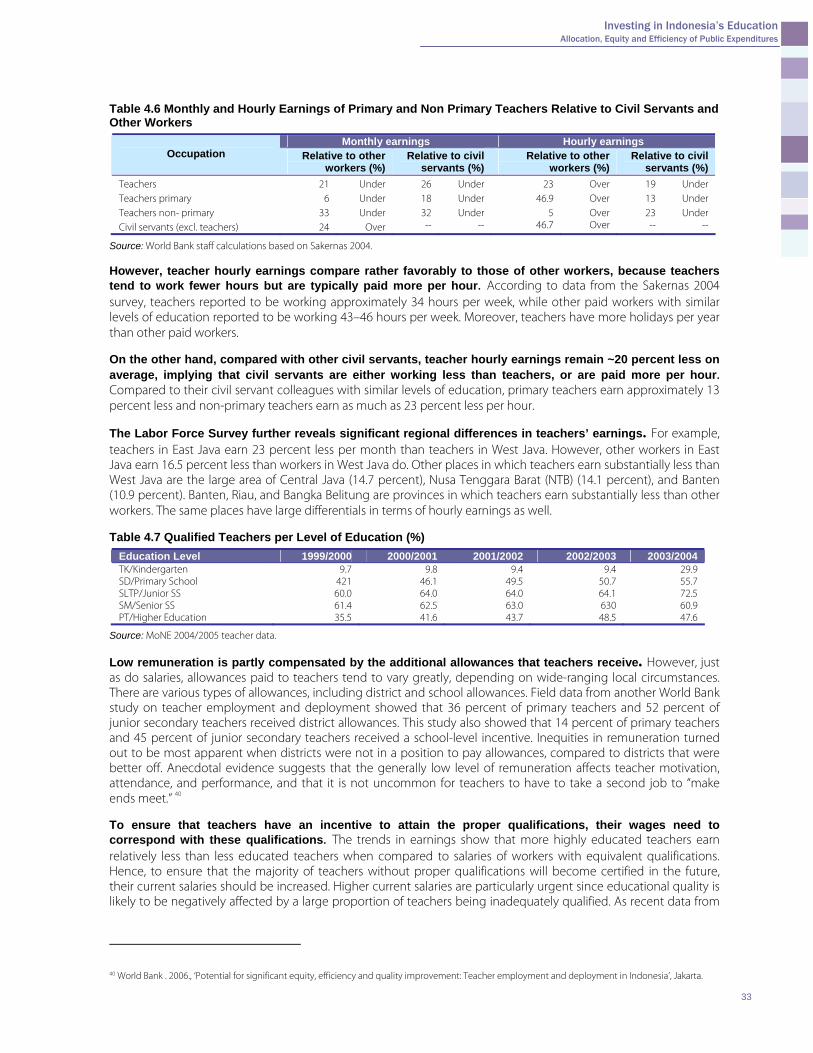
Investing in Indonesia’s Education Allocation, Equity and Efficiency of Public Expenditures
Table 4.6 Monthly and Hourly Earnings of Primary and Non Primary Teachers Relative to Civil Servants and Other Workers
Monthly earnings Hourly earnings Occupation Relative to other
workers (%) Relative to civil
servants (%) Relative to other
workers (%) Relative to civil
servants (%) Teachers 21 Under 26 Under 23 Over 19 Under Teachers primary 6 Under 18 Under 46.9 Over 13 Under Teachers non- primary 33 Under 32 Under 5 Over 23 Under Civil servants (excl. teachers) 24 Over -- -- 46.7 Over -- --
Source: World Bank staff calculations based on Sakernas 2004. However, teacher hourly earnings compare rather favorably to those of other workers, because teachers tend to work fewer hours but are typically paid more per hour. According to data from the Sakernas 2004 survey, teachers reported to be working approximately 34 hours per week, while other paid workers with similar levels of education reported to be working 43–46 hours per week. Moreover, teachers have more holidays per year than other paid workers. On the other hand, compared with other civil servants, teacher hourly earnings remain ~20 percent less on average, implying that civil servants are either working less than teachers, or are paid more per hour. Compared to their civil servant colleagues with similar levels of education, primary teachers earn approximately 13 percent less and non-primary teachers earn as much as 23 percent less per hour. The Labor Force Survey further reveals significant regional differences in teachers’ earnings. For example, teachers in East Java earn 23 percent less per month than teachers in West Java. However, other workers in East Java earn 16.5 percent less than workers in West Java do. Other places in which teachers earn substantially less than West Java are the large area of Central Java (14.7 percent), Nusa Tenggara Barat (NTB) (14.1 percent), and Banten (10.9 percent). Banten, Riau, and Bangka Belitung are provinces in which teachers earn substantially less than other workers. The same places have large differentials in terms of hourly earnings as well. Table 4.7 Qualified Teachers per Level of Education (%)
Education Level 1999/2000 2000/2001 2001/2002 2002/2003 2003/2004 TK/Kindergarten 9.7 9.8 9.4 9.4 29.9 SD/Primary School 421 46.1 49.5 50.7 55.7 SLTP/Junior SS 60.0 64.0 64.0 64.1 72.5 SM/Senior SS 61.4 62.5 63.0 630 60.9 PT/Higher Education 35.5 41.6 43.7 48.5 47.6
Source: MoNE 2004/2005 teacher data.
Low remuneration is partly compensated by the additional allowances that teachers receive. However, just as do salaries, allowances paid to teachers tend to vary greatly, depending on wide-ranging local circumstances. There are various types of allowances, including district and school allowances. Field data from another World Bank study on teacher employment and deployment showed that 36 percent of primary teachers and 52 percent of junior secondary teachers received district allowances. This study also showed that 14 percent of primary teachers and 45 percent of junior secondary teachers received a school-level incentive. Inequities in remuneration turned out to be most apparent when districts were not in a position to pay allowances, compared to districts that were better off. Anecdotal evidence suggests that the generally low level of remuneration affects teacher motivation, attendance, and performance, and that it is not uncommon for teachers to have to take a second job to “make ends meet.” 40 To ensure that teachers have an incentive to attain the proper qualifications, their wages need to correspond with these qualifications. The trends in earnings show that more highly educated teachers earn relatively less than less educated teachers when compared to salaries of workers with equivalent qualifications. Hence, to ensure that the majority of teachers without proper qualifications will become certified in the future, their current salaries should be increased. Higher current salaries are particularly urgent since educational quality is likely to be negatively affected by a large proportion of teachers being inadequately qualified. As recent data from
40 World Bank . 2006., ‘Potential for significant equity, efficiency and quality improvement: Teacher employment and deployment in Indonesia’, Jakarta.
33
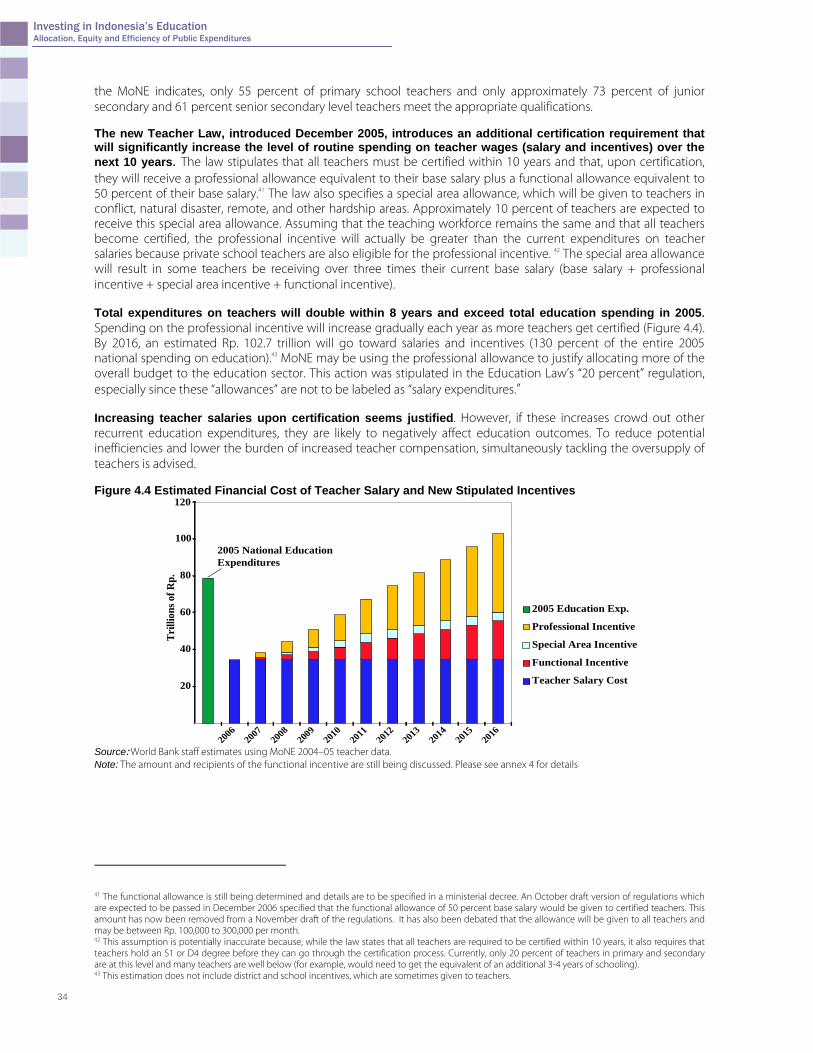
Investing in Indonesia’s Education Allocation, Equity and Efficiency of Public Expenditures
the MoNE indicates, only 55 percent of primary school teachers and only approximately 73 percent of junior secondary and 61 percent senior secondary level teachers meet the appropriate qualifications. The new Teacher Law, introduced December 2005, introduces an additional certification requirement that will significantly increase the level of routine spending on teacher wages (salary and incentives) over the next 10 years. The law stipulates that all teachers must be certified within 10 years and that, upon certification, they will receive a professional allowance equivalent to their base salary plus a functional allowance equivalent to 50 percent of their base salary.41 The law also specifies a special area allowance, which will be given to teachers in conflict, natural disaster, remote, and other hardship areas. Approximately 10 percent of teachers are expected to receive this special area allowance. Assuming that the teaching workforce remains the same and that all teachers become certified, the professional incentive will actually be greater than the current expenditures on teacher salaries because private school teachers are also eligible for the professional incentive. 42 The special area allowance will result in some teachers be receiving over three times their current base salary (base salary + professional incentive + special area incentive + functional incentive).
Total expenditures on teachers will double within 8 years and exceed total education spending in 2005. Spending on the professional incentive will increase gradually each year as more teachers get certified (Figure 4.4). By 2016, an estimated Rp. 102.7 trillion will go toward salaries and incentives (130 percent of the entire 2005 national spending on education).43 MoNE may be using the professional allowance to justify allocating more of the overall budget to the education sector. This action was stipulated in the Education Law’s “20 percent” regulation, especially since these “allowances” are not to be labeled as “salary expenditures.”
Increasing teacher salaries upon certification seems justified. However, if these increases crowd out other recurrent education expenditures, they are likely to negatively affect education outcomes. To reduce potential inefficiencies and lower the burden of increased teacher compensation, simultaneously tackling the oversupply of teachers is advised. Figure 4.4 Estimated Financial Cost of Teacher Salary and New Stipulated Incentives
20
40
60
80
100
120
2006
2007
2008
2009
2010
2011
2012
2013
2014
2015
2016
Trill
ions
of R
p.
2005 Education Exp.
Professional Incentive
Special Area Incentive
Functional Incentive
Teacher Salary Cost
2005 National EducationExpenditures
Source: World Bank staff estimates using MoNE 2004–05 teacher data. Note: The amount and recipients of the functional incentive are still being discussed. Please see annex 4 for details
41 The functional allowance is still being determined and details are to be specified in a ministerial decree. An October draft version of regulations which are expected to be passed in December 2006 specified that the functional allowance of 50 percent base salary would be given to certified teachers. This amount has now been removed from a November draft of the regulations. It has also been debated that the allowance will be given to all teachers and may be between Rp. 100,000 to 300,000 per month. 42 This assumption is potentially inaccurate because, while the law states that all teachers are required to be certified within 10 years, it also requires that teachers hold an S1 or D4 degree before they can go through the certification process. Currently, only 20 percent of teachers in primary and secondary are at this level and many teachers are well below (for example, would need to get the equivalent of an additional 3-4 years of schooling). 43 This estimation does not include district and school incentives, which are sometimes given to teachers.
34
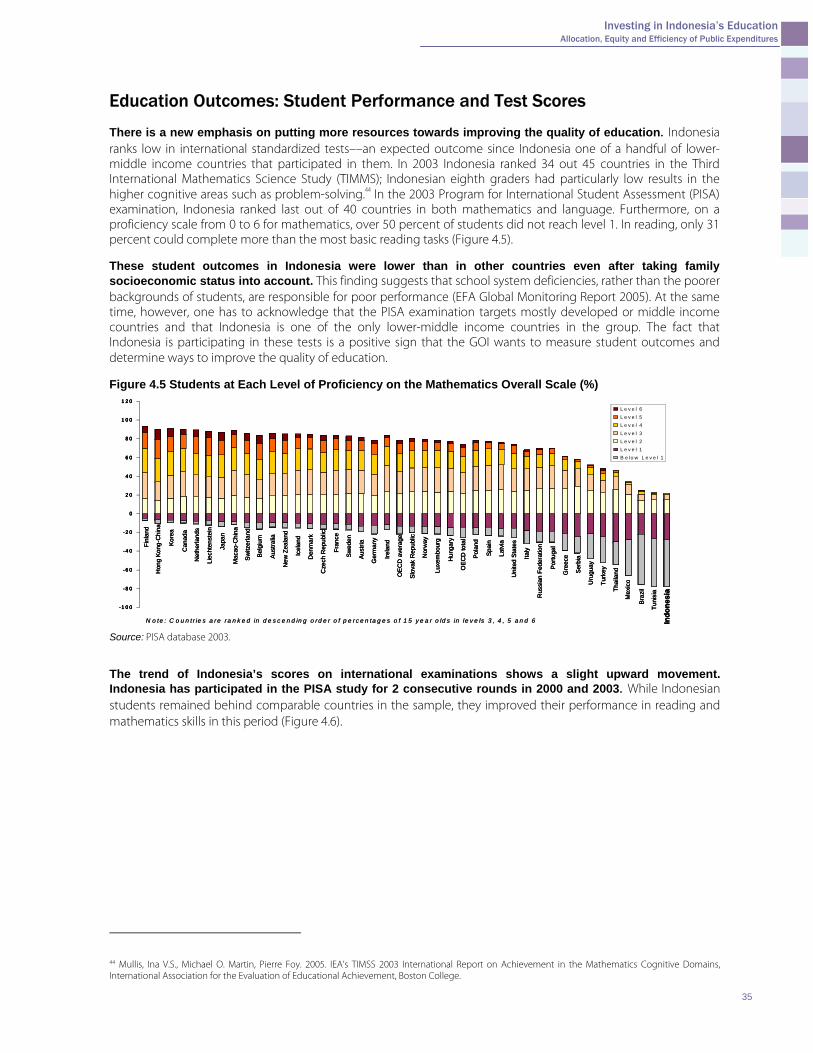
Investing in Indonesia’s Education Allocation, Equity and Efficiency of Public Expenditures
Education Outcomes: Student Performance and Test Scores There is a new emphasis on putting more resources towards improving the quality of education. Indonesia ranks low in international standardized tests––an expected outcome since Indonesia one of a handful of lower-middle income countries that participated in them. In 2003 Indonesia ranked 34 out 45 countries in the Third International Mathematics Science Study (TIMMS); Indonesian eighth graders had particularly low results in the higher cognitive areas such as problem-solving.44 In the 2003 Program for International Student Assessment (PISA) examination, Indonesia ranked last out of 40 countries in both mathematics and language. Furthermore, on a proficiency scale from 0 to 6 for mathematics, over 50 percent of students did not reach level 1. In reading, only 31 percent could complete more than the most basic reading tasks (Figure 4.5). These student outcomes in Indonesia were lower than in other countries even after taking family socioeconomic status into account. This finding suggests that school system deficiencies, rather than the poorer backgrounds of students, are responsible for poor performance (EFA Global Monitoring Report 2005). At the same time, however, one has to acknowledge that the PISA examination targets mostly developed or middle income countries and that Indonesia is one of the only lower-middle income countries in the group. The fact that Indonesia is participating in these tests is a positive sign that the GOI wants to measure student outcomes and determine ways to improve the quality of education. Figure 4.5 Students at Each Level of Proficiency on the Mathematics Overall Scale (%)
Finl
and
Hon
g Ko
ng-C
hina
Kore
a
Can
ada
Net
herla
nds
Liec
hten
stei
n
Japa
n
Mac
ao-C
hina
Sw
itzer
land
Belg
ium
Aust
ralia
New
Zea
land
Icel
and
Den
mar
k
Cze
ch R
epub
lic
Fran
ce
Sw
eden
Aust
ria
Ger
man
y
Irela
nd
OEC
D a
vera
ge
Slov
ak R
epub
lic
Nor
way
Luxe
mbo
urg
Hun
gary
OEC
D to
tal
Pola
nd
Spai
n
Latv
ia
Uni
ted
Stat
es
Italy
Rus
sian
Fed
erat
ion
Portu
gal
Gre
ece
Serb
ia
Uru
guay
Turk
ey
Thai
land
Mex
ico
Braz
il
Tuni
sia
Indo
nesi
a
L e v e l 6L e v e l 5L e v e l 4L e v e l 3L e v e l 2L e v e l 1B e lo w L e v e l 1
-1 0 0
- 8 0
- 6 0
- 4 0
- 2 0
0
2 0
4 0
6 0
8 0
1 0 0
1 2 0
N o te : C o u n t r ie s a r e r a n k e d in d e s c e n d in g o r d e r o f p e r c e n ta g e s o f 1 5 y e a r o ld s in le v e ls 3 , 4 , 5 a n d 6
Finl
and
Hon
g Ko
ng-C
hina
Kore
a
Can
ada
Net
herla
nds
Liec
hten
stei
n
Japa
n
Mac
ao-C
hina
Sw
itzer
land
Belg
ium
Aust
ralia
New
Zea
land
Icel
and
Den
mar
k
Cze
ch R
epub
lic
Fran
ce
Sw
eden
Aust
ria
Ger
man
y
Irela
nd
OEC
D a
vera
ge
Slov
ak R
epub
lic
Nor
way
Luxe
mbo
urg
Hun
gary
OEC
D to
tal
Pola
nd
Spai
n
Latv
ia
Uni
ted
Stat
es
Italy
Rus
sian
Fed
erat
ion
Portu
gal
Gre
ece
Serb
ia
Uru
guay
Turk
ey
Thai
land
Mex
ico
Braz
il
Tuni
sia
Indo
nesi
a
L e v e l 6L e v e l 5L e v e l 4L e v e l 3L e v e l 2L e v e l 1B e lo w L e v e l 1
-1 0 0
- 8 0
- 6 0
- 4 0
- 2 0
0
2 0
4 0
6 0
8 0
1 0 0
1 2 0
-1 0 0
- 8 0
- 6 0
- 4 0
- 2 0
0
2 0
4 0
6 0
8 0
1 0 0
1 2 0
N o te : C o u n t r ie s a r e r a n k e d in d e s c e n d in g o r d e r o f p e r c e n ta g e s o f 1 5 y e a r o ld s in le v e ls 3 , 4 , 5 a n d 6 Source: PISA database 2003. The trend of Indonesia’s scores on international examinations shows a slight upward movement. Indonesia has participated in the PISA study for 2 consecutive rounds in 2000 and 2003. While Indonesian students remained behind comparable countries in the sample, they improved their performance in reading and mathematics skills in this period (Figure 4.6).
44 Mullis, Ina V.S., Michael O. Martin, Pierre Foy. 2005. IEA’s TIMSS 2003 International Report on Achievement in the Mathematics Cognitive Domains, International Association for the Evaluation of Educational Achievement, Boston College.
35
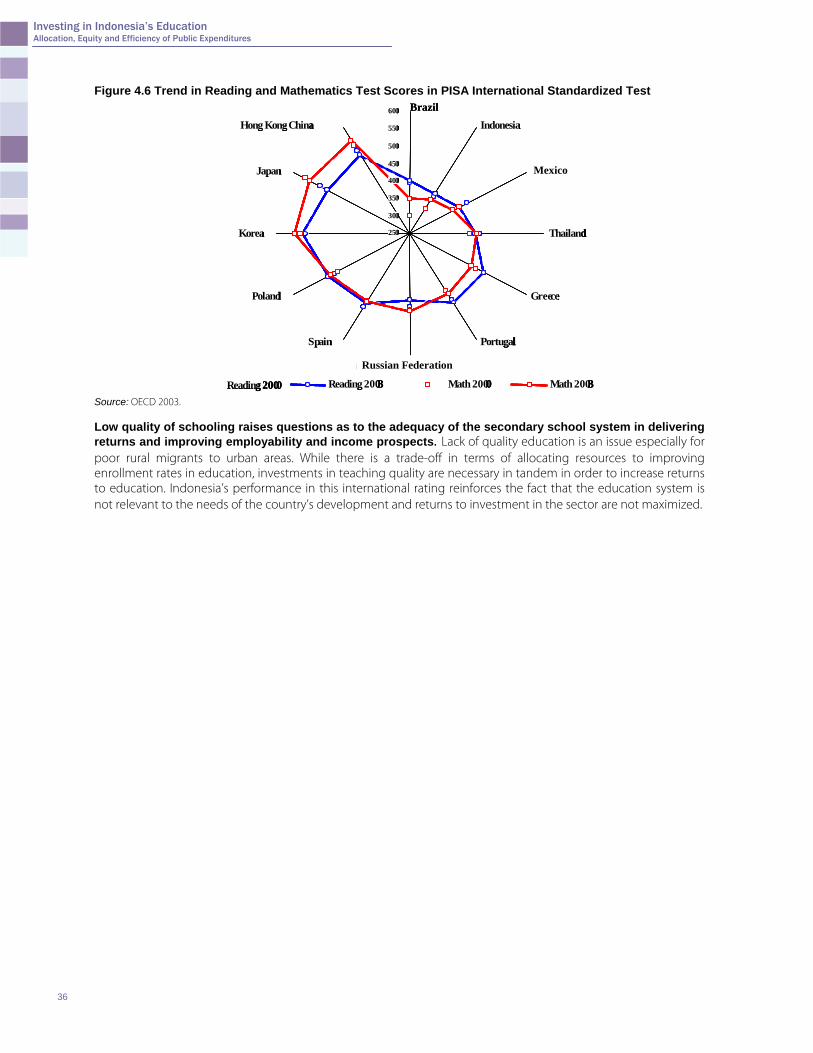
Investing in Indonesia’s Education Allocation, Equity and Efficiency of Public Expenditures
Figure 4.6 Trend in Reading and Mathematics Test Scores in PISA International Standardized Test
Brazil
250
300
350
400
450
500
550
600
Indonesia
Mexico
Thailand
Greece
Portugal
Russian Federation
Spain
Poland
Korea
Japan
Hong Kong-China
Reading 2003 Math 2000 Math 2003
250
300
350
400
450
500
550
600
Indonesia
Mexico
Thailand
Greece
Portugal
Russian Federation
Spain
Poland
Korea
Japan
Hong Kong- China
Reading 2000 Reading 2003 Math 2000 Math 2003
Mexico
Russian Federation
Brazil
250
300
350
400
450
500
550
600
Indonesia
Mexico
Thailand
Greece
Portugal
Russian Federation
Spain
Poland
Korea
Japan
Hong Kong-China
Reading 2003 Math 2000 Math 2003
250
300
350
400
450
500
550
600
Indonesia
Mexico
Thailand
Greece
Portugal
Russian Federation
Spain
Poland
Korea
Japan
Hong Kong- China
Reading 2000 Reading 2003 Math 2000 Math 2003
250
300
350
400
450
500
550
600
Indonesia
Mexico
Thailand
Greece
Portugal
Russian Federation
Spain
Poland
Korea
Japan
Hong Kong-China
Reading 2003 Mat
250
300
350
400
450
500
550
600
Indonesia
Mexico
Thailand
Greece
Portugal
Russian Federation
Spain
Poland
Korea
Japan
Hong Kong-China
Reading 2003 Math 2000 Math 2003h 2000 Math 2003
250
300
350
400
450
500
550
600
Indonesia
Mexico
Thailand
Greece
Portugal
Russian Federat
250
300
350
400
450
500
550
600
Indonesia
Mexico
Thailand
Greece
Portugal
Russian Federation
Spain
Poland
Korea
Japan
Hong Kong- China
Reading 2000 Reading 2003 Math 2000 Math 2003
Mexico
Russian Federation
Source: OECD 2003. Low quality of schooling raises questions as to the adequacy of the secondary school system in delivering returns and improving employability and income prospects. Lack of quality education is an issue especially for poor rural migrants to urban areas. While there is a trade-off in terms of allocating resources to improving enrollment rates in education, investments in teaching quality are necessary in tandem in order to increase returns to education. Indonesia’s performance in this international rating reinforces the fact that the education system is not relevant to the needs of the country’s development and returns to investment in the sector are not maximized.
36
Investing in Indonesia’s Education Allocation, Equity and Efficiency of Public Expenditures
ANNEXES
37
Investing in Indonesia’s Education Allocation, Equity and Efficiency of Public Expenditures
Annex 1 Estimating Education Expenditures The estimation reported is based on panel data of 46 developing and developed countries from 1972–2000. Budget data is drawn from the International Monetary Fund’s (IMF) Government Financial Statistics. The source of other control variables is the World Bank’s World Development Indicators. Unobserved country characteristics were not controlled for, because the objective of the exercise was to compute the expected value of education spending given a set of economic and geographical characteristics. Control for unobserved country specifics would generate expectations given the historical (and other unobserved relevant dimensions) country-specific levels of education spending. A fixed-effects specification that controls for a country’s specific unobserved characteristics generates lower predictions (expected education spending of approximately 12 percent of the consolidated budget). The specification used can be written as:
)Re( ,43,2,10, tiiitititi ugiondevXDecGComp +++++= ααααα
)Re( 43,2,10, iitititi giondevXDecGompC ααααα ++++=)
Where: G(.): Denotes the transformation function applied to the model due to special characteristics of our dependent variable (G(x) = log(x/1-x)). Comp: Is the ratio of education expenditures to the total amount of public expenditures. X: Is a set of control variables, which include population, population density, GDP per capita, a measure of fiscal decentralization (sub-national expenditure share), and budget balance. Dev: Slope dummy defined as (DEC * Industrialized Dummy) is introduced in the model to account for possible different impact of decentralization depending on the level of economic development. Region: Regional dummies (LAC, MENA, NA, EASA, Sub-Saharan, relative to ECA) Note: This methodology draws upon Arze, Martinez-Vazquez, and McNab 2005. .
38
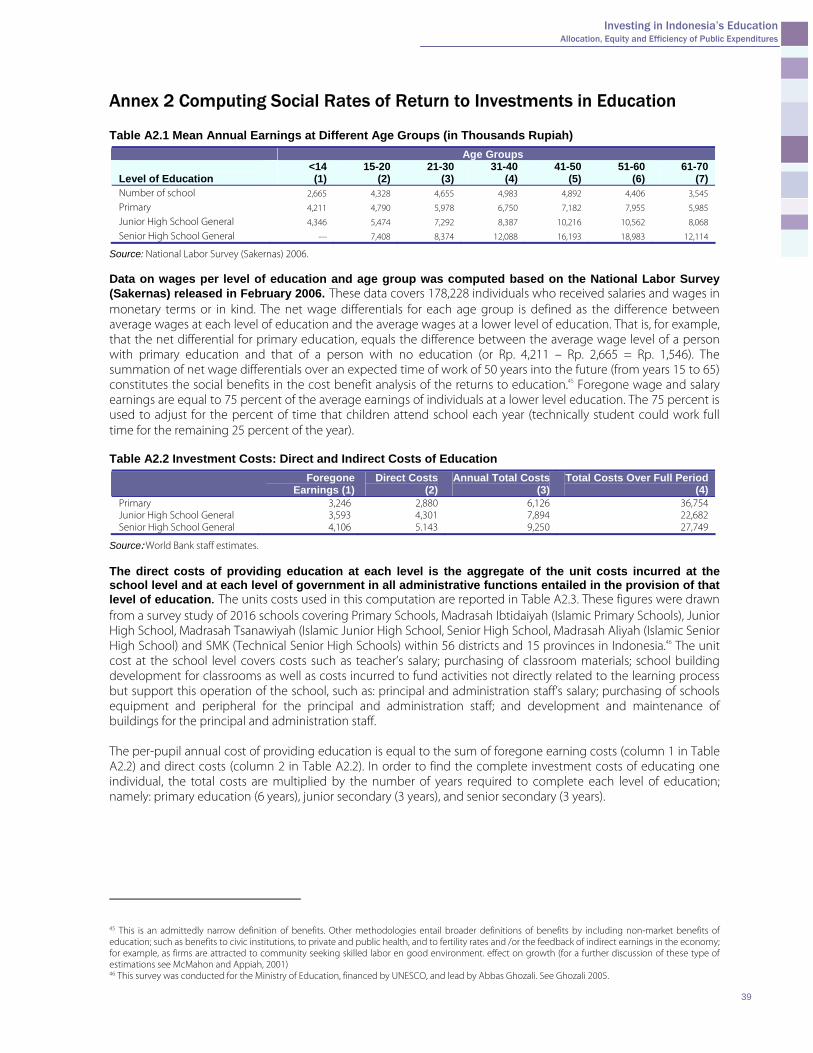
Investing in Indonesia’s Education Allocation, Equity and Efficiency of Public Expenditures
Annex 2 Computing Social Rates of Return to Investments in Education
Table A2.1 Mean Annual Earnings at Different Age Groups (in Thousands Rupiah) Age Groups
Level of Education <14 (1)
15-20 (2)
21-30 (3)
31-40 (4)
41-50 (5)
51-60 (6)
61-70 (7)
Number of school 2,665 4,328 4,655 4,983 4,892 4,406 3,545
Primary 4,211 4,790 5,978 6,750 7,182 7,955 5,985
Junior High School General 4,346 5,474 7,292 8,387 10,216 10,562 8,068
Senior High School General --- 7,408 8,374 12,088 16,193 18,983 12,114
Source: National Labor Survey (Sakernas) 2006. Data on wages per level of education and age group was computed based on the National Labor Survey (Sakernas) released in February 2006. These data covers 178,228 individuals who received salaries and wages in monetary terms or in kind. The net wage differentials for each age group is defined as the difference between average wages at each level of education and the average wages at a lower level of education. That is, for example, that the net differential for primary education, equals the difference between the average wage level of a person with primary education and that of a person with no education (or Rp. 4,211 – Rp. 2,665 = Rp. 1,546). The summation of net wage differentials over an expected time of work of 50 years into the future (from years 15 to 65) constitutes the social benefits in the cost benefit analysis of the returns to education.45 Foregone wage and salary earnings are equal to 75 percent of the average earnings of individuals at a lower level education. The 75 percent is used to adjust for the percent of time that children attend school each year (technically student could work full time for the remaining 25 percent of the year). Table A2.2 Investment Costs: Direct and Indirect Costs of Education
Foregone Earnings (1)
Direct Costs (2)
Annual Total Costs (3)
Total Costs Over Full Period (4)
Primary 3,246 2,880 6,126 36,754 Junior High School General 3,593 4,301 7,894 22,682 Senior High School General 4,106 5.143 9,250 27,749
Source: World Bank staff estimates. The direct costs of providing education at each level is the aggregate of the unit costs incurred at the school level and at each level of government in all administrative functions entailed in the provision of that level of education. The units costs used in this computation are reported in Table A2.3. These figures were drawn from a survey study of 2016 schools covering Primary Schools, Madrasah Ibtidaiyah (Islamic Primary Schools), Junior High School, Madrasah Tsanawiyah (Islamic Junior High School, Senior High School, Madrasah Aliyah (Islamic Senior High School) and SMK (Technical Senior High Schools) within 56 districts and 15 provinces in Indonesia.46 The unit cost at the school level covers costs such as teacher’s salary; purchasing of classroom materials; school building development for classrooms as well as costs incurred to fund activities not directly related to the learning process but support this operation of the school, such as: principal and administration staff’s salary; purchasing of schools equipment and peripheral for the principal and administration staff; and development and maintenance of buildings for the principal and administration staff. The per-pupil annual cost of providing education is equal to the sum of foregone earning costs (column 1 in Table A2.2) and direct costs (column 2 in Table A2.2). In order to find the complete investment costs of educating one individual, the total costs are multiplied by the number of years required to complete each level of education; namely: primary education (6 years), junior secondary (3 years), and senior secondary (3 years).
45 This is an admittedly narrow definition of benefits. Other methodologies entail broader definitions of benefits by including non-market benefits of education; such as benefits to civic institutions, to private and public health, and to fertility rates and /or the feedback of indirect earnings in the economy; for example, as firms are attracted to community seeking skilled labor en good environment. effect on growth (for a further discussion of these type of estimations see McMahon and Appiah, 2001) 46 This survey was conducted for the Ministry of Education, financed by UNESCO, and lead by Abbas Ghozali. See Ghozali 2005.
39
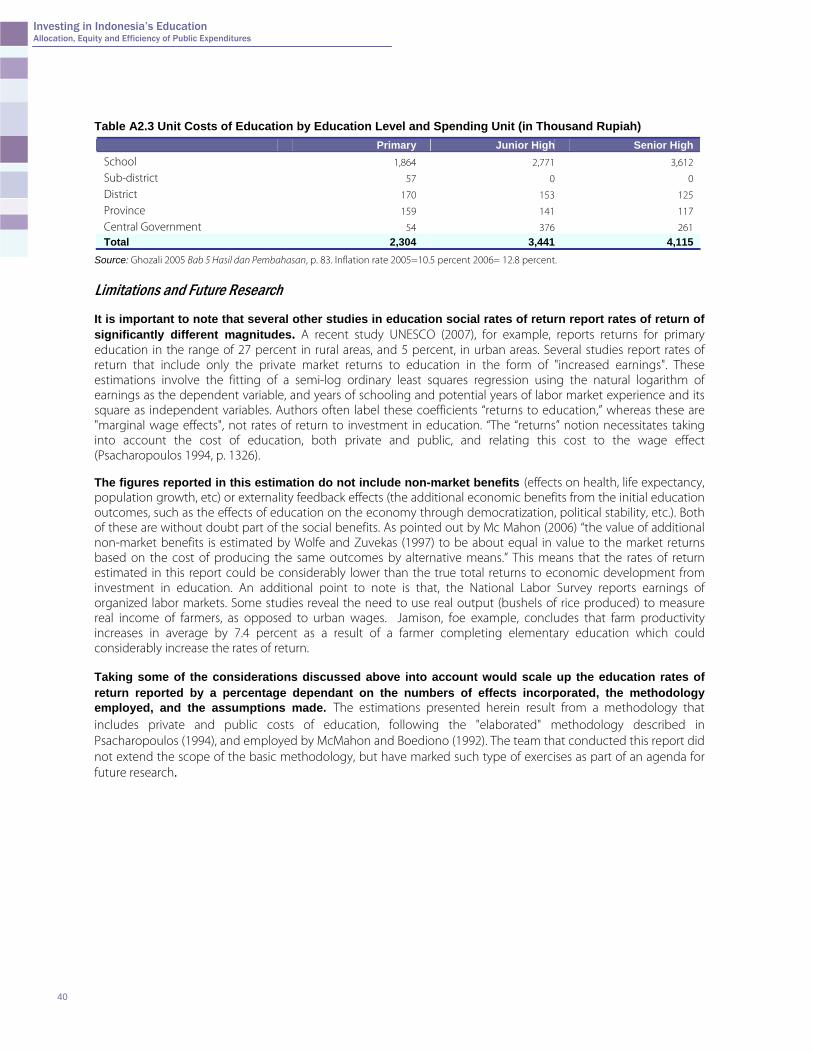
Investing in Indonesia’s Education Allocation, Equity and Efficiency of Public Expenditures
Table A2.3 Unit Costs of Education by Education Level and Spending Unit (in Thousand Rupiah)
Primary Junior High Senior High School 1,864 2,771 3,612
Sub-district 57 0 0
District 170 153 125
Province 159 141 117
Central Government 54 376 261 Total 2,304 3,441 4,115
Source: Ghozali 2005 Bab 5 Hasil dan Pembahasan, p. 83. Inflation rate 2005=10.5 percent 2006= 12.8 percent.
Limitations and Future Research It is important to note that several other studies in education social rates of return report rates of return of significantly different magnitudes. A recent study UNESCO (2007), for example, reports returns for primary education in the range of 27 percent in rural areas, and 5 percent, in urban areas. Several studies report rates of return that include only the private market returns to education in the form of "increased earnings". These estimations involve the fitting of a semi-log ordinary least squares regression using the natural logarithm of earnings as the dependent variable, and years of schooling and potential years of labor market experience and its square as independent variables. Authors often label these coefficients “returns to education,” whereas these are "marginal wage effects", not rates of return to investment in education. “The “returns” notion necessitates taking into account the cost of education, both private and public, and relating this cost to the wage effect (Psacharopoulos 1994, p. 1326). The figures reported in this estimation do not include non-market benefits (effects on health, life expectancy, population growth, etc) or externality feedback effects (the additional economic benefits from the initial education outcomes, such as the effects of education on the economy through democratization, political stability, etc.). Both of these are without doubt part of the social benefits. As pointed out by Mc Mahon (2006) “the value of additional non-market benefits is estimated by Wolfe and Zuvekas (1997) to be about equal in value to the market returns based on the cost of producing the same outcomes by alternative means.” This means that the rates of return estimated in this report could be considerably lower than the true total returns to economic development from investment in education. An additional point to note is that, the National Labor Survey reports earnings of organized labor markets. Some studies reveal the need to use real output (bushels of rice produced) to measure real income of farmers, as opposed to urban wages. Jamison, foe example, concludes that farm productivity increases in average by 7.4 percent as a result of a farmer completing elementary education which could considerably increase the rates of return.
Taking some of the considerations discussed above into account would scale up the education rates of return reported by a percentage dependant on the numbers of effects incorporated, the methodology employed, and the assumptions made. The estimations presented herein result from a methodology that includes private and public costs of education, following the "elaborated" methodology described in Psacharopoulos (1994), and employed by McMahon and Boediono (1992). The team that conducted this report did not extend the scope of the basic methodology, but have marked such type of exercises as part of an agenda for future research.
40
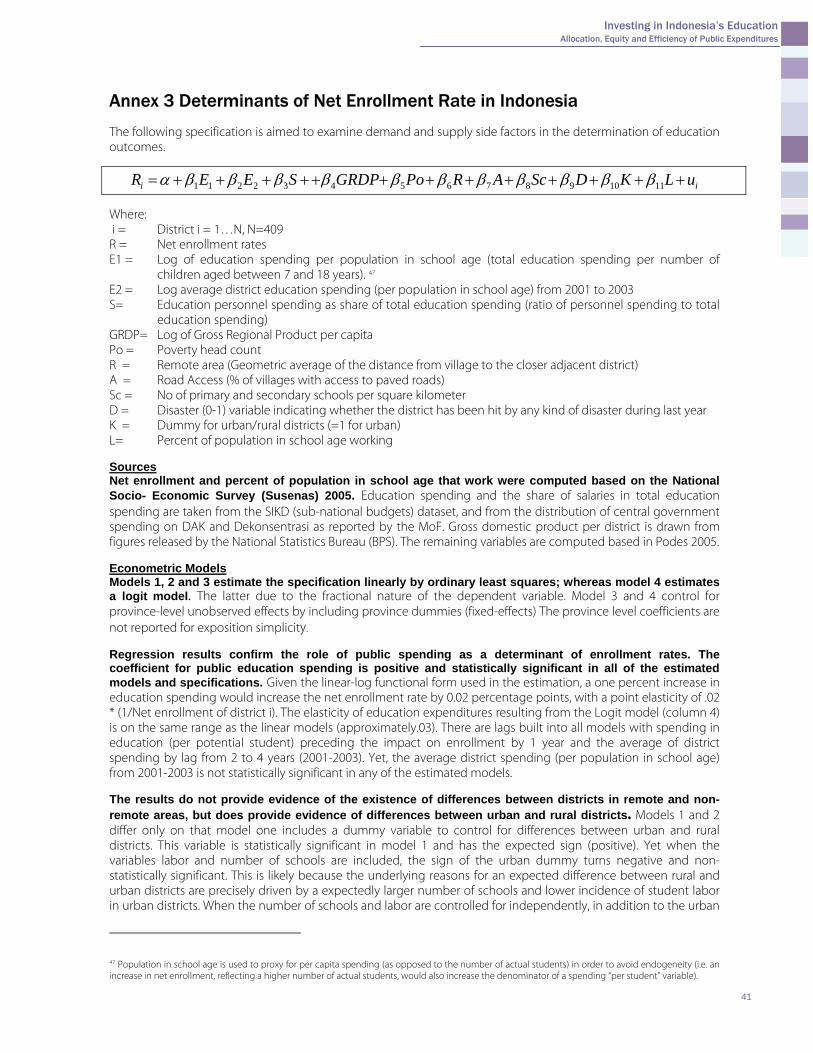
Investing in Indonesia’s Education Allocation, Equity and Efficiency of Public Expenditures
Annex 3 Determinants of Net Enrollment Rate in Indonesia The following specification is aimed to examine demand and supply side factors in the determination of education outcomes.
ii uLKDScARPoGRDPSEER +++++++++++++= 111098765432211 βββββββββββα Where: i = District i = 1…N, N=409 R = Net enrollment rates E1 = Log of education spending per population in school age (total education spending per number of
children aged between 7 and 18 years). 47 E2 = Log average district education spending (per population in school age) from 2001 to 2003 S= Education personnel spending as share of total education spending (ratio of personnel spending to total
education spending) GRDP= Log of Gross Regional Product per capita Po = Poverty head count R = Remote area (Geometric average of the distance from village to the closer adjacent district) A = Road Access (% of villages with access to paved roads) Sc = No of primary and secondary schools per square kilometer D = Disaster (0-1) variable indicating whether the district has been hit by any kind of disaster during last year K = Dummy for urban/rural districts (=1 for urban) L= Percent of population in school age working Sources Net enrollment and percent of population in school age that work were computed based on the National Socio- Economic Survey (Susenas) 2005. Education spending and the share of salaries in total education spending are taken from the SIKD (sub-national budgets) dataset, and from the distribution of central government spending on DAK and Dekonsentrasi as reported by the MoF. Gross domestic product per district is drawn from figures released by the National Statistics Bureau (BPS). The remaining variables are computed based in Podes 2005. Econometric Models Models 1, 2 and 3 estimate the specification linearly by ordinary least squares; whereas model 4 estimates a logit model. The latter due to the fractional nature of the dependent variable. Model 3 and 4 control for province-level unobserved effects by including province dummies (fixed-effects) The province level coefficients are not reported for exposition simplicity. Regression results confirm the role of public spending as a determinant of enrollment rates. The coefficient for public education spending is positive and statistically significant in all of the estimated models and specifications. Given the linear-log functional form used in the estimation, a one percent increase in education spending would increase the net enrollment rate by 0.02 percentage points, with a point elasticity of .02 * (1/Net enrollment of district i). The elasticity of education expenditures resulting from the Logit model (column 4) is on the same range as the linear models (approximately.03). There are lags built into all models with spending in education (per potential student) preceding the impact on enrollment by 1 year and the average of district spending by lag from 2 to 4 years (2001-2003). Yet, the average district spending (per population in school age) from 2001-2003 is not statistically significant in any of the estimated models. The results do not provide evidence of the existence of differences between districts in remote and non-remote areas, but does provide evidence of differences between urban and rural districts. Models 1 and 2 differ only on that model one includes a dummy variable to control for differences between urban and rural districts. This variable is statistically significant in model 1 and has the expected sign (positive). Yet when the variables labor and number of schools are included, the sign of the urban dummy turns negative and non-statistically significant. This is likely because the underlying reasons for an expected difference between rural and urban districts are precisely driven by a expectedly larger number of schools and lower incidence of student labor in urban districts. When the number of schools and labor are controlled for independently, in addition to the urban
47 Population in school age is used to proxy for per capita spending (as opposed to the number of actual students) in order to avoid endogeneity (i.e. an increase in net enrollment, reflecting a higher number of actual students, would also increase the denominator of a spending “per student” variable).
41
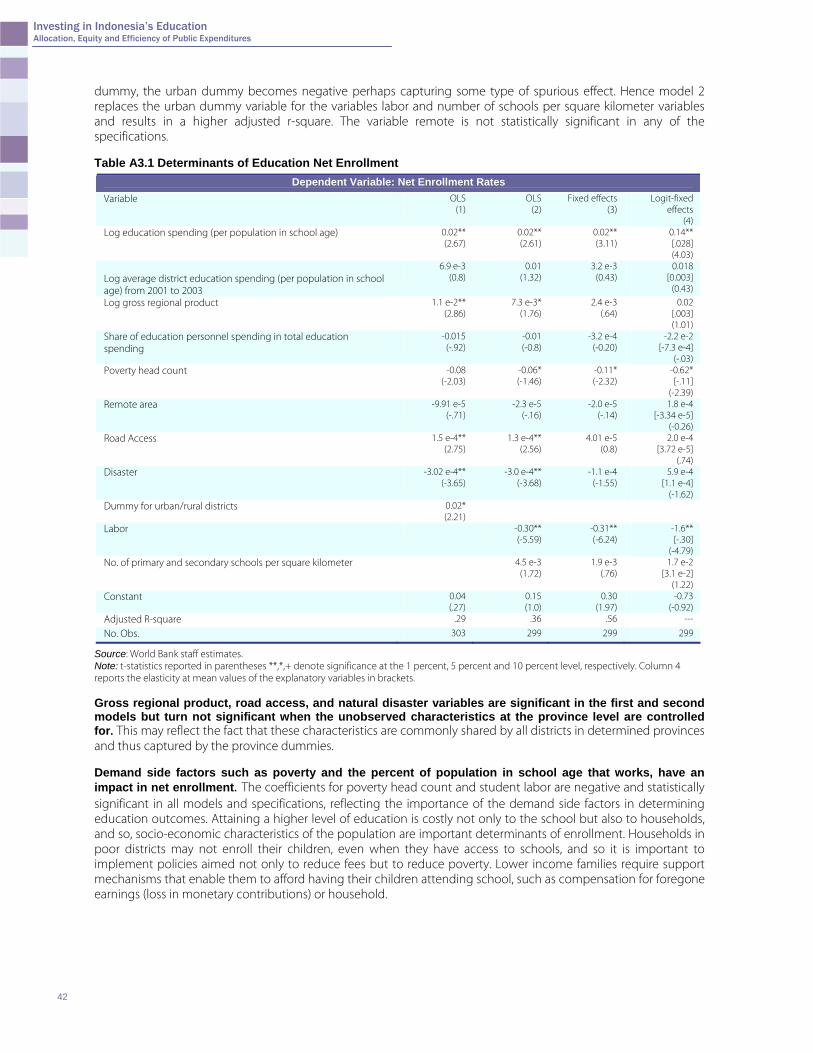
Investing in Indonesia’s Education Allocation, Equity and Efficiency of Public Expenditures
dummy, the urban dummy becomes negative perhaps capturing some type of spurious effect. Hence model 2 replaces the urban dummy variable for the variables labor and number of schools per square kilometer variables and results in a higher adjusted r-square. The variable remote is not statistically significant in any of the specifications. Table A3.1 Determinants of Education Net Enrollment
Dependent Variable: Net Enrollment Rates Variable OLS
(1) OLS
(2) Fixed effects
(3) Logit-fixed
effects (4)
Log education spending (per population in school age) 0.02** (2.67)
0.02** (2.61)
0.02** (3.11)
0.14** [.028] (4.03)
Log average district education spending (per population in school age) from 2001 to 2003
6.9 e-3 (0.8)
0.01 (1.32)
3.2 e-3 (0.43)
0.018 [0.003]
(0.43)
Log gross regional product 1.1 e-2** (2.86)
7.3 e-3* (1.76)
2.4 e-3 (.64)
0.02 [.003] (1.01)
Share of education personnel spending in total education spending
-0.015 (-.92)
-0.01 (-0.8)
-3.2 e-4 (-0.20)
-2.2 e-2 [-7.3 e-4]
(-.03) Poverty head count -0.08
(-2.03) -0.06* (-1.46)
-0.11* (-2.32)
-0.62* [-.11]
(-2.39) Remote area -9.91 e-5
(-.71) -2.3 e-5
(-.16) -2.0 e-5
(-.14)
1.8 e-4 [-3.34 e-5]
(-0.26) Road Access 1.5 e-4**
(2.75) 1.3 e-4**
(2.56) 4.01 e-5
(0.8) 2.0 e-4
[3.72 e-5] (.74)
Disaster -3.02 e-4** (-3.65)
-3.0 e-4** (-3.68)
-1.1 e-4 (-1.55)
5.9 e-4 [1.1 e-4]
(-1.62) Dummy for urban/rural districts 0.02*
(2.21)
Labor -0.30** (-5.59)
-0.31** (-6.24)
-1.6** [-.30]
(-4.79) No. of primary and secondary schools per square kilometer 4.5 e-3
(1.72) 1.9 e-3
(.76) 1.7 e-2
[3.1 e-2] (1.22)
Constant 0.04 (.27)
0.15 (1.0)
0.30 (1.97)
-0.73 (-0.92)
Adjusted R-square .29 .36 .56 ---
No. Obs. 303 299 299 299
Source: World Bank staff estimates. Note: t-statistics reported in parentheses **,*,+ denote significance at the 1 percent, 5 percent and 10 percent level, respectively. Column 4 reports the elasticity at mean values of the explanatory variables in brackets. Gross regional product, road access, and natural disaster variables are significant in the first and second models but turn not significant when the unobserved characteristics at the province level are controlled for. This may reflect the fact that these characteristics are commonly shared by all districts in determined provinces and thus captured by the province dummies. Demand side factors such as poverty and the percent of population in school age that works, have an impact in net enrollment. The coefficients for poverty head count and student labor are negative and statistically significant in all models and specifications, reflecting the importance of the demand side factors in determining education outcomes. Attaining a higher level of education is costly not only to the school but also to households, and so, socio-economic characteristics of the population are important determinants of enrollment. Households in poor districts may not enroll their children, even when they have access to schools, and so it is important to implement policies aimed not only to reduce fees but to reduce poverty. Lower income families require support mechanisms that enable them to afford having their children attending school, such as compensation for foregone earnings (loss in monetary contributions) or household.
42
Investing in Indonesia’s Education Allocation, Equity and Efficiency of Public Expenditures
Annex 4 Estimating the Financial Implications of the New Teacher Law The new 2005 Teacher Law states that teachers will receive functional, special area, and professional incentives. Figure 4.3 attempts to demonstrate the impact of these incentives on the education budget. Calculations in this figure are based on the following assumptions:
• The special area allowance will be equal to the teacher’s base salary (2005 Teacher Law). It is assumed that the average salary is 18 million Rp per year and that, for the first two years, 5 percent of teachers will receive this allowance. Ten percent of teachers will receive the incentive by 2009, and this percentage will remain through 2016. (Some within MoNE argue that it should be 15 percent) The reason for a staggered increase is that the government most likely will phase in the designation of special area schools.
• The professional allowance will be given to teachers who pass a certification examination and will be equal to the teacher’s base salary (2005 Teacher Law). The calculation of the professional allowance is complex and requires many assumptions (including the number of teachers who will pass the certification examination, the average base salary of teachers who receive certification, and the rate of increase of teachers in the workforce). The estimate of teachers receiving the incentive for the first three years is based on MoNE targets: 5 percent of teachers will receive the allowance in 2007, 12 percent in 2008, and 20 percent in 2009. The incentive then is assumed to increase by 10 percent through 2016, so that by then 90 percent of teachers will receive the incentive. This target is optimistic. A more conservative estimate is 70 percent, which would reduce the overall expenditure on the professional incentive.
• The functional incentive was specified in an October 2006 version of the draft regulations was to be 50 percent of base salary and to be given to certified teachers. This has since been changed in a November 2006 version of the draft to not specify an amount, but to still be given to teachers who are certified. Still, there is debate on whether it should be given to all teachers or possibly be used as additional performance incentives for teachers. If the incentive is given to all teachers, it will have a significant immediate impact on the budget. If it is given to only certified teachers and only to those that meet certain performance requirements, then it will have a gradual effect (because no teachers are certified yet), but it will be much larger in the long-term.
• The number of teachers is estimated to stay constant. Although Indonesia’s teaching workforce has increased steadily in the past, there is now a large oversupply of teachers. The new incentives will push MoNE to be more efficient in its supply and distribution of teachers. The 2006 teacher regulations (RPP Guru) demonstrate that MoNE is serious about attempting to control the supply of teachers. There is also a slight bulge of teachers aged 50–60. The retirement of these teachers will help by not keeping the number of teachers constant or reducing the workforce. If the steady trend of increasing the number of teachers continues, it will increase the expenditure that goes toward teacher salaries and incentives.
• The forecast calculations are in real (rather than nominal) terms. Salaries and incentives are assumed to increase with the rate of inflation.
43
Investing in Indonesia’s Education Allocation, Equity and Efficiency of Public Expenditures
Annex 5 Methodological Note on the Computation of Unit Costs of Education (as reported by McMahon 2003) McMahon’s estimates, developed on a per-pupil basis, are based on the following assumptions among others:
• A recently conducted survey of schools provides data on what schools are actually spending. These data provided information on the current or base cost of schools.
• “Best practice” schools are defined as those that have experienced increases in their test scores. These schools have more books and teaching materials for every pupil, and salary supplements for teachers are larger. For example, in expenditure terms, the average school is estimated to spend Rp. 15,000 per pupil on teaching aids while the “best practice schools” spend an average of Rp. 21,745 per pupil.
• The corresponding cost estimate for junior secondary education is 1.5 times the cost estimate for primary education.
• To increase the enrollment rate of the poor and disadvantaged population requires additional resources, largely to eliminate fees. Currently, fees are charged for entrance, examinations; procurement of textbooks, notebooks, and school bags; and transport. At the primary level, eliminating fees means foregone revenues of an average of Rp. 13,000 per pupil in 2004 (2003 prices), increasing to Rp. 38,000 per pupil in 2008. At the junior secondary level, the amount is approximately Rp. 57,000 per pupil.
• In addition, a student grant of Rp. 290,000 per pupil per year for 18.2 percent of all primary school students, which is more than doubling the current grant by the government, will cover the opportunity costs borne by parents and for teacher supplements. The corresponding grant allocated to the school level is Rp. 93,000 per pupil per year. The BOS program has started to cover part of these costs in 2005.
44
Investing in Indonesia’s Education Allocation, Equity and Efficiency of Public Expenditures
Annex 6 Estimating the Financial Implications of Teacher Oversupply The teacher oversupply issue in Indonesia presents a system inefficiency and addressing the supply issue represents significant potential savings. The table below shows an estimate of the potential savings. The calculations are based on the following method and assumptions: • Only public school teachers are included, since this is the area government is financing and has control over.
Student data used in the calculations is also only for public schools. • Because 22 percent of public junior secondary teachers and 25 percent of public senior secondary teachers are
part-time, an adjustment is made so that two part-time teachers is equivalent to be one full-time teacher. (The number of part-time teachers in private schools is much higher, at 55 percent and 63 percent for junior and senior respectively).
• It is assumed that the average teacher salary is 17 million per year for primary teachers and 18 million for junior
and senior secondary teachers. • The proposed policy was applied on a school-by-school basis on a survey sample so that a realistic estimate of
the number of required teachers and level of teacher oversupply by school is determined. The resulting figures were then applied nationally, with weighting applied to schools by size.
• The effective STR is used in the calculations. There is a difference between proposed STR and effective STR. For
example, the primary STR used is 30:1, but when applying the formula of each school getting at least 4 teachers for each school and a target STR of 30:1, the effective STR is actually 26:1. This is because (1) a school with, say, 40 students, will still get 4 teachers and have an STR of 10:1 and (2) the additional teacher allocation is rounded up, so a school with, say, 160 students will get 6 teachers, for an STR of 27:1.
The formula for Junior Secondary and Senior Secondary teachers is complex because it currently requires that teachers be assigned to classes for specific subjects. For the purposes of analysis, an STR is applied with what would be more in line with other countries than Indonesia’s currently low STRs of 17:1 for Junior Secondary and 14:1 for Senior Secondary. Column A shows what the actual supply is. Column B shows what the STR would be if the proposed new entitlement formula is followed. In this scenario B, 22.8 percent fewer teachers are required (or 19.4 percent taking part-time into account). This would amount to a salary savings of approximately 6.7 trillion Rupiah. Taking part-time teachers into account (assuming 2 part-time = 1 full-time), the amount is reduced to 5.6 trillion Rupiah, which is still approximately 10 percent of the total education budget. This represents significant potential savings and would become even more significant with the impact of the new teacher law, where teachers who become certified will receive an allowance equivalent to their base salary. (See Teacher Salaries, Incentives, and Education Quality section in chapter 4)
45
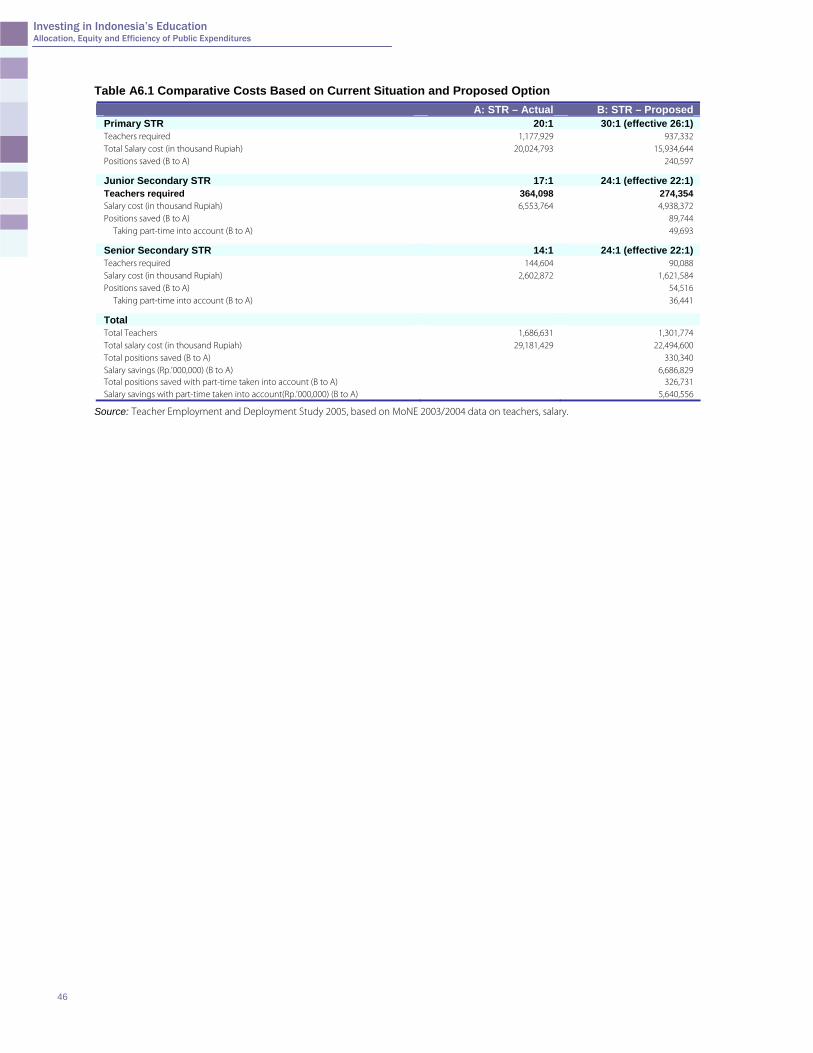
Investing in Indonesia’s Education Allocation, Equity and Efficiency of Public Expenditures
Table A6.1 Comparative Costs Based on Current Situation and Proposed Option
A: STR – Actual B: STR – Proposed Primary STR 20:1 30:1 (effective 26:1) Teachers required 1,177,929 937,332 Total Salary cost (in thousand Rupiah) 20,024,793 15,934,644 Positions saved (B to A) 240,597
Junior Secondary STR 17:1 24:1 (effective 22:1) Teachers required 364,098 274,354 Salary cost (in thousand Rupiah) 6,553,764 4,938,372 Positions saved (B to A) 89,744
Taking part-time into account (B to A) 49,693
Senior Secondary STR 14:1 24:1 (effective 22:1) Teachers required 144,604 90,088 Salary cost (in thousand Rupiah) 2,602,872 1,621,584 Positions saved (B to A) 54,516
Taking part-time into account (B to A) 36,441
Total Total Teachers 1,686,631 1,301,774 Total salary cost (in thousand Rupiah) 29,181,429 22,494,600 Total positions saved (B to A) 330,340 Salary savings (Rp.’000,000) (B to A) 6,686,829 Total positions saved with part-time taken into account (B to A) 326,731 Salary savings with part-time taken into account(Rp.’000,000) (B to A) 5,640,556
Source: Teacher Employment and Deployment Study 2005, based on MoNE 2003/2004 data on teachers, salary.
46
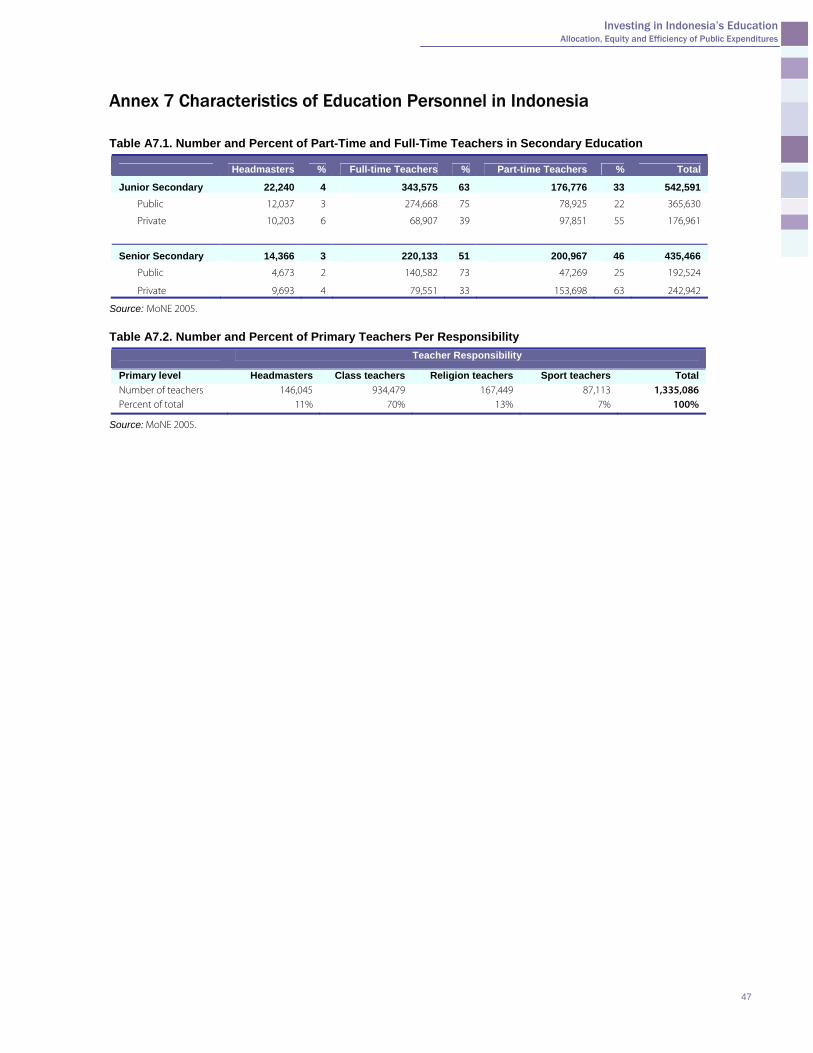
Investing in Indonesia’s Education Allocation, Equity and Efficiency of Public Expenditures
Annex 7 Characteristics of Education Personnel in Indonesia Table A7.1. Number and Percent of Part-Time and Full-Time Teachers in Secondary Education
Headmasters % Full-time Teachers % Part-time Teachers % Total
Junior Secondary 22,240 4 343,575 63 176,776 33 542,591 Public 12,037 3 274,668 75 78,925 22 365,630
Private 10,203 6 68,907 39 97,851 55 176,961
Senior Secondary 14,366 3 220,133 51 200,967 46 435,466 Public 4,673 2 140,582 73 47,269 25 192,524
Private 9,693 4 79,551 33 153,698 63 242,942
Source: MoNE 2005. Table A7.2. Number and Percent of Primary Teachers Per Responsibility
Teacher Responsibility
Primary level Headmasters Class teachers Religion teachers Sport teachers Total Number of teachers 146,045 934,479 167,449 87,113 1,335,086 Percent of total 11% 70% 13% 7% 100%
Source: MoNE 2005.
47
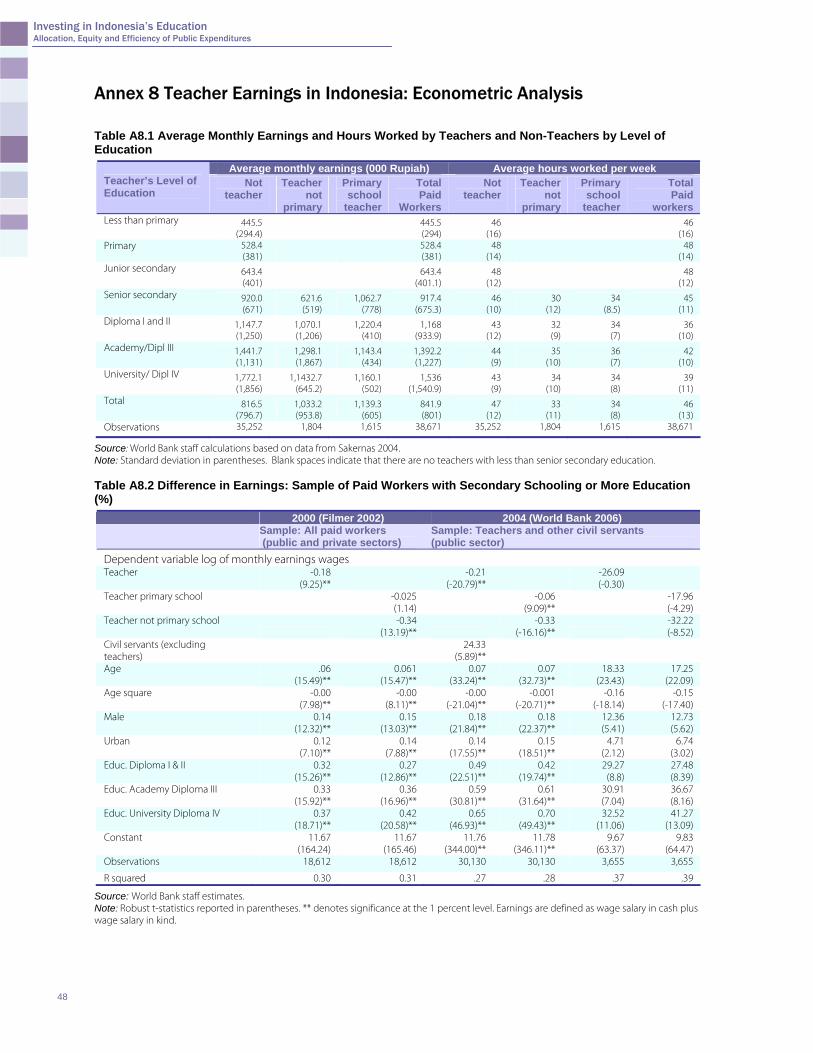
Investing in Indonesia’s Education Allocation, Equity and Efficiency of Public Expenditures
Annex 8 Teacher Earnings in Indonesia: Econometric Analysis Table A8.1 Average Monthly Earnings and Hours Worked by Teachers and Non-Teachers by Level of Education
Average monthly earnings (000 Rupiah) Average hours worked per week Teacher’s Level of Education
Not teacher
Teacher not
primary
Primary school
teacher
Total Paid
Workers
Not teacher
Teacher not
primary
Primary school
teacher
Total Paid
workers Less than primary 445.5
(294.4) 445.5 (294)
46 (16)
46 (16)
Primary 528.4 (381)
528.4 (381)
48 (14)
48 (14)
Junior secondary 643.4 (401)
643.4 (401.1)
48 (12)
48 (12)
Senior secondary 920.0 (671)
621.6 (519)
1,062.7 (778)
917.4 (675.3)
46 (10)
30 (12)
34 (8.5)
45 (11)
Diploma I and II 1,147.7 (1,250)
1,070.1 (1,206)
1,220.4 (410)
1,168 (933.9)
43 (12)
32 (9)
34 (7)
36 (10)
Academy/Dipl III 1,441.7 (1,131)
1,298.1 (1,867)
1,143.4 (434)
1,392.2 (1,227)
44 (9)
35 (10)
36 (7)
42 (10)
University/ Dipl IV 1,772.1 (1,856)
1,1432.7 (645.2)
1,160.1 (502)
1,536 (1,540.9)
43 (9)
34 (10)
34 (8)
39 (11)
Total 816.5 (796.7)
1,033.2 (953.8)
1,139.3 (605)
841.9 (801)
47 (12)
33 (11)
34 (8)
46 (13)
Observations 35,252 1,804 1,615 38,671 35,252 1,804 1,615 38,671
Source: World Bank staff calculations based on data from Sakernas 2004. Note: Standard deviation in parentheses. Blank spaces indicate that there are no teachers with less than senior secondary education. Table A8.2 Difference in Earnings: Sample of Paid Workers with Secondary Schooling or More Education (%)
2000 (Filmer 2002) 2004 (World Bank 2006) Sample: All paid workers
(public and private sectors) Sample: Teachers and other civil servants (public sector)
Dependent variable log of monthly earnings wages Teacher -0.18
(9.25)** -0.21
(-20.79)** -26.09 (-0.30)
Teacher primary school
-0.025 (1.14)
-0.06 (9.09)**
-17.96 (-4.29)
Teacher not primary school
-0.34 (13.19)**
-0.33 (-16.16)**
-32.22 (-8.52)
Civil servants (excluding teachers)
24.33 (5.89)**
Age .06 (15.49)**
0.061 (15.47)**
0.07 (33.24)**
0.07 (32.73)**
18.33 (23.43)
17.25 (22.09)
Age square -0.00 (7.98)**
-0.00 (8.11)**
-0.00 (-21.04)**
-0.001 (-20.71)**
-0.16 (-18.14)
-0.15 (-17.40)
Male 0.14 (12.32)**
0.15 (13.03)**
0.18 (21.84)**
0.18 (22.37)**
12.36 (5.41)
12.73 (5.62)
Urban 0.12 (7.10)**
0.14 (7.88)**
0.14 (17.55)**
0.15 (18.51)**
4.71 (2.12)
6.74 (3.02)
Educ. Diploma I & II 0.32 (15.26)**
0.27 (12.86)**
0.49 (22.51)**
0.42 (19.74)**
29.27 (8.8)
27.48 (8.39)
Educ. Academy Diploma III 0.33 (15.92)**
0.36 (16.96)**
0.59 (30.81)**
0.61 (31.64)**
30.91 (7.04)
36.67 (8.16)
Educ. University Diploma IV 0.37 (18.71)**
0.42 (20.58)**
0.65 (46.93)**
0.70 (49.43)**
32.52 (11.06)
41.27 (13.09)
Constant 11.67 (164.24)
11.67 (165.46)
11.76 (344.00)**
11.78 (346.11)**
9.67 (63.37)
9.83 (64.47)
Observations 18,612 18,612 30,130 30,130 3,655 3,655
R squared 0.30 0.31 .27 .28 .37 .39
Source: World Bank staff estimates. Note: Robust t-statistics reported in parentheses. ** denotes significance at the 1 percent level. Earnings are defined as wage salary in cash plus wage salary in kind.
48
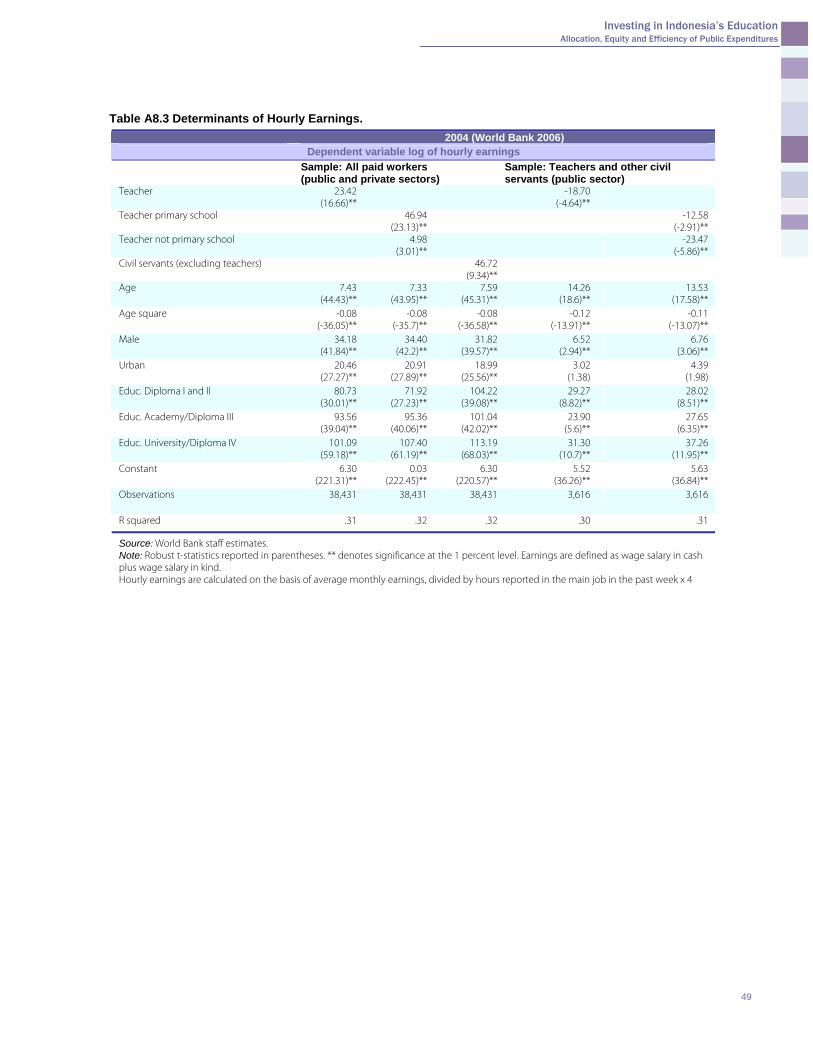
Investing in Indonesia’s Education Allocation, Equity and Efficiency of Public Expenditures
Table A8.3 Determinants of Hourly Earnings. 2004 (World Bank 2006)
Dependent variable log of hourly earnings Sample: All paid workers
(public and private sectors) Sample: Teachers and other civil servants (public sector)
Teacher 23.42 (16.66)**
-18.70 (-4.64)**
Teacher primary school 46.94 (23.13)**
-12.58 (-2.91)**
Teacher not primary school 4.98 (3.01)**
-23.47 (-5.86)**
Civil servants (excluding teachers) 46.72 (9.34)**
Age 7.43 (44.43)**
7.33 (43.95)**
7.59 (45.31)**
14.26 (18.6)**
13.53 (17.58)**
Age square -0.08 (-36.05)**
-0.08 (-35.7)**
-0.08 (-36.58)**
-0.12 (-13.91)**
-0.11 (-13.07)**
Male 34.18 (41.84)**
34.40 (42.2)**
31.82 (39.57)**
6.52 (2.94)**
6.76 (3.06)**
Urban 20.46 (27.27)**
20.91 (27.89)**
18.99 (25.56)**
3.02 (1.38)
4.39 (1.98)
Educ. Diploma I and II 80.73 (30.01)**
71.92 (27.23)**
104.22 (39.08)**
29.27 (8.82)**
28.02 (8.51)**
Educ. Academy/Diploma III 93.56 (39.04)**
95.36 (40.06)**
101.04 (42.02)**
23.90 (5.6)**
27.65 (6.35)**
Educ. University/Diploma IV 101.09 (59.18)**
107.40 (61.19)**
113.19 (68.03)**
31.30 (10.7)**
37.26 (11.95)**
Constant 6.30 (221.31)**
0.03 (222.45)**
6.30 (220.57)**
5.52 (36.26)**
5.63 (36.84)**
Observations 38,431 38,431 38,431 3,616 3,616
R squared .31 .32 .32 .30 .31
Source: World Bank staff estimates. Note: Robust t-statistics reported in parentheses. ** denotes significance at the 1 percent level. Earnings are defined as wage salary in cash plus wage salary in kind. Hourly earnings are calculated on the basis of average monthly earnings, divided by hours reported in the main job in the past week x 4
49
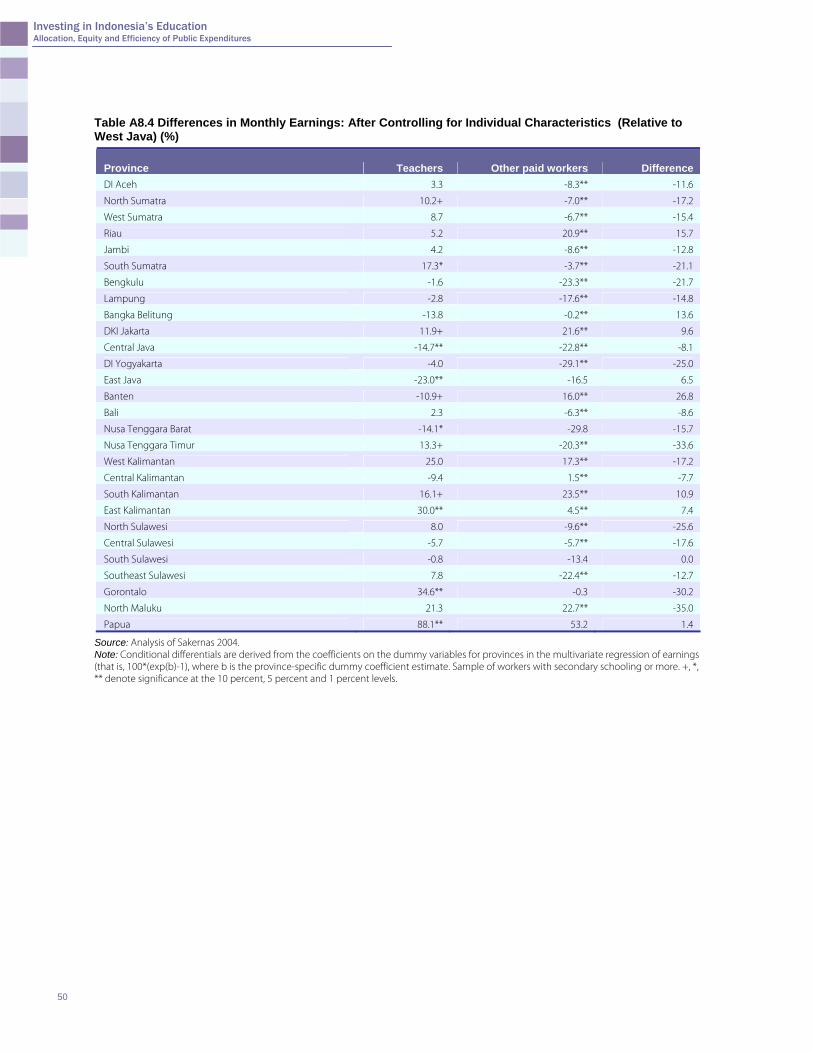
Investing in Indonesia’s Education Allocation, Equity and Efficiency of Public Expenditures
Table A8.4 Differences in Monthly Earnings: After Controlling for Individual Characteristics (Relative to West Java) (%)
Province Teachers Other paid workers Difference DI Aceh 3.3 -8.3** -11.6
North Sumatra 10.2+ -7.0** -17.2
West Sumatra 8.7 -6.7** -15.4
Riau 5.2 20.9** 15.7
Jambi 4.2 -8.6** -12.8
South Sumatra 17.3* -3.7** -21.1
Bengkulu -1.6 -23.3** -21.7
Lampung -2.8 -17.6** -14.8
Bangka Belitung -13.8 -0.2** 13.6
DKI Jakarta 11.9+ 21.6** 9.6
Central Java -14.7** -22.8** -8.1
DI Yogyakarta -4.0 -29.1** -25.0
East Java -23.0** -16.5 6.5
Banten -10.9+ 16.0** 26.8
Bali 2.3 -6.3** -8.6
Nusa Tenggara Barat -14.1* -29.8 -15.7
Nusa Tenggara Timur 13.3+ -20.3** -33.6
West Kalimantan 25.0 17.3** -17.2
Central Kalimantan -9.4 1.5** -7.7
South Kalimantan 16.1+ 23.5** 10.9
East Kalimantan 30.0** 4.5** 7.4
North Sulawesi 8.0 -9.6** -25.6
Central Sulawesi -5.7 -5.7** -17.6
South Sulawesi -0.8 -13.4 0.0
Southeast Sulawesi 7.8 -22.4** -12.7
Gorontalo 34.6** -0.3 -30.2
North Maluku 21.3 22.7** -35.0
Papua 88.1** 53.2 1.4
Source: Analysis of Sakernas 2004. Note: Conditional differentials are derived from the coefficients on the dummy variables for provinces in the multivariate regression of earnings (that is, 100*(exp(b)-1), where b is the province-specific dummy coefficient estimate. Sample of workers with secondary schooling or more. +, *, ** denote significance at the 10 percent, 5 percent and 1 percent levels.
50
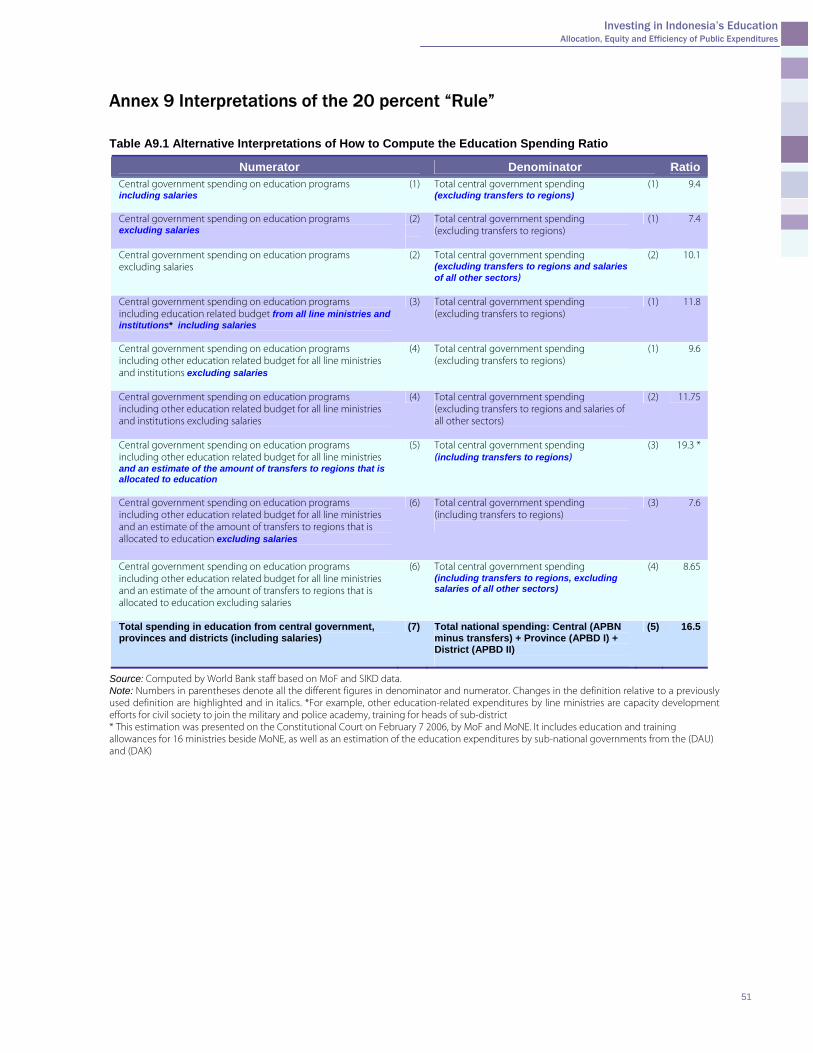
Investing in Indonesia’s Education Allocation, Equity and Efficiency of Public Expenditures
Annex 9 Interpretations of the 20 percent “Rule” Table A9.1 Alternative Interpretations of How to Compute the Education Spending Ratio
Numerator Denominator Ratio Central government spending on education programs including salaries
(1) Total central government spending (excluding transfers to regions)
(1) 9.4
Central government spending on education programs excluding salaries
(2)
Total central government spending (excluding transfers to regions)
(1) 7.4
Central government spending on education programs excluding salaries
(2) Total central government spending (excluding transfers to regions and salaries of all other sectors)
(2) 10.1
Central government spending on education programs including education related budget from all line ministries and institutions* including salaries
(3) Total central government spending (excluding transfers to regions)
(1) 11.8
Central government spending on education programs including other education related budget for all line ministries and institutions excluding salaries
(4) Total central government spending (excluding transfers to regions)
(1) 9.6
Central government spending on education programs including other education related budget for all line ministries and institutions excluding salaries
(4) Total central government spending (excluding transfers to regions and salaries of all other sectors)
(2) 11.75
Central government spending on education programs including other education related budget for all line ministries and an estimate of the amount of transfers to regions that is allocated to education
(5) Total central government spending (including transfers to regions)
(3) 19.3 *
Central government spending on education programs including other education related budget for all line ministries and an estimate of the amount of transfers to regions that is allocated to education excluding salaries
(6) Total central government spending (including transfers to regions)
(3) 7.6
Central government spending on education programs including other education related budget for all line ministries and an estimate of the amount of transfers to regions that is allocated to education excluding salaries
(6) Total central government spending (including transfers to regions, excluding salaries of all other sectors)
(4) 8.65
Total spending in education from central government, provinces and districts (including salaries)
(7) Total national spending: Central (APBN minus transfers) + Province (APBD I) + District (APBD II)
(5) 16.5
Source: Computed by World Bank staff based on MoF and SIKD data. Note: Numbers in parentheses denote all the different figures in denominator and numerator. Changes in the definition relative to a previously used definition are highlighted and in italics. *For example, other education-related expenditures by line ministries are capacity development efforts for civil society to join the military and police academy, training for heads of sub-district * This estimation was presented on the Constitutional Court on February 7 2006, by MoF and MoNE. It includes education and training allowances for 16 ministries beside MoNE, as well as an estimation of the education expenditures by sub-national governments from the (DAU) and (DAK)
51
Investing in Indonesia’s Education Allocation, Equity and Efficiency of Public Expenditures
REFERENCES Arze, del Granado F. Javier, Martinez-Vazquez, Jorge, and Robert McNab. 2005. Fiscal Decentralization and The Functional Composition of Public Expenditures. International Studies Program Working Paper Series 0501, Andrew Young School of Policy Studies, Georgia State University. Atlanta. Baqir, Reza. 2002. Social Sector Spending in a Panel of Countries. International Monetary Fund, Working Paper WP/02/35. Washington, DC: International Monetary Fund. Chaudhury, Nazmul, Jeffrey Hammer, Michael Kremer, Karthik Muralidharan, and F. Halsey Rogers. 2005. Missing in Action: Teacher and Health Worker Absence in Developing Countries. Washington, DC: World Bank. Dabla-Norris, E. and J. Matovu. 2002. Composition of Government Expenditures and Demand for Education in Developing Countries. International Monetary Fund, Working Paper WP/02/78. Washington, DC: International Monetary Fund Filmer, Deon. 2004. Teacher pay in Indonesia. Unpublished paper. Washington, DC: World Bank. Filmer, Deon and David Landauer. 2000. Does Indonesia have a ‘Low Pay’ Civil Service? Unpublished paper. Washington, DC: World Bank. Ghozali, Abbas. 2005. Educational Cost and Finance in Indonesia. Jakarta. Ghozali, Abbas. 2005. Analisis Biaya Satuan Pendidikan Dasar dan Menengah. Jakarta: Departemen Pendidikan Nasional. Kaiser, Kai and Suharnoko, Bambang. 2005. Design and Political Trade Offs in Financing Indonesia’s Regions: The Case of Indonesia’s General Allocation Grant (DAU). Washington, DC: World Bank. McMahon, Walter W. and Boediono. 1992. Universal Basic Education: an Overall Strategy of Investment Priorities for Economic Growth. Economics of Education Review, Vol 11, No.2, pp 137-151.Jakarta: Ministry of National Education. McMahon, Walter. 2001. Improving Education Finance in Indonesia. Policy Research Center, Institute for Research and Development, Ministry of National Education, UNICEF, and UNESCO. Jakarta: Ministry of National Education. McMahon, Walter. 2003. Financing and Achieving Education for All Goals, Ministry of National Education, Bappenas, the World Bank. Working paper. Jakarta: Ministry of National Education. McMahon, Walter and Elizabeth Appiah. 2001. The Social benefits of Education in Indonesian Communities. In: “Improving Education Finance in Indonesia”. Eds. McMahon, Suwaryani, and Boediono. Jakarta: Ministry of Education. Ministry of National Education. 2005. BOS Program Guidelines. Jakarta:Ministry of National Education. Ministry of National Education. 2005. Educational Indicators in Brief 2004-2005. Jakarta: Ministry of National Education. Mullis, Ina V.S., Michael O. Martin, Pierre Foy. 2005. IEA’s TIMSS 2003 International Report on Achievement in the Mathematics Cognitive Domains, International Association for the Evaluation of Educational Achievement. Boston: TIMSS and PIRLS International Study Center, Lynch School of Education, Boston College. OECD. 2004. Learning for Tomorrow’s World: First Results from PISA 2003, Programme for International Student Assessment. Paris: Organization for Economic Co-operation and Development. OECD. 2000. Financing Education – Investments and Returns. Paris: Organization for Economic Co-operation and Development.
52
Investing in Indonesia’s Education Allocation, Equity and Efficiency of Public Expenditures
Policy Research Center, Institute for Research and Development, MONE, and UNICEF and UNESCO (forthcoming). Improving Education Finance in Indonesia, by Walter W. McMahon, Nanik Suwaryani, and Boediono. Jakarta: Ministry of National Education. Psacharopoulos, George. 1994. Returns to Investment in Education and Global Update. World Development 22 (9), 1325-1343. UNESCO-UIS/OECD. 2005. Education Trends in Perspective - Analysis of the World Education Indicators. Paris. Verbina, Inna, and Abdur Chowdhury. 2002. What determines public education expenditures in a transition economy? World Bank. 2005. Education in Indonesia Managing the Transition to Decentralization. Human Development Sector Reports East Asia and the Pacific Region. Washington, DC: World Bank. World Bank. 2006. Potential for significant equity, efficiency and quality improvement: Teacher employment and deployment in Indonesia. Jakarta: World Bank. World Bank. 2006. Making the New Indonesia Work for The Poor. Jakarta: World Bank. World Bank. 2007. Forthcoming. Spending for Development: Making the Most of Indonesia’s New Opportunities. Jakarta: World Bank.
53