Embed Size (px)
Citation preview
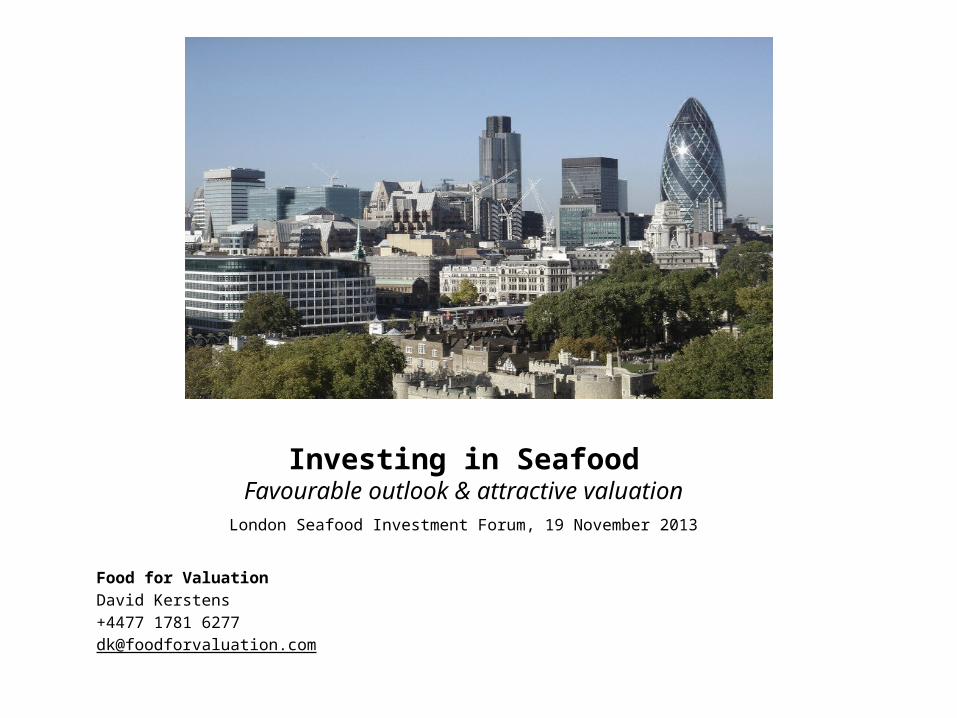
Investing in SeafoodFavourable outlook & attractive valuation
Food for ValuationDavid Kerstens+4477 1781 [email protected]
London Seafood Investment Forum, 19 November 2013
Agenda
Overview publicly listed seafood sector Company rankings Favourable outlook Attractive valuation Risk factors
Q&A
Food for Valuation 2
Overview publicly listed seafood sector
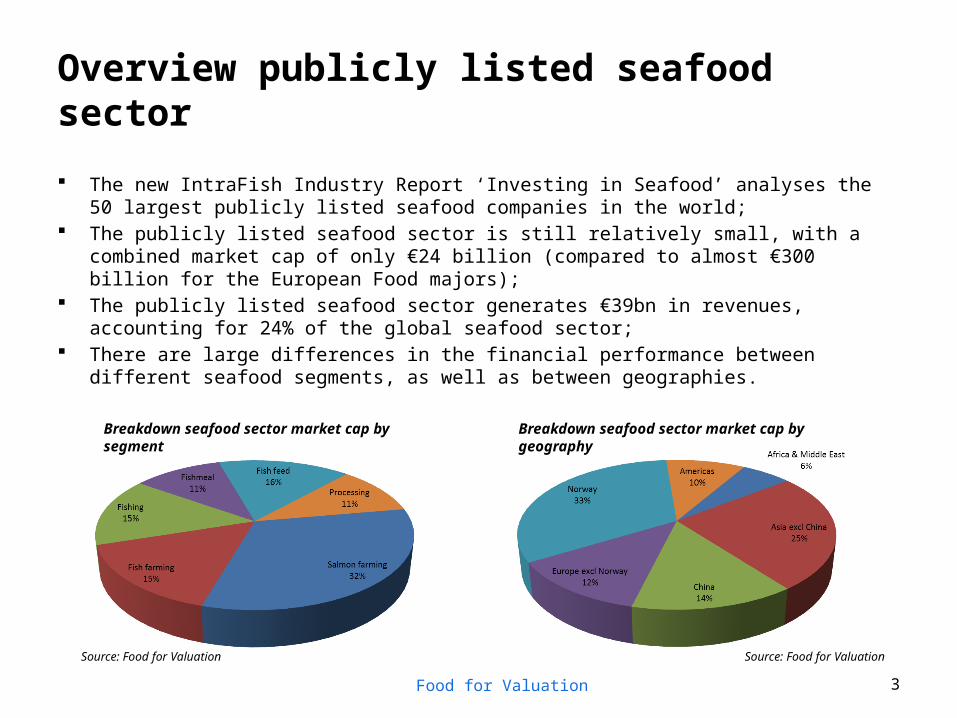
The new IntraFish Industry Report ‘Investing in Seafood’ analyses the 50 largest publicly listed seafood companies in the world;
The publicly listed seafood sector is still relatively small, with a combined market cap of only €24 billion (compared to almost €300 billion for the European Food majors);
The publicly listed seafood sector generates €39bn in revenues, accounting for 24% of the global seafood sector;
There are large differences in the financial performance between different seafood segments, as well as between geographies.
Food for Valuation 3
Breakdown seafood sector market cap by segment Breakdown seafood sector market cap by geography
Source: Food for Valuation Source: Food for Valuation
Company rankings
Food for Valuation 4
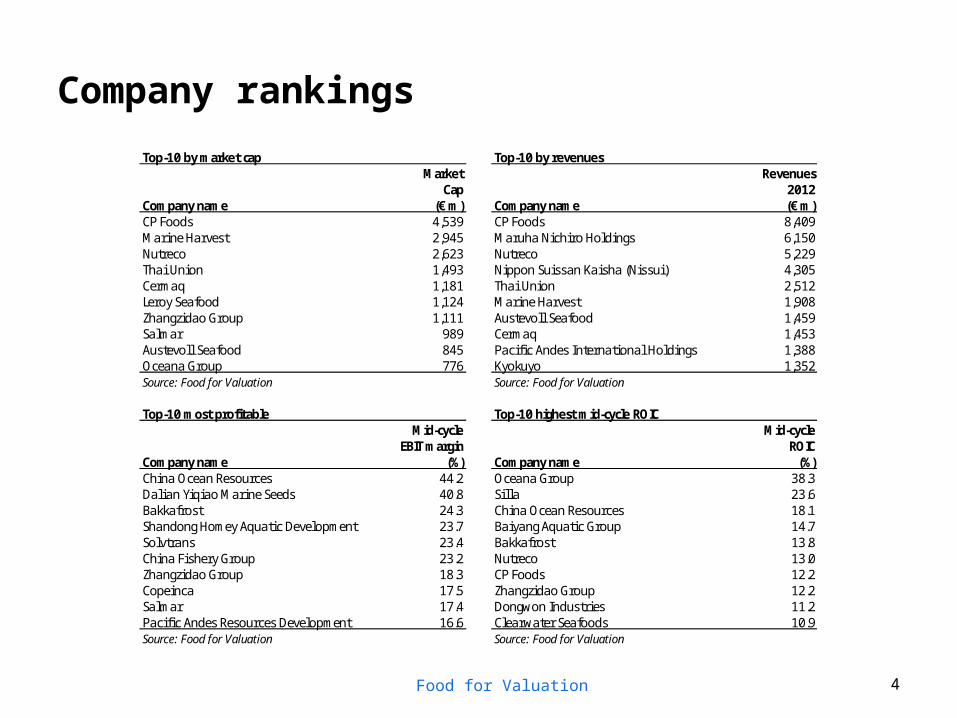
Top-10 by market cap Top-10 by revenuesMarket Revenues
Cap 2012Company name (€ m) Company name (€ m)CP Foods 4,539 CP Foods 8,409Marine Harvest 2,945 Maruha Nichiro Holdings 6,150Nutreco 2,623 Nutreco 5,229Thai Union 1,493 Nippon Suissan Kaisha (Nissui) 4,305Cermaq 1,181 Thai Union 2,512Leroy Seafood 1,124 Marine Harvest 1,908Zhangzidao Group 1,111 Austevoll Seafood 1,459Salmar 989 Cermaq 1,453Austevoll Seafood 845 Pacific Andes International Holdings 1,388Oceana Group 776 Kyokuyo 1,352Source: Food for Valuation Source: Food for Valuation
Top-10 most profitable Top-10 highest mid-cycle ROICMid-cycle Mid-cycle
EBIT margin ROICCompany name (%) Company name (%)China Ocean Resources 44.2 Oceana Group 38.3Dalian Yiqiao Marine Seeds 40.8 Sil la 23.6Bakkafrost 24.3 China Ocean Resources 18.1Shandong Homey Aquatic Development 23.7 Baiyang Aquatic Group 14.7Solvtrans 23.4 Bakkafrost 13.8China Fishery Group 23.2 Nutreco 13.0Zhangzidao Group 18.3 CP Foods 12.2Copeinca 17.5 Zhangzidao Group 12.2Salmar 17.4 Dongwon Industries 11.2Pacific Andes Resources Development 16.6 Clearwater Seafoods 10.9Source: Food for Valuation Source: Food for Valuation
Company rankings - continued
Food for Valuation 5
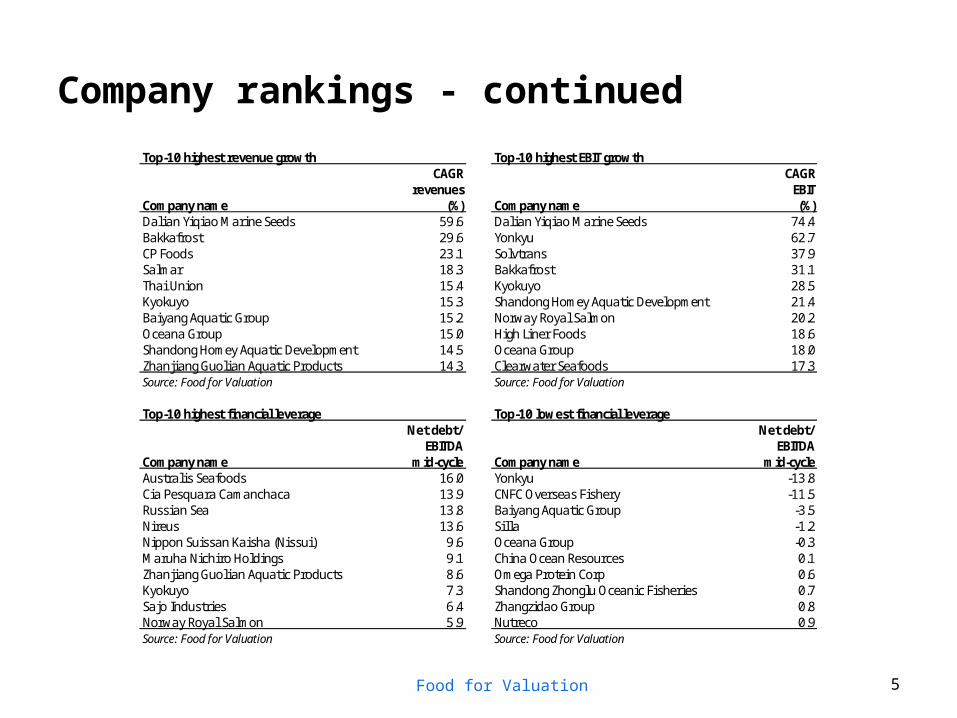
Top-10 highest revenue growth Top-10 highest EBIT growthCAGR CAGR
revenues EBITCompany name (%) Company name (%)Dalian Yiqiao Marine Seeds 59.6 Dalian Yiqiao Marine Seeds 74.4Bakkafrost 29.6 Yonkyu 62.7CP Foods 23.1 Solvtrans 37.9Salmar 18.3 Bakkafrost 31.1Thai Union 15.4 Kyokuyo 28.5Kyokuyo 15.3 Shandong Homey Aquatic Development 21.4Baiyang Aquatic Group 15.2 Norway Royal Salmon 20.2Oceana Group 15.0 High Liner Foods 18.6Shandong Homey Aquatic Development 14.5 Oceana Group 18.0Zhanjiang Guolian Aquatic Products 14.3 Clearwater Seafoods 17.3Source: Food for Valuation Source: Food for Valuation
Top-10 highest financial leverage Top-10 lowest financial leverageNet debt/ Net debt/
EBITDA EBITDACompany name mid-cycle Company name mid-cycleAustralis Seafoods 16.0 Yonkyu -13.8Cia Pesquara Camanchaca 13.9 CNFC Overseas Fishery -11.5Russian Sea 13.8 Baiyang Aquatic Group -3.5Nireus 13.6 Sil la -1.2Nippon Suissan Kaisha (Nissui) 9.6 Oceana Group -0.3Maruha Nichiro Holdings 9.1 China Ocean Resources 0.1Zhanjiang Guolian Aquatic Products 8.6 Omega Protein Corp 0.6Kyokuyo 7.3 Shandong Zhonglu Oceanic Fisheries 0.7Sajo Industries 6.4 Zhangzidao Group 0.8Norway Royal Salmon 5.9 Nutreco 0.9Source: Food for Valuation Source: Food for Valuation
Favourable outlook
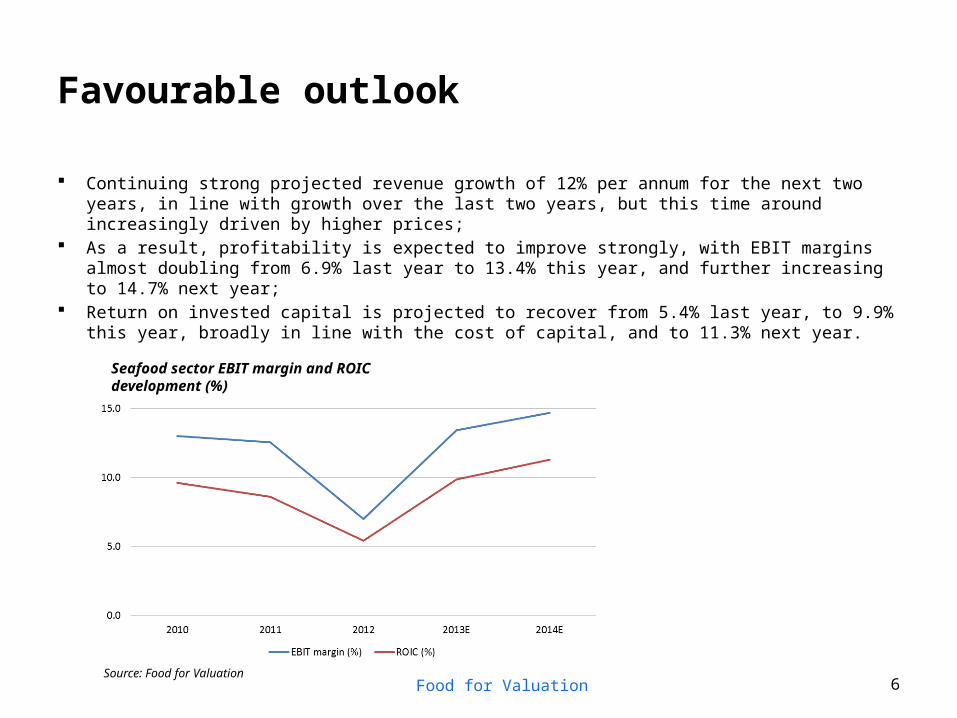
Continuing strong projected revenue growth of 12% per annum for the next two years, in line with growth over the last two years, but this time around increasingly driven by higher prices;
As a result, profitability is expected to improve strongly, with EBIT margins almost doubling from 6.9% last year to 13.4% this year, and further increasing to 14.7% next year;
Return on invested capital is projected to recover from 5.4% last year, to 9.9% this year, broadly in line with the cost of capital, and to 11.3% next year.
Food for Valuation 6
Seafood sector EBIT margin and ROIC development (%)
Source: Food for Valuation
Favourable outlook
Food for Valuation 7
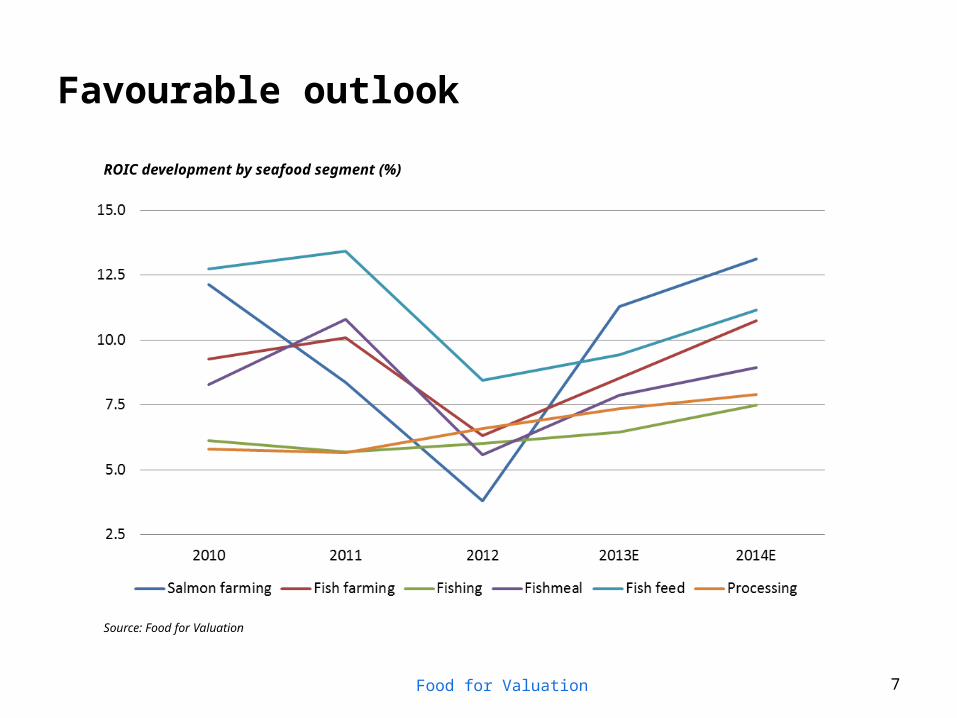
ROIC development by seafood segment (%)
Source: Food for Valuation
Valuation
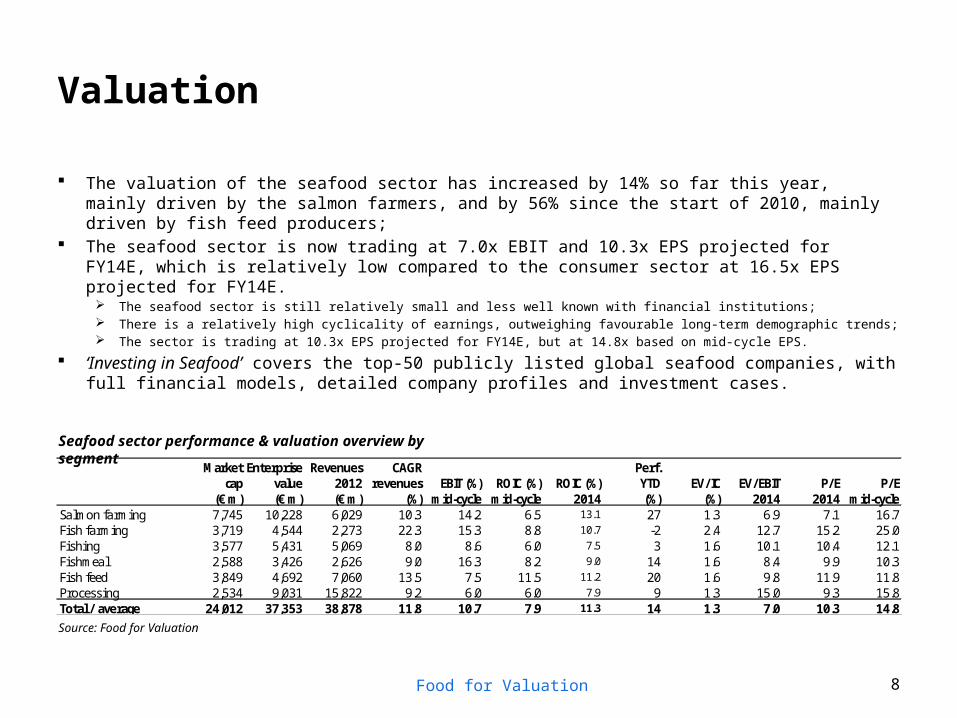
The valuation of the seafood sector has increased by 14% so far this year, mainly driven by the salmon farmers, and by 56% since the start of 2010, mainly driven by fish feed producers;
The seafood sector is now trading at 7.0x EBIT and 10.3x EPS projected for FY14E, which is relatively low compared to the consumer sector at 16.5x EPS projected for FY14E.
The seafood sector is still relatively small and less well known with financial institutions; There is a relatively high cyclicality of earnings, outweighing favourable long-term demographic trends; The sector is trading at 10.3x EPS projected for FY14E, but at 14.8x based on mid-cycle EPS.
‘Investing in Seafood’ covers the top-50 publicly listed global seafood companies, with full financial models, detailed company profiles and investment cases.
Food for Valuation 8
Market Enterprise Revenues CAGR Perf.cap value 2012 revenues EBIT (%) ROIC (%) ROIC (%) YTD EV/IC EV/EBIT P/E P/E
(€ m) (€ m) (€ m) (%) mid-cycle mid-cycle 2014 (%) (%) 2014 2014 mid-cycleSalmon farming 7,745 10,228 6,029 10.3 14.2 6.5 13.1 27 1.3 6.9 7.1 16.7Fish farming 3,719 4,544 2,273 22.3 15.3 8.8 10.7 -2 2.4 12.7 15.2 25.0Fishing 3,577 5,431 5,069 8.0 8.6 6.0 7.5 3 1.6 10.1 10.4 12.1Fishmeal 2,588 3,426 2,626 9.0 16.3 8.2 9.0 14 1.6 8.4 9.9 10.3Fish feed 3,849 4,692 7,060 13.5 7.5 11.5 11.2 20 1.6 9.8 11.9 11.8Processing 2,534 9,031 15,822 9.2 6.0 6.0 7.9 9 1.3 15.0 9.3 15.8Total / average 24,012 37,353 38,878 11.8 10.7 7.9 11.3 14 1.3 7.0 10.3 14.8
Seafood sector performance & valuation overview by segment
Source: Food for Valuation
Valuation - continued
Food for Valuation 9
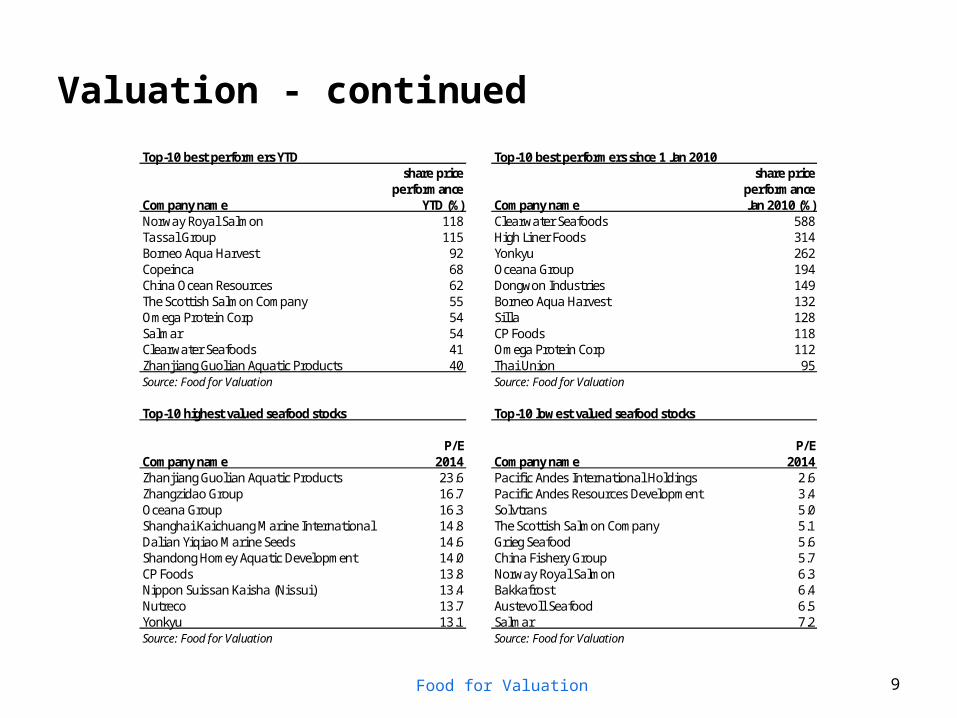
Top-10 best performers YTD Top-10 best performers since 1 Jan 2010share price share price
performance performanceCompany name YTD (%) Company name Jan 2010 (%)Norway Royal Salmon 118 Clearwater Seafoods 588Tassal Group 115 High Liner Foods 314Borneo Aqua Harvest 92 Yonkyu 262Copeinca 68 Oceana Group 194China Ocean Resources 62 Dongwon Industries 149The Scottish Salmon Company 55 Borneo Aqua Harvest 132Omega Protein Corp 54 Sil la 128Salmar 54 CP Foods 118Clearwater Seafoods 41 Omega Protein Corp 112Zhanjiang Guolian Aquatic Products 40 Thai Union 95Source: Food for Valuation Source: Food for Valuation
Top-10 highest valued seafood stocks Top-10 lowest valued seafood stocks
P/E P/ECompany name 2014 Company name 2014Zhanjiang Guolian Aquatic Products 23.6 Pacific Andes International Holdings 2.6Zhangzidao Group 16.7 Pacific Andes Resources Development 3.4Oceana Group 16.3 Solvtrans 5.0Shanghai Kaichuang Marine International 14.8 The Scottish Salmon Company 5.1Dalian Yiqiao Marine Seeds 14.6 Grieg Seafood 5.6Shandong Homey Aquatic Development 14.0 China Fishery Group 5.7CP Foods 13.8 Norway Royal Salmon 6.3Nippon Suissan Kaisha (Nissui) 13.4 Bakkafrost 6.4Nutreco 13.7 Austevoll Seafood 6.5Yonkyu 13.1 Salmar 7.2Source: Food for Valuation Source: Food for Valuation
Risk factors
High share price volatility Volatility is caused by commodity price cycles, with salmon prices moving up or down by over 50% in less than a year.
Low earnings predictability Earnings are highly sensitive to salmon prices, which have proven difficult to forecast. A change of NOK 1/kg in the
salmon price changes operational EBIT by NOK350m, corresponding to more than 50% of operational EBIT in 2012.
Relatively high financial leverage Farmers tend to overinvest in the upturn of the cycle, resulting in high financial leverage when the cycle turns. For
example, balance sheets of seafood stocks looked stretched with net debt at 4.8x EBITDA at the end of 2012.
Currency transaction risk Marine Harvest farms the majority of its salmon in Norway, whereas the majority of revenues are generated in the
Eurozone, causing substantial NOK/EUR transaction exposure.
Fish diseases and other biological issues Fish diseases and other biological issues are likely to continue to negatively impact operating costs and investor
sentiment towards seafood stocks.
Environmental and food safety concerns Fish farming sometimes is criticized from an environmental or food safety perspective, which may negatively affect
consumption and investor sentiment.
Economic factors Demand for salmon as a relatively more expensive protein source maybe negatively affected in a weaker economic
environment.
Food for Valuation 10
Disclaimer
Every effort has been made to ensure the accuracy of the contents of this presentation, but legal responsibility cannot be accepted for errors, omissions, or for damages resulting from the use of the information contained in this presentation.
Food for Valuation 11
Thank you!Questions?
Food for Valuation 12