Embed Size (px)
Citation preview
Investor Expectations of Oil and Gas Companies:Transition to a lower carbon futureNovember 2016
Institutional Investors Group on Climate ChangeST
RICT
LY E
MBA
RGOE
D un
til 0
0.01
am T
UES
DAY
22 N
OVEM
BER
2016
2INVESTOR EXPECTATIONS OF OIL AND GAS COMPANIES: TRANSITION TO A LOWER CARBON FUTURE
STRI
CTLY
EM
BARG
OED
until
00.
01am
TUES
DAY
22 N
OVEM
BER
2016
Institutional Investors Group on Climate Change
The Institutional Investors Group on Climate Change (IIGCC) is a forum for collaboration on climate change for investors. IIGCC’s network includes over 120 members, with some of the largest pension funds and asset managers in Europe, representing €13 trillion in assets. IIGCC’s mission is to provide investors a common voice to encourage public policies, investment practices and corporate behaviour which address long-term risks and opportunities associated with climate change.
www.iigcc.org
The Investor Network on Climate Risk (INCR) is a North America focused network of institutional investors dedicated to addressing the financial risks and investment opportunities posed by climate change and other sustainability challenges. INCR currently has more than 100 members representing over $13 trillion in assets. INCR is a project of Ceres, a nonprofit advocate for sustainability leadership that mobilises investors, companies and public interest groups to accelerate and expand the adoption of sustainable business practices and solutions to build a healthy global economy.
www.ceres.org
IGCC is a collaboration of over 60 Australian and New Zealand institutional investors and advisors, managing over $1 trillion in assets under management and focusing on the impact that climate change has on the financial value of investments. IGCC aims to encourage government policies and investment practices that address the risks and opportunities of climate change.
www.igcc.org.au
The Asia Investor Group on Climate Change (AIGCC) is an initiative to create awareness among Asia’s asset owners and financial institutions about the risks and opportunities associated with climate change and low carbon investing. AIGCC provides capacity for investors to share best practice and to collaborate on investment activity, credit analysis, risk management, engagement and policy. AIGCC represents the Asian voice in the evolving global discussions on climate change and the transition to a greener economy.
www.aigcc.net
Acknowledgements
The Investor Expectations series of guides are developed through IIGCC’s Corporate engagement programme in partnership with Ceres Carbon Asset Risk Initiative and input from a global network of investors and advisors. We would like to thank the lead author of this instalment: Stephanie Maier (Aviva Investors) with input from Oliver Grayer (IIGCC). We would also like to acknowledge reviews by: Andrew Logan (Ceres), Emma Herd (IGCC), Helen Wildsmith (CCLA), Sylvia van Waveren (Robeco), Helena Charrier (CDC) and Christina Olivecrona (AP2).
3INVESTOR EXPECTATIONS OF OIL AND GAS COMPANIES: TRANSITION TO A LOWER CARBON FUTURE
STRI
CTLY
EM
BARG
OED
until
00.
01am
TUES
DAY
22 N
OVEM
BER
2016
Introduction In 2015 institutional investors representing over $24 trillion assets under management called on governments to support a new global agreement on climate change, in addition to national and regional policy measures. This was in recognition of the significant impact that climate change will have on our holdings, portfolios and asset values in the short, medium and long term. The Paris Climate Agreement, committing 195 countries to a long-term goal of keeping the increase in global average temperature to well below 2°C above pre-industrial levels, entered into force in November 2016 less than a year after being adopted. This global action plan implies a need for a considerable transition across all sectors, crucially energy, transport, industry and agriculture, as we shift towards a lower carbon economy. As investors, we are acutely aware of the need to understand and manage climate-related risks (both the risks associated with the transition and the physical risks manifesting now and significantly exacerbated above 2°C) for us and the clients and beneficiaries on whose behalf we invest. We have particular concerns regarding the oil and gas sector, given that this sector is a meaningful proportion of most major indices and represents trillions of dollars of market capitalisation. We recognise the importance of energy to economic development and prosperity. After Paris, it is clear that current business strategies of some companies in the oil and gas sector may not be sufficiently sustainable given the changing nature of demand, technology innovation and regulatory measures in support of 2°C which can and will impact on the sector. We are aware that business decisions and capital allocation decisions being made now will determine the future sustainability and profitability of the sector. We look to the Boards and management of major oil and gas companies to make these decisions in the long term interests of investors.
Purpose
The first Investor Expectations on Oil and Gas Company Strategy was published in December 2014 and has formed the basis of effective investor engagement and voting with the boards and management of oil and gas companies. The purpose of this document is to provide an updated guide for further constructive engagement following the Paris Climate Agreement, focused in particular on helping investors understand how companies in this sector are governing and managing the transition risks and opportunities associated with a 2°C trajectory. We aim to stimulate and facilitate meaningful discussion of, and action on, climate risk to mitigate the long term risks to us as investors and position companies to adapt and thrive through the energy transition.
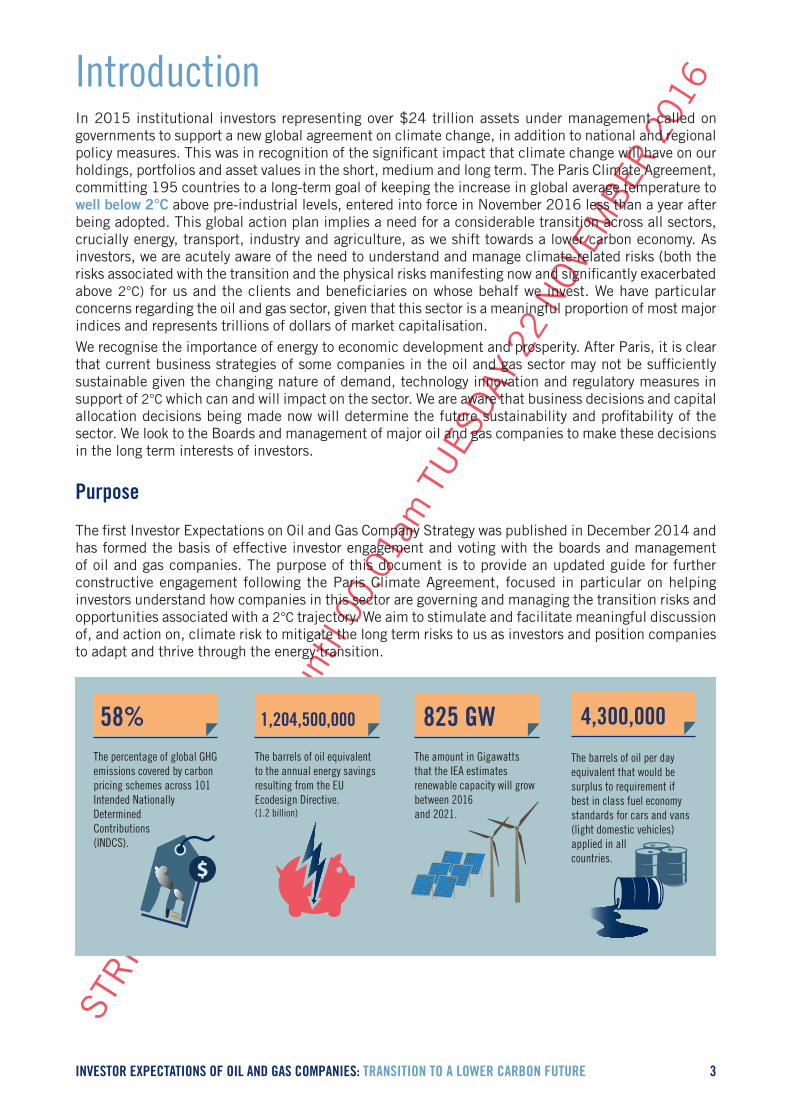
The percentage of global GHG emissions covered by carbon pricing schemes across 101 Intended Nationally DeterminedContributions (INDCS).
$
58%The barrels of oil equivalent to the annual energy savings resulting from the EU Ecodesign Directive.(1.2 billion)
1,204,500,000
The amount in Gigawatts that the IEA estimates renewable capacity will grow between 2016and 2021.
825 GW
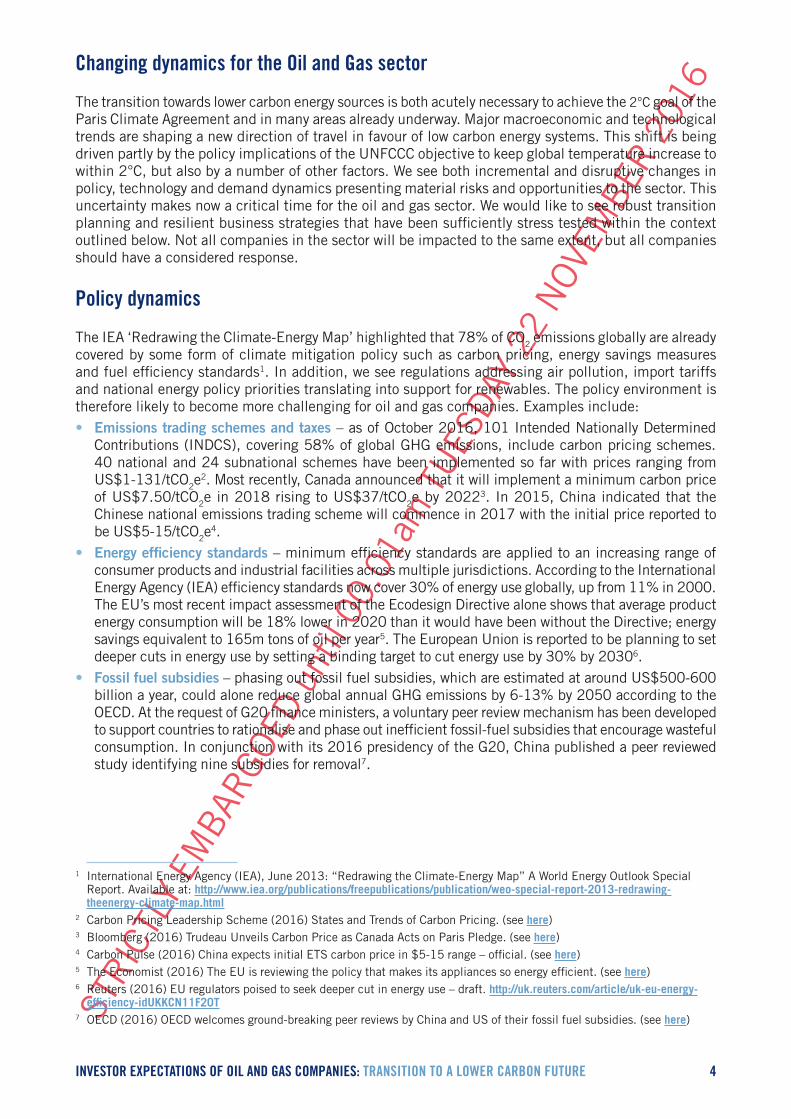
The percentage that average battery pack prices fell between 2010 and 2015. Some manufacturers are reportedly now paying just $145 per kWh for battery cells, an 86% reduction since 2010.
65%
The barrels of oil per day equivalent that would be surplus to requirement if best in class fuel economy standards for cars and vans (light domestic vehicles) applied in all countries.
4,300,000
The estimated revenues lost from methane leakages across global oil and gas
operations in 2012.($30 billion)
$30,000,000,000
The percentage mismatch in oil supply and demand that drove prices 60% beneath 2014 levels.
2%
$
The amount that is invested annually in car-pooling clubs, up from $200 million in 2011. ($11.3 billion)
$11,300,000,000
4INVESTOR EXPECTATIONS OF OIL AND GAS COMPANIES: TRANSITION TO A LOWER CARBON FUTURE
STRI
CTLY
EM
BARG
OED
until
00.
01am
TUES
DAY
22 N
OVEM
BER
2016
Changing dynamics for the Oil and Gas sector
The transition towards lower carbon energy sources is both acutely necessary to achieve the 2°C goal of the Paris Climate Agreement and in many areas already underway. Major macroeconomic and technological trends are shaping a new direction of travel in favour of low carbon energy systems. This shift is being driven partly by the policy implications of the UNFCCC objective to keep global temperature increase to within 2°C, but also by a number of other factors. We see both incremental and disruptive changes in policy, technology and demand dynamics presenting material risks and opportunities to the sector. This uncertainty makes now a critical time for the oil and gas sector. We would like to see robust transition planning and resilient business strategies that have been sufficiently stress tested within the context outlined below. Not all companies in the sector will be impacted to the same extent, but all companies should have a considered response.
Policy dynamics
The IEA ‘Redrawing the Climate-Energy Map’ highlighted that 78% of CO2 emissions globally are already covered by some form of climate mitigation policy such as carbon pricing, energy savings measures and fuel efficiency standards1. In addition, we see regulations addressing air pollution, import tariffs and national energy policy priorities translating into support for renewables. The policy environment is therefore likely to become more challenging for oil and gas companies. Examples include: • Emissions trading schemes and taxes – as of October 2016, 101 Intended Nationally Determined
Contributions (INDCS), covering 58% of global GHG emissions, include carbon pricing schemes. 40 national and 24 subnational schemes have been implemented so far with prices ranging from US$1-131/tCO2e
2. Most recently, Canada announced that it will implement a minimum carbon price of US$7.50/tCO2e in 2018 rising to US$37/tCO2e by 20223. In 2015, China indicated that the Chinese national emissions trading scheme will commence in 2017 with the initial price reported to be US$5-15/tCO2e
4.• Energy efficiency standards – minimum efficiency standards are applied to an increasing range of
consumer products and industrial facilities across multiple jurisdictions. According to the International Energy Agency (IEA) efficiency standards now cover 30% of energy use globally, up from 11% in 2000. The EU’s most recent impact assessment of the Ecodesign Directive alone shows that average product energy consumption will be 18% lower in 2020 than it would have been without the Directive; energy savings equivalent to 165m tons of oil per year5. The European Union is reported to be planning to set deeper cuts in energy use by setting a binding target to cut energy use by 30% by 20306.
• Fossil fuel subsidies – phasing out fossil fuel subsidies, which are estimated at around US$500-600 billion a year, could alone reduce global annual GHG emissions by 6-13% by 2050 according to the OECD. At the request of G20 finance ministers, a voluntary peer review mechanism has been developed to support countries to rationalise and phase out inefficient fossil-fuel subsidies that encourage wasteful consumption. In conjunction with its 2016 presidency of the G20, China published a peer reviewed study identifying nine subsidies for removal7.
1 International Energy Agency (IEA), June 2013: “Redrawing the Climate-Energy Map” A World Energy Outlook Special Report. Available at: http://www.iea.org/publications/freepublications/publication/weo-special-report-2013-redrawing-theenergy-climate-map.html
2 Carbon Pricing Leadership Scheme (2016) States and Trends of Carbon Pricing. (see here)3 Bloomberg (2016) Trudeau Unveils Carbon Price as Canada Acts on Paris Pledge. (see here)4 Carbon Pulse (2016) China expects initial ETS carbon price in $5-15 range – official. (see here)5 The Economist (2016) The EU is reviewing the policy that makes its appliances so energy efficient. (see here)6 Reuters (2016) EU regulators poised to seek deeper cut in energy use – draft. http://uk.reuters.com/article/uk-eu-energy-
efficiency-idUKKCN11F20T7 OECD (2016) OECD welcomes ground-breaking peer reviews by China and US of their fossil fuel subsidies. (see here)
5INVESTOR EXPECTATIONS OF OIL AND GAS COMPANIES: TRANSITION TO A LOWER CARBON FUTURE
STRI
CTLY
EM
BARG
OED
until
00.
01am
TUES
DAY
22 N
OVEM
BER
2016
Technology dynamics
The energy sector is no stranger to disruptive technology change. Recent research indicates renewable energy production and electric vehicles costs have fallen at unanticipated rates. Oil and gas businesses continue to seek product quality and efficiency gains to drive down costs, however the following areas of technology development are of particular interest: • Renewable energy – in 2016, the IEA forecasts renewable capacity will grow by 825 gigawatts (GW)
over the next five years and generate enough power in 2021 to supply the equivalent of all electricity generation in the US and EU today. This increase is 13% higher than the five-year forecast published in 20158.
• Energy storage – a McKinsey/Bloomberg report has found that average battery pack prices fell 65% from US$1,000 per kWh in 2010 to $350 per kWh in 20159 with some manufacturers reportedly now paying just $145 per kWh for battery cells.
• Electric vehicles – in October 2016, Fitch Ratings described electric cars as a “resoundingly negative” threat to the oil industry and urged energy companies to plan for “radical change”10. In the 450 Scenario of the 2016 World Energy Outlook, the IEA forecast that technology combined with policy will lead to 715 million electric cars on the road by 2040, displacing 6 mb/d of oil demand11.
• Smart cities and shared mobility – by 2050, the urban population will grow to two-thirds of global population, and the urban share of global GDP will be approx. 85%12. A number of cities have already set ambitious carbon reduction targets and issued green bonds to finance clean transportation, green buildings, and smart grid infrastructure projects. Further, enabled by app based innovation, McKinsey research found investments in ride sharing or car-pooling clubs reached US$11.3 billion up from US$0.2 billion in 2011 and presents a tangible risk to demand for vehicles.
• Carbon capture, utilisation and storage (CCUS) – while a number of large-scale projects are in operation, deployment is not yet at sufficient scale or cost to have a meaningful impact on carbon emission levels. However, the development of a viable approach here would be positive.
The percentage of global GHG emissions covered by carbon pricing schemes across 101 Intended Nationally DeterminedContributions (INDCS).
$
58%The barrels of oil equivalent to the annual energy savings resulting from the EU Ecodesign Directive.(1.2 billion)
1,204,500,000
The amount in Gigawatts that the IEA estimates renewable capacity will grow between 2016and 2021.
825 GW
The percentage that average battery pack prices fell between 2010 and 2015. Some manufacturers are reportedly now paying just $145 per kWh for battery cells, an 86% reduction since 2010.
65%
The barrels of oil per day equivalent that would be surplus to requirement if best in class fuel economy standards for cars and vans (light domestic vehicles) applied in all countries.
4,300,000
The estimated revenues lost from methane leakages across global oil and gas
operations in 2012.($30 billion)
$30,000,000,000
The percentage mismatch in oil supply and demand that drove prices 60% beneath 2014 levels.
2%
$
The amount that is invested annually in car-pooling clubs, up from $200 million in 2011. ($11.3 billion)
$11,300,000,000
8 IEA (2016) Medium-Term renewable Market Report. (see here)9 Bloomberg New Energy Finance and McKinsey & Co (2016) An Integrated Perspective on the Future of Mobility (see here)10 Financial Times (2016) Oil groups ‘threatened’ by electric cars (see here) 11 IEA (2016) World Energy Outlook 2016 (see here)12 IEA (2016) Energy Technology Perspectives 2016
6INVESTOR EXPECTATIONS OF OIL AND GAS COMPANIES: TRANSITION TO A LOWER CARBON FUTURE
STRI
CTLY
EM
BARG
OED
until
00.
01am
TUES
DAY
22 N
OVEM
BER
2016
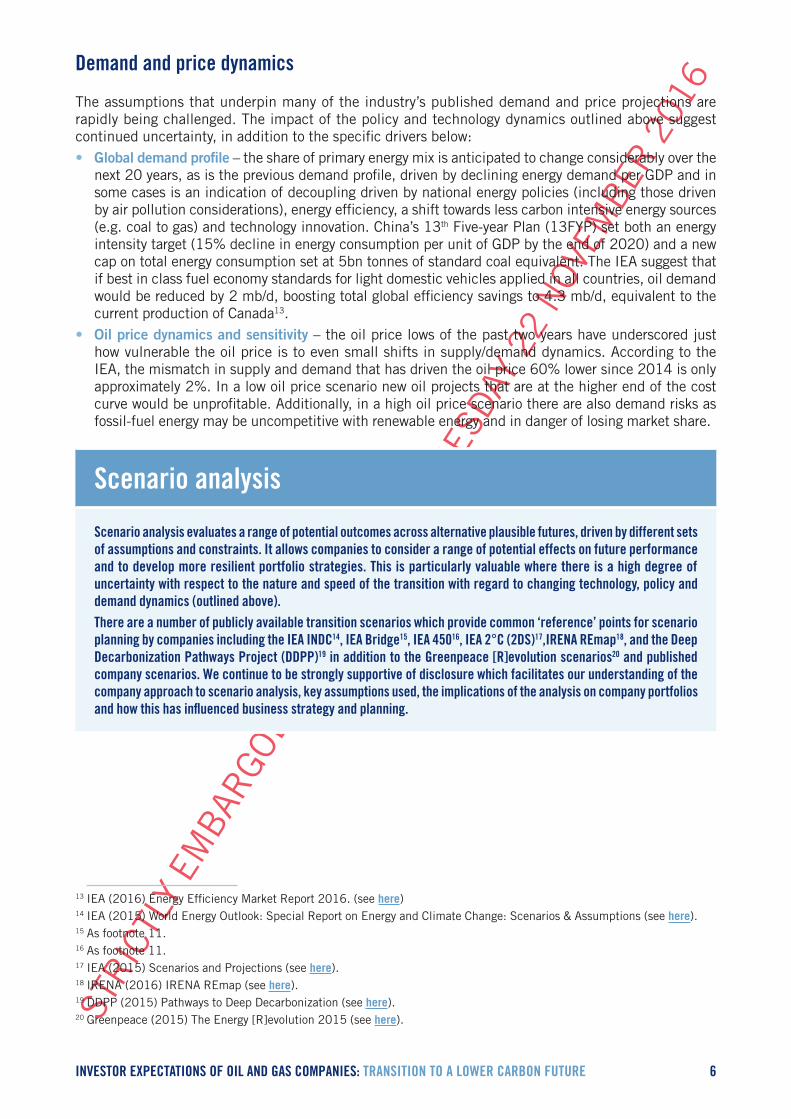
Demand and price dynamics
The assumptions that underpin many of the industry’s published demand and price projections are rapidly being challenged. The impact of the policy and technology dynamics outlined above suggest continued uncertainty, in addition to the specific drivers below:• Global demand profile – the share of primary energy mix is anticipated to change considerably over the
next 20 years, as is the previous demand profile, driven by declining energy demand per GDP and in some cases is an indication of decoupling driven by national energy policies (including those driven by air pollution considerations), energy efficiency, a shift towards less carbon intensive energy sources (e.g. coal to gas) and technology innovation. China’s 13th Five-year Plan (13FYP) set both an energy intensity target (15% decline in energy consumption per unit of GDP by the end of 2020) and a new cap on total energy consumption set at 5bn tonnes of standard coal equivalent. The IEA suggest that if best in class fuel economy standards for light domestic vehicles applied in all countries, oil demand would be reduced by 2 mb/d, boosting total global efficiency savings to 4.3 mb/d, equivalent to the current production of Canada13.
• Oil price dynamics and sensitivity – the oil price lows of the past two years have underscored just how vulnerable the oil price is to even small shifts in supply/demand dynamics. According to the IEA, the mismatch in supply and demand that has driven the oil price 60% lower since 2014 is only approximately 2%. In a low oil price scenario new oil projects that are at the higher end of the cost curve would be unprofitable. Additionally, in a high oil price scenario there are also demand risks as fossil-fuel energy may be uncompetitive with renewable energy and in danger of losing market share.
Scenario analysis
Scenario analysis evaluates a range of potential outcomes across alternative plausible futures, driven by different sets of assumptions and constraints. It allows companies to consider a range of potential effects on future performance and to develop more resilient portfolio strategies. This is particularly valuable where there is a high degree of uncertainty with respect to the nature and speed of the transition with regard to changing technology, policy and demand dynamics (outlined above). There are a number of publicly available transition scenarios which provide common ‘reference’ points for scenario planning by companies including the IEA INDC14, IEA Bridge15, IEA 45016, IEA 2°C (2DS)17,IRENA REmap18, and the Deep Decarbonization Pathways Project (DDPP)19 in addition to the Greenpeace [R]evolution scenarios20 and published company scenarios. We continue to be strongly supportive of disclosure which facilitates our understanding of the company approach to scenario analysis, key assumptions used, the implications of the analysis on company portfolios and how this has influenced business strategy and planning.
13 IEA (2016) Energy Efficiency Market Report 2016. (see here)14 IEA (2015) World Energy Outlook: Special Report on Energy and Climate Change: Scenarios & Assumptions (see here).15 As footnote 11. 16 As footnote 11.17 IEA (2015) Scenarios and Projections (see here). 18 IRENA (2016) IRENA REmap (see here).19 DDPP (2015) Pathways to Deep Decarbonization (see here).20 Greenpeace (2015) The Energy [R]evolution 2015 (see here).
7INVESTOR EXPECTATIONS OF OIL AND GAS COMPANIES: TRANSITION TO A LOWER CARBON FUTURE
STRI
CTLY
EM
BARG
OED
until
00.
01am
TUES
DAY
22 N
OVEM
BER
2016
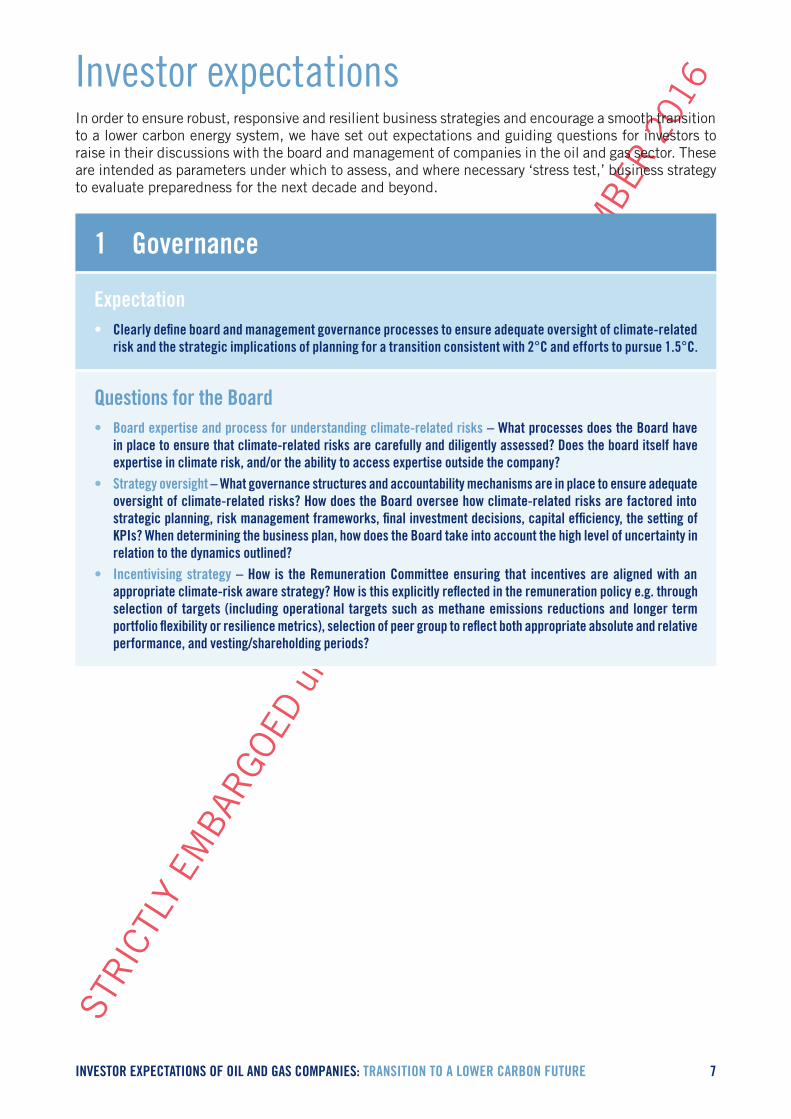
Investor expectations In order to ensure robust, responsive and resilient business strategies and encourage a smooth transition to a lower carbon energy system, we have set out expectations and guiding questions for investors to raise in their discussions with the board and management of companies in the oil and gas sector. These are intended as parameters under which to assess, and where necessary ‘stress test,’ business strategy to evaluate preparedness for the next decade and beyond.
1 Governance
Expectation• Clearly define board and management governance processes to ensure adequate oversight of climate-related
risk and the strategic implications of planning for a transition consistent with 2°C and efforts to pursue 1.5°C.
Questions for the Board• Board expertise and process for understanding climate-related risks – What processes does the Board have
in place to ensure that climate-related risks are carefully and diligently assessed? Does the board itself have expertise in climate risk, and/or the ability to access expertise outside the company?
• Strategy oversight – What governance structures and accountability mechanisms are in place to ensure adequate oversight of climate-related risks? How does the Board oversee how climate-related risks are factored into strategic planning, risk management frameworks, final investment decisions, capital efficiency, the setting of KPIs? When determining the business plan, how does the Board take into account the high level of uncertainty in relation to the dynamics outlined?
• Incentivising strategy – How is the Remuneration Committee ensuring that incentives are aligned with an appropriate climate-risk aware strategy? How is this explicitly reflected in the remuneration policy e.g. through selection of targets (including operational targets such as methane emissions reductions and longer term portfolio flexibility or resilience metrics), selection of peer group to reflect both appropriate absolute and relative performance, and vesting/shareholding periods?
8INVESTOR EXPECTATIONS OF OIL AND GAS COMPANIES: TRANSITION TO A LOWER CARBON FUTURE
STRI
CTLY
EM
BARG
OED
until
00.
01am
TUES
DAY
22 N
OVEM
BER
2016
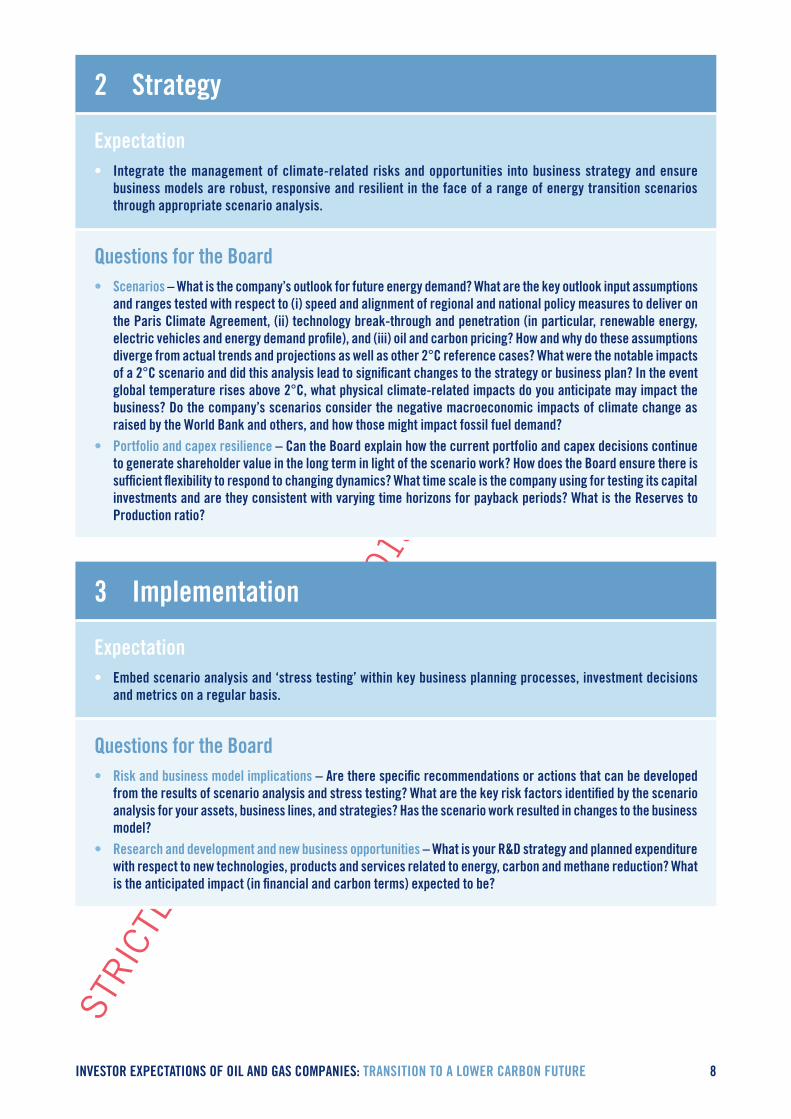
2 Strategy
Expectation• Integrate the management of climate-related risks and opportunities into business strategy and ensure
business models are robust, responsive and resilient in the face of a range of energy transition scenarios through appropriate scenario analysis.
Questions for the Board• Scenarios – What is the company’s outlook for future energy demand? What are the key outlook input assumptions
and ranges tested with respect to (i) speed and alignment of regional and national policy measures to deliver on the Paris Climate Agreement, (ii) technology break-through and penetration (in particular, renewable energy, electric vehicles and energy demand profile), and (iii) oil and carbon pricing? How and why do these assumptions diverge from actual trends and projections as well as other 2°C reference cases? What were the notable impacts of a 2°C scenario and did this analysis lead to significant changes to the strategy or business plan? In the event global temperature rises above 2°C, what physical climate-related impacts do you anticipate may impact the business? Do the company’s scenarios consider the negative macroeconomic impacts of climate change as raised by the World Bank and others, and how those might impact fossil fuel demand?
• Portfolio and capex resilience – Can the Board explain how the current portfolio and capex decisions continue to generate shareholder value in the long term in light of the scenario work? How does the Board ensure there is sufficient flexibility to respond to changing dynamics? What time scale is the company using for testing its capital investments and are they consistent with varying time horizons for payback periods? What is the Reserves to Production ratio?
3 Implementation
Expectation• Embed scenario analysis and ‘stress testing’ within key business planning processes, investment decisions
and metrics on a regular basis.
Questions for the Board• Risk and business model implications – Are there specific recommendations or actions that can be developed
from the results of scenario analysis and stress testing? What are the key risk factors identified by the scenario analysis for your assets, business lines, and strategies? Has the scenario work resulted in changes to the business model?
• Research and development and new business opportunities – What is your R&D strategy and planned expenditure with respect to new technologies, products and services related to energy, carbon and methane reduction? What is the anticipated impact (in financial and carbon terms) expected to be?
9INVESTOR EXPECTATIONS OF OIL AND GAS COMPANIES: TRANSITION TO A LOWER CARBON FUTURE
STRI
CTLY
EM
BARG
OED
until
00.
01am
TUES
DAY
22 N
OVEM
BER
2016
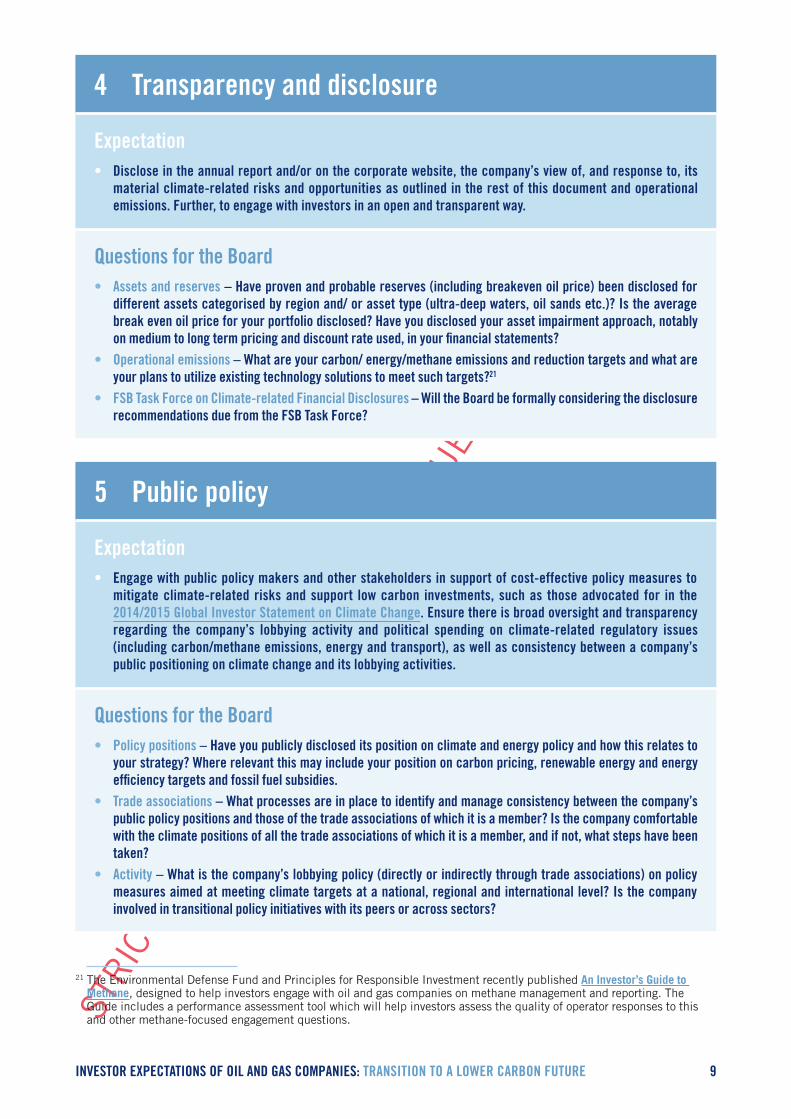
4 Transparency and disclosure
Expectation• Disclose in the annual report and/or on the corporate website, the company’s view of, and response to, its
material climate-related risks and opportunities as outlined in the rest of this document and operational emissions. Further, to engage with investors in an open and transparent way.
Questions for the Board• Assets and reserves – Have proven and probable reserves (including breakeven oil price) been disclosed for
different assets categorised by region and/ or asset type (ultra-deep waters, oil sands etc.)? Is the average break even oil price for your portfolio disclosed? Have you disclosed your asset impairment approach, notably on medium to long term pricing and discount rate used, in your financial statements?
• Operational emissions – What are your carbon/ energy/methane emissions and reduction targets and what are your plans to utilize existing technology solutions to meet such targets?21
• FSB Task Force on Climate-related Financial Disclosures – Will the Board be formally considering the disclosure recommendations due from the FSB Task Force?
5 Public policy
Expectation• Engage with public policy makers and other stakeholders in support of cost-effective policy measures to
mitigate climate-related risks and support low carbon investments, such as those advocated for in the 2014/2015 Global Investor Statement on Climate Change. Ensure there is broad oversight and transparency regarding the company’s lobbying activity and political spending on climate-related regulatory issues (including carbon/methane emissions, energy and transport), as well as consistency between a company’s public positioning on climate change and its lobbying activities.
Questions for the Board• Policy positions – Have you publicly disclosed its position on climate and energy policy and how this relates to
your strategy? Where relevant this may include your position on carbon pricing, renewable energy and energy efficiency targets and fossil fuel subsidies.
• Trade associations – What processes are in place to identify and manage consistency between the company’s public policy positions and those of the trade associations of which it is a member? Is the company comfortable with the climate positions of all the trade associations of which it is a member, and if not, what steps have been taken?
• Activity – What is the company’s lobbying policy (directly or indirectly through trade associations) on policy measures aimed at meeting climate targets at a national, regional and international level? Is the company involved in transitional policy initiatives with its peers or across sectors?
21 The Environmental Defense Fund and Principles for Responsible Investment recently published An Investor’s Guide to Methane, designed to help investors engage with oil and gas companies on methane management and reporting. The Guide includes a performance assessment tool which will help investors assess the quality of operator responses to this and other methane-focused engagement questions.
Institutional Investors Group on Climate Change
STRI
CTLY
EM
BARG
OED
until
00.
01am
TUES
DAY
22 N
OVEM
BER
2016