Embed Size (px)
Citation preview
1August 2016
Investor Presentation
August 2016
2August 2016
Disclaimer
• Presentation includes forward looking statements about events and
financial results
• Actual events or results may be materially different
• Risks are described in the company’s filings with the SEC
• Statements are made subject to “safe harbor” provisions of Private
Securities Reform Act of 1995
• Full disclaimer and reconciliation of Non-GAAP financial measures to
GAAP measures are at the end of this presentation
Presentation is subject to safe harbor laws
3August 2016
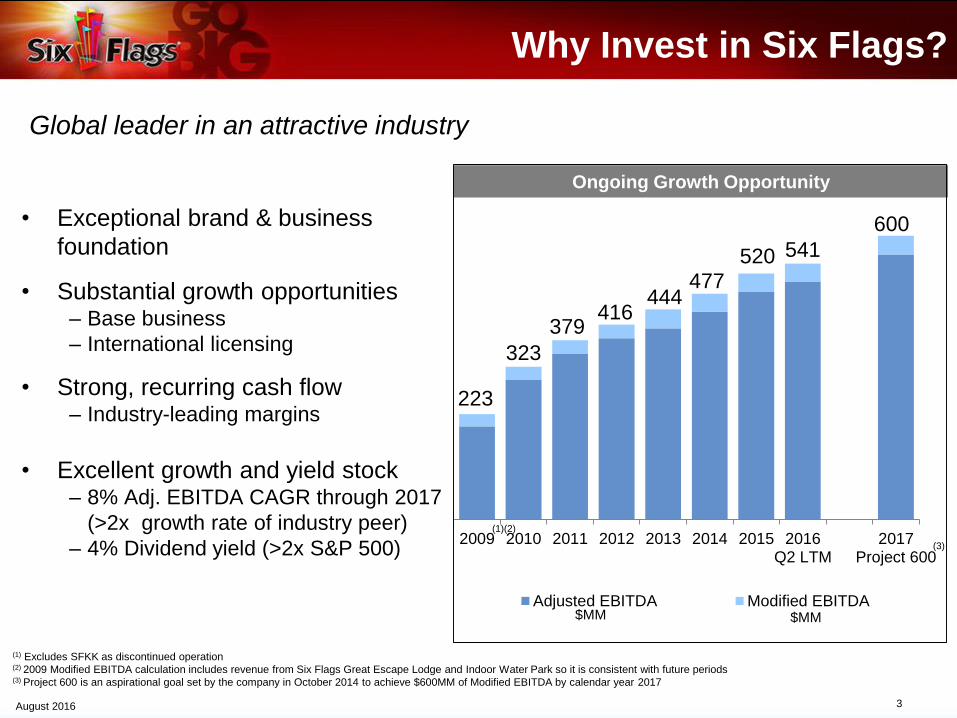
Why Invest in Six Flags?
• Exceptional brand & business
foundation
• Substantial growth opportunities– Base business
– International licensing
• Strong, recurring cash flow– Industry-leading margins
• Excellent growth and yield stock– 8% Adj. EBITDA CAGR through 2017
(>2x growth rate of industry peer)
– 4% Dividend yield (>2x S&P 500)
Global leader in an attractive industry
(1) Excludes SFKK as discontinued operation(2) 2009 Modified EBITDA calculation includes revenue from Six Flags Great Escape Lodge and Indoor Water Park so it is consistent with future periods(3) Project 600 is an aspirational goal set by the company in October 2014 to achieve $600MM of Modified EBITDA by calendar year 2017
223
323
379416
444477
600
520 541
2009 2010 2011 2012 2013 2014 2015 2016Q2 LTM
2017Project 600
Adjusted EBITDA Modified EBITDA
Ongoing Growth Opportunity
(1)(2)
$MM $MM
(3)

4August 2016
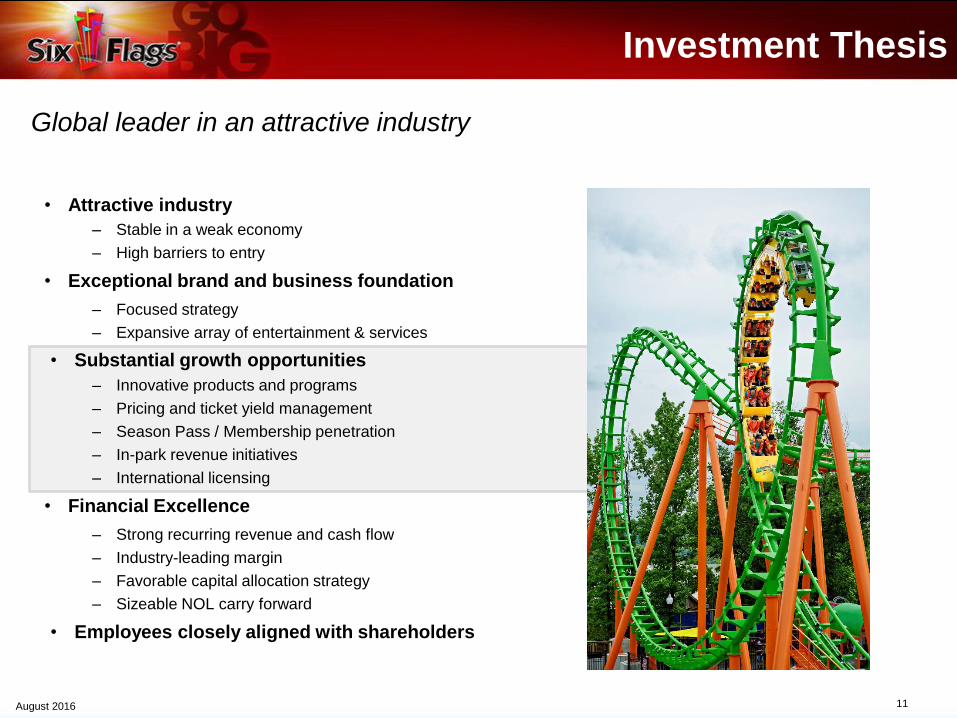
Investment Thesis
• Attractive industry
– Stable in a weak economy
– High barriers to entry
• Exceptional brand and business foundation
– Focused strategy
– Expansive array of entertainment & services
• Substantial growth opportunities
– Innovative products and programs
– Pricing and ticket yield management
– Season Pass / Membership penetration
– In-park revenue initiatives
– International licensing
• Financial Excellence
– Strong recurring revenue and cash flow
– Industry-leading margin
– Favorable capital allocation strategy
– Sizeable NOL carry forward
• Employees closely aligned with shareholders
Global leader in an attractive industry
5August 2016
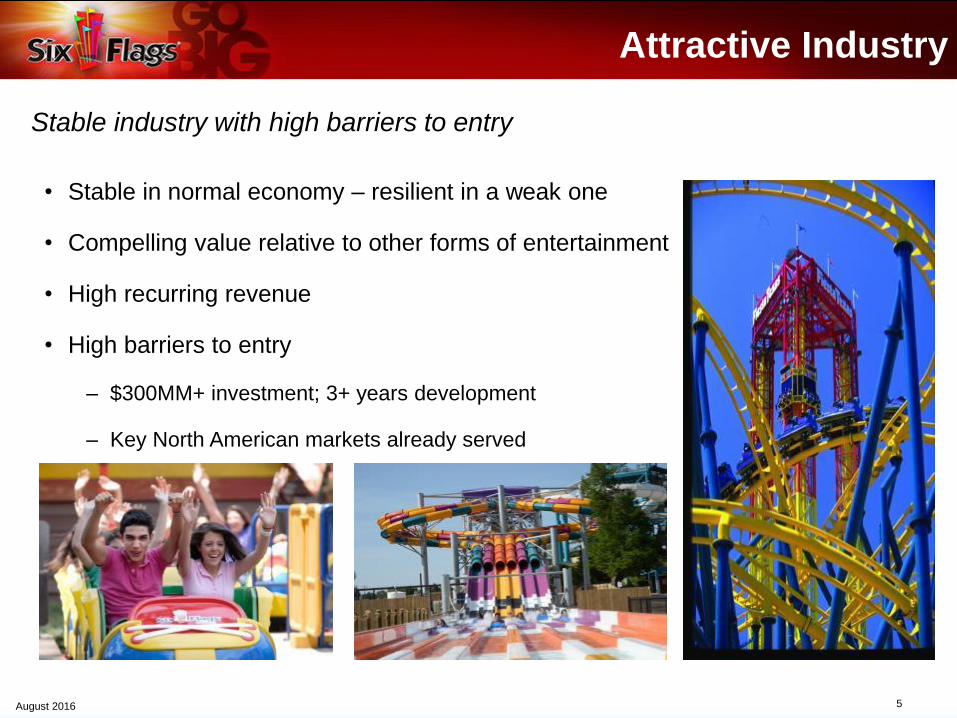
Attractive Industry
• Stable in normal economy – resilient in a weak one
• Compelling value relative to other forms of entertainment
• High recurring revenue
• High barriers to entry
– $300MM+ investment; 3+ years development
– Key North American markets already served
Stable industry with high barriers to entry

6August 2016
Investment Thesis
Global leader in an attractive industry
• Attractive industry
– Stable in a weak economy
– High barriers to entry
• Exceptional brand and business foundation
– Focused strategy
– Expansive array of entertainment & services
• Substantial growth opportunities
– Innovative products and programs
– Pricing and ticket yield management
– Season Pass / Membership penetration
– In-park revenue initiatives
– International licensing
• Financial Excellence
– Strong recurring revenue and cash flow
– Industry-leading margin
– Favorable capital allocation strategy
– Sizeable NOL carry forward
• Employees closely aligned with shareholders
7August 2016
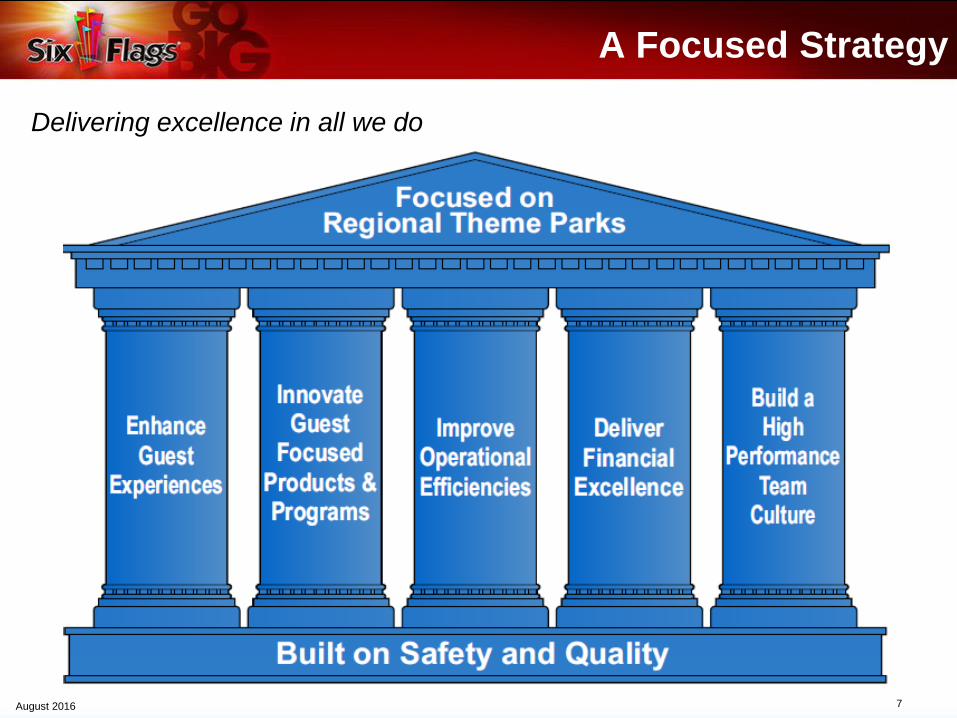
A Focused Strategy
Delivering excellence in all we do
8August 2016
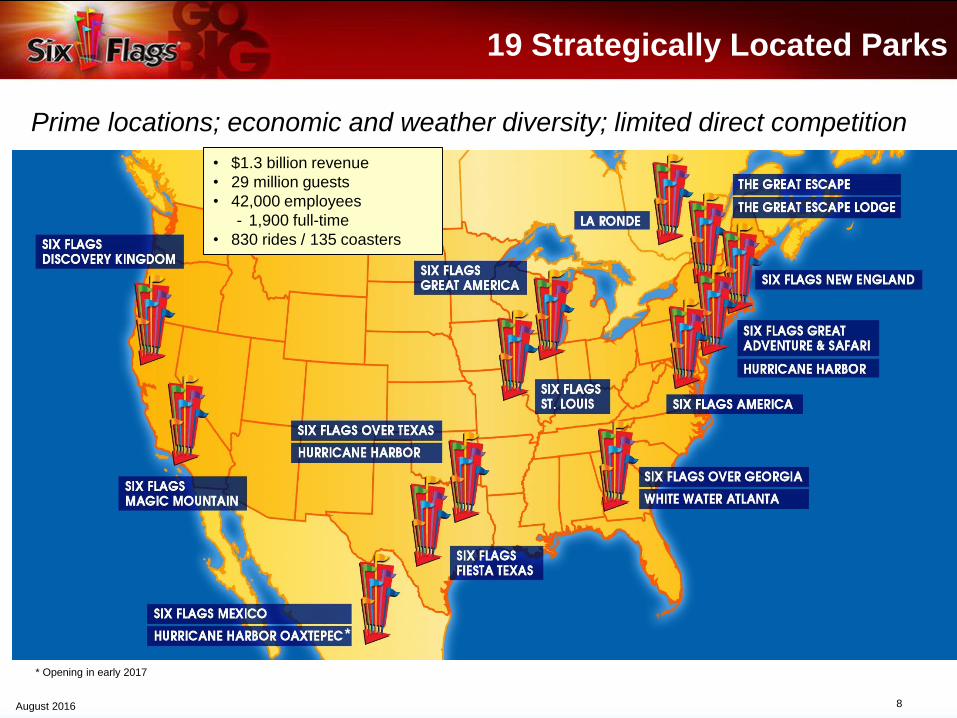
19 Strategically Located Parks
Prime locations; economic and weather diversity; limited direct competition
• $1.3 billion revenue
• 29 million guests
• 42,000 employees
- 1,900 full-time
• 830 rides / 135 coasters
*
* Opening in early 2017
9August 2016
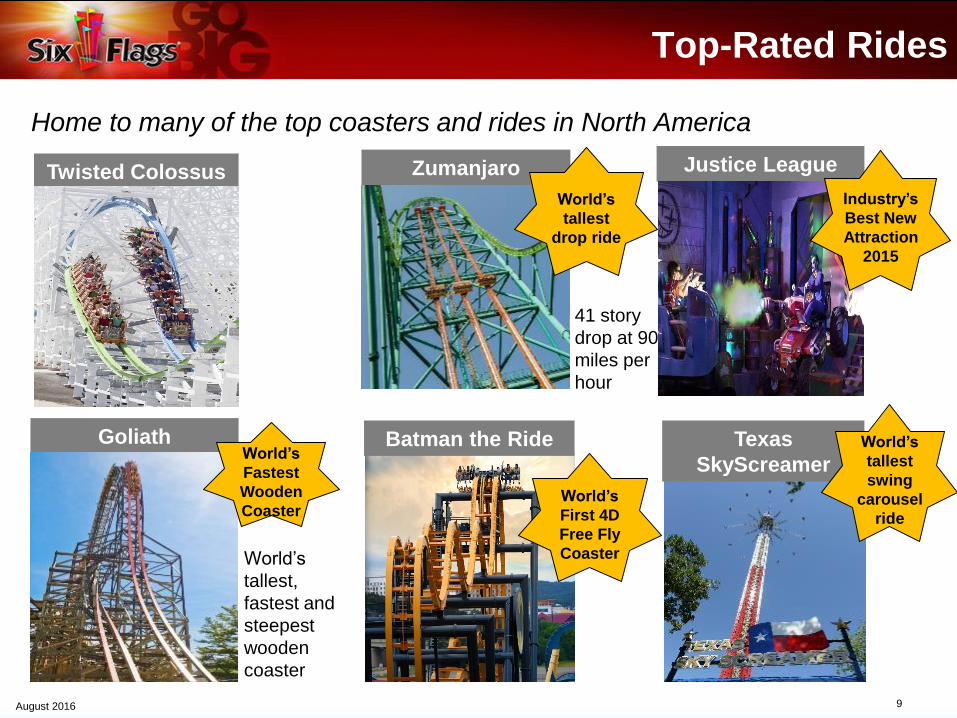
Top-Rated Rides
Home to many of the top coasters and rides in North America
Justice LeagueZumanjaro
Goliath
World’s
tallest,
fastest and
steepest
wooden
coaster
Batman the Ride Texas
SkyScreamer
World’s
First 4D
Free Fly
Coaster
World’s
tallest
drop ride
World’s
Fastest
Wooden
Coaster
41 story
drop at 90
miles per
hour
World’s
tallest
swing
carousel
ride
Twisted Colossus
Industry’s
Best New
Attraction
2015
10August 2016
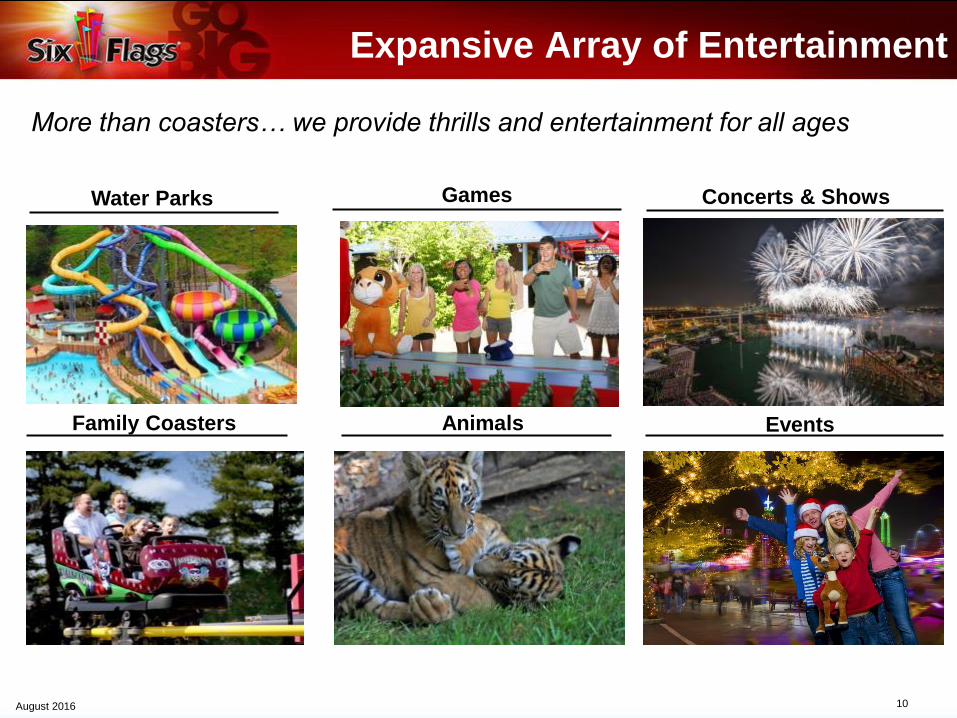
Family Coasters
Concerts & Shows
Animals
Games
Events
Water Parks
Expansive Array of Entertainment
More than coasters… we provide thrills and entertainment for all ages
11August 2016
Investment Thesis
Global leader in an attractive industry
• Attractive industry
– Stable in a weak economy
– High barriers to entry
• Exceptional brand and business foundation
– Focused strategy
– Expansive array of entertainment & services
• Substantial growth opportunities
– Innovative products and programs
– Pricing and ticket yield management
– Season Pass / Membership penetration
– In-park revenue initiatives
– International licensing
• Financial Excellence
– Strong recurring revenue and cash flow
– Industry-leading margin
– Favorable capital allocation strategy
– Sizeable NOL carry forward
• Employees closely aligned with shareholders
12August 2016
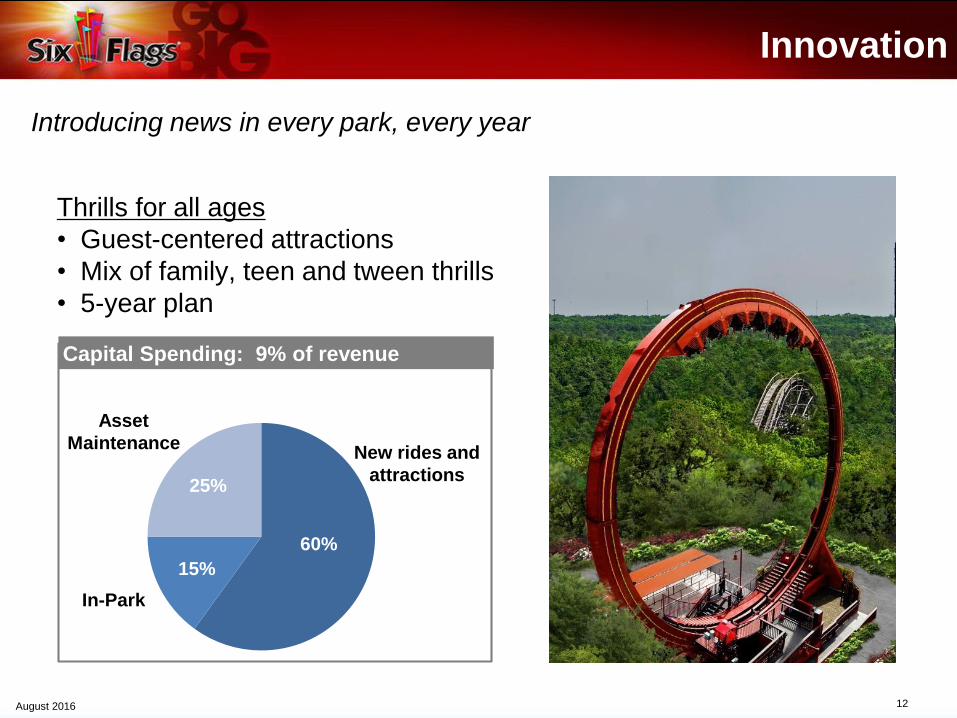
Thrills for all ages
• Guest-centered attractions
• Mix of family, teen and tween thrills
• 5-year plan
Capital Spending: 9% of revenue
60%
15%
25%
New rides and
attractions
Asset
Maintenance
In-Park
Innovation
Introducing news in every park, every year
13August 2016
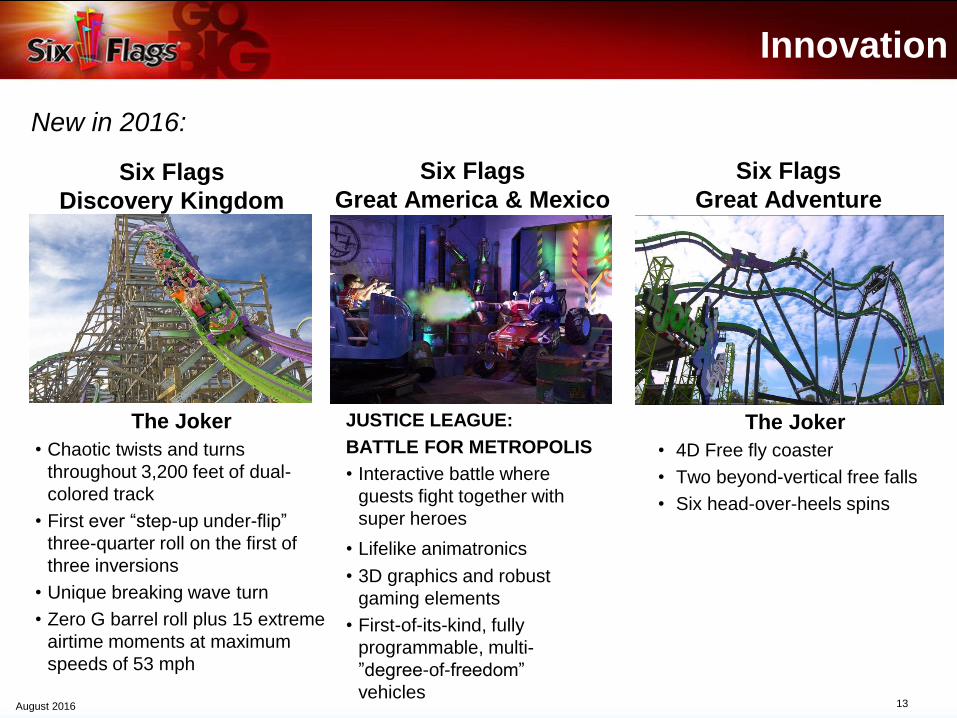
Innovation
New in 2016:
The Joker
• Chaotic twists and turns
throughout 3,200 feet of dual-
colored track
• First ever “step-up under-flip”
three-quarter roll on the first of
three inversions
• Unique breaking wave turn
• Zero G barrel roll plus 15 extreme
airtime moments at maximum
speeds of 53 mph
Six Flags
Discovery Kingdom
Six Flags
Great Adventure
Six Flags
Great America & Mexico
The Joker
• 4D Free fly coaster
• Two beyond-vertical free falls
• Six head-over-heels spins
JUSTICE LEAGUE:
BATTLE FOR METROPOLIS
• Interactive battle where
guests fight together with
super heroes
• Lifelike animatronics
• 3D graphics and robust
gaming elements
• First-of-its-kind, fully
programmable, multi-
”degree-of-freedom”
vehicles
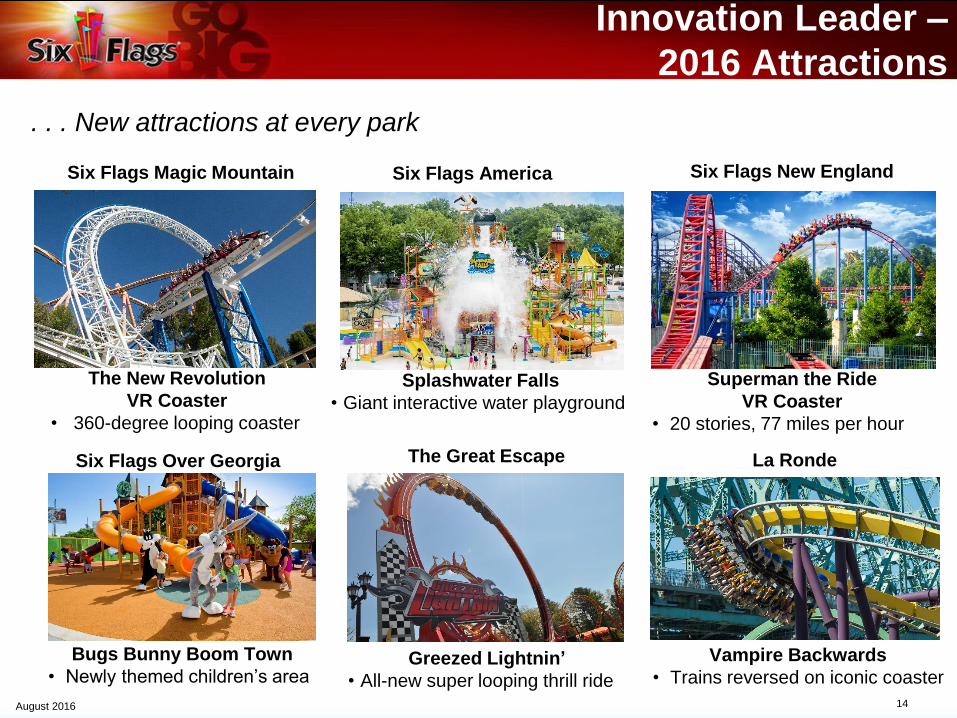
14August 2016
Innovation Leader –
2016 Attractions
. . . New attractions at every park
Six Flags America
Splashwater Falls
• Giant interactive water playground
Six Flags Magic Mountain
The New Revolution
VR Coaster
• 360-degree looping coaster
The Great EscapeSix Flags Over Georgia La Ronde
Bugs Bunny Boom Town
• Newly themed children’s areaGreezed Lightnin’
• All-new super looping thrill ride
Vampire Backwards
• Trains reversed on iconic coaster
Six Flags New England
Superman the Ride
VR Coaster
• 20 stories, 77 miles per hour
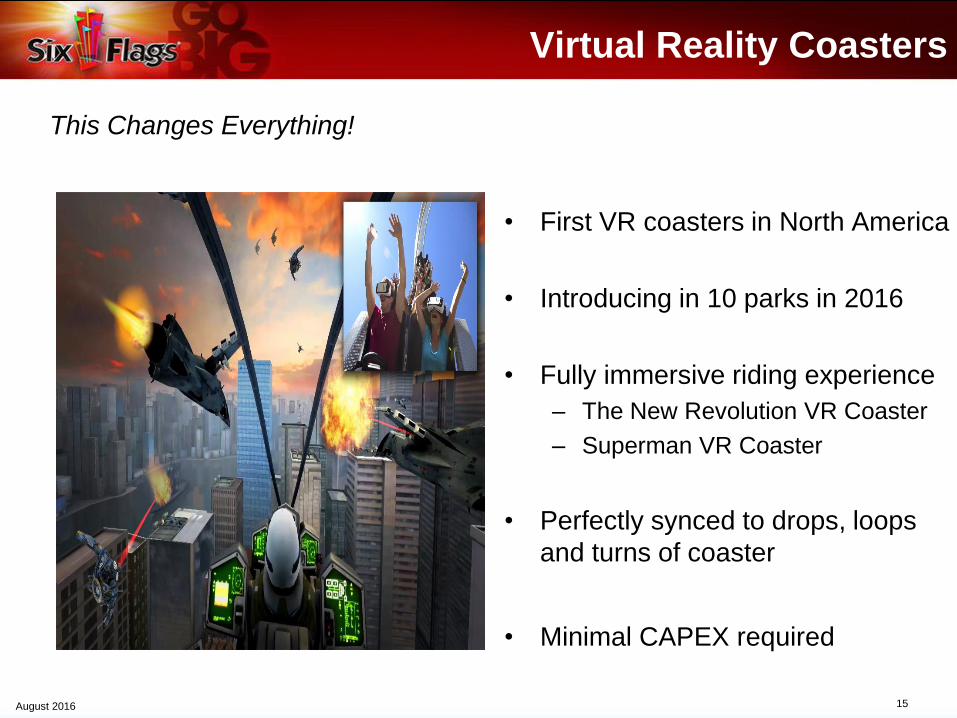
15August 2016
Virtual Reality Coasters
• First VR coasters in North America
• Introducing in 10 parks in 2016
• Fully immersive riding experience
– The New Revolution VR Coaster
– Superman VR Coaster
• Perfectly synced to drops, loops
and turns of coaster
• Minimal CAPEX required
This Changes Everything!
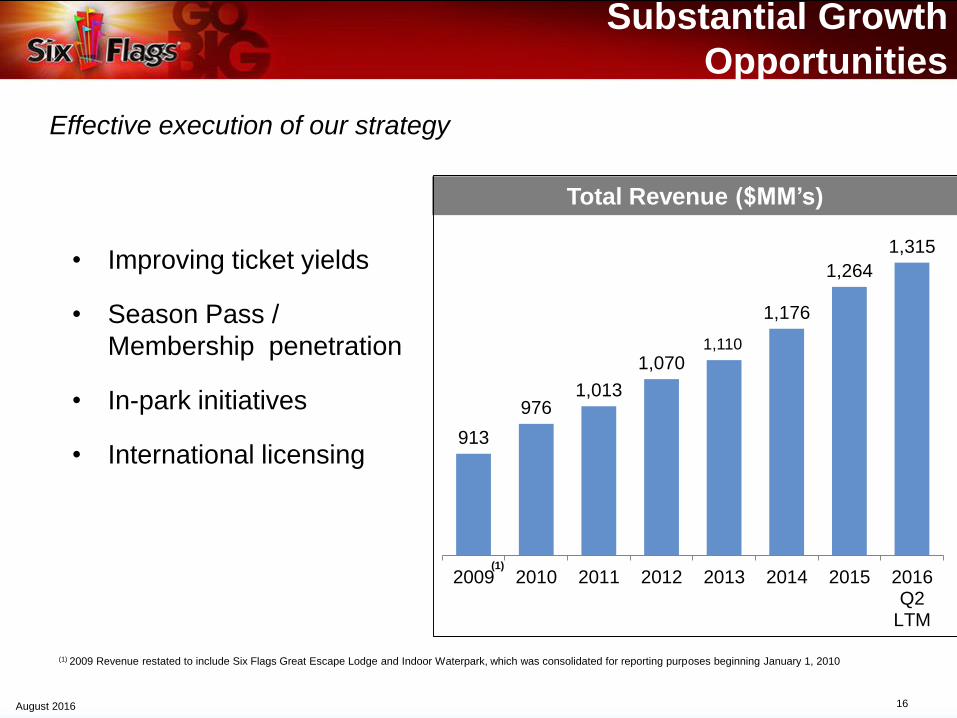
16August 2016
Substantial Growth
Opportunities
• Improving ticket yields
• Season Pass /
Membership penetration
• In-park initiatives
• International licensing
Effective execution of our strategy
Total Revenue ($MM’s)
(1) 2009 Revenue restated to include Six Flags Great Escape Lodge and Indoor Waterpark, which was consolidated for reporting purposes beginning January 1, 2010
(1)
913
9761,013
1,0701,110
1,176
1,264
1,315
2009 2010 2011 2012 2013 2014 2015 2016Q2
LTM
17August 2016
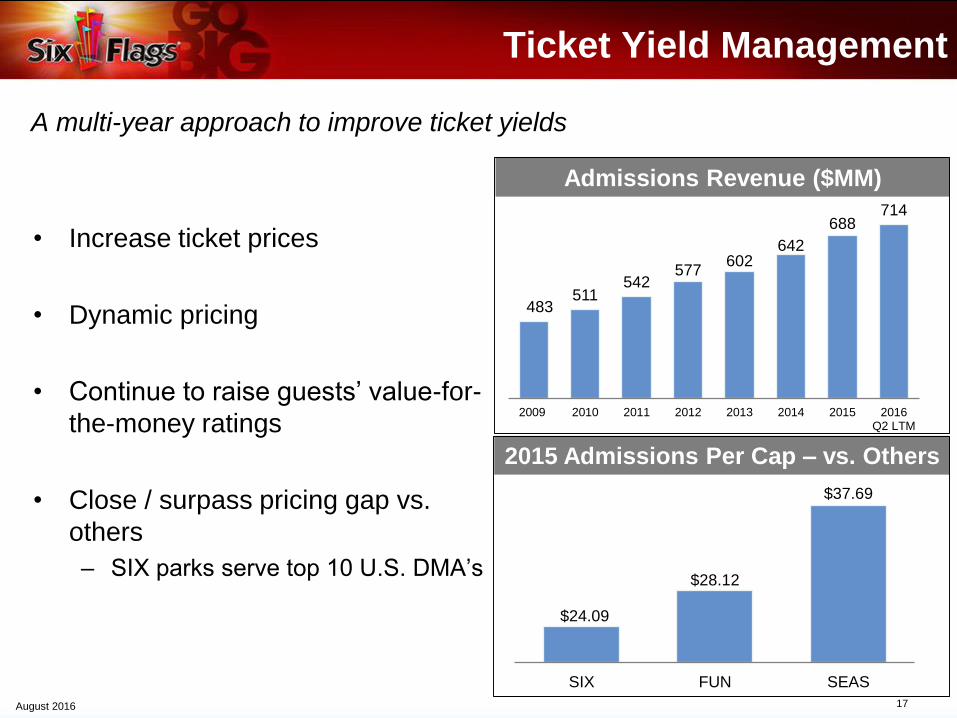
$24.09
$28.12
$37.69
SIX FUN SEAS
Ticket Yield Management
• Increase ticket prices
• Dynamic pricing
• Continue to raise guests’ value-for-
the-money ratings
• Close / surpass pricing gap vs.
others
– SIX parks serve top 10 U.S. DMA’s
A multi-year approach to improve ticket yields
483511
542577
602642
688714
2009 2010 2011 2012 2013 2014 2015 2016Q2 LTM
Admissions Revenue ($MM)
2015 Admissions Per Cap – vs. Others
18August 2016
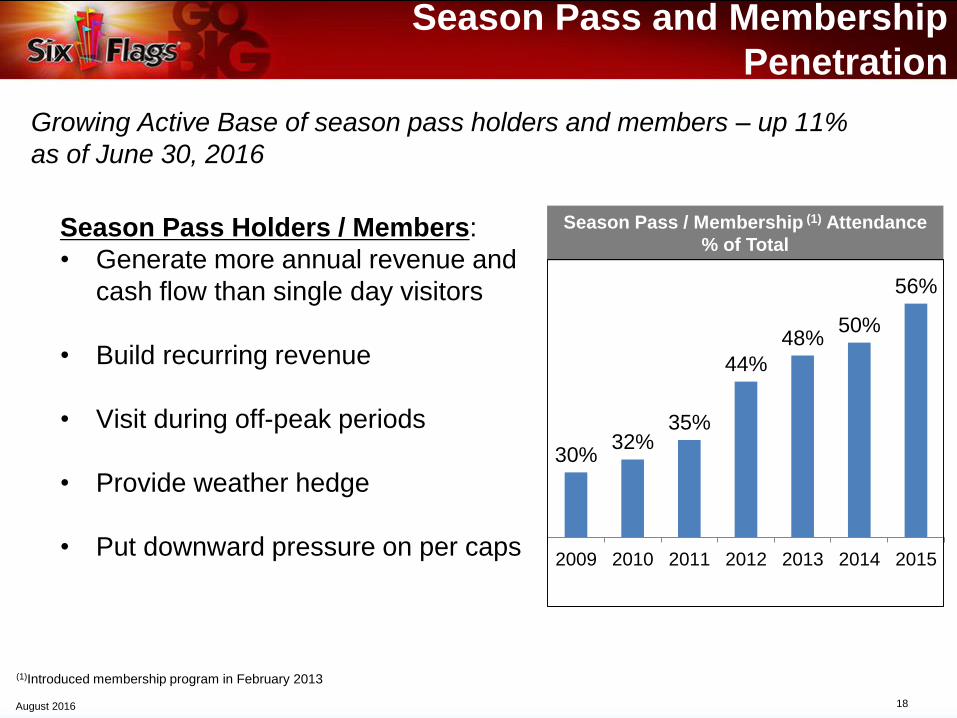
Season Pass and Membership
Penetration
Season Pass Holders / Members:
• Generate more annual revenue and
cash flow than single day visitors
• Build recurring revenue
• Visit during off-peak periods
• Provide weather hedge
• Put downward pressure on per caps
Growing Active Base of season pass holders and members – up 11%
as of June 30, 2016
30%32%
35%
44%
48%50%
56%
2009 2010 2011 2012 2013 2014 2015
Season Pass / Membership (1) Attendance
% of Total
(1)Introduced membership program in February 2013
19August 2016
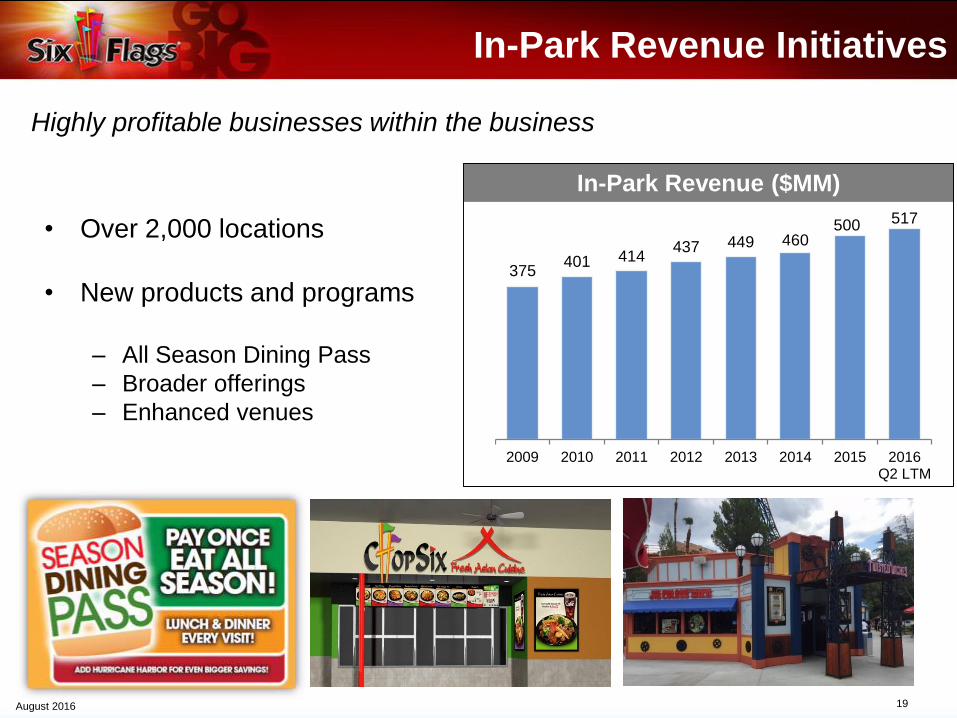
In-Park Revenue Initiatives
• Over 2,000 locations
• New products and programs
– All Season Dining Pass
– Broader offerings
– Enhanced venues
Highly profitable businesses within the business
375401 414
437 449 460500 517
2009 2010 2011 2012 2013 2014 2015 2016Q2 LTM
In-Park Revenue ($MM)
20August 2016
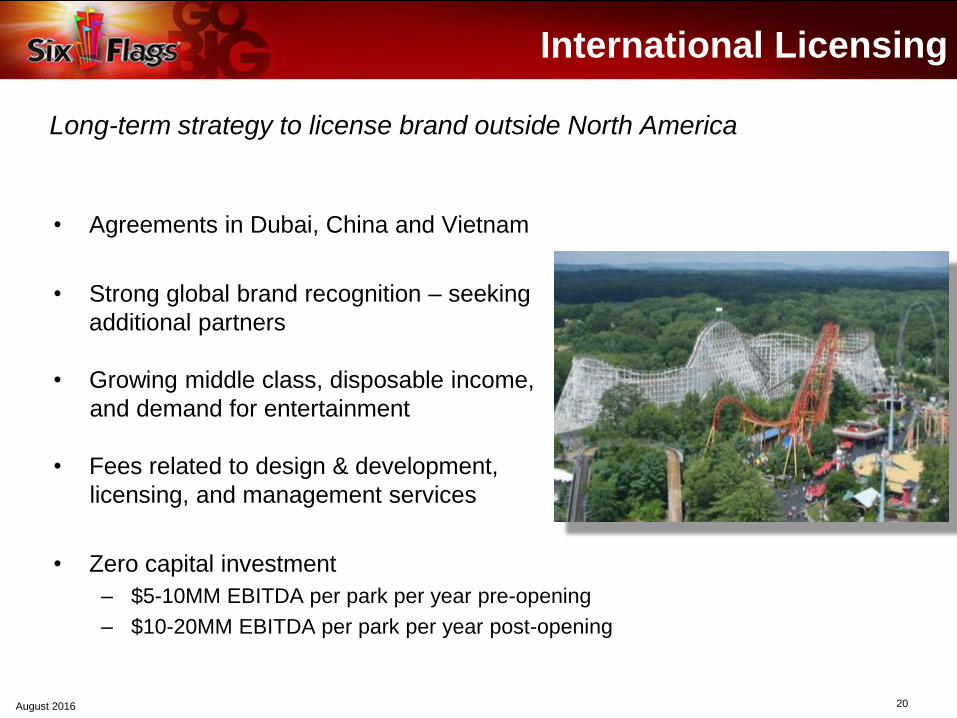
International Licensing
• Agreements in Dubai, China and Vietnam
• Strong global brand recognition – seeking
additional partners
• Growing middle class, disposable income,
and demand for entertainment
• Fees related to design & development,
licensing, and management services
• Zero capital investment
– $5-10MM EBITDA per park per year pre-opening
– $10-20MM EBITDA per park per year post-opening
Long-term strategy to license brand outside North America

21August 2016
Investment Thesis
Global leader in an attractive industry
• Attractive industry
– Stable in a weak economy
– High barriers to entry
• Exceptional brand and business foundation
– Focused strategy
– Expansive array of entertainment & services
• Substantial growth opportunities
– Innovative products and programs
– Pricing and ticket yield management
– Season Pass / Membership penetration
– In-park revenue initiatives
– International licensing
• Financial Excellence
– Strong recurring revenue and cash flow
– Industry-leading margin
– Favorable capital allocation strategy
– Sizeable NOL carry forward
• Employees closely aligned with shareholders
22August 2016
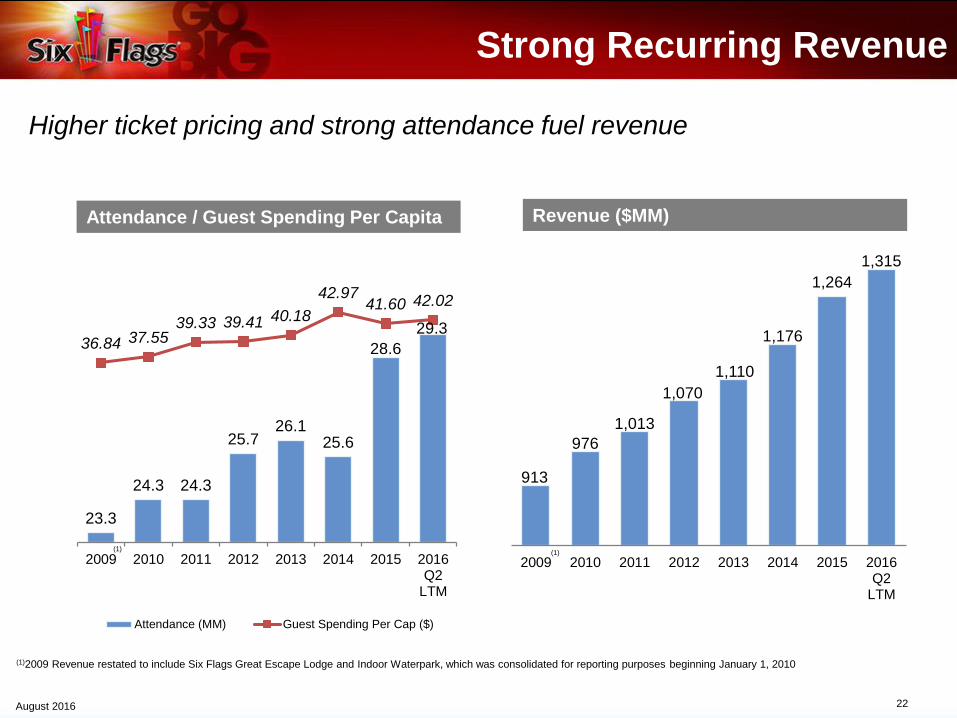
Strong Recurring Revenue
Higher ticket pricing and strong attendance fuel revenue
Attendance / Guest Spending Per Capita Revenue ($MM)
(1)
(1)2009 Revenue restated to include Six Flags Great Escape Lodge and Indoor Waterpark, which was consolidated for reporting purposes beginning January 1, 2010
23.3
24.3 24.3
25.726.1
25.6
28.6
29.336.84 37.55
39.33 39.41 40.18
42.9741.60 42.02
2009 2010 2011 2012 2013 2014 2015 2016Q2
LTM
Attendance (MM) Guest Spending Per Cap ($)
(1)
913
976
1,013
1,070
1,110
1,176
1,264
1,315
2009 2010 2011 2012 2013 2014 2015 2016Q2
LTM
(1)
23August 2016
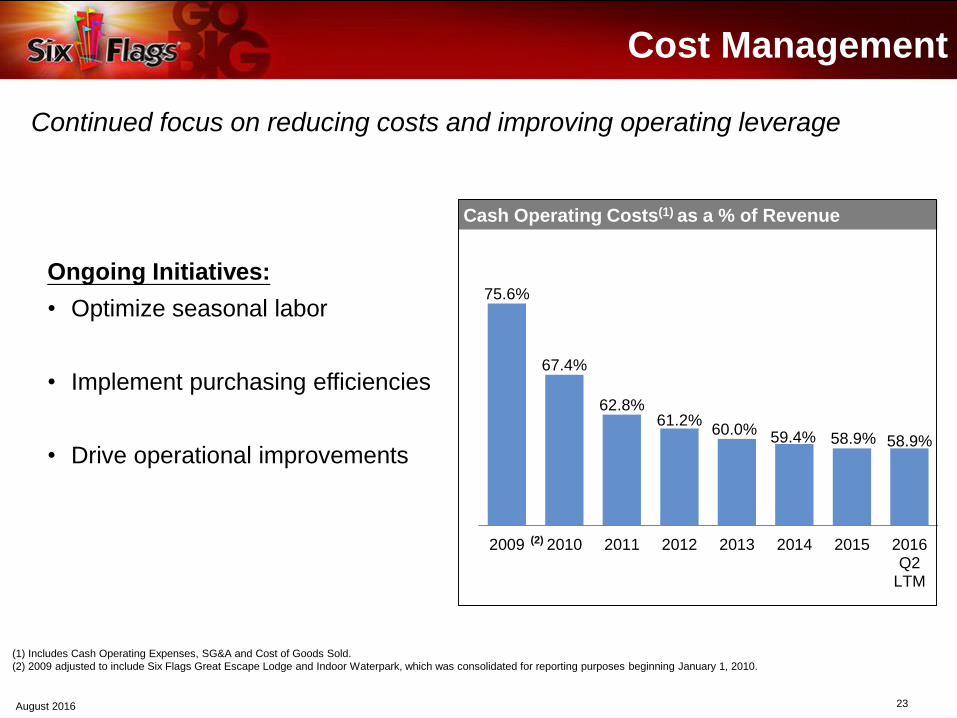
Cost Management
75.6%
67.4%
62.8%61.2%
60.0%59.4% 58.9% 58.9%
2009 2010 2011 2012 2013 2014 2015 2016Q2
LTM
Continued focus on reducing costs and improving operating leverage
Ongoing Initiatives:
• Optimize seasonal labor
• Implement purchasing efficiencies
• Drive operational improvements
Cash Operating Costs(1) as a % of Revenue
(1) Includes Cash Operating Expenses, SG&A and Cost of Goods Sold.
(2) 2009 adjusted to include Six Flags Great Escape Lodge and Indoor Waterpark, which was consolidated for reporting purposes beginning January 1, 2010.
(2)
24August 2016
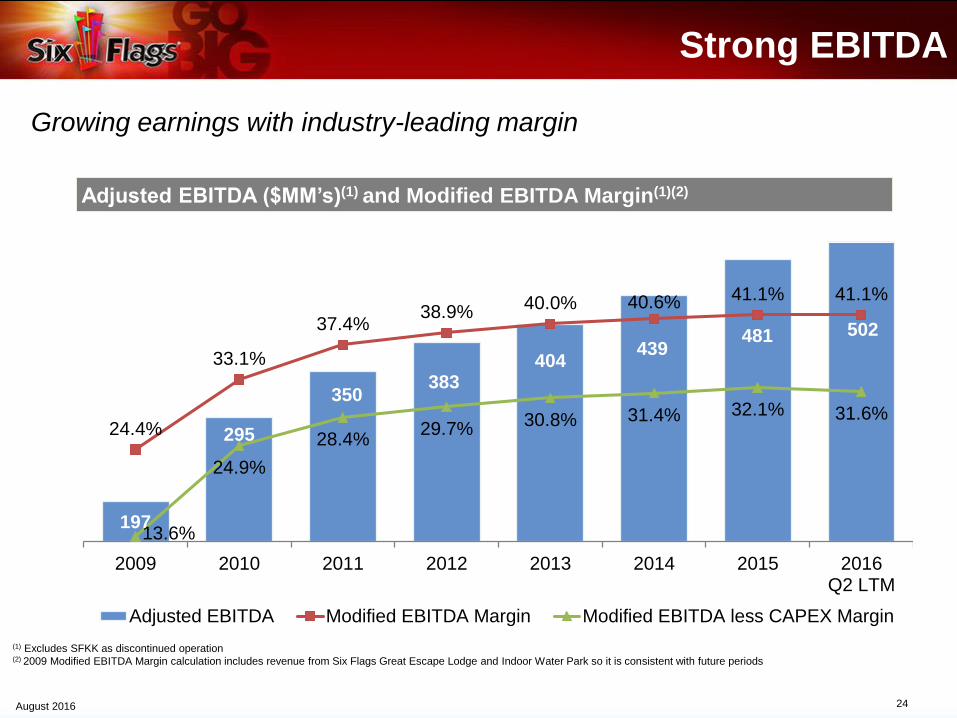
197
295
350383
404439
481 502
24.4%
33.1%
37.4%38.9%
40.0% 40.6% 41.1% 41.1%
13.6%
24.9%
28.4%29.7%
30.8% 31.4% 32.1% 31.6%
2009 2010 2011 2012 2013 2014 2015 2016Q2 LTM
Adjusted EBITDA Modified EBITDA Margin Modified EBITDA less CAPEX Margin
Strong EBITDA
Growing earnings with industry-leading margin
(1) Excludes SFKK as discontinued operation(2) 2009 Modified EBITDA Margin calculation includes revenue from Six Flags Great Escape Lodge and Indoor Water Park so it is consistent with future periods
Adjusted EBITDA ($MM’s)(1) and Modified EBITDA Margin(1)(2)
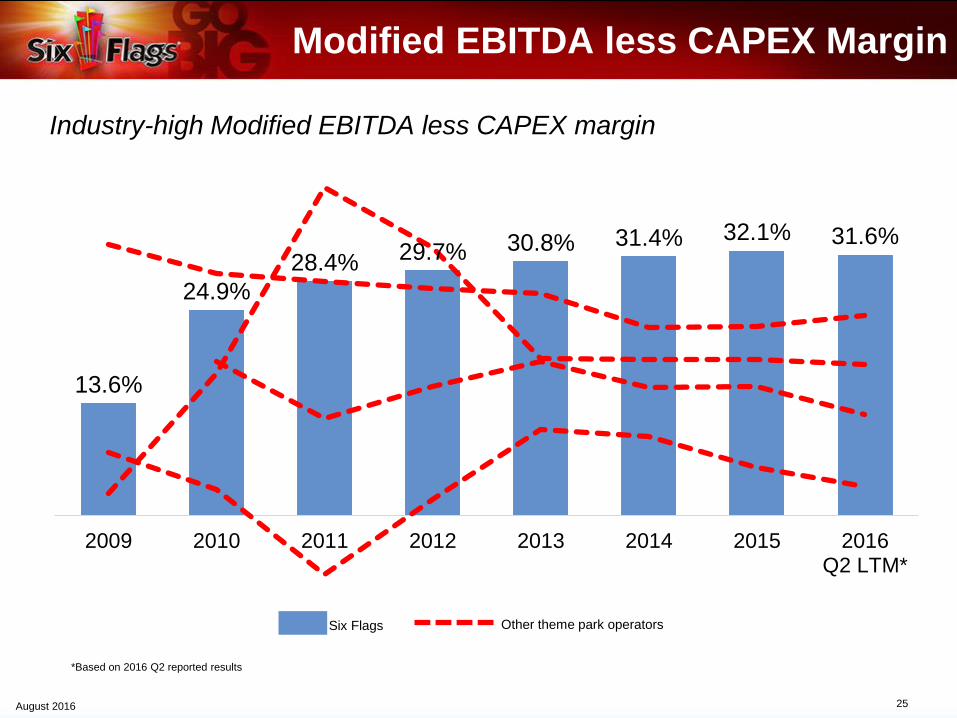
25August 2016
Modified EBITDA less CAPEX Margin
Industry-high Modified EBITDA less CAPEX margin
13.6%
24.9%
28.4% 29.7% 30.8% 31.4% 32.1% 31.6%
2009 2010 2011 2012 2013 2014 2015 2016Q2 LTM*
Six Flags Other theme park operators
*Based on 2016 Q2 reported results
26August 2016
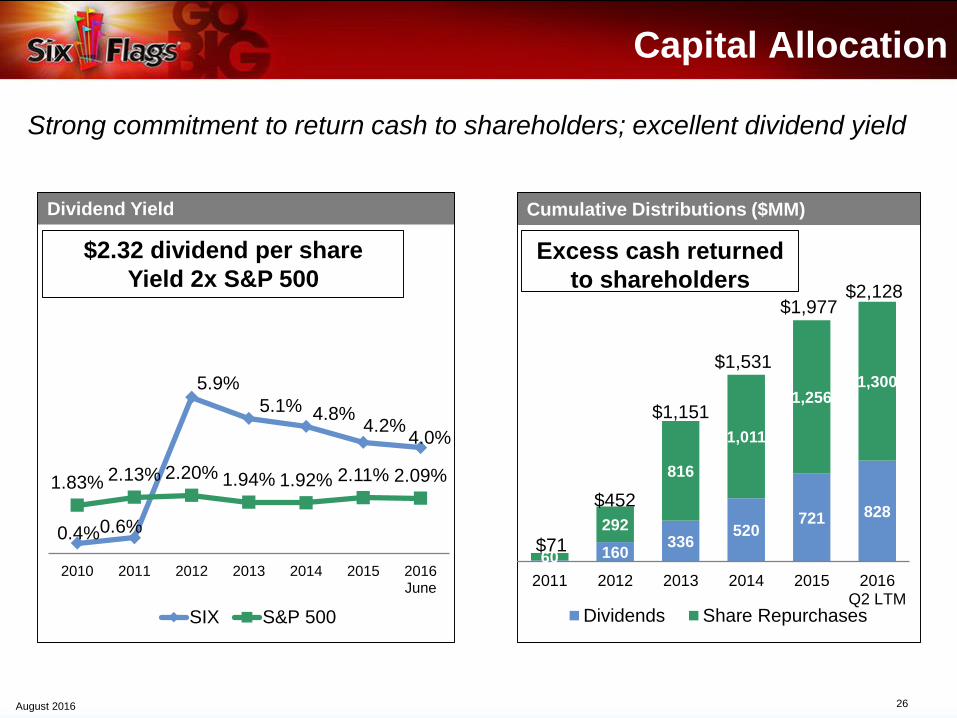
0.4%0.6%
5.9%
5.1% 4.8%4.2%
4.0%
1.83% 2.13% 2.20% 1.94% 1.92% 2.11% 2.09%
2010 2011 2012 2013 2014 2015 2016June
SIX S&P 500
Capital Allocation
Strong commitment to return cash to shareholders; excellent dividend yield
Dividend Yield Cumulative Distributions ($MM)
$2.32 dividend per share
Yield 2x S&P 500
160336
520721 828
60
292
816
1,011
1,2561,300
2011 2012 2013 2014 2015 2016Q2 LTM
Dividends Share Repurchases
$71
$452
$1,151
$1,531
$1,977
Excess cash returned
to shareholders$2,128
27August 2016
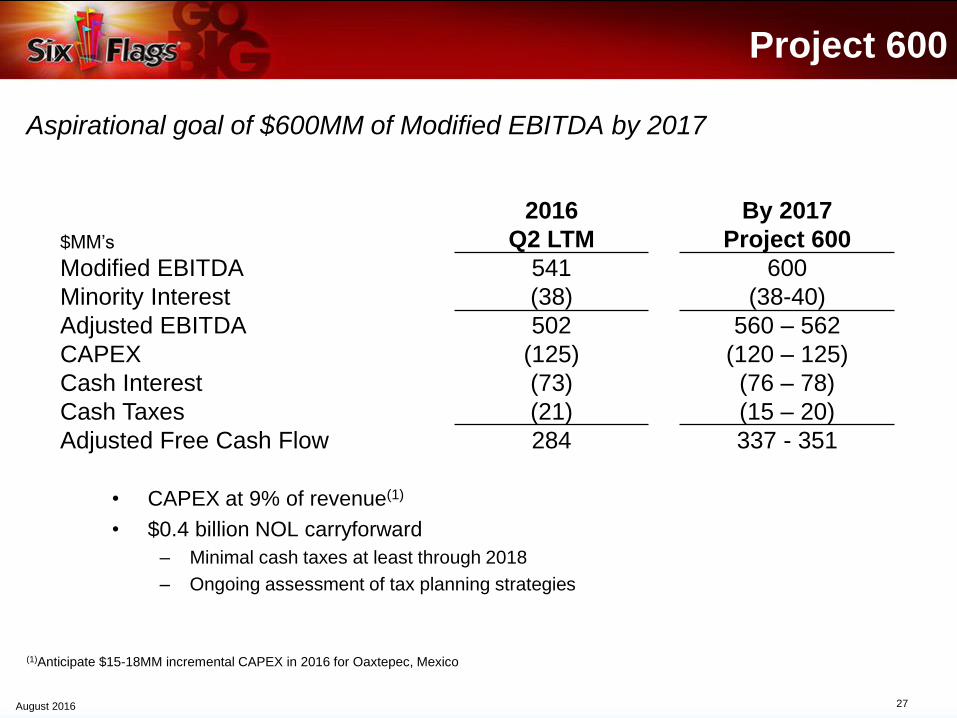
Project 600
• CAPEX at 9% of revenue(1)
• $0.4 billion NOL carryforward
– Minimal cash taxes at least through 2018
– Ongoing assessment of tax planning strategies
Aspirational goal of $600MM of Modified EBITDA by 2017
$MM’s
2016
Q2 LTM
By 2017
Project 600
Modified EBITDA 541 600
Minority Interest (38) (38-40)
Adjusted EBITDA 502 560 – 562
CAPEX (125) (120 – 125)
Cash Interest (73) (76 – 78)
Cash Taxes (21) (15 – 20)
Adjusted Free Cash Flow 284 337 - 351
(1)Anticipate $15-18MM incremental CAPEX in 2016 for Oaxtepec, Mexico
28August 2016
Summary
• Delighting our guests
• Building brand equity
• Leveraging brand outside North America
• Maximizing revenue and cash flow
• Generating strong returns for our shareholders
Delivering shareholder value
29August 2016
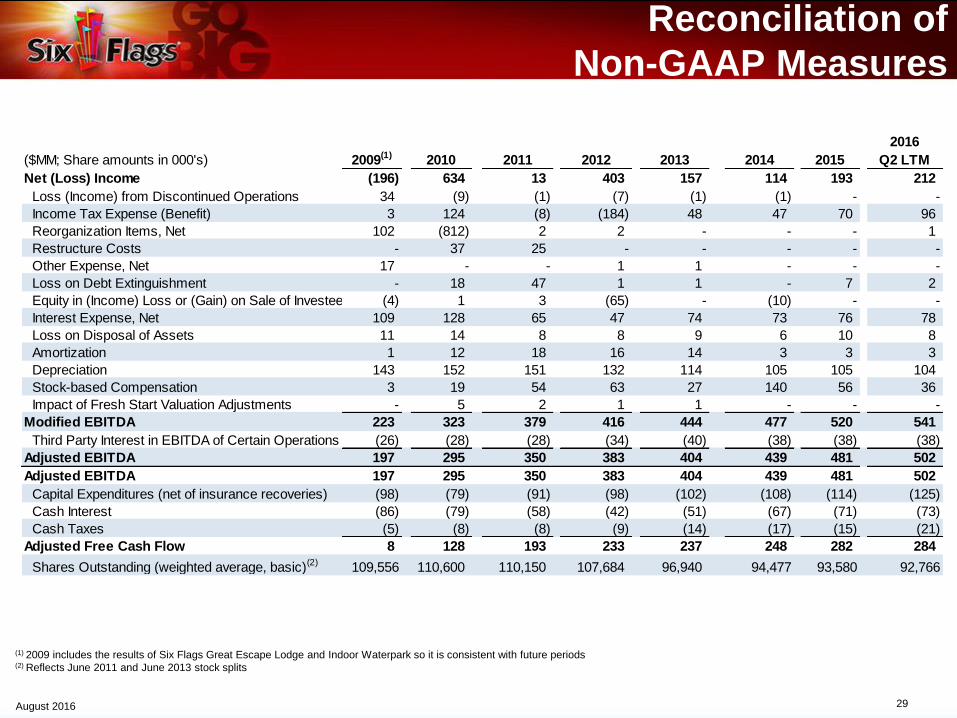
($MM; Share amounts in 000's) 2009(1) 2010 2011 2012 2013 2014 2015
2016
Q2 LTM
Net (Loss) Income (196) 634 13 403 157 114 193 212
Loss (Income) from Discontinued Operations 34 (9) (1) (7) (1) (1) - -
Income Tax Expense (Benefit) 3 124 (8) (184) 48 47 70 96
Reorganization Items, Net 102 (812) 2 2 - - - 1
Restructure Costs - 37 25 - - - - -
Other Expense, Net 17 - - 1 1 - - -
Loss on Debt Extinguishment - 18 47 1 1 - 7 2
Equity in (Income) Loss or (Gain) on Sale of Investee (4) 1 3 (65) - (10) - -
Interest Expense, Net 109 128 65 47 74 73 76 78
Loss on Disposal of Assets 11 14 8 8 9 6 10 8
Amortization 1 12 18 16 14 3 3 3
Depreciation 143 152 151 132 114 105 105 104
Stock-based Compensation 3 19 54 63 27 140 56 36
Impact of Fresh Start Valuation Adjustments - 5 2 1 1 - - -
Modified EBITDA 223 323 379 416 444 477 520 541
Third Party Interest in EBITDA of Certain Operations (26) (28) (28) (34) (40) (38) (38) (38)
Adjusted EBITDA 197 295 350 383 404 439 481 502
Adjusted EBITDA 197 295 350 383 404 439 481 502
Capital Expenditures (net of insurance recoveries) (98) (79) (91) (98) (102) (108) (114) (125)
Cash Interest (86) (79) (58) (42) (51) (67) (71) (73)
Cash Taxes (5) (8) (8) (9) (14) (17) (15) (21)
Adjusted Free Cash Flow 8 128 193 233 237 248 282 284
Shares Outstanding (weighted average, basic)(2) 109,556 110,600 110,150 107,684 96,940 94,477 93,580 92,766
(1) 2009 includes the results of Six Flags Great Escape Lodge and Indoor Waterpark so it is consistent with future periods(2) Reflects June 2011 and June 2013 stock splits
Reconciliation of
Non-GAAP Measures
30August 2016
Disclaimer
Note About Forward-Looking Information
• The information contained in this presentation, other than purely historical information, contains "forward-looking statements" within the meaning of Section 27A of the Securities Act and Section 21E of the
Exchange Act. These statements may involve risks and uncertainties that could cause actual results to differ materially from those described in such statements.
• We caution you that you should not rely on any of these forward-looking statements as statements of historical fact or as guarantees or assurances of future performance. These risks and uncertainties
include, but are not limited to, statements we make regarding: (i) the adequacy of cash flows from operations, available cash and available amounts under our credit facilities to meet our future liquidity needs,
(ii) our ability to roll out our capital enhancements in a timely and cost effective manner, (iii) our ability to improve operating results by implementing strategic cost reductions, and organizational and personnel
changes without adversely affecting our business, and (iv) our operations and results of operations. Additional important factors that could cause actual results to differ materially from those in the forward-
looking statements include regional, national or global political, economic, business, competitive, market and regulatory conditions and include the following: (i) factors impacting attendance, such as local
conditions, contagious diseases, events, disturbances and terrorist activities; (ii) accidents occurring at our parks or other parks in the industry and adverse publicity related thereto; (iii) adverse weather
conditions; (iv) general financial and credit market conditions; (v) economic conditions; (vi) competition with other theme parks and other entertainment alternatives; and (vii) pending, threatened or future legal
proceedings.
• Reference is made to a more complete discussion of forward-looking statements and applicable risks contained under the caption “Cautionary Note Regarding Forward-Looking Statements” and “Risk Factors”
in our Annual Report on Form 10-K for the year ended December 31, 2015 that is available on our website at www.sixflags.com\investors.
• Any forward-looking statement made by us in this presentation, or on our behalf by our directors, officers or employees related to the information contained herein, speaks only as of the date of this
presentation. Factors or events that could cause our actual results to differ may emerge from time to time, and it is not possible for us to predict all of them. We do not intend to update any forward-looking
statement, whether as a result of new information, future developments or otherwise.
Non-GAAP Financial Measures
• The non-GAAP financial measures defined herein are used throughout this presentation and a reconciliation to GAAP has been included in the appendix of this presentation. We believe that these non-GAAP
financial measures provide important and useful information for investors to facilitate a comparison of our operating performance on a consistent basis from period to period and make it easier to compare our
results with those of other companies in our industry. We use these measures for internal planning and forecasting purposes, to evaluate ongoing operations and our performance generally, and in our annual
and long-term incentive plans. By providing these measures, we provide our investors with the ability to review our performance in the same manner as our management.
• However, because these non-GAAP financial measures are not determined in accordance with GAAP, they are susceptible to varying calculations, and not all companies calculate these measures in the
same manner. As a result, these non-GAAP financial measures as presented may not be directly comparable to a similarly titled non-GAAP financial measure presented by another company. These non-
GAAP financial measures are presented as supplemental information and not as alternatives to any GAAP financial measures. When reviewing a non-GAAP financial measure, we encourage our investors to
fully review and consider the related reconciliation as detailed below.
• Modified EBITDA, a non-GAAP measure, is defined as the company’s consolidated income (loss) from continuing operations: excluding the cumulative effect of changes in accounting principles, discontinued
operations gains or losses, income tax expense or benefit, restructure costs or recoveries, reorganization items (net), other income or expense, gain or loss on early extinguishment of debt, equity in income or
loss of investees, interest expense (net), gain or loss on disposal of assets, gain or loss on the sale of investees, amortization, depreciation, stock-based compensation, and fresh start accounting valuation
adjustments. Modified EBITDA as defined herein may differ from similarly titled measures presented by other companies.
• Adjusted EBITDA, a non-GAAP measure, is defined as Modified EBITDA minus the interests of third parties in the Adjusted EBITDA of properties that are less than wholly owned (consisting of Six Flags Over
Georgia, Six Flags White Water Atlanta, and Six Flags Over Texas). Adjusted EBITDA is approximately equal to “Parent Consolidated Adjusted EBITDA” as defined in the company’s secured credit
agreement, except that Parent Consolidated Adjusted EBITDA excludes Adjusted EBITDA from equity investees that is not distributed to the company in cash on a net basis and has limitations on the
amounts of certain expenses that are excluded from the calculation. Adjusted EBITDA as defined herein may differ from similarly titled measures presented by other companies.
• Adjusted Free Cash Flow, a non-GAAP measure, is defined as Adjusted EBITDA less (i) cash paid for interest expense net of interest income receipts, (ii) capital expenditures net of property insurance
recoveries, and (iii) cash taxes. We exclude deferred financing costs related to our debt from the definition of Adjusted Free Cash Flow in order to present our debt costs for the current period without
including the amortization of financing costs that were previously paid. Adjusted Free Cash Flow as defined herein may differ from similarly titled measures presented by other companies.
• Based on our current federal net operating loss carryforwards, we believe we will continue to pay minimal amounts for cash taxes for the next three years. Cash taxes paid represents statutory taxes paid,
primarily in Mexico.
• Cash Operating Expenses include cost of goods sold, SG&A and operating expenses excluding, depreciation, amortization, stock-based compensation, and gain/loss on disposal of assets.
Market and Industry Data
• This presentation includes market, industry and competitor data, forecasts and valuations that have been obtained from independent consultant reports, publicly available information, various industry
publications and other published industry sources. Although we believe these sources are reliable, we have not independently verified the information and cannot make any representation as to the accuracy
or completeness of such information.