Embed Size (px)
Citation preview

Slide 1
5,05
4,10
3,50
4,72
11,82 11,82
Investor presentation
First six months of 2015
Mexico City – part of Cities Changing Diabetes
Slide 2
5,05
4,10
3,50
4,72
11,82 11,82
Agenda
Investor presentation First six months of 2015
Highlights and key events
R&D update
Financials and outlook
Sales update
Slide 3
5,05
4,10
3,50
4,72
11,82 11,82
Investor presentation First six months of 2015
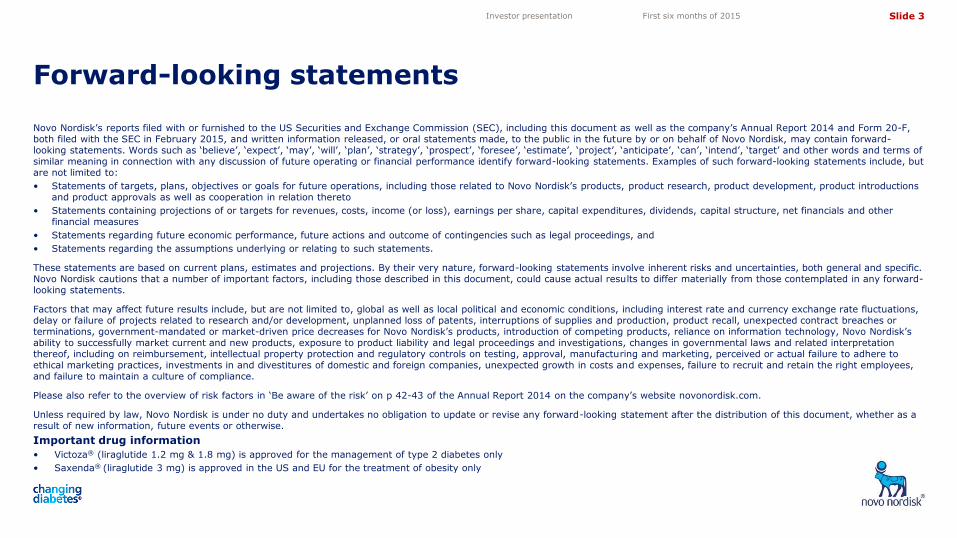
Forward-looking statements
Novo Nordisk’s reports filed with or furnished to the US Securities and Exchange Commission (SEC), including this document as well as the company’s Annual Report 2014 and Form 20-F, both filed with the SEC in February 2015, and written information released, or oral statements made, to the public in the future by or on behalf of Novo Nordisk, may contain forward-looking statements. Words such as ‘believe’, ‘expect’, ‘may’, ‘will’, ‘plan’, ‘strategy’, ‘prospect’, ‘foresee’, ‘estimate’, ‘project’, ‘anticipate’, ‘can’, ‘intend’, ‘target’ and other words and terms of similar meaning in connection with any discussion of future operating or financial performance identify forward-looking statements. Examples of such forward-looking statements include, but are not limited to:
• Statements of targets, plans, objectives or goals for future operations, including those related to Novo Nordisk’s products, product research, product development, product introductions and product approvals as well as cooperation in relation thereto
• Statements containing projections of or targets for revenues, costs, income (or loss), earnings per share, capital expenditures, dividends, capital structure, net financials and other financial measures
• Statements regarding future economic performance, future actions and outcome of contingencies such as legal proceedings, and
• Statements regarding the assumptions underlying or relating to such statements.
These statements are based on current plans, estimates and projections. By their very nature, forward-looking statements involve inherent risks and uncertainties, both general and specific. Novo Nordisk cautions that a number of important factors, including those described in this document, could cause actual results to differ materially from those contemplated in any forward-looking statements.
Factors that may affect future results include, but are not limited to, global as well as local political and economic conditions, including interest rate and currency exchange rate fluctuations, delay or failure of projects related to research and/or development, unplanned loss of patents, interruptions of supplies and production, product recall, unexpected contract breaches or terminations, government-mandated or market-driven price decreases for Novo Nordisk’s products, introduction of competing products, reliance on information technology, Novo Nordisk’s ability to successfully market current and new products, exposure to product liability and legal proceedings and investigations, changes in governmental laws and related interpretation thereof, including on reimbursement, intellectual property protection and regulatory controls on testing, approval, manufacturing and marketing, perceived or actual failure to adhere to ethical marketing practices, investments in and divestitures of domestic and foreign companies, unexpected growth in costs and expenses, failure to recruit and retain the right employees, and failure to maintain a culture of compliance.
Please also refer to the overview of risk factors in ‘Be aware of the risk’ on p 42-43 of the Annual Report 2014 on the company’s website novonordisk.com.
Unless required by law, Novo Nordisk is under no duty and undertakes no obligation to update or revise any forward-looking statement after the distribution of this document, whether as a result of new information, future events or otherwise.
Important drug information
• Victoza® (liraglutide 1.2 mg & 1.8 mg) is approved for the management of type 2 diabetes only
• Saxenda® (liraglutide 3 mg) is approved in the US and EU for the treatment of obesity only
Slide 4
5,05
4,10
3,50
4,72
11,82 11,82
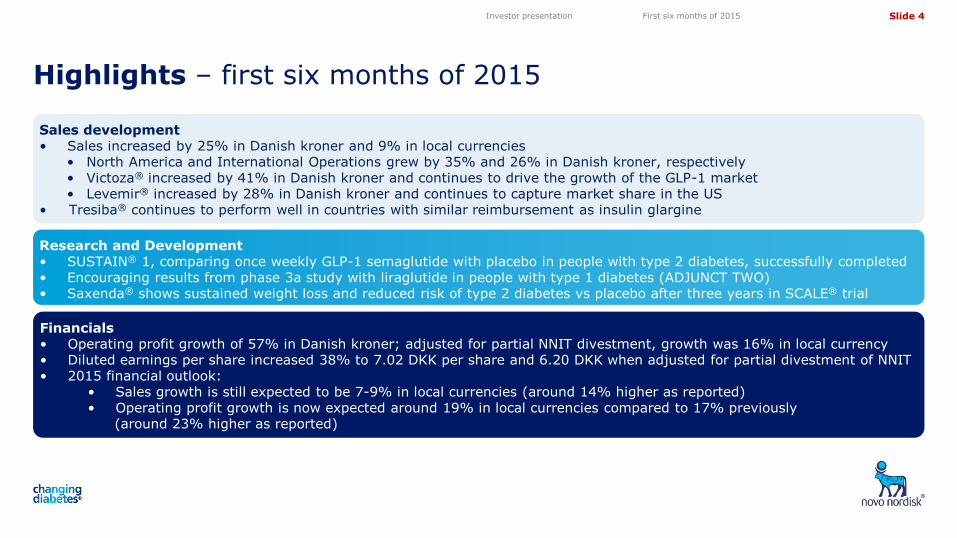
Highlights – first six months of 2015
Investor presentation First six months of 2015
Sales development • Sales increased by 25% in Danish kroner and 9% in local currencies
• North America and International Operations grew by 35% and 26% in Danish kroner, respectively • Victoza® increased by 41% in Danish kroner and continues to drive the growth of the GLP-1 market • Levemir® increased by 28% in Danish kroner and continues to capture market share in the US
• Tresiba® continues to perform well in countries with similar reimbursement as insulin glargine
Research and Development • SUSTAIN® 1, comparing once weekly GLP-1 semaglutide with placebo in people with type 2 diabetes, successfully completed • Encouraging results from phase 3a study with liraglutide in people with type 1 diabetes (ADJUNCT TWO) • Saxenda® shows sustained weight loss and reduced risk of type 2 diabetes vs placebo after three years in SCALE® trial
Financials • Operating profit growth of 57% in Danish kroner; adjusted for partial NNIT divestment, growth was 16% in local currency • Diluted earnings per share increased 38% to 7.02 DKK per share and 6.20 DKK when adjusted for partial divestment of NNIT • 2015 financial outlook:
• Sales growth is still expected to be 7-9% in local currencies (around 14% higher as reported) • Operating profit growth is now expected around 19% in local currencies compared to 17% previously (around 23% higher as reported)
Slide 5
5,05
4,10
3,50
4,72
11,82 11,82
Growth analysis – First six months of 2015
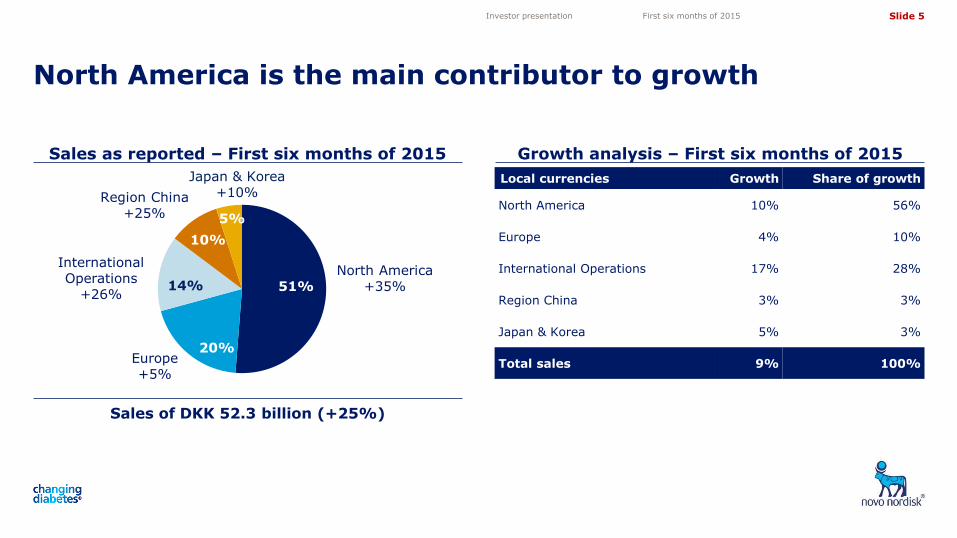
North America is the main contributor to growth
Sales as reported – First six months of 2015
Local currencies Growth Share of growth
North America 10% 56%
Europe 4% 10%
International Operations 17% 28%
Region China 3% 3%
Japan & Korea 5% 3%
Total sales 9% 100%
International Operations
+26%
Region China +25%
Japan & Korea +10%
North America +35%
Europe +5%
51%
20%
14%
10%
5%
Sales of DKK 52.3 billion (+25%)
Investor presentation First six months of 2015
Slide 6
5,05
4,10
3,50
4,72
11,82 11,82
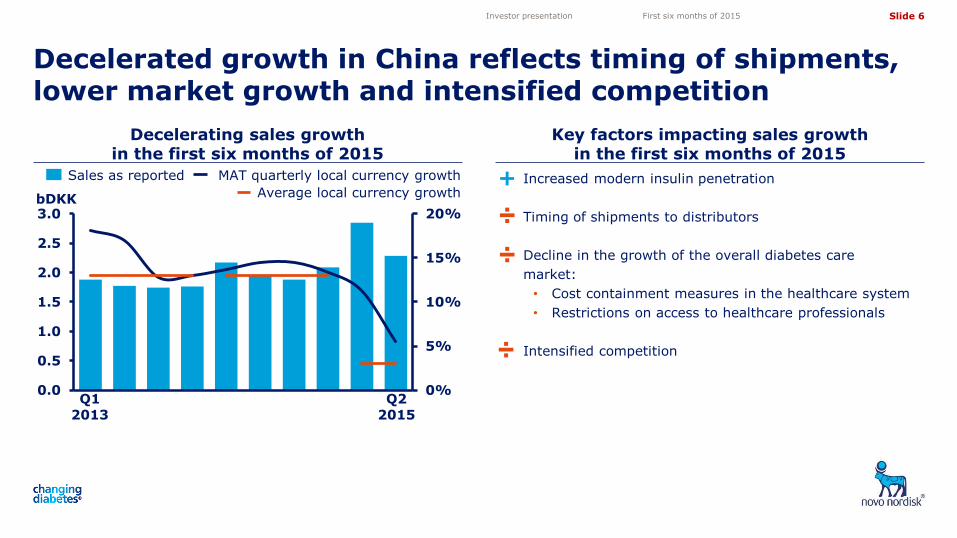
Increased modern insulin penetration
Timing of shipments to distributors
Decline in the growth of the overall diabetes care
market:
• Cost containment measures in the healthcare system
• Restrictions on access to healthcare professionals
Intensified competition
Decelerating sales growth in the first six months of 2015
Key factors impacting sales growth in the first six months of 2015
Decelerated growth in China reflects timing of shipments, lower market growth and intensified competition
Investor presentation First six months of 2015
0%
5%
10%
15%
20%
0.0
0.5
1.0
1.5
2.0
2.5
3.0
Sales as reported
bDKK
Q2 2015
Q1 2013
MAT quarterly local currency growth +
÷
÷
÷
Average local currency growth
Slide 7
5,05
4,10
3,50
4,72
11,82 11,82
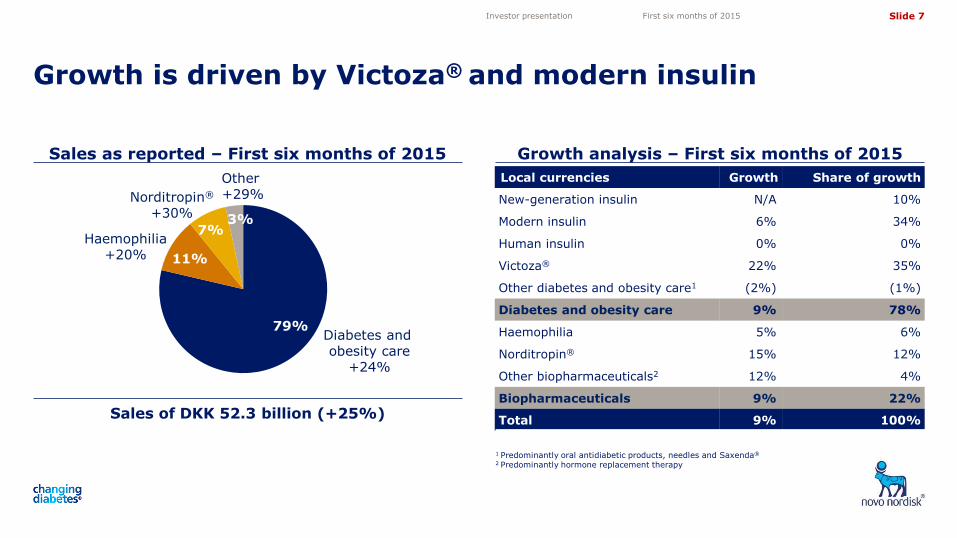
Local currencies Growth Share of growth
New-generation insulin N/A 10%
Modern insulin 6% 34%
Human insulin 0% 0%
Victoza® 22% 35%
Other diabetes and obesity care1 (2%) (1%)
Diabetes and obesity care 9% 78%
Haemophilia 5% 6%
Norditropin® 15% 12%
Other biopharmaceuticals2 12% 4%
Biopharmaceuticals 9% 22%
Total 9% 100%
Growth is driven by Victoza® and modern insulin
Sales as reported – First six months of 2015 Growth analysis – First six months of 2015
1 Predominantly oral antidiabetic products, needles and Saxenda®
2 Predominantly hormone replacement therapy
Other +29%
7% Haemophilia
+20% 11%
Diabetes and obesity care
+24%
79%
3%
79%
11%
7% 3%
Norditropin®
+30%
Sales of DKK 52.3 billion (+25%)
Investor presentation First six months of 2015
Slide 8
5,05
4,10
3,50
4,72
11,82 11,82
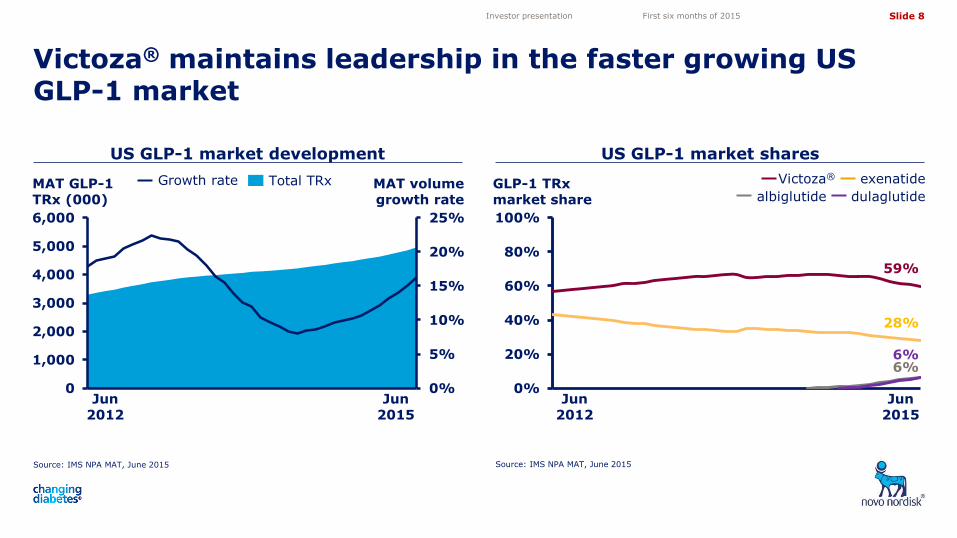
59%
6% 6%
28%
0%
20%
40%
60%
80%
100%
Source: IMS NPA MAT, June 2015
US GLP-1 market development
Source: IMS NPA MAT, June 2015
Victoza® maintains leadership in the faster growing US GLP-1 market
Jun 2015
Jun 2012
Jun 2012
Total TRx Growth rate
0%
5%
10%
15%
20%
25%
0
1,000
2,000
3,000
4,000
5,000
6,000
Thousands
US GLP-1 market shares
exenatide Victoza®
albiglutide dulaglutide
Jun 2015
MAT GLP-1 TRx (000)
GLP-1 TRx market share
MAT volume growth rate
Investor presentation First six months of 2015
Slide 9
5,05
4,10
3,50
4,72
11,82 11,82
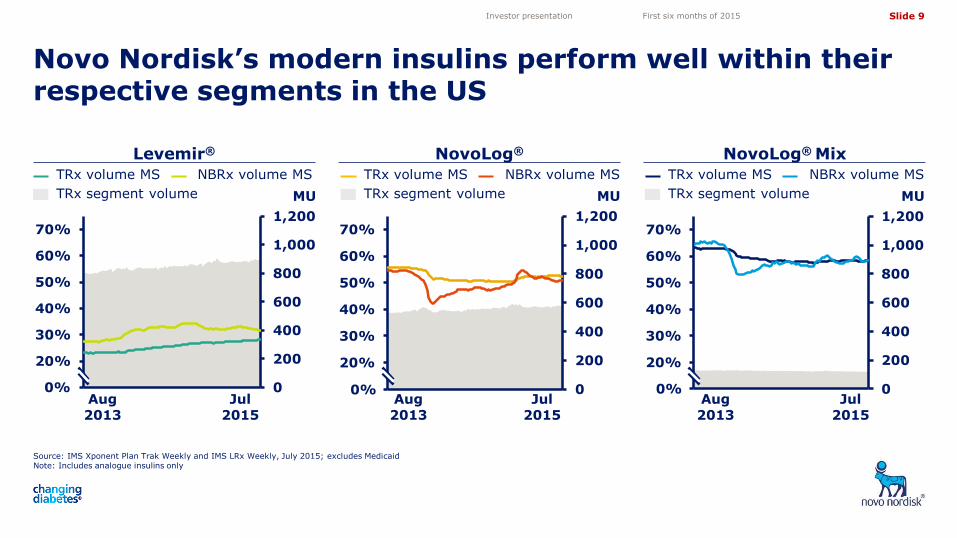
Levemir®
Novo Nordisk’s modern insulins perform well within their respective segments in the US
NovoLog® Mix
NovoLog®
Investor presentation First six months of 2015
Aug 2013
Jul 2015
Aug 2013
Jul 2015
Aug 2013
Jul 2015
TRx volume MS
TRx segment volume
NBRx volume MS
MU MU MU
TRx volume MS
TRx segment volume
NBRx volume MS TRx volume MS
TRx segment volume
NBRx volume MS
0
200
400
600
800
1,000
1,200
10%
20%
30%
40%
50%
60%
70%
Source: IMS Xponent Plan Trak Weekly and IMS LRx Weekly, July 2015; excludes Medicaid Note: Includes analogue insulins only
0
200
400
600
800
1,000
1,200
10%
20%
30%
40%
50%
60%
70%
0
200
400
600
800
1,000
1,200
10%
20%
30%
40%
50%
60%
70%
0% 0% 0%
Slide 10
5,05
4,10
3,50
4,72
11,82 11,82
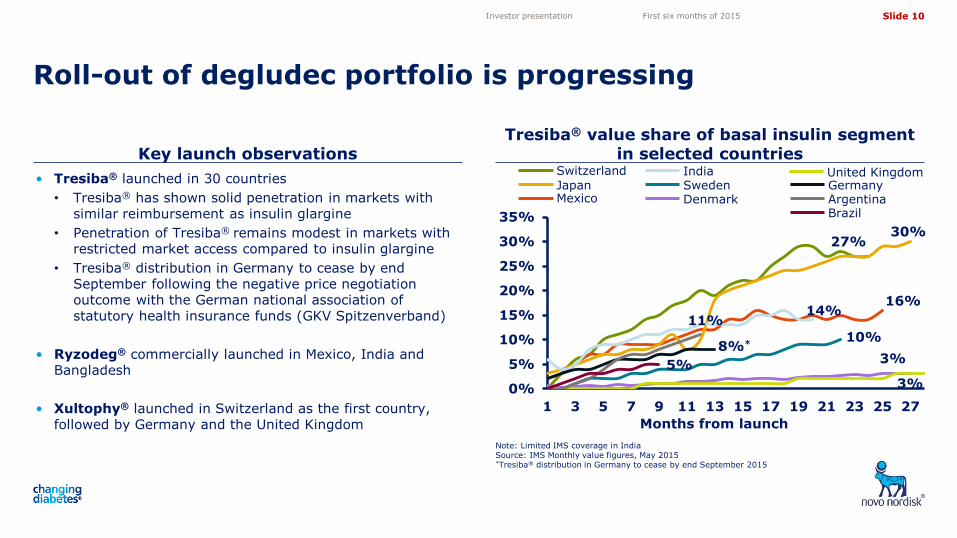
Key launch observations Tresiba® value share of basal insulin segment
in selected countries
Roll-out of degludec portfolio is progressing
Note: Limited IMS coverage in India Source: IMS Monthly value figures, May 2015 *Tresiba® distribution in Germany to cease by end September 2015
Months from launch
• Tresiba® launched in 30 countries
• Tresiba® has shown solid penetration in markets with similar reimbursement as insulin glargine
• Penetration of Tresiba® remains modest in markets with restricted market access compared to insulin glargine
• Tresiba® distribution in Germany to cease by end September following the negative price negotiation outcome with the German national association of statutory health insurance funds (GKV Spitzenverband)
• Ryzodeg® commercially launched in Mexico, India and Bangladesh
• Xultophy® launched in Switzerland as the first country, followed by Germany and the United Kingdom
30%
5%
11%
8%*
3%
3%
10%
14% 16%
27%
0%
5%
10%
15%
20%
25%
30%
35%
1 3 5 7 9 11 13 15 17 19 21 23 25 27
Mexico
Switzerland
Japan India Sweden Denmark
Germany Argentina Brazil
United Kingdom
Investor presentation First six months of 2015
Slide 11
5,05
4,10
3,50
4,72
11,82 11,82
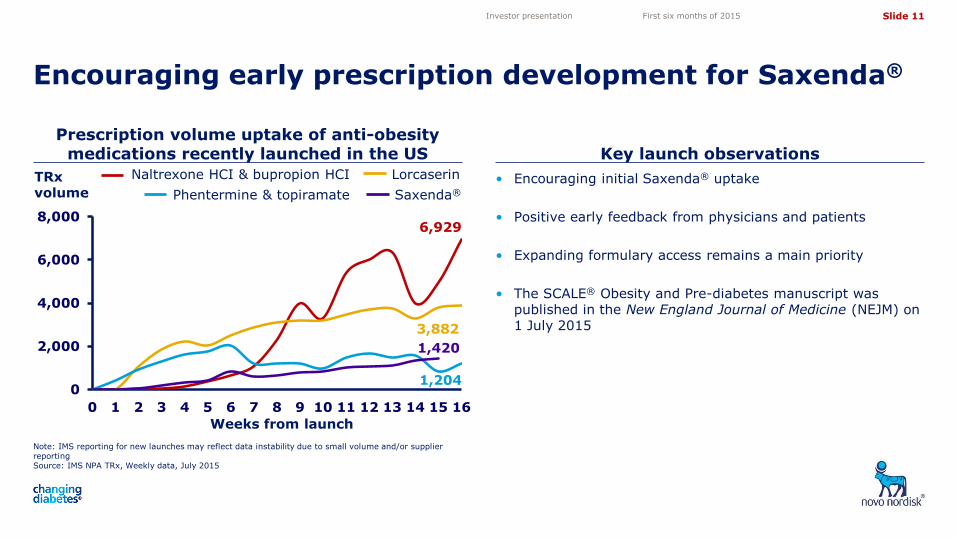
6,929
3,882
1,420
1,204 0
2,000
4,000
6,000
8,000
0 1 2 3 4 5 6 7 8 9 10 11 12 13 14 15 16
• Encouraging initial Saxenda® uptake
• Positive early feedback from physicians and patients
• Expanding formulary access remains a main priority
• The SCALE® Obesity and Pre-diabetes manuscript was published in the New England Journal of Medicine (NEJM) on 1 July 2015
Note: IMS reporting for new launches may reflect data instability due to small volume and/or supplier reporting Source: IMS NPA TRx, Weekly data, July 2015
Prescription volume uptake of anti-obesity medications recently launched in the US Key launch observations
Encouraging early prescription development for Saxenda®
Investor presentation First six months of 2015
TRx volume
Weeks from launch
Saxenda®
Lorcaserin
Phentermine & topiramate
Naltrexone HCI & bupropion HCI
Slide 12
5,05
4,10
3,50
4,72
11,82 11,82
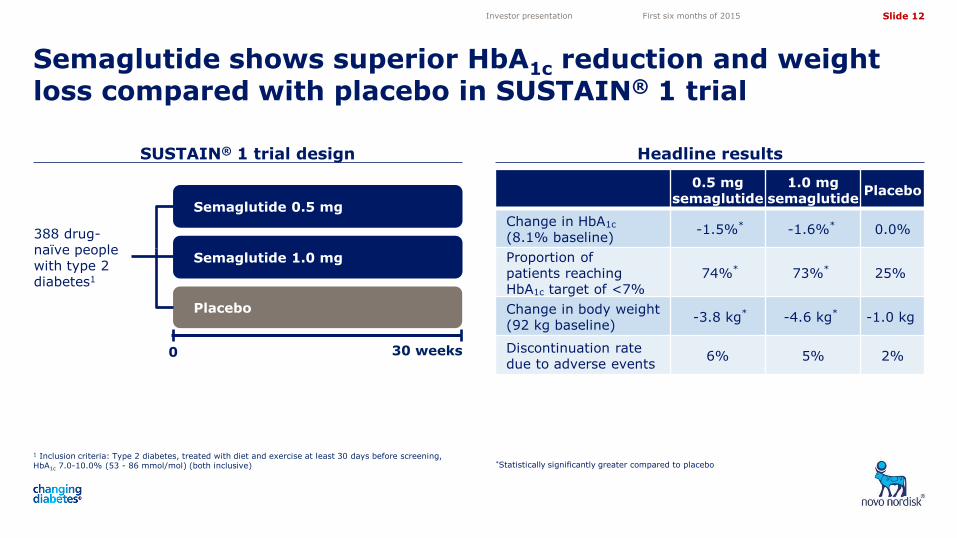
SUSTAIN® 1 trial design Headline results
0.5 mg
semaglutide 1.0 mg
semaglutide Placebo
Change in HbA1c (8.1% baseline)
-1.5%* -1.6%* 0.0%
Proportion of patients reaching HbA1c target of <7%
74%* 73%* 25%
Change in body weight (92 kg baseline)
-3.8 kg* -4.6 kg* -1.0 kg
Discontinuation rate due to adverse events
6% 5% 2%
Semaglutide shows superior HbA1c reduction and weight loss compared with placebo in SUSTAIN® 1 trial
1 Inclusion criteria: Type 2 diabetes, treated with diet and exercise at least 30 days before screening, HbA1c 7.0-10.0% (53 - 86 mmol/mol) (both inclusive) *Statistically significantly greater compared to placebo
Investor presentation First six months of 2015
Placebo
Semaglutide 0.5 mg
0 30 weeks
388 drug-naïve people with type 2 diabetes1
Semaglutide 1.0 mg
Slide 13
5,05
4,10
3,50
4,72
11,82 11,82
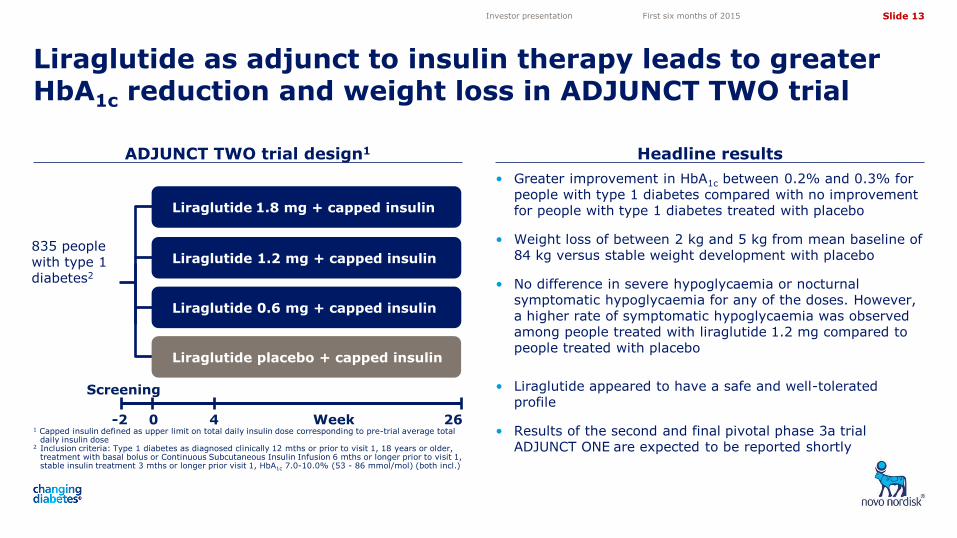
• Greater improvement in HbA1c between 0.2% and 0.3% for people with type 1 diabetes compared with no improvement for people with type 1 diabetes treated with placebo
• Weight loss of between 2 kg and 5 kg from mean baseline of 84 kg versus stable weight development with placebo
• No difference in severe hypoglycaemia or nocturnal symptomatic hypoglycaemia for any of the doses. However, a higher rate of symptomatic hypoglycaemia was observed among people treated with liraglutide 1.2 mg compared to people treated with placebo
• Liraglutide appeared to have a safe and well-tolerated profile
• Results of the second and final pivotal phase 3a trial ADJUNCT ONE are expected to be reported shortly
ADJUNCT TWO trial design1 Headline results
Liraglutide as adjunct to insulin therapy leads to greater HbA1c reduction and weight loss in ADJUNCT TWO trial
Investor presentation First six months of 2015
26
835 people with type 1 diabetes2
1 Capped insulin defined as upper limit on total daily insulin dose corresponding to pre-trial average total daily insulin dose
2 Inclusion criteria: Type 1 diabetes as diagnosed clinically 12 mths or prior to visit 1, 18 years or older, treatment with basal bolus or Continuous Subcutaneous Insulin Infusion 6 mths or longer prior to visit 1, stable insulin treatment 3 mths or longer prior visit 1, HbA1c 7.0-10.0% (53 - 86 mmol/mol) (both incl.)
0 Week 4 -2
Screening
Liraglutide placebo + capped insulin
Liraglutide 1.8 mg + capped insulin
Liraglutide 1.2 mg + capped insulin
Liraglutide 0.6 mg + capped insulin
Slide 14
5,05
4,10
3,50
4,72
11,82 11,82
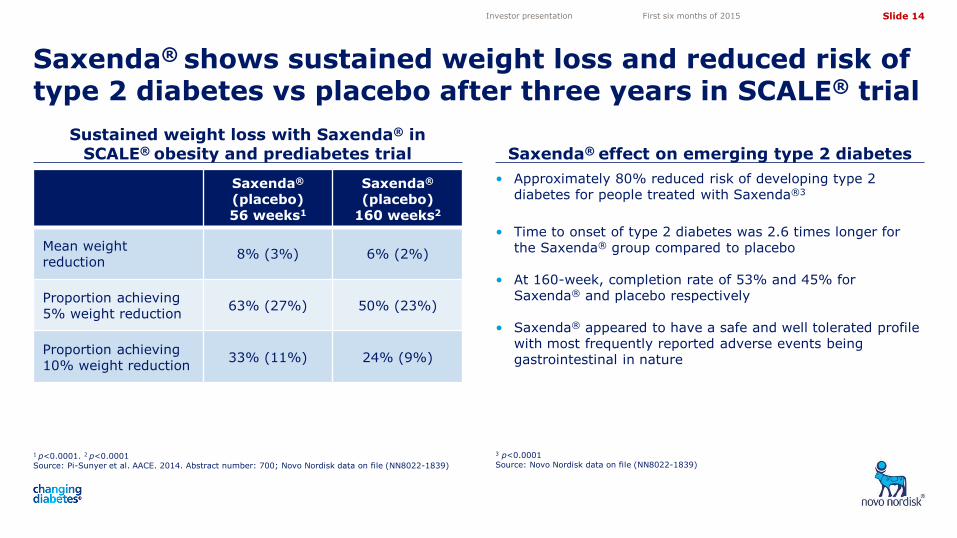
• Approximately 80% reduced risk of developing type 2 diabetes for people treated with Saxenda®3
• Time to onset of type 2 diabetes was 2.6 times longer for the Saxenda® group compared to placebo
• At 160-week, completion rate of 53% and 45% for Saxenda® and placebo respectively
• Saxenda® appeared to have a safe and well tolerated profile with most frequently reported adverse events being gastrointestinal in nature
1 p<0.0001. 2 p<0.0001 Source: Pi-Sunyer et al. AACE. 2014. Abstract number: 700; Novo Nordisk data on file (NN8022-1839)
Sustained weight loss with Saxenda® in SCALE® obesity and prediabetes trial Saxenda® effect on emerging type 2 diabetes
Saxenda® shows sustained weight loss and reduced risk of type 2 diabetes vs placebo after three years in SCALE® trial
3 p<0.0001 Source: Novo Nordisk data on file (NN8022-1839)
Saxenda® (placebo) 56 weeks1
Saxenda®
(placebo) 160 weeks2
Mean weight reduction
8% (3%) 6% (2%)
Proportion achieving 5% weight reduction
63% (27%) 50% (23%)
Proportion achieving 10% weight reduction
33% (11%) 24% (9%)
Investor presentation First six months of 2015
Slide 15
5,05
4,10
3,50
4,72
11,82 11,82
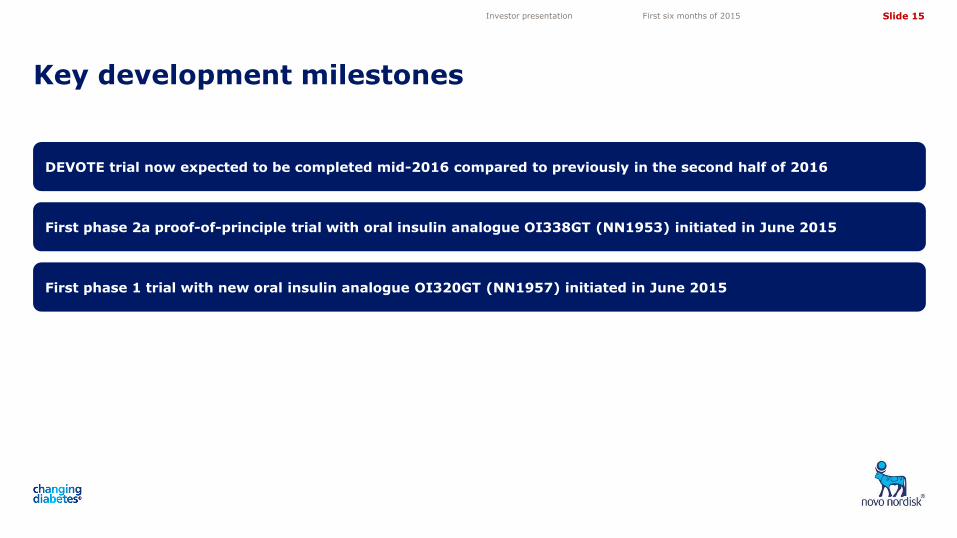
Key development milestones
Investor presentation First six months of 2015
DEVOTE trial now expected to be completed mid-2016 compared to previously in the second half of 2016
First phase 1 trial with new oral insulin analogue OI320GT (NN1957) initiated in June 2015
First phase 2a proof-of-principle trial with oral insulin analogue OI338GT (NN1953) initiated in June 2015
Slide 16
5,05
4,10
3,50
4,72
11,82 11,82
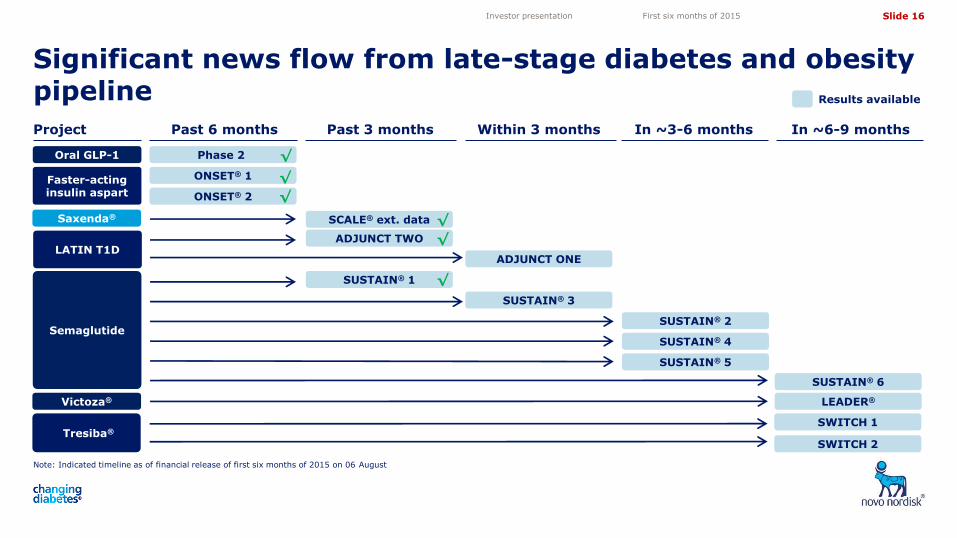
Significant news flow from late-stage diabetes and obesity pipeline
Investor presentation First six months of 2015
Project Past 6 months Past 3 months Within 3 months In ~3-6 months
Oral GLP-1 Phase 2
Faster-acting insulin aspart
LATIN T1D ADJUNCT TWO
Results available
In ~6-9 months
Semaglutide
SUSTAIN® 1
SUSTAIN® 3
SUSTAIN® 2
SUSTAIN® 4
SUSTAIN® 5
Victoza®
SUSTAIN® 6
LEADER®
Saxenda® SCALE® ext. data
ONSET® 1 √
ONSET® 2 √
√
Tresiba® SWITCH 1
SWITCH 2
√
√
√
Note: Indicated timeline as of financial release of first six months of 2015 on 06 August
ADJUNCT ONE
Slide 17
5,05
4,10
3,50
4,72
11,82 11,82
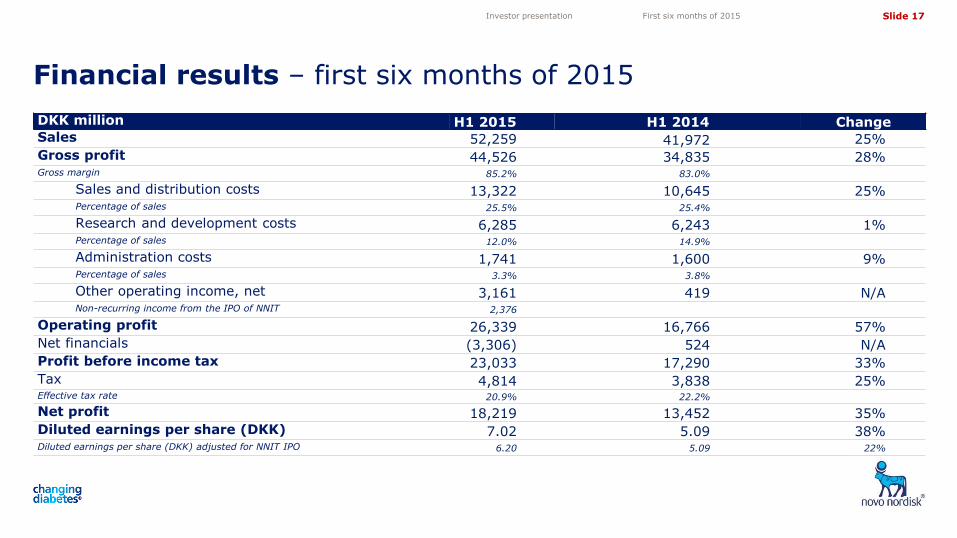
DKK million H1 2015 H1 2014 Change Sales 52,259 41,972 25% Gross profit 44,526 34,835 28% Gross margin 85.2% 83.0%
Sales and distribution costs 13,322 10,645 25% Percentage of sales 25.5% 25.4%
Research and development costs 6,285 6,243 1% Percentage of sales 12.0% 14.9%
Administration costs 1,741 1,600 9% Percentage of sales 3.3% 3.8%
Other operating income, net 3,161 419 N/A Non-recurring income from the IPO of NNIT 2,376
Operating profit 26,339 16,766 57% Net financials (3,306) 524 N/A Profit before income tax 23,033 17,290 33% Tax 4,814 3,838 25% Effective tax rate 20.9% 22.2%
Net profit 18,219 13,452 35% Diluted earnings per share (DKK) 7.02 5.09 38% Diluted earnings per share (DKK) adjusted for NNIT IPO 6.20 5.09 22%
Financial results – first six months of 2015
Investor presentation First six months of 2015
Slide 18
5,05
4,10
3,50
4,72
11,82 11,82
3 1 2 4 1 2 40
60
80
100
120
140
90
95
100
105
110
115
120
125
130
135
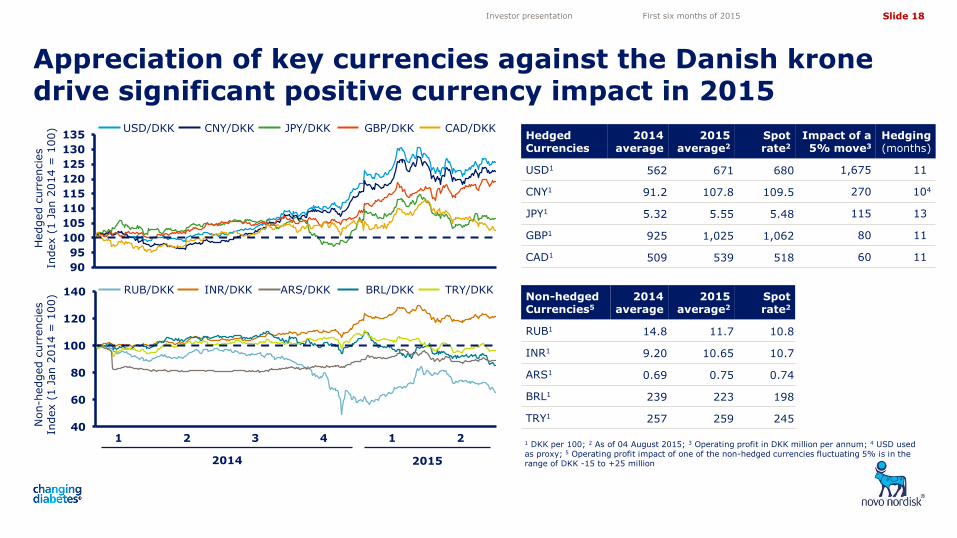
Appreciation of key currencies against the Danish krone drive significant positive currency impact in 2015
Investor presentation First six months of 2015
Hedged c
urr
encie
s
Index (
1 J
an 2
014 =
100)
CNY/DKK JPY/DKK USD/DKK
Non-h
edged c
urr
encie
s
Index (
1 J
an 2
014 =
100)
2014
CAD/DKK GBP/DKK
1 DKK per 100; 2 As of 04 August 2015; 3 Operating profit in DKK million per annum; 4 USD used as proxy; 5 Operating profit impact of one of the non-hedged currencies fluctuating 5% is in the range of DKK -15 to +25 million
Hedged Currencies
2014 average
2015 average2
Spot rate2
Impact of a 5% move3
Hedging (months)
USD1 562 671 680 1,675 11
CNY1 91.2 107.8 109.5 270 104
JPY1 5.32 5.55 5.48 115 13
GBP1 925 1,025 1,062 80 11
CAD1 509 539 518 60 11
Non-hedged Currencies5
2014 average
2015 average2
Spot rate2
RUB1 14.8 11.7 10.8
INR1 9.20 10.65 10.7
ARS1 0.69 0.75 0.74
BRL1 239 223 198
TRY1 257 259 245
INR/DKK ARS/DKK RUB/DKK TRY/DKK BRL/DKK
2015
Slide 19
5,05
4,10
3,50
4,72
11,82 11,82
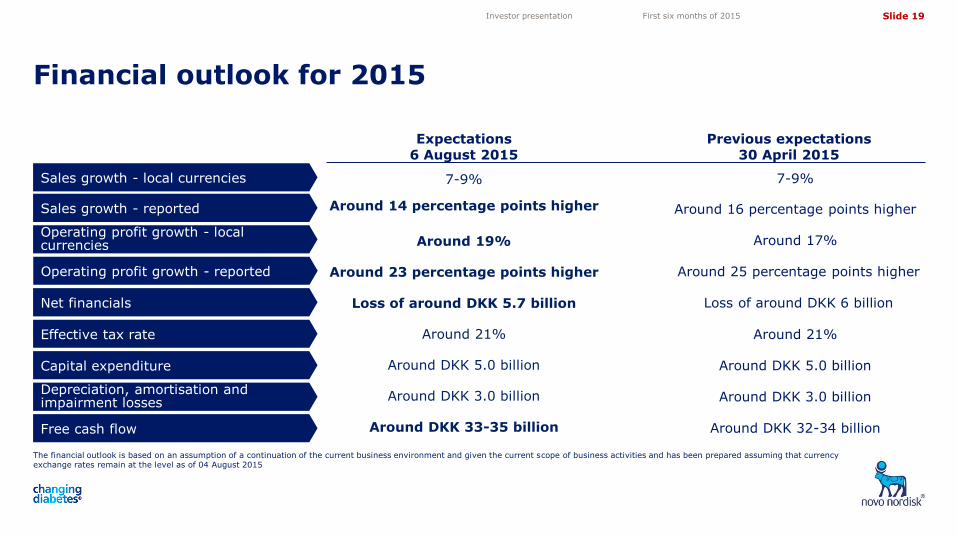
Financial outlook for 2015
The financial outlook is based on an assumption of a continuation of the current business environment and given the current scope of business activities and has been prepared assuming that currency exchange rates remain at the level as of 04 August 2015
Investor presentation First six months of 2015
Sales growth - local currencies
Sales growth - reported
Operating profit growth - local currencies
Operating profit growth - reported
Net financials
Effective tax rate
Capital expenditure
Free cash flow
Expectations 6 August 2015
7-9%
Around 14 percentage points higher
Around 19%
Around 23 percentage points higher
Loss of around DKK 5.7 billion
Around 21%
Around DKK 5.0 billion
Around DKK 3.0 billion
Around DKK 33-35 billion
Previous expectations 30 April 2015
Depreciation, amortisation and impairment losses
7-9%
Around 16 percentage points higher
Around 17%
Around 25 percentage points higher
Loss of around DKK 6 billion
Around 21%
Around DKK 5.0 billion
Around DKK 3.0 billion
Around DKK 32-34 billion
Slide 20
5,05
4,10
3,50
4,72
11,82 11,82
Source: IMS MAT May 2015 volume and value (DKK) figures
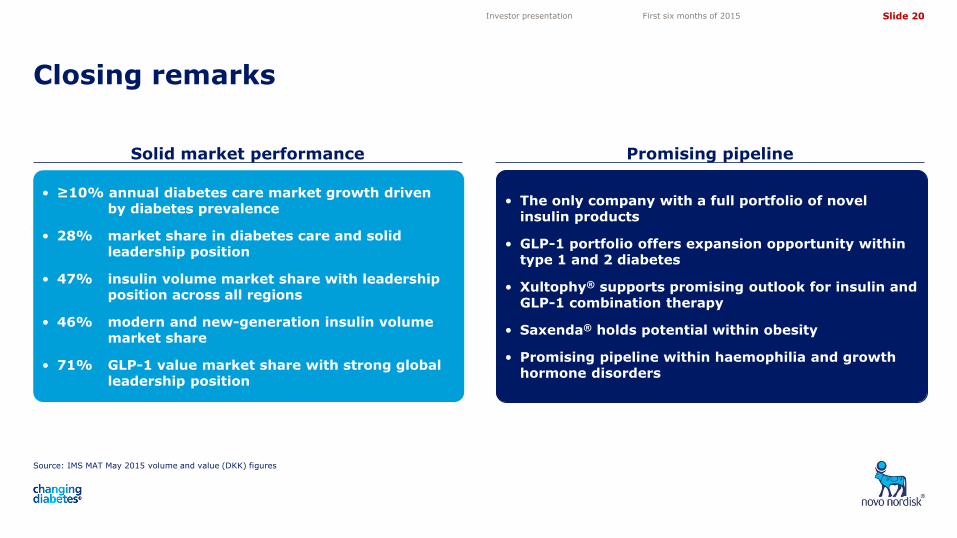
Solid market performance Promising pipeline
Closing remarks
> > • The only company with a full portfolio of novel
insulin products
• GLP-1 portfolio offers expansion opportunity within type 1 and 2 diabetes
• Xultophy® supports promising outlook for insulin and GLP-1 combination therapy
• Saxenda® holds potential within obesity
• Promising pipeline within haemophilia and growth hormone disorders
• ≥10% annual diabetes care market growth driven by diabetes prevalence
• 28% market share in diabetes care and solid leadership position
• 47% insulin volume market share with leadership position across all regions
• 46% modern and new-generation insulin volume c market share
• 71% GLP-1 value market share with strong global leadership position
Investor presentation First six months of 2015
Slide 21
5,05
4,10
3,50
4,72
11,82 11,82
Share information Investor Relations contacts
Investor contact information
Novo Nordisk’s B shares are listed on the stock exchange in Copenhagen under the symbol ‘NOVO B’. Its ADRs are listed on the New York Stock Exchange under the symbol ‘NVO’. For further company information, visit Novo Nordisk on the internet at: novonordisk.com
Kasper Roseeuw Poulsen +45 3079 4303 [email protected]
Daniel Bohsen +45 3079 6376 [email protected]
Melanie Raouzeos +45 3075 3479 [email protected]
In North America:
Frank Daniel Mersebach
+1 609 235 8567
Novo Nordisk A/S Investor Relations Novo Allé, DK-2880 Bagsværd
29 Oct 2015 Financial statement for the first nine months of 2015
03 Feb 2016 Financial statement for 2015
Upcoming events
Investor presentation First six months of 2015
Slide 22
5,05
4,10
3,50
4,72
11,82 11,82
Appendix
Investor presentation First six months of 2015
1. Novo Nordisk at a glance
3. Biopharmaceuticals
4. Financials
2. Diabetes
Slide 23
5,05
4,10
3,50
4,72
11,82 11,82
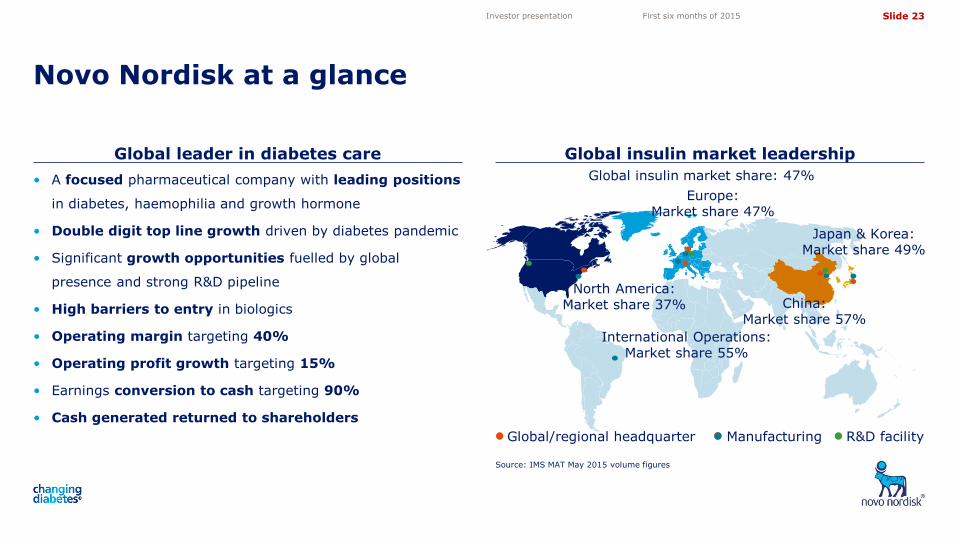
Global leader in diabetes care Global insulin market leadership
Novo Nordisk at a glance
Source: IMS MAT May 2015 volume figures
Investor presentation First six months of 2015
R&D facility Manufacturing Global/regional headquarter
North America: Market share 37%
International Operations: Market share 55%
Japan & Korea: Market share 49%
Europe: Market share 47%
China: Market share 57%
Global insulin market share: 47% • A focused pharmaceutical company with leading positions
in diabetes, haemophilia and growth hormone
• Double digit top line growth driven by diabetes pandemic
• Significant growth opportunities fuelled by global
presence and strong R&D pipeline
• High barriers to entry in biologics
• Operating margin targeting 40%
• Operating profit growth targeting 15%
• Earnings conversion to cash targeting 90%
• Cash generated returned to shareholders
Slide 24
5,05
4,10
3,50
4,72
11,82 11,82
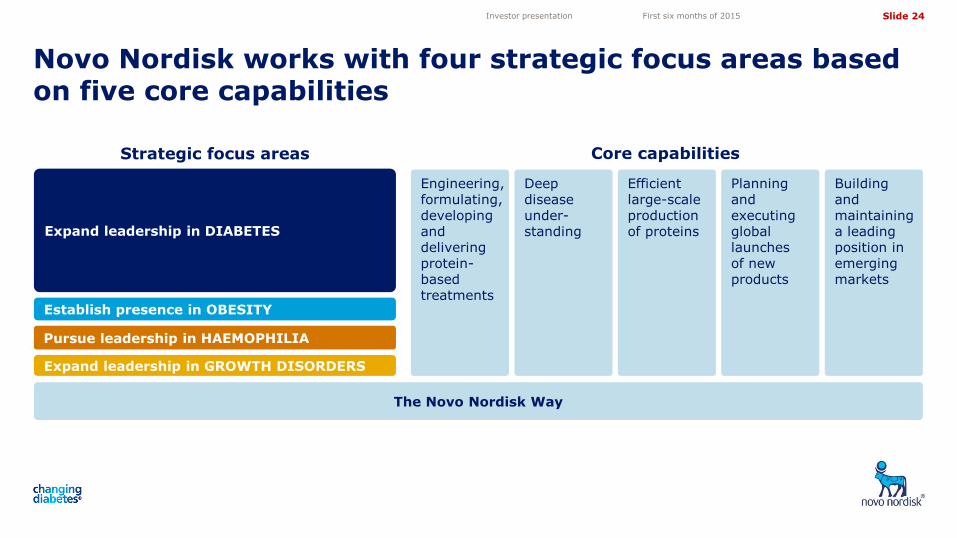
Novo Nordisk works with four strategic focus areas based on five core capabilities
Investor presentation First six months of 2015
Core capabilities
Expand leadership
Expand leadership in DIABETES
Pursue leadership in HAEMOPHILIA
Establish presence in OBESITY
Expand leadership in GROWTH DISORDERS
Strategic focus areas
The Novo Nordisk Way
Engineering, formulating, developing and delivering protein- based treatments
Deep disease under- standing
Efficient large-scale production of proteins
Building and maintaining a leading position in emerging markets
Planning and executing global launches of new products
Slide 25
5,05
4,10
3,50
4,72
11,82 11,82
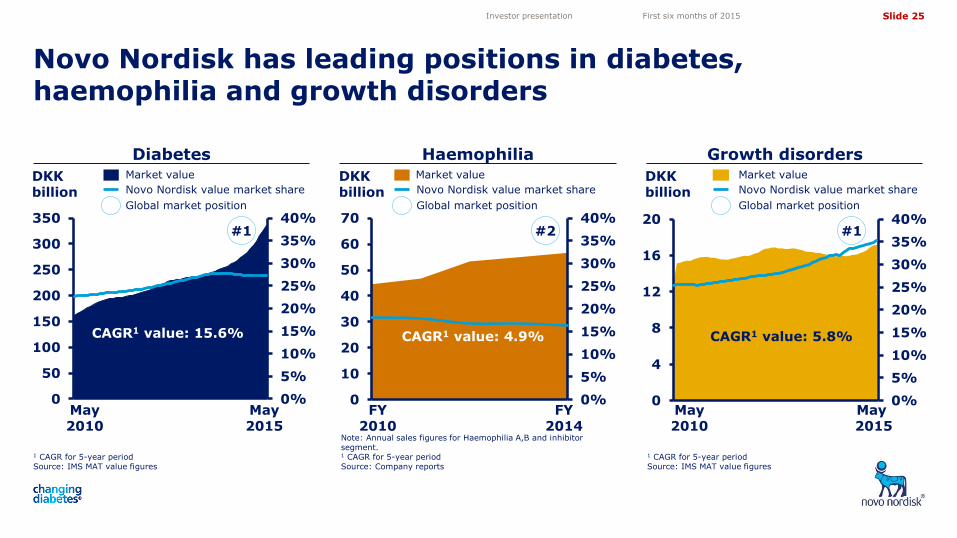
Novo Nordisk has leading positions in diabetes, haemophilia and growth disorders
Investor presentation First six months of 2015
DKK billion
1 CAGR for 5-year period Source: IMS MAT value figures
Growth disorders Diabetes
DKK billion Novo Nordisk value market share
Global market position
Market value
1 CAGR for 5-year period Source: IMS MAT value figures
0%
5%
10%
15%
20%
25%
30%
35%
40%
0
50
100
150
200
250
300
350#1
0%
5%
10%
15%
20%
25%
30%
35%
40%
0
4
8
12
16
20#1
CAGR1 value: 15.6% CAGR1 value: 5.8%
May 2010
May 2015
May 2010
May 2015
Market value
0%
5%
10%
15%
20%
25%
30%
35%
40%
0
10
20
30
40
50
60
70
DKK billion
Haemophilia Market value
Note: Annual sales figures for Haemophilia A,B and inhibitor segment. 1 CAGR for 5-year period Source: Company reports
#2
CAGR1 value: 4.9%
FY 2010
FY 2014
Novo Nordisk value market share
Global market position
Novo Nordisk value market share
Global market position
Slide 26
5,05
4,10
3,50
4,72
11,82 11,82
0
100
200
300
400
500
600
0
5
10
15
20
25
30
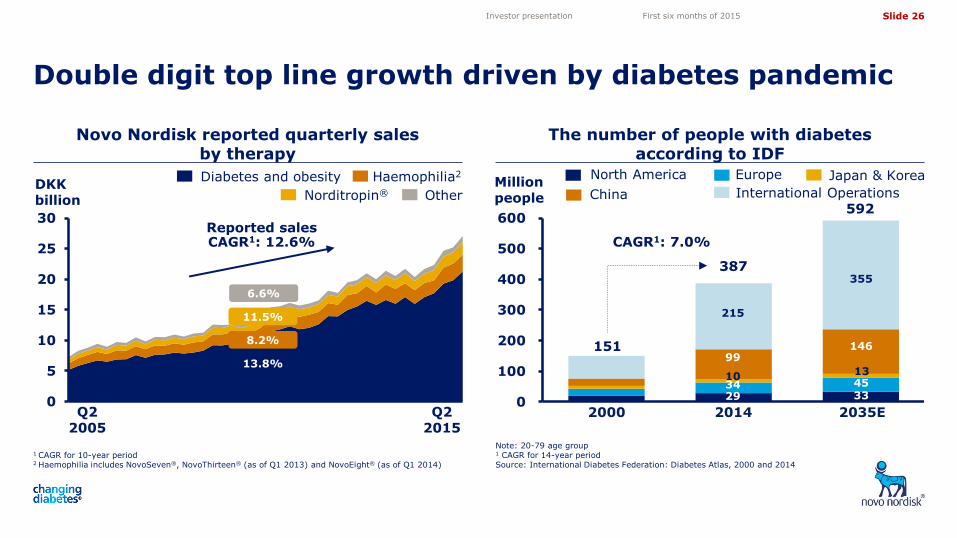
Novo Nordisk reported quarterly sales by therapy
The number of people with diabetes according to IDF
Double digit top line growth driven by diabetes pandemic
1 CAGR for 10-year period 2 Haemophilia includes NovoSeven®, NovoThirteen® (as of Q1 2013) and NovoEight® (as of Q1 2014)
Note: 20-79 age group 1 CAGR for 14-year period Source: International Diabetes Federation: Diabetes Atlas, 2000 and 2014
Investor presentation First six months of 2015
DKK billion
Diabetes and obesity Haemophilia2
Norditropin® Other Million people
Reported sales CAGR1: 12.6%
11.5%
8.2%
13.8%
6.6%
2000 2014 2035E
151
387
215
99
34 29
CAGR1: 7.0%
592
10
355
146
45 33
13
Europe North America Japan & Korea
International Operations China
Q2 2005
Q2 2015
Slide 27
5,05
4,10
3,50
4,72
11,82 11,82
0
50
100
150
200
250
300
350
0%
10%
20%
30%
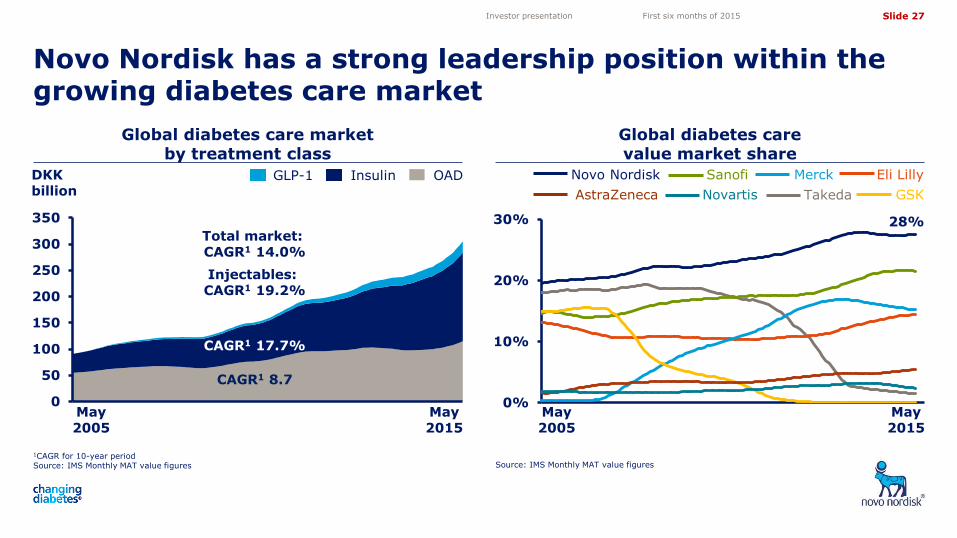
1CAGR for 10-year period Source: IMS Monthly MAT value figures
Global diabetes care market by treatment class
Global diabetes care value market share
Novo Nordisk has a strong leadership position within the growing diabetes care market
Source: IMS Monthly MAT value figures
May 2005
May 2015
28%
GSK
Merck Eli Lilly Sanofi
Takeda
Novo Nordisk
AstraZeneca Novartis
DKK billion
OAD Insulin GLP-1
Total market: CAGR1 14.0%
CAGR1 17.7%
Injectables: CAGR1 19.2%
CAGR1 8.7
May 2005
May 2015
Investor presentation First six months of 2015
Slide 28
5,05
4,10
3,50
4,72
11,82 11,82
NovoEight®
NovoSeven®
NovoThirteen®/TRETTEN®
Norditropin®
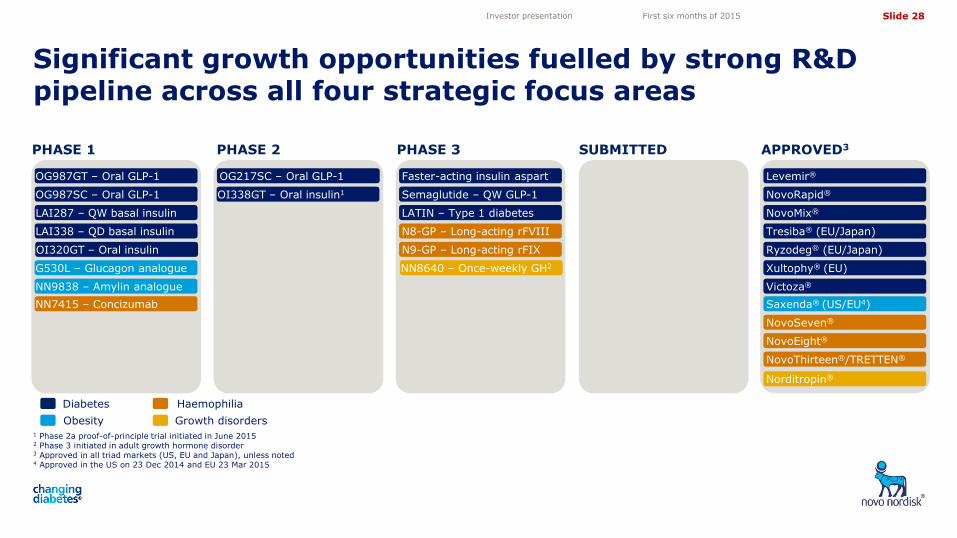
Significant growth opportunities fuelled by strong R&D pipeline across all four strategic focus areas
1 Phase 2a proof-of-principle trial initiated in June 2015 2 Phase 3 initiated in adult growth hormone disorder 3 Approved in all triad markets (US, EU and Japan), unless noted 4 Approved in the US on 23 Dec 2014 and EU 23 Mar 2015
Investor presentation First six months of 2015
Saxenda® (US/EU4)
Semaglutide – QW GLP-1
Faster-acting insulin aspart
OI338GT – Oral insulin1
OG987GT – Oral GLP-1 OG217SC – Oral GLP-1
LATIN – Type 1 diabetes
OG987SC – Oral GLP-1
LAI287 – QW basal insulin
PHASE 1 PHASE 2 PHASE 3 SUBMITTED APPROVED3
NovoRapid®
NovoMix®
Victoza®
Levemir®
NN8640 – Once-weekly GH2
NN7415 – Concizumab
N8-GP – Long-acting rFVIII
N9-GP – Long-acting rFIX
Tresiba® (EU/Japan)
Ryzodeg® (EU/Japan)
Diabetes
Obesity
Haemophilia
Growth disorders
Xultophy® (EU) G530L – Glucagon analogue
LAI338 – QD basal insulin
NN9838 – Amylin analogue
OI320GT – Oral insulin
Slide 29
5,05
4,10
3,50
4,72
11,82 11,82
FTEs in sales regions1 Global manufacturing setup
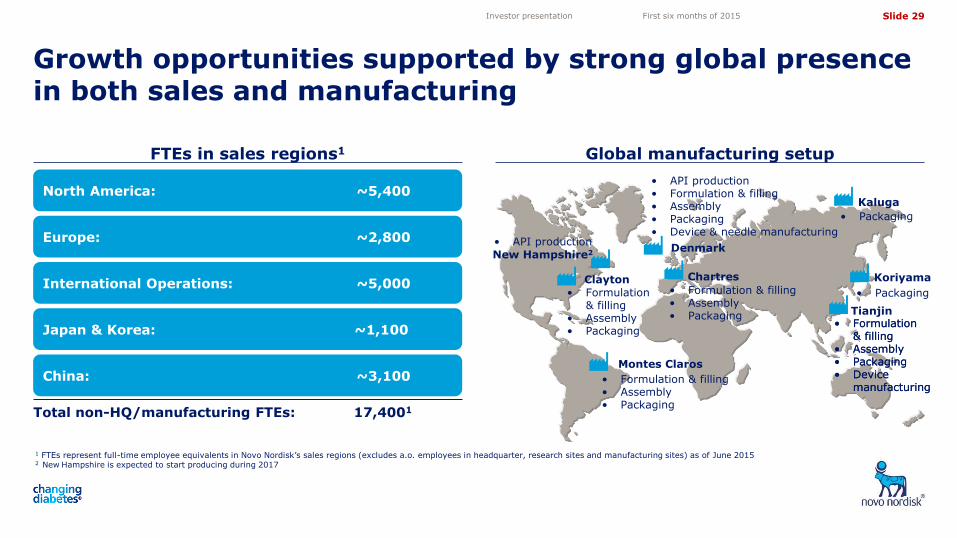
Growth opportunities supported by strong global presence in both sales and manufacturing
1 FTEs represent full-time employee equivalents in Novo Nordisk’s sales regions (excludes a.o. employees in headquarter, research sites and manufacturing sites) as of June 2015 2 New Hampshire is expected to start producing during 2017
Investor presentation First six months of 2015
Denmark
Chartres
• Formulation & filling • Assembly • Packaging
Clayton
• Formulation & filling
• Assembly • Packaging
Montes Claros
• Formulation & filling • Assembly • Packaging
• Formulation & filling
• Assembly • Packaging • Device
manufacturing
• Packaging
Koriyama
Tianjin
China: ~3,100
Japan & Korea: ~1,100
International Operations: ~5,000
North America: ~5,400
Europe: ~2,800
Total non-HQ/manufacturing FTEs: 17,4001
• Packaging
Kaluga
• Formulation & filling
• Assembly • Packaging • Device
manufacturing
• API production • Formulation & filling • Assembly • Packaging • Device & needle manufacturing
New Hampshire2
• API production
Slide 30
5,05
4,10
3,50
4,72
11,82 11,82
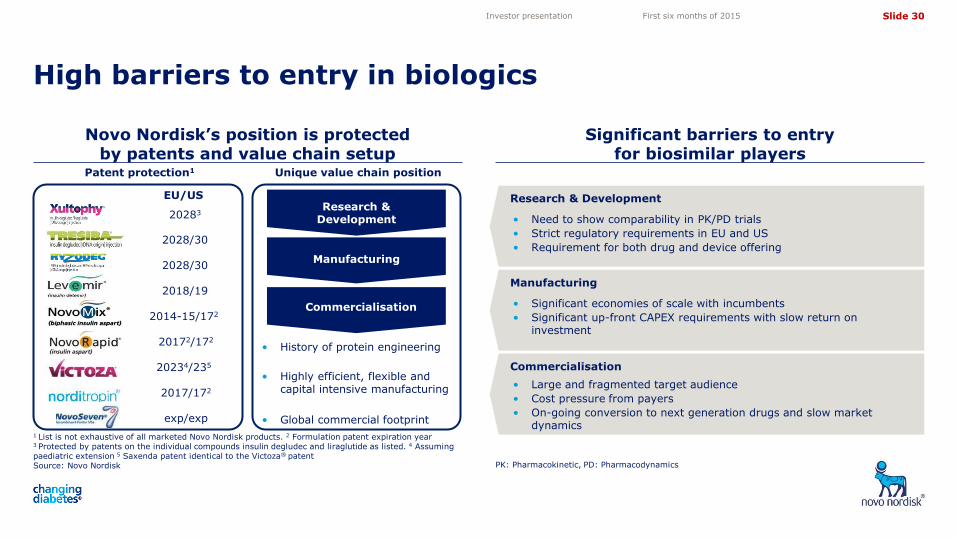
Novo Nordisk’s position is protected by patents and value chain setup
Significant barriers to entry for biosimilar players
High barriers to entry in biologics
1 List is not exhaustive of all marketed Novo Nordisk products. 2 Formulation patent expiration year 3 Protected by patents on the individual compounds insulin degludec and liraglutide as listed. 4 Assuming paediatric extension 5 Saxenda patent identical to the Victoza® patent Source: Novo Nordisk PK: Pharmacokinetic, PD: Pharmacodynamics
Investor presentation First six months of 2015
Research & Development
Manufacturing
Commercialisation
Unique value chain position Patent protection1
2018/192
2014-15/1722
20172/172
20234/2352
2017/172
exp/exp
EU/US0
• History of protein engineering
• Highly efficient, flexible and capital intensive manufacturing
• Global commercial footprint
• Need to show comparability in PK/PD trials
• Strict regulatory requirements in EU and US
• Requirement for both drug and device offering
Research & Development
• Significant economies of scale with incumbents
• Significant up-front CAPEX requirements with slow return on investment
Manufacturing
Commercialisation
• Large and fragmented target audience
• Cost pressure from payers
• On-going conversion to next generation drugs and slow market dynamics
2028/302
2028/302
202832
Slide 31
5,05
4,10
3,50
4,72
11,82 11,82
Average 2009-20131
Result
2014 Target2
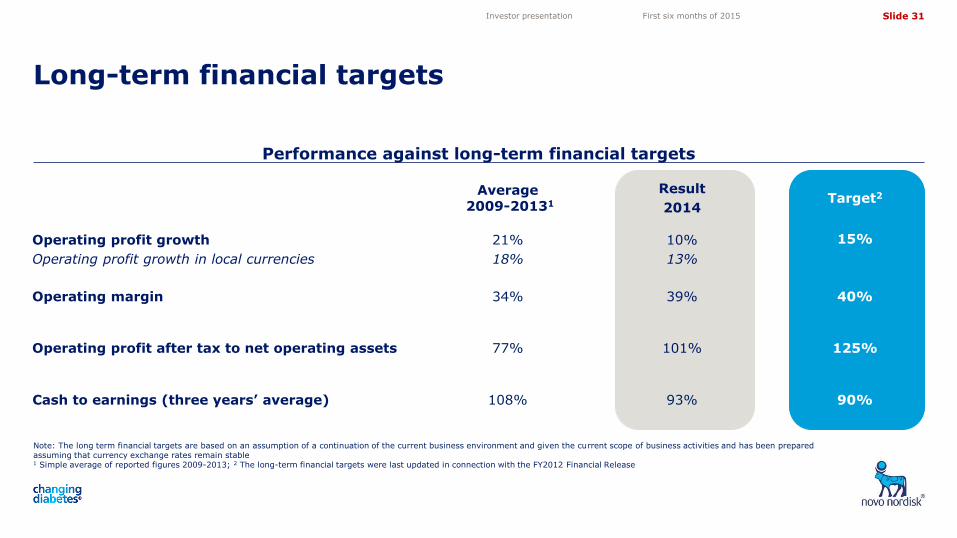
Operating profit growth
Operating profit growth in local currencies
21%
18%
10%
13%
15%
Operating margin 34% 39% 40%
Operating profit after tax to net operating assets 77% 101% 125%
Cash to earnings (three years’ average) 108% 93% 90%
Performance against long-term financial targets
Note: The long term financial targets are based on an assumption of a continuation of the current business environment and given the current scope of business activities and has been prepared assuming that currency exchange rates remain stable 1 Simple average of reported figures 2009-2013; 2 The long-term financial targets were last updated in connection with the FY2012 Financial Release
Long-term financial targets
Investor presentation First six months of 2015
Slide 32
5,05
4,10
3,50
4,72
11,82 11,82
Diabetes and obesity
Investor presentation First six months of 2015
Slide 33
5,05
4,10
3,50
4,72
11,82 11,82
Facts about diabetes Insulin secretion profile
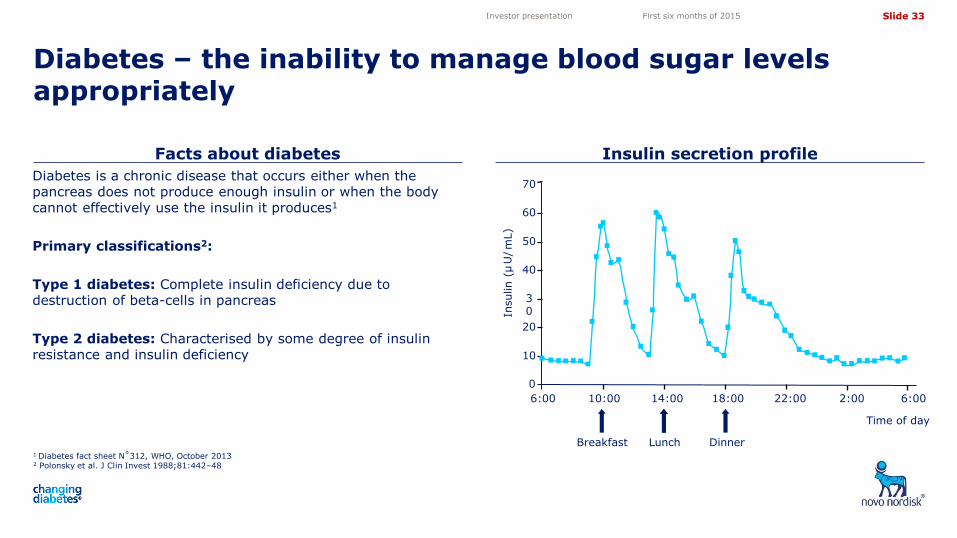
Diabetes – the inability to manage blood sugar levels appropriately
1 Diabetes fact sheet N˚312, WHO, October 2013 2 Polonsky et al. J Clin Invest 1988;81:442–48
Investor presentation First six months of 2015
Diabetes is a chronic disease that occurs either when the pancreas does not produce enough insulin or when the body cannot effectively use the insulin it produces1
Primary classifications2:
Type 1 diabetes: Complete insulin deficiency due to destruction of beta-cells in pancreas
Type 2 diabetes: Characterised by some degree of insulin resistance and insulin deficiency
6:00
0
10
20
30
40
50
60
70
10:00 14:00 18:00
Insulin (
µ U
/ m
L )
22:00 2:00 6:00
Time of day
Breakfast Lunch Dinner
Slide 34
5,05
4,10
3,50
4,72
11,82 11,82
Insulin enables glucose to become energy The aim of insulin therapy is to recreate normal
blood insulin profile
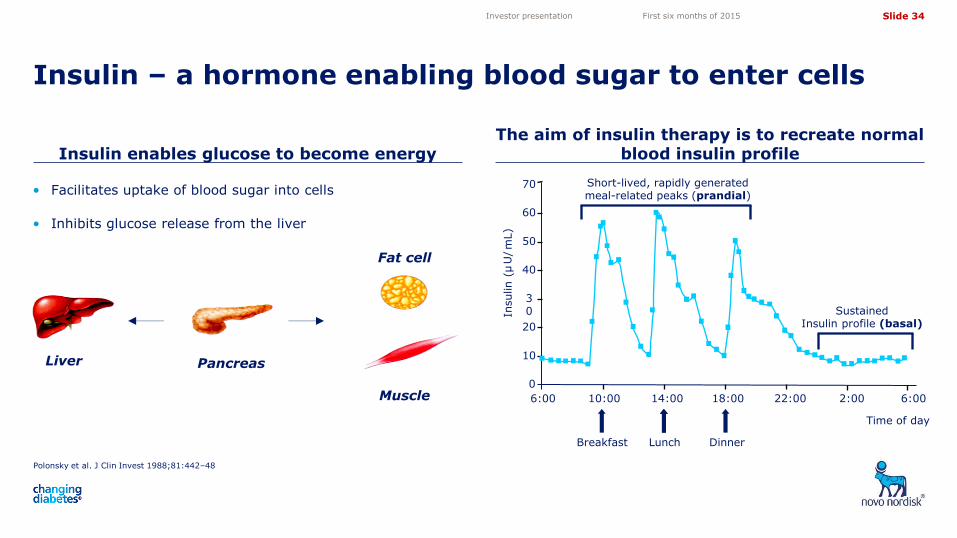
Insulin – a hormone enabling blood sugar to enter cells
Polonsky et al. J Clin Invest 1988;81:442–48
Investor presentation First six months of 2015
Liver Pancreas
Muscle
Fat cell
• Facilitates uptake of blood sugar into cells
• Inhibits glucose release from the liver
6:00
0
10
20
30
40
50
60
70
10:00 14:00 18:00
Insulin (
µ U
/ m
L )
22:00 2:00 6:00
Short-lived, rapidly generated meal-related peaks (prandial)
Sustained Insulin profile (basal)
Time of day
Breakfast Lunch Dinner
Slide 35
5,05
4,10
3,50
4,72
11,82 11,82
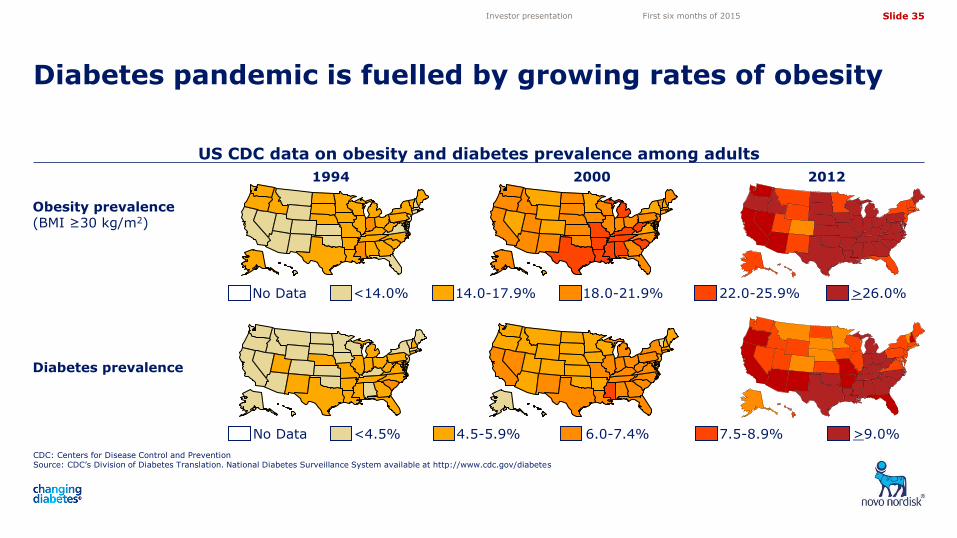
US CDC data on obesity and diabetes prevalence among adults
CDC: Centers for Disease Control and Prevention Source: CDC’s Division of Diabetes Translation. National Diabetes Surveillance System available at http://www.cdc.gov/diabetes
Diabetes pandemic is fuelled by growing rates of obesity
Investor presentation First six months of 2015
Obesity prevalence (BMI ≥30 kg/m2)
Diabetes prevalence
No Data <14.0% 14.0-17.9% 18.0-21.9% 22.0-25.9% >26.0%
No Data <4.5% 4.5-5.9% 6.0-7.4% 7.5-8.9% >9.0%
1994 2000 2012
Slide 36
5,05
4,10
3,50
4,72
11,82 11,82
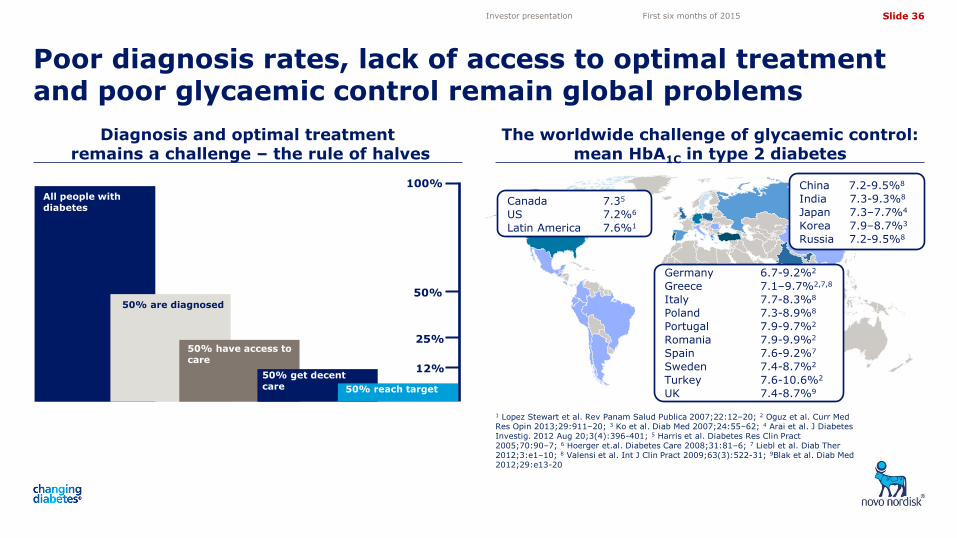
Diagnosis and optimal treatment remains a challenge – the rule of halves
The worldwide challenge of glycaemic control: mean HbA1C in type 2 diabetes
Poor diagnosis rates, lack of access to optimal treatment and poor glycaemic control remain global problems
1 Lopez Stewart et al. Rev Panam Salud Publica 2007;22:12–20; 2 Oguz et al. Curr Med Res Opin 2013;29:911–20; 3 Ko et al. Diab Med 2007;24:55–62; 4 Arai et al. J Diabetes Investig. 2012 Aug 20;3(4):396-401; 5 Harris et al. Diabetes Res Clin Pract 2005;70:90–7; 6 Hoerger et.al. Diabetes Care 2008;31:81–6; 7 Liebl et al. Diab Ther 2012;3:e1–10; 8 Valensi et al. Int J Clin Pract 2009;63(3):522-31; 9Blak et al. Diab Med 2012;29:e13-20
Investor presentation First six months of 2015
50% reach target 50% reach target
All people with diabetes
50% are diagnosed
50% have access to care
50% get decent care
100%
50%
25%
12%
Canada 7.35
US 7.2%6
Latin America 7.6%1
China 7.2-9.5%8
India 7.3-9.3%8
Japan 7.3–7.7%4
Korea 7.9–8.7%3
Russia 7.2-9.5%8
Germany 6.7-9.2%2
Greece 7.1–9.7%2,7,8
Italy 7.7-8.3%8
Poland 7.3-8.9%8
Portugal 7.9-9.7%2
Romania 7.9-9.9%2
Spain 7.6-9.2%7
Sweden 7.4-8.7%2
Turkey 7.6-10.6%2
UK 7.4-8.7%9
Slide 37
5,05
4,10
3,50
4,72
11,82 11,82
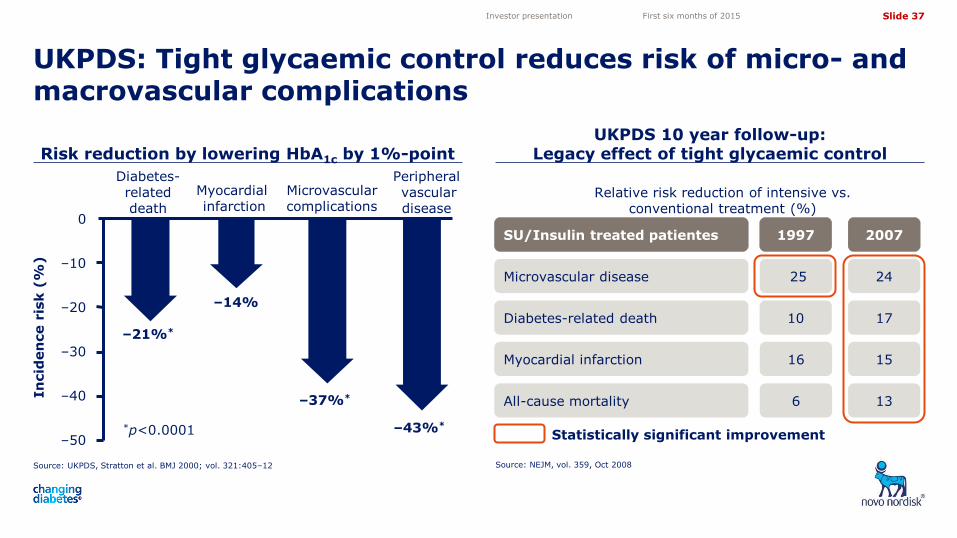
Risk reduction by lowering HbA1c by 1%-point UKPDS 10 year follow-up:
Legacy effect of tight glycaemic control
UKPDS: Tight glycaemic control reduces risk of micro- and macrovascular complications
Source: UKPDS, Stratton et al. BMJ 2000; vol. 321:405–12 Source: NEJM, vol. 359, Oct 2008
Investor presentation First six months of 2015
In
cid
en
ce r
isk (
%)
–21%*
–14%
–37%*
–43%* *p<0.0001 –50
–40
–30
–20
–10
0
Diabetes-related death
Myocardial infarction
Microvascular complications
Peripheral vascular disease
Relative risk reduction of intensive vs. conventional treatment (%)
25 24 Microvascular disease
16 15 Myocardial infarction
6 13 All-cause mortality
SU/Insulin 1997 2007
10 17 Diabetes-related death
SU/Insulin treated patientes
Statistically significant improvement
Slide 38
5,05
4,10
3,50
4,72
11,82 11,82
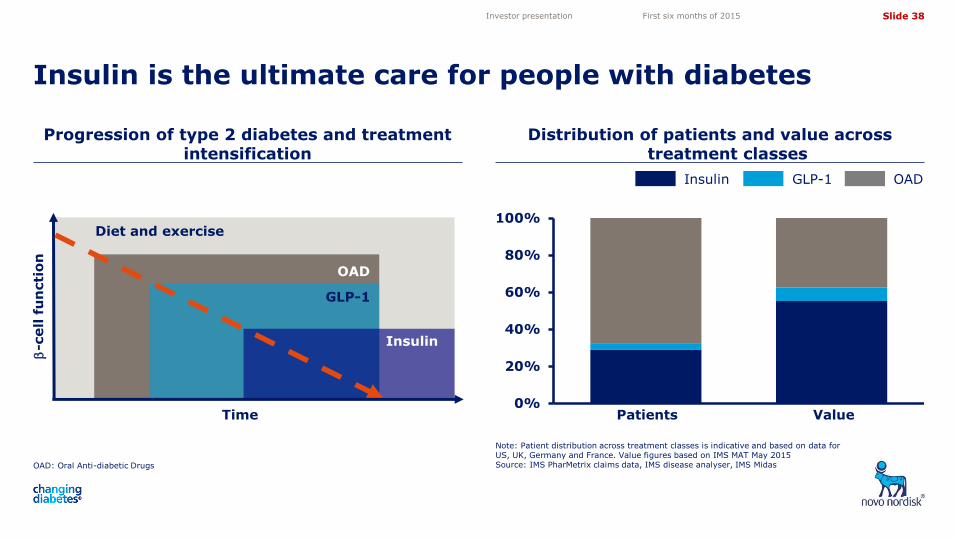
Progression of type 2 diabetes and treatment intensification
Distribution of patients and value across treatment classes
Insulin is the ultimate care for people with diabetes
OAD: Oral Anti-diabetic Drugs
Note: Patient distribution across treatment classes is indicative and based on data for US, UK, Germany and France. Value figures based on IMS MAT May 2015 Source: IMS PharMetrix claims data, IMS disease analyser, IMS Midas
Investor presentation First six months of 2015
-c
ell f
un
cti
on
Time
Diet and exercise
OAD
GLP-1
Insulin
OAD GLP-1 Insulin
Patients Value 0%
20%
40%
60%
80%
100%
Slide 39
5,05
4,10
3,50
4,72
11,82 11,82
0
50
100
150
200
250
300
350
400
450
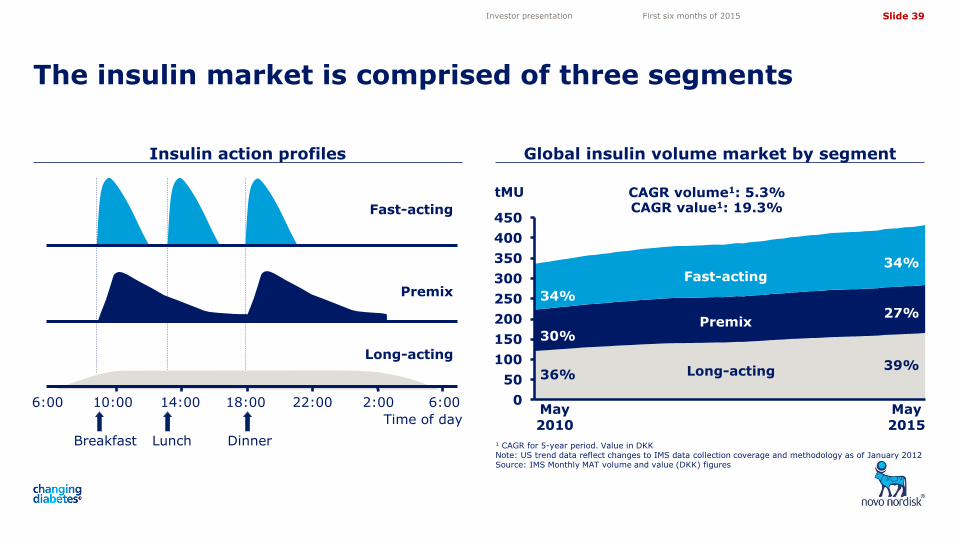
Insulin action profiles
The insulin market is comprised of three segments
Investor presentation First six months of 2015
Time of day
6:00 10:00 14:00 18:00 22:00 2:00 6:00
Breakfast Lunch Dinner
Long-acting
Premix
Fast-acting
Global insulin volume market by segment
1 CAGR for 5-year period. Value in DKK Note: US trend data reflect changes to IMS data collection coverage and methodology as of January 2012 Source: IMS Monthly MAT volume and value (DKK) figures
CAGR volume1: 5.3% CAGR value1: 19.3%
36%
30%
34%
34%
27%
39%
May 2010
Fast-acting
Premix
Long-acting
tMU
May 2015
Slide 40
5,05
4,10
3,50
4,72
11,82 11,82
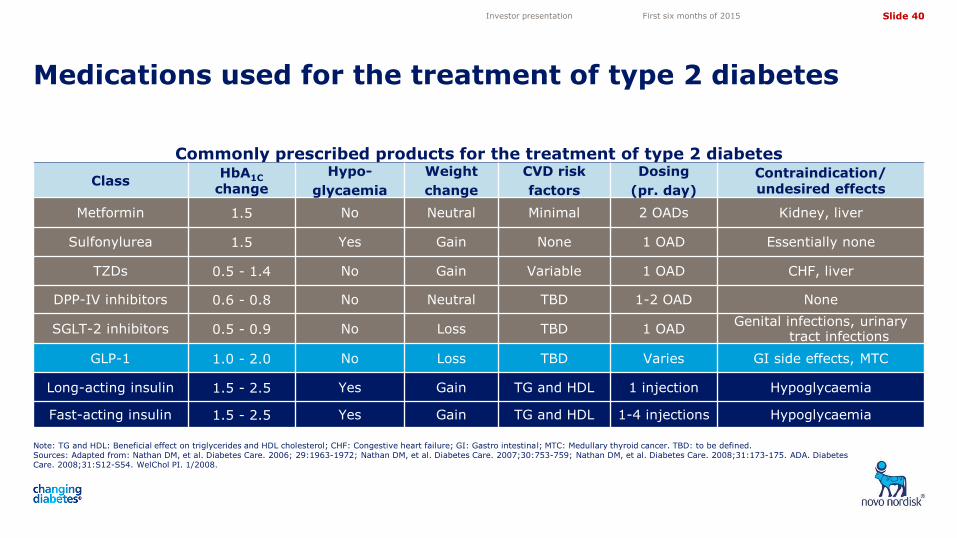
Commonly prescribed products for the treatment of type 2 diabetes
Class HbA1C
change
Hypo-
glycaemia
Weight
change
CVD risk
factors
Dosing
(pr. day)
Contraindication/ undesired effects
Metformin 1.5 No Neutral Minimal 2 OADs Kidney, liver
Sulfonylurea 1.5 Yes Gain None 1 OAD Essentially none
TZDs 0.5 - 1.4 No Gain Variable 1 OAD CHF, liver
DPP-IV inhibitors 0.6 - 0.8 No Neutral TBD 1-2 OAD None
SGLT-2 inhibitors 0.5 - 0.9 No Loss TBD 1 OAD Genital infections, urinary
tract infections
GLP-1 1.0 - 2.0 No Loss TBD Varies GI side effects, MTC
Long-acting insulin 1.5 - 2.5 Yes Gain TG and HDL 1 injection Hypoglycaemia
Fast-acting insulin 1.5 - 2.5 Yes Gain TG and HDL 1-4 injections Hypoglycaemia
Note: TG and HDL: Beneficial effect on triglycerides and HDL cholesterol; CHF: Congestive heart failure; GI: Gastro intestinal; MTC: Medullary thyroid cancer. TBD: to be defined. Sources: Adapted from: Nathan DM, et al. Diabetes Care. 2006; 29:1963-1972; Nathan DM, et al. Diabetes Care. 2007;30:753-759; Nathan DM, et al. Diabetes Care. 2008;31:173-175. ADA. Diabetes Care. 2008;31:S12-S54. WelChol PI. 1/2008.
Medications used for the treatment of type 2 diabetes
Investor presentation First six months of 2015
Slide 41
5,05
4,10
3,50
4,72
11,82 11,82
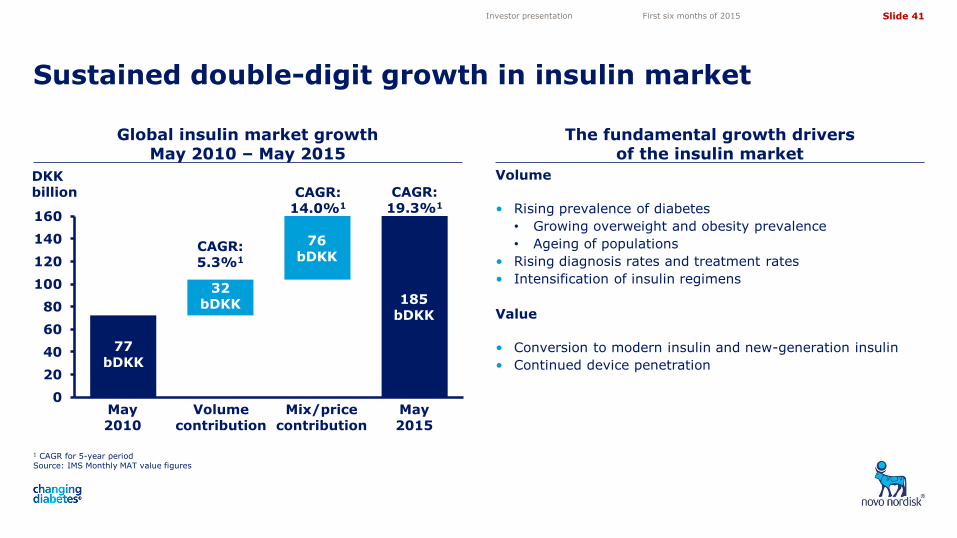
The fundamental growth drivers of the insulin market
Sustained double-digit growth in insulin market
Investor presentation First six months of 2015
Volume
• Rising prevalence of diabetes
• Growing overweight and obesity prevalence
• Ageing of populations
• Rising diagnosis rates and treatment rates
• Intensification of insulin regimens
Value
• Conversion to modern insulin and new-generation insulin
• Continued device penetration
1 CAGR for 5-year period Source: IMS Monthly MAT value figures
Global insulin market growth May 2010 – May 2015
DKK billion
66
139
0
20
40
60
80
100
120
140
160
77 bDKK
185 bDKK
32 bDKK
76 bDKK
May 2010
May 2015
Volume contribution
Mix/price contribution
CAGR: 5.3%1
CAGR: 14.0%1
CAGR: 19.3%1
Slide 42
5,05
4,10
3,50
4,72
11,82 11,82
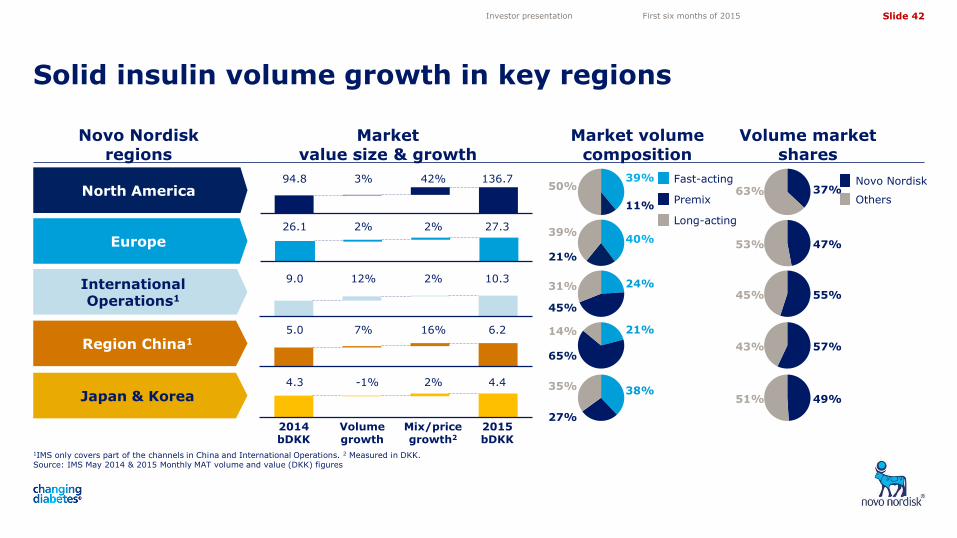
1IMS only covers part of the channels in China and International Operations. 2 Measured in DKK. Source: IMS May 2014 & 2015 Monthly MAT volume and value (DKK) figures
Solid insulin volume growth in key regions
Novo Nordisk regions
Market value size & growth
Market volume composition
Volume market shares
North America
Europe
International Operations1
Region China1
Japan & Korea
2014 bDKK
Volume growth
Mix/price growth2
2015 bDKK
94.8 3% 42% 136.7
26.1 2% 2% 27.3
9.0 12% 2% 10.3
4.3 -1% 2% 4.4
5.0 7% 16% 6.2
Novo Nordisk
Others Premix
Fast-acting
Long-acting
43% 57%
51% 49%
45% 55%
53% 47%
63% 37%
65%
14% 21%
35%
27%
38%
31%
45%
24%
39%
21%
40%
50%
11%
39%
Investor presentation First six months of 2015
Slide 43
5,05
4,10
3,50
4,72
11,82 11,82
0%
5%
10%
15%
20%
25%
30%
35%
40%
0.00 0.00 0.00
Millions
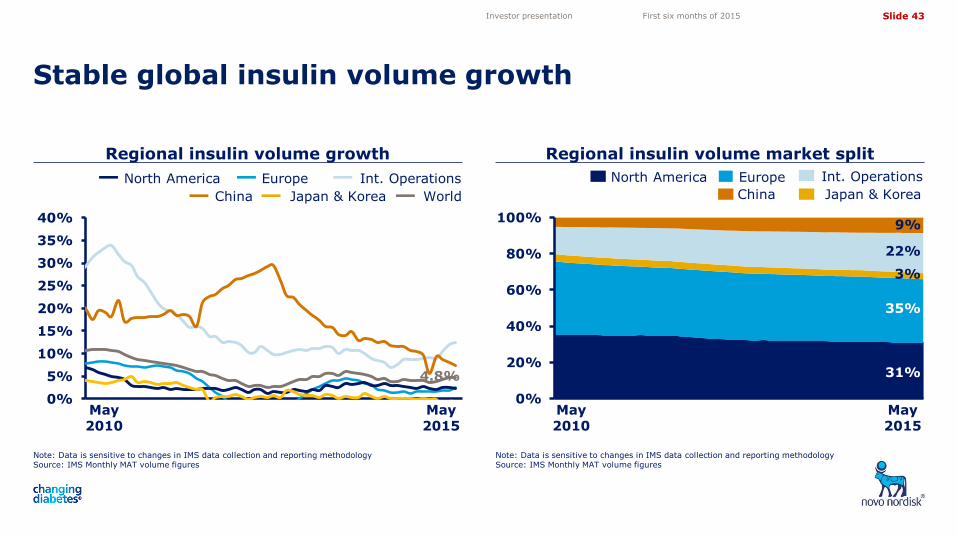
Regional insulin volume growth Regional insulin volume market split
Stable global insulin volume growth
Note: Data is sensitive to changes in IMS data collection and reporting methodology Source: IMS Monthly MAT volume figures
0%
20%
40%
60%
80%
100%
World
May 2010
May 2015
May 2010
May 2015
9%
22%
3%
35%
31%
North America Int. Operations
China Japan & Korea
Europe North America Int. Operations
China Japan & Korea
Europe
Investor presentation First six months of 2015
4.8%
Note: Data is sensitive to changes in IMS data collection and reporting methodology Source: IMS Monthly MAT volume figures
Slide 44
5,05
4,10
3,50
4,72
11,82 11,82
0%
20%
40%
60%
80%
100%
0
50
100
150
200
250
300
350
400
450
Th
ou
san
ds
0%
20%
40%
60%
80%
100%
0
50
100
150
200
250
300
350
400
450
Thousands
0%
20%
40%
60%
80%
100%
0
50
100
150
200
250
300
350
400
450
Thousands
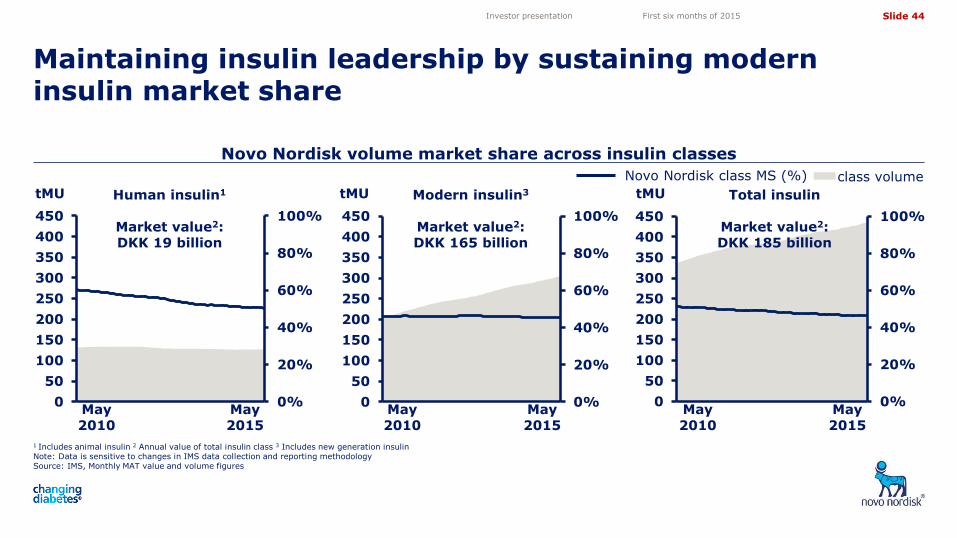
Novo Nordisk volume market share across insulin classes
1 Includes animal insulin 2 Annual value of total insulin class 3 Includes new generation insulin Note: Data is sensitive to changes in IMS data collection and reporting methodology Source: IMS, Monthly MAT value and volume figures
Maintaining insulin leadership by sustaining modern insulin market share
May 2010
May 2015
May 2010
May 2015
May 2010
May 2015
Novo Nordisk class MS (%) class volume
Human insulin1
Market value2: DKK 19 billion
Modern insulin3
Market value2: DKK 165 billion
Total insulin
Market value2: DKK 185 billion
tMU tMU tMU
Investor presentation First six months of 2015
Slide 45
5,05
4,10
3,50
4,72
11,82 11,82
0%
10%
20%
30%
40%
50%
60%
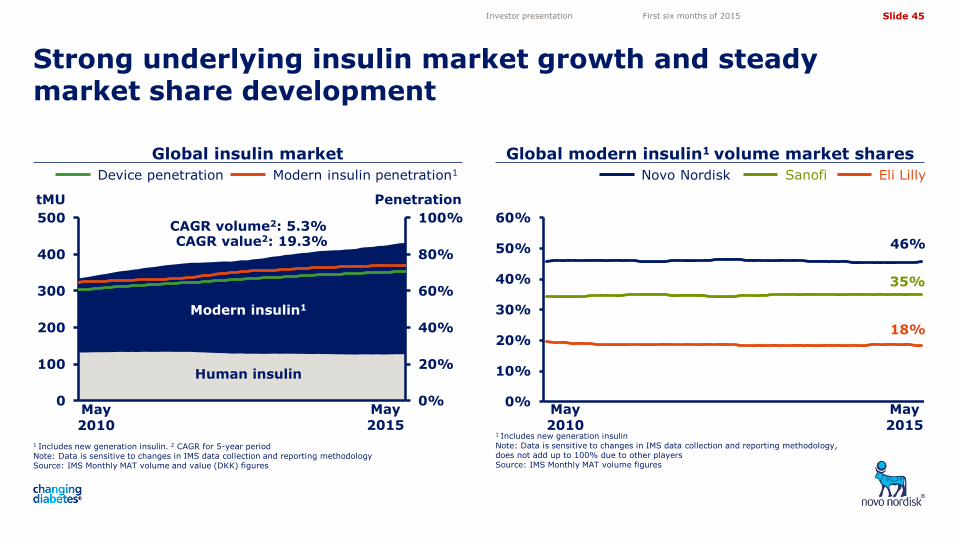
Global insulin market Global modern insulin1 volume market shares
Strong underlying insulin market growth and steady market share development
1 Includes new generation insulin. 2 CAGR for 5-year period Note: Data is sensitive to changes in IMS data collection and reporting methodology Source: IMS Monthly MAT volume and value (DKK) figures
1 Includes new generation insulin Note: Data is sensitive to changes in IMS data collection and reporting methodology, does not add up to 100% due to other players Source: IMS Monthly MAT volume figures
Investor presentation First six months of 2015
May 2015
May 2010
May 2015
Eli Lilly Novo Nordisk Sanofi
0%
20%
40%
60%
80%
100%
0
100
200
300
400
500
Modern insulin1
Human insulin
tMU Penetration
Device penetration Modern insulin penetration1
CAGR volume2: 5.3% CAGR value2: 19.3% 46%
35%
18%
May 2010
Slide 46
5,05
4,10
3,50
4,72
11,82 11,82
0%
20%
40%
60%
80%
100%
0
20
40
60
80
100
120
140
160
180
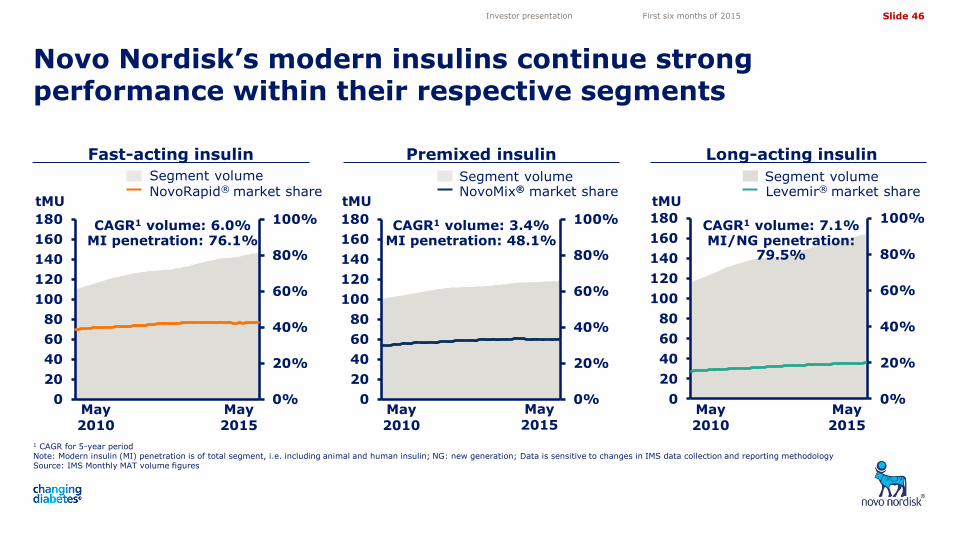
Novo Nordisk’s modern insulins continue strong performance within their respective segments
1 CAGR for 5-year period Note: Modern insulin (MI) penetration is of total segment, i.e. including animal and human insulin; NG: new generation; Data is sensitive to changes in IMS data collection and reporting methodology Source: IMS Monthly MAT volume figures
Investor presentation First six months of 2015
Fast-acting insulin Long-acting insulin
tMU Levemir® market share Segment volume
NovoRapid® market share Segment volume
NovoMix® market share Segment volume
tMU tMU
0%
20%
40%
60%
80%
100%
0
20
40
60
80
100
120
140
160
180
0%
20%
40%
60%
80%
100%
0
20
40
60
80
100
120
140
160
180
May 2010
May 2015
May 2010
May 2015
May 2010
May 2015
Premixed insulin
CAGR1 volume: 7.1% MI/NG penetration:
79.5%
CAGR1 volume: 6.0% MI penetration: 76.1%
CAGR1 volume: 3.4% MI penetration: 48.1%
Slide 47
5,05
4,10
3,50
4,72
11,82 11,82
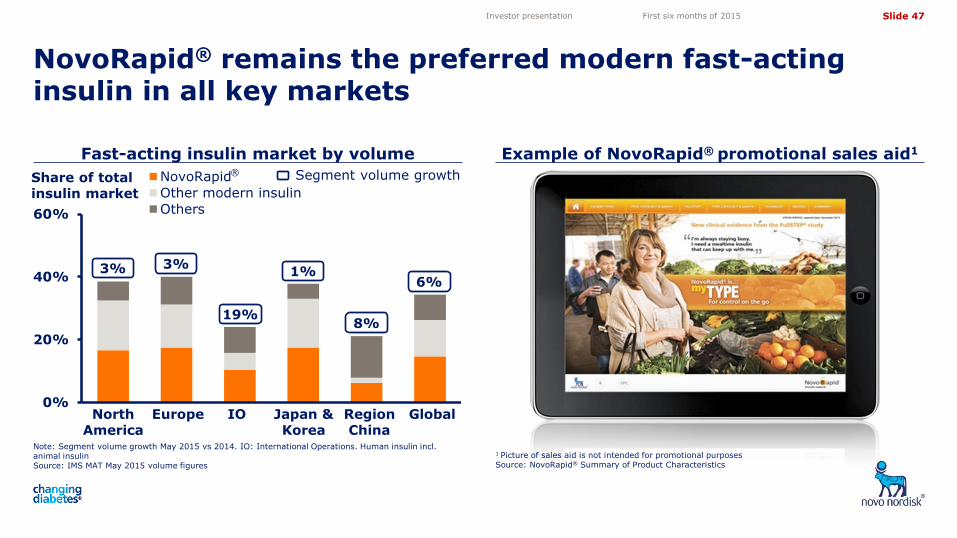
Example of NovoRapid® promotional sales aid1
NovoRapid® remains the preferred modern fast-acting insulin in all key markets
1 Picture of sales aid is not intended for promotional purposes Source: NovoRapid® Summary of Product Characteristics
Investor presentation First six months of 2015
Fast-acting insulin market by volume
0%
20%
40%
60%
NovoRapid
Other modern insulin
Others
3% 1% 3%
19% 8%
6%
North America
Europe IO Japan & Korea
Region China
Global
® Share of total insulin market
Segment volume growth
Note: Segment volume growth May 2015 vs 2014. IO: International Operations. Human insulin incl. animal insulin Source: IMS MAT May 2015 volume figures
Slide 48
5,05
4,10
3,50
4,72
11,82 11,82
Example of NovoMix® promotional sales aid1
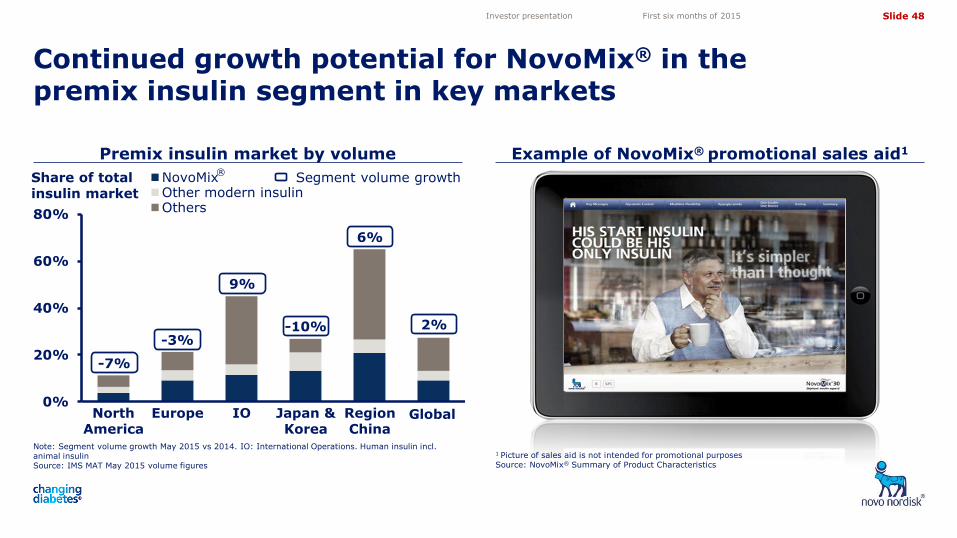
Continued growth potential for NovoMix® in the premix insulin segment in key markets
1 Picture of sales aid is not intended for promotional purposes Source: NovoMix® Summary of Product Characteristics
Investor presentation First six months of 2015
Note: Segment volume growth May 2015 vs 2014. IO: International Operations. Human insulin incl. animal insulin Source: IMS MAT May 2015 volume figures
Premix insulin market by volume
0%
20%
40%
60%
80%
NovoMixOther modern insulinOthers
North America
Europe IO Japan & Korea
Region China
-7%
-10% -3%
9%
6%
2%
® Share of total insulin market
Segment volume growth
Global
Slide 49
5,05
4,10
3,50
4,72
11,82 11,82
Example of Levemir® promotional sales aid1
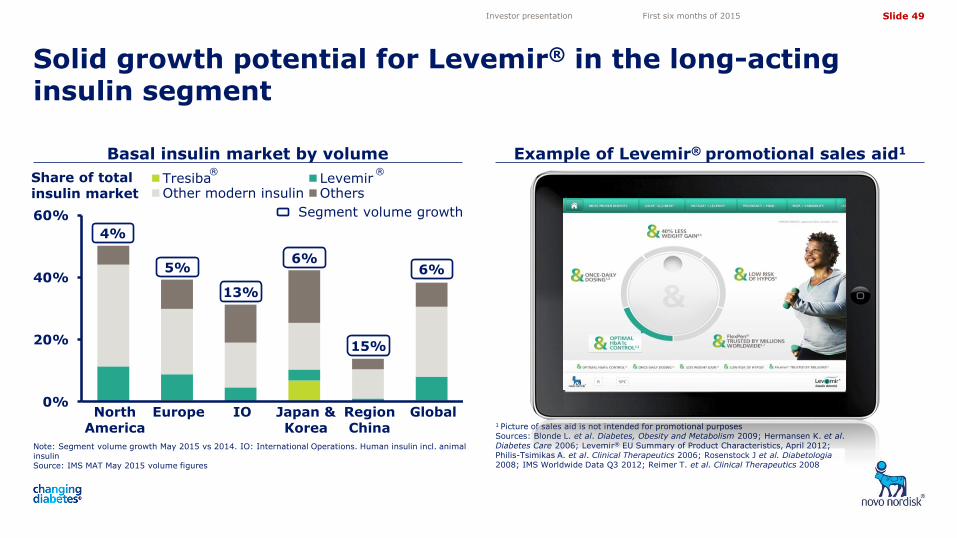
Solid growth potential for Levemir® in the long-acting insulin segment
1 Picture of sales aid is not intended for promotional purposes Sources: Blonde L. et al. Diabetes, Obesity and Metabolism 2009; Hermansen K. et al. Diabetes Care 2006; Levemir® EU Summary of Product Characteristics, April 2012; Philis-Tsimikas A. et al. Clinical Therapeutics 2006; Rosenstock J et al. Diabetologia 2008; IMS Worldwide Data Q3 2012; Reimer T. et al. Clinical Therapeutics 2008
Investor presentation First six months of 2015
Note: Segment volume growth May 2015 vs 2014. IO: International Operations. Human insulin incl. animal insulin Source: IMS MAT May 2015 volume figures
Basal insulin market by volume
0%
20%
40%
60%
Tresiba LevemirOther modern insulin Others
4%
6% 5%
13%
15%
Segment volume growth
6%
North America
Europe IO Japan & Korea
Region China
Global
Share of total insulin market
® ®
Slide 50
5,05
4,10
3,50
4,72
11,82 11,82
0%
10%
20%
30%
40%
50%
60%
US insulin market by segments US modern insulin volume market shares
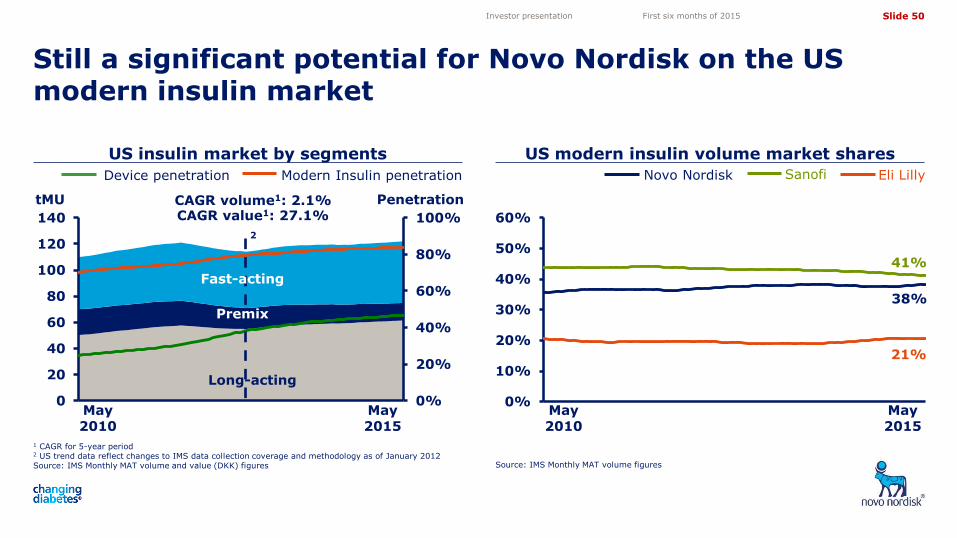
Still a significant potential for Novo Nordisk on the US modern insulin market
1 CAGR for 5-year period 2 US trend data reflect changes to IMS data collection coverage and methodology as of January 2012 Source: IMS Monthly MAT volume and value (DKK) figures Source: IMS Monthly MAT volume figures
Investor presentation First six months of 2015
Modern Insulin penetration Device penetration
May 2010
May 2015
May 2010
May 2015
Eli Lilly Novo Nordisk Sanofi
0%
20%
40%
60%
80%
100%
0
20
40
60
80
100
120
140
tMU Penetration CAGR volume1: 2.1% CAGR value1: 27.1%
38%
41%
21%
2
Fast-acting
Long-acting
Premix
Slide 51
5,05
4,10
3,50
4,72
11,82 11,82
0%
20%
40%
60%
80%
100%
0
10
20
30
40
50
60
70
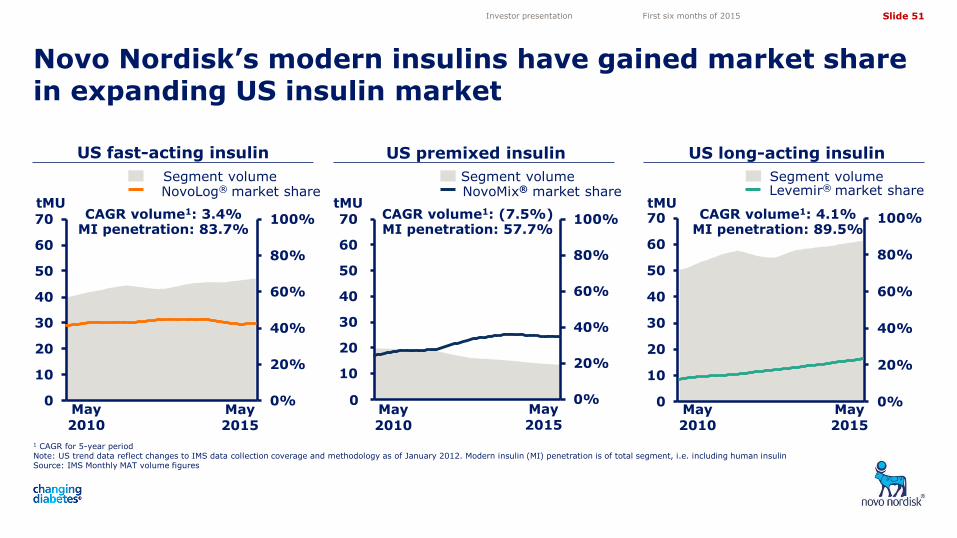
Novo Nordisk’s modern insulins have gained market share in expanding US insulin market
1 CAGR for 5-year period Note: US trend data reflect changes to IMS data collection coverage and methodology as of January 2012. Modern insulin (MI) penetration is of total segment, i.e. including human insulin Source: IMS Monthly MAT volume figures
US long-acting insulin
tMU Levemir® market share Segment volume
0%
20%
40%
60%
80%
100%
0
10
20
30
40
50
60
70 CAGR volume1: 4.1% MI penetration: 89.5%
May 2010
May 2015
0%
20%
40%
60%
80%
100%
-
10
20
30
40
50
60
70
0
US fast-acting insulin
NovoLog® market share Segment volume
NovoMix® market share Segment volume
tMU tMU
US premixed insulin
CAGR volume1: 3.4% MI penetration: 83.7%
CAGR volume1: (7.5%) MI penetration: 57.7%
May 2010
May 2015
May 2015
May 2010
Investor presentation First six months of 2015
Slide 52
5,05
4,10
3,50
4,72
11,82 11,82
0%
10%
20%
30%
40%
50%
60%
0%
20%
40%
60%
80%
100%
0
20
40
60
80
100
120
140
160
180
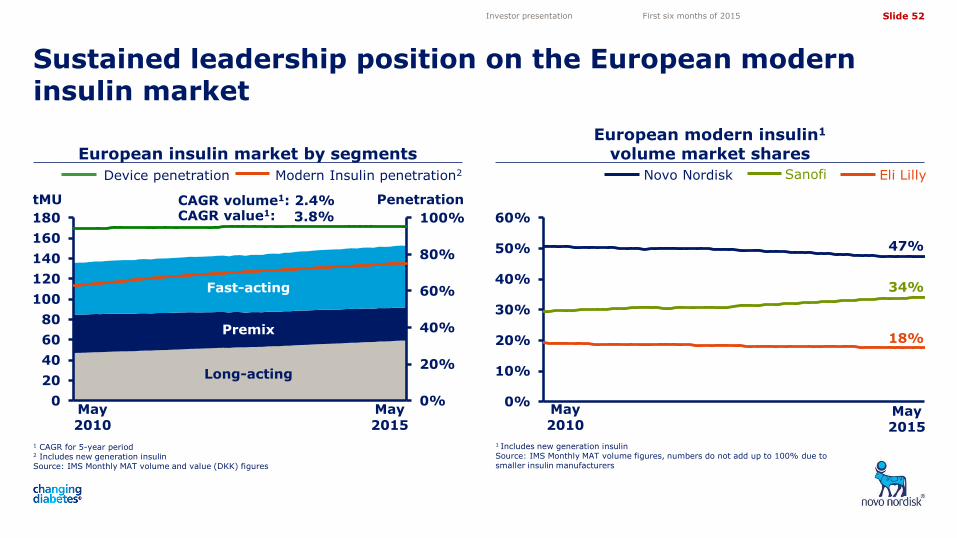
European insulin market by segments European modern insulin1
volume market shares
Sustained leadership position on the European modern insulin market
1 CAGR for 5-year period 2 Includes new generation insulin Source: IMS Monthly MAT volume and value (DKK) figures
Modern Insulin penetration2 Device penetration
May 2010
May 2015
Eli Lilly Novo Nordisk Sanofi
Fast-acting
Long-acting
tMU Penetration
Premix
47%
34%
18%
1 Includes new generation insulin Source: IMS Monthly MAT volume figures, numbers do not add up to 100% due to smaller insulin manufacturers
CAGR volume1: 2.4% CAGR value1: 3.8%
Investor presentation First six months of 2015
May 2015
May 2010
Slide 53
5,05
4,10
3,50
4,72
11,82 11,82
0%
10%
20%
30%
40%
50%
60%
70%
0%
20%
40%
60%
80%
100%
0
10
20
30
40
50
60
70
80
90
100
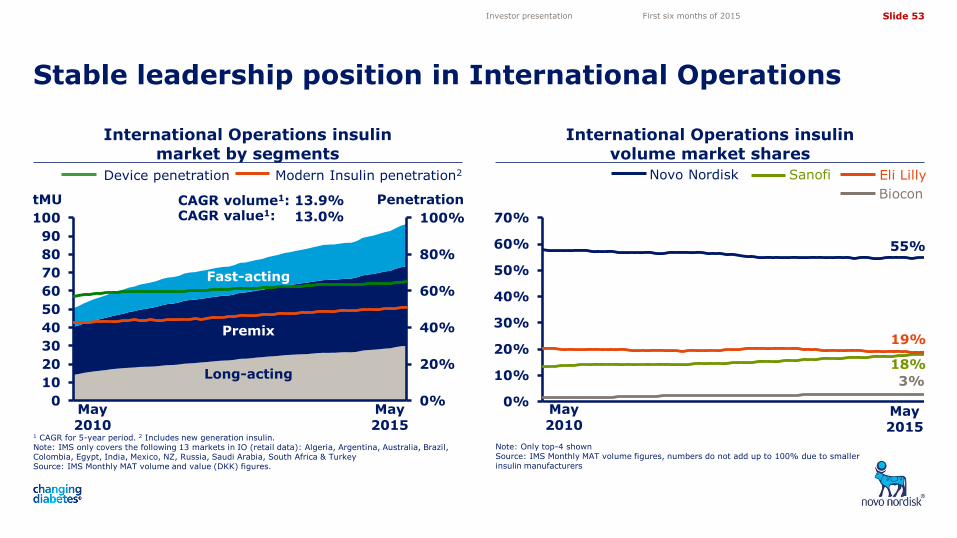
International Operations insulin market by segments
International Operations insulin volume market shares
Stable leadership position in International Operations
Note: Only top-4 shown Source: IMS Monthly MAT volume figures, numbers do not add up to 100% due to smaller insulin manufacturers
Device penetration
tMU Penetration CAGR volume1: 13.9% CAGR value1: 13.0%
May 2015
Biocon
1 CAGR for 5-year period. 2 Includes new generation insulin. Note: IMS only covers the following 13 markets in IO (retail data): Algeria, Argentina, Australia, Brazil, Colombia, Egypt, India, Mexico, NZ, Russia, Saudi Arabia, South Africa & Turkey Source: IMS Monthly MAT volume and value (DKK) figures.
55%
18%
19%
May 2010
3%
Sanofi Novo Nordisk
Fast-acting
Long-acting
Premix
May 2015
Eli Lilly Modern Insulin penetration2
May 2010
Investor presentation First six months of 2015
Slide 54
5,05
4,10
3,50
4,72
11,82 11,82
0%
20%
40%
60%
80%
100%
0
5
10
15
20
25
30
35
40
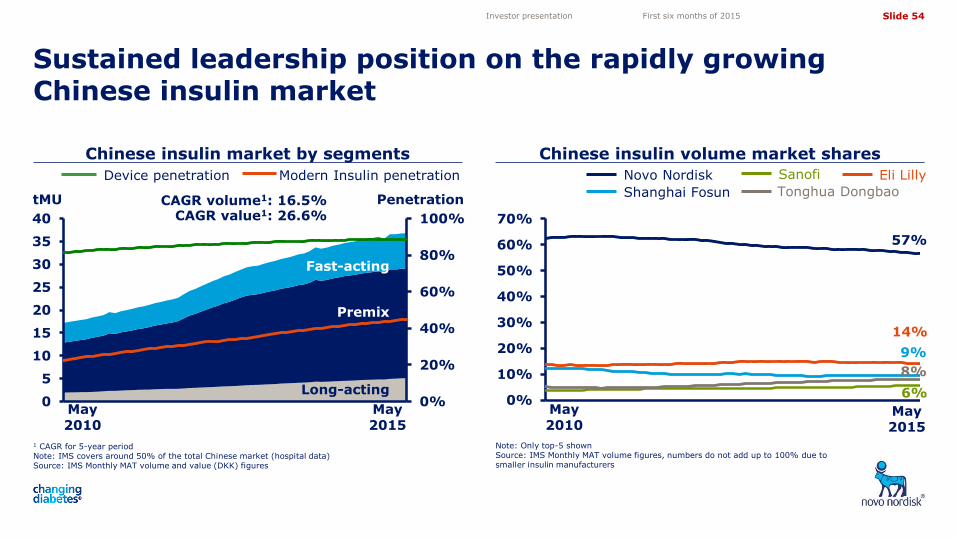
Chinese insulin market by segments Chinese insulin volume market shares
Sustained leadership position on the rapidly growing Chinese insulin market
1 CAGR for 5-year period Note: IMS covers around 50% of the total Chinese market (hospital data) Source: IMS Monthly MAT volume and value (DKK) figures
Note: Only top-5 shown Source: IMS Monthly MAT volume figures, numbers do not add up to 100% due to smaller insulin manufacturers
Modern Insulin penetration Device penetration
tMU Penetration CAGR volume1: 16.5% CAGR value1: 26.6%
Fast-acting
Long-acting
Premix
May 2015
0%
10%
20%
30%
40%
50%
60%
70%
Eli Lilly Novo Nordisk Sanofi
Shanghai Fosun Tonghua Dongbao
57%
6%
14%
9%
8%
May 2010
May 2015
May 2010
Investor presentation First six months of 2015
Slide 55
5,05
4,10
3,50
4,72
11,82 11,82
0%
10%
20%
30%
40%
50%
60%
70%
0%
20%
40%
60%
80%
100%
0
2
4
6
8
10
12
14
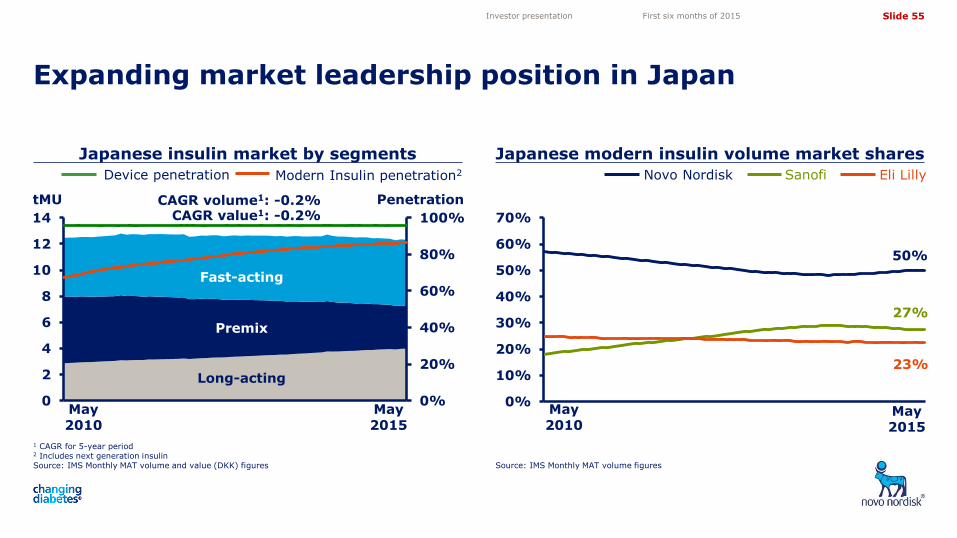
Japanese insulin market by segments Japanese modern insulin volume market shares
Expanding market leadership position in Japan
1 CAGR for 5-year period 2 Includes next generation insulin Source: IMS Monthly MAT volume and value (DKK) figures Source: IMS Monthly MAT volume figures
Device penetration Eli Lilly Novo Nordisk Sanofi
tMU Penetration CAGR volume1: -0.2% CAGR value1: -0.2%
Fast-acting
Long-acting
Premix
May 2010
May 2015
50%
27%
23%
May 2010
May 2015
Modern Insulin penetration2
Investor presentation First six months of 2015
Slide 56
5,05
4,10
3,50
4,72
11,82 11,82
0%
20%
40%
60%
80%
Japanese basal value market shares Japanese total insulin value market shares
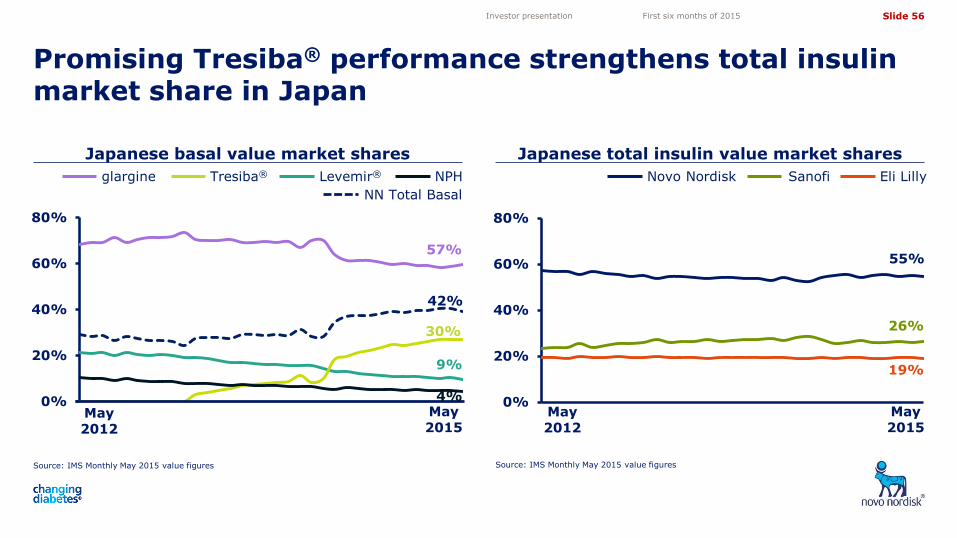
Promising Tresiba® performance strengthens total insulin market share in Japan
Source: IMS Monthly May 2015 value figures Source: IMS Monthly May 2015 value figures
Investor presentation First six months of 2015
May 2012
May 2015
Tresiba®
NN Total Basal
glargine Levemir® NPH
42%
57%
30%
9%
4% 0%
20%
40%
60%
80%
Eli Lilly Novo Nordisk Sanofi
May 2012
May 2015
55%
19%
26%
Slide 57
5,05
4,10
3,50
4,72
11,82 11,82
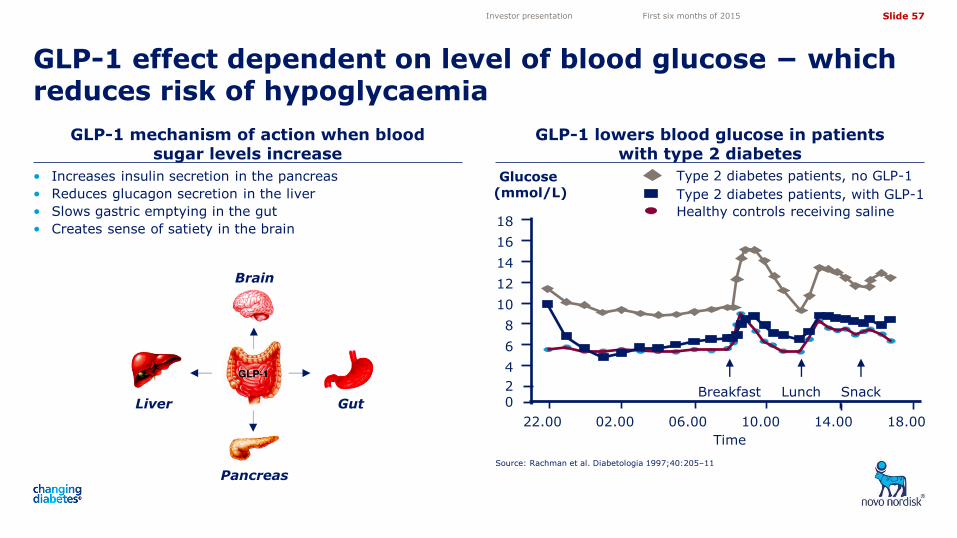
GLP-1 mechanism of action when blood sugar levels increase
GLP-1 lowers blood glucose in patients with type 2 diabetes
GLP-1 effect dependent on level of blood glucose − which reduces risk of hypoglycaemia
Source: Rachman et al. Diabetologia 1997;40:205–11
Investor presentation First six months of 2015
• Increases insulin secretion in the pancreas
• Reduces glucagon secretion in the liver
• Slows gastric emptying in the gut
• Creates sense of satiety in the brain
Pancreas
Liver
Brain
Gut
Glucose (mmol/L)
12
8
6
0
22.00 02.00 06.00 10.00 14.00
10
4
14
16
Time
2 Breakfast Lunch Snack
18.00
18
Type 2 diabetes patients, no GLP-1
Healthy controls receiving saline
Type 2 diabetes patients, with GLP-1
Slide 58
5,05
4,10
3,50
4,72
11,82 11,82
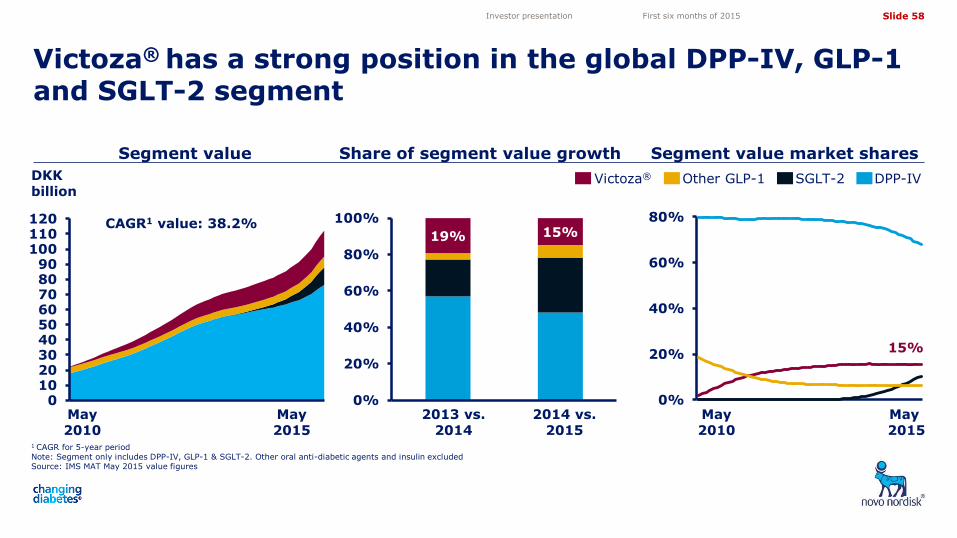
DPP-IV SGLT-2 Victoza® Other GLP-1
Share of segment value growth Segment value market shares
0102030405060708090
100110120
1 CAGR for 5-year period Note: Segment only includes DPP-IV, GLP-1 & SGLT-2. Other oral anti-diabetic agents and insulin excluded Source: IMS MAT May 2015 value figures
Victoza® has a strong position in the global DPP-IV, GLP-1 and SGLT-2 segment
19% 15%
0%
20%
40%
60%
80%
100%
Segment value
DKK billion
0%
20%
40%
60%
80%
May 2010
May 2015
May 2010
May 2015
CAGR1 value: 38.2%
15%
2014 vs. 2015
2013 vs. 2014
Investor presentation First six months of 2015
Slide 59
5,05
4,10
3,50
4,72
11,82 11,82
0
5
10
15
20
25
0%
1%
2%
3%
4%
5%
6%
7%
8%
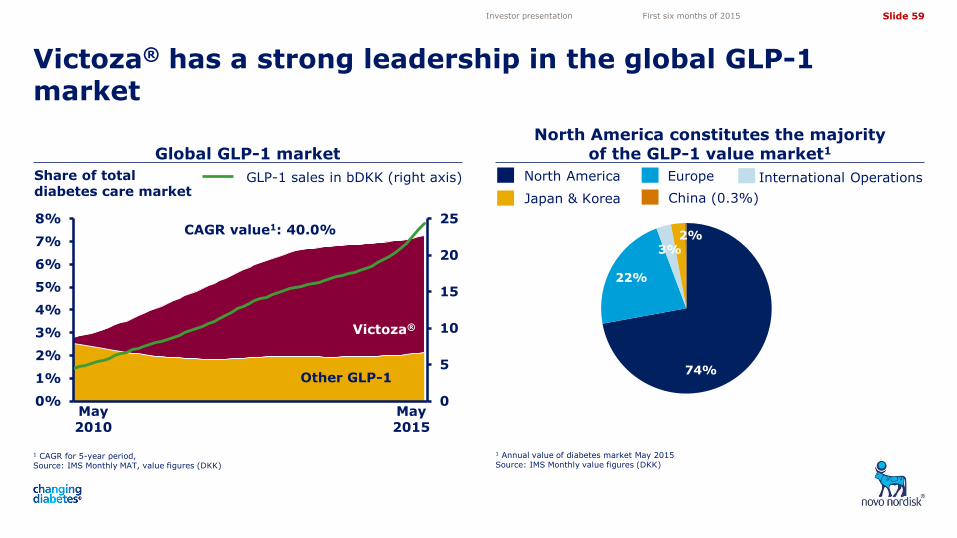
Global GLP-1 market North America constitutes the majority
of the GLP-1 value market1
Victoza® has a strong leadership in the global GLP-1 market
1 CAGR for 5-year period, Source: IMS Monthly MAT, value figures (DKK)
1 Annual value of diabetes market May 2015 Source: IMS Monthly value figures (DKK)
Investor presentation First six months of 2015
Europe North America
Japan & Korea
International Operations
China (0.3%)
4% 4%
May 2015
22%
74%
2% 3%
GLP-1 sales in bDKK (right axis)
Victoza®
May 2010
CAGR value1: 40.0%
Share of total diabetes care market
Other GLP-1
Slide 60
5,05
4,10
3,50
4,72
11,82 11,82
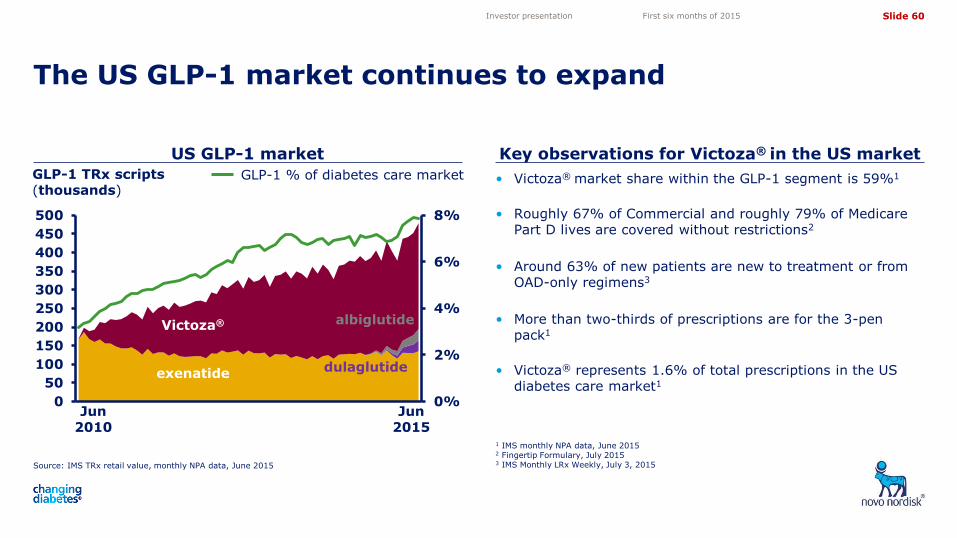
• Victoza® market share within the GLP-1 segment is 59%1
• Roughly 67% of Commercial and roughly 79% of Medicare Part D lives are covered without restrictions2
• Around 63% of new patients are new to treatment or from OAD-only regimens3
• More than two-thirds of prescriptions are for the 3-pen pack1
• Victoza® represents 1.6% of total prescriptions in the US diabetes care market1
Source: IMS TRx retail value, monthly NPA data, June 2015
US GLP-1 market Key observations for Victoza® in the US market
0%
2%
4%
6%
8%
0
50
100
150
200
250
300
350
400
450
500
The US GLP-1 market continues to expand
1 IMS monthly NPA data, June 2015 2 Fingertip Formulary, July 2015 3 IMS Monthly LRx Weekly, July 3, 2015
GLP-1 % of diabetes care market GLP-1 TRx scripts (thousands)
Victoza®
exenatide
Investor presentation First six months of 2015
albiglutide
dulaglutide
Jun 2015
Jun 2010
Slide 61
5,05
4,10
3,50
4,72
11,82 11,82
0%
20%
40%
60%
80%
100%
0%
20%
40%
60%
80%
Value market shares of key Novo Nordisk products in the US
% unrestricted market access of key Novo Nordisk products in the US
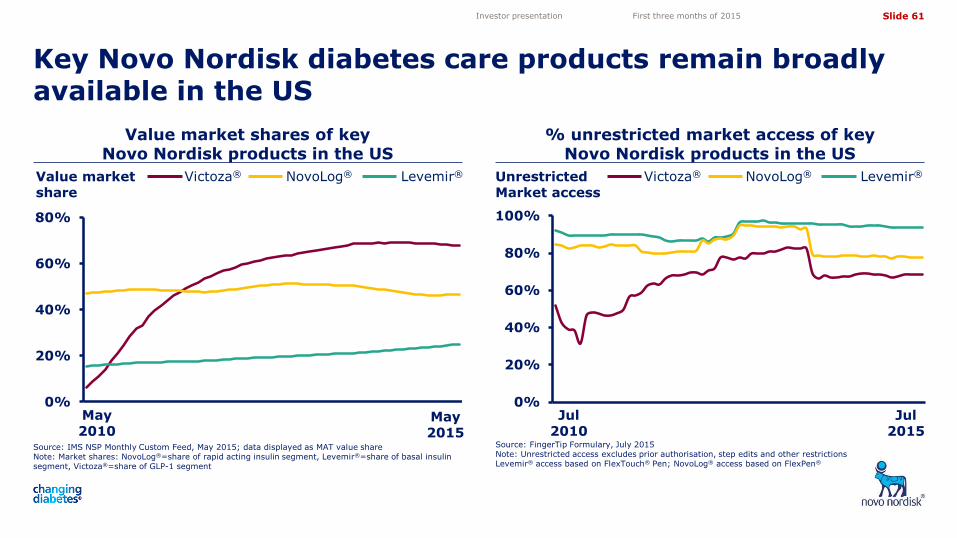
Key Novo Nordisk diabetes care products remain broadly available in the US
Source: IMS NSP Monthly Custom Feed, May 2015; data displayed as MAT value share Note: Market shares: NovoLog®=share of rapid acting insulin segment, Levemir®=share of basal insulin segment, Victoza®=share of GLP-1 segment
Source: FingerTip Formulary, July 2015 Note: Unrestricted access excludes prior authorisation, step edits and other restrictions Levemir® access based on FlexTouch® Pen; NovoLog® access based on FlexPen®
Jul 2010
Jul 2015
May 2010
May 2015
Value market share
Unrestricted Market access
Victoza® NovoLog® Levemir® Victoza® NovoLog® Levemir®
Investor presentation First three months of 2015
Slide 62
5,05
4,10
3,50
4,72
11,82 11,82
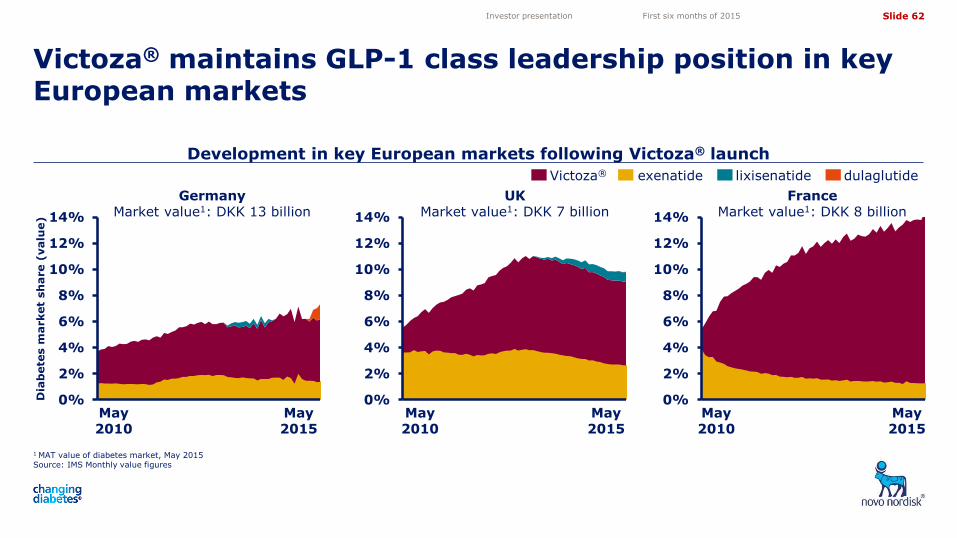
Development in key European markets following Victoza® launch
0%
2%
4%
6%
8%
10%
12%
14%
1 MAT value of diabetes market, May 2015 Source: IMS Monthly value figures
Victoza® maintains GLP-1 class leadership position in key European markets
Germany Market value1: DKK 13 billion
UK Market value1: DKK 7 billion
France Market value1: DKK 8 billion
May 2010
May 2015
May 2010
May 2015
May 2010
May 2015
Dia
bete
s m
arket
sh
are (
valu
e)
lixisenatide Victoza® exenatide
Investor presentation First six months of 2015
dulaglutide
0%
2%
4%
6%
8%
10%
12%
14%
0%
2%
4%
6%
8%
10%
12%
14%
Slide 63
5,05
4,10
3,50
4,72
11,82 11,82
0%
2%
4%
6%
8%
10%
Victoza exenatide albiglutidelixisenatide dulaglutide
Example of Victoza® promotional sales aid1
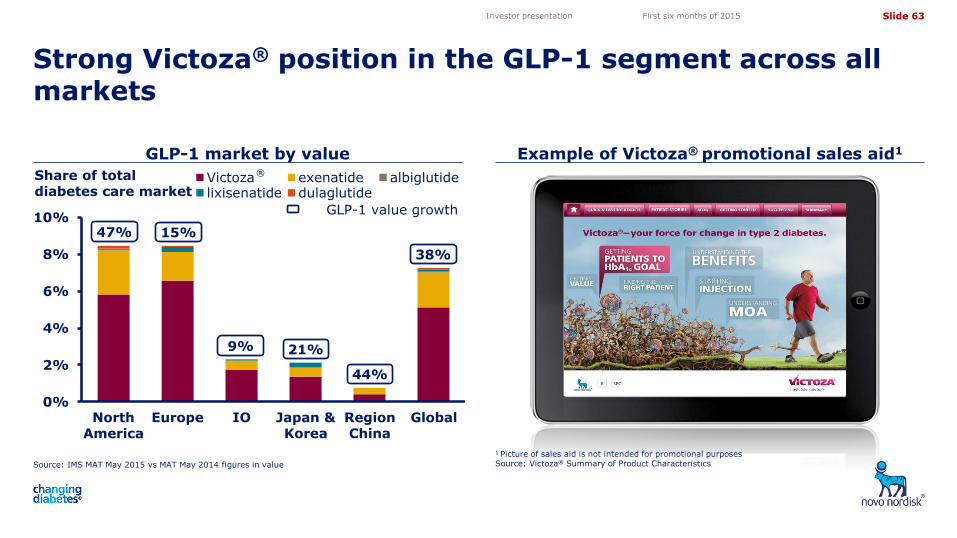
Strong Victoza® position in the GLP-1 segment across all markets
1 Picture of sales aid is not intended for promotional purposes Source: Victoza® Summary of Product Characteristics
GLP-1 market by value
Source: IMS MAT May 2015 vs MAT May 2014 figures in value
North America
Europe IO Japan & Korea
Region China
47%
21%
15%
9%
44%
GLP-1 value growth
38%
Global
® Share of total diabetes care market
Investor presentation First six months of 2015
Slide 64
5,05
4,10
3,50
4,72
11,82 11,82
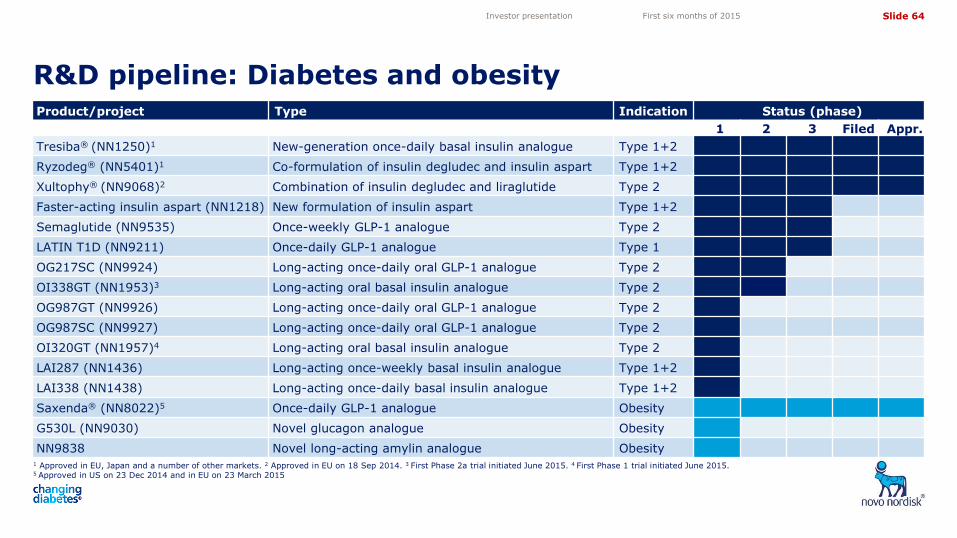
R&D pipeline: Diabetes and obesity
1 Approved in EU, Japan and a number of other markets. 2 Approved in EU on 18 Sep 2014. 3 First Phase 2a trial initiated June 2015. 4 First Phase 1 trial initiated June 2015. 5 Approved in US on 23 Dec 2014 and in EU on 23 March 2015
Investor presentation First six months of 2015
Product/project Type Indication Status (phase)
1 2 3 Filed Appr.
Tresiba® (NN1250)1 New-generation once-daily basal insulin analogue Type 1+2
Ryzodeg® (NN5401)1 Co-formulation of insulin degludec and insulin aspart Type 1+2
Xultophy® (NN9068)2 Combination of insulin degludec and liraglutide Type 2
Faster-acting insulin aspart (NN1218) New formulation of insulin aspart Type 1+2
Semaglutide (NN9535) Once-weekly GLP-1 analogue Type 2
LATIN T1D (NN9211) Once-daily GLP-1 analogue Type 1
OG217SC (NN9924) Long-acting once-daily oral GLP-1 analogue Type 2
OI338GT (NN1953)3 Long-acting oral basal insulin analogue Type 2
OG987GT (NN9926) Long-acting once-daily oral GLP-1 analogue Type 2
OG987SC (NN9927) Long-acting once-daily oral GLP-1 analogue Type 2
OI320GT (NN1957)4 Long-acting oral basal insulin analogue Type 2
LAI287 (NN1436) Long-acting once-weekly basal insulin analogue Type 1+2
LAI338 (NN1438) Long-acting once-daily basal insulin analogue Type 1+2
Saxenda® (NN8022)5 Once-daily GLP-1 analogue Obesity
G530L (NN9030) Novel glucagon analogue Obesity
NN9838 Novel long-acting amylin analogue Obesity
Slide 65
5,05
4,10
3,50
4,72
11,82 11,82
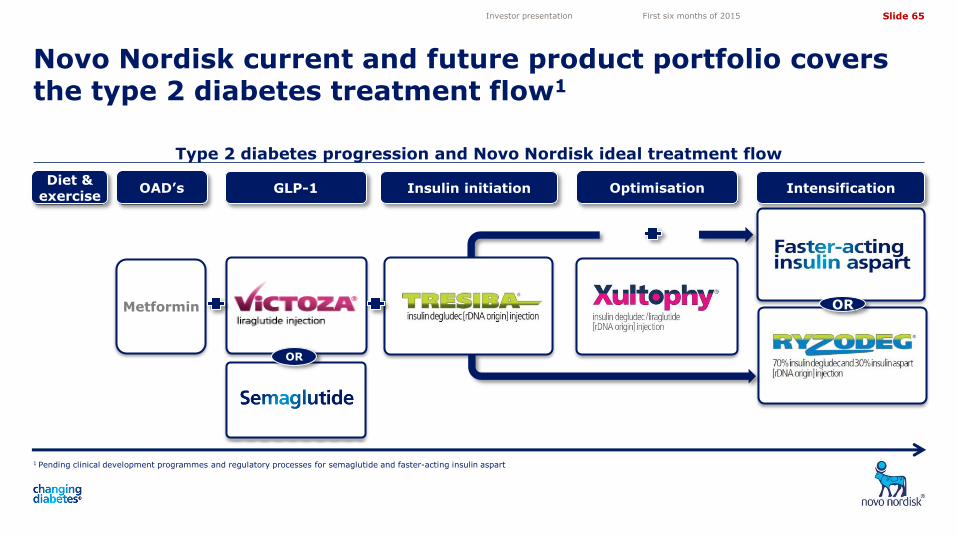
OR
Optimisation
Type 2 diabetes progression and Novo Nordisk ideal treatment flow
1 Pending clinical development programmes and regulatory processes for semaglutide and faster-acting insulin aspart
Novo Nordisk current and future product portfolio covers the type 2 diabetes treatment flow1
Investor presentation First six months of 2015
Metformin
OAD’s GLP-1 Insulin initiation Intensification
OR
Diet & exercise
Slide 66
5,05
4,10
3,50
4,72
11,82 11,82
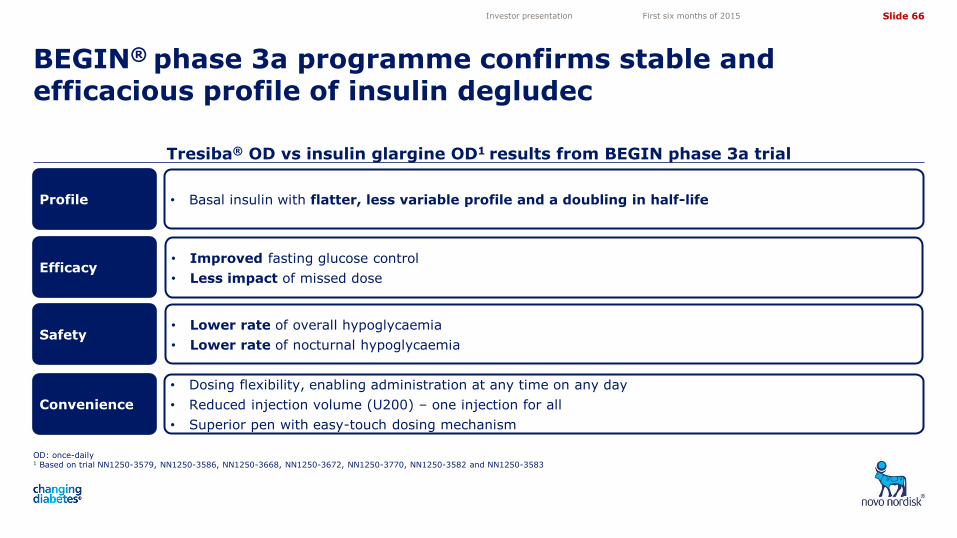
Tresiba® OD vs insulin glargine OD1 results from BEGIN phase 3a trial
OD: once-daily
1 Based on trial NN1250-3579, NN1250-3586, NN1250-3668, NN1250-3672, NN1250-3770, NN1250-3582 and NN1250-3583
BEGIN® phase 3a programme confirms stable and efficacious profile of insulin degludec
Investor presentation First six months of 2015
• Improved fasting glucose control
• Less impact of missed dose
• Lower rate of overall hypoglycaemia
• Lower rate of nocturnal hypoglycaemia
• Dosing flexibility, enabling administration at any time on any day
• Reduced injection volume (U200) – one injection for all
• Superior pen with easy-touch dosing mechanism
• Basal insulin with flatter, less variable profile and a doubling in half-life
Convenience
Safety
Efficacy
Profile
Slide 67
5,05
4,10
3,50
4,72
11,82 11,82
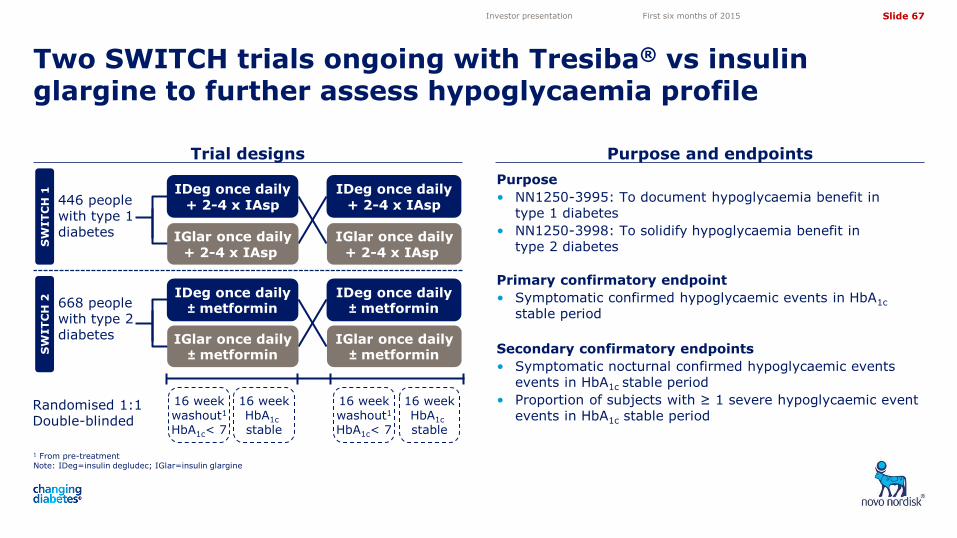
Trial designs Purpose and endpoints
Two SWITCH trials ongoing with Tresiba® vs insulin glargine to further assess hypoglycaemia profile
1 From pre-treatment Note: IDeg=insulin degludec; IGlar=insulin glargine
Investor presentation First six months of 2015
IDeg once daily + 2-4 x IAsp 446 people
with type 1 diabetes
16 week washout1 HbA1c< 7
16 week HbA1c stable
16 week washout1 HbA1c< 7
16 week HbA1c stable
Purpose
• NN1250-3995: To document hypoglycaemia benefit in type 1 diabetes
• NN1250-3998: To solidify hypoglycaemia benefit in type 2 diabetes
Primary confirmatory endpoint
• Symptomatic confirmed hypoglycaemic events in HbA1c stable period
Secondary confirmatory endpoints
• Symptomatic nocturnal confirmed hypoglycaemic events events in HbA1c stable period
• Proportion of subjects with ≥ 1 severe hypoglycaemic event events in HbA1c stable period
Randomised 1:1 Double-blinded
668 people with type 2 diabetes
SW
IT
CH
1
SW
IT
CH
2
IGlar once daily + 2-4 x IAsp
IGlar once daily + 2-4 x IAsp
IDeg once daily + 2-4 x IAsp
IDeg once daily ± metformin
IGlar once daily ± metformin
IGlar once daily ± metformin
IDeg once daily ± metformin
Slide 68
5,05
4,10
3,50
4,72
11,82 11,82
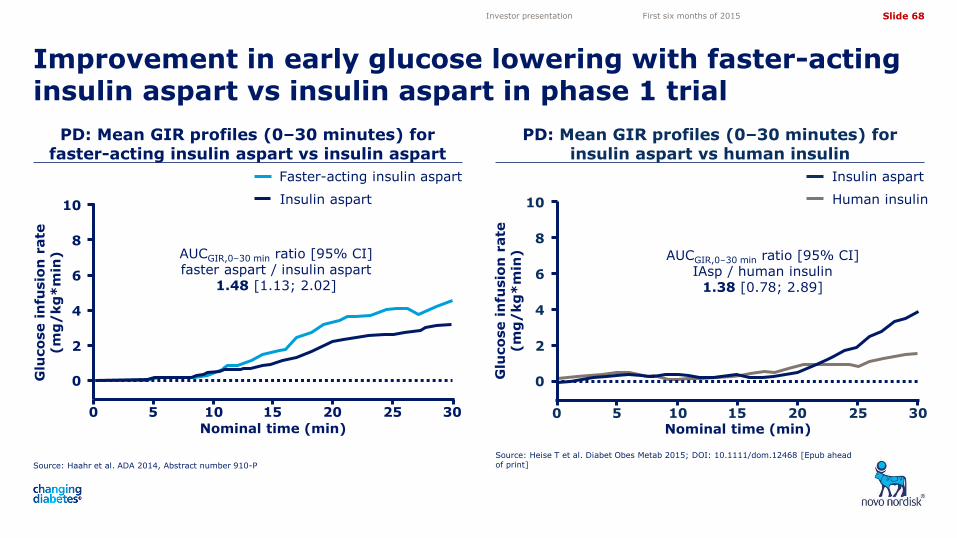
PD: Mean GIR profiles (0–30 minutes) for faster-acting insulin aspart vs insulin aspart
PD: Mean GIR profiles (0–30 minutes) for insulin aspart vs human insulin
Improvement in early glucose lowering with faster-acting insulin aspart vs insulin aspart in phase 1 trial
Source: Haahr et al. ADA 2014, Abstract number 910-P
Source: Heise T et al. Diabet Obes Metab 2015; DOI: 10.1111/dom.12468 [Epub ahead of print]
Investor presentation First six months of 2015
Faster-acting insulin aspart
Insulin aspart
AUCGIR,0–30 min ratio [95% CI] faster aspart / insulin aspart
1.48 [1.13; 2.02]
Glu
co
se i
nfu
sio
n r
ate
(m
g/
kg
*m
in)
0
2
4
6
8
10
0
Nominal time (min)
5 10 15 20 25 30
AUCGIR,0–30 min ratio [95% CI] IAsp / human insulin
1.38 [0.78; 2.89]
Glu
co
se i
nfu
sio
n r
ate
(m
g/
kg
*m
in)
0
2
4
6
8
10
0 Nominal time (min)
5 10 15 20 25 30
Insulin aspart
Human insulin
Slide 69
5,05
4,10
3,50
4,72
11,82 11,82
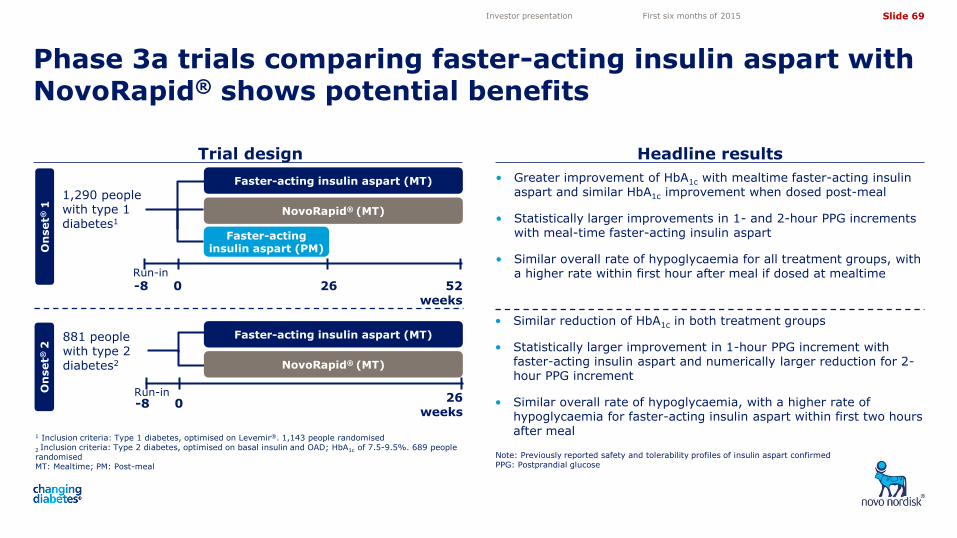
• Greater improvement of HbA1c with mealtime faster-acting insulin aspart and similar HbA1c improvement when dosed post-meal
• Statistically larger improvements in 1- and 2-hour PPG increments with meal-time faster-acting insulin aspart
• Similar overall rate of hypoglycaemia for all treatment groups, with a higher rate within first hour after meal if dosed at mealtime
1 Inclusion criteria: Type 1 diabetes, optimised on Levemir®. 1,143 people randomised
2 Inclusion criteria: Type 2 diabetes, optimised on basal insulin and OAD; HbA1c of 7.5-9.5%. 689 people randomised MT: Mealtime; PM: Post-meal
Trial design Headline results
Phase 3a trials comparing faster-acting insulin aspart with NovoRapid® shows potential benefits
Note: Previously reported safety and tolerability profiles of insulin aspart confirmed PPG: Postprandial glucose
881 people with type 2 diabetes2
Faster-acting insulin aspart (MT)
NovoRapid® (MT)
-8 0 Run-in 26
weeks
Faster-acting insulin aspart (PM)
Faster-acting insulin aspart (MT)
1,290 people with type 1 diabetes1
52 weeks
NovoRapid® (MT)
26
-8 0 Run-in
• Similar reduction of HbA1c in both treatment groups
• Statistically larger improvement in 1-hour PPG increment with faster-acting insulin aspart and numerically larger reduction for 2-hour PPG increment
• Similar overall rate of hypoglycaemia, with a higher rate of hypoglycaemia for faster-acting insulin aspart within first two hours after meal
On
set®
1
On
set®
2
Investor presentation First six months of 2015
Slide 70
5,05
4,10
3,50
4,72
11,82 11,82
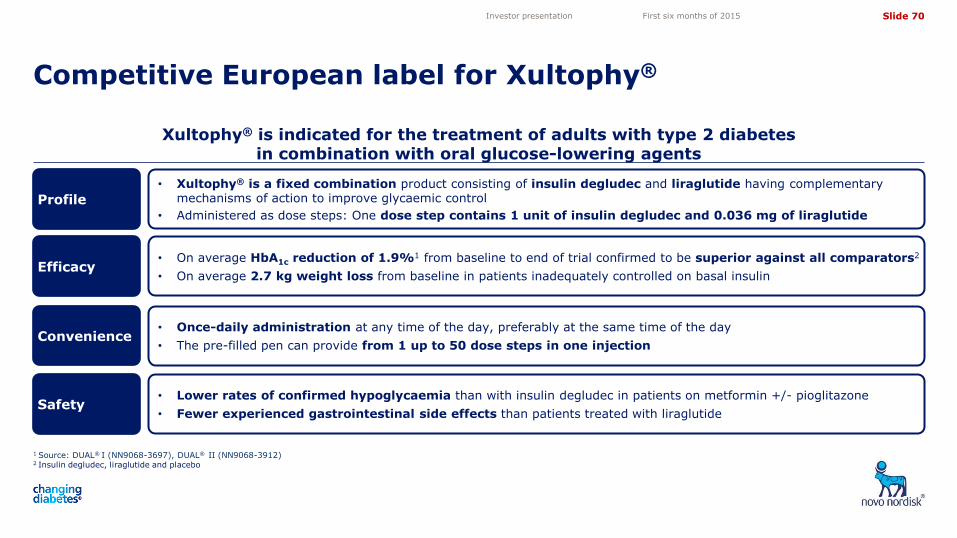
Xultophy® is indicated for the treatment of adults with type 2 diabetes in combination with oral glucose-lowering agents
1 Source: DUAL® I (NN9068-3697), DUAL® II (NN9068-3912)
2 Insulin degludec, liraglutide and placebo
Competitive European label for Xultophy®
Investor presentation First six months of 2015
• Lower rates of confirmed hypoglycaemia than with insulin degludec in patients on metformin +/- pioglitazone
• Fewer experienced gastrointestinal side effects than patients treated with liraglutide
• On average HbA1c reduction of 1.9%1 from baseline to end of trial confirmed to be superior against all comparators2
• On average 2.7 kg weight loss from baseline in patients inadequately controlled on basal insulin
• Once-daily administration at any time of the day, preferably at the same time of the day
• The pre-filled pen can provide from 1 up to 50 dose steps in one injection
• Xultophy® is a fixed combination product consisting of insulin degludec and liraglutide having complementary mechanisms of action to improve glycaemic control
• Administered as dose steps: One dose step contains 1 unit of insulin degludec and 0.036 mg of liraglutide
Convenience
Efficacy
Profile
Safety
Slide 71
5,05
4,10
3,50
4,72
11,82 11,82
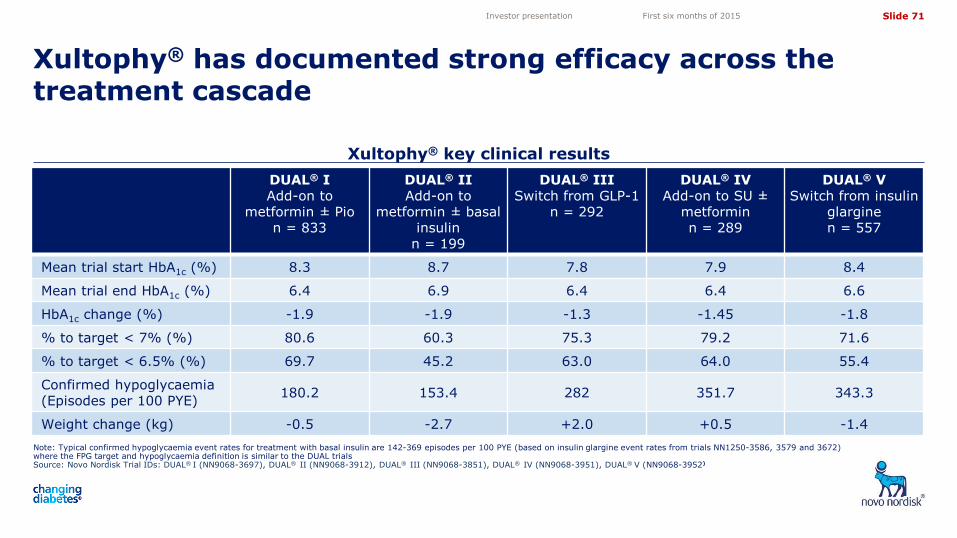
Xultophy® key clinical results
Note: Typical confirmed hypoglycaemia event rates for treatment with basal insulin are 142-369 episodes per 100 PYE (based on insulin glargine event rates from trials NN1250-3586, 3579 and 3672) where the FPG target and hypoglycaemia definition is similar to the DUAL trials Source: Novo Nordisk Trial IDs: DUAL® I (NN9068-3697), DUAL® II (NN9068-3912), DUAL® III (NN9068-3851), DUAL® IV (NN9068-3951), DUAL® V (NN9068-3952)
Xultophy® has documented strong efficacy across the treatment cascade
Investor presentation First six months of 2015
DUAL® I Add-on to
metformin ± Pio n = 833
DUAL® II Add-on to
metformin ± basal insulin
n = 199
DUAL® III Switch from GLP-1
n = 292
DUAL® IV Add-on to SU ±
metformin n = 289
DUAL® V Switch from insulin
glargine n = 557
Mean trial start HbA1c (%) 8.3 8.7 7.8 7.9 8.4
Mean trial end HbA1c (%) 6.4 6.9 6.4 6.4 6.6
HbA1c change (%) -1.9 -1.9 -1.3 -1.45 -1.8
% to target < 7% (%) 80.6 60.3 75.3 79.2 71.6
% to target < 6.5% (%) 69.7 45.2 63.0 64.0 55.4
Confirmed hypoglycaemia (Episodes per 100 PYE)
180.2 153.4 282 351.7 343.3
Weight change (kg) -0.5 -2.7 +2.0 +0.5 -1.4
Slide 72
5,05
4,10
3,50
4,72
11,82 11,82
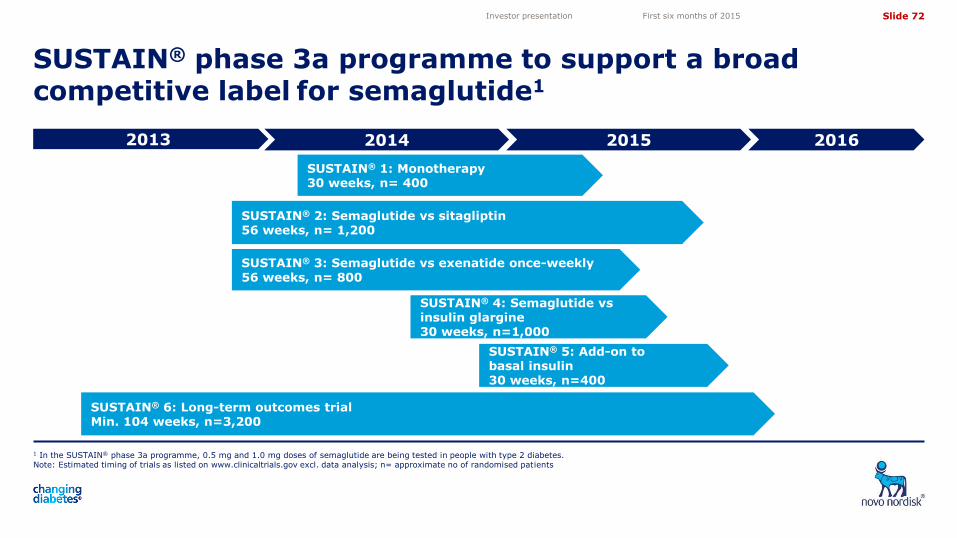
SUSTAIN® phase 3a programme to support a broad competitive label for semaglutide1
1 In the SUSTAIN® phase 3a programme, 0.5 mg and 1.0 mg doses of semaglutide are being tested in people with type 2 diabetes. Note: Estimated timing of trials as listed on www.clinicaltrials.gov excl. data analysis; n= approximate no of randomised patients
Investor presentation First six months of 2015
2013 2014 2015 2016
SUSTAIN® 1: Monotherapy 30 weeks, n= 400
SUSTAIN® 2: Semaglutide vs sitagliptin 56 weeks, n= 1,200
SUSTAIN® 3: Semaglutide vs exenatide once-weekly 56 weeks, n= 800
SUSTAIN® 4: Semaglutide vs insulin glargine 30 weeks, n=1,000
SUSTAIN® 5: Add-on to basal insulin 30 weeks, n=400
SUSTAIN® 6: Long-term outcomes trial Min. 104 weeks, n=3,200
Slide 73
5,05
4,10
3,50
4,72
11,82 11,82
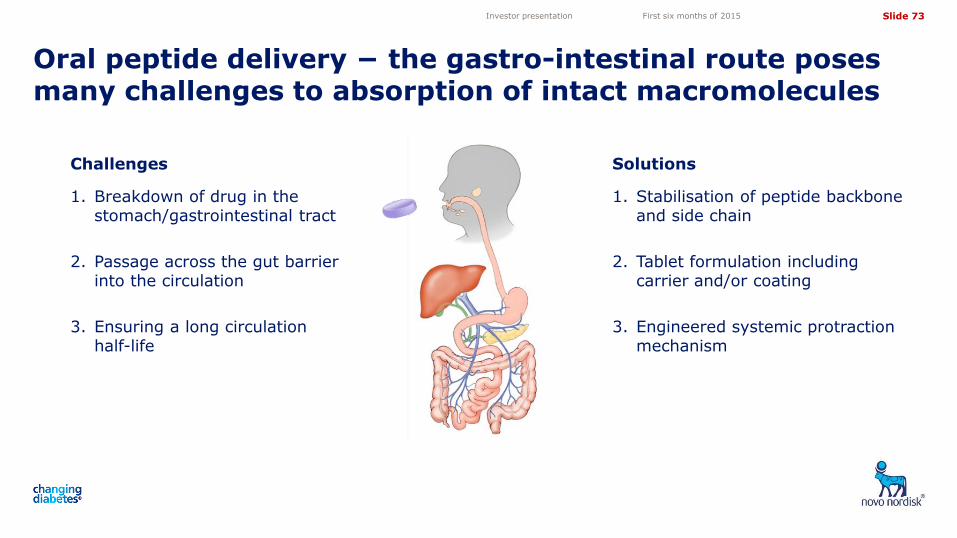
Oral peptide delivery − the gastro-intestinal route poses many challenges to absorption of intact macromolecules
Investor presentation First six months of 2015
Challenges
1. Breakdown of drug in the stomach/gastrointestinal tract
2. Passage across the gut barrier into the circulation
3. Ensuring a long circulation half-life
Solutions
1. Stabilisation of peptide backbone and side chain
2. Tablet formulation including carrier and/or coating
3. Engineered systemic protraction mechanism
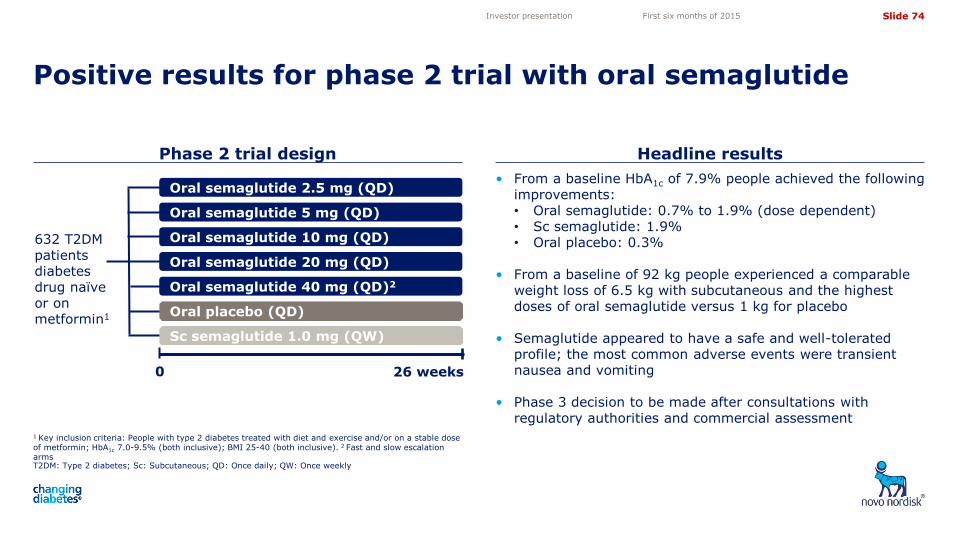
Slide 74
5,05
4,10
3,50
4,72
11,82 11,82
• From a baseline HbA1c of 7.9% people achieved the following improvements: • Oral semaglutide: 0.7% to 1.9% (dose dependent) • Sc semaglutide: 1.9% • Oral placebo: 0.3%
• From a baseline of 92 kg people experienced a comparable weight loss of 6.5 kg with subcutaneous and the highest doses of oral semaglutide versus 1 kg for placebo
• Semaglutide appeared to have a safe and well-tolerated
profile; the most common adverse events were transient nausea and vomiting
• Phase 3 decision to be made after consultations with
regulatory authorities and commercial assessment 1 Key inclusion criteria: People with type 2 diabetes treated with diet and exercise and/or on a stable dose of metformin; HbA1c 7.0-9.5% (both inclusive); BMI 25-40 (both inclusive). 2 Fast and slow escalation arms T2DM: Type 2 diabetes; Sc: Subcutaneous; QD: Once daily; QW: Once weekly
Phase 2 trial design Headline results
Positive results for phase 2 trial with oral semaglutide
Oral placebo (QD)
Sc semaglutide 1.0 mg (QW)
0 26 weeks
632 T2DM patients diabetes drug naïve or on metformin1
Investor presentation First six months of 2015
Oral semaglutide 2.5 mg (QD)
Oral semaglutide 5 mg (QD)
Oral semaglutide 10 mg (QD)
Oral semaglutide 20 mg (QD)
Oral semaglutide 40 mg (QD)2
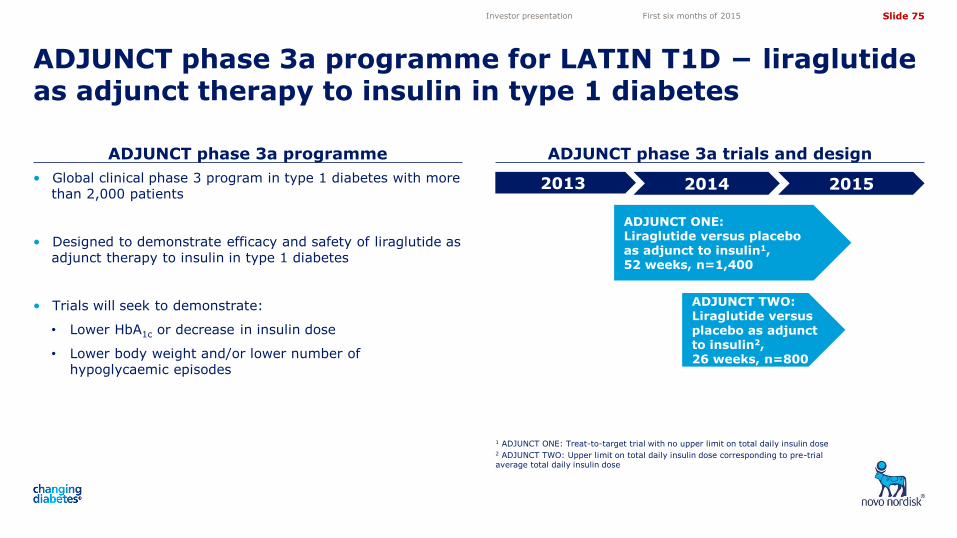
Slide 75
5,05
4,10
3,50
4,72
11,82 11,82
ADJUNCT phase 3a programme ADJUNCT phase 3a trials and design
ADJUNCT phase 3a programme for LATIN T1D − liraglutide as adjunct therapy to insulin in type 1 diabetes
1 ADJUNCT ONE: Treat-to-target trial with no upper limit on total daily insulin dose 2 ADJUNCT TWO: Upper limit on total daily insulin dose corresponding to pre-trial average total daily insulin dose
Investor presentation First six months of 2015
• Global clinical phase 3 program in type 1 diabetes with more than 2,000 patients
• Designed to demonstrate efficacy and safety of liraglutide as adjunct therapy to insulin in type 1 diabetes
• Trials will seek to demonstrate:
• Lower HbA1c or decrease in insulin dose
• Lower body weight and/or lower number of hypoglycaemic episodes
2013 2014 2015
ADJUNCT ONE: Liraglutide versus placebo as adjunct to insulin1, 52 weeks, n=1,400
ADJUNCT TWO: Liraglutide versus placebo as adjunct to insulin2, 26 weeks, n=800
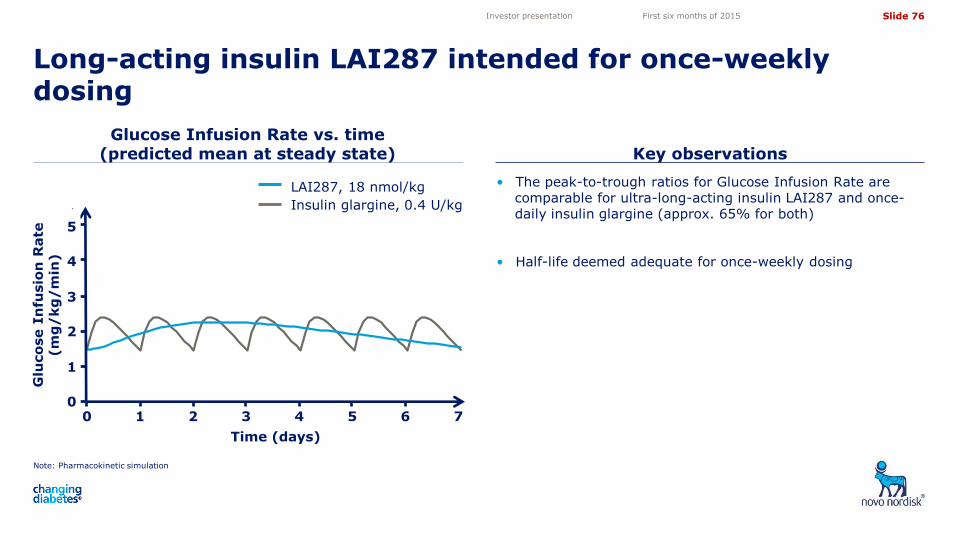
Slide 76
5,05
4,10
3,50
4,72
11,82 11,82
Glucose Infusion Rate vs. Time (Predicted Mean)
Time (days)
Glu
cose
Infu
sio
n R
ate
(m
g/k
g/m
in)
0 2 4 6
01
23
45
6 18 nmol/kgIGlar 0.4 U/kg
2013-Oct-25T11:20:20 E:/Project/NN1436/NN1436-3955/current/Splus/Final/09_MultipleDoseComparison.ssc
Glucose Infusion Rate vs. time (predicted mean at steady state) Key observations
Long-acting insulin LAI287 intended for once-weekly dosing
Note: Pharmacokinetic simulation
Investor presentation First six months of 2015
• The peak-to-trough ratios for Glucose Infusion Rate are comparable for ultra-long-acting insulin LAI287 and once-daily insulin glargine (approx. 65% for both)
• Half-life deemed adequate for once-weekly dosing
LAI287, 18 nmol/kg
Insulin glargine, 0.4 U/kg
Glu
co
se I
nfu
sio
n R
ate
(m
g/
kg
/m
in)
1
0
3
2
5
4
0 2 4 6
Time (days)
5 1 3
Time (days)
7
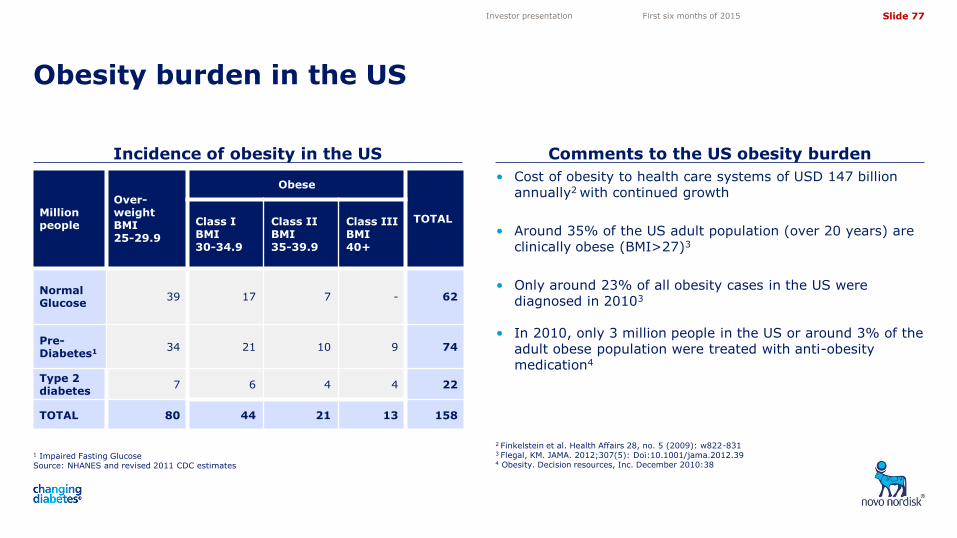
Slide 77
5,05
4,10
3,50
4,72
11,82 11,82
1 Impaired Fasting Glucose Source: NHANES and revised 2011 CDC estimates
Incidence of obesity in the US Comments to the US obesity burden
Obesity burden in the US
2 Finkelstein et al. Health Affairs 28, no. 5 (2009): w822-831 3 Flegal, KM. JAMA. 2012;307(5): Doi:10.1001/jama.2012.39 4 Obesity. Decision resources, Inc. December 2010:38
Investor presentation First six months of 2015
• Cost of obesity to health care systems of USD 147 billion annually2 with continued growth
• Around 35% of the US adult population (over 20 years) are clinically obese (BMI>27)3
• Only around 23% of all obesity cases in the US were diagnosed in 20103
• In 2010, only 3 million people in the US or around 3% of the adult obese population were treated with anti-obesity medication4
Million people
Over-weight BMI 25-29.9
Obese
TOTAL Class I BMI 30-34.9
Class II BMI 35-39.9
Class III BMI 40+
Normal Glucose
39 17 x7 - 62
Pre-Diabetes1
34 21 10 x9 74
Type 2 diabetes
x7 x6 x4 x4 22
TOTAL 80 44 21 13 158
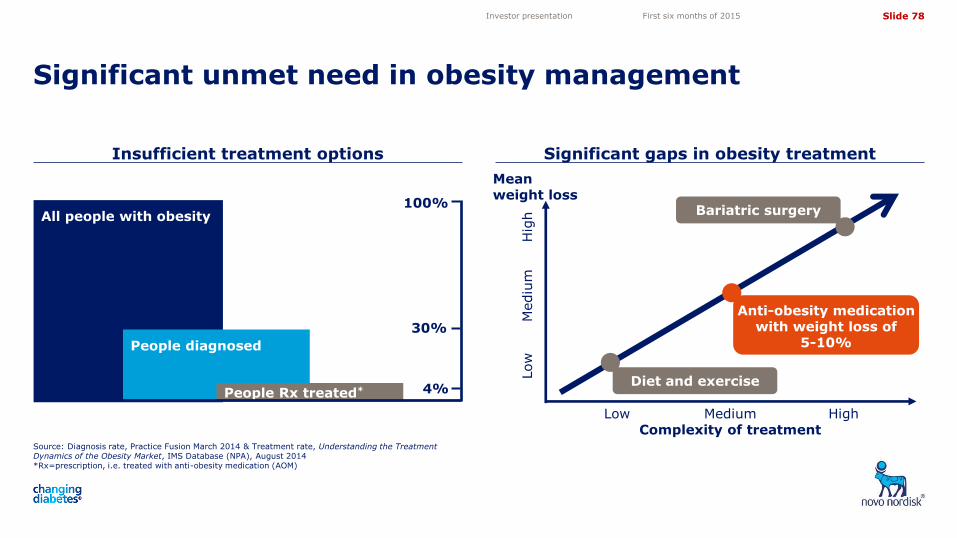
Slide 78
5,05
4,10
3,50
4,72
11,82 11,82
Insufficient treatment options Significant gaps in obesity treatment
Significant unmet need in obesity management
Source: Diagnosis rate, Practice Fusion March 2014 & Treatment rate, Understanding the Treatment Dynamics of the Obesity Market, IMS Database (NPA), August 2014 *Rx=prescription, i.e. treated with anti-obesity medication (AOM)
All people with obesity
People diagnosed
People Rx treated*
100%
30%
4%
Complexity of treatment Low Medium High
Low
H
igh
Mediu
m
Anti-obesity medication with weight loss of
5-10%
Diet and exercise
Bariatric surgery
Mean weight loss
Investor presentation First six months of 2015
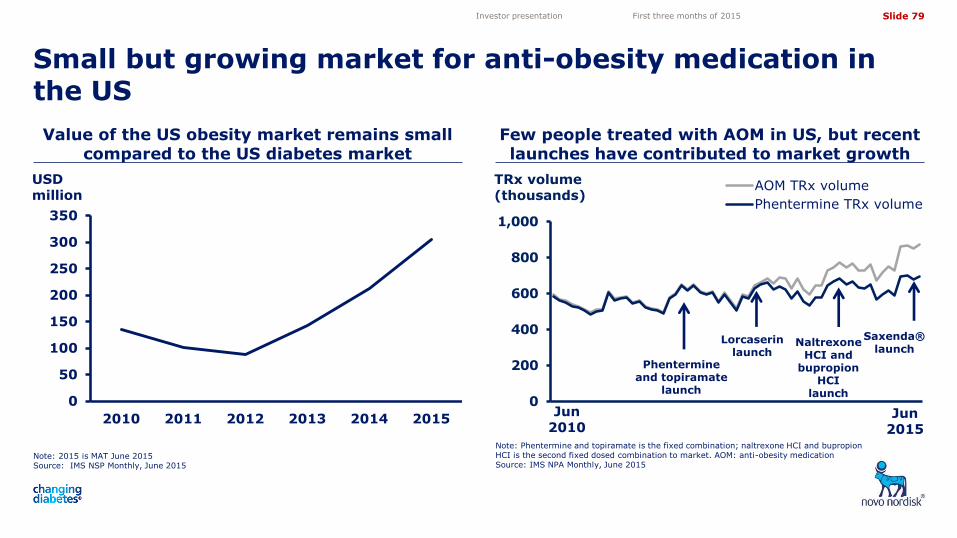
Slide 79
5,05
4,10
3,50
4,72
11,82 11,82
0
200
400
600
800
1,000
AOM TRx volume
Phentermine TRx volume
Value of the US obesity market remains small compared to the US diabetes market
Few people treated with AOM in US, but recent launches have contributed to market growth
Small but growing market for anti-obesity medication in the US
Note: 2015 is MAT June 2015 Source: IMS NSP Monthly, June 2015
Note: Phentermine and topiramate is the fixed combination; naltrexone HCI and bupropion HCI is the second fixed dosed combination to market. AOM: anti-obesity medication Source: IMS NPA Monthly, June 2015
Investor presentation First three months of 2015
TRx volume (thousands)
Phentermine and topiramate
launch
Lorcaserin
launch
USD million
Naltrexone HCI and
bupropion HCI
launch
Saxenda® launch
Jun 2010
Jun 2015
0
50
100
150
200
250
300
350
2010 2011 2012 2013 2014 2015
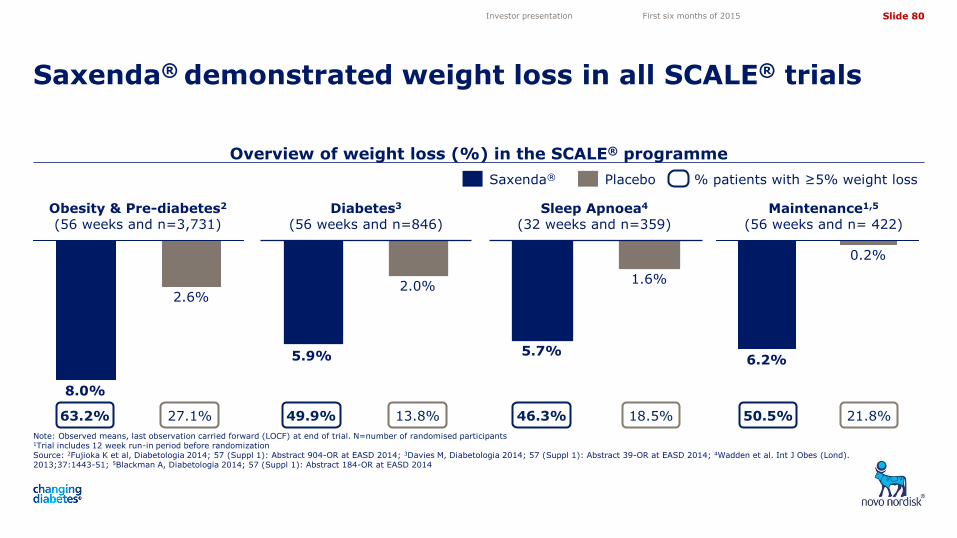
Slide 80
5,05
4,10
3,50
4,72
11,82 11,82
Overview of weight loss (%) in the SCALE® programme
Note: Observed means, last observation carried forward (LOCF) at end of trial. N=number of randomised participants
1Trial includes 12 week run-in period before randomization Source: 2Fujioka K et al, Diabetologia 2014; 57 (Suppl 1): Abstract 904-OR at EASD 2014; 3Davies M, Diabetologia 2014; 57 (Suppl 1): Abstract 39-OR at EASD 2014; 4Wadden et al. Int J Obes (Lond). 2013;37:1443-51; 5Blackman A, Diabetologia 2014; 57 (Suppl 1): Abstract 184-OR at EASD 2014
Saxenda® demonstrated weight loss in all SCALE® trials
Investor presentation First six months of 2015
Saxenda® Placebo % patients with ≥5% weight loss
2.0%
5.9%
0.2%
6.2%
1.6%
5.7%
Maintenance1,5
(56 weeks and n= 422) Diabetes3
(56 weeks and n=846) Obesity & Pre-diabetes2 (56 weeks and n=3,731)
Sleep Apnoea4
(32 weeks and n=359)
2.6%
8.0%
63.2% 27.1% 49.9% 13.8% 50.5% 21.8% 46.3% 18.5%
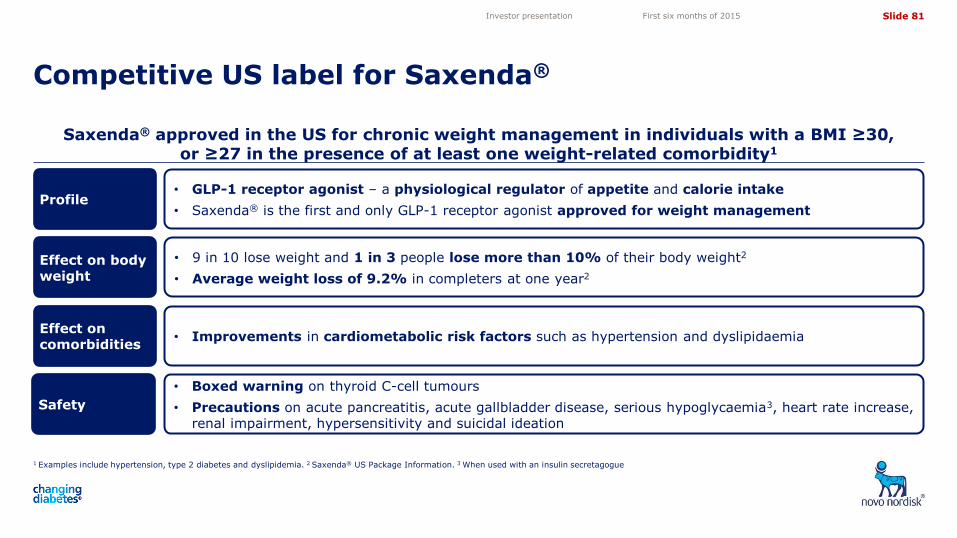
Slide 81
5,05
4,10
3,50
4,72
11,82 11,82
Saxenda® approved in the US for chronic weight management in individuals with a BMI ≥30, or ≥27 in the presence of at least one weight-related comorbidity1
1 Examples include hypertension, type 2 diabetes and dyslipidemia. 2 Saxenda® US Package Information. 3 When used with an insulin secretagogue
Competitive US label for Saxenda®
Investor presentation First six months of 2015
• Improvements in cardiometabolic risk factors such as hypertension and dyslipidaemia
• Boxed warning on thyroid C-cell tumours
• Precautions on acute pancreatitis, acute gallbladder disease, serious hypoglycaemia3, heart rate increase, renal impairment, hypersensitivity and suicidal ideation
Profile
Safety
Effect on body weight
Effect on comorbidities
• GLP-1 receptor agonist – a physiological regulator of appetite and calorie intake
• Saxenda® is the first and only GLP-1 receptor agonist approved for weight management
• 9 in 10 lose weight and 1 in 3 people lose more than 10% of their body weight2
• Average weight loss of 9.2% in completers at one year2
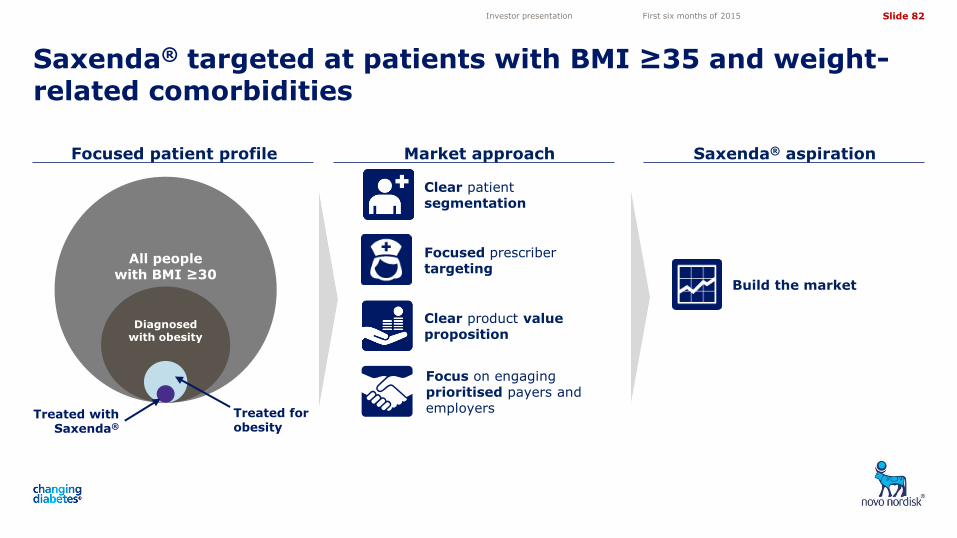
Slide 82
5,05
4,10
3,50
4,72
11,82 11,82
Saxenda® targeted at patients with BMI ≥35 and weight-related comorbidities
All people with BMI ≥30
Treated with Saxenda®
Treated for obesity
Diagnosed with obesity
Saxenda® aspiration Market approach Focused patient profile
Clear product value proposition
Focused prescriber targeting
Focus on engaging prioritised payers and employers
Clear patient segmentation
Build the market
Investor presentation First six months of 2015
Slide 83
5,05
4,10
3,50
4,72
11,82 11,82
Biopharmaceuticals
Investor presentation First six months of 2015
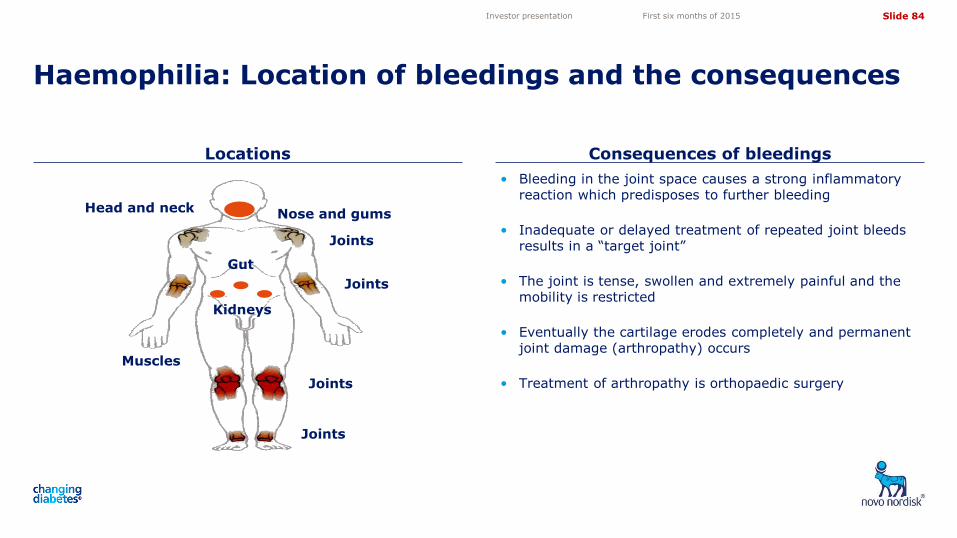
Slide 84
5,05
4,10
3,50
4,72
11,82 11,82
Locations Consequences of bleedings
Haemophilia: Location of bleedings and the consequences
Investor presentation First six months of 2015
• Bleeding in the joint space causes a strong inflammatory reaction which predisposes to further bleeding
• Inadequate or delayed treatment of repeated joint bleeds results in a “target joint”
• The joint is tense, swollen and extremely painful and the mobility is restricted
• Eventually the cartilage erodes completely and permanent joint damage (arthropathy) occurs
• Treatment of arthropathy is orthopaedic surgery
Nose and gums
Joints
Gut
Kidneys
Head and neck
Joints
Joints
Muscles
Joints
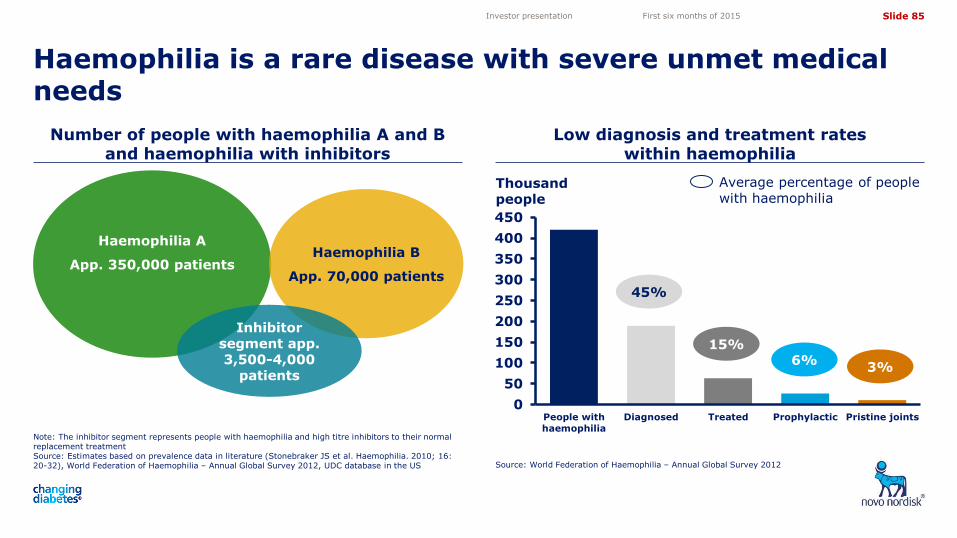
Slide 85
5,05
4,10
3,50
4,72
11,82 11,82
Number of people with haemophilia A and B and haemophilia with inhibitors
Low diagnosis and treatment rates within haemophilia
Haemophilia is a rare disease with severe unmet medical needs
Note: The inhibitor segment represents people with haemophilia and high titre inhibitors to their normal replacement treatment Source: Estimates based on prevalence data in literature (Stonebraker JS et al. Haemophilia. 2010; 16: 20-32), World Federation of Haemophilia – Annual Global Survey 2012, UDC database in the US Source: World Federation of Haemophilia – Annual Global Survey 2012
Investor presentation First six months of 2015
Haemophilia A
App. 350,000 patients
Haemophilia B
App. 70,000 patients
Inhibitor segment app. 3,500-4,000
patients
Average percentage of people with haemophilia
0
50
100
150
200
250
300
350
400
450
People with
haemophilia
Diagnosed Treated Prophylactic Pristine joints
45%
15%
3% 6%
Thousand people
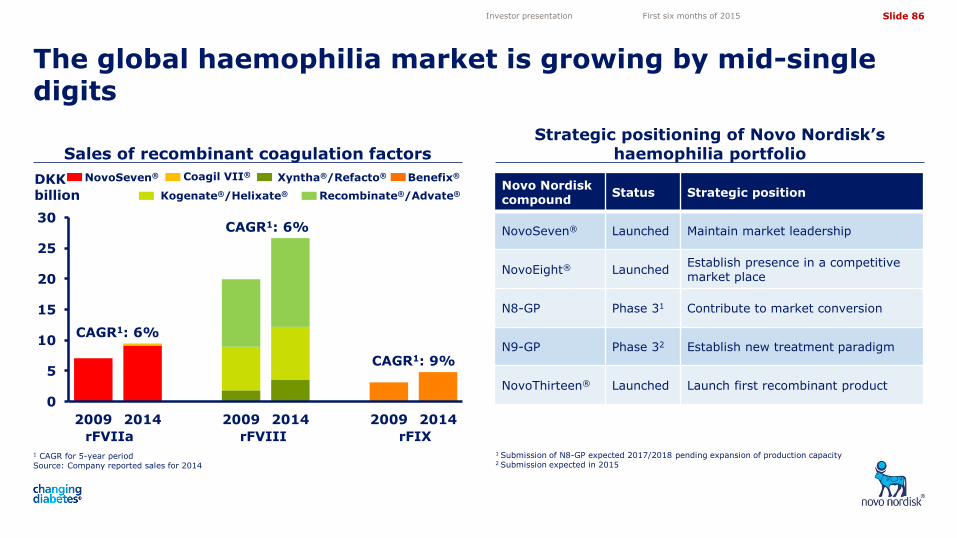
Slide 86
5,05
4,10
3,50
4,72
11,82 11,82
Novo Nordisk compound
Status Strategic position
NovoSeven® Launched Maintain market leadership
NovoEight® Launched Establish presence in a competitive market place
N8-GP Phase 31 Contribute to market conversion
N9-GP Phase 32 Establish new treatment paradigm
NovoThirteen® Launched Launch first recombinant product
Sales of recombinant coagulation factors Strategic positioning of Novo Nordisk’s
haemophilia portfolio
The global haemophilia market is growing by mid-single digits
1 CAGR for 5-year period Source: Company reported sales for 2014
1 Submission of N8-GP expected 2017/2018 pending expansion of production capacity 2 Submission expected in 2015
Investor presentation First six months of 2015
0
5
10
15
20
25
30
2009 2014 2009 2014 2009 2014
DKK billion
rFVIIa rFVIII rFIX
CAGR1: 6%
CAGR1: 6%
CAGR1: 9%
NovoSeven® Xyntha®/Refacto®
Kogenate®/Helixate® Recombinate®/Advate®
Coagil VII® Benefix®
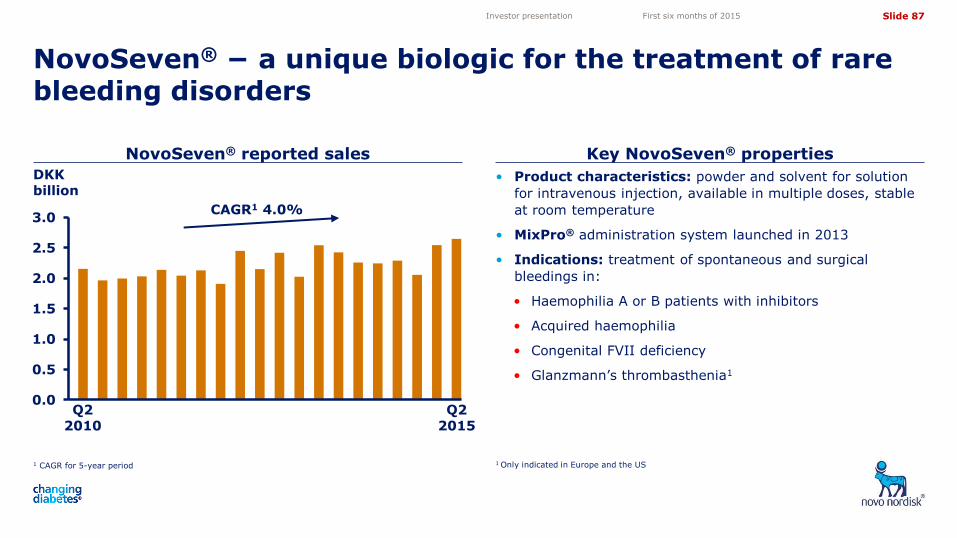
Slide 87
5,05
4,10
3,50
4,72
11,82 11,82
0.0
0.5
1.0
1.5
2.0
2.5
3.0
1 CAGR for 5-year period
NovoSeven® reported sales Key NovoSeven® properties
NovoSeven® − a unique biologic for the treatment of rare bleeding disorders
1 Only indicated in Europe and the US
Investor presentation First six months of 2015
• Product characteristics: powder and solvent for solution
for intravenous injection, available in multiple doses, stable
at room temperature
• MixPro® administration system launched in 2013
• Indications: treatment of spontaneous and surgical
bleedings in:
• Haemophilia A or B patients with inhibitors
• Acquired haemophilia
• Congenital FVII deficiency
• Glanzmann’s thrombasthenia1
Q2 2010
Q2 2015
DKK billion
CAGR1 4.0%
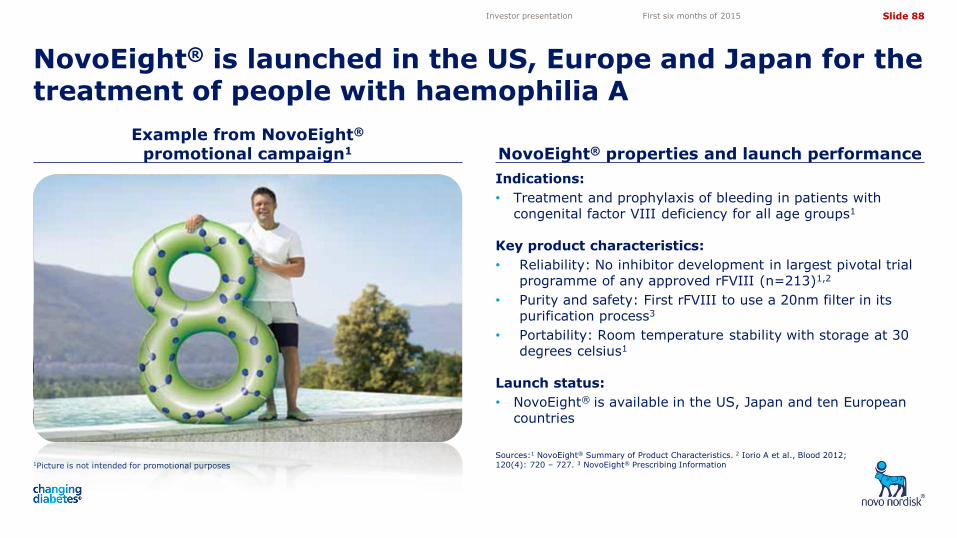
Slide 88
5,05
4,10
3,50
4,72
11,82 11,82
Indications:
• Treatment and prophylaxis of bleeding in patients with congenital factor VIII deficiency for all age groups1
Key product characteristics:
• Reliability: No inhibitor development in largest pivotal trial programme of any approved rFVIII (n=213)1,2
• Purity and safety: First rFVIII to use a 20nm filter in its purification process3
• Portability: Room temperature stability with storage at 30 degrees celsius1
Launch status:
• NovoEight® is available in the US, Japan and ten European countries
1Picture is not intended for promotional purposes
Example from NovoEight® promotional campaign1 NovoEight® properties and launch performance
NovoEight® is launched in the US, Europe and Japan for the treatment of people with haemophilia A
Sources:1 NovoEight® Summary of Product Characteristics. 2 Iorio A et al., Blood 2012; 120(4): 720 – 727. 3 NovoEight® Prescribing Information
Investor presentation First six months of 2015
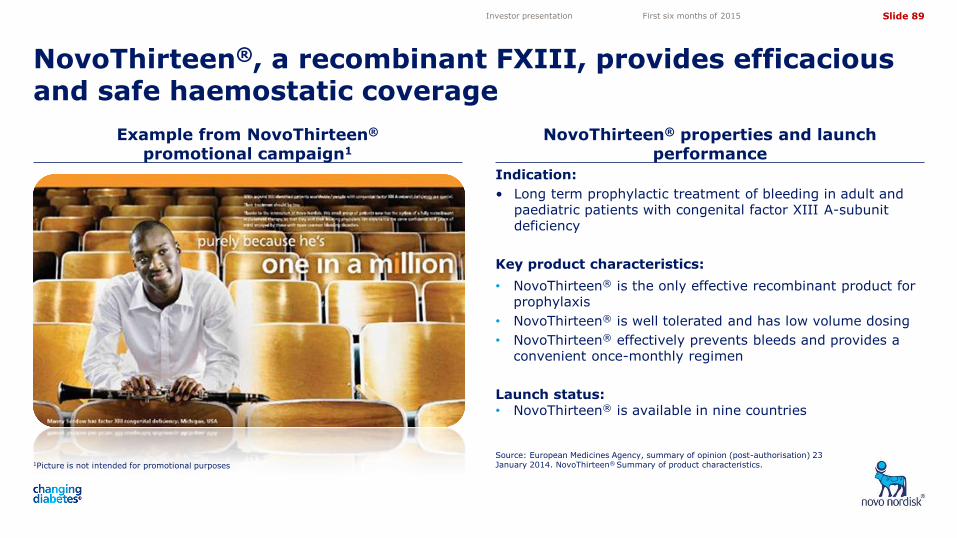
Slide 89
5,05
4,10
3,50
4,72
11,82 11,82
1Picture is not intended for promotional purposes
Example from NovoThirteen® promotional campaign1
NovoThirteen® properties and launch performance
NovoThirteen®, a recombinant FXIII, provides efficacious and safe haemostatic coverage
Source: European Medicines Agency, summary of opinion (post-authorisation) 23 January 2014. NovoThirteen® Summary of product characteristics.
Investor presentation First six months of 2015
Indication:
• Long term prophylactic treatment of bleeding in adult and paediatric patients with congenital factor XIII A-subunit deficiency
Key product characteristics:
• NovoThirteen® is the only effective recombinant product for prophylaxis
• NovoThirteen® is well tolerated and has low volume dosing
• NovoThirteen® effectively prevents bleeds and provides a convenient once-monthly regimen
Launch status: • NovoThirteen® is available in nine countries
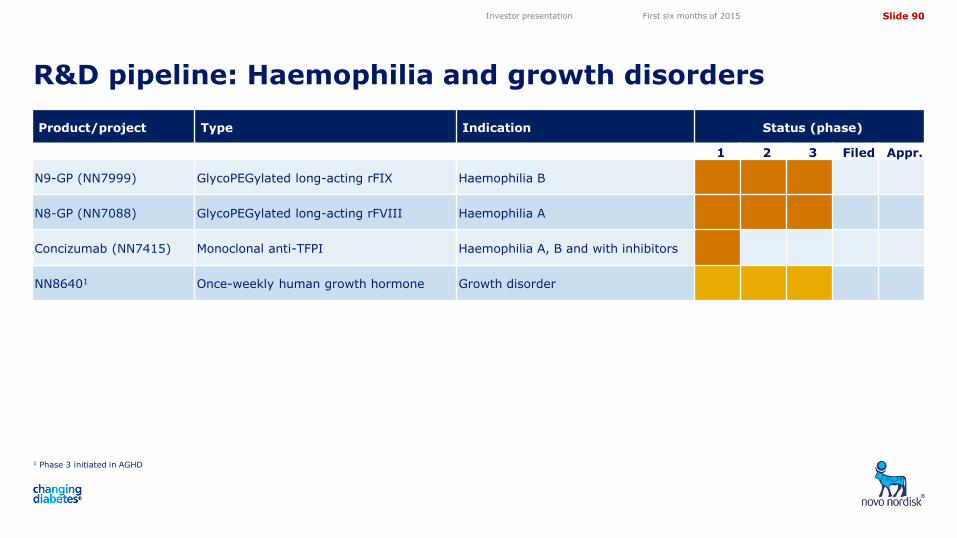
Slide 90
5,05
4,10
3,50
4,72
11,82 11,82
R&D pipeline: Haemophilia and growth disorders
1 Phase 3 initiated in AGHD
Investor presentation First six months of 2015
Product/project Type Indication Status (phase)
1 2 3 Filed Appr.
N9-GP (NN7999) GlycoPEGylated long-acting rFIX Haemophilia B
N8-GP (NN7088) GlycoPEGylated long-acting rFVIII Haemophilia A
Concizumab (NN7415) Monoclonal anti-TFPI Haemophilia A, B and with inhibitors
NN86401 Once-weekly human growth hormone Growth disorder
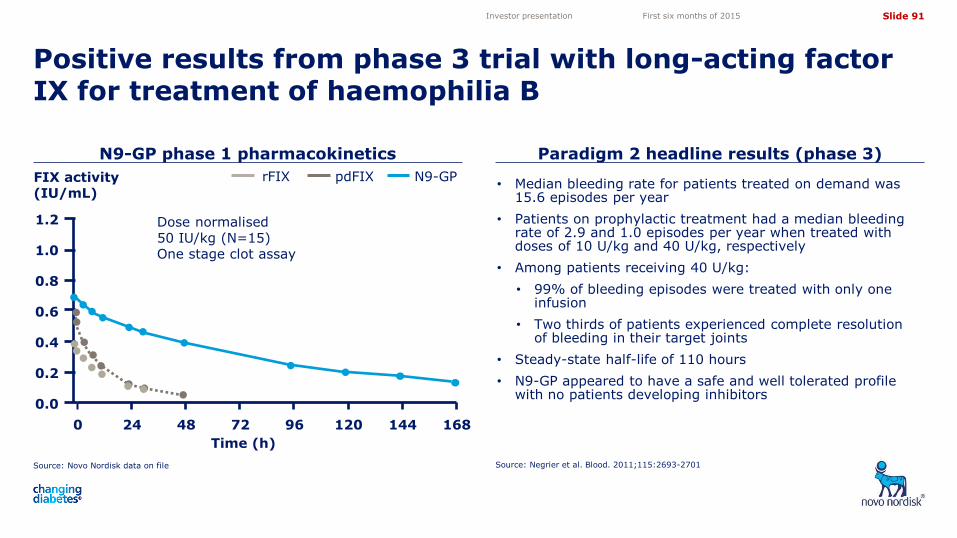
Slide 91
5,05
4,10
3,50
4,72
11,82 11,82
Source: Novo Nordisk data on file
N9-GP phase 1 pharmacokinetics Paradigm 2 headline results (phase 3)
Positive results from phase 3 trial with long-acting factor IX for treatment of haemophilia B
Source: Negrier et al. Blood. 2011;115:2693-2701
Investor presentation First six months of 2015
• Median bleeding rate for patients treated on demand was 15.6 episodes per year
• Patients on prophylactic treatment had a median bleeding rate of 2.9 and 1.0 episodes per year when treated with doses of 10 U/kg and 40 U/kg, respectively
• Among patients receiving 40 U/kg:
• 99% of bleeding episodes were treated with only one infusion
• Two thirds of patients experienced complete resolution of bleeding in their target joints
• Steady-state half-life of 110 hours
• N9-GP appeared to have a safe and well tolerated profile with no patients developing inhibitors
Dose normalised 50 IU/kg (N=15) One stage clot assay
1.2
1.0
0.8
0.6
0.4
0.2
0.0
FIX activity (IU/mL)
N9-GP pdFIX rFIX
168 0 24 48 72 96 120 144
Time (h)
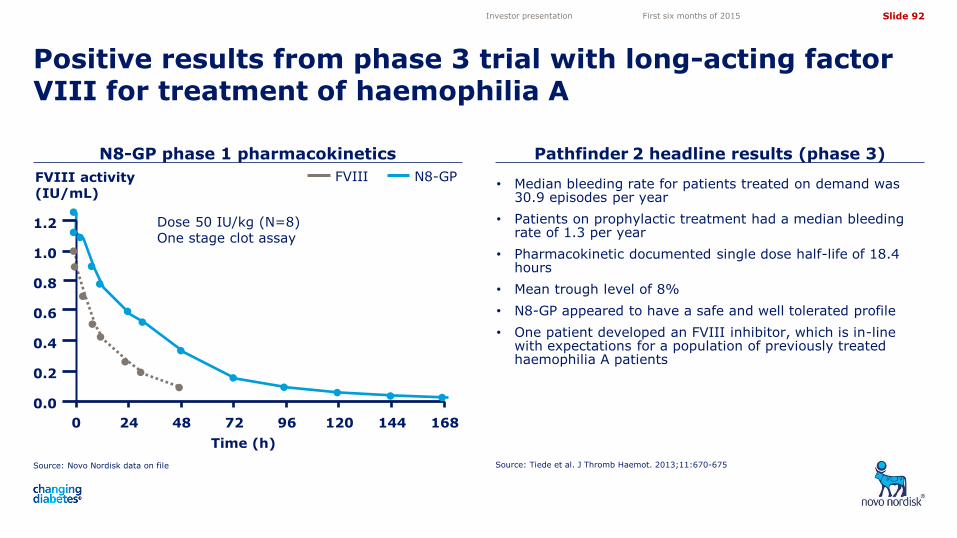
Slide 92
5,05
4,10
3,50
4,72
11,82 11,82
N8-GP
Source: Novo Nordisk data on file
N8-GP phase 1 pharmacokinetics Pathfinder 2 headline results (phase 3)
Positive results from phase 3 trial with long-acting factor VIII for treatment of haemophilia A
Source: Tiede et al. J Thromb Haemot. 2013;11:670-675
Investor presentation First six months of 2015
FVIII activity (IU/mL)
168
1.2
1.0
0.8
0.6
0.4
0.2
0.0
0 24 48 72 96 120 144
FVIII
Dose 50 IU/kg (N=8) One stage clot assay
Time (h)
• Median bleeding rate for patients treated on demand was 30.9 episodes per year
• Patients on prophylactic treatment had a median bleeding rate of 1.3 per year
• Pharmacokinetic documented single dose half-life of 18.4 hours
• Mean trough level of 8%
• N8-GP appeared to have a safe and well tolerated profile
• One patient developed an FVIII inhibitor, which is in-line with expectations for a population of previously treated haemophilia A patients
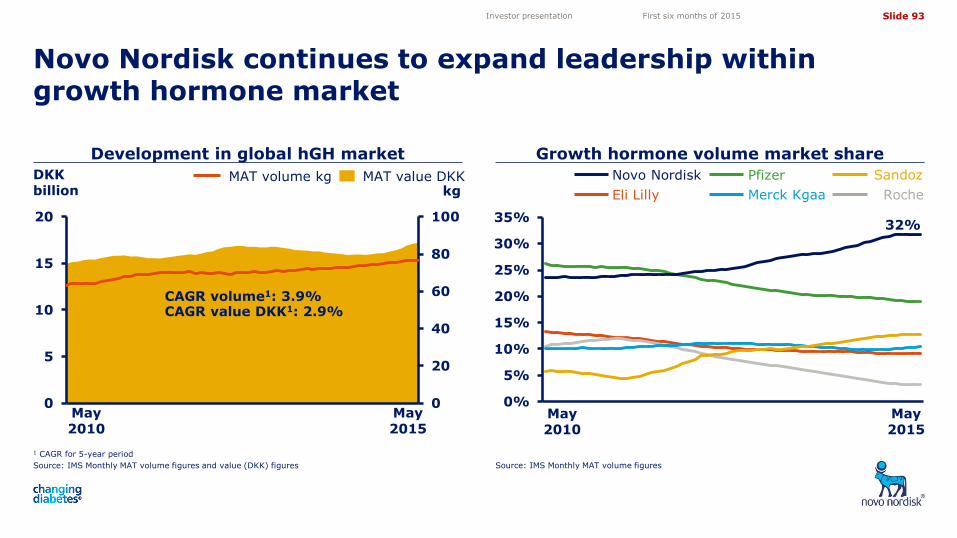
Slide 93
5,05
4,10
3,50
4,72
11,82 11,82
Development in global hGH market Growth hormone volume market share
Novo Nordisk continues to expand leadership within growth hormone market
1 CAGR for 5-year period
Source: IMS Monthly MAT volume figures and value (DKK) figures Source: IMS Monthly MAT volume figures
May 2010
May 2015
32%
0%
5%
10%
15%
20%
25%
30%
35%
Sandoz
Roche Eli Lilly
Novo Nordisk Pfizer
Merck Kgaa
0
20
40
60
80
100
0
5
10
15
20
Thousands
May 2010
May 2015
CAGR volume1: 3.9% CAGR value DKK1: 2.9%
MAT value DKK MAT volume kg kg
DKK billion
Investor presentation First six months of 2015
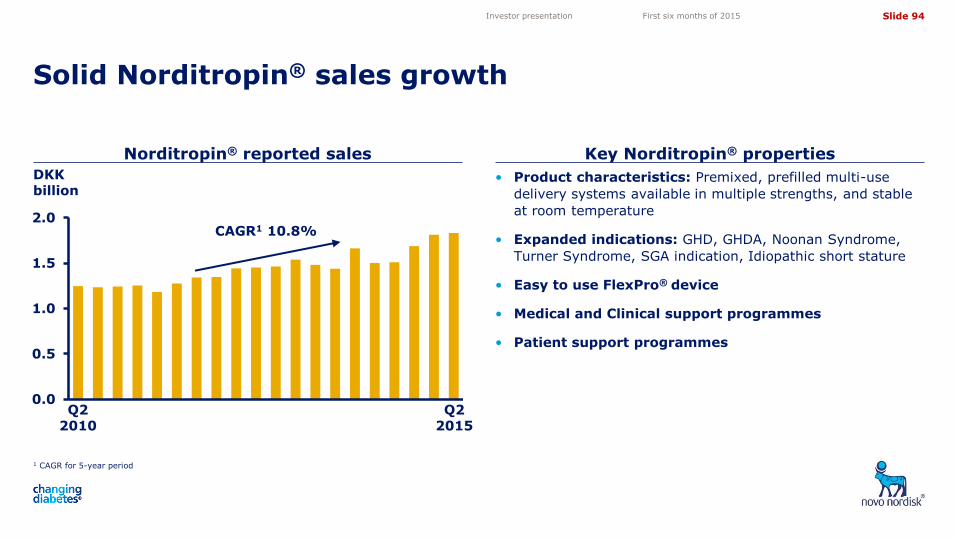
Slide 94
5,05
4,10
3,50
4,72
11,82 11,82
0.0
0.5
1.0
1.5
2.0
Norditropin® reported sales Key Norditropin® properties
Solid Norditropin® sales growth
1 CAGR for 5-year period
Investor presentation First six months of 2015
CAGR1 10.8%
• Product characteristics: Premixed, prefilled multi-use
delivery systems available in multiple strengths, and stable
at room temperature
• Expanded indications: GHD, GHDA, Noonan Syndrome,
Turner Syndrome, SGA indication, Idiopathic short stature
• Easy to use FlexPro® device
• Medical and Clinical support programmes
• Patient support programmes
DKK billion
Q2 2010
Q2 2015
Slide 95
5,05
4,10
3,50
4,72
11,82 11,82
Financials
Investor presentation First six months of 2015
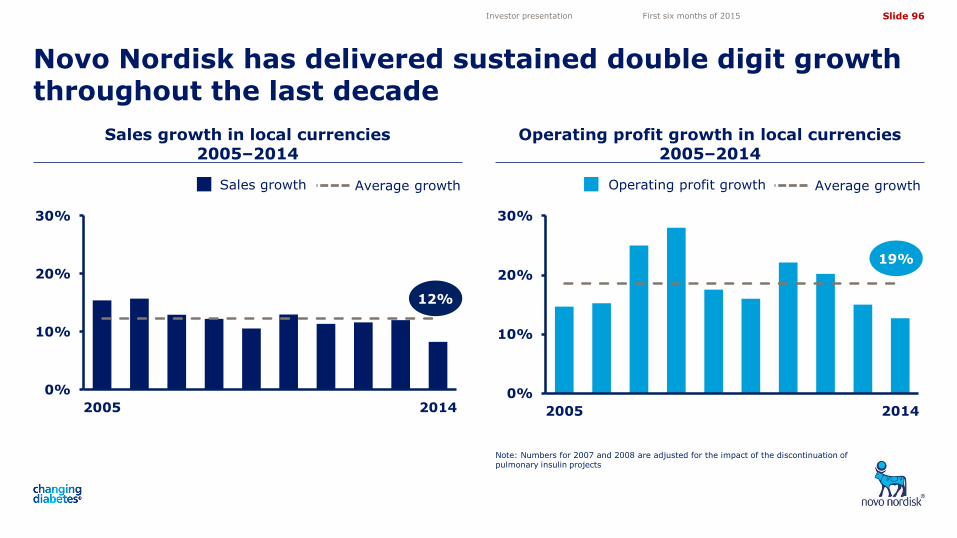
Slide 96
5,05
4,10
3,50
4,72
11,82 11,82
0%
10%
20%
30%
2005 20140%
10%
20%
30%
2005 2014
Sales growth in local currencies 2005–2014
Operating profit growth in local currencies 2005–2014
Novo Nordisk has delivered sustained double digit growth throughout the last decade
Note: Numbers for 2007 and 2008 are adjusted for the impact of the discontinuation of pulmonary insulin projects
Investor presentation First six months of 2015
12%
Sales growth Average growth Operating profit growth Average growth
19%
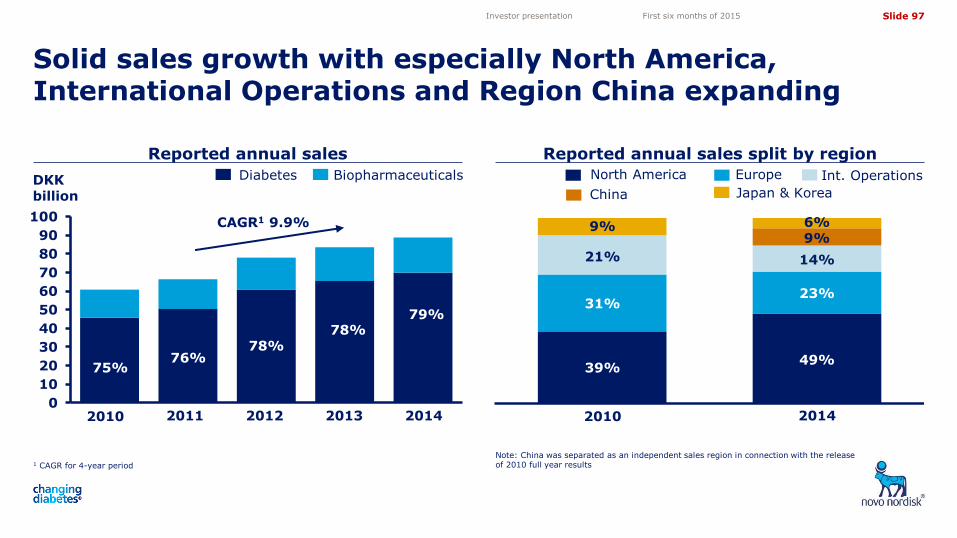
Slide 97
5,05
4,10
3,50
4,72
11,82 11,82
Reported annual sales Reported annual sales split by region
Solid sales growth with especially North America, International Operations and Region China expanding
1 CAGR for 4-year period
Note: China was separated as an independent sales region in connection with the release of 2010 full year results
Investor presentation First six months of 2015
Europe North America Int. Operations
Japan & Korea China
Biopharmaceuticals Diabetes
0
10
20
30
40
50
60
70
80
90
100
1 2 3 4 5
Th
ou
san
ds
2010 2011 2012 2013 2014
CAGR1 9.9%
75% 76%
78% 78%
79%
2010 2014
39%
31%
49%
23%
14%
6%
21%
9% 9%
DKK billion
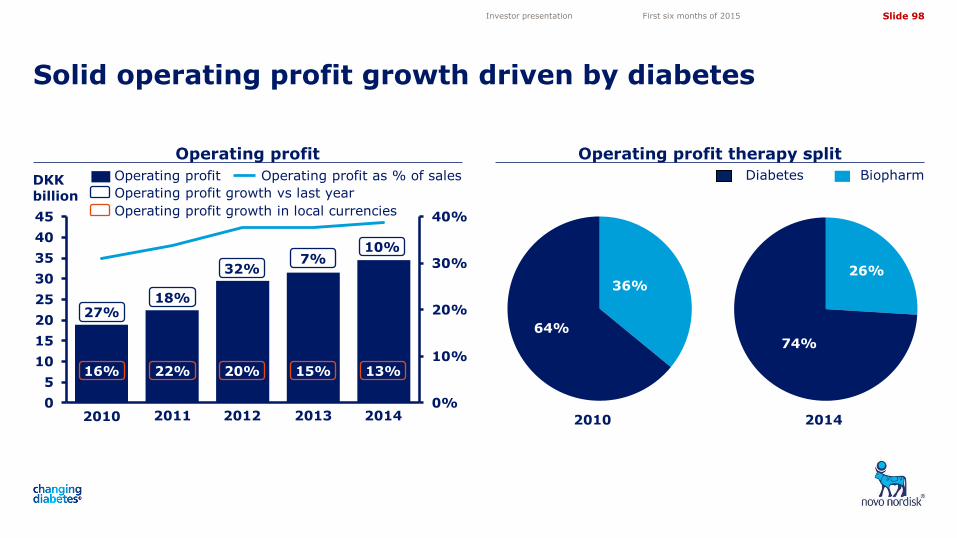
Slide 98
5,05
4,10
3,50
4,72
11,82 11,82
0%
10%
20%
30%
40%
0
5
10
15
20
25
30
35
40
45
1 2 3 4 5
Operating profit Operating profit therapy split
Solid operating profit growth driven by diabetes
Investor presentation First six months of 2015
Diabetes Biopharm
2010 2014
26%
74% 64%
36%
27% 18%
32%
10% 7%
Operating profit growth vs last year
Operating profit as % of sales Operating profit
2010 2011 2012 2013 2014
Operating profit growth in local currencies
16% 22% 20% 15% 13%
DKK billion
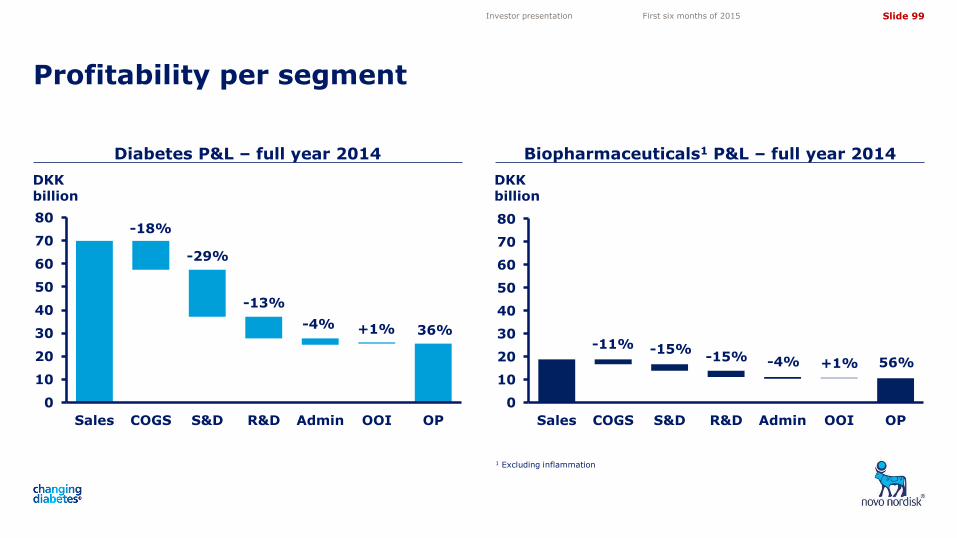
Slide 99
5,05
4,10
3,50
4,72
11,82 11,82
Diabetes P&L – full year 2014 Biopharmaceuticals1 P&L – full year 2014
Profitability per segment
1 Excluding inflammation
Investor presentation First six months of 2015
0
10
20
30
40
50
60
70
80
Sales COGS S&D R&D Admin OOI OP
-18%
-29%
-13%
-4% 36% +1%
0
10
20
30
40
50
60
70
80
Sales COGS S&D R&D Admin OOI OP
-11% -15% -15% -4% 56% +1%
DKK billion
DKK billion
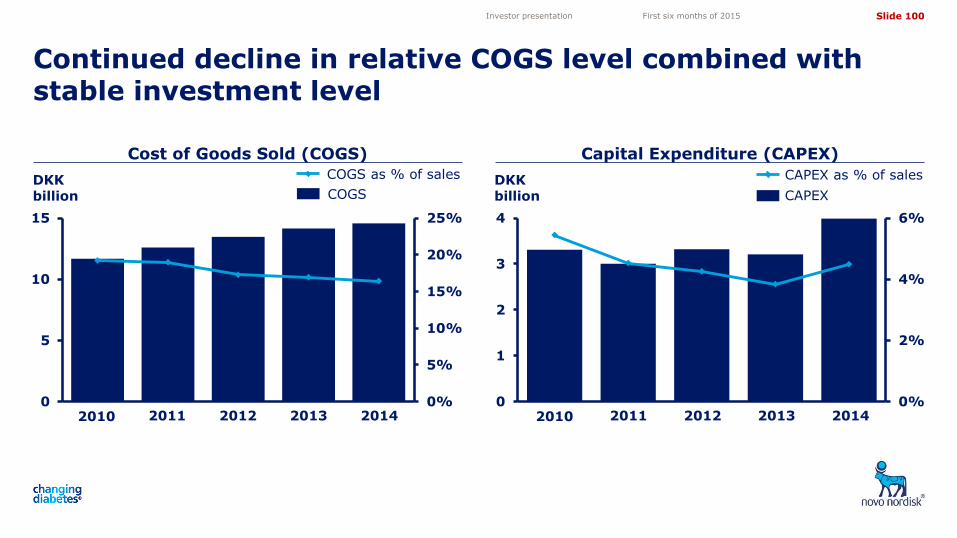
Slide 100
5,05
4,10
3,50
4,72
11,82 11,82
0%
5%
10%
15%
20%
25%
0
5
10
15
Th
ou
san
ds
Cost of Goods Sold (COGS) Capital Expenditure (CAPEX)
Continued decline in relative COGS level combined with stable investment level
Investor presentation First six months of 2015
2010 2011 2012 2013 2014 0%
2%
4%
6%
0
1
2
3
4
1 2 3 4 52010 2011 2012 2013 2014
COGS as % of sales CAPEX as % of sales
COGS CAPEX DKK billion
DKK billion
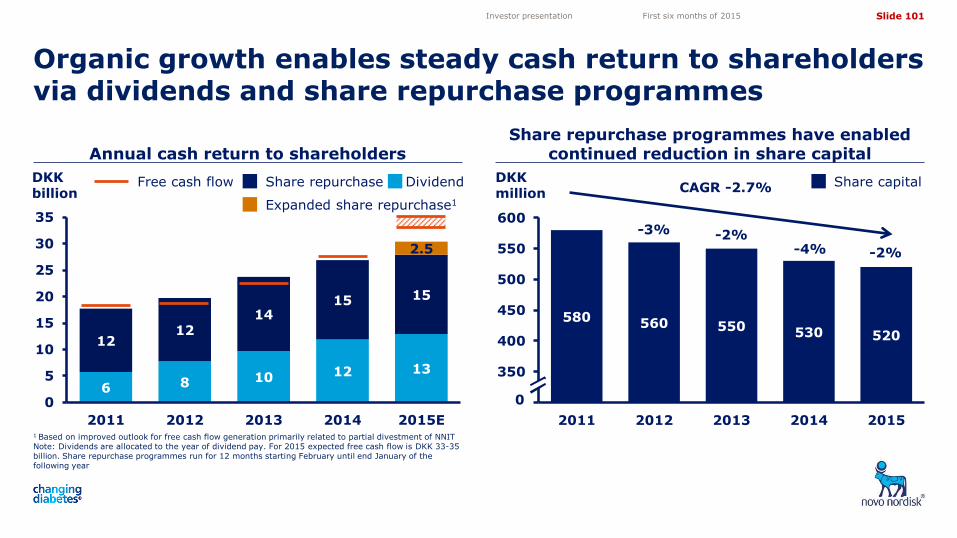
Slide 101
5,05
4,10
3,50
4,72
11,82 11,82
6 8 10 12 13
12 12
14 15 15
2.5
0
5
10
15
20
25
30
35
2011 2012 2013 2014 2015E
Annual cash return to shareholders Share repurchase programmes have enabled
continued reduction in share capital
Organic growth enables steady cash return to shareholders via dividends and share repurchase programmes
1 Based on improved outlook for free cash flow generation primarily related to partial divestment of NNIT
Note: Dividends are allocated to the year of dividend pay. For 2015 expected free cash flow is DKK 33-35 billion. Share repurchase programmes run for 12 months starting February until end January of the following year
580 560 550 530 520
300
350
400
450
500
550
600
2011 2012 2013 2014 2015
DKK billion
DKK million
0
Share capital CAGR -2.7%
-3% -2%
-4% -2%
Investor presentation First six months of 2015
Share repurchase Dividend Free cash flow
Expanded share repurchase1
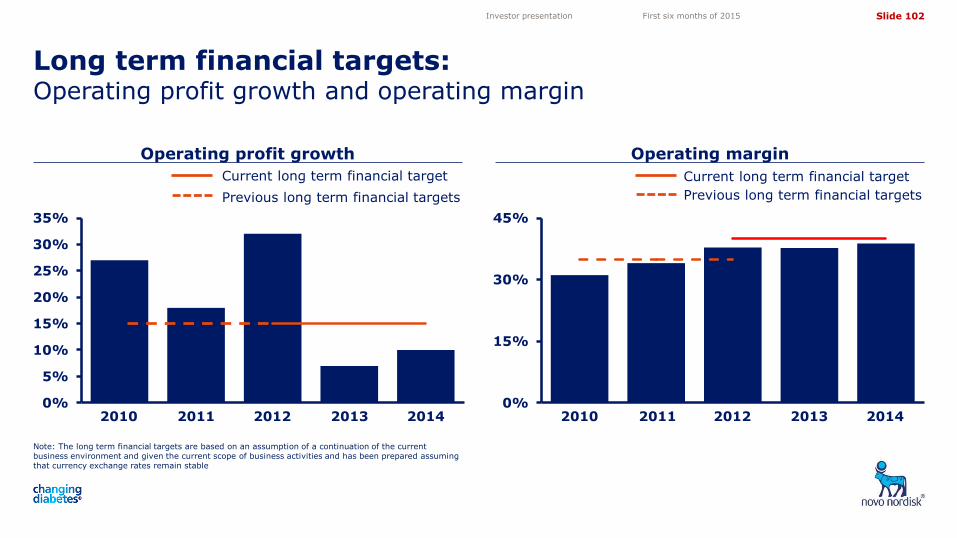
Slide 102
5,05
4,10
3,50
4,72
11,82 11,82
Operating profit growth Operating margin
Long term financial targets: Operating profit growth and operating margin
Note: The long term financial targets are based on an assumption of a continuation of the current business environment and given the current scope of business activities and has been prepared assuming that currency exchange rates remain stable
Investor presentation First six months of 2015
Current long term financial target
Previous long term financial targets
Current long term financial target
Previous long term financial targets
0%
5%
10%
15%
20%
25%
30%
35%
2010 2011 2012 2013 2014 0%
15%
30%
45%
2010 2011 2012 2013 2014
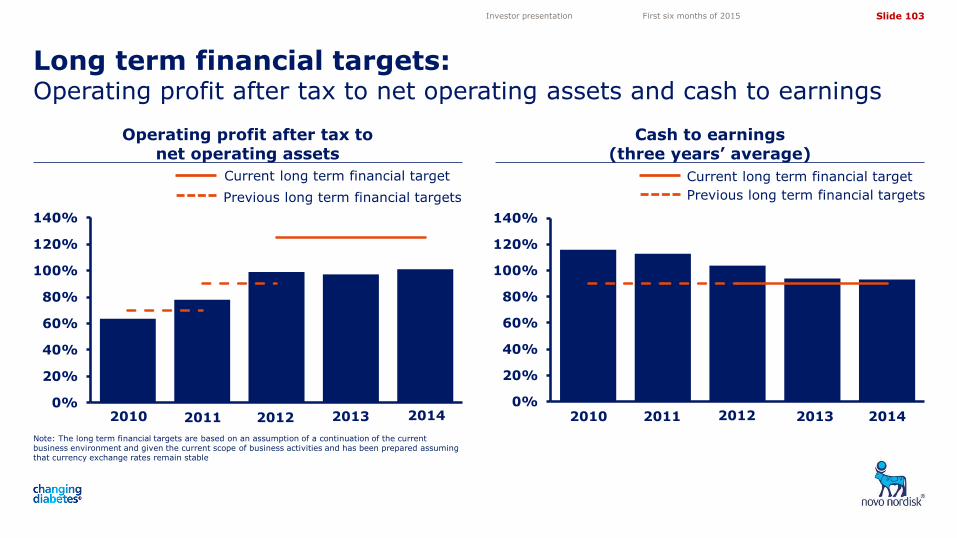
Slide 103
5,05
4,10
3,50
4,72
11,82 11,82
Operating profit after tax to net operating assets
Cash to earnings (three years’ average)
Long term financial targets: Operating profit after tax to net operating assets and cash to earnings
Note: The long term financial targets are based on an assumption of a continuation of the current business environment and given the current scope of business activities and has been prepared assuming that currency exchange rates remain stable
Investor presentation First six months of 2015
0%
20%
40%
60%
80%
100%
120%
140%
0%
20%
40%
60%
80%
100%
120%
140%
Current long term financial target
Previous long term financial targets
Current long term financial target
Previous long term financial targets
2010 2011 2012 2013 2014 2010 2011 2012 2013 2014
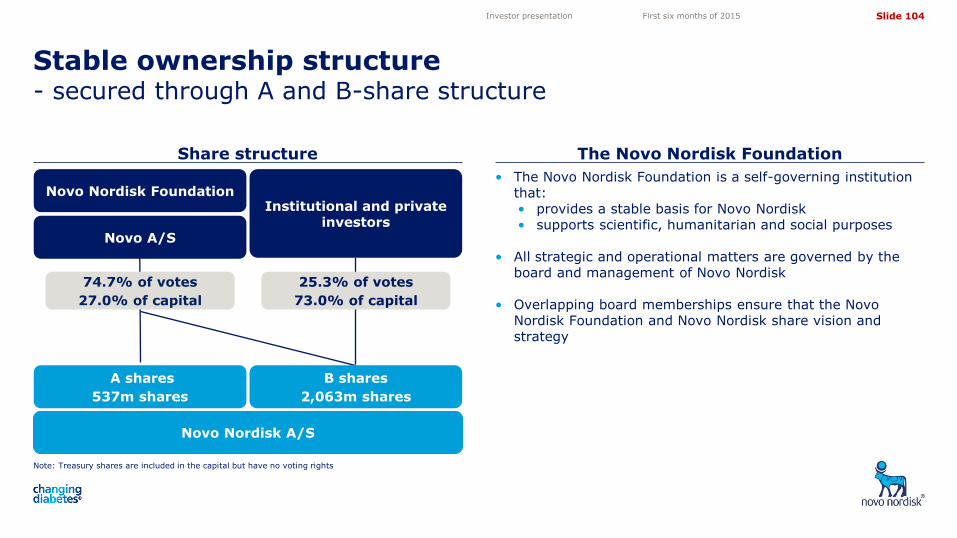
Slide 104
5,05
4,10
3,50
4,72
11,82 11,82
Note: Treasury shares are included in the capital but have no voting rights
Share structure The Novo Nordisk Foundation
Stable ownership structure - secured through A and B-share structure
Investor presentation First six months of 2015
• The Novo Nordisk Foundation is a self-governing institution that: • provides a stable basis for Novo Nordisk • supports scientific, humanitarian and social purposes
• All strategic and operational matters are governed by the board and management of Novo Nordisk
• Overlapping board memberships ensure that the Novo Nordisk Foundation and Novo Nordisk share vision and strategy
Novo Nordisk A/S
Novo Nordisk Foundation Institutional and private
investors Novo A/S
A shares
537m shares
B shares
2,063m shares
74.7% of votes
27.0% of capital
25.3% of votes
73.0% of capital