Embed Size (px)
Citation preview

Investor Presentation
Results FY 2018, April 2019
© Wirecard 2019 1
Highlights
© Wirecard 2019 2
279 kMerchants
€ 125 bnTransaction volume 2018
2
Wirecard is one of the
fastest growing financial
commerce platforms that
offers merchants and
consumers a continuously
expanding payment access
system over an integrated
B2B2C approach.
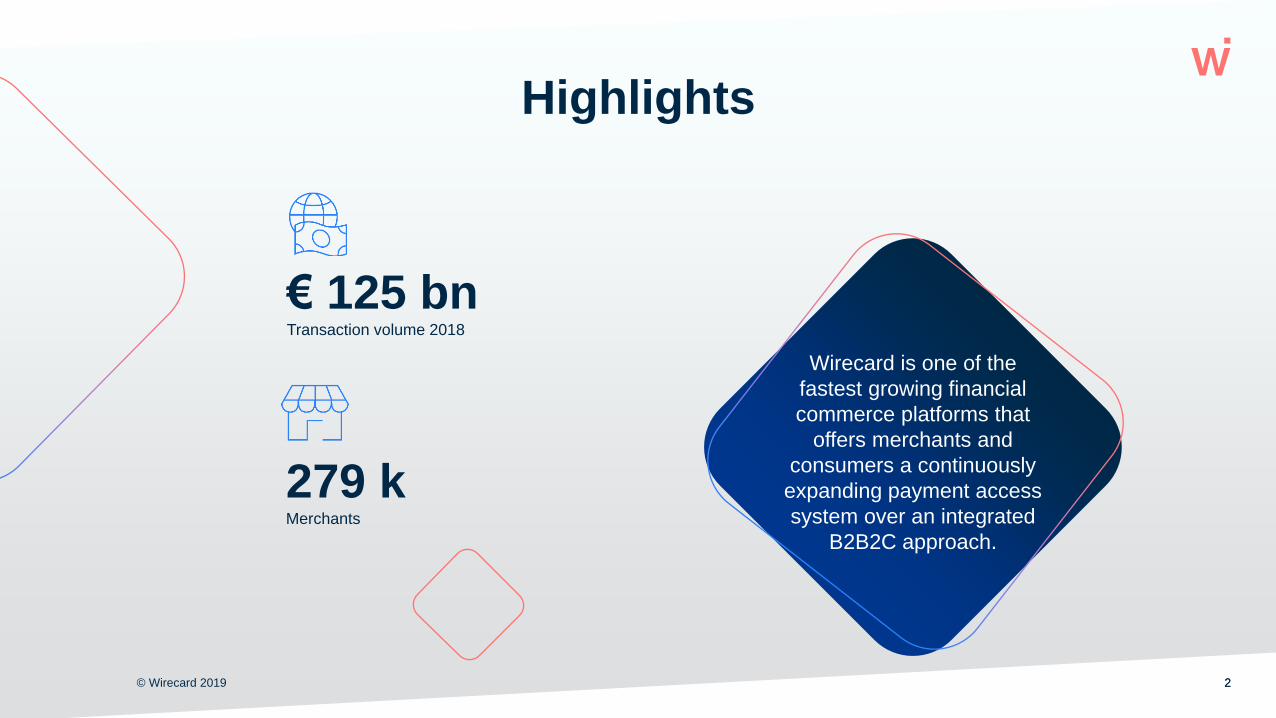
Cashless World
the shift from cash to
plastic and virtual
money – driven by
regulators, supply and
demand
Internet
Technology & IOT
taking over new areas
such as production
and retail
Financial Inclusion
Increasing demand
and supply for
unbanked and
underbanked people
Borderless
Payments
driven by global trade,
travel and politics
Frictionless
Customer
Experience
driven by convergence
of payment channels
and customer
expectations
Artificial
Intelligence
the first ever possibility
to derive actionable
insights from big data
Global Megatrends Driving Wirecard’s Strategy
© Wirecard 2019 3
6 Global payment megatrends… …driving our strategy
Driving convergence between
online, mobile and POS front-
ends using innovative internet
technology
Globalization of own
footprint, customers and
services
Constantly extend
value chain with
innovative value
adding solutions
3
1
2
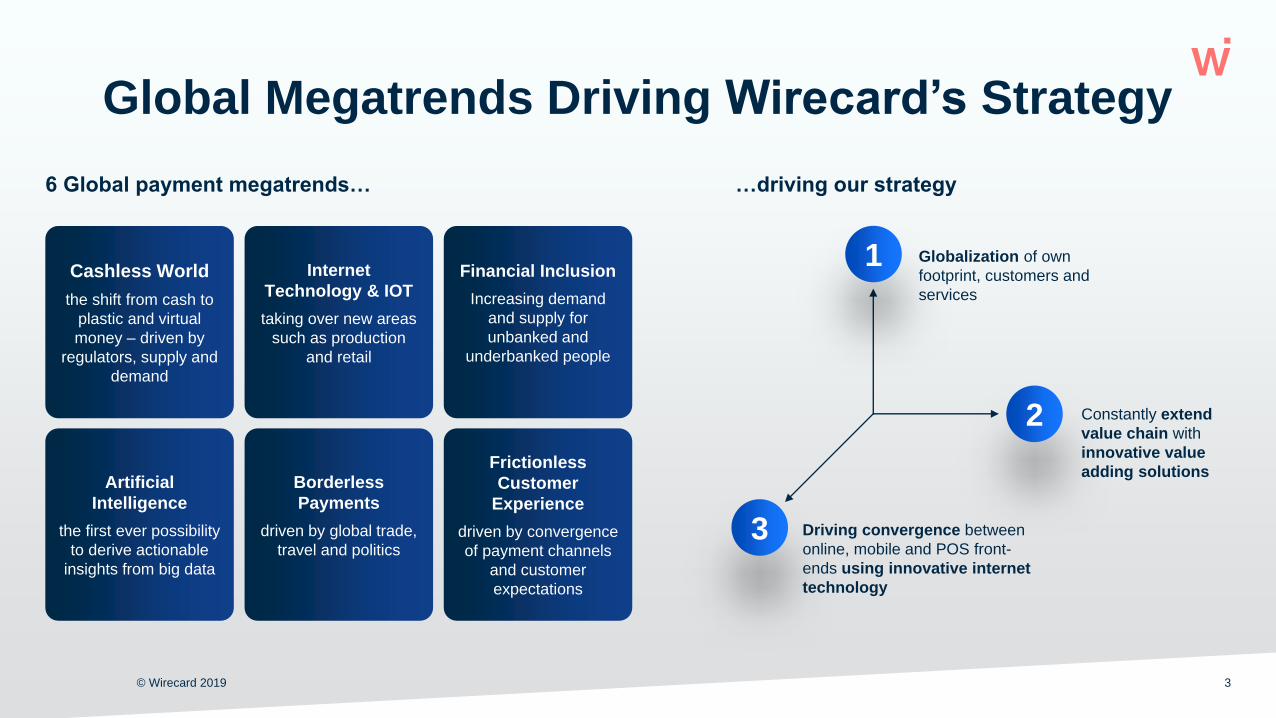
Big data
© Wirecard 2019 4
Artificial intelligence
White label/
Co-branding
White label/
Co-branding
Value-added
services in
digital banking
Value-added
services
to increase
topline
Transaction/
Mobile banking
Call center
Analytics /
RFM analysis
Loyalty/Couponing/
Dynamic pricing
Risk
management
Mobile wallet
Peer-to-peer/B2B
Credit
Financial Platform
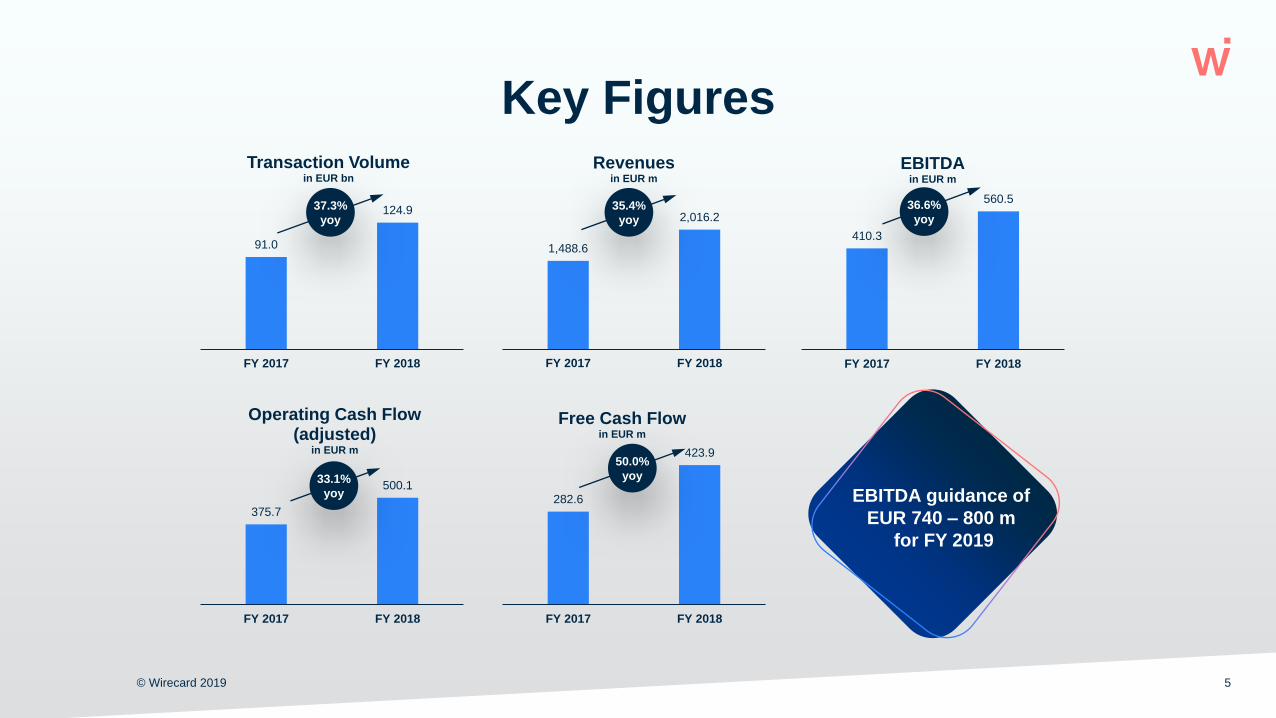
560.5
410.3
FY 2018FY 2017
EBITDAin EUR m
124.9
91.0
FY 2018FY 2017
Transaction Volumein EUR bn
Key Figures
© Wirecard 2019 5
2,016.2
1,488.6
FY 2018FY 2017
Revenuesin EUR m
500.1
375.7
FY 2018FY 2017
Operating Cash Flow(adjusted)
in EUR m 423.9
282.6
FY 2018FY 2017
Free Cash Flowin EUR m
36.6%
yoy
50.0%
yoy
EBITDA guidance of
EUR 740 – 800 m
for FY 2019
35.4%
yoy
37.3%
yoy
33.1%
yoy
Organic and M&A Related Growth
© Wirecard 2019 6
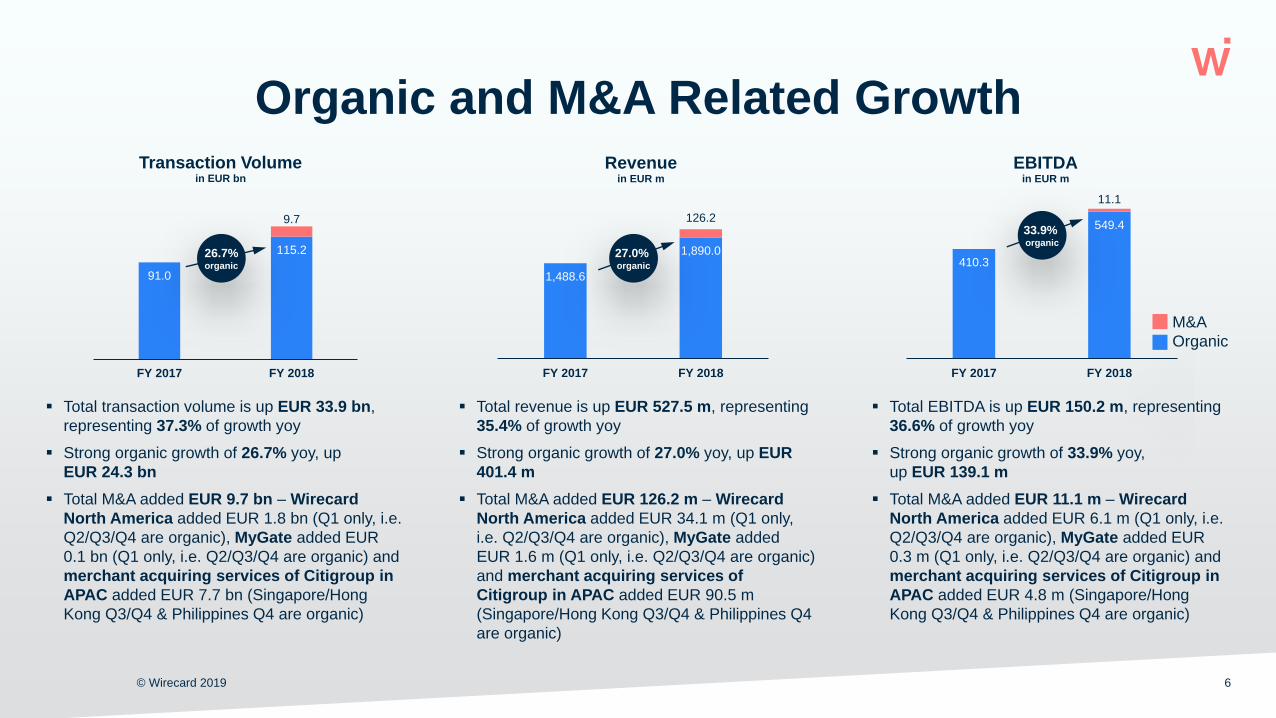
91.0
115.2
9.7
FY 2017 FY 2018
Transaction Volumein EUR bn
26.7%organic
Total transaction volume is up EUR 33.9 bn,
representing 37.3% of growth yoy
Strong organic growth of 26.7% yoy, up
EUR 24.3 bn
Total M&A added EUR 9.7 bn – Wirecard
North America added EUR 1.8 bn (Q1 only, i.e.
Q2/Q3/Q4 are organic), MyGate added EUR
0.1 bn (Q1 only, i.e. Q2/Q3/Q4 are organic) and
merchant acquiring services of Citigroup in
APAC added EUR 7.7 bn (Singapore/Hong
Kong Q3/Q4 & Philippines Q4 are organic)
410.3
549.4
11.1
FY 2017 FY 2018
EBITDAin EUR m
33.9% organic
M&A
Organic
Total revenue is up EUR 527.5 m, representing
35.4% of growth yoy
Strong organic growth of 27.0% yoy, up EUR
401.4 m
Total M&A added EUR 126.2 m – Wirecard
North America added EUR 34.1 m (Q1 only,
i.e. Q2/Q3/Q4 are organic), MyGate added
EUR 1.6 m (Q1 only, i.e. Q2/Q3/Q4 are organic)
and merchant acquiring services of
Citigroup in APAC added EUR 90.5 m
(Singapore/Hong Kong Q3/Q4 & Philippines Q4
are organic)
Total EBITDA is up EUR 150.2 m, representing
36.6% of growth yoy
Strong organic growth of 33.9% yoy,
up EUR 139.1 m
Total M&A added EUR 11.1 m – Wirecard
North America added EUR 6.1 m (Q1 only, i.e.
Q2/Q3/Q4 are organic), MyGate added EUR
0.3 m (Q1 only, i.e. Q2/Q3/Q4 are organic) and
merchant acquiring services of Citigroup in
APAC added EUR 4.8 m (Singapore/Hong
Kong Q3/Q4 & Philippines Q4 are organic)
1,488.6
1,890.0
126.2
FY 2017 FY 2018
Revenuein EUR m
27.0% organic
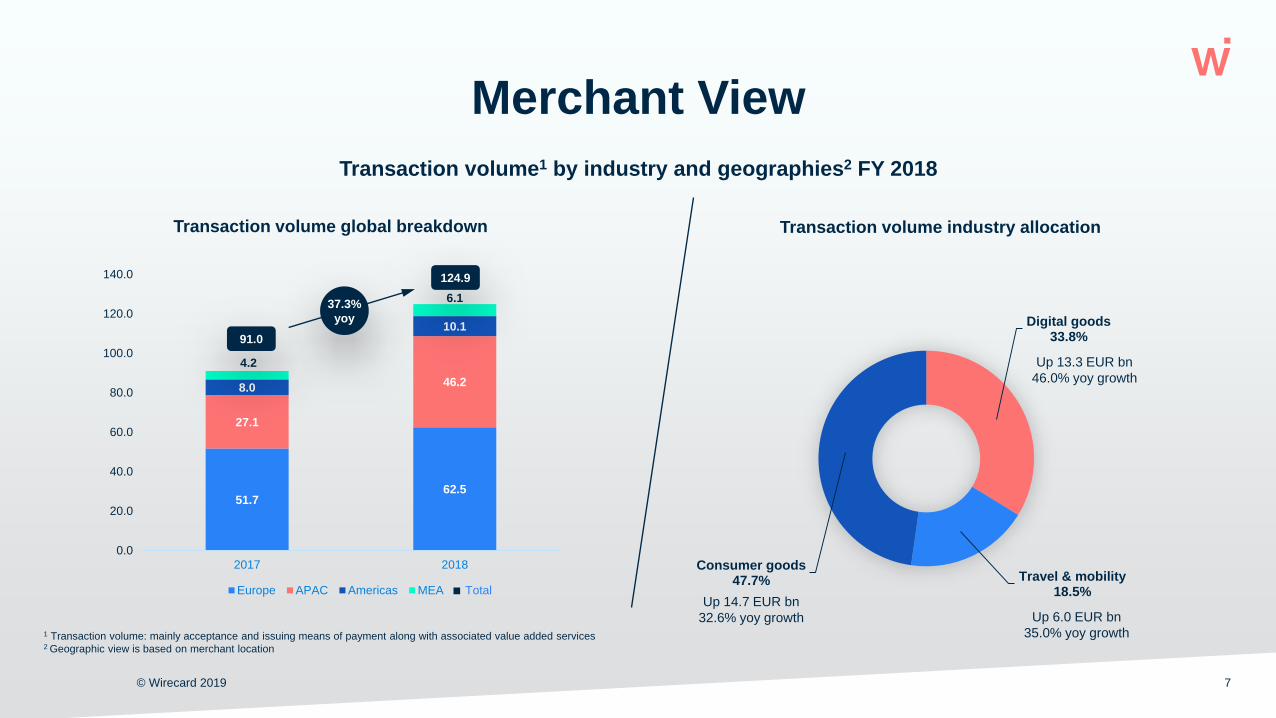
Merchant View
© Wirecard 2019 7
Transaction volume1 by industry and geographies2 FY 2018
1 Transaction volume: mainly acceptance and issuing means of payment along with associated value added services2 Geographic view is based on merchant location
Digital goods33.8%
Travel & mobility18.5%
Consumer goods47.7%
Transaction volume industry allocation
Up 13.3 EUR bn
46.0% yoy growth
Up 14.7 EUR bn
32.6% yoy growth Up 6.0 EUR bn
35.0% yoy growth
51.762.5
27.1
46.28.0
10.1
4.2
6.1
0.0
20.0
40.0
60.0
80.0
100.0
120.0
140.0
2017 2018
Transaction volume global breakdown
Europe APAC Americas MEA
37.3%
yoy
91.0
124.9
Total
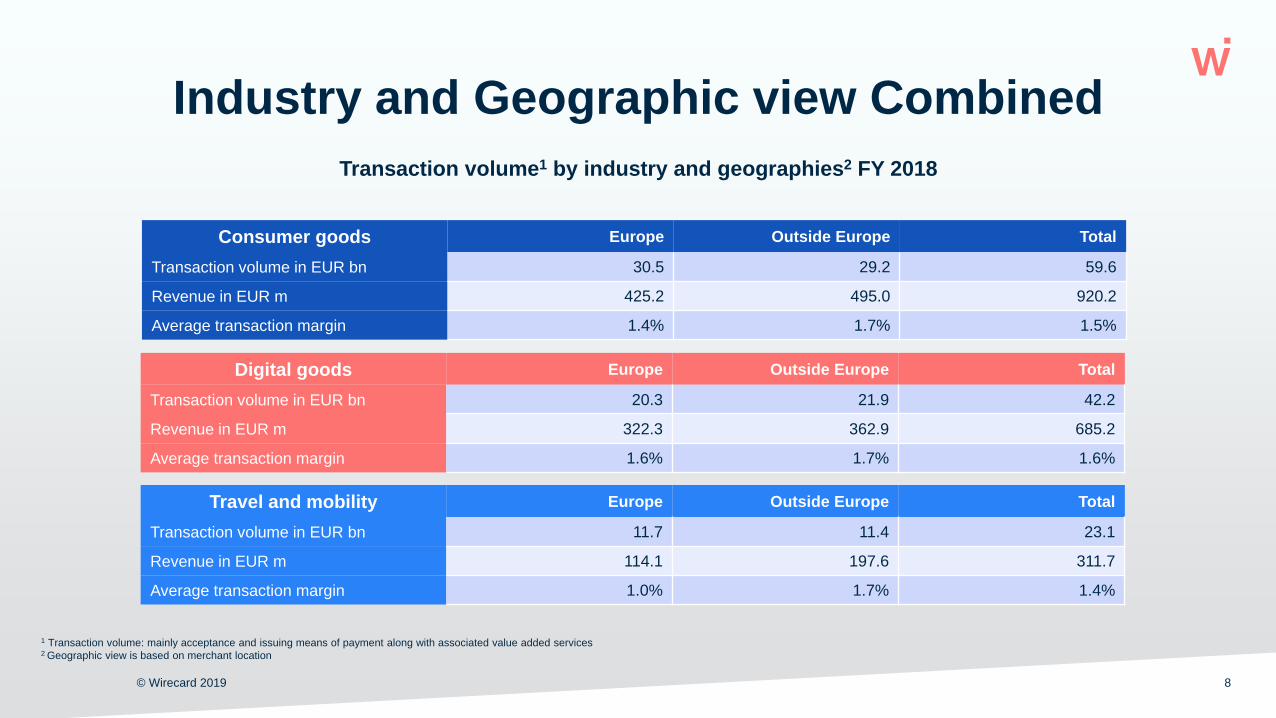
Industry and Geographic view Combined
© Wirecard 2019 8
Transaction volume1 by industry and geographies2 FY 2018
1 Transaction volume: mainly acceptance and issuing means of payment along with associated value added services2 Geographic view is based on merchant location
Consumer goods Europe Outside Europe Total
Transaction volume in EUR bn 30.5 29.2 59.6
Revenue in EUR m 425.2 495.0 920.2
Average transaction margin 1.4% 1.7% 1.5%
Digital goods Europe Outside Europe Total
Transaction volume in EUR bn 20.3 21.9 42.2
Revenue in EUR m 322.3 362.9 685.2
Average transaction margin 1.6% 1.7% 1.6%
Travel and mobility Europe Outside Europe Total
Transaction volume in EUR bn 11.7 11.4 23.1
Revenue in EUR m 114.1 197.6 311.7
Average transaction margin 1.0% 1.7% 1.4%
© Wirecard 2019 9
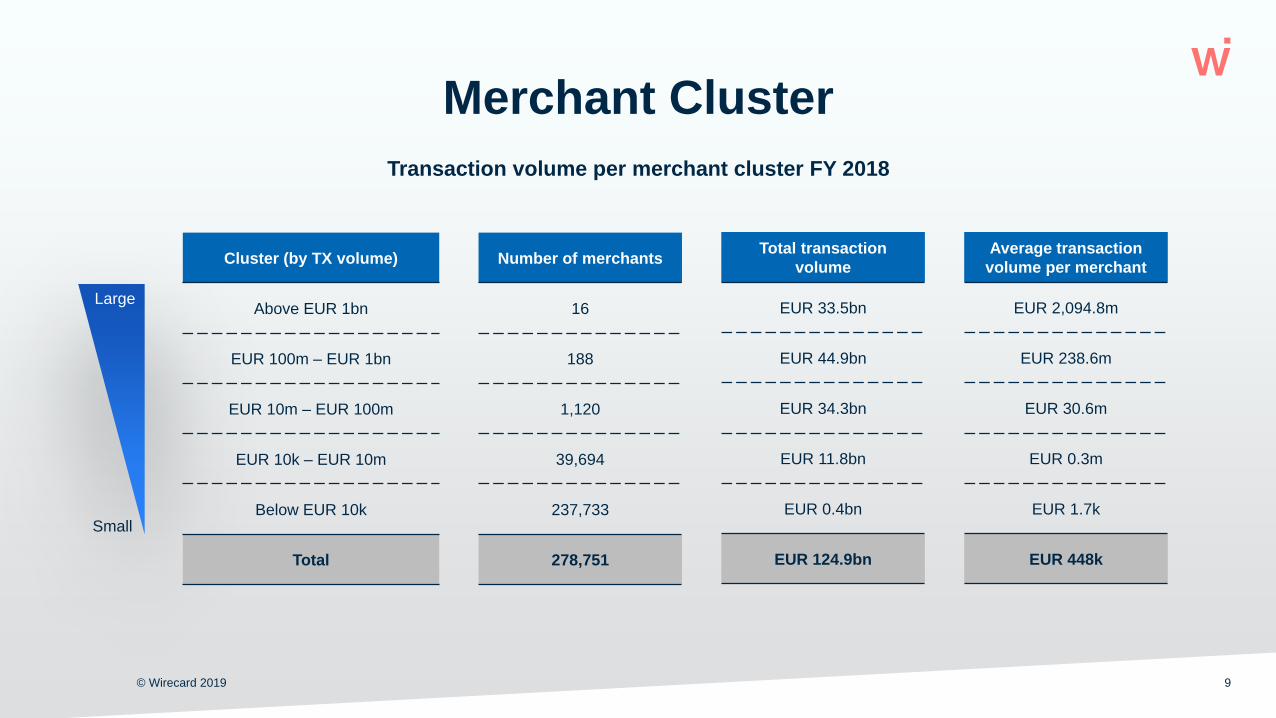
Merchant Cluster
Large
Small
Cluster (by TX volume)
Above EUR 1bn
EUR 100m – EUR 1bn
EUR 10m – EUR 100m
EUR 10k – EUR 10m
Below EUR 10k
Total
Number of merchants
16
188
1,120
39,694
237,733
278,751
Total transaction
volume
EUR 33.5bn
EUR 44.9bn
EUR 34.3bn
EUR 11.8bn
EUR 0.4bn
EUR 124.9bn
Average transaction
volume per merchant
EUR 2,094.8m
EUR 238.6m
EUR 30.6m
EUR 0.3m
EUR 1.7k
EUR 448k
Transaction volume per merchant cluster FY 2018
© Wirecard 2019 10
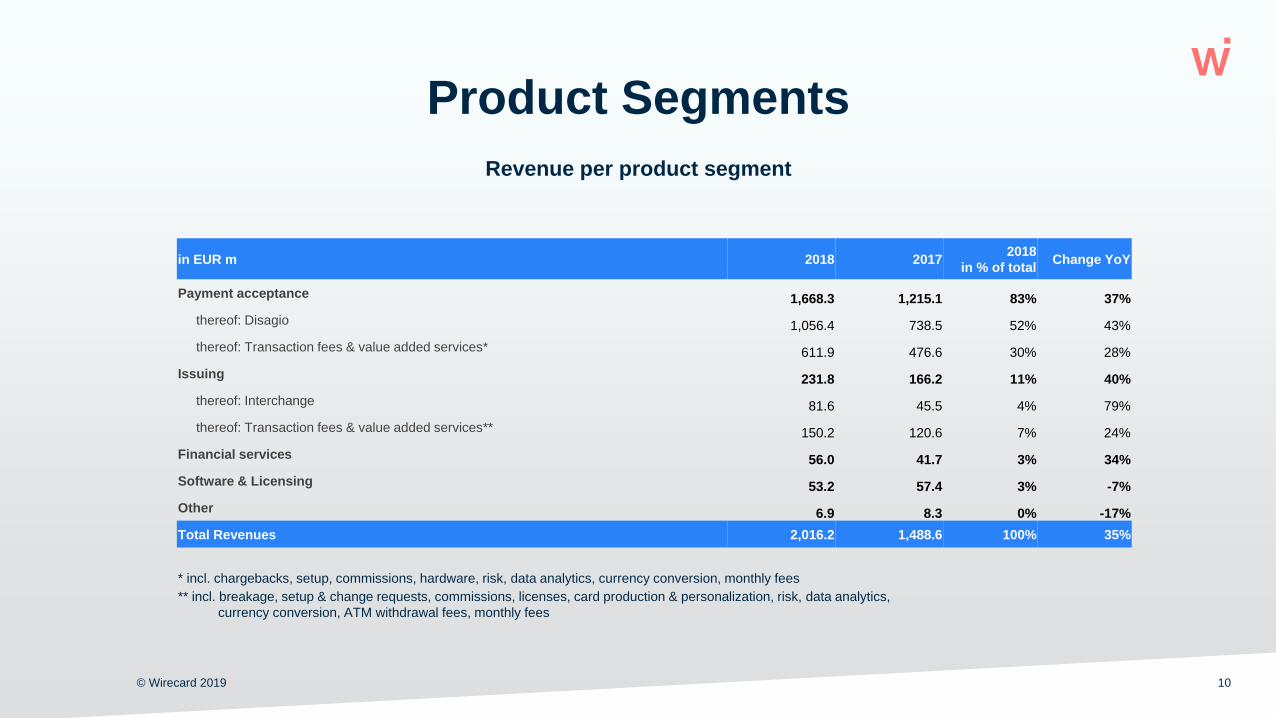
Product Segments
Revenue per product segment
in EUR m 2018 20172018
in % of totalChange YoY
Payment acceptance 1,668.3 1,215.1 83% 37%
thereof: Disagio 1,056.4 738.5 52% 43%
thereof: Transaction fees & value added services* 611.9 476.6 30% 28%
Issuing 231.8 166.2 11% 40%
thereof: Interchange 81.6 45.5 4% 79%
thereof: Transaction fees & value added services** 150.2 120.6 7% 24%
Financial services 56.0 41.7 3% 34%
Software & Licensing 53.2 57.4 3% -7%
Other 6.9 8.3 0% -17%
Total Revenues 2,016.2 1,488.6 100% 35%
* incl. chargebacks, setup, commissions, hardware, risk, data analytics, currency conversion, monthly fees
** incl. breakage, setup & change requests, commissions, licenses, card production & personalization, risk, data analytics,
currency conversion, ATM withdrawal fees, monthly fees
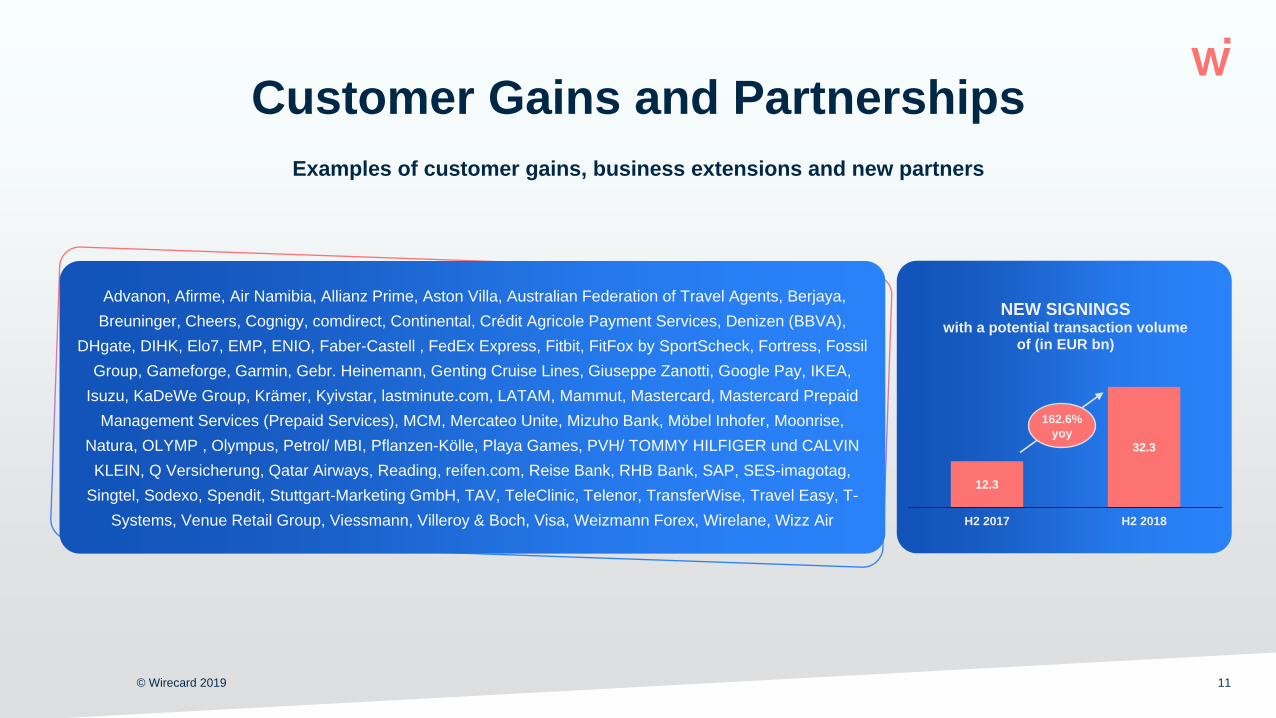
Examples of customer gains, business extensions and new partners
Customer Gains and Partnerships
© Wirecard 2019 11
Advanon, Afirme, Air Namibia, Allianz Prime, Aston Villa, Australian Federation of Travel Agents, Berjaya,
Breuninger, Cheers, Cognigy, comdirect, Continental, Crédit Agricole Payment Services, Denizen (BBVA),
DHgate, DIHK, Elo7, EMP, ENIO, Faber-Castell , FedEx Express, Fitbit, FitFox by SportScheck, Fortress, Fossil
Group, Gameforge, Garmin, Gebr. Heinemann, Genting Cruise Lines, Giuseppe Zanotti, Google Pay, IKEA,
Isuzu, KaDeWe Group, Krämer, Kyivstar, lastminute.com, LATAM, Mammut, Mastercard, Mastercard Prepaid
Management Services (Prepaid Services), MCM, Mercateo Unite, Mizuho Bank, Möbel Inhofer, Moonrise,
Natura, OLYMP , Olympus, Petrol/ MBI, Pflanzen-Kölle, Playa Games, PVH/ TOMMY HILFIGER und CALVIN
KLEIN, Q Versicherung, Qatar Airways, Reading, reifen.com, Reise Bank, RHB Bank, SAP, SES-imagotag,
Singtel, Sodexo, Spendit, Stuttgart-Marketing GmbH, TAV, TeleClinic, Telenor, TransferWise, Travel Easy, T-
Systems, Venue Retail Group, Viessmann, Villeroy & Boch, Visa, Weizmann Forex, Wirelane, Wizz Air
12.3
32.3
H2 2017 H2 2018
NEW SIGNINGSwith a potential transaction volume
of (in EUR bn)
162.6%
yoy
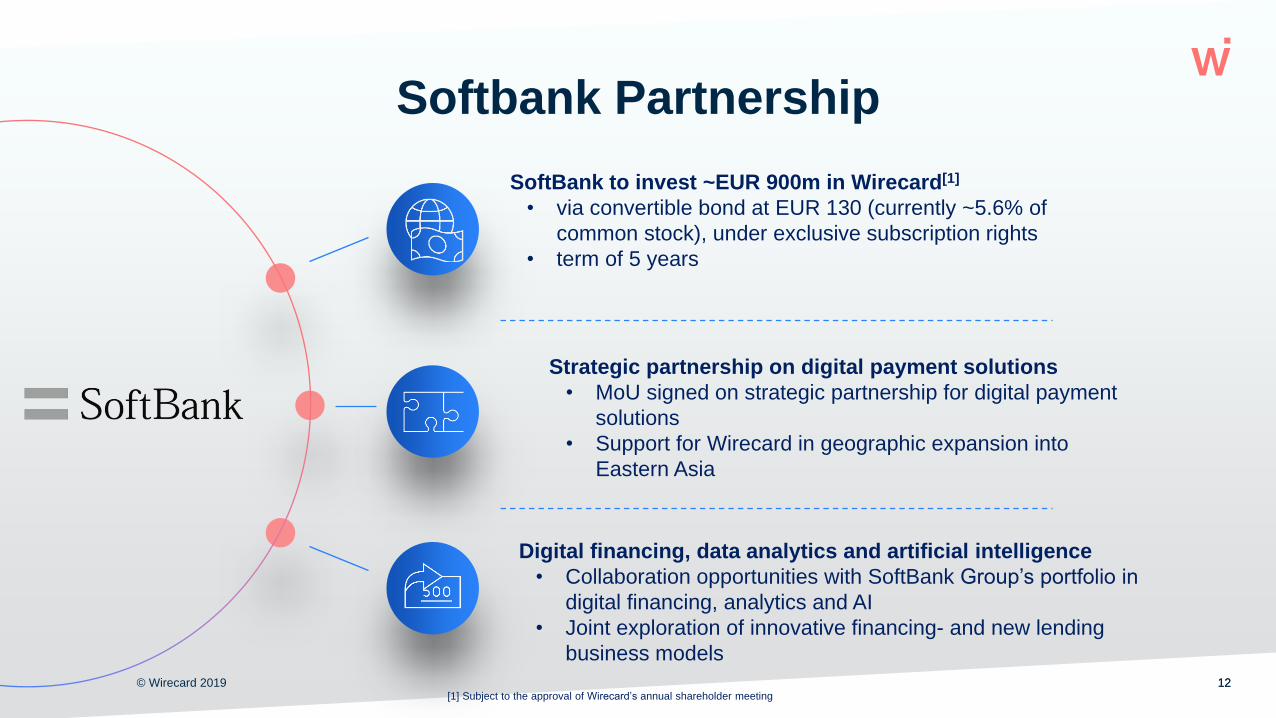
Softbank Partnership
© Wirecard 2019 1212
Strategic partnership on digital payment solutions
• MoU signed on strategic partnership for digital payment
solutions
• Support for Wirecard in geographic expansion into
Eastern Asia
SoftBank to invest ~EUR 900m in Wirecard[1]
• via convertible bond at EUR 130 (currently ~5.6% of
common stock), under exclusive subscription rights
• term of 5 years
Digital financing, data analytics and artificial intelligence
• Collaboration opportunities with SoftBank Group’s portfolio in
digital financing, analytics and AI
• Joint exploration of innovative financing- and new lending
business models
[1] Subject to the approval of Wirecard’s annual shareholder meeting

Outlook
© Wirecard 2019 13
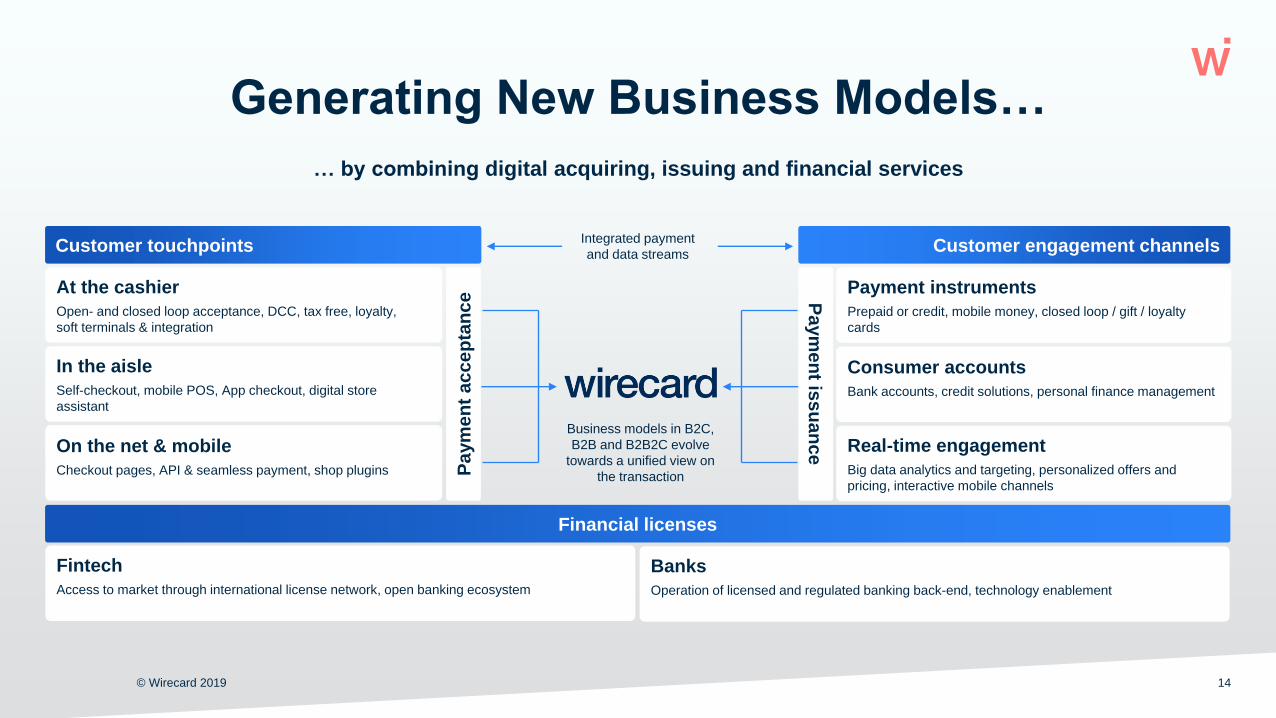
Consumer accounts
Bank accounts, credit solutions, personal finance management
Real-time engagement
Big data analytics and targeting, personalized offers and
pricing, interactive mobile channels
Payment instruments
Prepaid or credit, mobile money, closed loop / gift / loyalty
cards
In the aisle
Self-checkout, mobile POS, App checkout, digital store
assistant
On the net & mobile
Checkout pages, API & seamless payment, shop plugins
At the cashier
Open- and closed loop acceptance, DCC, tax free, loyalty,
soft terminals & integration
Paym
en
t iss
uan
ce
Financial licenses
… by combining digital acquiring, issuing and financial services
Generating New Business Models…
Business models in B2C,
B2B and B2B2C evolve
towards a unified view on
the transaction
Integrated payment
and data streams
© Wirecard 2019 14
Customer touchpoints Customer engagement channels
Paym
en
t ac
ce
pta
nce
Fintech
Access to market through international license network, open banking ecosystem
Banks
Operation of licensed and regulated banking back-end, technology enablement
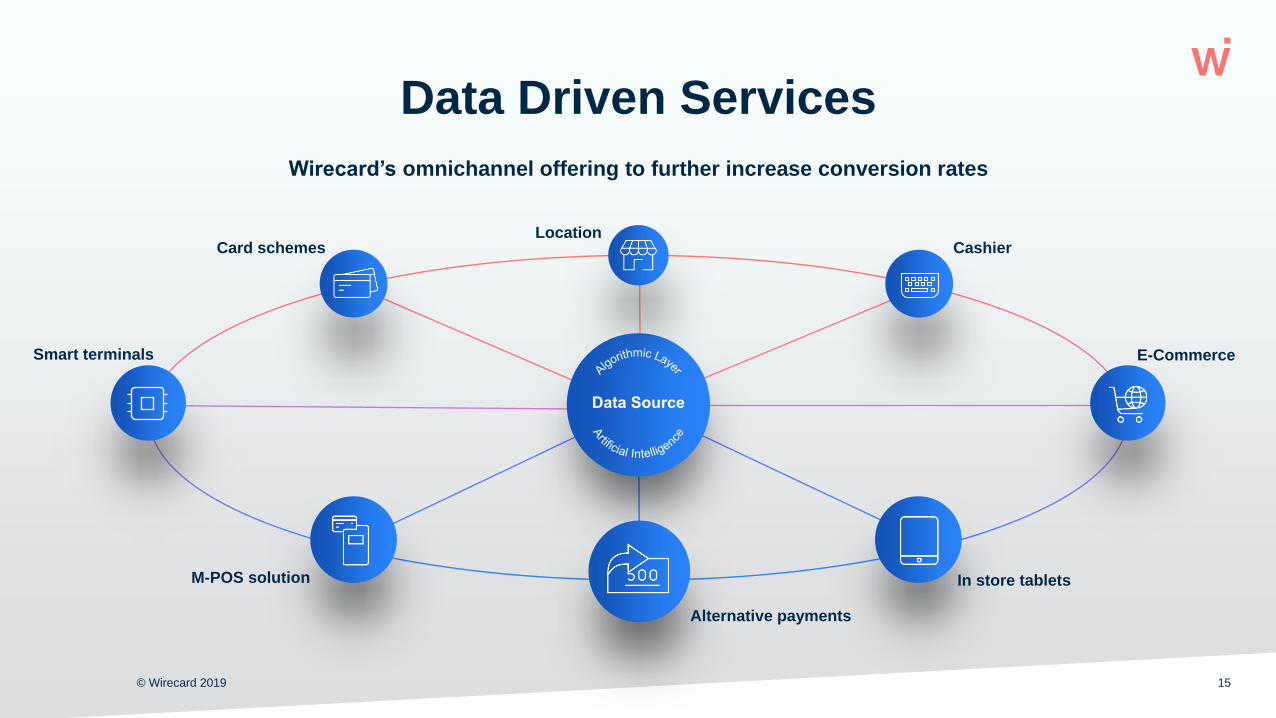
Wirecard’s omnichannel offering to further increase conversion rates
Data Driven Services
© Wirecard 2019 15
Card schemesLocation
Cashier
E-Commerce
In store tablets
Alternative payments
Smart terminals
M-POS solution
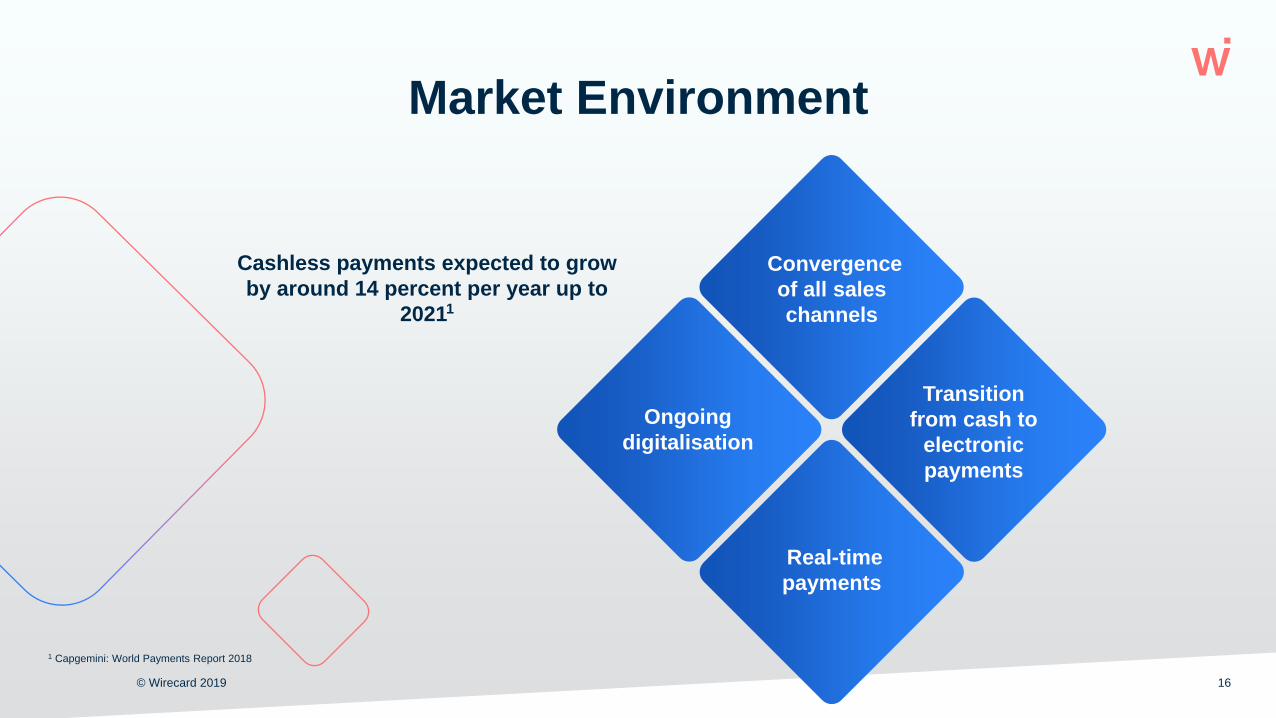
Market Environment
© Wirecard 2019 16
Ongoing
digitalisation
Real-time
payments
Convergence
of all sales
channels
Transition
from cash to
electronic
payments
Cashless payments expected to grow
by around 14 percent per year up to
20211
1 Capgemini: World Payments Report 2018
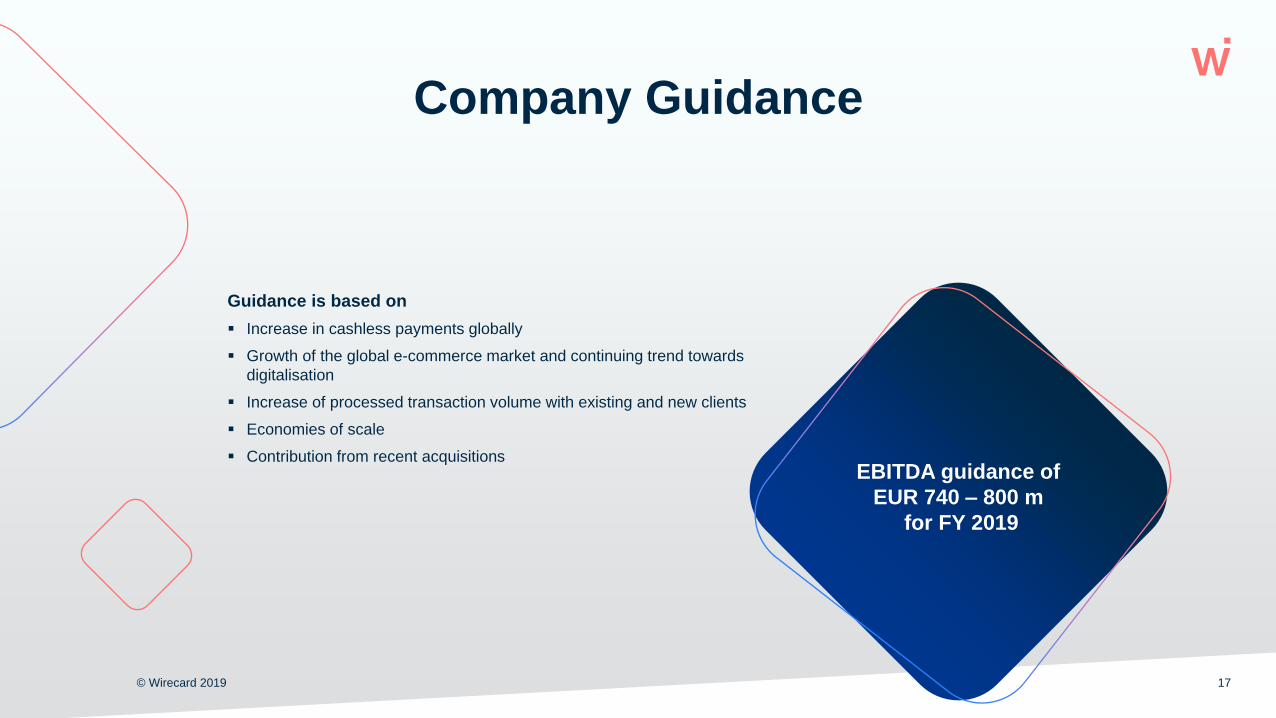
Company Guidance
© Wirecard 2019 17
Guidance is based on
Increase in cashless payments globally
Growth of the global e-commerce market and continuing trend towards
digitalisation
Increase of processed transaction volume with existing and new clients
Economies of scale
Contribution from recent acquisitionsEBITDA guidance of
EUR 740 – 800 m
for FY 2019
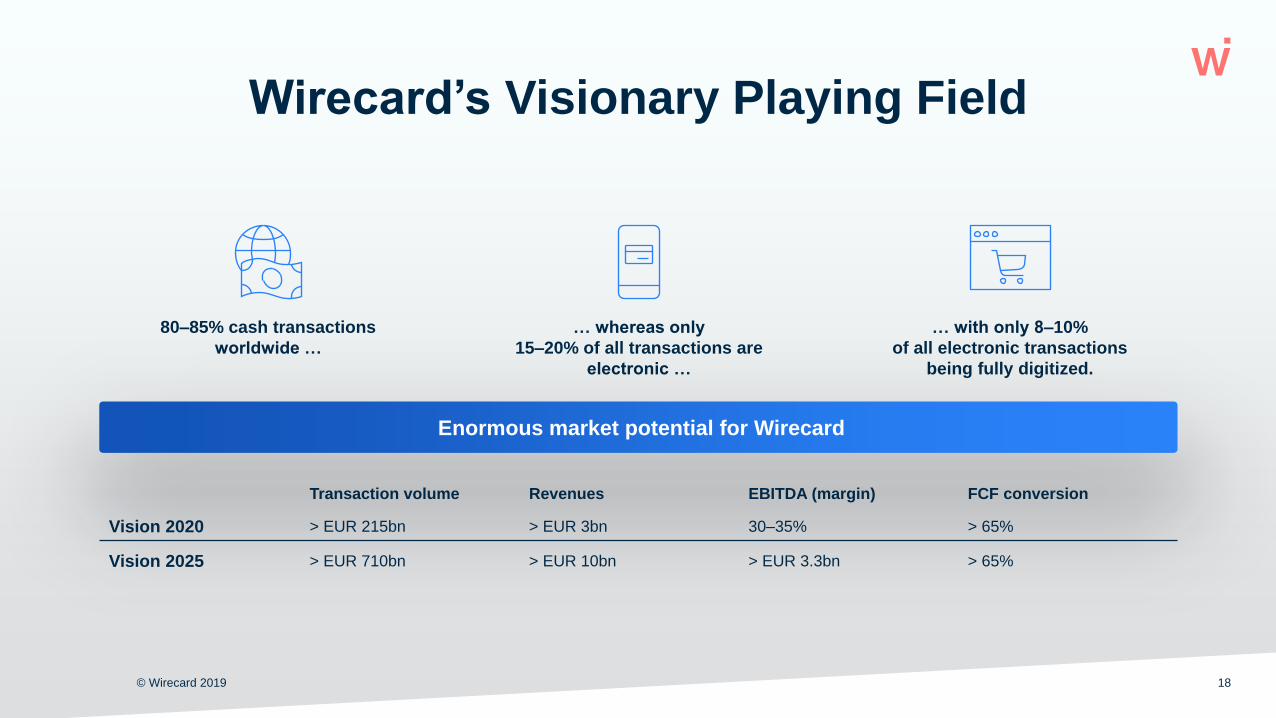
Wirecard’s Visionary Playing Field
80–85% cash transactions
worldwide …
… whereas only
15–20% of all transactions are
electronic …
… with only 8–10%
of all electronic transactions
being fully digitized.
Enormous market potential for Wirecard
Transaction volume Revenues EBITDA (margin) FCF conversion
Vision 2020 > EUR 215bn > EUR 3bn 30–35% > 65%
Vision 2025 > EUR 710bn > EUR 10bn > EUR 3.3bn > 65%
© Wirecard 2019 18

Financial Data
© Wirecard 2019 19
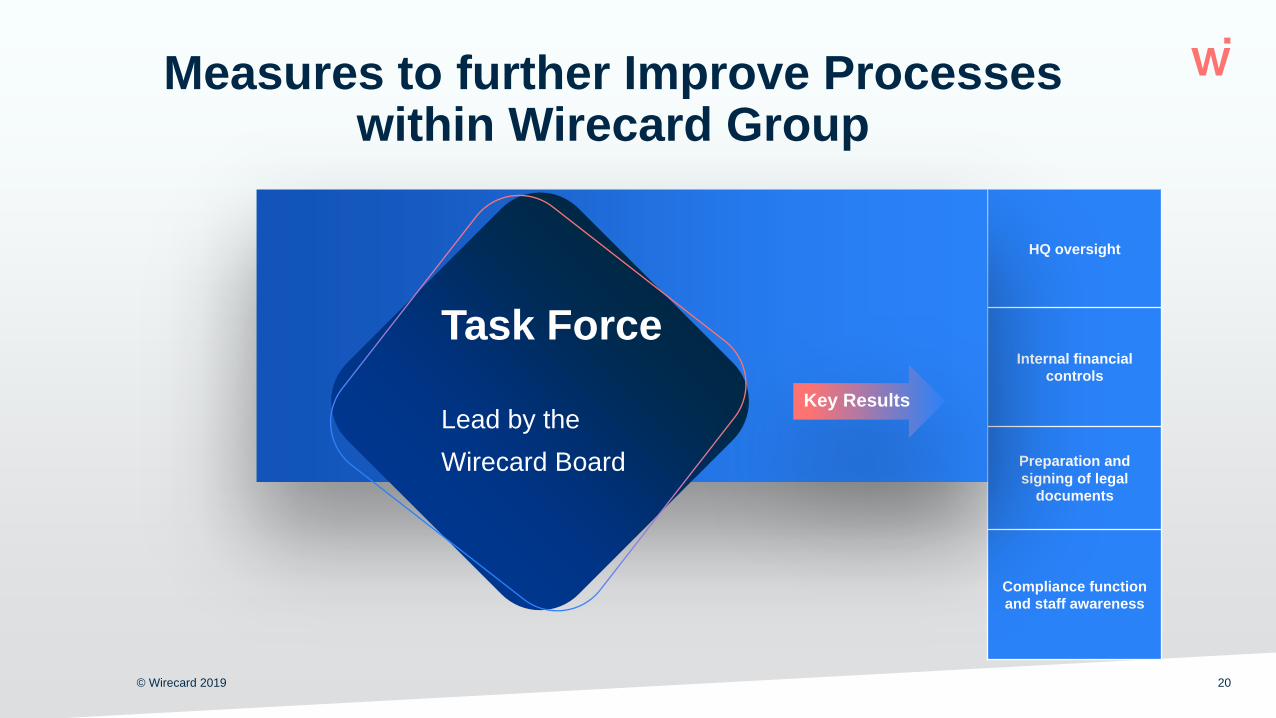
Measures to further Improve Processes within Wirecard Group
© Wirecard 2019 20
HQ oversight
Internal financial
controls
Preparation and
signing of legal
documents
Compliance function
and staff awareness
Task Force
Lead by the
Wirecard Board
Key Results
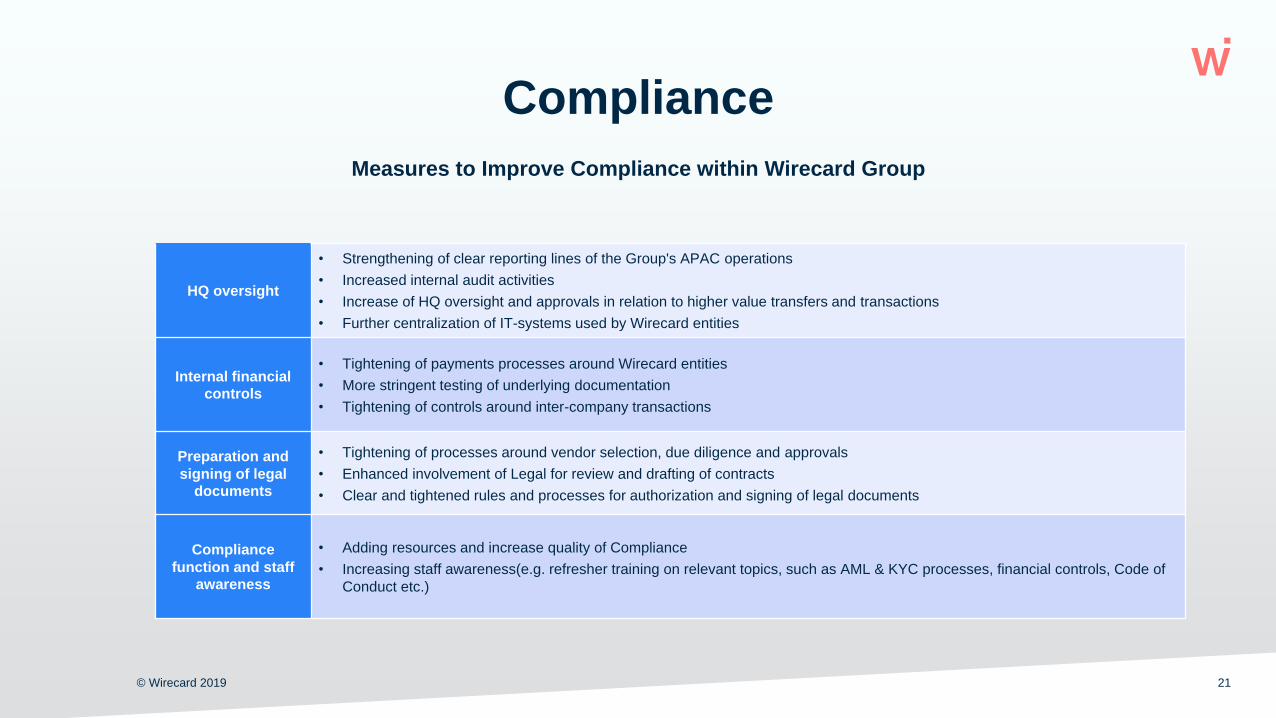
Compliance
© Wirecard 2019 21
Measures to Improve Compliance within Wirecard Group
HQ oversight
• Strengthening of clear reporting lines of the Group's APAC operations
• Increased internal audit activities
• Increase of HQ oversight and approvals in relation to higher value transfers and transactions
• Further centralization of IT-systems used by Wirecard entities
Internal financial
controls
• Tightening of payments processes around Wirecard entities
• More stringent testing of underlying documentation
• Tightening of controls around inter-company transactions
Preparation and
signing of legal
documents
• Tightening of processes around vendor selection, due diligence and approvals
• Enhanced involvement of Legal for review and drafting of contracts
• Clear and tightened rules and processes for authorization and signing of legal documents
Compliance
function and staff
awareness
• Adding resources and increase quality of Compliance
• Increasing staff awareness(e.g. refresher training on relevant topics, such as AML & KYC processes, financial controls, Code of
Conduct etc.)
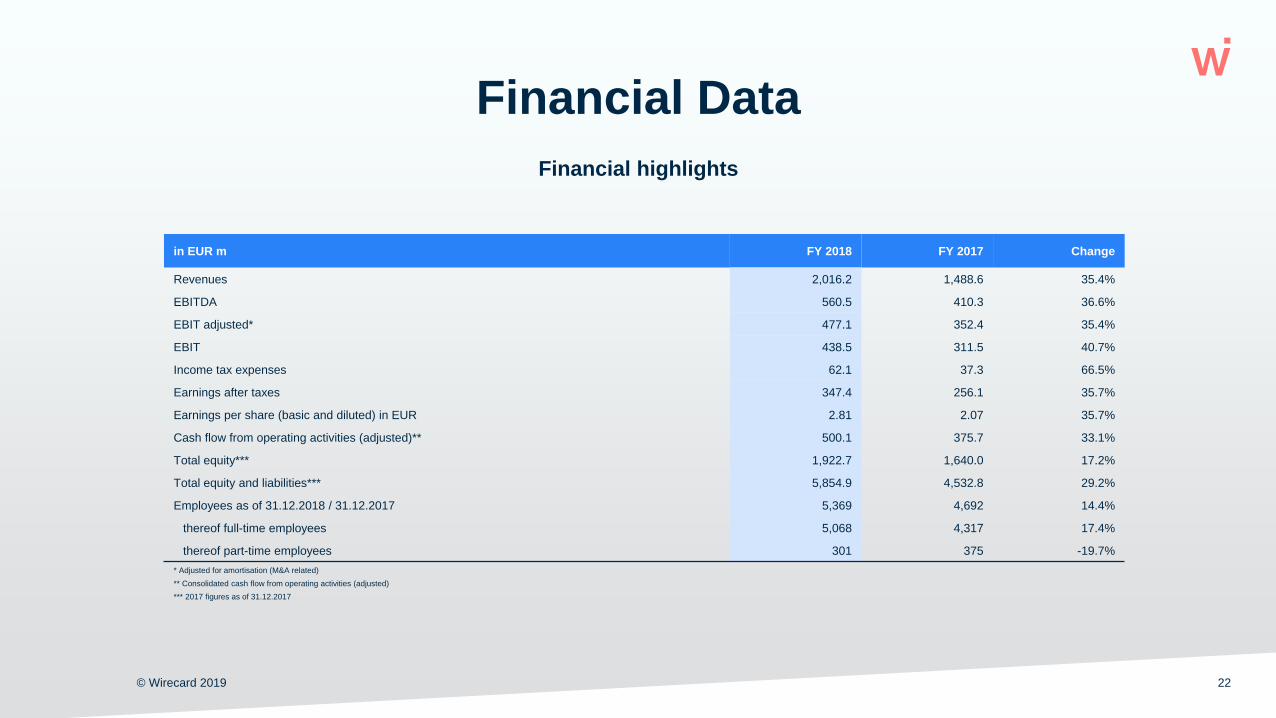
Financial highlights
Financial Data
© Wirecard 2019 22
in EUR m FY 2018 FY 2017 Change
Revenues 2,016.2 1,488.6 35.4%
EBITDA 560.5 410.3 36.6%
EBIT adjusted* 477.1 352.4 35.4%
EBIT 438.5 311.5 40.7%
Income tax expenses 62.1 37.3 66.5%
Earnings after taxes 347.4 256.1 35.7%
Earnings per share (basic and diluted) in EUR 2.81 2.07 35.7%
Cash flow from operating activities (adjusted)** 500.1 375.7 33.1%
Total equity*** 1,922.7 1,640.0 17.2%
Total equity and liabilities*** 5,854.9 4,532.8 29.2%
Employees as of 31.12.2018 / 31.12.2017 5,369 4,692 14.4%
thereof full-time employees 5,068 4,317 17.4%
thereof part-time employees 301 375 -19.7%
* Adjusted for amortisation (M&A related)
** Consolidated cash flow from operating activities (adjusted)
*** 2017 figures as of 31.12.2017
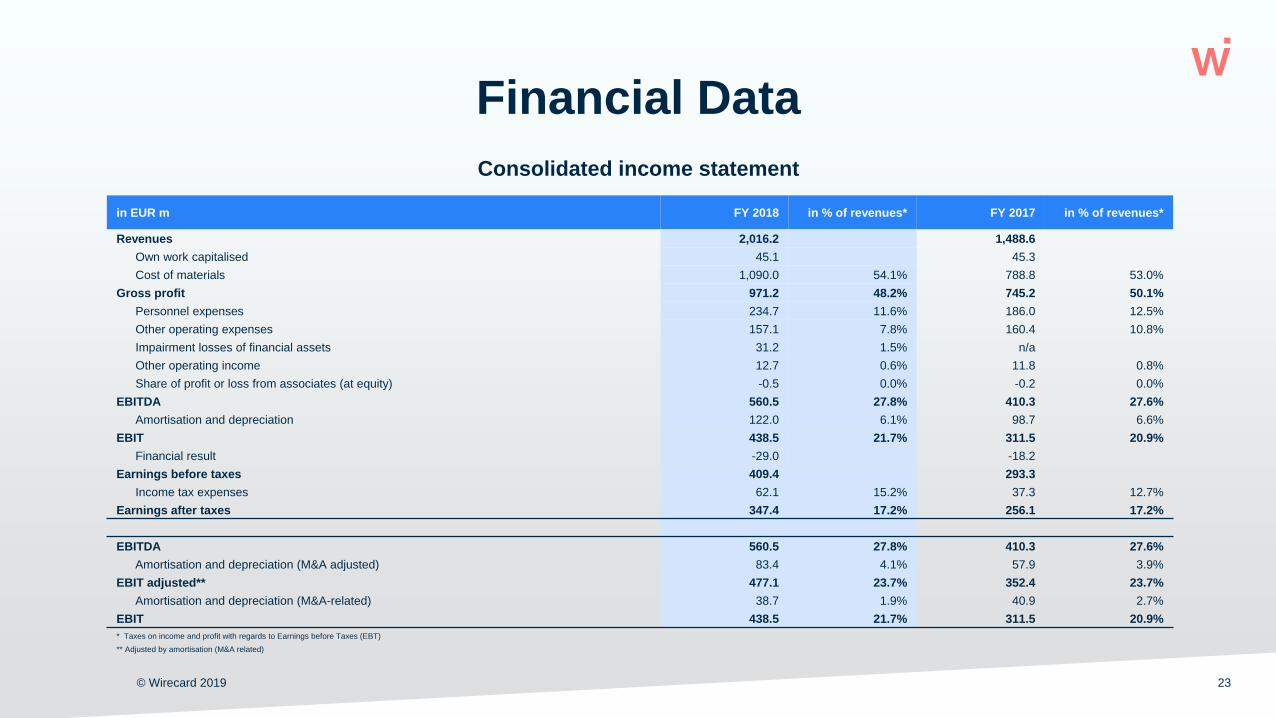
Consolidated income statement
Financial Data
© Wirecard 2019 23
in EUR m FY 2018 in % of revenues* FY 2017 in % of revenues*
Revenues 2,016.2 1,488.6
Own work capitalised 45.1 45.3
Cost of materials 1,090.0 54.1% 788.8 53.0%
Gross profit 971.2 48.2% 745.2 50.1%
Personnel expenses 234.7 11.6% 186.0 12.5%
Other operating expenses 157.1 7.8% 160.4 10.8%
Impairment losses of financial assets 31.2 1.5% n/a
Other operating income 12.7 0.6% 11.8 0.8%
Share of profit or loss from associates (at equity) -0.5 0.0% -0.2 0.0%
EBITDA 560.5 27.8% 410.3 27.6%
Amortisation and depreciation 122.0 6.1% 98.7 6.6%
EBIT 438.5 21.7% 311.5 20.9%
Financial result -29.0 -18.2
Earnings before taxes 409.4 293.3
Income tax expenses 62.1 15.2% 37.3 12.7%
Earnings after taxes 347.4 17.2% 256.1 17.2%
EBITDA 560.5 27.8% 410.3 27.6%
Amortisation and depreciation (M&A adjusted) 83.4 4.1% 57.9 3.9%
EBIT adjusted** 477.1 23.7% 352.4 23.7%
Amortisation and depreciation (M&A-related) 38.7 1.9% 40.9 2.7%
EBIT 438.5 21.7% 311.5 20.9%
* Taxes on income and profit with regards to Earnings before Taxes (EBT)
** Adjusted by amortisation (M&A related)
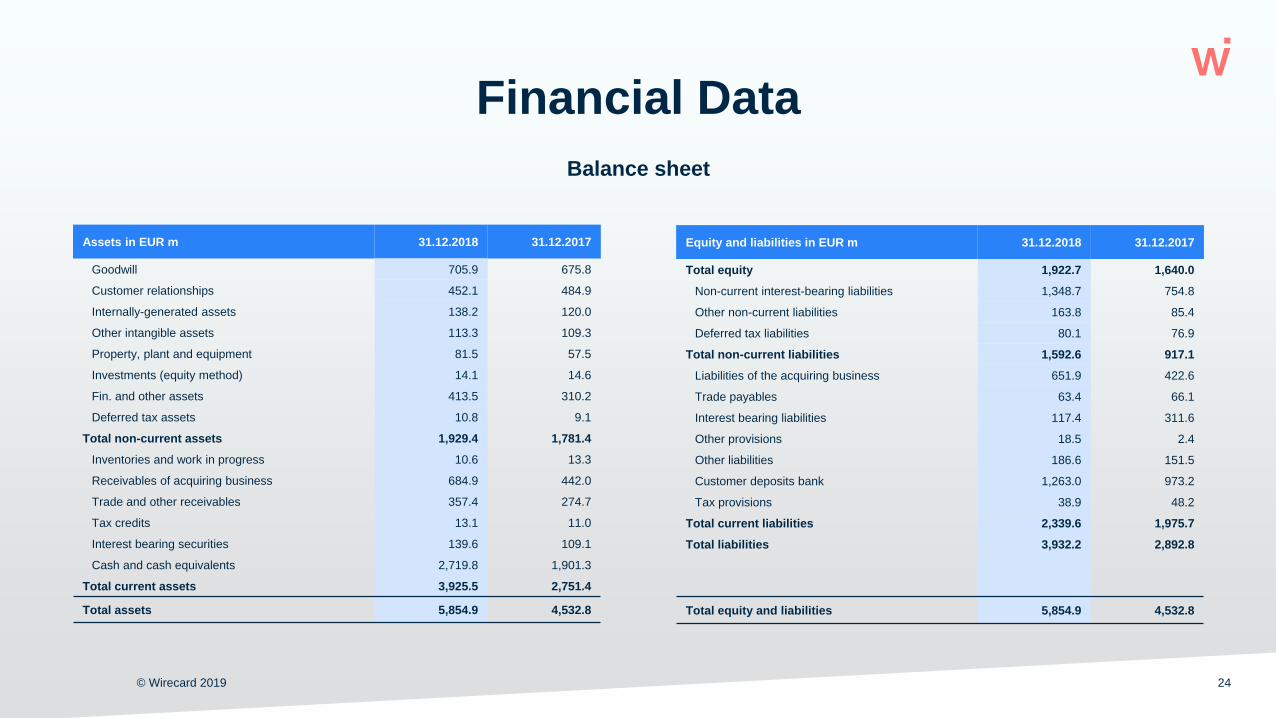
Balance sheet
Financial Data
© Wirecard 2019 24
Assets in EUR m 31.12.2018 31.12.2017
Goodwill 705.9 675.8
Customer relationships 452.1 484.9
Internally-generated assets 138.2 120.0
Other intangible assets 113.3 109.3
Property, plant and equipment 81.5 57.5
Investments (equity method) 14.1 14.6
Fin. and other assets 413.5 310.2
Deferred tax assets 10.8 9.1
Total non-current assets 1,929.4 1,781.4
Inventories and work in progress 10.6 13.3
Receivables of acquiring business 684.9 442.0
Trade and other receivables 357.4 274.7
Tax credits 13.1 11.0
Interest bearing securities 139.6 109.1
Cash and cash equivalents 2,719.8 1,901.3
Total current assets 3,925.5 2,751.4
Total assets 5,854.9 4,532.8
Equity and liabilities in EUR m 31.12.2018 31.12.2017
Total equity 1,922.7 1,640.0
Non-current interest-bearing liabilities 1,348.7 754.8
Other non-current liabilities 163.8 85.4
Deferred tax liabilities 80.1 76.9
Total non-current liabilities 1,592.6 917.1
Liabilities of the acquiring business 651.9 422.6
Trade payables 63.4 66.1
Interest bearing liabilities 117.4 311.6
Other provisions 18.5 2.4
Other liabilities 186.6 151.5
Customer deposits bank 1,263.0 973.2
Tax provisions 38.9 48.2
Total current liabilities 2,339.6 1,975.7
Total liabilities 3,932.2 2,892.8
Total equity and liabilities 5,854.9 4,532.8
0
500
1,000
1,500
2,000
2,500
3,000
3,500
4,000
Cash and cashequivalents
Interest bearingsecurities
Receivables ofacquiring
business & Tradeand other
receivables
Current interestbearing
liabilities/otherliabilities
Customerdeposits bank*
Liabilities ofacquiring
business andtrade payables
Net cash positionshort term -Wirecard
Non-currentfinancial assets
Non-currentinterest bearingliabilities / other
liabilities
Net cash positionlong term -Wirecard
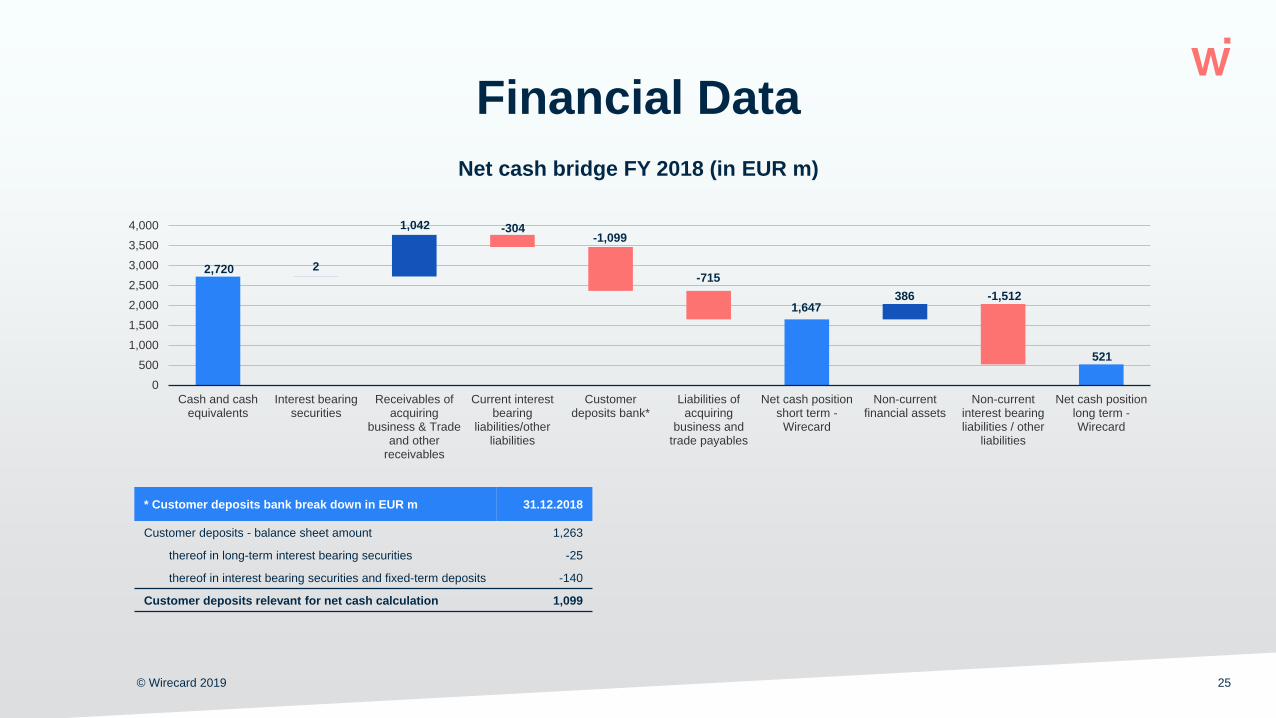
Net cash bridge FY 2018 (in EUR m)
Financial Data
© Wirecard 2019 25
* Customer deposits bank break down in EUR m 31.12.2018
Customer deposits - balance sheet amount 1,263
thereof in long-term interest bearing securities -25
thereof in interest bearing securities and fixed-term deposits -140
Customer deposits relevant for net cash calculation 1,099
2,720 2
1,042 -304-1,099
-715
1,647386 -1,512
521
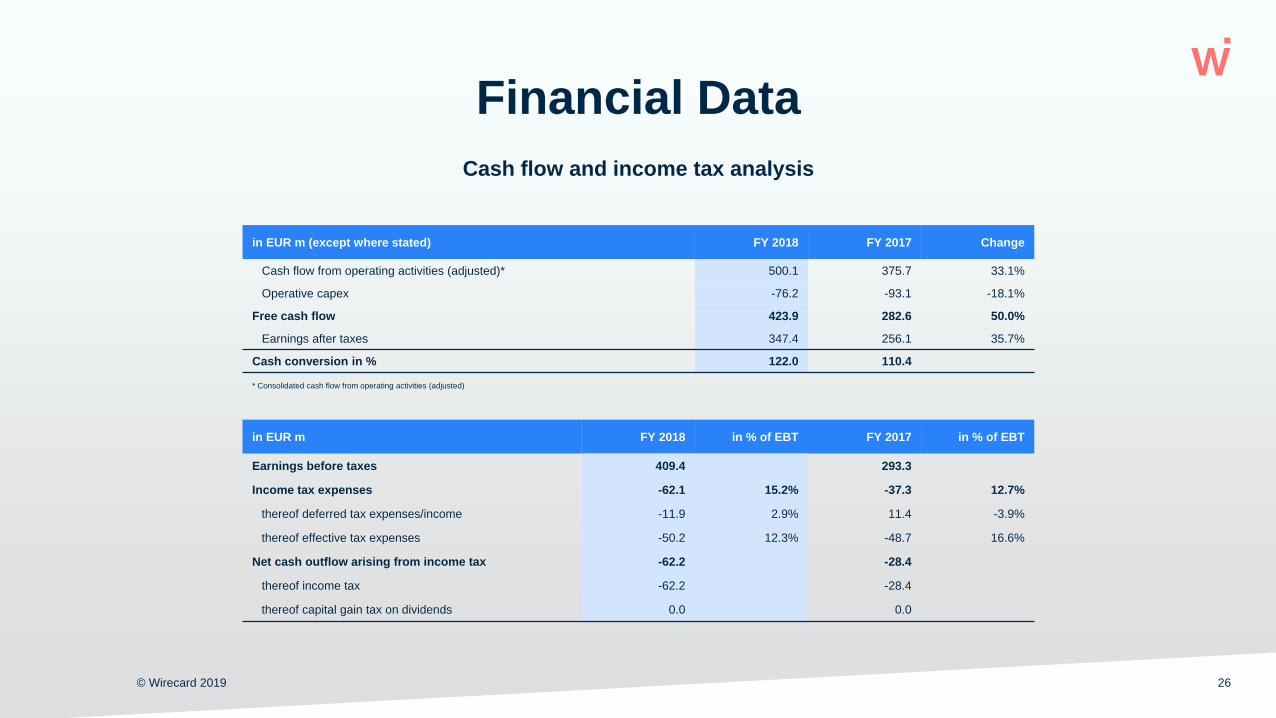
Cash flow and income tax analysis
Financial Data
© Wirecard 2019 26
in EUR m FY 2018 in % of EBT FY 2017 in % of EBT
Earnings before taxes 409.4 293.3
Income tax expenses -62.1 15.2% -37.3 12.7%
thereof deferred tax expenses/income -11.9 2.9% 11.4 -3.9%
thereof effective tax expenses -50.2 12.3% -48.7 16.6%
Net cash outflow arising from income tax -62.2 -28.4
thereof income tax -62.2 -28.4
thereof capital gain tax on dividends 0.0 0.0
in EUR m (except where stated) FY 2018 FY 2017 Change
Cash flow from operating activities (adjusted)* 500.1 375.7 33.1%
Operative capex -76.2 -93.1 -18.1%
Free cash flow 423.9 282.6 50.0%
Earnings after taxes 347.4 256.1 35.7%
Cash conversion in % 122.0 110.4
* Consolidated cash flow from operating activities (adjusted)
Wirecard AG | Einsteinring 35 | 85609 Aschheim, Germany | [email protected]
Thank you
© Wirecard 2019 27

Investor Relations
Iris Stoeckl
T: +49 89 44214 1424
Media Relations
Jana Tilz
T: +49 (0) 89 4424 1363
Media / Investor Relations
© Wirecard 2019 28
Disclaimer
© Wirecard 2019 29
This presentation contains explicit and implicit forward-looking statements concerning Wirecard AG, its affiliated companies and their business. These statements
are subject to various known and unknown risks, uncertainties and other factors due to which the actual events, financial conditions, performances and
achievements of Wirecard AG may differ substantially from those expressed in such explicit or implicit statements. Wirecard AG makes these statements at the
time of the publication of the presentation and is under no obligation to update the forward-looking statements in this presentation including on receipt of new
information or on occurrence of future events or for other reasons. However, Wirecard AG, may change in its own free discretion any forward-looking statements
should relevant factors change.
The forward-looking statements from third parties’ surveys, in particular without being limited to research reports and analysts’ statements, may prove to be
incorrect. Reference to such third parties’ surveys is provided for information only and does not imply any agreement with or consent to the content of such
surveys or the information, opinions or conclusions contained therein. Wirecard AG accepts no liability for the selection, completeness or correctness of third
parties’ studies.
Wirecard AG mostly publishes its figures in millions of euro (EUR m). The use of rounding means that it is possible that some figures do not add up exactly to form
the totals stated, and that the figures and percentages do not exactly reflect the absolute values on which they are based.
This presentation is no offer for the sale and no invitation for offers of purchase or for subscription to of shares of Wirecard AG but is provided for information only.
Financial data (IAS/IFRS) refers to the Reports of Wirecard AG published on our website: ir.wirecard.com

© Wirecard 2019 30
Appendix
Transaction volume
© Wirecard 2019 31
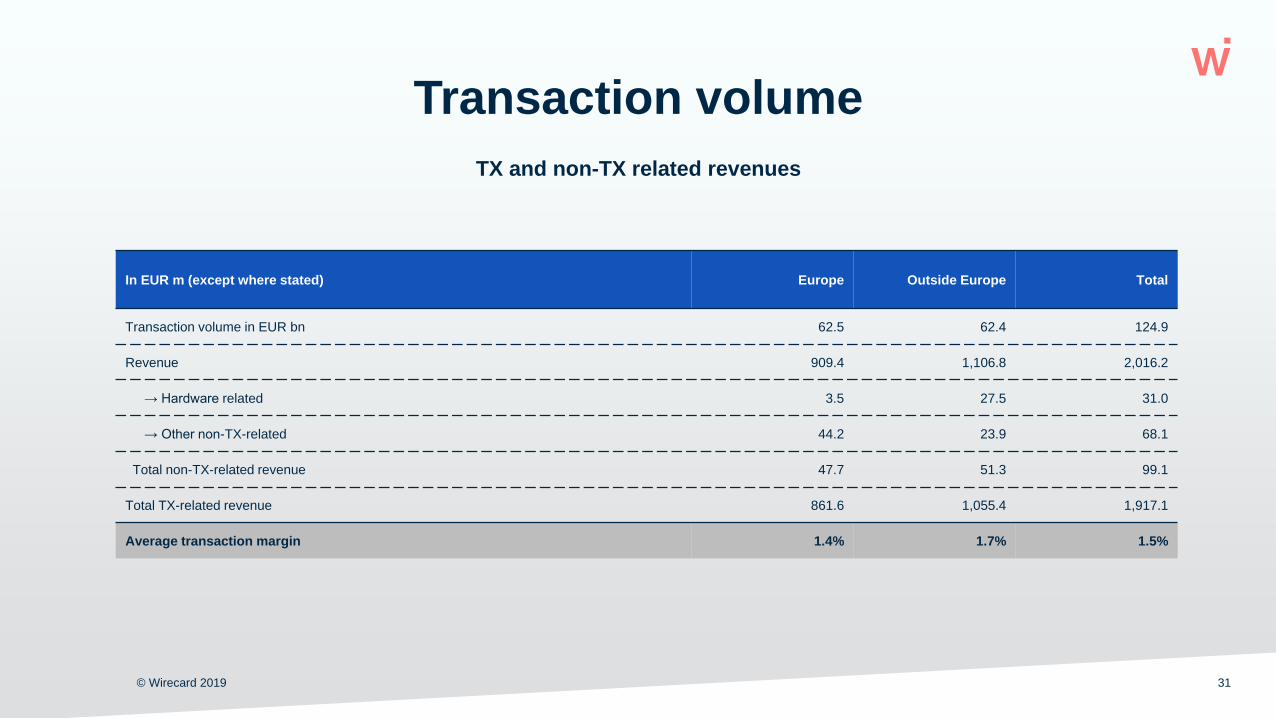
TX and non-TX related revenues
In EUR m (except where stated) Europe Outside Europe Total
Transaction volume in EUR bn 62.5 62.4 124.9
Revenue 909.4 1,106.8 2,016.2
→ Hardware related 3.5 27.5 31.0
→ Other non-TX-related 44.2 23.9 68.1
Total non-TX-related revenue 47.7 51.3 99.1
Total TX-related revenue 861.6 1,055.4 1,917.1
Average transaction margin 1.4% 1.7% 1.5%