Embed Size (px)
Citation preview
Investor Presentation
Q1 2021
Advisory Forward Looking Statements
2
Securities laws encourage public issuers to disclose forward-looking information in their management’s discussion and analysis (MD&A) so that investors can get a better understanding of the company’s future prospects and make informed investment decisions. Forward-looking information and statements included in this Investor Presentation about objectives and management’s expectations, beliefs, intentions or strategies for the future are not guarantees of future performance and should not be unduly relied upon. All forward-looking statements reflect management’s current views as at May 6, 2021, with respect to future events, and they are subject to certain risks, uncertainties and assumptions that may cause the actual results, performance or achievements to be materially different from any future results, performance or achievements expressed or implied by such forward-looking statements. Such risks, uncertainties and assumptions include, but are not limited to: general economic conditions; the cost and availability of capital; actions by government authorities; actions by regulatory authorities; availability of raw materials; changes in raw materials prices; currency exchange rates; interest rates; competitor activity; industry pricing pressures; seasonality of the construction industry; and weather related factors. A more detailed assessment of the risks that could cause actual results to materially differ from current expectations can be found in the Risk Management and Assessment section of the 2020 annual MD&A or under the Risk Factors section in the Annual Information Form for the year ended December 31, 2020.
PFB Corporation Overview
3
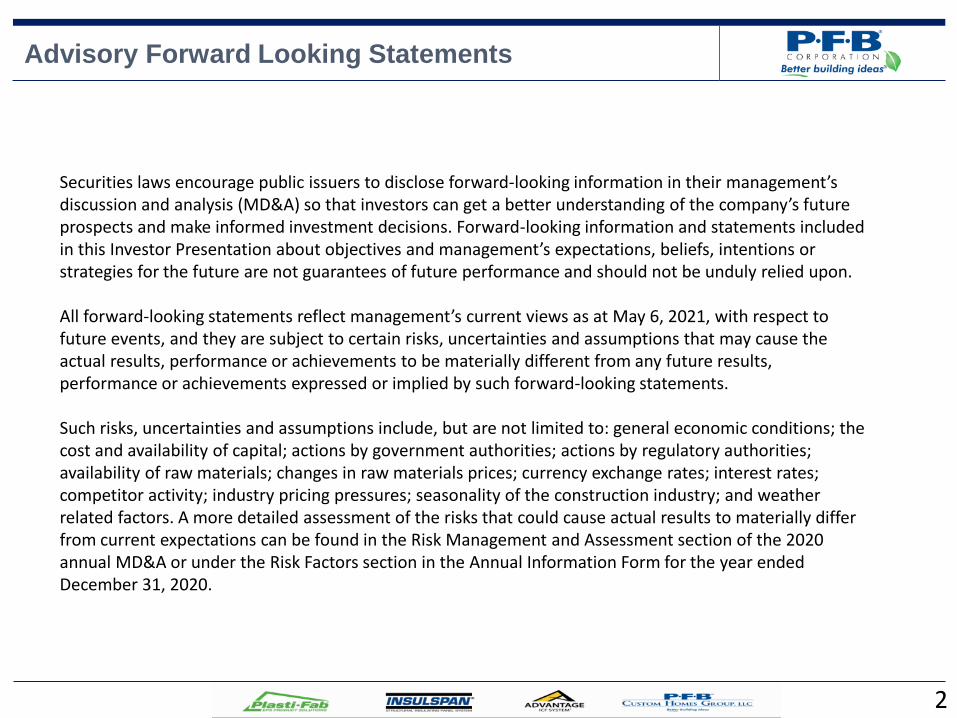
Our Strategic Focus:
PFB Corporation (PFB) is a vertically-integrated manufacturer of products based on our core competency in expanded polystyrene foams (“EPS”). We own or lease a total of eleven facilities in Canada and six in the USA.
We are industry leaders and the only vertically integrated EPS company in North America; experts in EPS resin, building science applications, and geotechnical applications of our engineered EPS foam products.
Our innovative designs and high-quality building products for insulated residential and commercial structures, engineered geotechnical products used as soil replacement in foundations, road and bridge construction and protective packaging products on both a custom and a commodity basis are available nationally.
Value-added, “green” products provide sustainable alternative to traditional building products and address demand for energy-efficient building structures; 35% of energy consumption is in buildings.
The financial strength of PFB is evidenced by our strong balance sheet, diversified and stable revenue
streams in both Canada and the USA, focus on return on capital and optimizing capacity utilization, and our ability to accretively grow revenue and earnings both organically and through acquisitions.
Our Growth Strategy
Grow revenues to $200 million supported by our integrated product strategy Execute growth strategies for both organic growth and opportunistic acquisitions Focus growth on USA operations and overall footprint
Dividend Policy:
Quarterly dividend of $0.10 per share ($0.40 pa)
o Last dividend increase: Q3 2020
One-time special dividend of $1.00 per common share paid in Q4 2020
Link to public disclosure at http://www.sedar.com; PFBCorp.com
All amounts in thousands CAD except for per share amounts and unless otherwise noted. Adjusted “EBITDA” represents earnings or loss before interest, taxes, depreciation and amortization. Adjusted EBITDA is an absolute measure of our operating performance and provides an indication of the results generated by our business activities prior to how activities are financed, how assets are depreciated and amortized, and how results are taxed. The Last Twelve Months sales, net income, net income per share, adjusted EBITDA and adjusted EBITDA per share are calculated on a simple annualized summation of prior period reported results.
Three Months ended March 31, 2021
2021 2020
Sales 26,058$ 24,233$
Net Income 1,654$ 346$
Per share (basic) 0.24$ 0.05$
Adj. EBITDA 3,383$ 1,909$
Per share (basic) 0.50$ 0.29$
Last Twelve Months ended March 31, 2021
2021 2020
Sales 136,621$ 133,352$
Net income 17,728$ 10,544$
Per share (basic) 2.62$ 1.56$
Adj. EBITDA 28,773$ 19,762$
Per share (basic) 4.26$ 2.94$
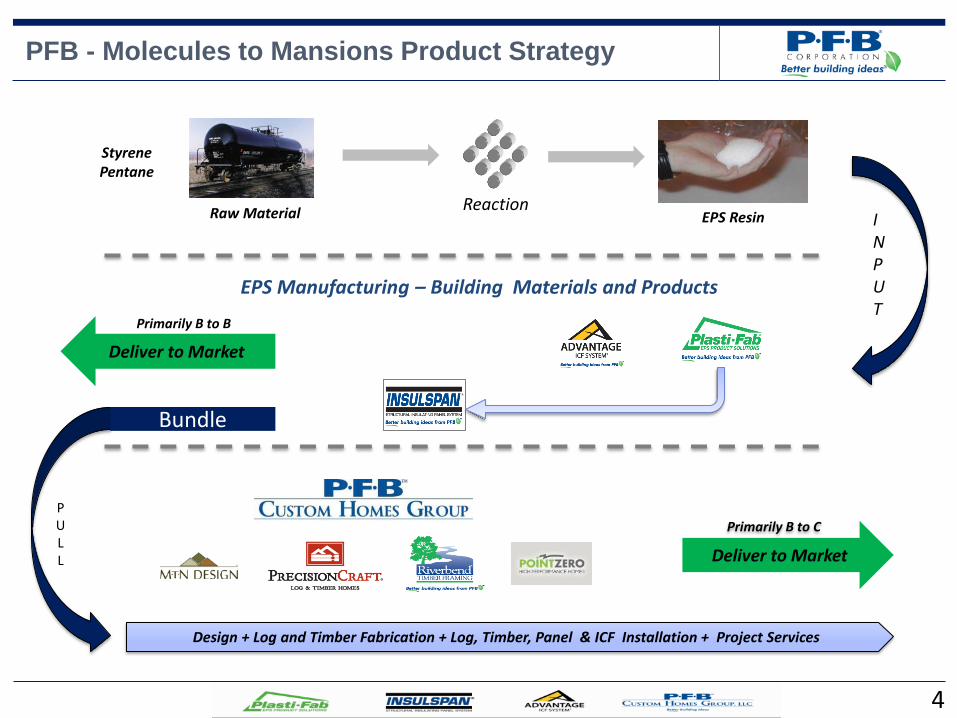
PFB - Molecules to Mansions Product Strategy
4
Bundle
P U L L Deliver to Market
Primarily B to C
EPS Resin Raw Material Reaction
Styrene Pentane
INPUT
Deliver to Market
EPS Manufacturing – Building Materials and Products
Primarily B to B
Design + Log and Timber Fabrication + Log, Timber, Panel & ICF Installation + Project Services
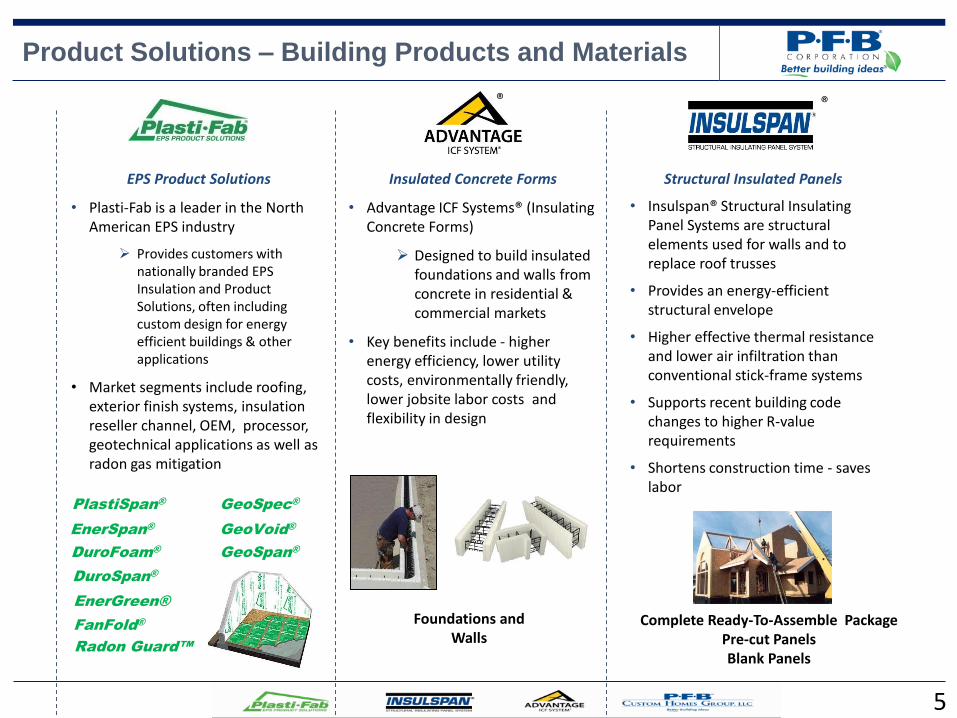
Complete Ready-To-Assemble Package Pre-cut Panels Blank Panels
Foundations and Walls
Insulated Concrete Forms
• Advantage ICF Systems® (Insulating Concrete Forms)
Designed to build insulated foundations and walls from concrete in residential & commercial markets
• Key benefits include - higher energy efficiency, lower utility costs, environmentally friendly, lower jobsite labor costs and flexibility in design
®
Product Solutions – Building Products and Materials
5
®
Structural Insulated Panels
• Insulspan® Structural Insulating Panel Systems are structural elements used for walls and to replace roof trusses
• Provides an energy-efficient structural envelope
• Higher effective thermal resistance and lower air infiltration than conventional stick-frame systems
• Supports recent building code changes to higher R-value requirements
• Shortens construction time - saves labor
®
EPS Product Solutions
• Plasti-Fab is a leader in the North American EPS industry
Provides customers with nationally branded EPS Insulation and Product Solutions, often including custom design for energy efficient buildings & other applications
• Market segments include roofing, exterior finish systems, insulation reseller channel, OEM, processor, geotechnical applications as well as radon gas mitigation
PlastiSpan®
DuroFoam®
DuroSpan®
EnerSpan®
Radon Guard™
EnerGreen®
FanFold®
GeoSpec®
GeoVoid®
GeoSpan®
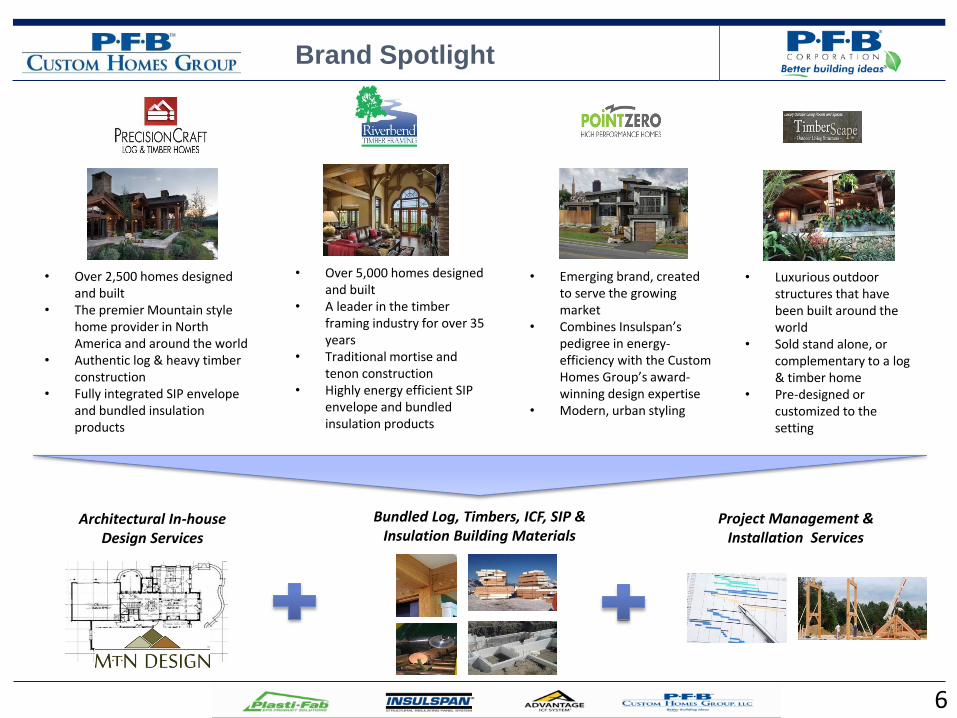
• Over 2,500 homes designed and built
• The premier Mountain style home provider in North America and around the world
• Authentic log & heavy timber construction
• Fully integrated SIP envelope and bundled insulation products
• Over 5,000 homes designed and built
• A leader in the timber framing industry for over 35 years
• Traditional mortise and tenon construction
• Highly energy efficient SIP envelope and bundled insulation products
• Emerging brand, created to serve the growing market
• Combines Insulspan’s pedigree in energy-efficiency with the Custom Homes Group’s award-winning design expertise
• Modern, urban styling
• Luxurious outdoor structures that have been built around the world
• Sold stand alone, or complementary to a log & timber home
• Pre-designed or customized to the setting
6
Architectural In-house Design Services
Bundled Log, Timbers, ICF, SIP & Insulation Building Materials
Project Management & Installation Services
Brand Spotlight
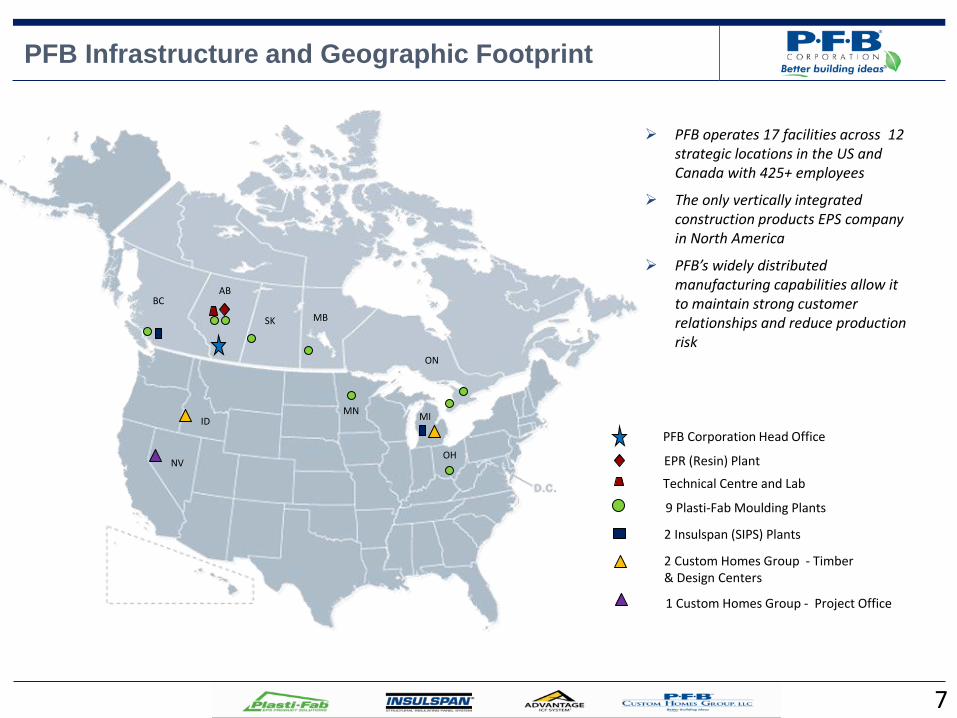
PFB Infrastructure and Geographic Footprint
7
PFB Corporation Head Office
EPR (Resin) Plant
Technical Centre and Lab
9 Plasti-Fab Moulding Plants
2 Custom Homes Group - Timber & Design Centers
2 Insulspan (SIPS) Plants
PFB operates 17 facilities across 12 strategic locations in the US and Canada with 425+ employees
The only vertically integrated construction products EPS company in North America
PFB’s widely distributed manufacturing capabilities allow it to maintain strong customer relationships and reduce production risk
ID
AB BC
MB
MI MN
OH
ON
SK
1 Custom Homes Group - Project Office
NV
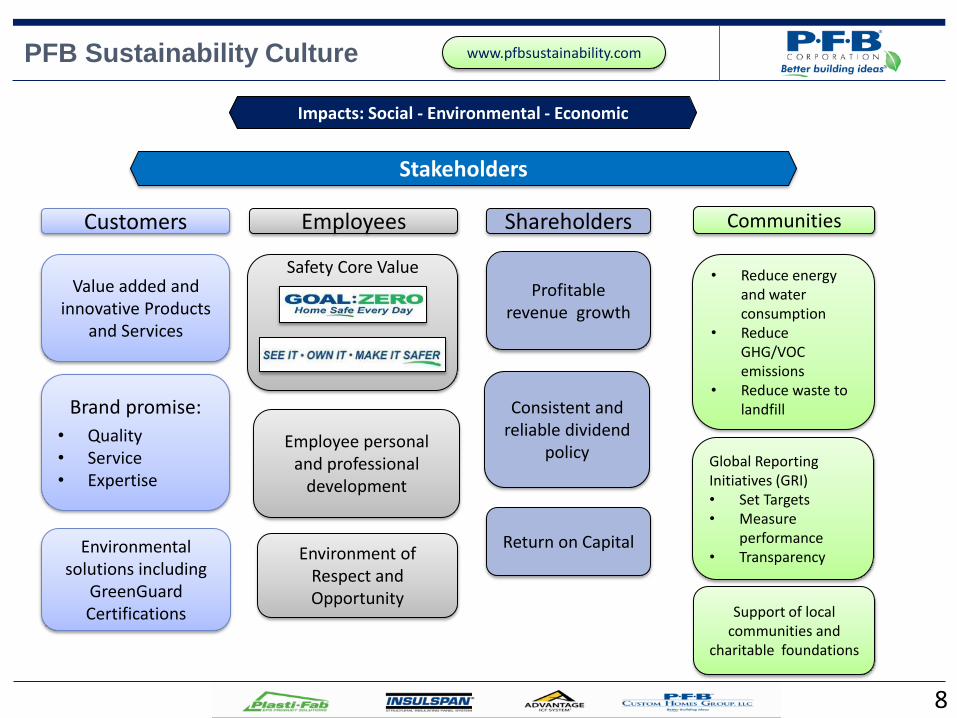
PFB Sustainability Culture
8
• Reduce energy and water consumption
• Reduce GHG/VOC emissions
• Reduce waste to landfill
Global Reporting Initiatives (GRI) • Set Targets • Measure
performance • Transparency
Safety Core Value
Employees Customers Shareholders Communities
Value added and innovative Products
and Services
Support of local communities and
charitable foundations
Employee personal and professional
development
Brand promise:
• Quality • Service • Expertise
Profitable revenue growth
Environment of Respect and Opportunity
Environmental solutions including
GreenGuard Certifications
Consistent and reliable dividend
policy
Return on Capital
www.pfbsustainability.com
Impacts: Social - Environmental - Economic
Stakeholders
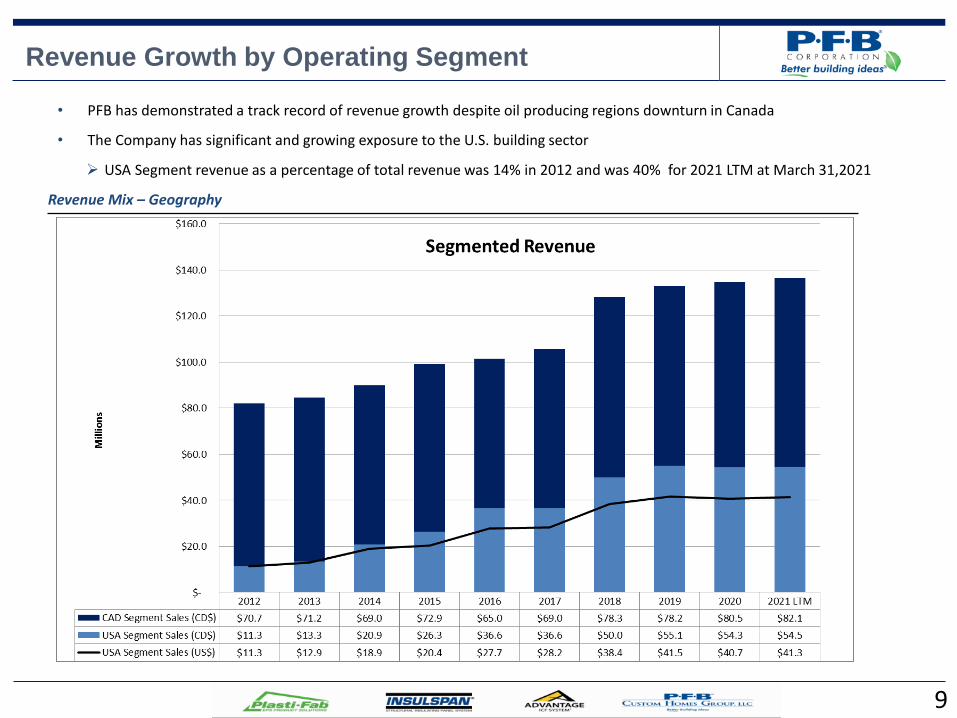
Revenue Growth by Operating Segment
9
Revenue Mix – Geography
• PFB has demonstrated a track record of revenue growth despite oil producing regions downturn in Canada
• The Company has significant and growing exposure to the U.S. building sector
USA Segment revenue as a percentage of total revenue was 14% in 2012 and was 40% for 2021 LTM at March 31,2021
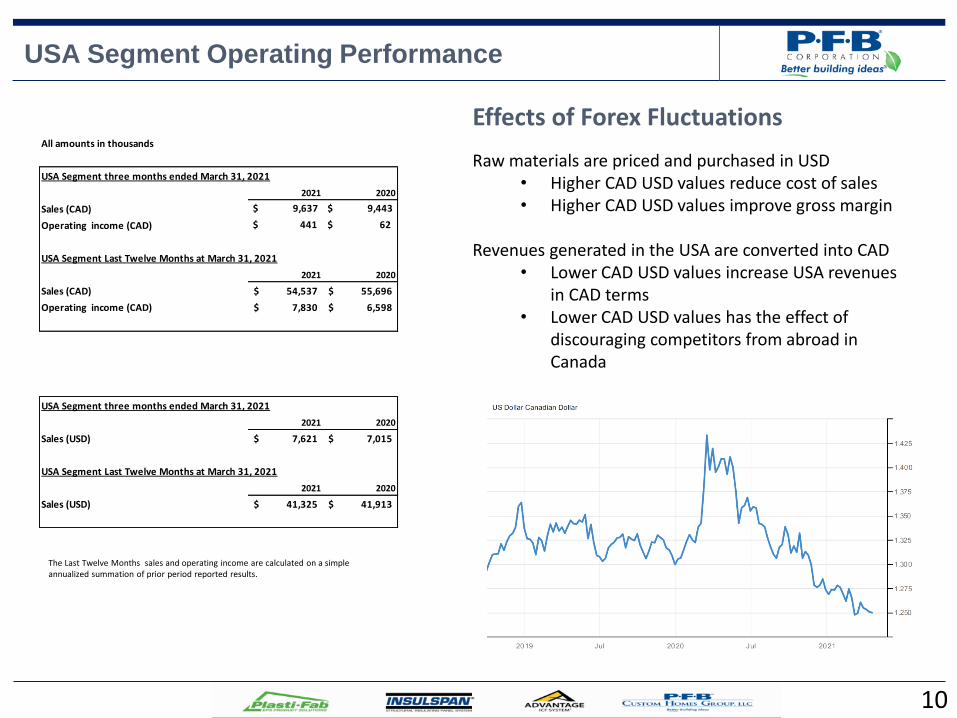
USA Segment Operating Performance
10
Effects of Forex Fluctuations
Raw materials are priced and purchased in USD • Higher CAD USD values reduce cost of sales • Higher CAD USD values improve gross margin
Revenues generated in the USA are converted into CAD
• Lower CAD USD values increase USA revenues in CAD terms
• Lower CAD USD values has the effect of discouraging competitors from abroad in Canada
The Last Twelve Months sales and operating income are calculated on a simple annualized summation of prior period reported results.
All amounts in thousands
USA Segment three months ended March 31, 2021
2021 2020
Sales (CAD) $ 9,637 $ 9,443
Operating income (CAD) $ 441 $ 62
USA Segment Last Twelve Months at March 31, 2021
2021 2020
Sales (CAD) 54,537$ 55,696$
Operating income (CAD) 7,830$ 6,598$
USA Segment three months ended March 31, 2021
2021 2020
Sales (USD) 7,621$ 7,015$
USA Segment Last Twelve Months at March 31, 2021
2021 2020
Sales (USD) 41,325$ 41,913$
11
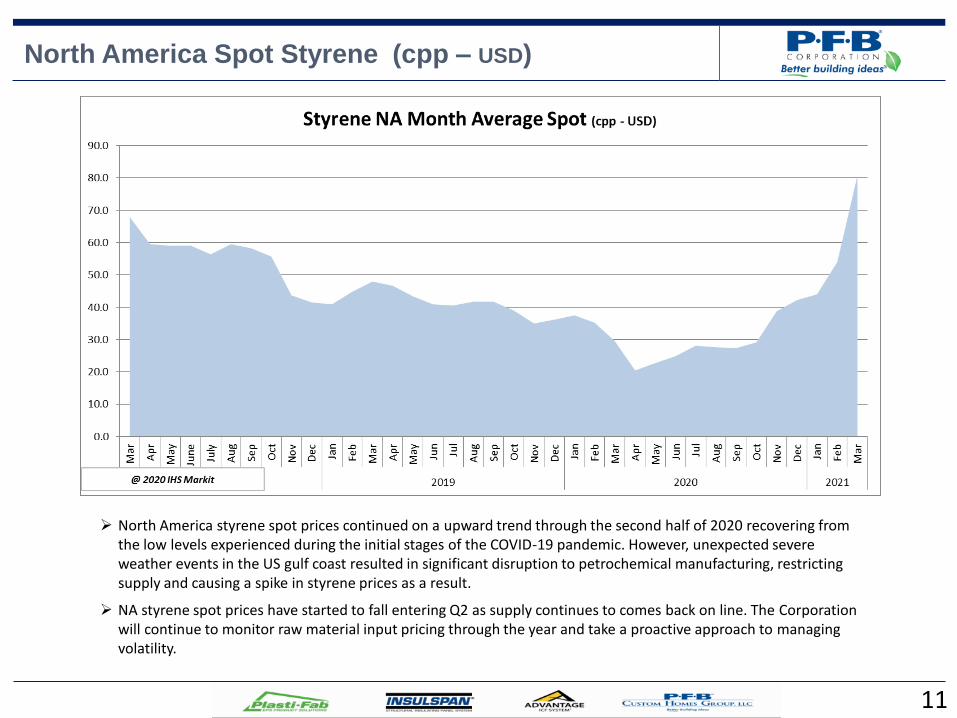
North America Spot Styrene (cpp – USD)
North America styrene spot prices continued on a upward trend through the second half of 2020 recovering from the low levels experienced during the initial stages of the COVID-19 pandemic. However, unexpected severe weather events in the US gulf coast resulted in significant disruption to petrochemical manufacturing, restricting supply and causing a spike in styrene prices as a result.
NA styrene spot prices have started to fall entering Q2 as supply continues to comes back on line. The Corporation will continue to monitor raw material input pricing through the year and take a proactive approach to managing volatility.
Trends & Influences on Q1 2021 Financial Results (All dollar amounts in thousands CAD unless otherwise noted)
12
Consolidated Sales
Sales were a record for a first quarter reporting period at $26,058 in Q1/21 compared with $24,233 in Q1/20, an increase of $1,825 or 7.5%.
Drivers of Q1 2021 results:
NA styrene average spot pricing trended upward during the fourth quarter of 2020 to levels more in line with those experienced in 2019. However, unexpected severe weather events in the US gulf coast during Q1/21 resulted in significant disruption to petrochemical manufacturing, restricting supply and causing a spike in styrene prices. The impact of rising raw material input costs was not a factor influencing gross margins in Q1/21. The Corporation has implemented price increases effective Q2/21 to reflect rising input costs and general inflationary trends.
As a result of improved operational efficiencies during Q1/21, gross margins improved to 25.8% of sales as compared to 23.7% of sales in Q1/20, an increase of 210 basis points.
Q1/21 net income was $1,654 compared with $346 for Q1/20, an increase of $1,308, driven by improved gross margins and reduced selling and administrative expenses.
Q1/21 adjusted EBITDA was a record for a first quarter at $3,383 compared to $1,909 for Q1/20, an increase of $1,474 or 77.2%.
Canadian Segment Sales
Q1/21 sales were $16,421 compared with $14,790 for Q1/20 an increase of $1,631 or 11.0%.
Canadian segment sales were led by strong performance in eastern Canada and supported by gains in the oil producing regions as well. Sales growth was driven by core EPS insulating and building products on increased commercial and residential construction activity. Order books continue to build entering Q2/21 aligned with increased construction activity as spring and summer months approach.
USA Segment Sales
Q1/21 sales were $9,637 compared with $9,443 in Q1/20, an increase of $194 or 2.1%.
In local USD terms Q1/21 revenue was $7,621 USD compared with $7,015 USD in Q1/20, an increase of $606 USD or 8.6%.
Sales of EPS insulating and building products , shipments of structurally insulated panels and custom home project based work all contributed to higher sales for the quarter in local USD terms. However the impact of a much stronger Canadian dollar against the US dollar over the comparable period of 2020 had a mitigating effect on sales. Order books and overall volume continue to build entering Q2/21 aligned with increased construction activity as spring and summer months approach.
Foreign Exchange Rates
The Canadian dollar strengthened significantly during Q1/21 as compared to Q1/20, having the effect of decreasing USA segment sales when consolidated and reported in Canadian dollars while at the same time decreasing the cost of raw materials which are priced in US dollars.
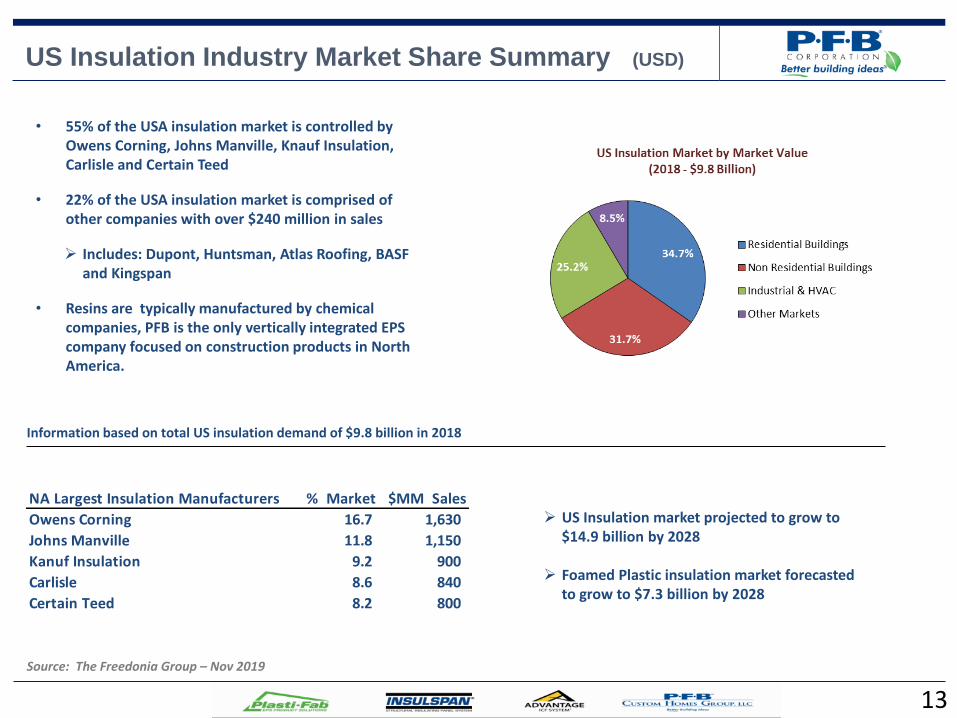
US Insulation Industry Market Share Summary (USD)
13
• 55% of the USA insulation market is controlled by Owens Corning, Johns Manville, Knauf Insulation, Carlisle and Certain Teed
• 22% of the USA insulation market is comprised of other companies with over $240 million in sales
Includes: Dupont, Huntsman, Atlas Roofing, BASF and Kingspan
• Resins are typically manufactured by chemical companies, PFB is the only vertically integrated EPS company focused on construction products in North America.
Source: The Freedonia Group – Nov 2019
US Insulation market projected to grow to $14.9 billion by 2028
Foamed Plastic insulation market forecasted
to grow to $7.3 billion by 2028
Information based on total US insulation demand of $9.8 billion in 2018
NA Largest Insulation Manufacturers % Market $MM Sales
Owens Corning 16.7 1,630
Johns Manville 11.8 1,150
Kanuf Insulation 9.2 900
Carlisle 8.6 840
Certain Teed 8.2 800
14
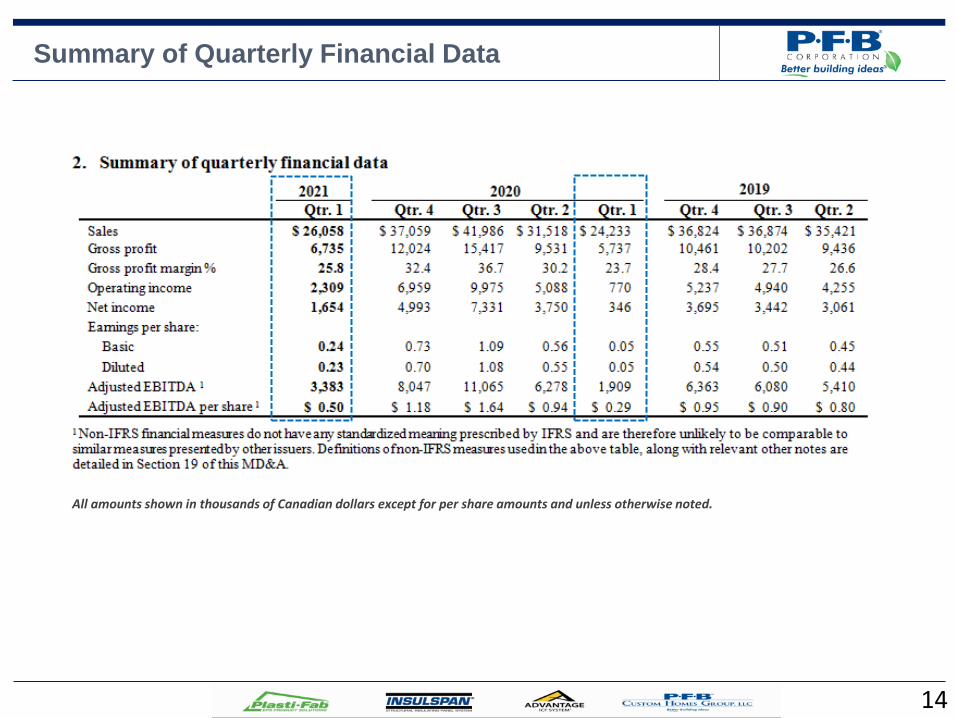
Summary of Quarterly Financial Data
All amounts shown in thousands of Canadian dollars except for per share amounts and unless otherwise noted.
15
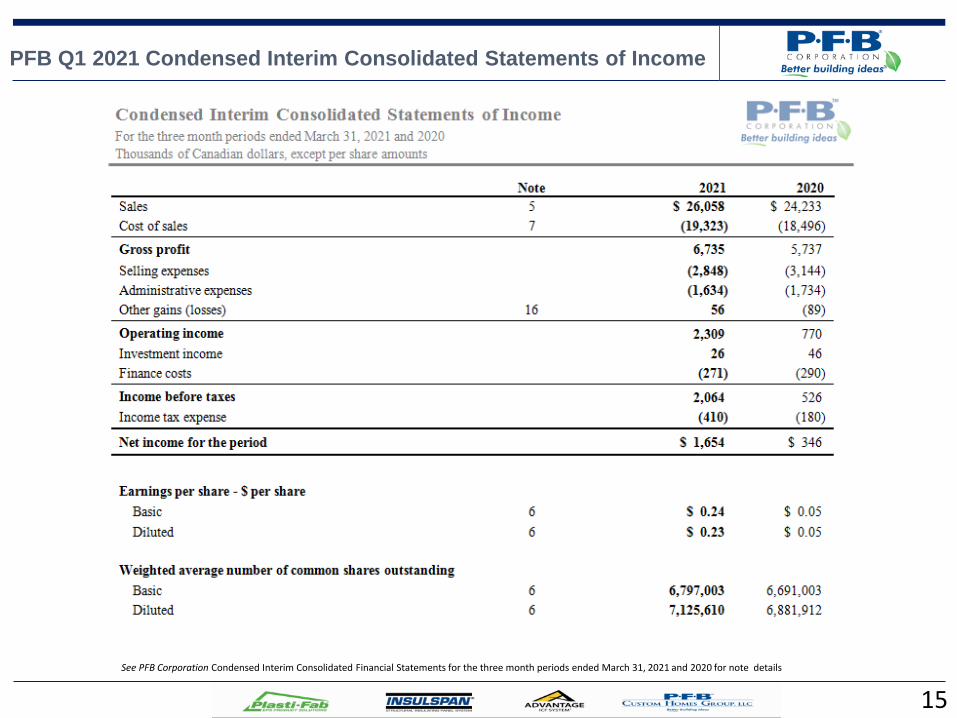
PFB Q1 2021 Condensed Interim Consolidated Statements of Income
See PFB Corporation Condensed Interim Consolidated Financial Statements for the three month periods ended March 31, 2021 and 2020 for note details
16
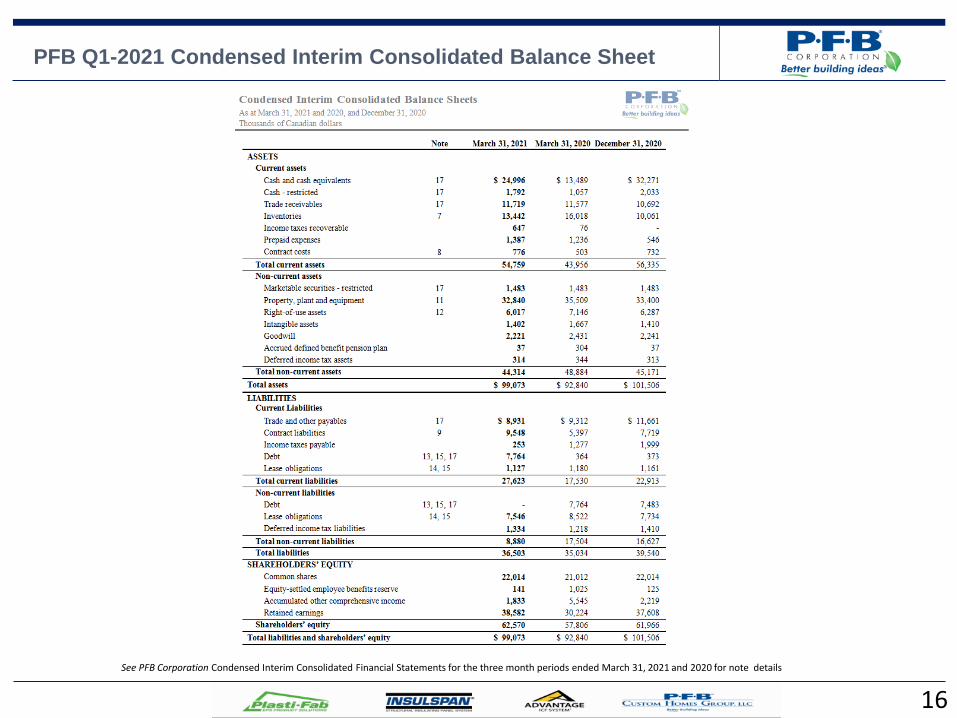
PFB Q1-2021 Condensed Interim Consolidated Balance Sheet
See PFB Corporation Condensed Interim Consolidated Financial Statements for the three month periods ended March 31, 2021 and 2020 for note details
17
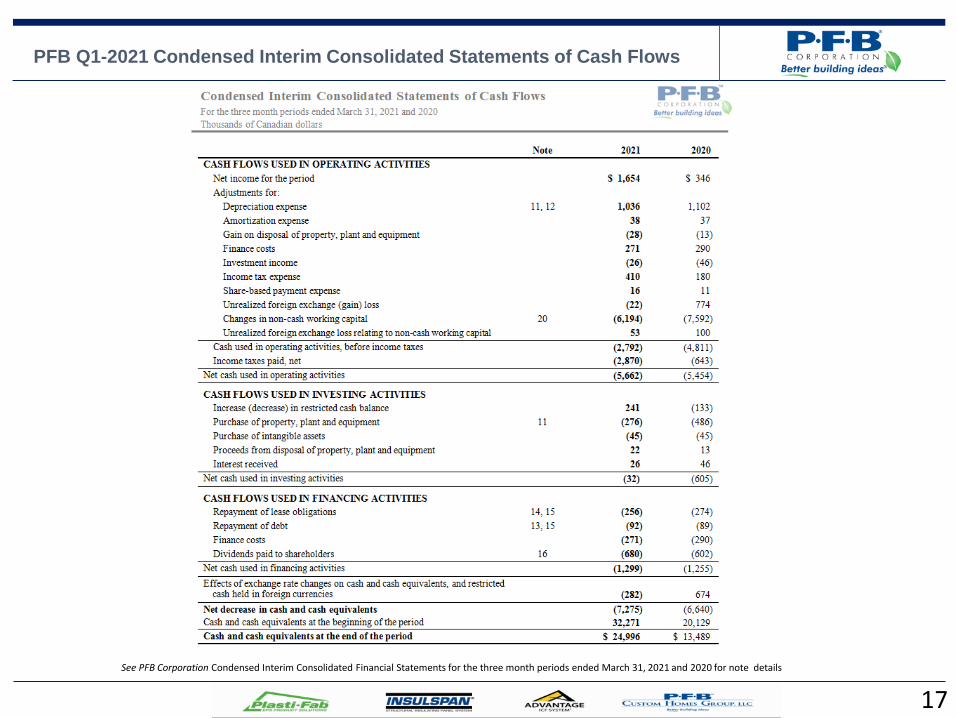
PFB Q1-2021 Condensed Interim Consolidated Statements of Cash Flows
See PFB Corporation Condensed Interim Consolidated Financial Statements for the three month periods ended March 31, 2021 and 2020 for note details
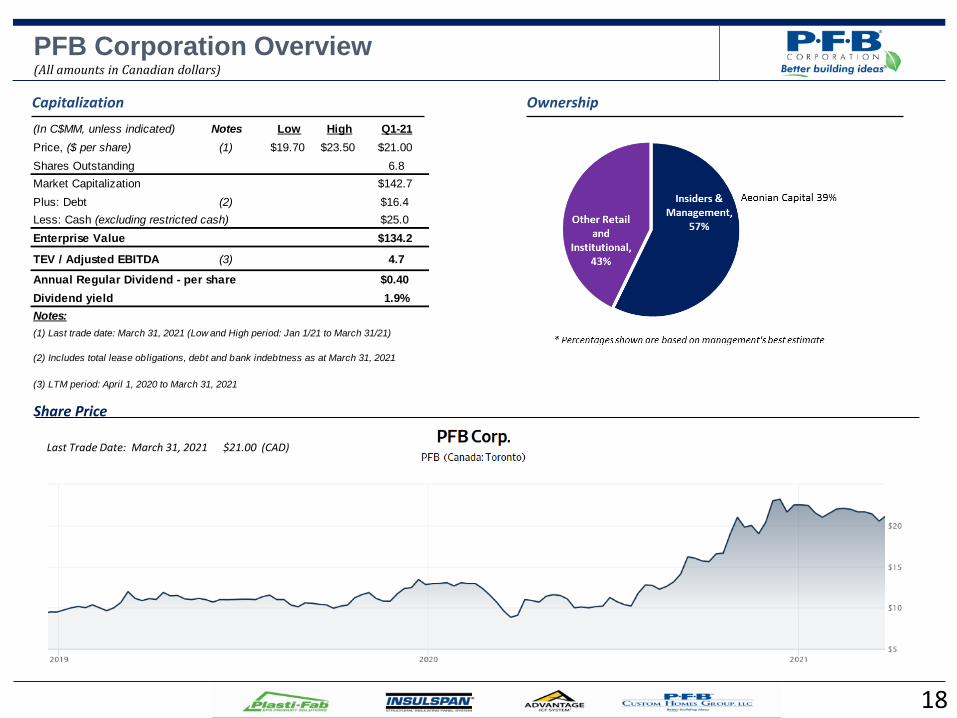
PFB Corporation Overview (All amounts in Canadian dollars)
18
Ownership
Share Price
Last Trade Date: March 31, 2021 $21.00 (CAD)
Capitalization
Jan 2020
(In C$MM, unless indicated) Notes Low High Q1-21
Price, ($ per share) (1) $19.70 $23.50 $21.00
Shares Outstanding 6.8
Market Capitalization $142.7
Plus: Debt (2) $16.4
$25.0
Enterprise Value $134.2
TEV / Adjusted EBITDA (3) 4.7
Annual Regular Dividend - per share $0.40
Dividend yield 1.9%
Notes:
(1) Last trade date: March 31, 2021 (Low and High period: Jan 1/21 to March 31/21)
(3) LTM period: April 1, 2020 to March 31, 2021
Less: Cash (excluding restricted cash)
(2) Includes total lease obligations, debt and bank indebtness as at March 31, 2021
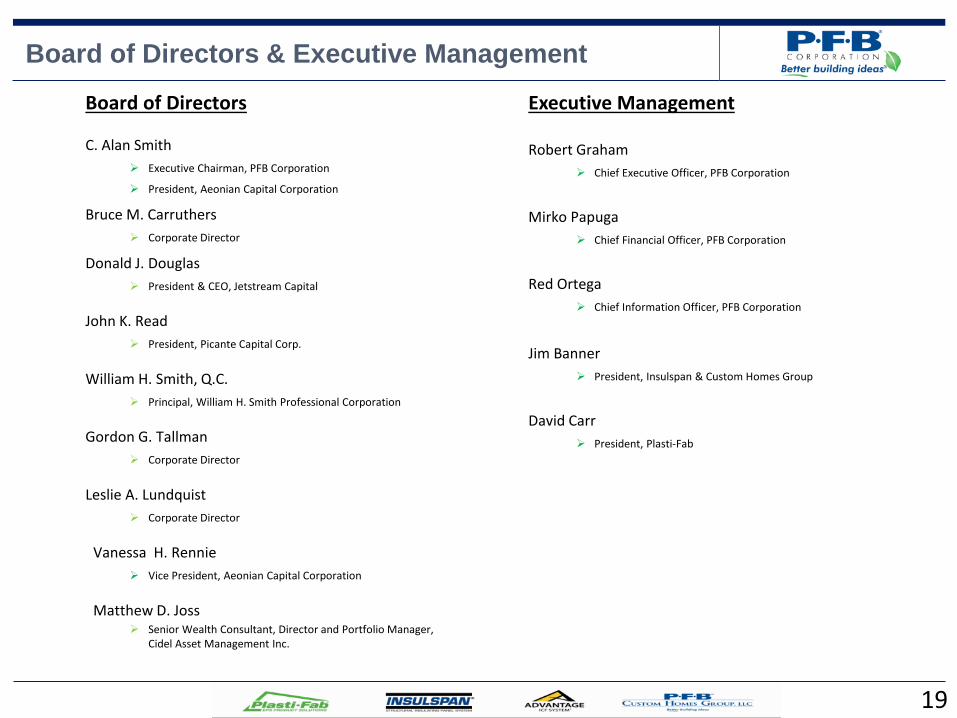
Board of Directors & Executive Management
Board of Directors
C. Alan Smith
Executive Chairman, PFB Corporation
President, Aeonian Capital Corporation
Bruce M. Carruthers
Corporate Director
Donald J. Douglas
President & CEO, Jetstream Capital
John K. Read
President, Picante Capital Corp.
William H. Smith, Q.C.
Principal, William H. Smith Professional Corporation
Gordon G. Tallman
Corporate Director
Leslie A. Lundquist
Corporate Director
Vanessa H. Rennie
Vice President, Aeonian Capital Corporation
Matthew D. Joss
Senior Wealth Consultant, Director and Portfolio Manager, Cidel Asset Management Inc.
19
Executive Management
Robert Graham
Chief Executive Officer, PFB Corporation
Mirko Papuga
Chief Financial Officer, PFB Corporation
Red Ortega
Chief Information Officer, PFB Corporation
Jim Banner
President, Insulspan & Custom Homes Group
David Carr
President, Plasti-Fab