Embed Size (px)
Citation preview

January 2016
Investor Presentation
SAFE HARBOR
2
This presentation includes forward-looking statements. Wayfair Inc. (“Wayfair” or the “Company”) has
based these forward-looking statements largely on its current expectations and projections about future
events and financial trends affecting its business. Forward-looking statements should not be read as
guarantees of future performance or results, and will not necessarily be accurate indications of the times at,
or by, which such performance or results will be achieved. Forward-looking statements are based on
information available at the date of this presentation and management’s good faith belief as of such date
with respect to future events, and are subject to risks and uncertainties that could cause actual
performance or results to differ materially from those expressed in or suggested by the forward-looking
statements. Important factors that could cause such differences include, but are not limited to: our ability to
acquire new customers, our ability to sustain and/or manage our growth, our ability to increase our net
revenue per active customer, our ability to build and maintain strong brands and other factors discussed
under “Risk Factors” and “Management’s Discussion and Analysis of Financial Condition and Results of
Operations” in periodic filings with the Securities and Exchange Commission (the “SEC”). In addition, in this
presentation, the words “believe,” “may,” “will,” “estimate,” “continue,” “anticipate,” “intend,” “expect,”
“predict,” “potential” and similar expressions, as they relate to the Company, business and management,
are intended to identify forward-looking statements. In light of these risks and uncertainties, the future
events and circumstances discussed in this presentation may not occur, and actual results could differ
materially from those anticipated or implied in the forward-looking statements. Forward-looking statements
speak only as of the date of this presentation. You should not put undue reliance on any forward-looking
statement. The Company assumes no obligation to update any forward-looking statements to reflect actual
results, changes in assumptions or changes in other factors affecting future performance or results, except
to the extent required by applicable laws. If the Company updates one or more forward-looking statements,
no inference should be drawn that it will make additional updates with respect to those or other forward-
looking statements.
OUR MISSION
3
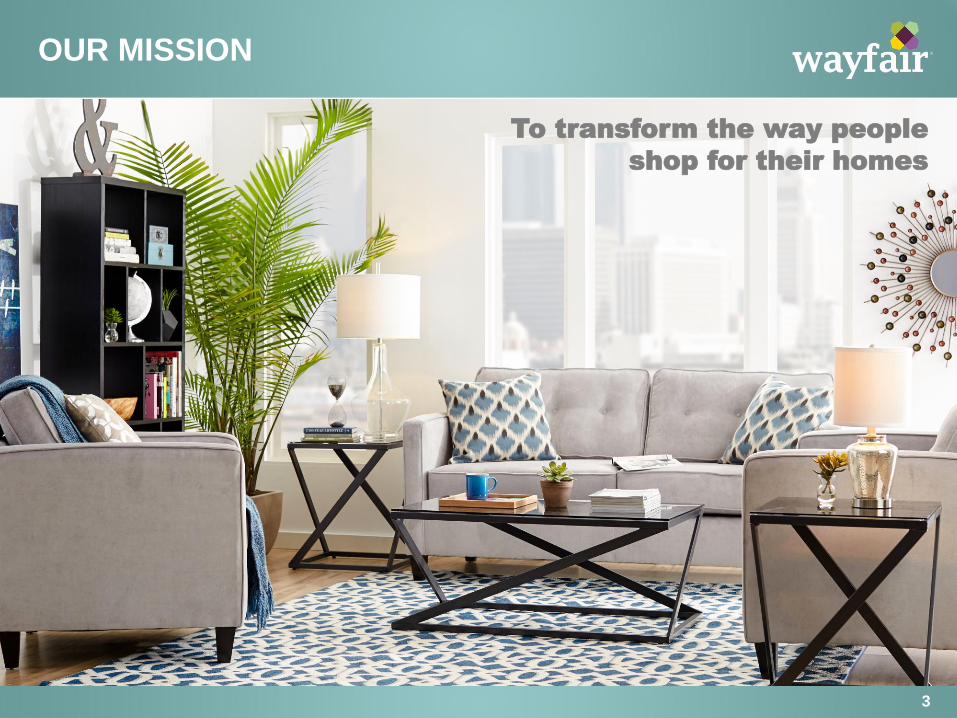
To transform the way people
shop for their homes
2002 2003 2004 2005 2006 2007 2008 2009 2010 2011 2012 2013 2014 LTM
A CLEAR ONLINE LEADER IN HOME GOODS
4
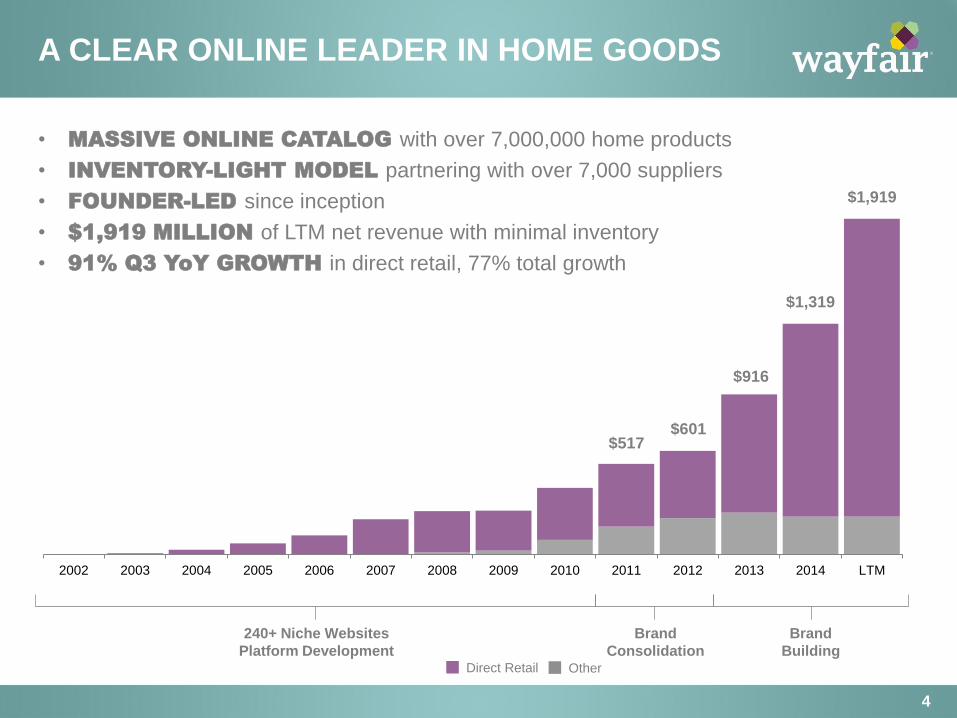
• MASSIVE ONLINE CATALOG with over 7,000,000 home products
• INVENTORY-LIGHT MODEL partnering with over 7,000 suppliers
• FOUNDER-LED since inception
• $1,919 MILLION of LTM net revenue with minimal inventory
• 91% Q3 YoY GROWTH in direct retail, 77% total growth
240+ Niche Websites
Platform Development
Brand
Consolidation
Brand
Building
$1,319
$916
$601 $517
Other Direct Retail
$1,919
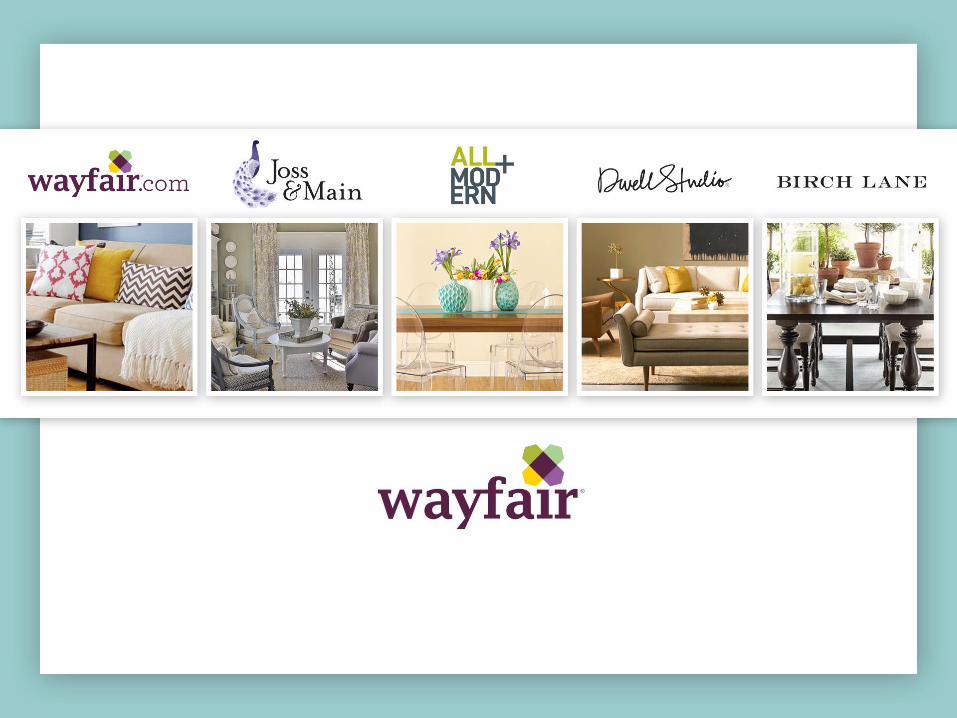
FIVE DISTINCT HOME BRANDS
5
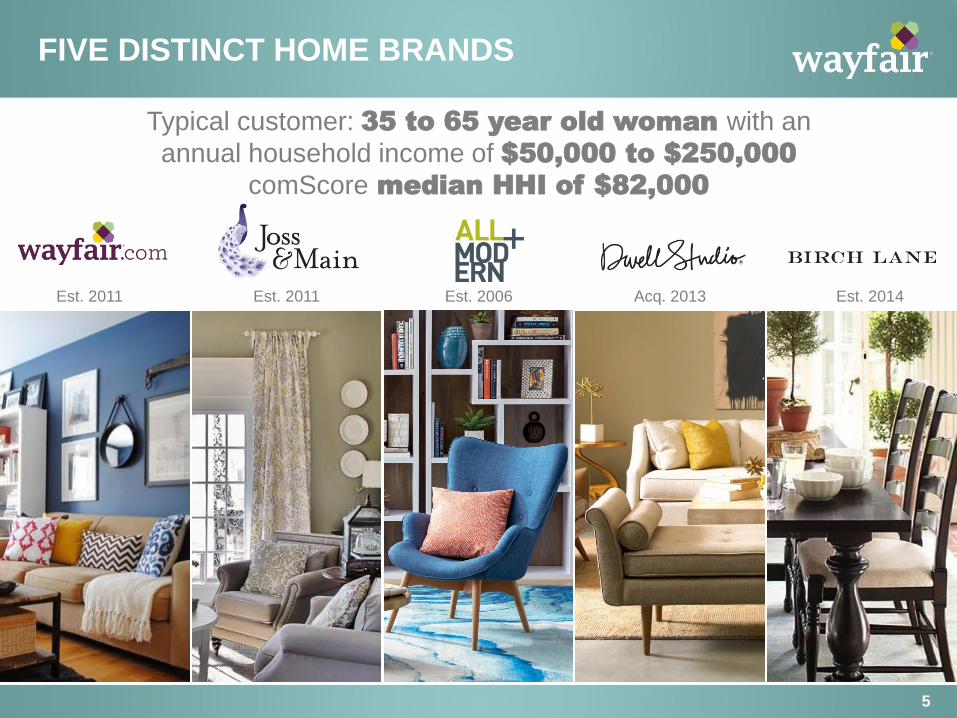
Typical customer: 35 to 65 year old woman with an
annual household income of $50,000 to $250,000
comScore median HHI of $82,000
Est. 2011 Est. 2011 Est. 2006 Est. 2014 Acq. 2013
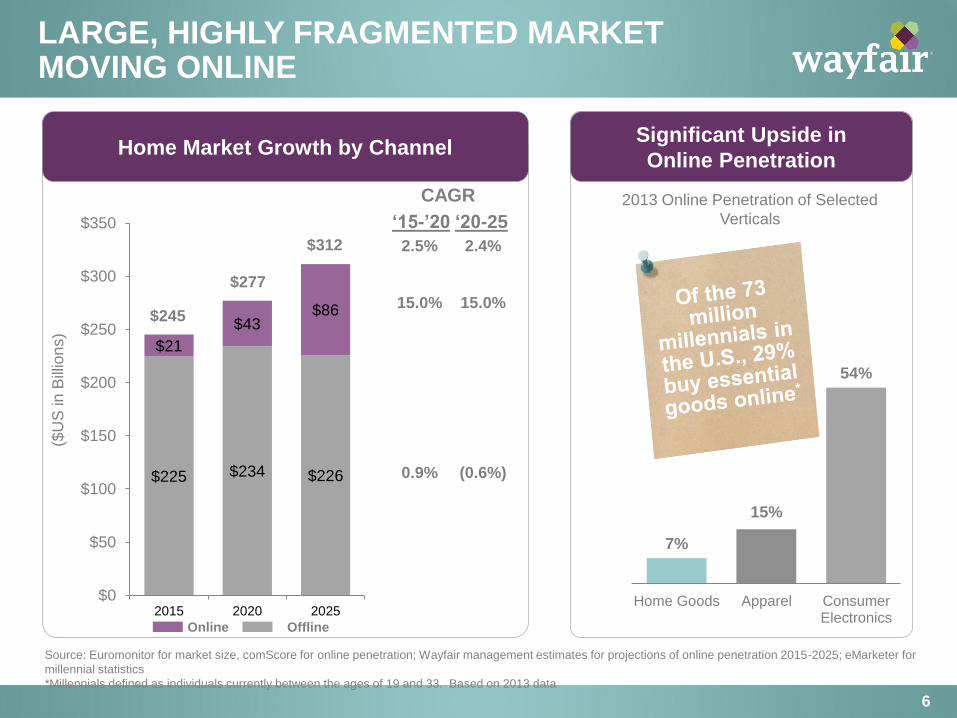
LARGE, HIGHLY FRAGMENTED MARKET MOVING ONLINE
6
Source: Euromonitor for market size, comScore for online penetration; Wayfair management estimates for projections of online penetration 2015-2025; eMarketer for
millennial statistics
*Millennials defined as individuals currently between the ages of 19 and 33. Based on 2013 data
7%
15%
54%
Home Goods Apparel ConsumerElectronics
Significant Upside in
Online Penetration
2013 Online Penetration of Selected
Verticals
Home Market Growth by Channel
15.0% 15.0%
(0.6%) 0.9%
91%
‘15-’20 ‘20-25
CAGR
2.5% 2.4%
$225 $234 $226
$21
$43 $86
$0
$50
$100
$150
$200
$250
$300
$350
2015 2020 2025
$277
$312
$245
($U
S in B
illio
ns)
Online Offline
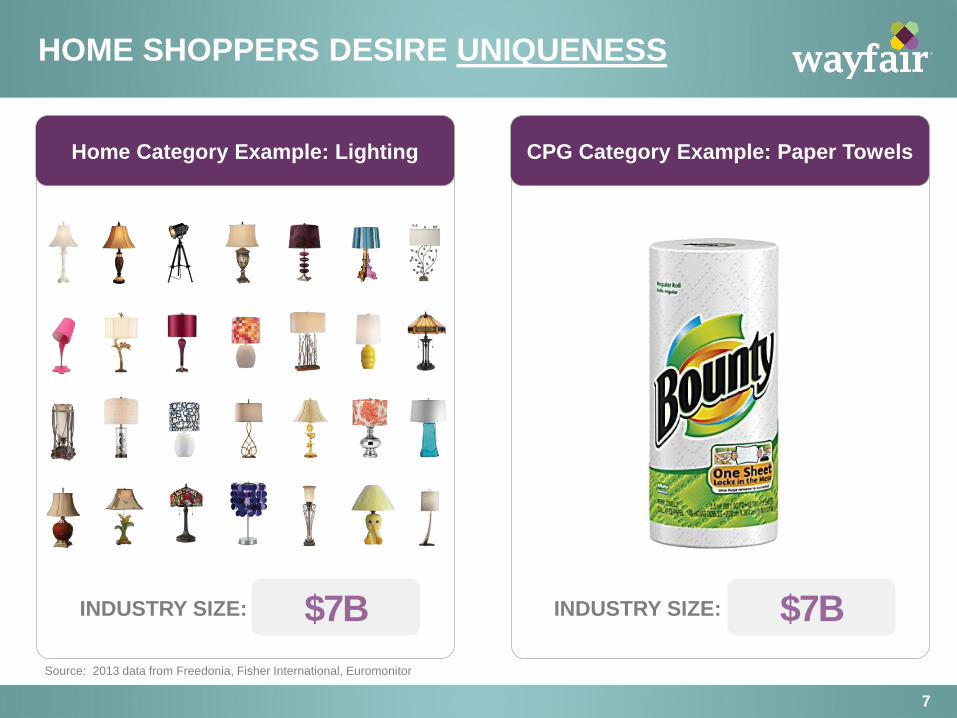
CPG Category Example: Paper Towels Home Category Example: Lighting
HOME SHOPPERS DESIRE UNIQUENESS
7
Source: 2013 data from Freedonia, Fisher International, Euromonitor
INDUSTRY SIZE: $7B INDUSTRY SIZE: $7B
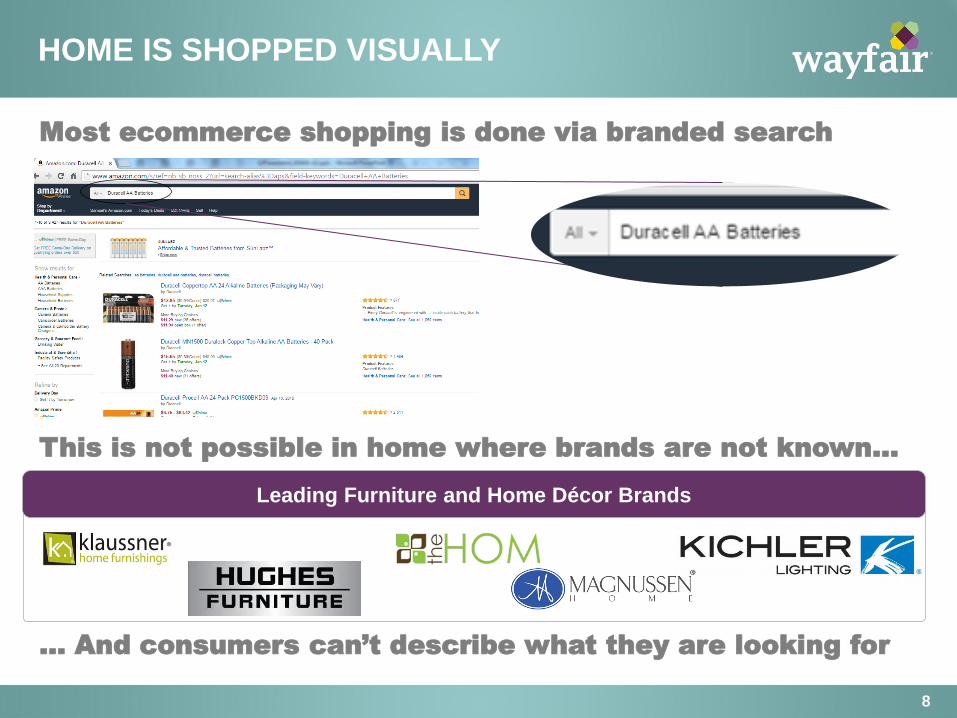
HOME IS SHOPPED VISUALLY
8
Most ecommerce shopping is done via branded search
This is not possible in home where brands are not known…
… And consumers can’t describe what they are looking for
Leading Furniture and Home Décor Brands
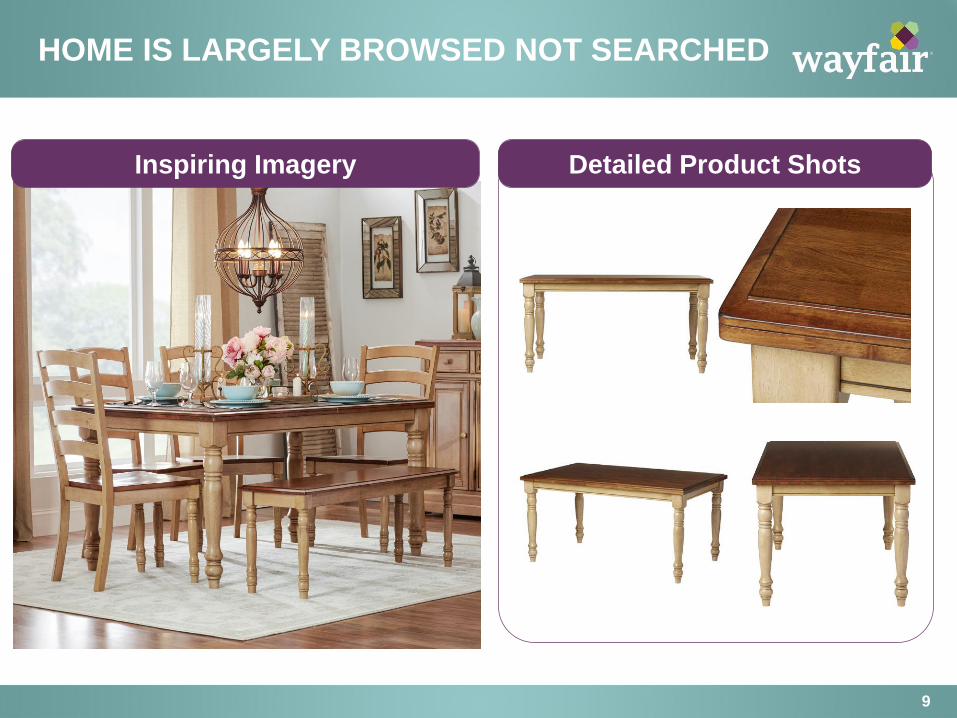
HOME IS LARGELY BROWSED NOT SEARCHED
9
Inspiring Imagery Detailed Product Shots
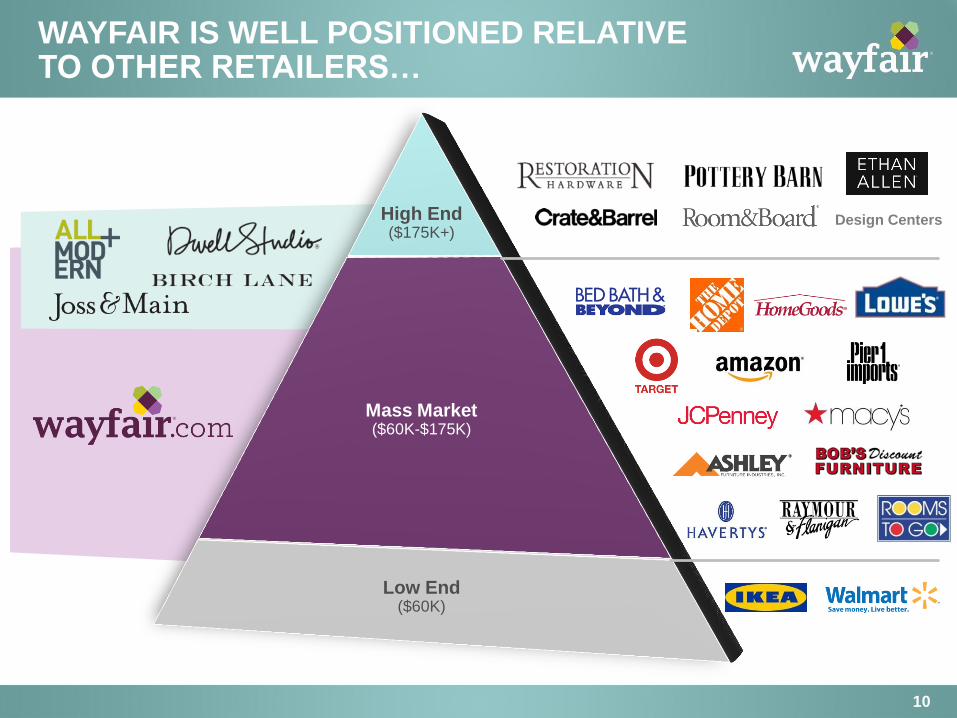
WAYFAIR IS WELL POSITIONED RELATIVE TO OTHER RETAILERS…
10
High End ($175K+)
Mass Market ($60K-$175K)
Low End ($60K)
Design Centers
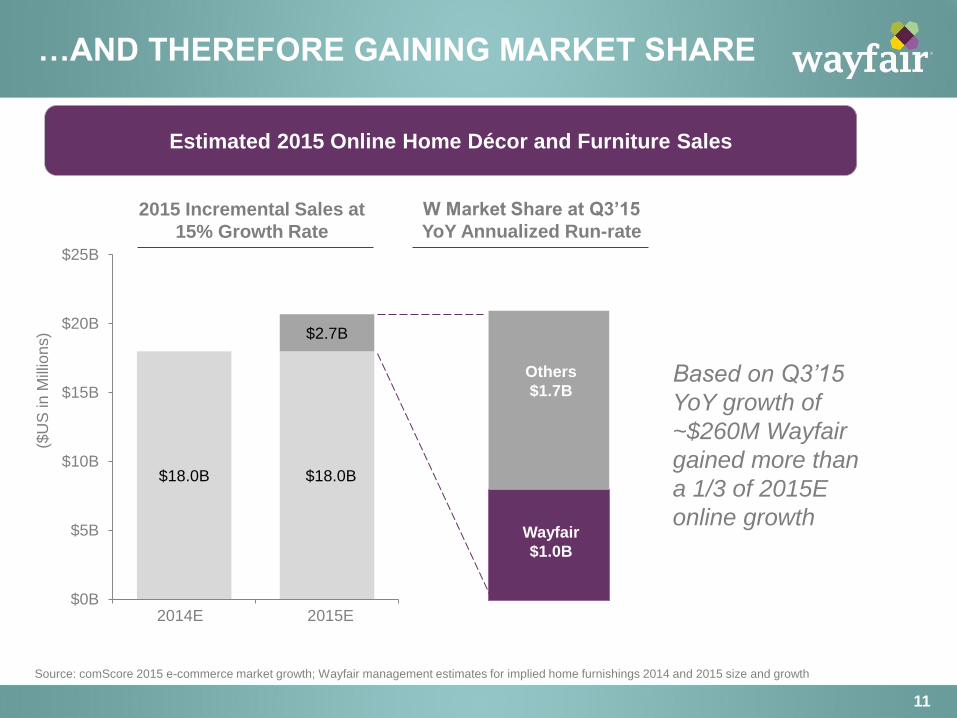
…AND THEREFORE GAINING MARKET SHARE
11
$18.0B $18.0B
$2.7B
$0B
$5B
$10B
$15B
$20B
$25B
1 22014E 2015E
($U
S in M
illio
ns)
Wayfair
$1.0B
Others
$1.7B
Estimated 2015 Online Home Décor and Furniture Sales
2015 Incremental Sales at
15% Growth Rate
W Market Share at Q3’15
YoY Annualized Run-rate
Based on Q3’15
YoY growth of
~$260M Wayfair
gained more than
a 1/3 of 2015E
online growth
Source: comScore 2015 e-commerce market growth; Wayfair management estimates for implied home furnishings 2014 and 2015 size and growth
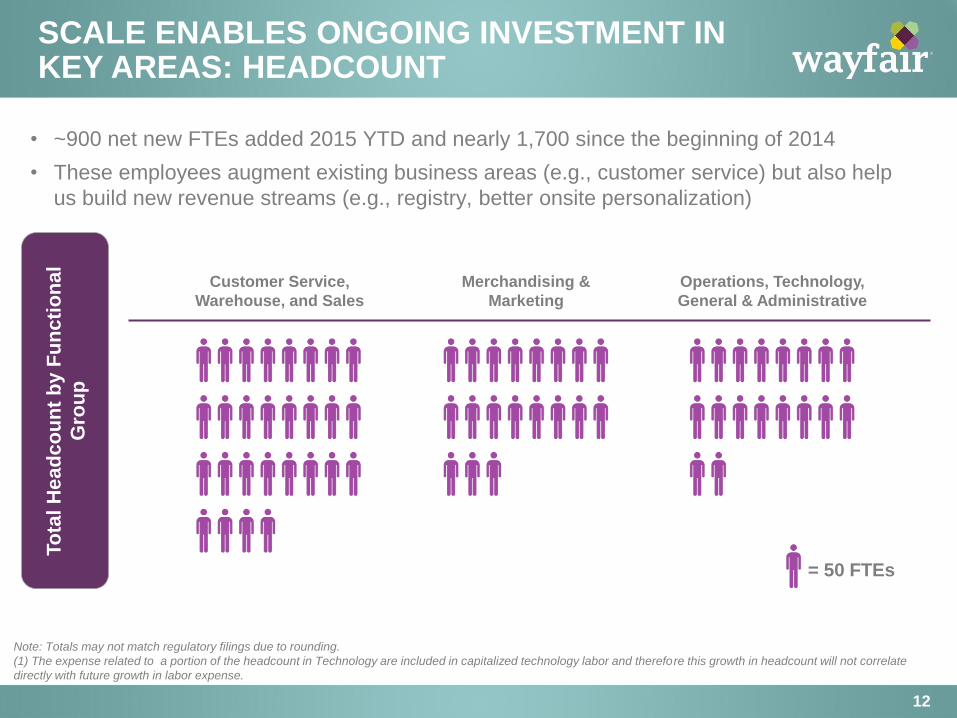
SCALE ENABLES ONGOING INVESTMENT IN KEY AREAS: HEADCOUNT
12
Customer Service,
Warehouse, and Sales
Merchandising &
Marketing
Operations, Technology,
General & Administrative
• ~900 net new FTEs added 2015 YTD and nearly 1,700 since the beginning of 2014
• These employees augment existing business areas (e.g., customer service) but also help
us build new revenue streams (e.g., registry, better onsite personalization)
Note: Totals may not match regulatory filings due to rounding.
(1) The expense related to a portion of the headcount in Technology are included in capitalized technology labor and therefore this growth in headcount will not correlate
directly with future growth in labor expense.
= 50 FTEs
To
tal
He
ad
co
un
t b
y F
un
cti
on
al
Gro
up
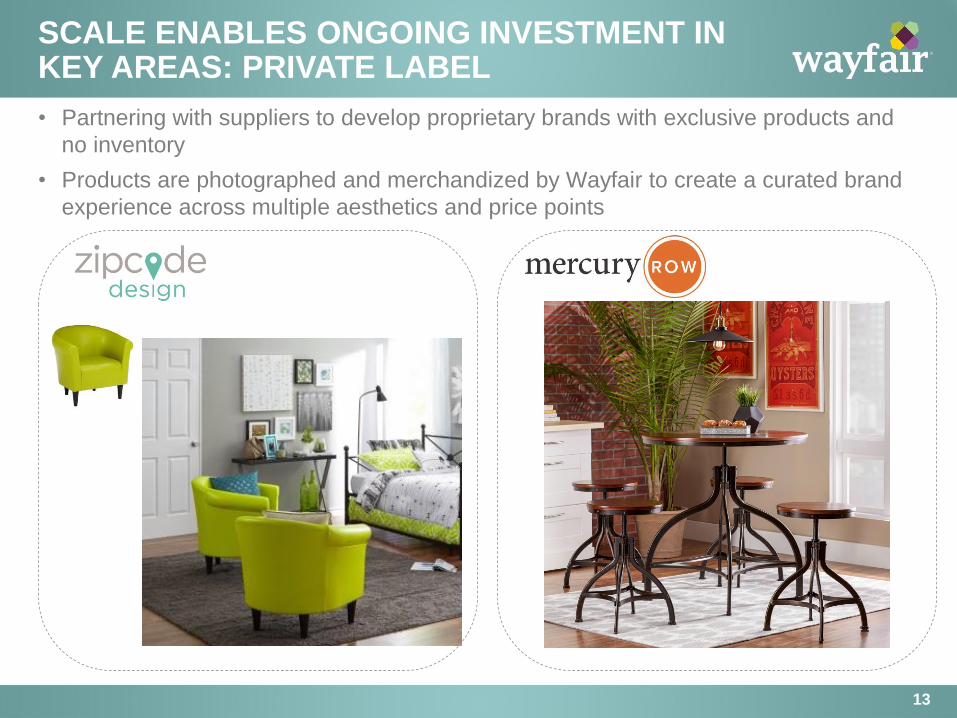
SCALE ENABLES ONGOING INVESTMENT IN KEY AREAS: PRIVATE LABEL
13
• Partnering with suppliers to develop proprietary brands with exclusive products and
no inventory
• Products are photographed and merchandized by Wayfair to create a curated brand
experience across multiple aesthetics and price points
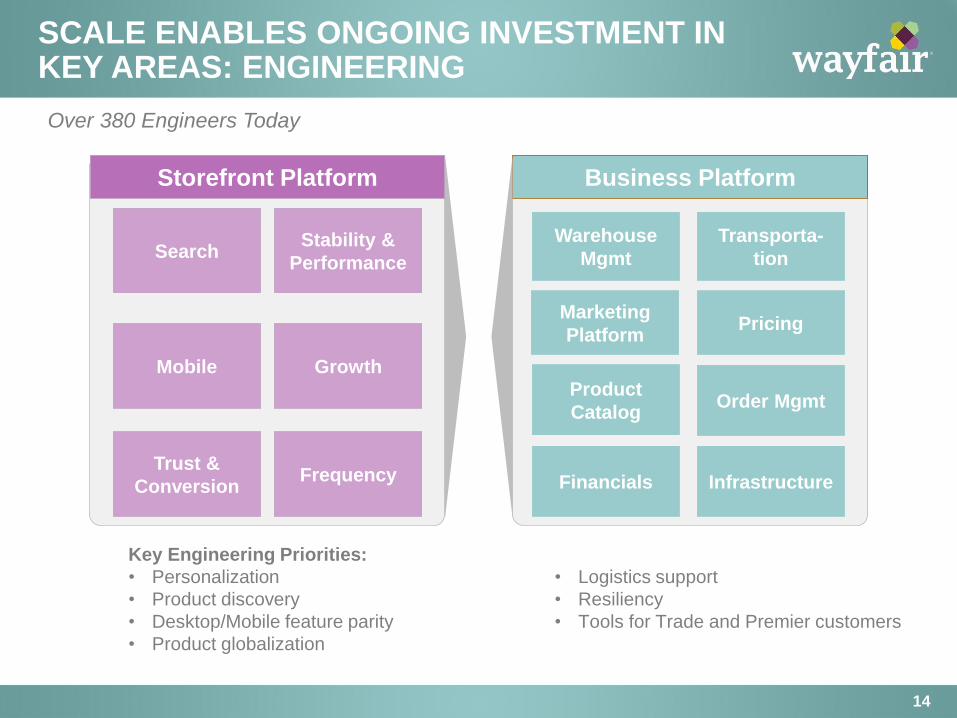
SCALE ENABLES ONGOING INVESTMENT IN KEY AREAS: ENGINEERING
14
Over 380 Engineers Today
Key Engineering Priorities:
• Personalization
• Product discovery
• Desktop/Mobile feature parity
• Product globalization
• Logistics support
• Resiliency
• Tools for Trade and Premier customers
Storefront Platform Business Platform
Search
Mobile
Trust &
Conversion
Stability &
Performance
Growth
Frequency Financials
Warehouse
Mgmt
Pricing
Infrastructure
Transporta-
tion
Product
CatalogOrder Mgmt
Marketing
Platform
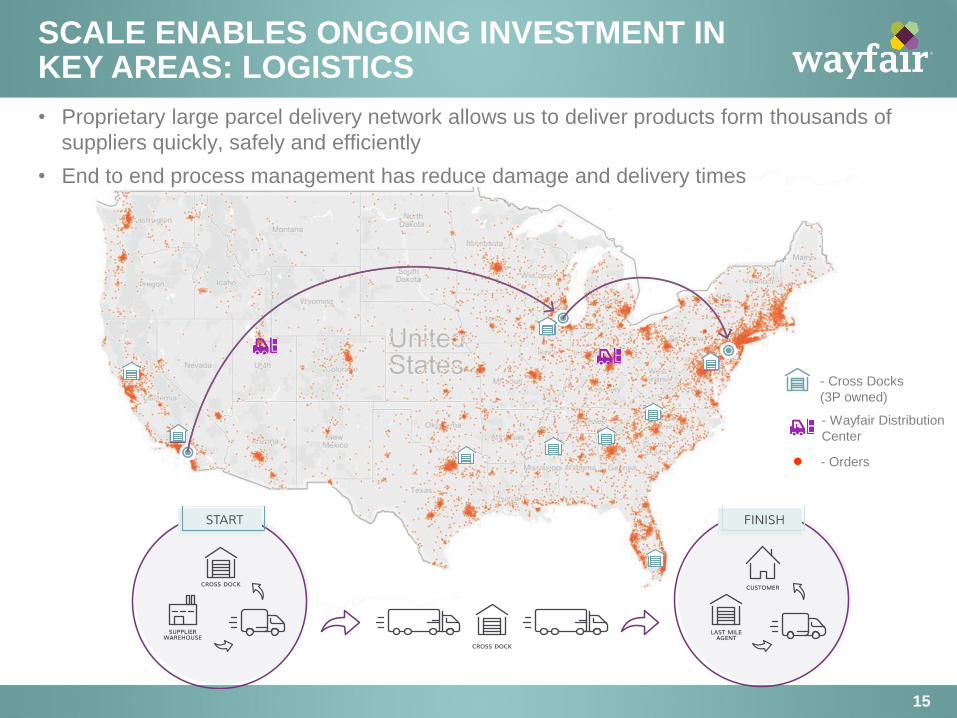
SCALE ENABLES ONGOING INVESTMENT IN KEY AREAS: LOGISTICS
15
- Cross Docks
(3P owned)
- Orders
- Wayfair Distribution
Center
• Proprietary large parcel delivery network allows us to deliver products form thousands of
suppliers quickly, safely and efficiently
• End to end process management has reduce damage and delivery times
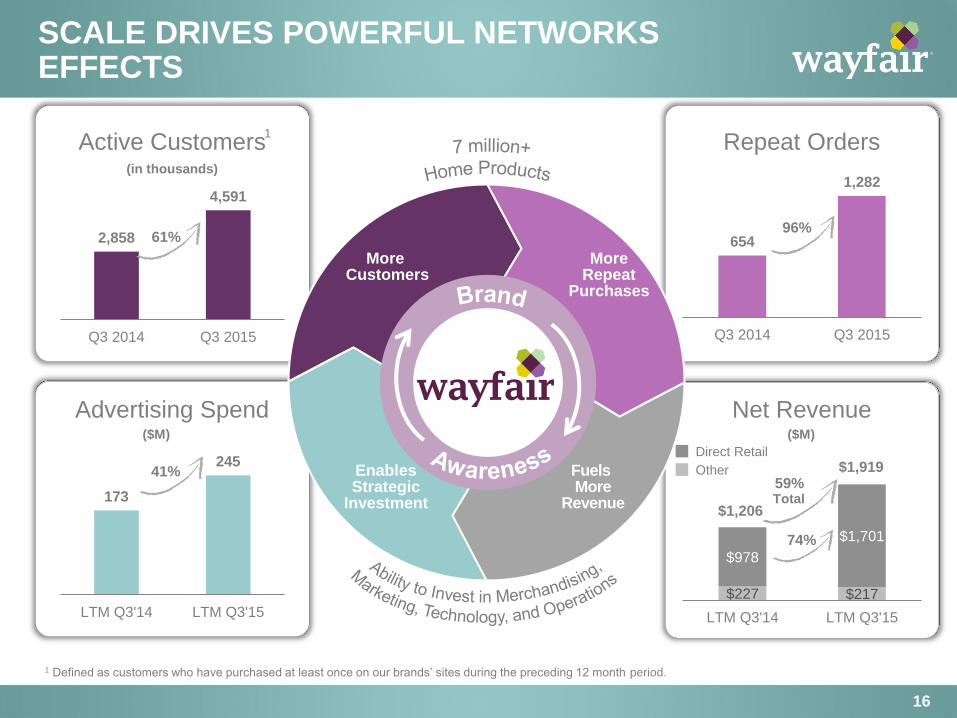
SCALE DRIVES POWERFUL NETWORKS EFFECTS
16
2,858
4,591
Q3 2014 Q3 2015
(in thousands)
Advertising Spend
173
245
LTM Q3'14 LTM Q3'15
654
1,282
Q3 2014 Q3 2015
Net Revenue
$227 $217
$978
$1,701
LTM Q3'14 LTM Q3'15
41%
74%
61%
1 Defined as customers who have purchased at least once on our brands’ sites during the preceding 12 month period.
Active Customers 1 Repeat Orders
59%
$1,206
$1,919 Direct Retail
Other
($M)
Total
Enables Strategic
Investment
Fuels More
Revenue
More Customers
More Repeat
Purchases
($M)
96%
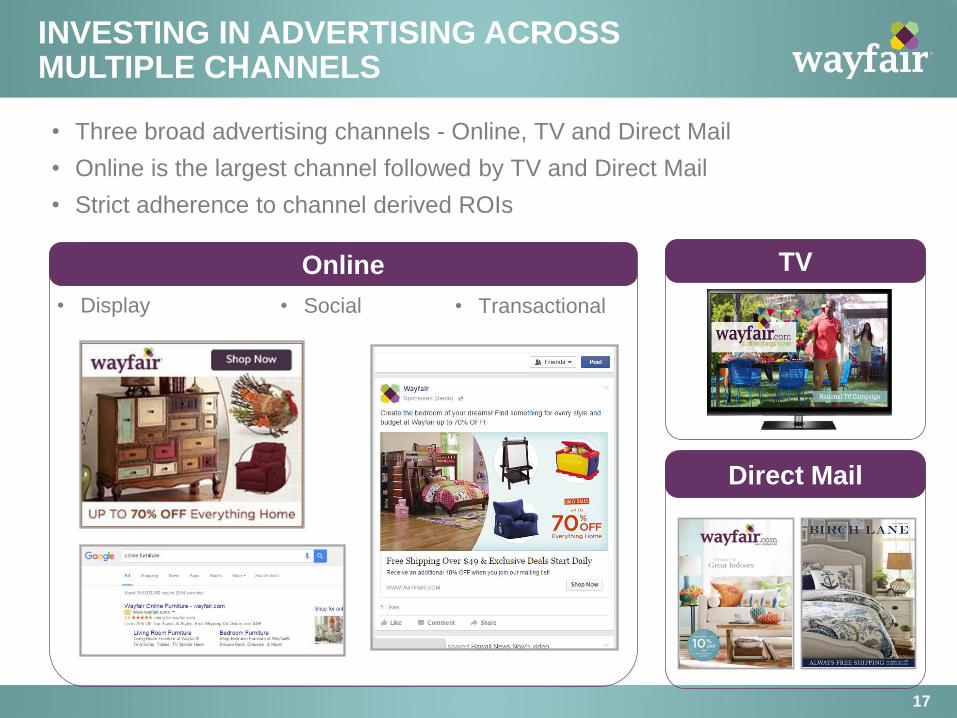
INVESTING IN ADVERTISING ACROSS MULTIPLE CHANNELS
17
• Three broad advertising channels - Online, TV and Direct Mail
• Online is the largest channel followed by TV and Direct Mail
• Strict adherence to channel derived ROIs
Online TV
Direct Mail
• Display
• Social • Transactional

Most 2011 and 2012 customers first purchased before site rebranding
Wayfair.com Gross Revenue Per Customer Per Month
INVESTMENT IN ADVERTISTING SPEND RESULTS IN HIGHER REVENUE/CUSTOMER…
18
Re
ve
nu
e/C
us
tom
er/
Mo
nth
(in
clu
de
s a
ll cu
sto
mers
)
Time Since Initial Purchase
x$
2x$
4x$
6x$
8x$
10x$
12x$
14x$
16x$
18x$
20x$
22x$
31-6
0 D
ays
61-9
0 D
ays
91-1
20
Days
121
-15
0 D
ays
151
-18
0 D
ays
181
-21
0 D
ays
211
-24
0 D
ays
241
-27
0 D
ays
271
-30
0 D
ays
301
-33
0 D
ays
331
-36
0 D
ays
361
-39
0 D
ays
391
-42
0 D
ays
421
-45
0 D
ays
451
-48
0 D
ays
481
-51
0 D
ays
511
-54
0 D
ays
541
-57
0 D
ays
571
-60
0 D
ays
601
-63
0 D
ays
631
-66
0 D
ays
661
-69
0 D
ays
691
-72
0 D
ays
721
- 7
50
Da
ys
751
- 7
80
Da
ys
781
- 8
10
Da
ys
811
- 8
40
Da
ys
841
- 8
70
Da
ys
871
- 9
00
Da
ys
901
- 9
30
Da
ys
931
- 9
60
Da
ys
961
- 9
90
Da
ys
991
- 1
02
0 D
ays
102
1 -
10
50 D
ays
105
1 -
10
80 D
ays
108
1 -
11
10 D
ays
111
1 -
11
40 D
ays
114
1 -
11
70 D
ays
117
1 -
12
00 D
ays
120
1 -
12
30 D
ays
123
1 -
12
60 D
ays
126
1 -
12
90 D
ays
129
1 -
13
20 D
ays
132
1 -
13
50 D
ays
135
1 -
13
80 D
ays
138
1 -
14
10 D
ays
141
1 -
14
40 D
ays
144
1 -
14
70 D
ays
147
1 -
15
00 D
ays
2011 2012 2013 2014 2015
• Customers acquired in more recent periods
consistently spend more over time than
customers acquired in older periods
• For example in the 6th month post their initial
order 2014 customers spent >2x 2011
customers
31-60
Days
151-180
Days
331-360
Days
511-540
Days
691-720
Days
871-900
Days
1,051-1,080
Days
1,231-1,260
Days
1,411-1,440
Days
2012 2013 2011
2014 2015
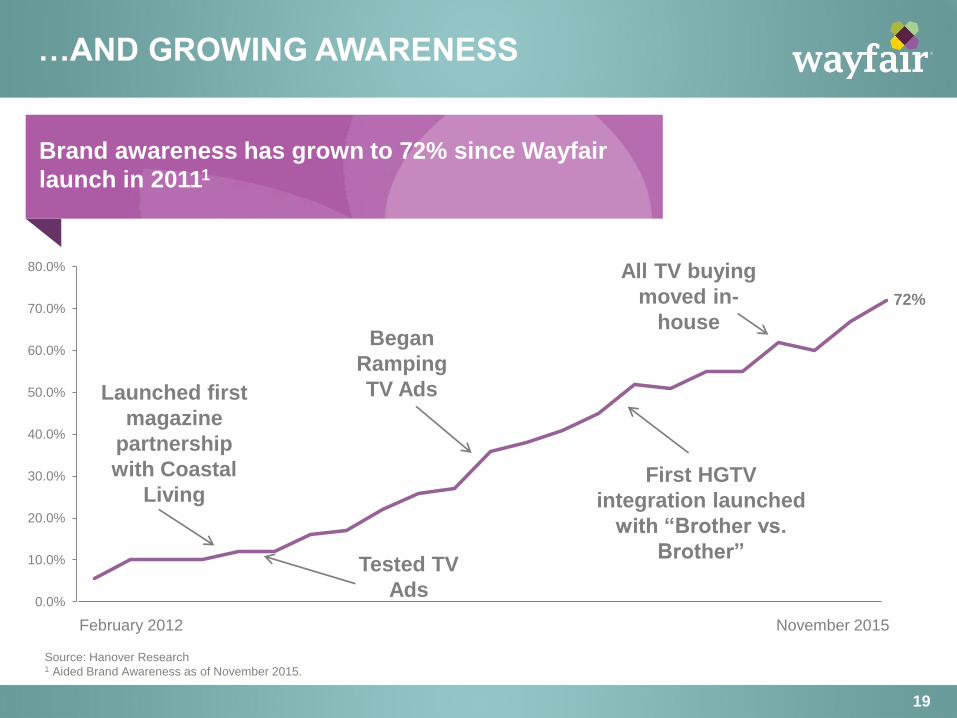
…AND GROWING AWARENESS
19
Source: Hanover Research
1 Aided Brand Awareness as of November 2015.
0.0%
10.0%
20.0%
30.0%
40.0%
50.0%
60.0%
70.0%
80.0%
Brand awareness has grown to 72% since Wayfair
launch in 20111
November 2015 February 2012
72%
Launched first
magazine
partnership
with Coastal
Living
All TV buying
moved in-
house
Tested TV
Ads
First HGTV
integration launched
with “Brother vs.
Brother”
Began
Ramping
TV Ads
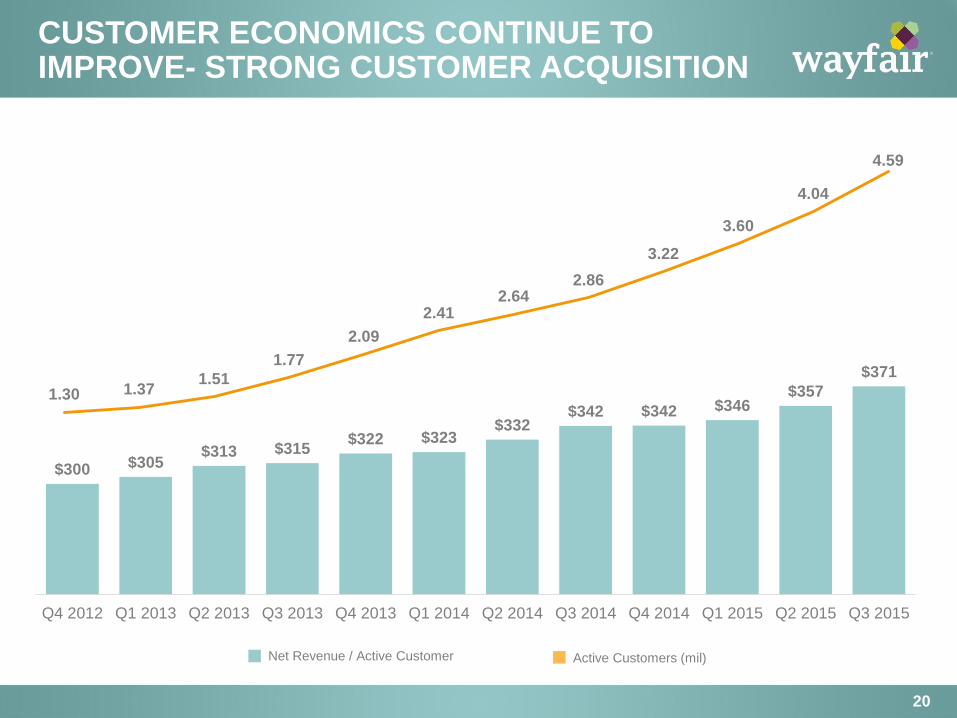
$300 $305 $313 $315
$322 $323 $332
$342 $342 $346 $357
$371
Q4 2012 Q1 2013 Q2 2013 Q3 2013 Q4 2013 Q1 2014 Q2 2014 Q3 2014 Q4 2014 Q1 2015 Q2 2015 Q3 2015
1.30 1.37 1.51
1.77
2.09
2.41 2.64
2.86
3.22
3.60
4.04
4.59
CUSTOMER ECONOMICS CONTINUE TO IMPROVE- STRONG CUSTOMER ACQUISITION
20
Net Revenue / Active Customer Active Customers (mil)
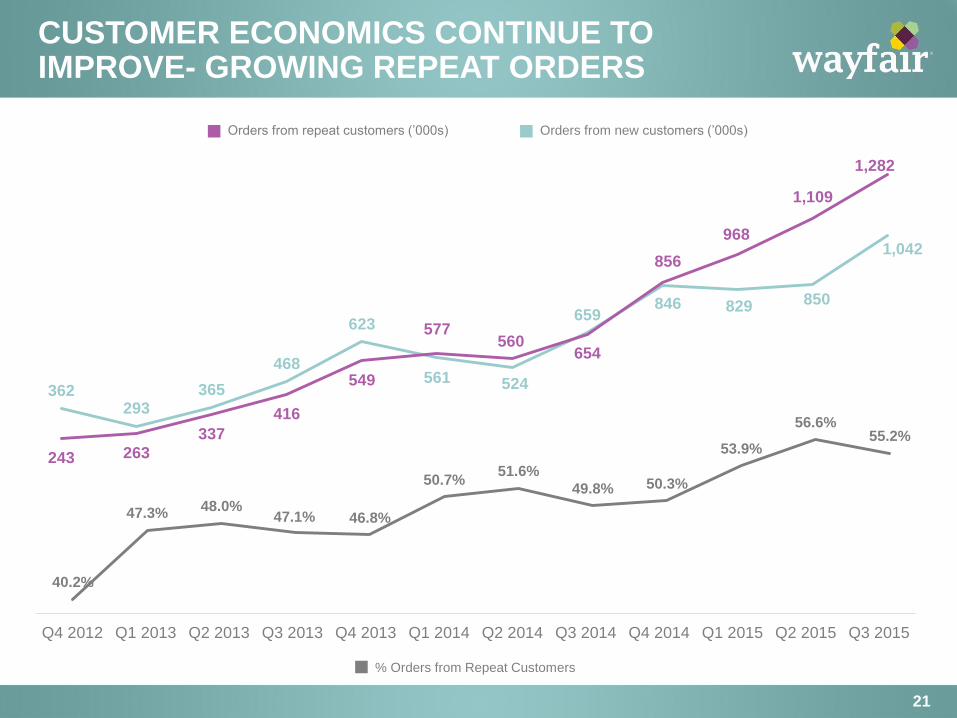
362 293
365
468
623
561 524
659 846 829 850
1,042
243 263
337
416
549
577 560
654
856
968
1,109
1,282
CUSTOMER ECONOMICS CONTINUE TO IMPROVE- GROWING REPEAT ORDERS
21
40.2%
47.3% 48.0% 47.1% 46.8%
50.7% 51.6%
49.8% 50.3%
53.9%
56.6% 55.2%
% Orders from Repeat Customers
Orders from repeat customers (’000s) Orders from new customers (’000s)
Q4 2012 Q1 2013 Q2 2013 Q3 2013 Q4 2013 Q1 2014 Q2 2014 Q3 2014 Q4 2014 Q1 2015 Q2 2015 Q3 2015

CAPITAL EFFICIENT WITH MINIMAL INVENTORY
22
Capital Efficient1 Minimal Inventory
1.5
38.5
Days Receivable Days Payable
$916
$1,319
$1,991
$15 $20 $23
2013 2014 LTM
Net Revenue Inventory
($M)
FCF Performance Consistently Better than Adjusted EBITDA
1 Average of last four quarters.
Q1 2014
Long-Term Target
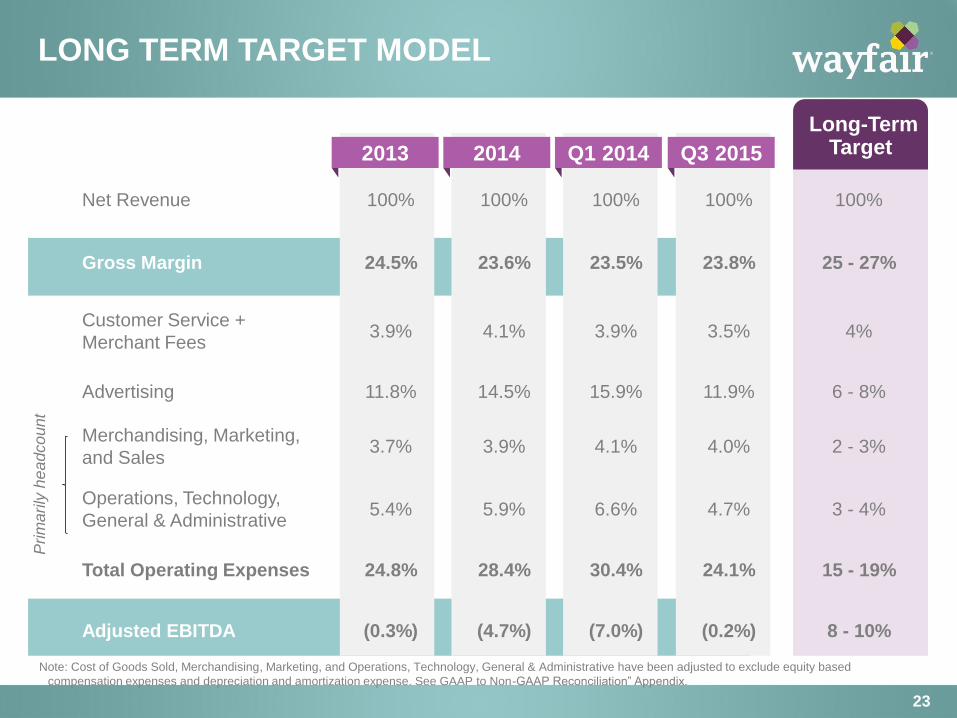
LONG TERM TARGET MODEL
23
Net Revenue 100% 100% 100% 100% 100%
Gross Margin 24.5% 23.6% 23.5% 23.8% 25 - 27%
Customer Service +
Merchant Fees 3.9% 4.1% 3.9% 3.5% 4%
Advertising 11.8% 14.5% 15.9% 11.9% 6 - 8%
Merchandising, Marketing,
and Sales 3.7% 3.9% 4.1% 4.0% 2 - 3%
Operations, Technology,
General & Administrative 5.4% 5.9% 6.6% 4.7% 3 - 4%
Total Operating Expenses 24.8% 28.4% 30.4% 24.1% 15 - 19%
Adjusted EBITDA (0.3%) (4.7%) (7.0%) (0.2%) 8 - 10%
Note: Cost of Goods Sold, Merchandising, Marketing, and Operations, Technology, General & Administrative have been adjusted to exclude equity based
compensation expenses and depreciation and amortization expense. See GAAP to Non-GAAP Reconciliation” Appendix.
Prim
arily
he
adco
unt
2013 2014 Q3 2015
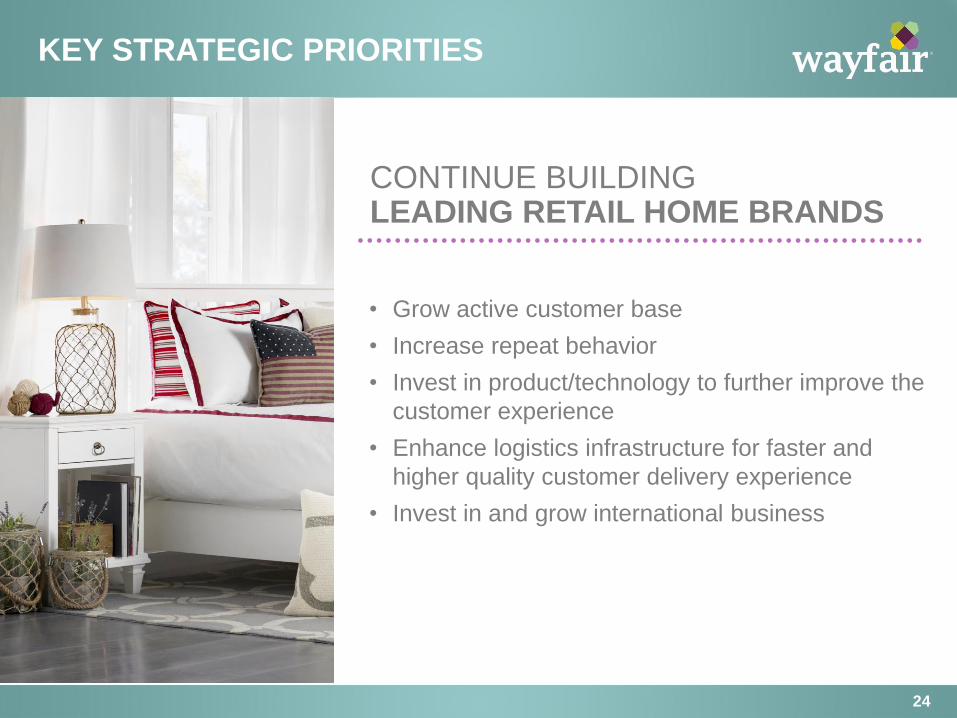
CONTINUE BUILDING LEADING RETAIL HOME BRANDS
• Grow active customer base
• Increase repeat behavior
• Invest in product/technology to further improve the
customer experience
• Enhance logistics infrastructure for faster and
higher quality customer delivery experience
• Invest in and grow international business
KEY STRATEGIC PRIORITIES
24
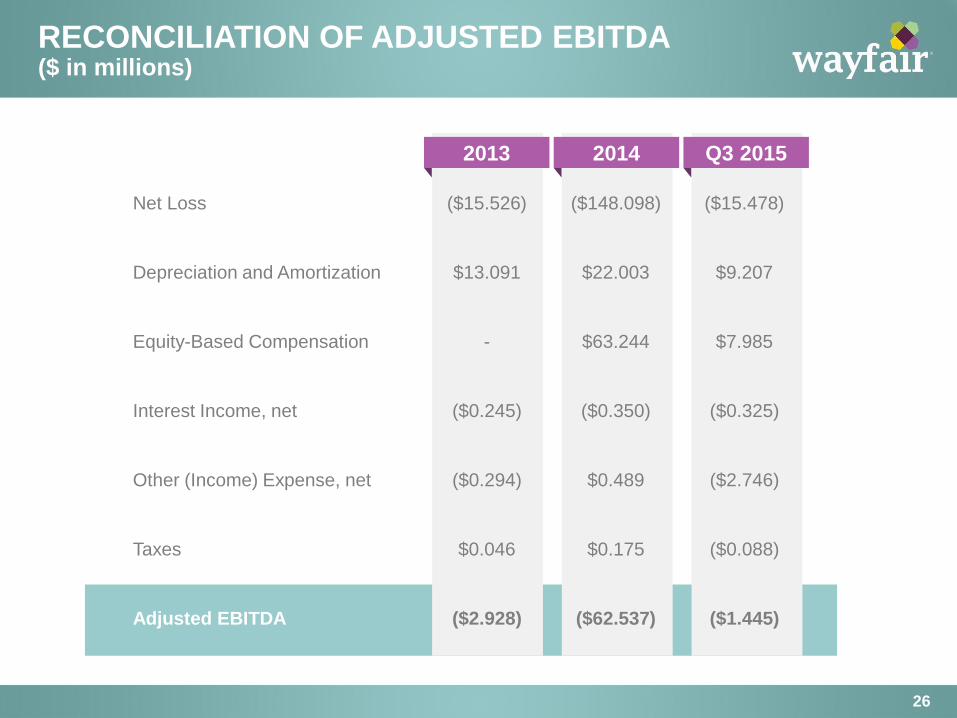
RECONCILIATION OF ADJUSTED EBITDA ($ in millions)
26
Net Loss ($15.526) ($148.098) ($15.478)
Depreciation and Amortization $13.091 $22.003 $9.207
Equity-Based Compensation - $63.244 $7.985
Interest Income, net ($0.245) ($0.350) ($0.325)
Other (Income) Expense, net ($0.294) $0.489 ($2.746)
Taxes $0.046 $0.175 ($0.088)
Adjusted EBITDA ($2.928) ($62.537) ($1.445)
2013 2014 Q3 2015

RECONCILIATION OF FREE CASH FLOW ($ in millions)
27
Net Cash Provided by Operating
Activities, Net of Acquisition $34.413 $11.692 $51.504
Purchase of Property, Equipment and
Leasehold Improvements ($6.739) ($39.422) ($11.491)
Site and Software Development Costs ($9.040) ($14.130) ($4.681)
Free Cash Flow $18.634 ($41.860) $35.332
2013 2014 Q3 2015
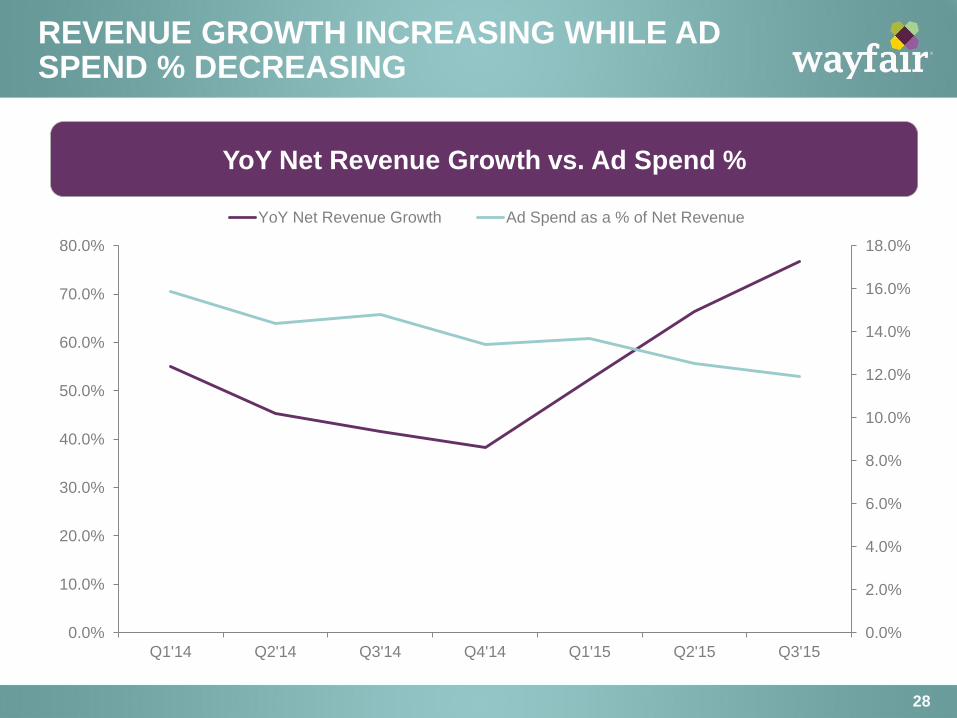
REVENUE GROWTH INCREASING WHILE AD SPEND % DECREASING
28
0.0%
2.0%
4.0%
6.0%
8.0%
10.0%
12.0%
14.0%
16.0%
18.0%
0.0%
10.0%
20.0%
30.0%
40.0%
50.0%
60.0%
70.0%
80.0%
Q1'14 Q2'14 Q3'14 Q4'14 Q1'15 Q2'15 Q3'15
YoY Net Revenue Growth Ad Spend as a % of Net Revenue
YoY Net Revenue Growth vs. Ad Spend %
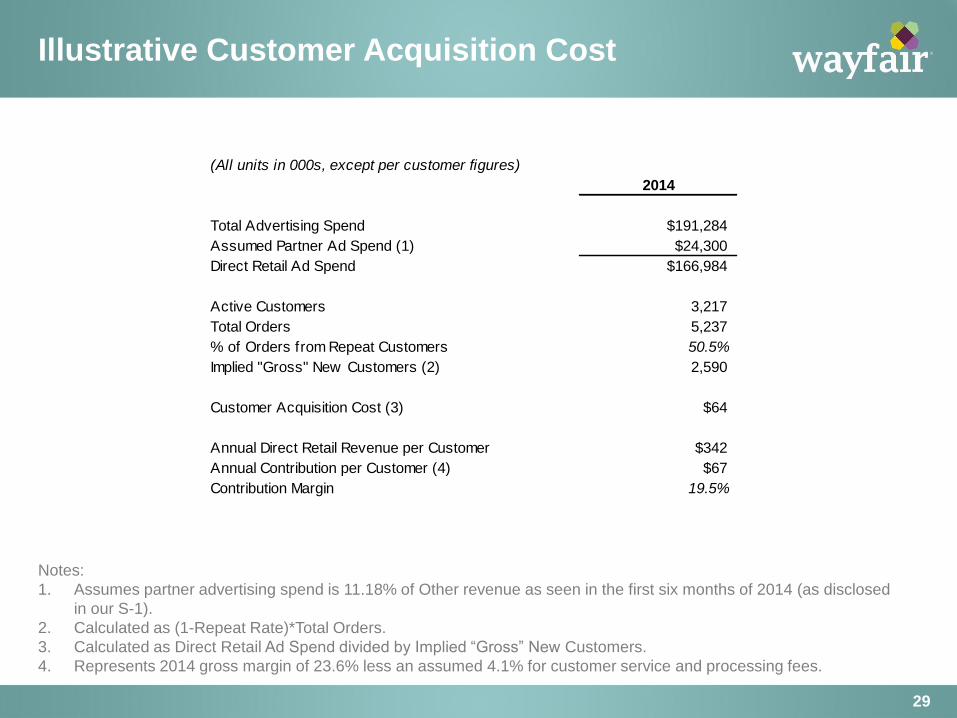
Illustrative Customer Acquisition Cost
29
Notes:
1. Assumes partner advertising spend is 11.18% of Other revenue as seen in the first six months of 2014 (as disclosed
in our S-1).
2. Calculated as (1-Repeat Rate)*Total Orders.
3. Calculated as Direct Retail Ad Spend divided by Implied “Gross” New Customers.
4. Represents 2014 gross margin of 23.6% less an assumed 4.1% for customer service and processing fees.
(All units in 000s, except per customer figures)
2014
Total Advertising Spend $191,284
Assumed Partner Ad Spend (1) $24,300
Direct Retail Ad Spend $166,984
Active Customers 3,217
Total Orders 5,237
% of Orders from Repeat Customers 50.5%
Implied "Gross" New Customers (2) 2,590
Customer Acquisition Cost (3) $64
Annual Direct Retail Revenue per Customer $342
Annual Contribution per Customer (4) $67
Contribution Margin 19.5%