Embed Size (px)
Citation preview

InvistaFoundationProperty TrustLimitedInterim Report for six months ended 30 September 2009

01 Company Summary02 Financial Summary03 Chairman’s Statement06 Investment Manager’s Report14 Statement of Directors’ Responsibilities15 Condensed Statement of Comprehensive Income16 Condensed Balance Sheet17 Condensed Statement of Changes in Equity18 Condensed Statement of Cash Flows19 Notes to the Interim Report24 Independent Auditors’ Review Report25 Corporate Information26 Important Information
www.ifpt.co.uk
Invista Foundation Property Trust Limited Interim Report 2009 01
Company Summary
Invista Foundation Property Trust Limited aims to provideShareholders with an attractive level of income together with thepotential for income and capital growth from investing in UKcommercial property.
Invista Foundation Property Trust Limited and its subsidiaries (the“Company”/the “Group”) hold a diversified portfolio of UK commercialproperties, which is mainly invested in three commercial propertysectors: office, retail and industrial. The Group may also invest inother sectors from time to time. The Group will not invest in otherlisted investment companies. In pursuing the investment objective,the Investment Manager concentrates on assets with good fundamentalcharacteristics, a diverse spread of occupational tenants and withopportunities to enhance value through active management.
02
Financial Summary
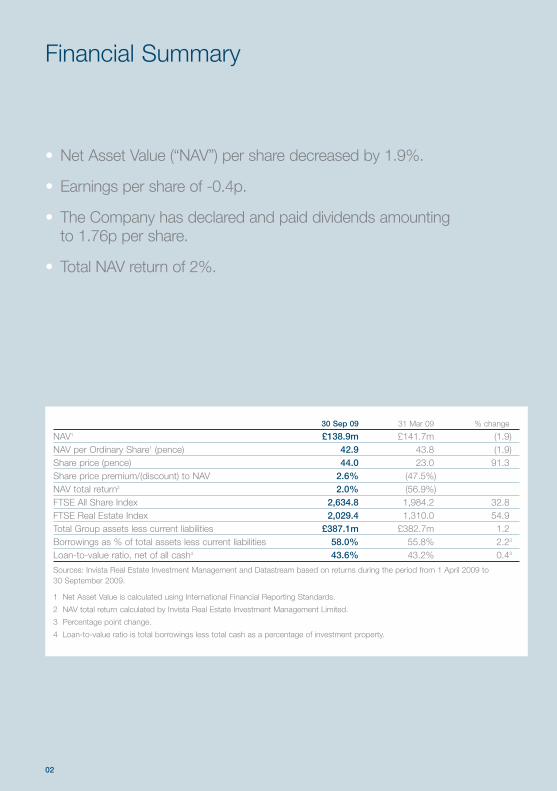
• Net Asset Value (“NAV”) per share decreased by 1.9%.
• Earnings per share of -0.4p.
• The Company has declared and paid dividends amounting to 1.76p per share.
• Total NAV return of 2%.
30 Sep 09 31 Mar 09 % change
NAV1 £138.9m £141.7m (1.9)NAV per Ordinary Share1 (pence) 42.9 43.8 (1.9)Share price (pence) 44.0 23.0 91.3Share price premium/(discount) to NAV 2.6% (47.5%)NAV total return2 2.0% (56.9%)FTSE All Share Index 2,634.8 1,984.2 32.8FTSE Real Estate Index 2,029.4 1,310.0 54.9Total Group assets less current liabilities £387.1m £382.7m 1.2Borrowings as % of total assets less current liabilities 58.0% 55.8% 2.23
Loan-to-value ratio, net of all cash4 43.6% 43.2% 0.43
Sources: Invista Real Estate Investment Management and Datastream based on returns during the period from 1 April 2009 to 30 September 2009.
1 Net Asset Value is calculated using International Financial Reporting Standards.
2 NAV total return calculated by Invista Real Estate Investment Management Limited.
3 Percentage point change.
4 Loan-to-value ratio is total borrowings less total cash as a percentage of investment property.

Invista Foundation Property Trust Limited Interim Report 2009 03
Chairman’s Statement
Results
In the course of the six months to 30 September2009 we have seen a gradual stabilisation in financial markets, with modest signs ofimprovement in the UK commercial propertymarket following the 44.1% decline in capitalvalues between June 2007 and July 2009, asmeasured by Investment Property Databank (“IPD”).
Invista Foundation Property Trust Limited (the“Company”/“Group”) has responded to thesechallenging conditions and now has a stablefinancial position. The unaudited Net Asset Value(“NAV”) of the Company fell by 0.9 pence pershare (“pps”) or 1.9%, from 43.8 pps to 42.9 ppsover the six months to 30 September 2009.Shareholders received total dividends of 1.76 ppsover this period, resulting in a NAV total return of2.0% over the six months to September 2009.
Strategic review
Over the last two years the Company has taken anumber of steps to counter the impact of steeplyfalling capital values. During the period underreview, the Investment Manager and the Boardhave continued to focus on reducing risk whileseeking to position the Company for a recoveryin due course.
The Company has continued to sell propertieswhere asset business plans have been completedor where there are concerns about futureperformance. Disposals totalling £10.28 millionhave been exchanged or completed since March2009 at an average premium to the immediatelyprior valuation of 7%. Following these disposals,the Company has cash of £82 million as at 1 November 2009.
The Company’s borrowings, net of all cash(excluding rent deposits) represent 43.6% of itsproperty assets, compared with the loan-to-value(“LTV”) ratio covenant in the Company’s debtfacility of 60% as at 30 September 2009. On this
Andrew SykesChairmanInvista Foundation Property Trust Limited
basis, the value of the underlying portfolio couldfall by a further 26.2% before breaching the 60%LTV ratio covenant.
Following recent disposals, the Company’sportfolio now generates £22.27 million of rentalincome per annum, which will increase by £2 million per annum over the next 12 months as rent-free periods on recently negotiated newlettings expire. The reduction in rental incomefollowing property disposals combined with theextremely low return earned on cash means thatdividend cover has fallen to 35% over the period.
The Company has considered acquiring newproperties which will increase net income anddividend cover and it continues to reviewopportunities. However, the extent to whichexisting cash resources can be deployed toacquire property is limited by the need tomaintain the Company’s gearing, net of cash, at an acceptable level. Any reduction in cashbalances to fund new property investmentsincreases net gearing directly.
In July 2009, in response to the opportunity thatappeared to be offered by weakness in thecommercial mortgage backed securities markets,the Company sought to deploy up to £55 millionof its cash resources through a tender offer torepurchase and cancel up to £75 million of theCompany’s existing securitised borrowings at adiscount to face value. A majority of noteholdersresponded negatively to the proposal and it wastherefore withdrawn in August 2009.
The Board has considered the range of optionsopen to the Company to improve income anddividend cover without a material increase in netgearing, and has agreed to take the followingactions:
• To repay £40 million of debt at par on 15 January 2010, which is the next available
opportunity. This can be done withoutnoteholder consent and the only associatedfees are the pro-rata swap break costs, whichwill amount to approximately £3.7 million,depending on swap rates at the time ofrepayment. This will increase the Company’snet income by approximately £2.1 million per annum.
• To invest up to £15 million in new property togenerate ungeared total returns of between8% and 10% per annum. Properties yieldingbetween 7.5% and 8.5% are likely to betargeted and whilst there will be no specificsector or regional focus, the InvestmentManager expects to maintain an above-average weighting within the South East andCentral London. As the cash to be deployedin this way currently earns very little ondeposit, this will add £1 million per annum or more to net income.
• To reduce expenses further where possible,including the Investment and AssetManagement Fee.
Investment and Asset Management Fees
The Board and the Investment Manager haveagreed a new Investment and Asset ManagementFee arrangement linked to Net Asset Value(“NAV”). This results in an immediate annualisedreduction of 22% or £793,000 per annum andaligns the Investment Manager’s incentives moreclosely with the interests of shareholders.
The current base fee arrangement of 0.95% perannum of Gross Asset Value (“GAV”) less currentliabilities has been changed to a fee based on theCompany’s NAV, backdated to 1 July 2009. Thecurrent NAV-linked performance fee arrangementwill not change as part of the new base feearrangement. The new fee arrangement will bepayable monthly in arrears and will be equal toone twelfth of:
04
Chairman’s Statement
Invista Foundation Property Trust Limited Interim Report 2009 05
Chairman’s Statement
• 2% of NAV up to £150 million; plus
• 1.75% of NAV between £150 million and £200million; plus
• 1.5% of NAV over £200 million.
This NAV based fee will be subject to a floor of£229,000 per month. In the event that this floor is breached, the fee will then revert to beingcalculated on the previous basis of 0.95% perannum of GAV, until NAV recovers to a pointwhere the monthly NAV based fee would onceagain exceed £229,000.
The combined new base fee and any performancefee based on the current arrangement cannotexceed 5% of the Company’s total NAV duringany financial year ending 31 March.
The portfolio
The Group’s portfolio continues to be welldiversified with a bias towards the South East ofEngland, with 58 properties and more than 150tenants. As at 30 September 2009, the portfoliohas an initial yield of 7.6%, increasing to 8.1% on expiry of contracted rent free periods over the next 12 months. The independent valuer has estimated that the current rental value of theportfolio is £27.3 million reflecting a reversionaryyield of 9.3%.
On completion of exchanged lease agreements,the average unexpired lease term in theCompany’s portfolio, assuming all tenants break or vacate at the earliest opportunity, is 8.1 yearswhich compares to the IPD Benchmark of 8.3 years as at 30 September 2009. The newlettings exchanged or completed over the period resulted in a void rate of 11.5% as at 30 September 2009, and these are described inmore detail in the Investment Manager’s Report.
The Board reviews regular asset managementreports to assess performance relative to
individual business plans and independentvaluation assumptions. The Investment Manageralso reports regularly to the Board on the financialhealth of tenants, and actions in hand to mitigatepotential defaults.
The Group’s three non-recourse, joint ventureinvestments continue to be held at nil.
Outlook
The combination of debt repayment, newacquisitions, asset management and a continuedfocus of lowering expenses will increase dividendcover to an acceptable level, whilst maintaining a loan-to-value ratio, net of cash, of 47.4%. The Investment Manager will continue to makeselected investments in the existing portfolio to enhance income, and will dispose of assetswhere business plans have been completed toredeploy proceeds in higher earning opportunities.
Andrew SykesChairmanInvista Foundation Property Trust Limited
26 November 2009

06
Investment Manager’s Report
Performance and strategy
The Chairman’s Statement highlights furtherprogress made in implementing the key initiativesto protect shareholder value in challenging andvolatile market conditions. The market does now appear to have passed an inflection point,with the Investment Property Databank (“IPD”)quarterly index showing a positive capital value movement of 1.5% over the quarter to 30 September 2009 compared with a decline of -4.0% over the quarter to 30 June 2009.Encouragingly, on a like for like basis, theCompany’s underlying property portfolioperformed relatively well over the June toSeptember period, with a capital value movementof 2.3%. Looking forward, the action taken tostrengthen the Company’s financial positioncombined with good progress in generatingadditional income means that the Company is better placed to benefit from a recovery inproperty markets. The focus now is on growingnet income and the package of measures set outin the Chairman’s Statement is designed toachieve this.
The market
Substantial injections of liquidity into the financialsystem have reduced short and long-term interestrates and supported a recovery in UK equitiesand commercial property. Capital values in the UK commercial property market have recentlybeen driven by high yields relative to short andlong-term interest rates, and by a lack of primequality investments to satisfy recent demand fromUK institutions and foreign investors seeking toinvest at what is perceived to be a low point inthe cycle. The strong demand for prime assets,with some transactions completing significantlyabove valuation, must be contrasted with very weak demand for secondary assets. Thepotentially negative outlook for rental incomegrowth, moreover, means that while the marketas a whole may have a more positive tone in the short term, there is a clear risk of continuedvolatility in returns over the months ahead.
Rental values should now be the key focus forinvestors. While capital values increased by 1.5%between June 2009 and September 2009, over thesame period rental values fell by 1.6% (source: IPD).
Duncan Owen Chief Executive Invista Real Estate Investment Management
Invista Foundation Property Trust Limited Interim Report 2009 07
The pace of rental value falls appears to beeasing but the contraction in rental valuesremains largely driven by the economic downturn.However, there has not been an oversupply ofnew development (as compared with the 1990s)so the supply/demand balance may besupportive. To illustrate, new retail and officespace available today of approximately 89 millionsq ft compares with approximately 150 million sqft available in 1990 (source: IPD).
Although the UK commercial property market is likely to face further challenges over 2010 the sector now offers a high income return and is already priced with much of the risk takeninto account. This explains increasing investordemand and should ensure that the sectorproduces positive total returns in line with or inexcess of the long run average of 8% per annum.This indicates that we are likely to return to amore “normal” property market where relativeoutperformance will be derived from growingincome returns through exposure to good qualityassets and proactive asset management.
Property portfolio
The Group’s direct property portfolio was valuedat £303.4 million as at 30 September 2009,which reduces to £297.9 million when takingaccount of disposals that have completedfollowing the period end. Following thesedisposals the Group had 58 direct propertyassets, with an average value of £5.1 million.The portfolio continues to comprise of good quality assets well diversified by tenant, sectorand geography.
08
Investment Manager’s Report
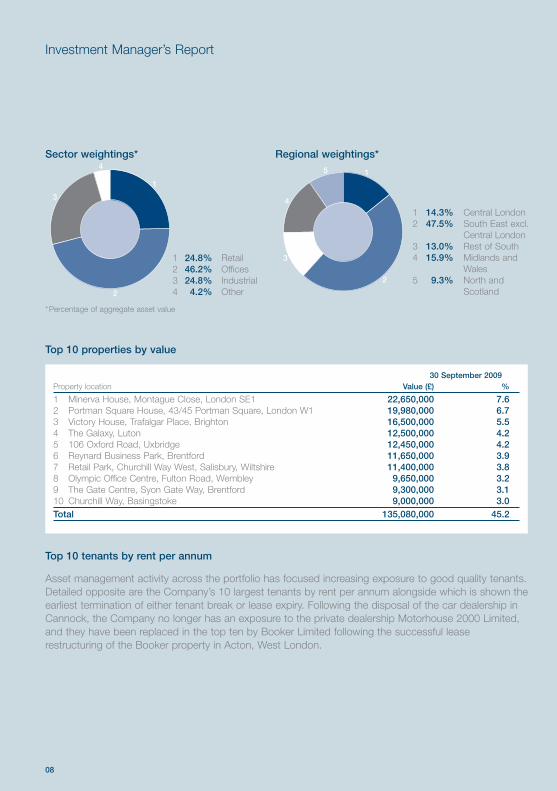
Sector weightings* Regional weightings*
3
4
2
1
1 24.8% Retail2 46.2% Offices3 24.8% Industrial4 4.2% Other
1
2
3
4
5
1 14.3% Central London2 47.5% South East excl.
Central London3 13.0% Rest of South4 15.9% Midlands and
Wales5 9.3% North and
Scotland
30 September 2009Property location Value (£) %
1 Minerva House, Montague Close, London SE1 22,650,000 7.62 Portman Square House, 43/45 Portman Square, London W1 19,980,000 6.73 Victory House, Trafalgar Place, Brighton 16,500,000 5.54 The Galaxy, Luton 12,500,000 4.25 106 Oxford Road, Uxbridge 12,450,000 4.26 Reynard Business Park, Brentford 11,650,000 3.97 Retail Park, Churchill Way West, Salisbury, Wiltshire 11,400,000 3.88 Olympic Office Centre, Fulton Road, Wembley 9,650,000 3.29 The Gate Centre, Syon Gate Way, Brentford 9,300,000 3.110 Churchill Way, Basingstoke 9,000,000 3.0Total 135,080,000 45.2
Top 10 properties by value
*Percentage of aggregate asset value
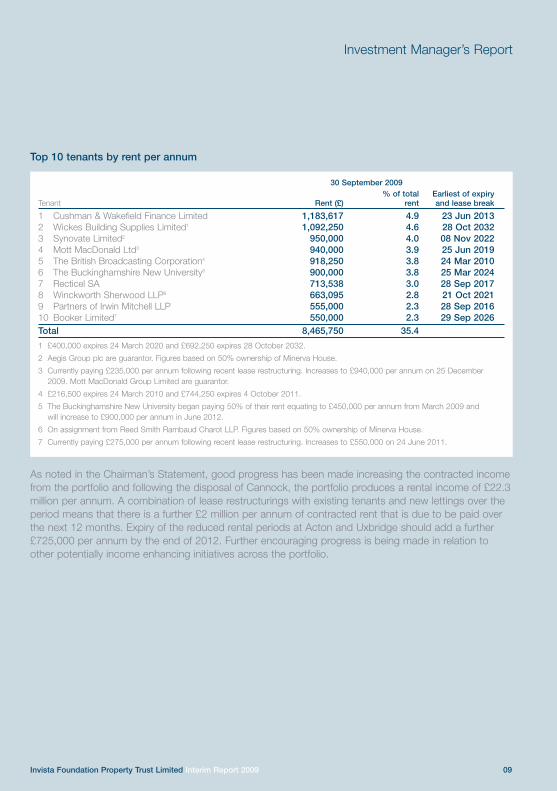
Top 10 tenants by rent per annum
Asset management activity across the portfolio has focused increasing exposure to good quality tenants.Detailed opposite are the Company’s 10 largest tenants by rent per annum alongside which is shown theearliest termination of either tenant break or lease expiry. Following the disposal of the car dealership inCannock, the Company no longer has an exposure to the private dealership Motorhouse 2000 Limited,and they have been replaced in the top ten by Booker Limited following the successful leaserestructuring of the Booker property in Acton, West London.
Invista Foundation Property Trust Limited Interim Report 2009 09
Investment Manager’s Report
30 September 2009% of total Earliest of expiry
Tenant Rent (£) rent and lease break
1 Cushman & Wakefield Finance Limited 1,183,617 4.9 23 Jun 20132 Wickes Building Supplies Limited1 1,092,250 4.6 28 Oct 20323 Synovate Limited2 950,000 4.0 08 Nov 20224 Mott MacDonald Ltd3 940,000 3.9 25 Jun 20195 The British Broadcasting Corporation4 918,250 3.8 24 Mar 20106 The Buckinghamshire New University5 900,000 3.8 25 Mar 20247 Recticel SA 713,538 3.0 28 Sep 20178 Winckworth Sherwood LLP6 663,095 2.8 21 Oct 20219 Partners of Irwin Mitchell LLP 555,000 2.3 28 Sep 201610 Booker Limited7 550,000 2.3 29 Sep 2026Total 8,465,750 35.4
1 £400,000 expires 24 March 2020 and £692,250 expires 28 October 2032.
2 Aegis Group plc are guarantor. Figures based on 50% ownership of Minerva House.
3 Currently paying £235,000 per annum following recent lease restructuring. Increases to £940,000 per annum on 25 December2009. Mott MacDonald Group Limited are guarantor.
4 £216,500 expires 24 March 2010 and £744,250 expires 4 October 2011.
5 The Buckinghamshire New University began paying 50% of their rent equating to £450,000 per annum from March 2009 and will increase to £900,000 per annum in June 2012.
6 On assignment from Reed Smith Rambaud Charot LLP. Figures based on 50% ownership of Minerva House.
7 Currently paying £275,000 per annum following recent lease restructuring. Increases to £550,000 on 24 June 2011.
Top 10 tenants by rent per annum
As noted in the Chairman’s Statement, good progress has been made increasing the contracted incomefrom the portfolio and following the disposal of Cannock, the portfolio produces a rental income of £22.3million per annum. A combination of lease restructurings with existing tenants and new lettings over theperiod means that there is a further £2 million per annum of contracted rent that is due to be paid overthe next 12 months. Expiry of the reduced rental periods at Acton and Uxbridge should add a further£725,000 per annum by the end of 2012. Further encouraging progress is being made in relation toother potentially income enhancing initiatives across the portfolio.
10
Investment Manager’s Report
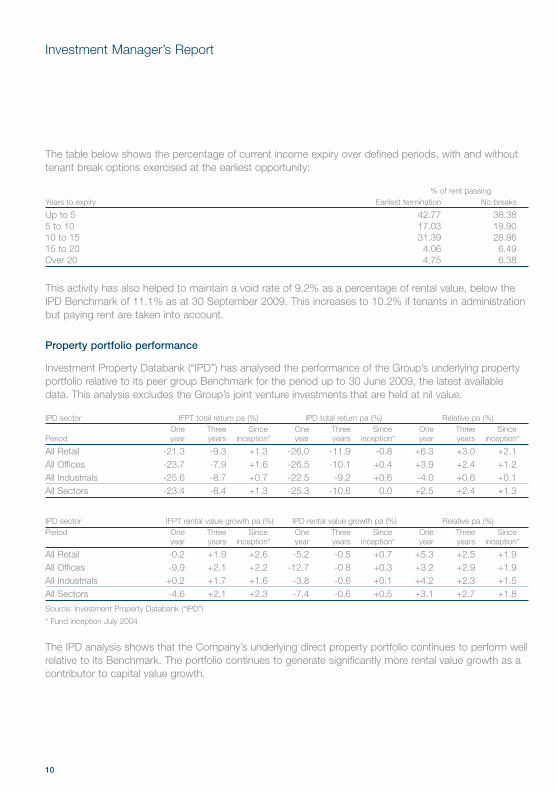
The table below shows the percentage of current income expiry over defined periods, with and withouttenant break options exercised at the earliest opportunity:
% of rent passingYears to expiry Earliest termination No breaks
Up to 5 42.77 38.385 to 10 17.03 19.9010 to 15 31.39 28.8615 to 20 4.06 6.49Over 20 4.75 6.38
This activity has also helped to maintain a void rate of 9.2% as a percentage of rental value, below theIPD Benchmark of 11.1% as at 30 September 2009. This increases to 10.2% if tenants in administrationbut paying rent are taken into account.
Property portfolio performance
Investment Property Databank (“IPD”) has analysed the performance of the Group’s underlying propertyportfolio relative to its peer group Benchmark for the period up to 30 June 2009, the latest availabledata. This analysis excludes the Group’s joint venture investments that are held at nil value.
IPD sector IFPT total return pa (%) IPD total return pa (%) Relative pa (%)One Three Since One Three Since One Three Since
Period year years inception* year years inception* year years inception*
All Retail -21.3 -9.3 +1.3 -26.0 -11.9 -0.8 +6.3 +3.0 +2.1All Offices -23.7 -7.9 +1.6 -26.5 -10.1 +0.4 +3.9 +2.4 +1.2All Industrials -25.6 -8.7 +0.7 -22.5 -9.2 +0.6 -4.0 +0.6 +0.1All Sectors -23.4 -8.4 +1.3 -25.3 -10.6 0.0 +2.5 +2.4 +1.3
IPD sector IFPT rental value growth pa (%) IPD rental value growth pa (%) Relative pa (%)Period One Three Since One Three Since One Three Since
year years inception* year years inception* year years inception*
All Retail -0.2 +1.9 +2.6 -5.2 -0.5 +0.7 +5.3 +2.5 +1.9All Offices -9.9 +2.1 +2.2 -12.7 -0.8 +0.3 +3.2 +2.9 +1.9All Industrials +0.2 +1.7 +1.6 -3.8 -0.6 +0.1 +4.2 +2.3 +1.5All Sectors -4.6 +2.1 +2.3 -7.4 -0.6 +0.5 +3.1 +2.7 +1.8
Source: Investment Property Databank (“IPD”)
* Fund inception July 2004
The IPD analysis shows that the Company’s underlying direct property portfolio continues to perform wellrelative to its Benchmark. The portfolio continues to generate significantly more rental value growth as acontributor to capital value growth.
Invista Foundation Property Trust Limited Interim Report 2009 11
Investment Manager’s Report
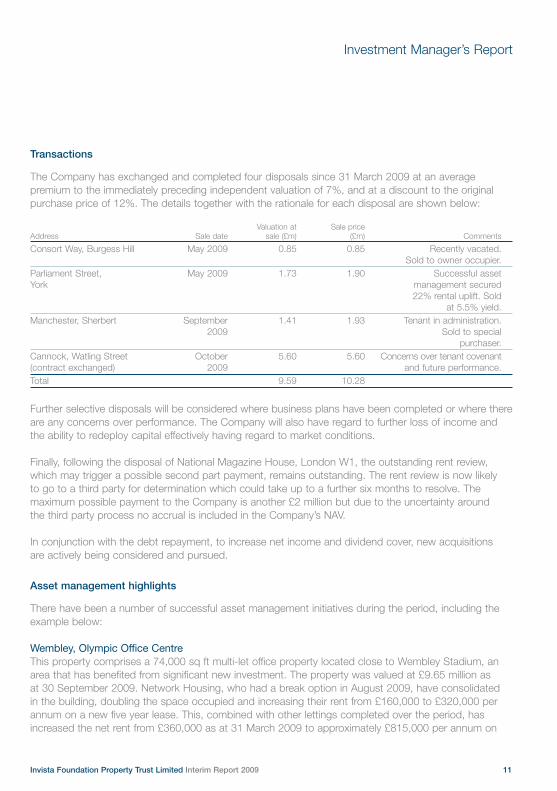
Transactions
The Company has exchanged and completed four disposals since 31 March 2009 at an averagepremium to the immediately preceding independent valuation of 7%, and at a discount to the originalpurchase price of 12%. The details together with the rationale for each disposal are shown below:
Valuation at Sale priceAddress Sale date sale (£m) (£m) Comments
Consort Way, Burgess Hill May 2009 0.85 0.85 Recently vacated.Sold to owner occupier.
Parliament Street, May 2009 1.73 1.90 Successful assetYork management secured
22% rental uplift. Soldat 5.5% yield.
Manchester, Sherbert September 1.41 1.93 Tenant in administration.2009 Sold to special
purchaser.Cannock, Watling Street October 5.60 5.60 Concerns over tenant covenant(contract exchanged) 2009 and future performance.Total 9.59 10.28
Further selective disposals will be considered where business plans have been completed or where thereare any concerns over performance. The Company will also have regard to further loss of income andthe ability to redeploy capital effectively having regard to market conditions.
Finally, following the disposal of National Magazine House, London W1, the outstanding rent review,which may trigger a possible second part payment, remains outstanding. The rent review is now likely to go to a third party for determination which could take up to a further six months to resolve. Themaximum possible payment to the Company is another £2 million but due to the uncertainty around the third party process no accrual is included in the Company’s NAV.
In conjunction with the debt repayment, to increase net income and dividend cover, new acquisitions are actively being considered and pursued.
Asset management highlights
There have been a number of successful asset management initiatives during the period, including theexample below:
Wembley, Olympic Office CentreThis property comprises a 74,000 sq ft multi-let office property located close to Wembley Stadium, anarea that has benefited from significant new investment. The property was valued at £9.65 million as at 30 September 2009. Network Housing, who had a break option in August 2009, have consolidated in the building, doubling the space occupied and increasing their rent from £160,000 to £320,000 perannum on a new five year lease. This, combined with other lettings completed over the period, hasincreased the net rent from £360,000 as at 31 March 2009 to approximately £815,000 per annum on
12
Investment Manager’s Report
expiry of contracted rent free. The final vacant floor is under offer which has the potential to generate a further £150,000 per annum.
In addition to considering new investment opportunities, the Company will continue to invest capitalexpenditure in its existing portfolio where there is the potential for income and capital growth. There are a number of projects ongoing where the Company could deploy up to £10 million over the next 12 months.
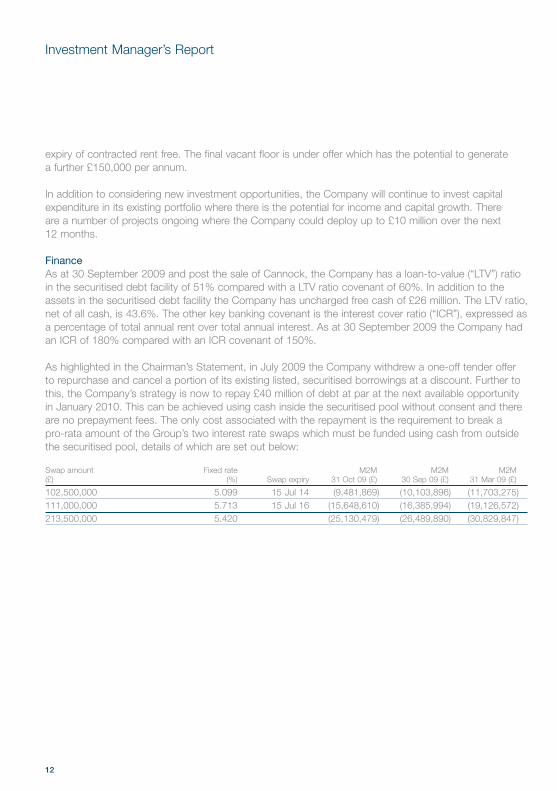
FinanceAs at 30 September 2009 and post the sale of Cannock, the Company has a loan-to-value (“LTV”) ratioin the securitised debt facility of 51% compared with a LTV ratio covenant of 60%. In addition to theassets in the securitised debt facility the Company has uncharged free cash of £26 million. The LTV ratio,net of all cash, is 43.6%. The other key banking covenant is the interest cover ratio (“ICR”), expressed asa percentage of total annual rent over total annual interest. As at 30 September 2009 the Company hadan ICR of 180% compared with an ICR covenant of 150%.
As highlighted in the Chairman’s Statement, in July 2009 the Company withdrew a one-off tender offerto repurchase and cancel a portion of its existing listed, securitised borrowings at a discount. Further tothis, the Company’s strategy is now to repay £40 million of debt at par at the next available opportunityin January 2010. This can be achieved using cash inside the securitised pool without consent and thereare no prepayment fees. The only cost associated with the repayment is the requirement to break a pro-rata amount of the Group’s two interest rate swaps which must be funded using cash from outsidethe securitised pool, details of which are set out below:
Swap amount Fixed rate M2M M2M M2M(£) (%) Swap expiry 31 Oct 09 (£) 30 Sep 09 (£) 31 Mar 09 (£)
102,500,000 5.099 15 Jul 14 (9,481,869) (10,103,896) (11,703,275)111,000,000 5.713 15 Jul 16 (15,648,610) (16,385,994) (19,126,572)213,500,000 5.420 (25,130,479) (26,489,890) (30,829,847)
Invista Foundation Property Trust Limited Interim Report 2009 13
Investment Manager’s Report
Assuming the Company breaks the swap,resulting in the lowest break cost, then based on the latest available valuation the break costswould be £3.7 million. This in turn would reduceannual interest from £12 million to approximately£9.9 million, a reduction of £2.1 million per annum.
Incurring the swap break cost will result in a small increase in the Group’s net loan-to-valueratio due to the cash used to break the swap, but the impact on the ICR will be significant,increasing from 180% to 218% as a result of the debt repayment.
The Group's securitised debt facility has aliquidity facility of £11.2 million attached to itprovided by Lloyds Banking Group (“Lloyds”).This is a standard feature designed as an on-demand loan to cover short-term incomeshortfalls against payments due under the loan.The Liquidity Facility Agreement requires theprovider to have a minimum Standard & Poor's(“S&P”) credit rating of A-1+, which Lloydsbreached in March 2009 when they weredowngraded by S&P to A-1. The breach requiresthe liquidity facility to be drawn down in full and placed in a blocked deposit account or alternatively a new provider put in place.Accordingly, on 23 September 2009, the liquidityfacility was drawn down.
This has a neutral impact on the Group's NAVwith the increase in loan off-set by an increase in cash. However, as a result, interest costs willrise by a nominal amount with an estimated netincrease of approximately £50,000 per annum.The securitisation loan covenants exclude anyamount drawn under the liquidity facility. In theevent that Lloyd's credit rating reverts back to A-1+, the liquidity facility will be repaid.
Joint ventures
The Group continues to have three joint venturesthat are financed using non-recourse debt,meaning that the lender’s security is limited to the assets held by the individual joint ventures.Any breach or default of an individual joint venturehas no impact upon the Group’s other assets orbanking arrangements.
The Crendon loan has been successfullyrestructured and good progress has been madein negotiating a restructure to the Merchant loan.Despite attempts, negotiations to restructurePlantation Place have been unsuccessful. In each case the interest on the loans is being fully serviced by rent.
The Group’s three joint ventures continue to beheld at nil.
Conclusion
The UK commercial property market appears tohave passed an inflection point and the directionof value movements has changed. The Companyis well placed to take advantage of any recovery,but we are exercising caution as the recoverymay be drawn out with further upward anddownward movements across the UK market.The steps taken over the last six months in termsof growing income combined with the stepsoutlined above should enhance dividend coverand enable the Company to selectively re-investand add to long-term NAV growth.
Duncan Owen Chief Executive Invista Real Estate Investment Management
26 November 2009
14
We confirm that to the best of our knowledge:
• the condensed set of financial statements has been prepared in accordance with IAS 34Interim Financial Reporting as adopted by theEU; and
• the interim management report includes a fairreview of the information required by:
(a) DTR 4.2.7R of the Disclosure andTransparency Rules, being an indication ofimportant events that have occurred during thefirst six months of the financial year and theirimpact on the condensed set of financialstatements; and a description of the principalrisks and uncertainties for the remaining sixmonths of the year; and
(b) DTR 4.2.8R of the Disclosure andTransparency Rules, being related partytransactions that have taken place in the first six months of the current financial year and thathave materially affected the financial position orperformance of the entity during that period; andany changes in the related party transactionsdescribed in the last annual report that could do so.
By order of the Board
Harry Dick-ClelandDirector
26 November 2009
Statement of Directors’ Responsibilitiesin respect of the half-yearly financial report
Invista Foundation Property Trust Limited Interim Report 2009 15
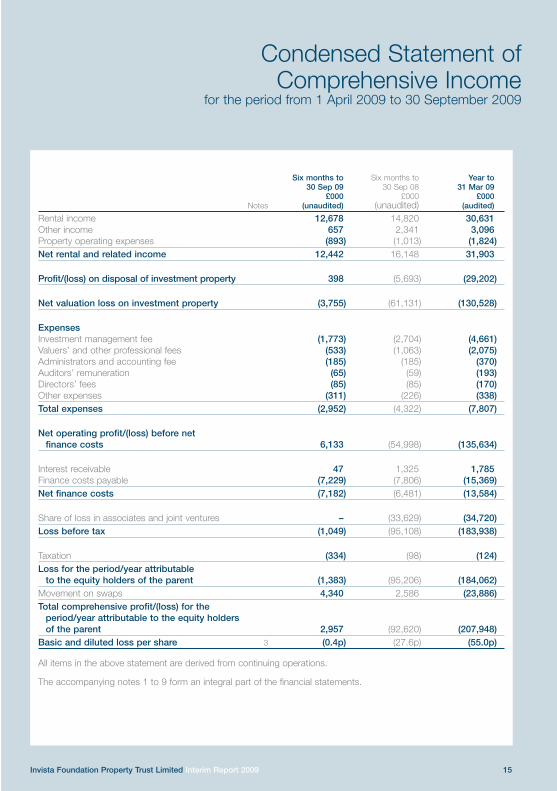
Condensed Statement of Comprehensive Income
for the period from 1 April 2009 to 30 September 2009
Six months to Six months to Year to30 Sep 09 30 Sep 08 31 Mar 09
£000 £000 £000Notes (unaudited) (unaudited) (audited)
Rental income 12,678 14,820 30,631Other income 657 2,341 3,096Property operating expenses (893) (1,013) (1,824)Net rental and related income 12,442 16,148 31,903
Profit/(loss) on disposal of investment property 398 (5,693) (29,202)
Net valuation loss on investment property (3,755) (61,131) (130,528)
ExpensesInvestment management fee (1,773) (2,704) (4,661)Valuers’ and other professional fees (533) (1,063) (2,075)Administrators and accounting fee (185) (185) (370)Auditors’ remuneration (65) (59) (193)Directors’ fees (85) (85) (170)Other expenses (311) (226) (338)Total expenses (2,952) (4,322) (7,807)
Net operating profit/(loss) before net finance costs 6,133 (54,998) (135,634)
Interest receivable 47 1,325 1,785Finance costs payable (7,229) (7,806) (15,369)Net finance costs (7,182) (6,481) (13,584)
Share of loss in associates and joint ventures – (33,629) (34,720)Loss before tax (1,049) (95,108) (183,938)
Taxation (334) (98) (124)Loss for the period/year attributable
to the equity holders of the parent (1,383) (95,206) (184,062)Movement on swaps 4,340 2,586 (23,886)Total comprehensive profit/(loss) for the
period/year attributable to the equity holdersof the parent 2,957 (92,620) (207,948)
Basic and diluted loss per share 3 (0.4p) (27.6p) (55.0p)
All items in the above statement are derived from continuing operations.
The accompanying notes 1 to 9 form an integral part of the financial statements.
16
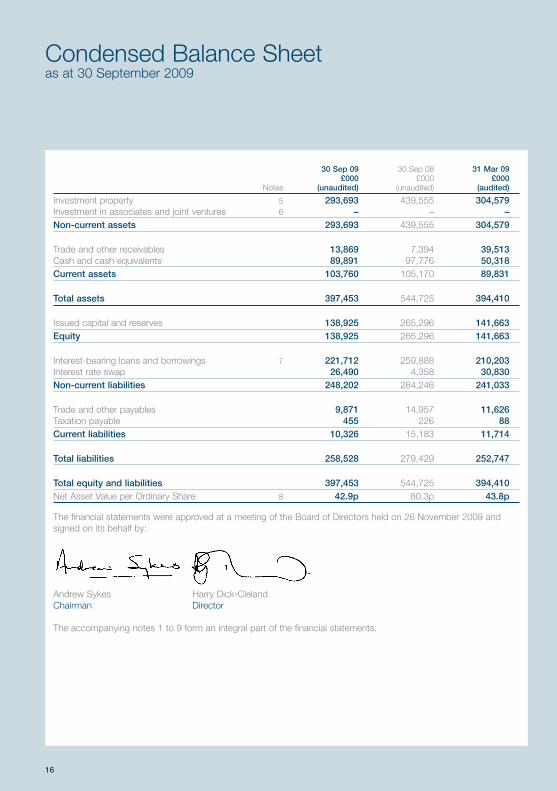
Condensed Balance Sheetas at 30 September 2009
30 Sep 09 30 Sep 08 31 Mar 09£000 £000 £000
Notes (unaudited) (unaudited) (audited)
Investment property 5 293,693 439,555 304,579Investment in associates and joint ventures 6 – – –Non-current assets 293,693 439,555 304,579
Trade and other receivables 13,869 7,394 39,513Cash and cash equivalents 89,891 97,776 50,318Current assets 103,760 105,170 89,831
Total assets 397,453 544,725 394,410
Issued capital and reserves 138,925 265,296 141,663Equity 138,925 265,296 141,663
Interest-bearing loans and borrowings 7 221,712 259,888 210,203Interest rate swap 26,490 4,358 30,830Non-current liabilities 248,202 264,246 241,033
Trade and other payables 9,871 14,957 11,626Taxation payable 455 226 88Current liabilities 10,326 15,183 11,714
Total liabilities 258,528 279,429 252,747
Total equity and liabilities 397,453 544,725 394,410Net Asset Value per Ordinary Share 8 42.9p 80.3p 43.8p
The financial statements were approved at a meeting of the Board of Directors held on 26 November 2009 andsigned on its behalf by:
Andrew Sykes Harry Dick-ClelandChairman Director
The accompanying notes 1 to 9 form an integral part of the financial statements.
Invista Foundation Property Trust Limited Interim Report 2009 17
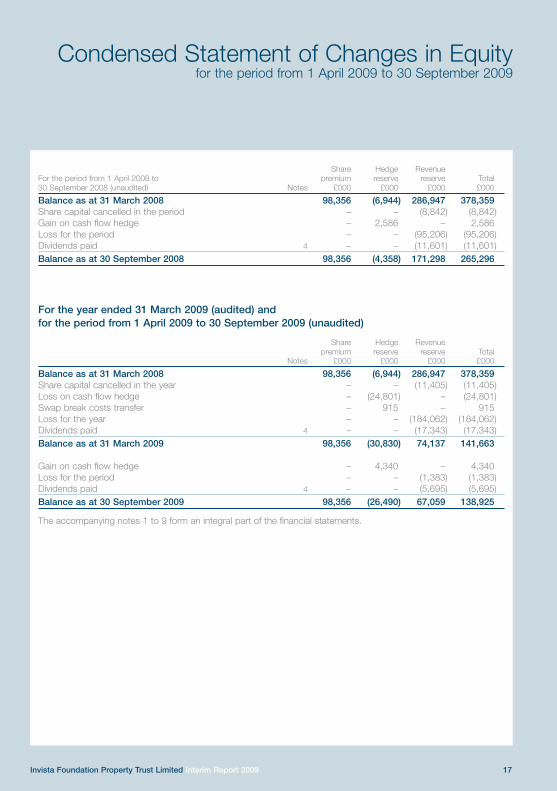
Condensed Statement of Changes in Equityfor the period from 1 April 2009 to 30 September 2009
Share Hedge RevenueFor the period from 1 April 2008 to premium reserve reserve Total30 September 2008 (unaudited) Notes £000 £000 £000 £000
Balance as at 31 March 2008 98,356 (6,944) 286,947 378,359Share capital cancelled in the period – – (8,842) (8,842)Gain on cash flow hedge – 2,586 – 2,586Loss for the period – – (95,206) (95,206)Dividends paid 4 – – (11,601) (11,601)Balance as at 30 September 2008 98,356 (4,358) 171,298 265,296
For the year ended 31 March 2009 (audited) and for the period from 1 April 2009 to 30 September 2009 (unaudited)
Share Hedge Revenuepremium reserve reserve Total
Notes £000 £000 £000 £000
Balance as at 31 March 2008 98,356 (6,944) 286,947 378,359Share capital cancelled in the year – – (11,405) (11,405)Loss on cash flow hedge – (24,801) – (24,801)Swap break costs transfer – 915 – 915Loss for the year – – (184,062) (184,062)Dividends paid 4 – – (17,343) (17,343)Balance as at 31 March 2009 98,356 (30,830) 74,137 141,663
Gain on cash flow hedge – 4,340 – 4,340Loss for the period – – (1,383) (1,383)Dividends paid 4 – – (5,695) (5,695)Balance as at 30 September 2009 98,356 (26,490) 67,059 138,925
The accompanying notes 1 to 9 form an integral part of the financial statements.
18
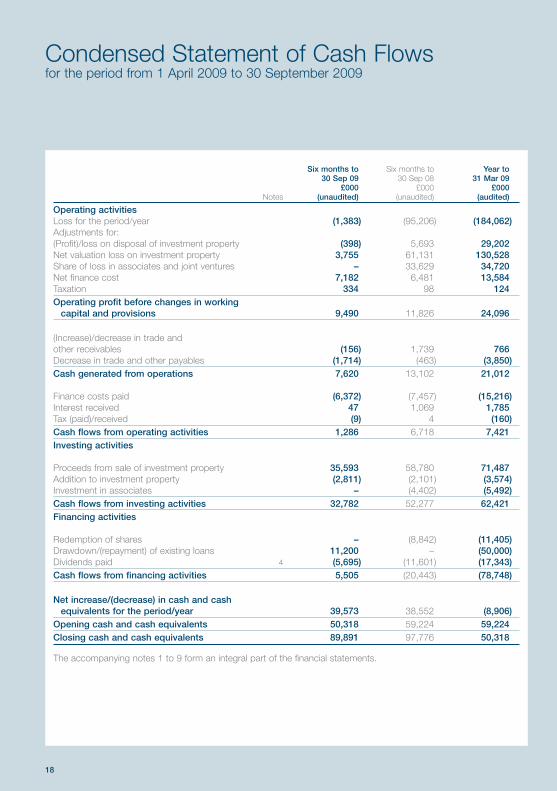
Condensed Statement of Cash Flowsfor the period from 1 April 2009 to 30 September 2009
Six months to Six months to Year to30 Sep 09 30 Sep 08 31 Mar 09
£000 £000 £000Notes (unaudited) (unaudited) (audited)
Operating activitiesLoss for the period/year (1,383) (95,206) (184,062)Adjustments for:(Profit)/loss on disposal of investment property (398) 5,693 29,202Net valuation loss on investment property 3,755 61,131 130,528Share of loss in associates and joint ventures – 33,629 34,720Net finance cost 7,182 6,481 13,584Taxation 334 98 124Operating profit before changes in working
capital and provisions 9,490 11,826 24,096
(Increase)/decrease in trade and other receivables (156) 1,739 766Decrease in trade and other payables (1,714) (463) (3,850)Cash generated from operations 7,620 13,102 21,012
Finance costs paid (6,372) (7,457) (15,216)Interest received 47 1,069 1,785Tax (paid)/received (9) 4 (160)Cash flows from operating activities 1,286 6,718 7,421Investing activities
Proceeds from sale of investment property 35,593 58,780 71,487Addition to investment property (2,811) (2,101) (3,574)Investment in associates – (4,402) (5,492)Cash flows from investing activities 32,782 52,277 62,421Financing activities
Redemption of shares – (8,842) (11,405)Drawdown/(repayment) of existing loans 11,200 – (50,000)Dividends paid 4 (5,695) (11,601) (17,343)Cash flows from financing activities 5,505 (20,443) (78,748)
Net increase/(decrease) in cash and cash equivalents for the period/year 39,573 38,552 (8,906)
Opening cash and cash equivalents 50,318 59,224 59,224Closing cash and cash equivalents 89,891 97,776 50,318
The accompanying notes 1 to 9 form an integral part of the financial statements.
Invista Foundation Property Trust Limited Interim Report 2009 19
Notes to the Interim ReportAs at 30 September 2009
1. Significant accounting policies
Invista Foundation Property Trust Limited (the “Company”) is a closed-ended investment companyincorporated in Guernsey. The condensed financial statements of the Company for the period ended 30 September 2009 comprise the Company, its subsidiaries and its interests in associates and jointventures (together referred to as the “Group”).
Statement of complianceThe condensed interim financial statements have been prepared in accordance with the Disclosure and Transparency Rules of the United Kingdom Financial Services Authority and International FinancialReporting Standards (“IFRS”) IAS 34 Interim Financial Reporting. They do not include all of the information required for the full annual financial statements, and should be read in conjunction with the consolidated financial statements of the Group as at and for the year ended 31 March 2009. Thefinancial statements have been prepared on the basis of the accounting policies set out in the Group’sannual financial statements for the year ended 31 March 2009. The Group’s annual financial statementsrefer to new Standards and Interpretations none of which had a material impact on the financial statements.
The Group applies revised IAS 1 Presentation of Financial Statements (2007), which became effective as of 1 April 2009. As a result, the Group presents in the consolidated statement of changes of equity all owner changes in equity, whereas all non-owner changes in equity are presented in the consolidatedstatement of comprehensive income. This presentation has been applied in these condensed interimfinancial statements as of and for the six-month period ended 30 September 2009. Comparativeinformation has been re-presented so that it also is in conformity with the revised standard. Since the change in accounting policy only impacts presentation aspects, there is no impact on earnings per share.
2. Material agreements
Invista Real Estate Investment Management Limited (“Invista”) has been appointed as InvestmentManager to the Company.
The Investment Manager is entitled to a base fee and a performance fee together with reasonableexpenses incurred by it in the performance of its duties. The base fee is equal to one quarter of 95 basis points of the gross assets less current liabilities of the Group per quarter.
In addition, and subject to the conditions below, the Investment Manager is entitled to an annualperformance fee where the NAV total return per Ordinary Share during the relevant financial periodexceeds an annual rate of 10 percent (the “performance hurdle”). Where the performance hurdle is met, a performance fee will be payable in an amount equal to 15 percent of any aggregate total returnover and above the performance hurdle. A performance fee will only be payable where: (i) in respect ofthe relevant financial period, the total return of the underlying assets meets or exceeds the InvestmentProperty Database (“IPD”) Monthly Index balanced funds benchmark on a like for like basis; and (ii) theannualised total return over the period from admission of the Company’s Ordinary Shares to the end ofthe relevant financial period is equal to or greater than 10 percent per annum.
20
Notes to the Interim Report
The Investment Management Agreement may be terminated by either the Company or the InvestmentManager on not less than 12 months notice in writing.
Post the period end, it has been agreed that the basis for calculating the base fee will be changed; seenote 9.
The Board appointed Invista Real Estate Investment Management Limited as the Accounting Agent tothe Company from 1 April 2007. The Accounting Agent is entitled to a fee equal to 5 basis points of Net Asset Value subject to a minimum annual fee of £250,000.
The Board appointed Northern Trust International Fund Administration Services (Guernsey) Limited asthe Administrator to the Company with effect from 25 July 2007. The Administrator is entitled to anannual fee equal to £120,000.
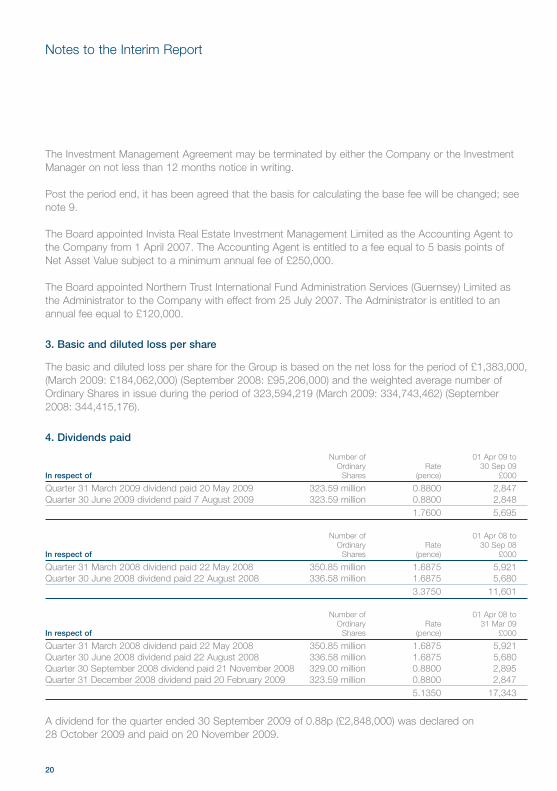
3. Basic and diluted loss per share
The basic and diluted loss per share for the Group is based on the net loss for the period of £1,383,000,(March 2009: £184,062,000) (September 2008: £95,206,000) and the weighted average number ofOrdinary Shares in issue during the period of 323,594,219 (March 2009: 334,743,462) (September2008: 344,415,176).
4. Dividends paid
Number of 01 Apr 09 toOrdinary Rate 30 Sep 09
In respect of Shares (pence) £000
Quarter 31 March 2009 dividend paid 20 May 2009 323.59 million 0.8800 2,847Quarter 30 June 2009 dividend paid 7 August 2009 323.59 million 0.8800 2,848
1.7600 5,695
Number of 01 Apr 08 toOrdinary Rate 30 Sep 08
In respect of Shares (pence) £000
Quarter 31 March 2008 dividend paid 22 May 2008 350.85 million 1.6875 5,921Quarter 30 June 2008 dividend paid 22 August 2008 336.58 million 1.6875 5,680
3.3750 11,601
Number of 01 Apr 08 toOrdinary Rate 31 Mar 09
In respect of Shares (pence) £000
Quarter 31 March 2008 dividend paid 22 May 2008 350.85 million 1.6875 5,921Quarter 30 June 2008 dividend paid 22 August 2008 336.58 million 1.6875 5,680Quarter 30 September 2008 dividend paid 21 November 2008 329.00 million 0.8800 2,895Quarter 31 December 2008 dividend paid 20 February 2009 323.59 million 0.8800 2,847
5.1350 17,343
A dividend for the quarter ended 30 September 2009 of 0.88p (£2,848,000) was declared on 28 October 2009 and paid on 20 November 2009.
Invista Foundation Property Trust Limited Interim Report 2009 21
Notes to the Interim Report
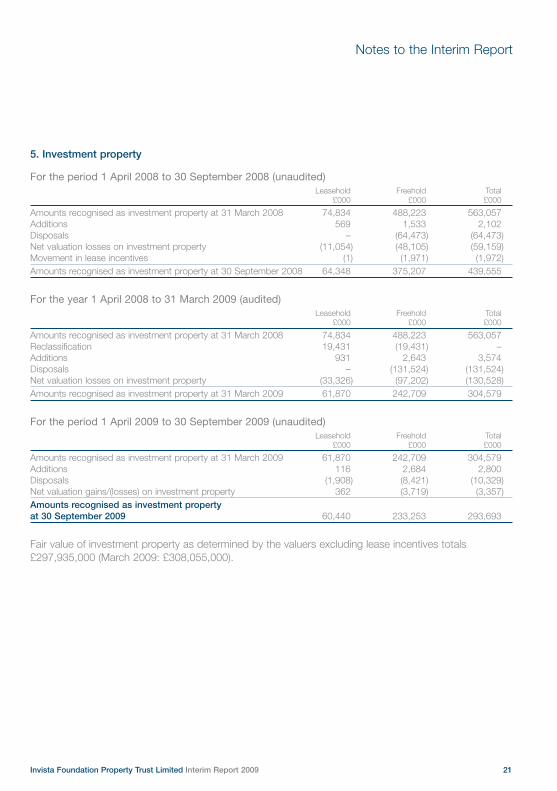
5. Investment property
For the period 1 April 2008 to 30 September 2008 (unaudited)Leasehold Freehold Total
£000 £000 £000
Amounts recognised as investment property at 31 March 2008 74,834 488,223 563,057Additions 569 1,533 2,102Disposals – (64,473) (64,473)Net valuation losses on investment property (11,054) (48,105) (59,159)Movement in lease incentives (1) (1,971) (1,972)Amounts recognised as investment property at 30 September 2008 64,348 375,207 439,555
For the year 1 April 2008 to 31 March 2009 (audited)Leasehold Freehold Total
£000 £000 £000
Amounts recognised as investment property at 31 March 2008 74,834 488,223 563,057Reclassification 19,431 (19,431) –Additions 931 2,643 3,574Disposals – (131,524) (131,524)Net valuation losses on investment property (33,326) (97,202) (130,528)Amounts recognised as investment property at 31 March 2009 61,870 242,709 304,579
For the period 1 April 2009 to 30 September 2009 (unaudited)Leasehold Freehold Total
£000 £000 £000
Amounts recognised as investment property at 31 March 2009 61,870 242,709 304,579Additions 116 2,684 2,800Disposals (1,908) (8,421) (10,329)Net valuation gains/(losses) on investment property 362 (3,719) (3,357)Amounts recognised as investment property at 30 September 2009 60,440 233,253 293,693
Fair value of investment property as determined by the valuers excluding lease incentives totals£297,935,000 (March 2009: £308,055,000).
22
Notes to the Interim Report
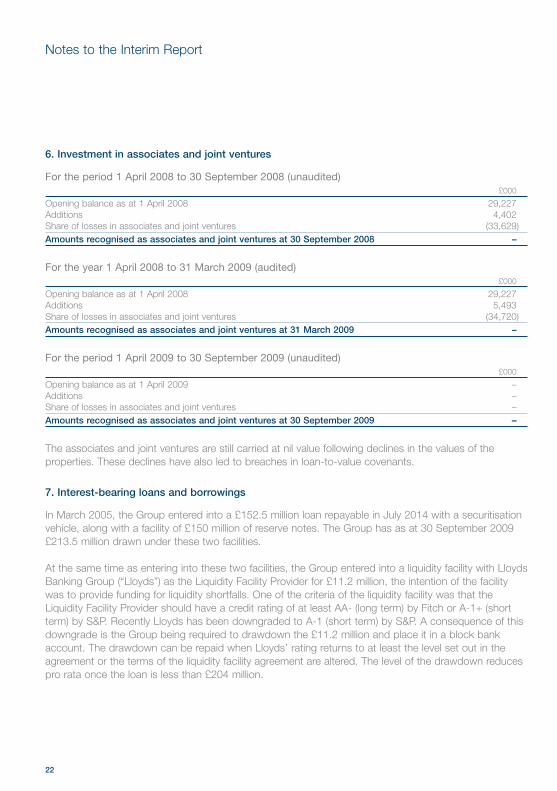
6. Investment in associates and joint ventures
For the period 1 April 2008 to 30 September 2008 (unaudited)£000
Opening balance as at 1 April 2008 29,227Additions 4,402Share of losses in associates and joint ventures (33,629)Amounts recognised as associates and joint ventures at 30 September 2008 –
For the year 1 April 2008 to 31 March 2009 (audited)£000
Opening balance as at 1 April 2008 29,227Additions 5,493Share of losses in associates and joint ventures (34,720)Amounts recognised as associates and joint ventures at 31 March 2009 –
For the period 1 April 2009 to 30 September 2009 (unaudited)£000
Opening balance as at 1 April 2009 –Additions –Share of losses in associates and joint ventures –Amounts recognised as associates and joint ventures at 30 September 2009 –
The associates and joint ventures are still carried at nil value following declines in the values of theproperties. These declines have also led to breaches in loan-to-value covenants.
7. Interest-bearing loans and borrowings
In March 2005, the Group entered into a £152.5 million loan repayable in July 2014 with a securitisationvehicle, along with a facility of £150 million of reserve notes. The Group has as at 30 September 2009£213.5 million drawn under these two facilities.
At the same time as entering into these two facilities, the Group entered into a liquidity facility with LloydsBanking Group (“Lloyds”) as the Liquidity Facility Provider for £11.2 million, the intention of the facilitywas to provide funding for liquidity shortfalls. One of the criteria of the liquidity facility was that theLiquidity Facility Provider should have a credit rating of at least AA- (long term) by Fitch or A-1+ (shortterm) by S&P. Recently Lloyds has been downgraded to A-1 (short term) by S&P. A consequence of thisdowngrade is the Group being required to drawdown the £11.2 million and place it in a block bankaccount. The drawdown can be repaid when Lloyds’ rating returns to at least the level set out in theagreement or the terms of the liquidity facility agreement are altered. The level of the drawdown reducespro rata once the loan is less than £204 million.
Invista Foundation Property Trust Limited Interim Report 2009 23
Notes to the Interim Report
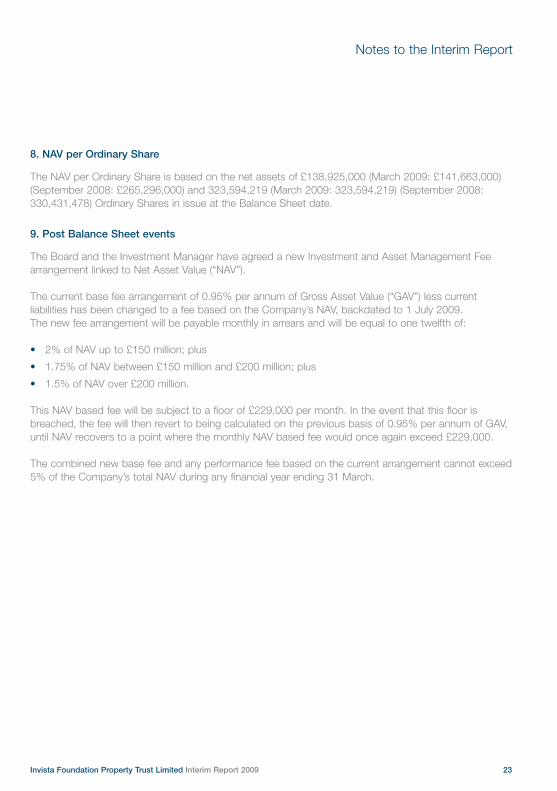
8. NAV per Ordinary Share
The NAV per Ordinary Share is based on the net assets of £138,925,000 (March 2009: £141,663,000)(September 2008: £265,296,000) and 323,594,219 (March 2009: 323,594,219) (September 2008:330,431,478) Ordinary Shares in issue at the Balance Sheet date.
9. Post Balance Sheet events
The Board and the Investment Manager have agreed a new Investment and Asset Management Feearrangement linked to Net Asset Value (“NAV”).
The current base fee arrangement of 0.95% per annum of Gross Asset Value (“GAV”) less currentliabilities has been changed to a fee based on the Company’s NAV, backdated to 1 July 2009. The new fee arrangement will be payable monthly in arrears and will be equal to one twelfth of:
• 2% of NAV up to £150 million; plus
• 1.75% of NAV between £150 million and £200 million; plus
• 1.5% of NAV over £200 million.
This NAV based fee will be subject to a floor of £229,000 per month. In the event that this floor isbreached, the fee will then revert to being calculated on the previous basis of 0.95% per annum of GAV,until NAV recovers to a point where the monthly NAV based fee would once again exceed £229,000.
The combined new base fee and any performance fee based on the current arrangement cannot exceed5% of the Company’s total NAV during any financial year ending 31 March.
24
Independent Auditors’ Review Reportto Invista Foundation Property Trust Limited (the “Company”)
IntroductionWe have been engaged by the Company to review the condensed set of financial statements in the half-yearly financial report for the six months ended 30 September 2009 which comprises CondensedStatement of Comprehensive Income, Condensed Balance Sheet, Condensed Statement of Changes inEquity, Condensed Statement of Cash Flows and the related explanatory notes. We have read the otherinformation contained in the half-yearly financial report and considered whether it contains any apparentmisstatements or material inconsistencies with the information in the condensed set of financial statements.
This report is made solely to the Company in accordance with the terms of our engagement to assist theCompany in meeting the requirements of the Disclosure and Transparency Rules (the "DTR") of the UnitedKingdom's Financial Services Authority (the "UK FSA"). Our review has been undertaken so that we mightstate to the Company those matters we are required to state to it in this report and for no other purpose.To the fullest extent permitted by law, we do not accept or assume responsibility to anyone other than theCompany for our review work, for this report, or for the conclusions we have reached.
Directors’ responsibilitiesThe half-yearly financial report is the responsibility of, and has been approved by, the Directors. The Directorsare responsible for preparing the half-yearly financial report in accordance with the DTR of the UK FSA.
As disclosed in note 1, the annual financial statements of the Group are prepared in accordance withIFRS. The condensed set of financial statements included in this half-yearly financial report has beenprepared in accordance with IAS 34 “Interim Financial Reporting”.
Our responsibilityOur responsibility is to express to the Company a conclusion on the condensed set of financial statementsin the half-yearly financial report based on our review.
Scope of reviewWe conducted our review in accordance with International Standard on Review Engagements (UK andIreland) 2410 “Review of Interim Financial Information Performed by the Independent Auditor of theEntity” issued by the Auditing Practices Board for use in the United Kingdom. A review of interimfinancial information consists of making enquiries, primarily of persons responsible for financial andaccounting matters, and applying analytical and other review procedures. A review is substantially less inscope than an audit conducted in accordance with International Standards on Auditing (UK and Ireland)and consequently does not enable us to obtain assurance that we would become aware of all significantmatters that might be identified in an audit. Accordingly, we do not express an audit opinion.
ConclusionBased on our review, nothing has come to our attention that causes us to believe that the condensedset of financial statements in the half-yearly financial report for the six months ended 30 September 2009is not prepared, in all material respects, in accordance with IAS 34 and the DTR of the UK FSA.
KPMG Channel Islands LimitedGuernsey
26 November 2009

Invista Foundation Property Trust Limited Interim Report 2009 25
Corporate Information
Registered addressTrafalgar CourtLes BanquesSt Peter PortGuernsey GY1 3QL
DirectorsAndrew Sykes (Chairman) Keith GoulbornJohn FrederiksenHarry Dick-Cleland David Warr Peter Atkinson (All Non-Executive Directors)
Investment Manager and Accounting AgentInvista Real Estate Investment ManagementLimitedExchequer Court33 St Mary AxeLondonEC3A 8AA
The Manager’s Investment CommitteeDuncan Owen (Chairman)Philip GadsdenNick MontgomeryMark Long
Secretary and AdministratorNorthern Trust International Fund AdministrationServices (Guernsey) LimitedTrafalgar CourtLes BanquesSt Peter PortGuernsey GY1 3QL
Solicitors to the Companyas to English Law:Herbert SmithExchange HousePrimrose StreetLondon EC2A 2HS
ISA/PEP statusThe Company’s shares are eligible for IndividualSavings Accounts (ISAs) and PEP transfers andcan continue to be held in existing PEPs.
AuditorKPMG Channel Islands Limited20 New StreetSt Peter PortGuernsey GY1 4AN
Property ValuersKnight Frank LLP20 Hanover SquareLondon W1S 1HZ
Channel Islands SponsorOzannes Securities Limited1 Le Marchant StreetSt. Peter PortGuernsey GY1 4HP
UK Sponsor and BrokerJPMorgan Cazenove Limited20 MoorgateLondon EC2R 6DA
Tax AdvisersDeloitte & Touche LLP180 StrandLondon WC2R 1BL
Receiving Agent and UK Transfer/Paying AgentComputershare InvestorServices PLC The PavilionsBridgewater RoadBristol BS99 1XZ
as to Guernsey Law:Ozannes1 Le Marchant StreetSt Peter PortGuernsey GY1 4HP
26
Important Information
Unless otherwise stated, the source of all information is Invista Real Estate Investment ManagementLimited. Unless otherwise stated all features in this document are current at the time of publication butmay be subject to change in the future. Any forecasts, other forward looking statements or opinions areInvista’s own and should not be regarded as guarantees. The data contained in this document is forinformation purposes only. It is correct to the best of our knowledge at the date of issue and may besubject to change.
This document is not legally binding and no party shall have any right of action against Invista in relationto the accuracy or completeness of the information contained in it or any other written or oral informationmade available in connection with it. Invista shall not be liable for any loss arising directly or indirectly asa result of reliance on this document.
Past performance is not a guide to future performance and the past performance of property funds is notalways represented by the performance of the property market as a whole. An investment’s value and theincome deriving from it may fall, as well as rise, due to market fluctuations. You may not get back theamount originally invested. The value of property is a matter of a valuer’s opinion rather than one of fact.Investments in property are relatively illiquid and more difficult to realise than equities or bonds.
This communication is not a promotion of, or invitation to, any person to acquire interests in the InvistaFoundation Property Trust Limited.

Invista Foundation Property Trust Limited Interim Report 2009 27
Notes

28
Notes

This publication was printed on Challenger Offset, made from FSC certified pulp.
It was produced to ISO 14001 Environmental Management System standards and95% of the waste created during the process was recycled. The materials usedincluded vegetable oil based inks, elemental chlorine free pulp and fibre from FSCmanaged forests.
The FSC (Forest Steward Council) managed forests have been independentlyinspected and comply with internationally agreed environmental, social andeconomic standards.
INV-462

Invista Real Estate Investment Management LimitedRegistered office Exchequer Court, 33 St Mary Axe, London EC3A 8AARegistered in England and Wales Registered number 04459443Authorised and regulated by the Financial Services Authority