Embed Size (px)
Citation preview
Biophysical Journal Volume 96 February 2009 1597–1605 1597
Ion Trapping with Fast-Response Ion-Selective Microelectrodes EnhancesDetection of Extracellular Ion Channel Gradients
Mark A. Messerli,* Leon P. Collis, and Peter J. S. SmithBioCurrents Research Center, Cell Dynamics Program, Marine Biological Laboratory, Woods Hole, Massachusetts 02543
ABSTRACT Previously, functional mapping of channels has been achieved by measuring the passage of net charge and ofspecific ions with electrophysiological and intracellular fluorescence imaging techniques. However, functional mapping of ionchannels using extracellular ion-selective microelectrodes has distinct advantages over the former methods. We have developedthis method through measurement of extracellular Kþ gradients caused by efflux through Ca2þ-activated Kþ channels expressedin Chinese hamster ovary cells. We report that electrodes constructed with short columns of a mechanically stable Kþ-selectiveliquid membrane respond quickly and measure changes in local [Kþ] consistent with a diffusion model. When used in closeproximity to the plasma membrane (<4 mm), the ISMs pose a barrier to simple diffusion, creating an ion trap. The ion trapamplifies the local change in [Kþ] without dramatically changing the rise or fall time of the [Kþ] profile. Measurement of extracel-lular Kþ gradients from activated rSlo channels shows that rapid events, 10–55 ms, can be characterized. This method providesa noninvasive means for functional mapping of channel location and density as well as for characterizing the properties of ionchannels in the plasma membrane.
INTRODUCTION
Plasma membrane ion channels are involved with maintain-
ing ionic balance and controlling ionic changes for signaling
pathways. Short-term blockade or inactivation of channels
destroys signaling pathways, whereas relatively long-term
inactivation interferes with ionic homeostasis and cell viabi-
lity (1). With the aid of voltage-clamp methods, parameters
such as conductance, permeability, and mode of activation
have been characterized for many different types of channels.
However, current methods for the functional mapping of the
location of ion channels on cells are tedious. There are at least
three different types of methods that have been used to map
the functional distribution of ion channels: 1), voltage clamp
of channels using loose patch clamp (reviewed by Roberts and
Almers (2)); 2), scanning ion conductance (SICM) using
whole-cell voltage clamp with a scanning current-passing
electrode (3); and 3), monitoring of intracellular fluorescent
ion indicators (4,5). The first two methods take advantage
of the measurement of current caused by the rapid movement
of charged ions across the plasma membrane, although
the measured current will be from any number of channels
with different ionic permeabilities. Additional experimental
manipulations are needed to obtain channel identity, includ-
ing ion substitution and/or removal, addition of specific phar-
macological blockers, and identification of activation or
reversal potentials. Loose patch-clamp methods are difficult
to use on flattened morphologically distinct regions of cells
compared to rounded-up regions and generally are not prac-
tical on small cells (2). Ion substitution was used in conjunc-
tion with SICM to functionally localize KATP channels on
Submitted August 15, 2008, and accepted for publication November 20, 2008.
*Correspondence: [email protected]
Editor: Michael Pusch.
� 2009 by the Biophysical Society
0006-3495/09/02/1597/9 $2.00
cardiac myocytes. Specifically, Kþ and other KATP permeant
ions were removed completely from both intracellular and
extracellular solutions. Kþ was supplied to the channel via
a scanning extracellular pipette filled with 1M Kþ (3). The
success of this method was dependent on nonphysiological
ionic conditions and whole-cell voltage clamp. The third
method, the use of fluorescent ion indicators to monitor ion
concentration changes after passage through channels, allows
long-term study of ion channels. However, it is at best
restricted to Ca2þ and Hþ influx through ion channels because
of the low intracellular concentration of the ions as well as the
high selectivity and sensitivity of their fluorescent indicators
compared to other inorganic ion indicators (6).
Based on the insight given by these methods, it became
apparent that extracellular ion-selective microelectrodes
(ISMs) could be used for functional mapping of ion channels
and also for characterization of the channels. Extracellular
ISMs have been used to measure steady and dynamic
changes in extracellular ion gradients near single cells and
tissues that arise as a result of ion passage across the plasma
membrane via channels, transporters, or exchangers (7,8).
Similar to fluorescent indicators, ISMs possess an inherent
selectivity enabling measurement of channel activity for
channels passing a specific ion in the presence of active
channels passing other ions. However, they possess a greater
signal/noise ratio than their corresponding fluorescent ion
indicators, are useful over a wider dynamic range, and exist
for a wide range of inorganic ions. Extracellular ISMs can be
used in a scanning mode similar to the SICM and loose patch
discussed above but do not contact the cell-like loose patch
and can be used under more physiologically relevant condi-
tions than those used with SICM.
In this report, we used fast-response Kþ-selective micro-
electrodes to capture rapid (10–55 ms duration) extracellular
doi: 10.1016/j.bpj.2008.11.025
1598 Messerli et al.
Kþ transients that arise from the activity of Ca2þ-activated
Kþ ion channels. We also report that ion trapping by the
ISM increases the magnitude of the single-channel gradients,
making it easier to detect and map the gradients.
MATERIALS AND METHODS
Electrode construction
Fast-response ISMs were fabricated by simple modifications to the previous
design (9). The fast-design Kþ-selective electrode incorporated a more
mechanically stable liquid membrane that enabled construction with stable
shorter columns, %10 mm. The Kþ-selective liquid membrane was made
similar to the Kþ-selective mixture 60398 (Sigma-Aldrich (Fluka), St. Louis,
MO), with the exception that 1,2-dimethyl-3-nitrobenzene was replaced
with 2-nitrophenyl octyl ether. The valinomycin-based liquid membranes
have >3 orders of magnitude selectivity for Kþ over other common cations
including Naþ, Hþ, Ca2þ, and Mg2þ (10). Microelectrode bodies for the
liquid membrane were pulled from both borosilicate (WPI, Sarasota, FL)
and aluminosilicate glass (Sutter Instruments, Novato, CA). Borosilicate
(1.5/0.84 and 2.0/1.12 mm OD/ID) and aluminosilicate (1.5/1.0 mm
OD/ID) glass capillaries were pulled to obtain tips of 2–3 mm inner diameter.
This resulted in tip wall thickness of 200 and 300 nm for the 1.5 and 2.0 mm
OD pipettes, respectively. Stable ISMs with short columns of ionophore were
not always possible with borosilicate glass but were made more consistently
with aluminosilicate glass. Pulled pipettes were silanized with the vapor
method by first drying glass at 230–240�C for 20 min under vacuum 28 in.
Hg. The evacuated oven was purged with argon, and the electrodes were intro-
duced to 20 mL of N,N-dimethyltrimethylsilylamine (Sigma-Aldrich (Fluka))
in an enclosed metal box at 230–240�C for 20 min. After silanization, pipettes
were stored in a bell jar with desiccant in the bottom. Electrical connection
was made with a Ag/AgCl wire connected to a backfilling solution of
100 mM KCl, 10 mM HEPES, pH 7.4.
Concentric ISMs were constructed according to previous designs (11,12).
Borosilicate glass with a filament (1.0/0.75 mm OD/ID) was inserted
and immobilized into a pulled and silanized outer borosilicate pipette
(1.5/1.12 mm OD/ID). Immobilization was achieved with a UV-curing glue,
Norland Optical Adhesive No. 74 (Norland Products, Cranbury, NJ). The tip
of the inner pipette was within 10 mm of the tip of the outer pipette. The inner
pipette was filled with backfilling solution before the liquid membrane was
tip loaded into the outer pipette. The liquid membrane was equilibrated with
100 mM KCl before loading as previously described (13).
ISMs measure ionic activity. However, we instead refer to ISMs as
measuring ionic concentration, as ionic activity is directly proportional to
ion concentration via the activity coefficient, and the changes that occur to
the activity coefficient as a result of changes in ionic strength are negligible
during our measurements. We reserve the term active or activity to discuss
the state of the ion channels.
Cell maintenance and handling
Chinese hamster ovary (CHO) cells stably expressing the Ca2þ-activated
Kþ channel, rSlo, were maintained in Iscove’s Modified Dulbecco’s Medium
with 10% FBS, HT supplement, and 1% of 10 K IU penicillin streptomycin
(Invitrogen, Carlsbad, CA). During recordings, medium was replaced with
a physiological saline containing (in mM) 140 NaCl, 5 CaCl2, 29 glucose,
25 HEPES, pH 7.2, with 0.3 KCl. Electrodes used for whole-cell voltage
clamp were filled with (in mM) 32.5 KCl, 97.5 Kþ gluconate, 5 EGTA,
10 HEPES, pH 7.2, with either 2.5 or 3.5 CaCl2 resulting in a final free
[Ca2þ] of ~200 and 400 nM, respectively, calculated with WEBMAXC Stan-
dard (14) (http://www.stanford.edu/~cpatton/maxc.html).
Kþ gradients were measured near the plasma membrane of CHO cells held
under whole-cell voltage clamp with varying [Ca2þ]i. Iberiotoxin (300 nM)
was added while clamping [Ca2þ]i to 400 nM to capture single-channel gradi-
ents at a range of applied voltages. Voltage clamp was performed with an
Biophysical Journal 96(4) 1597–1605
Axoclamp 200B amplifier while Kþ gradients were measured using an Axo-
clamp 2B amplifier with the 0.0001 H headstage. Additional amplification
was provided by a Warner Instruments LPF-100B (Hamden, CT). An offset
was applied to the ISM signal to apply gain and maintain the signal within
the dynamic range of the LPF-100B amplifier.
Ion gradient modeling and analysis
Construction of a realistic ISM
To assess the extent to which an ISM can affect the diffusion profile of Kþ
ions, a three-dimensional (3D) approach to modeling the movements of ions
was undertaken. First it was necessary to incorporate a 3D representation of
a typical ISM into the model environment. It was only necessary to incorpo-
rate a 10 mm length of the ISM from the tip, as we were analyzing the diffu-
sion of ions from a single ion channel over millisecond time periods. Typical
dimensions of tip diameter and taper angle were extracted from scanning
electron micrographs of ISMs and used to construct a 3D model using the
open-source 3D generation suite, Blender (version 2.45). This software
was run on a Linux platform (Fedora release 8) on a HP xw4400 workstation
with 2 GB RAM and a 2.1 GHz processor. ISMs were translated and rotated
within the 3D environment to assess the effect of orientation and separation
distance on the diffusion profile of ions.
Simulation of an ion channel
We used a Monte-Carlo method for simulating the Brownian motion of ions
from a point source in a 3D environment. For this purpose, the Model Descrip-
tion Language used within MCell (version 3.0 (15,16)) was used to simulate
the diffusion and random walk of Kþ ions from a point source (a 270 pS Kþ
channel) with a diffusion coefficient of 1.96 � 10�5 cm2 s�1. To decrease
simulation time, the extracellular background concentration of Kþ was left
at zero. Our graphs report the change to the local [Kþ]. The code was written
and executed using the same platform described above. Simulation time was
optimized by partitioning the 3D environment into 0.2-mm cubes and by
increasing the time step to 10 ms. Although this reduced the simulation time
significantly, no significant change in diffusion profile resulted from opti-
mizing these parameters (data not shown). The simulation generated ions at
a rate of 6.75� 107 s�1 from a single point source. To further reduce simula-
tion time, a 10 mm boundary box enclosed the simulation, and any ion that
contacted the box was deemed to have left the simulation space and was
removed from the simulation. This had no effect on diffusion profiles sampled
at %3 mm from the point source (data not shown). The boundary box was
omitted for the diffusion profiles collected at 10 mm from the source. After
a set channel open time (10–50 ms), the simulation was stopped, and simula-
tion data were checkpointed to a second simulation program where the ion
channel was closed.
Ion concentration was assessed using MCell sample boxes to count
ions. Sample boxes were generated using Blender and consisted of either
a 100-nm-thick disk covering the aperture of the ISM or a 100-nm-diameter
sphere at the center of the ISM aperture. The disk sample box was a reflection
of the actual ion concentration that the ISM would detect and thus convert to
a corresponding change in the electrode’s Nernstian voltage. However, ion
concentration was dependent on the orientation of the cylinder. To eliminate
the angle of the sample box as a variable, a sphere was used at varying
distances from the point source to calculate ion concentration. The separation
distance between the sample boxes and the point source was adjusted at incre-
menting distances from 0.2 mm to 10 mm. To reduce simulation noise and
obtain an average of simulation trials, the software was executed with
different initial seed values that generated different sequences of ‘‘pseudo-
random’’ numbers for the Monte-Carlo simulation.
Visualization of MCell simulation
To validate and verify the output of the MCell simulation, it was necessary to
generate 3D renderings of the meshes (ISM and sample boxes) and particles
(ions). MCell generated visualization files for use in the open-source 3D
Ion Channel Mapping with ISMs 1599
render software, DReAMM (version 3.3). All simulation images in this
manuscript were generated with DReAMM.
Mean open times were measured from single-channel gradients by hand
using the cursors in Clampfit (Molecular Devices, Sunnyvale, CA). These
values were used to calculate NPo, the product of the number of channels
(N) and the open probability (Po), at different voltages by summing the
time of the events and dividing by the time range used to collect the events.
NPo was calculated from transmembrane currents according to Eq. 8 of Gray
(17). Best-fit alignment of single-channel gradients was performed as
described earlier (18) with incorporation of the ion-trap correction factor
determined in this work.
RESULTS
Response times of Kþ-selective microelectrodes were deter-
mined by measuring a controlled transient change in [Kþ].
Current injection (20 pA) through one Kþ-selective micro-
electrode (source) was used to generate a step rise in [Kþ]
that was measured with a second Kþ-selective microelec-
trode, illustrated in Fig. 1 A. This method enables rapid
generation of a Kþ gradient of similar magnitude to those
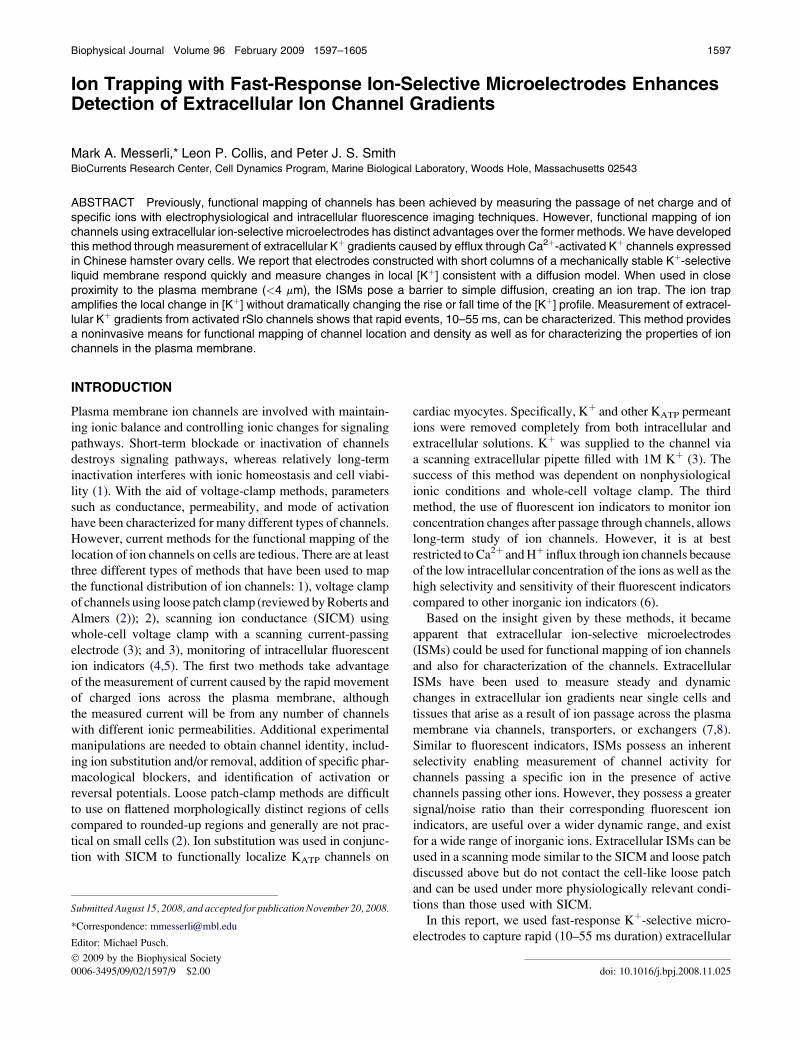
FIGURE 1 Diagrams showing the use of Kþ-selective microelectrodes.
(A) Current clamp of a Kþ-selective microelectrode was used to generate
a point source for an ion gradient of similar magnitude to those expected
from single Ca2þ-activated Kþ channels. [Kþ] profiles were collected by
the measuring Kþ-selective microelectrode at increasing distance from the
source. (B) Whole-cell voltage clamp was used to control the cytosolic
[Ca2þ] while depolarizing the membrane to activate the rSlo channels in
a controlled manner. The Kþ-selective microelectrode was moved in a
stop-and-hold mode, coming to rest for %10 s in a position near the cell
and also in a position 20 mm away from the cell.
generated by the ion channels in this study. The noise and
drift associated with flow systems prevented their use for
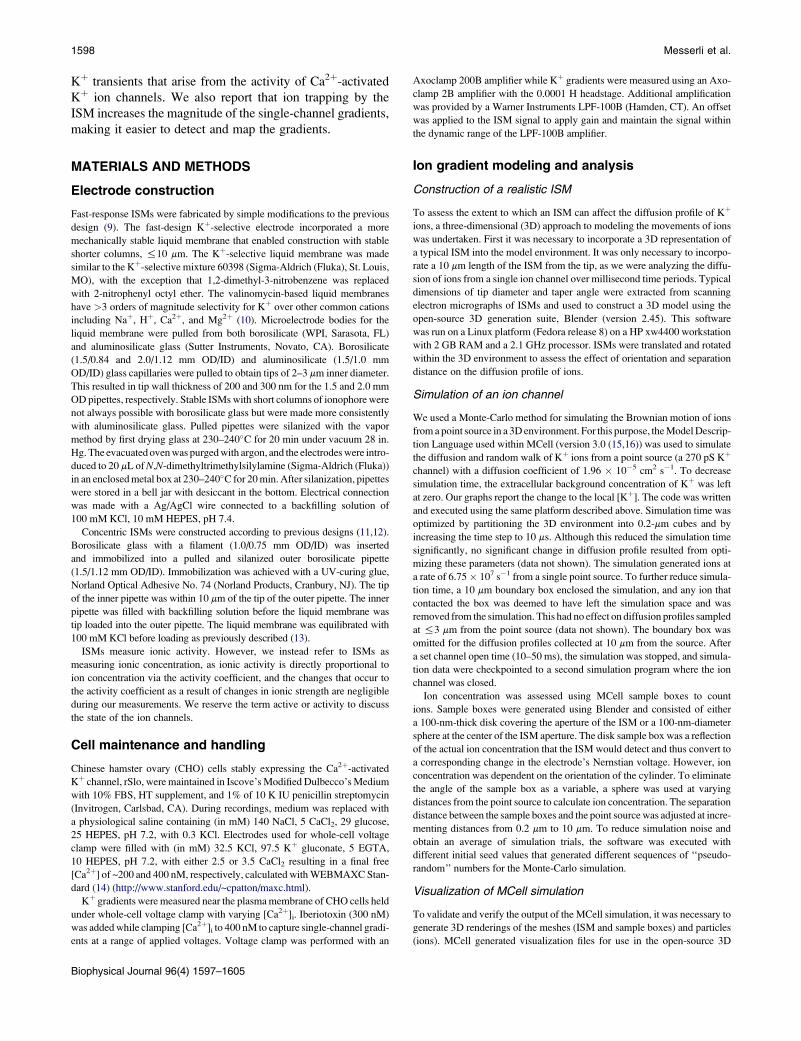
such small changes in [Kþ]. Fig. 2 A shows the voltage
recorded by the second Kþ-selective microelectrode at
increasing distance from the source electrode. The profiles
contain the electrical transient of the applied current step
summed with the measured [Kþ]-dependent voltage change.
The magnitude of the electrical transient was independent of
the distance between the source and measuring electrode and
was therefore subtracted to reveal only the [Kþ]-dependent
voltage measurements in Fig. 2 B. The measuring electrode
came from a batch of electrodes with inner tip diameters of
2.5–2.8 mm and was filled with a 30-mm column of Kþ-selec-
tive mixture made with 2-nitrophenyl octyl ether. [Kþ]
profiles are evident within a few micrometers from the
source electrode but are barely detected at 11.5 mm from
the source. The slopes of the rise times and amplitudes of
the [Kþ]-dependent voltage decrease with increasing
distance from the source electrode, consistent with diffusion
of Kþ away from the source electrode. We calculate a 95%
FIGURE 2 [Kþ] profiles measured at increasing distance from a current-
clamped source Kþ-selective electrode. (A) Raw voltage measurement from
a Kþ-selective microelectrode that contains the [Kþ]-dependent voltage
summed with a transient charge across the return electrode. The transient
charge across the return electrode was independent of position in the bath
and was subtracted to generate the [Kþ]-dependent voltages alone, as shown
in B. (B) The amplitude and rising and falling slopes of the [Kþ] profiles
decrease with increasing distance from the source electrode.
Biophysical Journal 96(4) 1597–1605
1600 Messerli et al.
response time (t95%) of 27 5 1 ms for this ISM based on the
measured [Kþ] profiles.
Detection of single-channel ion gradients
Extracellular changes in [Kþ] were monitored next to CHO
cells overexpressing rSlo channels as diagrammed in Fig. 1 B.
Gating of this type of channel is dependent on membrane
voltage, pHi, and [Ca2þ]i (19–22). Under the conditions we
used, channels require a transmembrane potential of at least
þ40 mV to open with 200 nM [Ca2þ]i but will open at
0 mV in the presence of 400 nM [Ca2þ]i. Once successful
whole-cell voltage clamp was achieved, the Kþ-selective
microelectrode was positioned next to the edge of the cell as
close as possible without touching the liquid membrane of
the ISM to the plasma membrane of the cell. Measurements
were obtained from cells still stuck relatively flat to the dish
and on cells that had rounded up slightly. With this setup,
depolarization of the plasma membrane created measurable
extracellular Kþ gradients in 9 of 14 cells. Failed measure-
ments were caused either by noisy ISMs in which the liquid
membrane was not stable within the micropipette or by the
ISM becoming physically blocked by debris in the culture
dish. Positioning of the ISM near the membrane without
touching was also a problem. Tapping the patched cell with
the liquid membrane caused an instant efflux of Kþ, and
tapping the patched cell with the side of the ISM broke the
high-resistance seal of the patch electrode.
When 200 nM [Ca2þ]i was used, a basal increase in Kþwas
measured along with very few single-channel gradients even
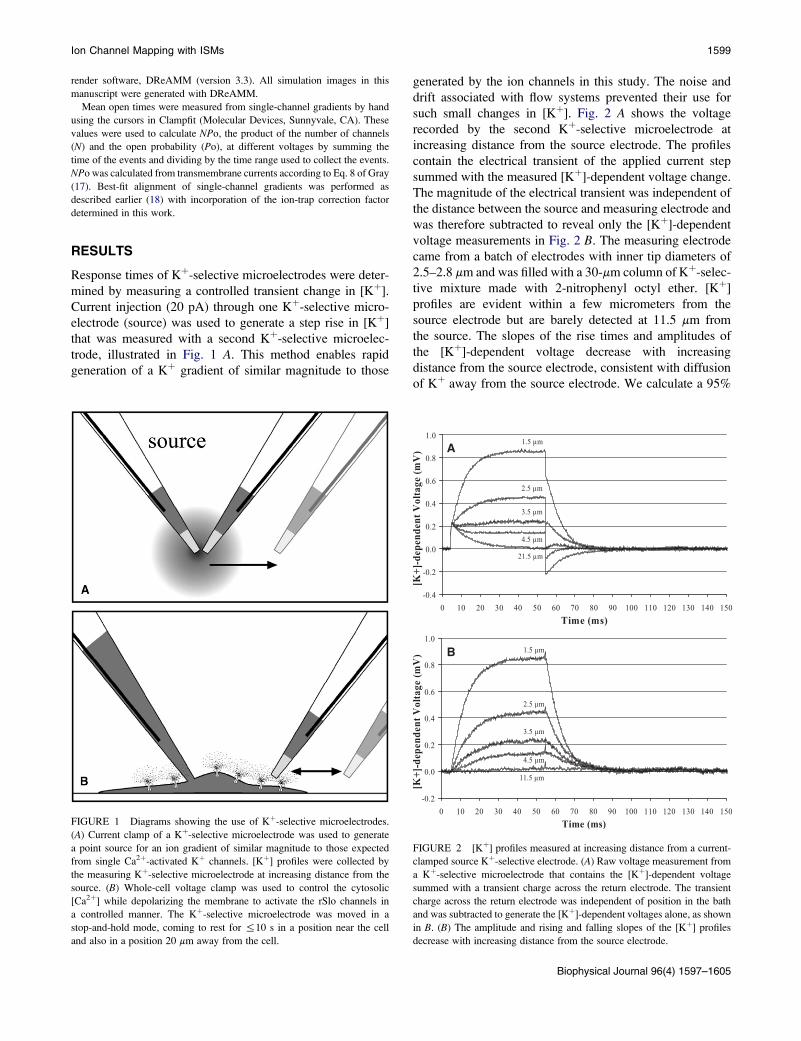
atþ60 mV. Fig. 3 shows a recording from a cell clamped with
200 nM [Ca2þ]i, first depolarized toþ60 mV and then polar-
ized to�60 mV, showing the difference in extracellular [Kþ]
between a membrane with active and then inactive channels.
The basal rise in [Kþ] is in part caused by the efflux of Kþ
FIGURE 3 Measurement of extracellular [Kþ] near the surface of a CHO
cell overexpressing rSlo channels at both depolarizing and resting potentials.
Depolarization was used to activate rSlo channels, giving rise to a slightly
higher background [Kþ] superimposed with single-channel gradients, which
appear as spikes. Voltage clamping the membrane back to �60 mV led to
inactivation of rSlo channels, a reduction in background [Kþ], and removal
of single-channel [Kþ] gradients. Breaking the GU seal allowed Kþ to flood
out of the patch electrode, leading to an immediate rise in [Kþ]-dependent
voltage measured by the ISM.
Biophysical Journal 96(4) 1597–1605
through activated channels but may also be caused by Kþ
efflux through transporters. Superimposed on the steady
increase in [Kþ]-dependent voltage are large-amplitude spikes
resulting from higher localized efflux of Kþ through the rSlo
channels, which are not seen at the�60 mV holding potential
when channels are not open. The single-channel gradients
were used to calculate a mean open time of 16.9 5 10.3 ms
(n ¼ 65 events) for the cell shown in Fig. 3.
With 400 nM [Ca2þ]i, the ISM measured large basal
increases in [Kþ] next to the cell, >8.5 mV at þ60 mV,
from the high overexpression and combined activation of
many of these channels. Single-channel gradients were not
easily resolved under these conditions. Iberiotoxin was added
to a final concentration of 300 nM to knock out a large fraction
of these channels to capture single-channel gradients over
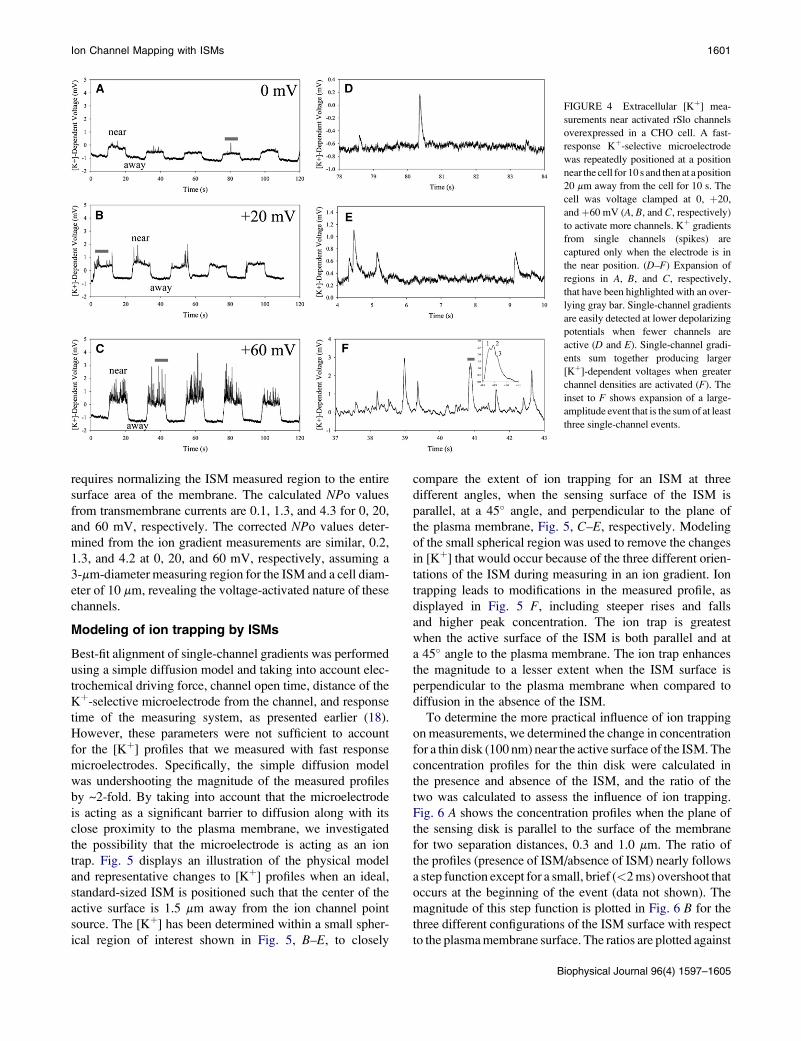
a range of holding potentials. Fig. 4, A–C, show representative
[Kþ]-dependent voltage changes measured with an ISM near
the same CHO cell, clamped to 0,þ20, andþ60 mV, respec-
tively. The cell remained clamped at each potential for the
duration of each recording. The ISM was moved in a stop-
and-hold mode with a period of 20 s, alternating between
a position near the cell and then 20 mm further away. This
gave rise to the step function in the recording, measuring
a greater [Kþ]-dependent voltage near the cell. Similar to
Fig. 3, large-amplitude spikes are superimposed on the steady
increase in [Kþ]-dependent voltage only when the ISM is near
the cell. The frequency and mean amplitude of the spikes
increase with increasing applied voltage as expected from
the nature of these channels. The single-channel ion gradients
are sufficiently small in the away position that they are buried
within the noise. Fig. 4, D–F, show expansion of the regions
under the gray bars in Fig. 4, A–C, respectively. The recording
in the near position is at the same region of the cell. With low
channel activity, gradients from single channels can be discre-
tized (Fig. 4, D and E). However, with higher activity, Kþ
gradients from different channel events sum together, giving
rise to much larger [Kþ]-dependent voltages as shown in
Fig. 4 F. The inset to Fig. 4 F shows expansion of a broad
spike under the gray bar in Fig. 4 F, indicating peaks from
three Kþ gradients or channel events. We use the term channel
events because currently we cannot resolve whether the three
ion gradients originated from the same channel firing rapidly
in succession or from multiple channels. The use of multiple
ISMs in close proximity could give better positional informa-
tion and help resolve this issue.
The single-channel gradients possess the information to
enable calculation of mean open times and open probabilities.
The mean open times for the events from the cell shown in
Fig. 4 are 33.5 5 7.9, 42.3 5 18.4, and 32.6 5 12.7 ms
when the membrane potential was held at 0, 20, and 60 mV,
respectively. NPo values can be determined from the ion
gradient measurements as well but only reveal the value for
a small patch of plasma membrane, whereas NPo values
from transmembrane currents represent channels over the
entire membrane. A direct comparison of these values
Ion Channel Mapping with ISMs 1601
FIGURE 4 Extracellular [Kþ] mea-
surements near activated rSlo channels
overexpressed in a CHO cell. A fast-
response Kþ-selective microelectrode
was repeatedly positioned at a position
near the cell for 10 s and then at a position
20 mm away from the cell for 10 s. The
cell was voltage clamped at 0, þ20,
andþ60 mV (A, B, and C, respectively)
to activate more channels. Kþ gradients
from single channels (spikes) are
captured only when the electrode is in
the near position. (D–F) Expansion of
regions in A, B, and C, respectively,
that have been highlighted with an over-
lying gray bar. Single-channel gradients
are easily detected at lower depolarizing
potentials when fewer channels are
active (D and E). Single-channel gradi-
ents sum together producing larger
[Kþ]-dependent voltages when greater
channel densities are activated (F). The
inset to F shows expansion of a large-
amplitude event that is the sum of at least
three single-channel events.
requires normalizing the ISM measured region to the entire
surface area of the membrane. The calculated NPo values
from transmembrane currents are 0.1, 1.3, and 4.3 for 0, 20,
and 60 mV, respectively. The corrected NPo values deter-
mined from the ion gradient measurements are similar, 0.2,
1.3, and 4.2 at 0, 20, and 60 mV, respectively, assuming a
3-mm-diameter measuring region for the ISM and a cell diam-
eter of 10 mm, revealing the voltage-activated nature of these
channels.
Modeling of ion trapping by ISMs
Best-fit alignment of single-channel gradients was performed
using a simple diffusion model and taking into account elec-
trochemical driving force, channel open time, distance of the
Kþ-selective microelectrode from the channel, and response
time of the measuring system, as presented earlier (18).
However, these parameters were not sufficient to account
for the [Kþ] profiles that we measured with fast response
microelectrodes. Specifically, the simple diffusion model
was undershooting the magnitude of the measured profiles
by ~2-fold. By taking into account that the microelectrode
is acting as a significant barrier to diffusion along with its
close proximity to the plasma membrane, we investigated
the possibility that the microelectrode is acting as an ion
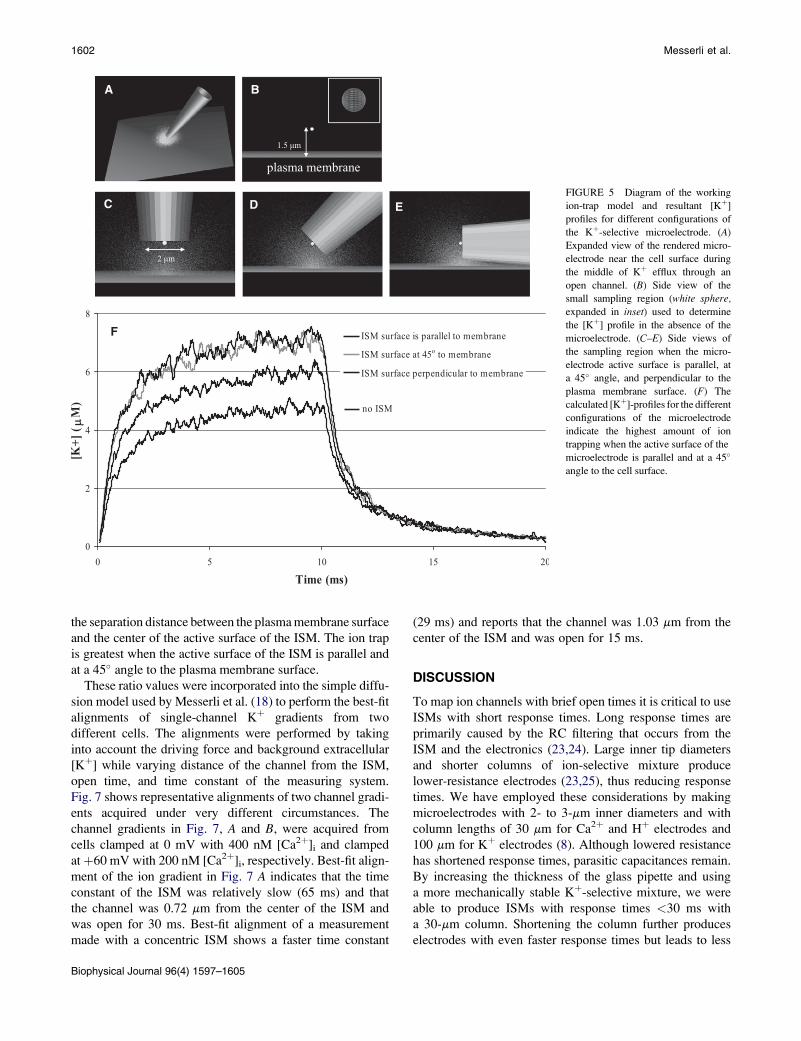
trap. Fig. 5 displays an illustration of the physical model
and representative changes to [Kþ] profiles when an ideal,
standard-sized ISM is positioned such that the center of the
active surface is 1.5 mm away from the ion channel point
source. The [Kþ] has been determined within a small spher-
ical region of interest shown in Fig. 5, B–E, to closely
compare the extent of ion trapping for an ISM at three
different angles, when the sensing surface of the ISM is
parallel, at a 45� angle, and perpendicular to the plane of
the plasma membrane, Fig. 5, C–E, respectively. Modeling
of the small spherical region was used to remove the changes
in [Kþ] that would occur because of the three different orien-
tations of the ISM during measuring in an ion gradient. Ion
trapping leads to modifications in the measured profile, as
displayed in Fig. 5 F, including steeper rises and falls
and higher peak concentration. The ion trap is greatest
when the active surface of the ISM is both parallel and at
a 45� angle to the plasma membrane. The ion trap enhances
the magnitude to a lesser extent when the ISM surface is
perpendicular to the plasma membrane when compared to
diffusion in the absence of the ISM.
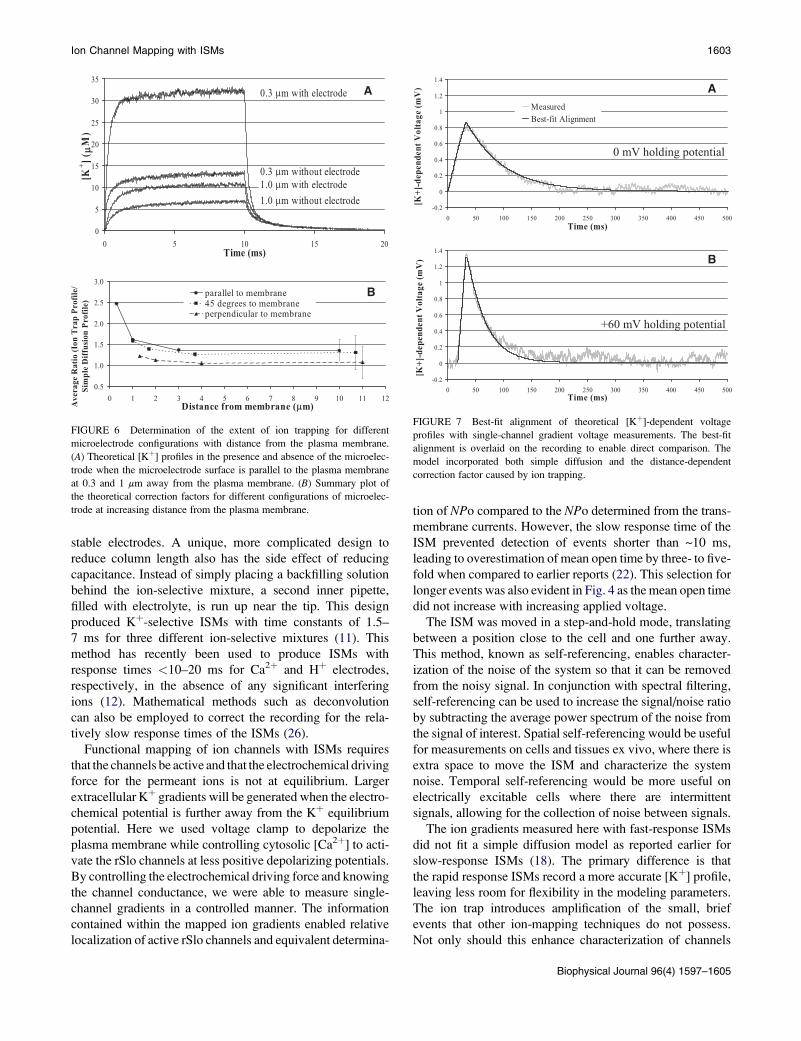
To determine the more practical influence of ion trapping
on measurements, we determined the change in concentration
for a thin disk (100 nm) near the active surface of the ISM. The
concentration profiles for the thin disk were calculated in
the presence and absence of the ISM, and the ratio of the
two was calculated to assess the influence of ion trapping.
Fig. 6 A shows the concentration profiles when the plane of
the sensing disk is parallel to the surface of the membrane
for two separation distances, 0.3 and 1.0 mm. The ratio of
the profiles (presence of ISM/absence of ISM) nearly follows
a step function except for a small, brief (<2 ms) overshoot that
occurs at the beginning of the event (data not shown). The
magnitude of this step function is plotted in Fig. 6 B for the
three different configurations of the ISM surface with respect
to the plasma membrane surface. The ratios are plotted against
Biophysical Journal 96(4) 1597–1605
1602 Messerli et al.
A B
C D E
F
FIGURE 5 Diagram of the working
ion-trap model and resultant [Kþ]
profiles for different configurations of
the Kþ-selective microelectrode. (A)
Expanded view of the rendered micro-
electrode near the cell surface during
the middle of Kþ efflux through an
open channel. (B) Side view of the
small sampling region (white sphere,
expanded in inset) used to determine
the [Kþ] profile in the absence of the
microelectrode. (C–E) Side views of
the sampling region when the micro-
electrode active surface is parallel, at
a 45� angle, and perpendicular to the
plasma membrane surface. (F) The
calculated [Kþ]-profiles for the different
configurations of the microelectrode
indicate the highest amount of ion
trapping when the active surface of the
microelectrode is parallel and at a 45�
angle to the cell surface.
the separation distance between the plasma membrane surface
and the center of the active surface of the ISM. The ion trap
is greatest when the active surface of the ISM is parallel and
at a 45� angle to the plasma membrane surface.
These ratio values were incorporated into the simple diffu-
sion model used by Messerli et al. (18) to perform the best-fit
alignments of single-channel Kþ gradients from two
different cells. The alignments were performed by taking
into account the driving force and background extracellular
[Kþ] while varying distance of the channel from the ISM,
open time, and time constant of the measuring system.
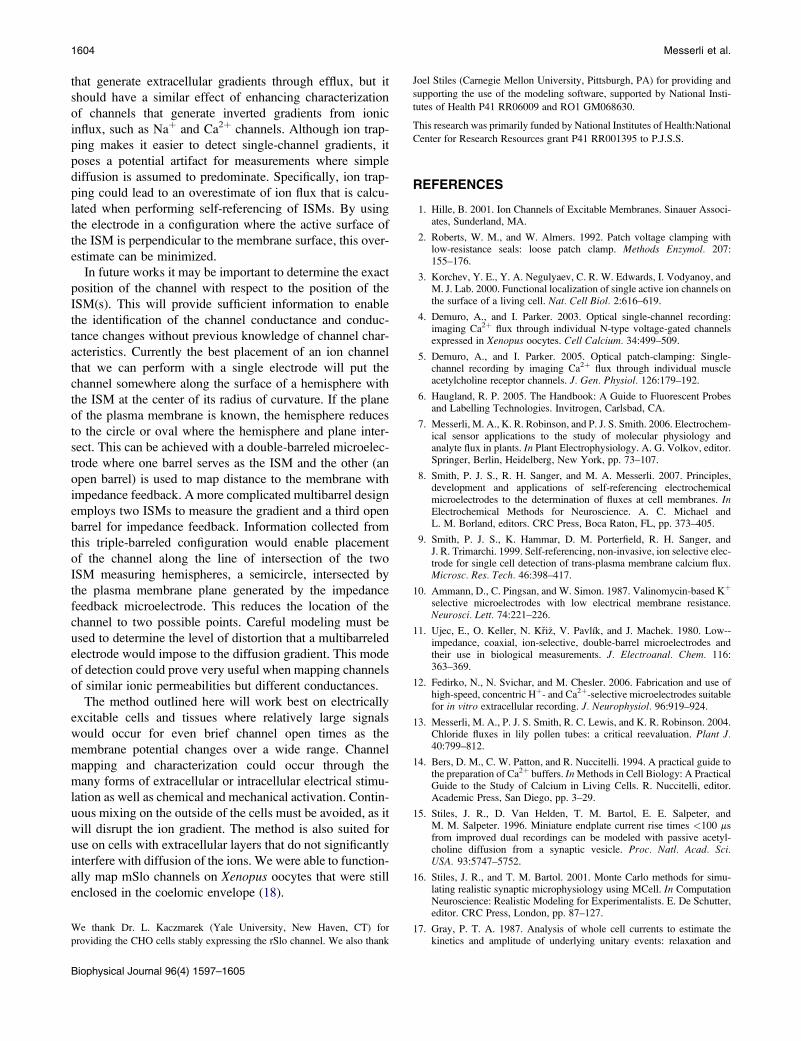
Fig. 7 shows representative alignments of two channel gradi-
ents acquired under very different circumstances. The
channel gradients in Fig. 7, A and B, were acquired from
cells clamped at 0 mV with 400 nM [Ca2þ]i and clamped
atþ60 mV with 200 nM [Ca2þ]i, respectively. Best-fit align-
ment of the ion gradient in Fig. 7 A indicates that the time
constant of the ISM was relatively slow (65 ms) and that
the channel was 0.72 mm from the center of the ISM and
was open for 30 ms. Best-fit alignment of a measurement
made with a concentric ISM shows a faster time constant
Biophysical Journal 96(4) 1597–1605
(29 ms) and reports that the channel was 1.03 mm from the
center of the ISM and was open for 15 ms.
DISCUSSION
To map ion channels with brief open times it is critical to use
ISMs with short response times. Long response times are
primarily caused by the RC filtering that occurs from the
ISM and the electronics (23,24). Large inner tip diameters
and shorter columns of ion-selective mixture produce
lower-resistance electrodes (23,25), thus reducing response
times. We have employed these considerations by making
microelectrodes with 2- to 3-mm inner diameters and with
column lengths of 30 mm for Ca2þ and Hþ electrodes and
100 mm for Kþ electrodes (8). Although lowered resistance
has shortened response times, parasitic capacitances remain.
By increasing the thickness of the glass pipette and using
a more mechanically stable Kþ-selective mixture, we were
able to produce ISMs with response times <30 ms with
a 30-mm column. Shortening the column further produces
electrodes with even faster response times but leads to less
Ion Channel Mapping with ISMs 1603
stable electrodes. A unique, more complicated design to
reduce column length also has the side effect of reducing
capacitance. Instead of simply placing a backfilling solution
behind the ion-selective mixture, a second inner pipette,
filled with electrolyte, is run up near the tip. This design
produced Kþ-selective ISMs with time constants of 1.5–
7 ms for three different ion-selective mixtures (11). This
method has recently been used to produce ISMs with
response times <10–20 ms for Ca2þ and Hþ electrodes,
respectively, in the absence of any significant interfering
ions (12). Mathematical methods such as deconvolution
can also be employed to correct the recording for the rela-
tively slow response times of the ISMs (26).
Functional mapping of ion channels with ISMs requires
that the channels be active and that the electrochemical driving
force for the permeant ions is not at equilibrium. Larger
extracellular Kþ gradients will be generated when the electro-
chemical potential is further away from the Kþ equilibrium
potential. Here we used voltage clamp to depolarize the
plasma membrane while controlling cytosolic [Ca2þ] to acti-
vate the rSlo channels at less positive depolarizing potentials.
By controlling the electrochemical driving force and knowing
the channel conductance, we were able to measure single-
channel gradients in a controlled manner. The information
contained within the mapped ion gradients enabled relative
localization of active rSlo channels and equivalent determina-
FIGURE 6 Determination of the extent of ion trapping for different
microelectrode configurations with distance from the plasma membrane.
(A) Theoretical [Kþ] profiles in the presence and absence of the microelec-
trode when the microelectrode surface is parallel to the plasma membrane
at 0.3 and 1 mm away from the plasma membrane. (B) Summary plot of
the theoretical correction factors for different configurations of microelec-
trode at increasing distance from the plasma membrane.
tion of NPo compared to the NPo determined from the trans-membrane currents. However, the slow response time of the
ISM prevented detection of events shorter than ~10 ms,
leading to overestimation of mean open time by three- to five-
fold when compared to earlier reports (22). This selection for
longer events was also evident in Fig. 4 as the mean open time
did not increase with increasing applied voltage.
The ISM was moved in a step-and-hold mode, translating
between a position close to the cell and one further away.
This method, known as self-referencing, enables character-
ization of the noise of the system so that it can be removed
from the noisy signal. In conjunction with spectral filtering,
self-referencing can be used to increase the signal/noise ratio
by subtracting the average power spectrum of the noise from
the signal of interest. Spatial self-referencing would be useful
for measurements on cells and tissues ex vivo, where there is
extra space to move the ISM and characterize the system
noise. Temporal self-referencing would be more useful on
electrically excitable cells where there are intermittent
signals, allowing for the collection of noise between signals.
The ion gradients measured here with fast-response ISMs
did not fit a simple diffusion model as reported earlier for
slow-response ISMs (18). The primary difference is that
the rapid response ISMs record a more accurate [Kþ] profile,
leaving less room for flexibility in the modeling parameters.
The ion trap introduces amplification of the small, brief
events that other ion-mapping techniques do not possess.
Not only should this enhance characterization of channels
-0.2
0
0.2
0.4
0.6
0.8
1
1.2
1.4
0 50 100 150 200 250 300 350 400 450 500Time (ms)
[K+]
-dep
ende
nt V
olta
ge (m
V)
MeasuredBest-fit Alignment
-0.2
0
0.2
0.4
0.6
0.8
1
1.2
1.4
0 50 100 150 200 250 300 350 400 450 500Time (ms)
[K+]
-dep
ende
nt V
olta
ge (m
V)
0 mV holding potential
+60 mV holding potential
A
B
FIGURE 7 Best-fit alignment of theoretical [Kþ]-dependent voltage
profiles with single-channel gradient voltage measurements. The best-fit
alignment is overlaid on the recording to enable direct comparison. The
model incorporated both simple diffusion and the distance-dependent
correction factor caused by ion trapping.
Biophysical Journal 96(4) 1597–1605
Biophysical Journal 96(4) 1597–1605
1604 Messerli et al.
Joel Stiles (Carnegie Mellon University, Pittsburgh, PA) for providing and
supporting the use of the modeling software, supported by National Insti-
tutes of Health P41 RR06009 and RO1 GM068630.
This research was primarily funded by National Institutes of Health:National
Center for Research Resources grant P41 RR001395 to P.J.S.S.
REFERENCES
1. Hille, B. 2001. Ion Channels of Excitable Membranes. Sinauer Associ-ates, Sunderland, MA.
2. Roberts, W. M., and W. Almers. 1992. Patch voltage clamping withlow-resistance seals: loose patch clamp. Methods Enzymol. 207:155–176.
3. Korchev, Y. E., Y. A. Negulyaev, C. R. W. Edwards, I. Vodyanoy, andM. J. Lab. 2000. Functional localization of single active ion channels onthe surface of a living cell. Nat. Cell Biol. 2:616–619.
4. Demuro, A., and I. Parker. 2003. Optical single-channel recording:imaging Ca2þ flux through individual N-type voltage-gated channelsexpressed in Xenopus oocytes. Cell Calcium. 34:499–509.
5. Demuro, A., and I. Parker. 2005. Optical patch-clamping: Single-channel recording by imaging Ca2þ flux through individual muscleacetylcholine receptor channels. J. Gen. Physiol. 126:179–192.
6. Haugland, R. P. 2005. The Handbook: A Guide to Fluorescent Probesand Labelling Technologies. Invitrogen, Carlsbad, CA.
7. Messerli, M. A., K. R. Robinson, and P. J. S. Smith. 2006. Electrochem-ical sensor applications to the study of molecular physiology andanalyte flux in plants. In Plant Electrophysiology. A. G. Volkov, editor.Springer, Berlin, Heidelberg, New York, pp. 73–107.
8. Smith, P. J. S., R. H. Sanger, and M. A. Messerli. 2007. Principles,development and applications of self-referencing electrochemicalmicroelectrodes to the determination of fluxes at cell membranes. InElectrochemical Methods for Neuroscience. A. C. Michael andL. M. Borland, editors. CRC Press, Boca Raton, FL, pp. 373–405.
9. Smith, P. J. S., K. Hammar, D. M. Porterfield, R. H. Sanger, andJ. R. Trimarchi. 1999. Self-referencing, non-invasive, ion selective elec-trode for single cell detection of trans-plasma membrane calcium flux.Microsc. Res. Tech. 46:398–417.
10. Ammann, D., C. Pingsan, and W. Simon. 1987. Valinomycin-based Kþ
selective microelectrodes with low electrical membrane resistance.Neurosci. Lett. 74:221–226.
11. Ujec, E., O. Keller, N. Kri�z, V. Pavlık, and J. Machek. 1980. Low--impedance, coaxial, ion-selective, double-barrel microelectrodes andtheir use in biological measurements. J. Electroanal. Chem. 116:363–369.
12. Fedirko, N., N. Svichar, and M. Chesler. 2006. Fabrication and use ofhigh-speed, concentric Hþ- and Ca2þ-selective microelectrodes suitablefor in vitro extracellular recording. J. Neurophysiol. 96:919–924.
13. Messerli, M. A., P. J. S. Smith, R. C. Lewis, and K. R. Robinson. 2004.Chloride fluxes in lily pollen tubes: a critical reevaluation. Plant J.40:799–812.
14. Bers, D. M., C. W. Patton, and R. Nuccitelli. 1994. A practical guide tothe preparation of Ca2þ buffers. In Methods in Cell Biology: A PracticalGuide to the Study of Calcium in Living Cells. R. Nuccitelli, editor.Academic Press, San Diego, pp. 3–29.
15. Stiles, J. R., D. Van Helden, T. M. Bartol, E. E. Salpeter, andM. M. Salpeter. 1996. Miniature endplate current rise times <100 msfrom improved dual recordings can be modeled with passive acetyl-choline diffusion from a synaptic vesicle. Proc. Natl. Acad. Sci.USA. 93:5747–5752.
16. Stiles, J. R., and T. M. Bartol. 2001. Monte Carlo methods for simu-lating realistic synaptic microphysiology using MCell. In ComputationNeuroscience: Realistic Modeling for Experimentalists. E. De Schutter,editor. CRC Press, London, pp. 87–127.
17. Gray, P. T. A. 1987. Analysis of whole cell currents to estimate thekinetics and amplitude of underlying unitary events: relaxation and
that generate extracellular gradients through efflux, but it
should have a similar effect of enhancing characterization
of channels that generate inverted gradients from ionic
influx, such as Naþ and Ca2þ channels. Although ion trap-
ping makes it easier to detect single-channel gradients, it
poses a potential artifact for measurements where simple
diffusion is assumed to predominate. Specifically, ion trap-
ping could lead to an overestimate of ion flux that is calcu-
lated when performing self-referencing of ISMs. By using
the electrode in a configuration where the active surface of
the ISM is perpendicular to the membrane surface, this over-
estimate can be minimized.
In future works it may be important to determine the exact
position of the channel with respect to the position of the
ISM(s). This will provide sufficient information to enable
the identification of the channel conductance and conduc-
tance changes without previous knowledge of channel char-
acteristics. Currently the best placement of an ion channel
that we can perform with a single electrode will put the
channel somewhere along the surface of a hemisphere with
the ISM at the center of its radius of curvature. If the plane
of the plasma membrane is known, the hemisphere reduces
to the circle or oval where the hemisphere and plane inter-
sect. This can be achieved with a double-barreled microelec-
trode where one barrel serves as the ISM and the other (an
open barrel) is used to map distance to the membrane with
impedance feedback. A more complicated multibarrel design
employs two ISMs to measure the gradient and a third open
barrel for impedance feedback. Information collected from
this triple-barreled configuration would enable placement
of the channel along the line of intersection of the two
ISM measuring hemispheres, a semicircle, intersected by
the plasma membrane plane generated by the impedance
feedback microelectrode. This reduces the location of the
channel to two possible points. Careful modeling must be
used to determine the level of distortion that a multibarreled
electrode would impose to the diffusion gradient. This mode
of detection could prove very useful when mapping channels
of similar ionic permeabilities but different conductances.
The method outlined here will work best on electrically
excitable cells and tissues where relatively large signals
would occur for even brief channel open times as the
membrane potential changes over a wide range. Channel
mapping and characterization could occur through the
many forms of extracellular or intracellular electrical stimu-
lation as well as chemical and mechanical activation. Contin-
uous mixing on the outside of the cells must be avoided, as it
will disrupt the ion gradient. The method is also suited for
use on cells with extracellular layers that do not significantly
interfere with diffusion of the ions. We were able to function-
ally map mSlo channels on Xenopus oocytes that were still
enclosed in the coelomic envelope (18).
We thank Dr. L. Kaczmarek (Yale University, New Haven, CT) for
providing the CHO cells stably expressing the rSlo channel. We also thank
Ion Channel Mapping with ISMs 1605
‘‘noise’’ analysis. In Microelectrode Techniques. D. Ogden, editor. TheCompany of Biologists, Cambridge.
18. Messerli, M. A., E. D. Corson, and P. J. S. Smith. 2007. Measuring
extracellular ion gradients from single channels with ion-selective
microelectrodes. Biophys. J. 92:L52–L54.
19. Laurido, C., S. Candia, D. Wolff, and R. Latorre. 1991. Proton modu-
lation of a Ca2þ-activated Kþ channel from rat skeletal muscle incorpo-
rated into planar bilayers. J. Gen. Physiol. 98:1025–1043.
20. Butler, A., S. Tsunoda, D. P. McCobb, A. Wei, and L. Salkoff. 1993.
mSlo, a complex mouse gene encoding ‘‘maxi’’ calcium-activated
potassium channels. Science. 261:221–224.
21. Ha, T. S., S. Y. Jeong, S. -W. Cho, H. -k. Jeon, G. S. Roh, et al. 2000.
Funtional characteristics of two BKCa channel variants differentially
expressed in rat brain tissues. Eur. J. Biochem. 267:910–918.
22. Barrett, J. N., K. L. Magleby, and B. S. Pallotta. 1982. Properties ofsingle calcium-activated potassium channels in cultured rat muscle.J. Physiol. 331:211–230.
23. Ammann, D. 1986. Ion-Selective Microelectrodes. Springer-Verlag,Berlin.
24. Bakker, E., P. Buhlmann, and E. Pretsch. 1997. Carrier-based ion-selective electrodes and bulk optodes. 1. General characteristics. Chem.Rev. 97:3083–3132.
25. Orme, F. W. 1969. Liquid ion-exchanger microelectrodes. In GlassMicroelectrodes. M. Lavallee, O. F. Schanne, and N. C. Hebert, editors.John Wiley & Sons, New York, pp. 376–395.
26. Tucker, J. L., R. Wen, and B. Oakley, II.. 1991. A deconvolution tech-nique for improved estimation of rapid changes in ion concentrationrecorded with ion-selective microelectrodes. IEEE Trans. Biomed.Eng. 38:156–160.
Biophysical Journal 96(4) 1597–1605


![University of Groningen Unraveling molecular signaling in ...oxidative phosphorylation, ion gradients, membrane potential, ROS generation and heat dissipation [23,24]. We demonstrated](https://img.pdfslide.net/doc/110x75/612846483b346e59a66ce96d/university-of-groningen-unraveling-molecular-signaling-in-oxidative-phosphorylation.jpg)
![[PPT]PowerPoint Presentation - Montana State University … 2009... · Web viewElectrochemical Potentials A. Factors responsible 1. ion concentration gradients on either side of the](https://img.pdfslide.net/doc/110x75/5b257b6a7f8b9ae13b8b4689/pptpowerpoint-presentation-montana-state-university-2009-web-viewelectrochemical.jpg)