Embed Size (px)
Citation preview
ipd.com RESEARCH
IPD Global PerformanceAnnual results for 2013
IPD global coverage
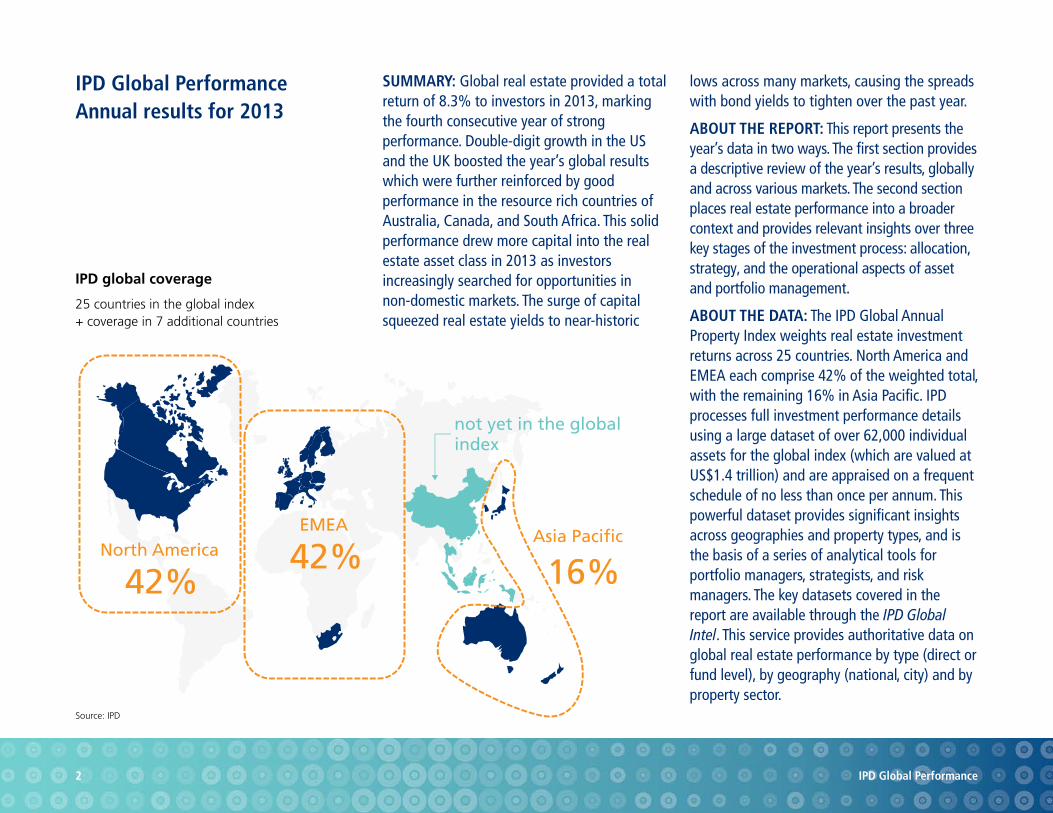
25 countries in the global index + coverage in 7 additional countries
North America
42%
EMEA
42%Asia Pacific
16%
not yet in the global index
Source: IPD
IPD global coverage
25 countries in the global index + coverage in 7 additional countries
2 IPD Global Performance
IPD Global PerformanceAnnual results for 2013
SUMMARY: Global real estate provided a total return of 8.3% to investors in 2013, marking the fourth consecutive year of strong performance. Double-digit growth in the US and the UK boosted the year’s global results which were further reinforced by good performance in the resource rich countries of Australia, Canada, and South Africa. This solid performance drew more capital into the real estate asset class in 2013 as investors increasingly searched for opportunities in non-domestic markets. The surge of capital squeezed real estate yields to near-historic
lows across many markets, causing the spreads with bond yields to tighten over the past year.
ABOUT THE REPORT: This report presents the year’s data in two ways. The first section provides a descriptive review of the year’s results, globally and across various markets. The second section places real estate performance into a broader context and provides relevant insights over three key stages of the investment process: allocation, strategy, and the operational aspects of asset and portfolio management.
ABOUT THE DATA: The IPD Global Annual Property Index weights real estate investment returns across 25 countries. North America and EMEA each comprise 42% of the weighted total, with the remaining 16% in Asia Pacific. IPD processes full investment performance details using a large dataset of over 62,000 individual assets for the global index (which are valued at US$1.4 trillion) and are appraised on a frequent schedule of no less than once per annum. This powerful dataset provides significant insights across geographies and property types, and is the basis of a series of analytical tools for portfolio managers, strategists, and risk managers. The key datasets covered in the report are available through the IPD Global Intel. This service provides authoritative data on global real estate performance by type (direct or fund level), by geography (national, city) and by property sector.

Section 1
2013: Another year of strong real estate performance
Global 8.3%
-40
-30
-20
-10
0
10
20
30
40
1998 1999 2000 2001 2002 2003 2004 2005 2006 2007 2008 2009 2010 2011 2012 2013
% pa
Number ofCountries Standard Deviation
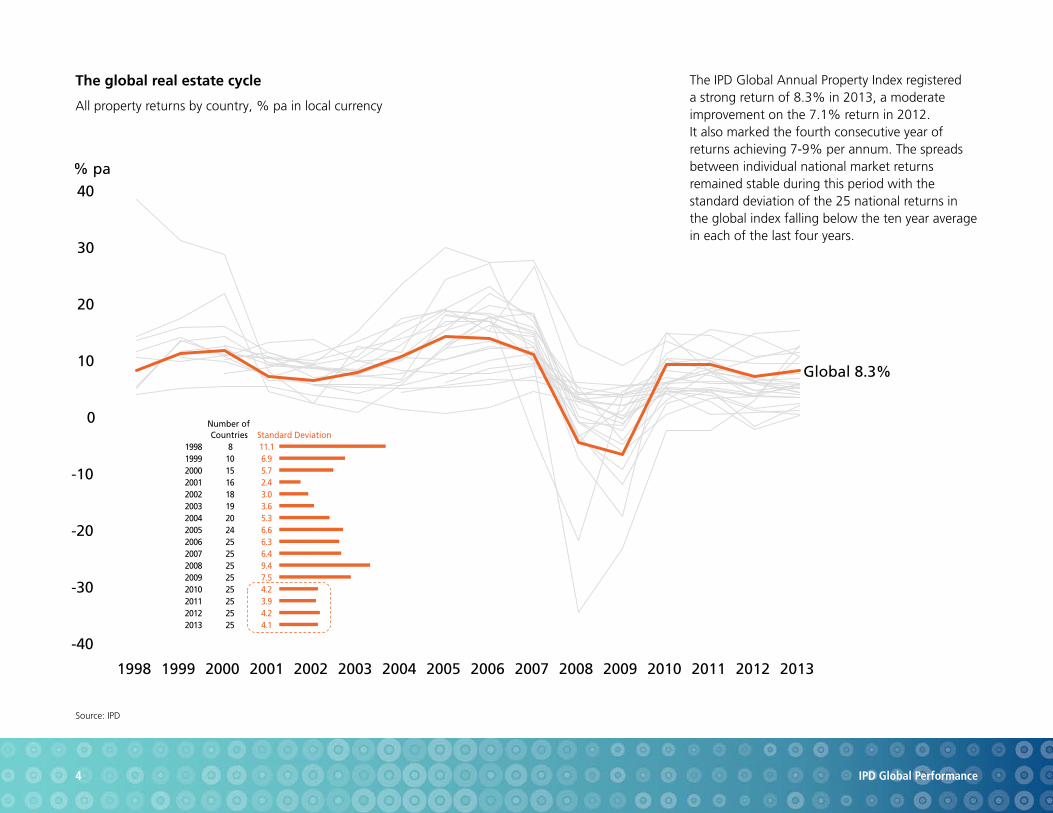
1998 8 11.11999 10 6.92000 15 5.72001 16 2.42002 18 3.02003 19 3.62004 20 5.32005 24 6.62006 25 6.32007 25 6.42008 25 9.42009 25 7.52010 25 4.22011 25 3.92012 25 4.22013 25 4.1
Source: IPD
4 IPD Global Performance
The global real estate cycle
All property returns by country, % pa in local currency
The IPD Global Annual Property Index registered a strong return of 8.3% in 2013, a moderate improvement on the 7.1% return in 2012. It also marked the fourth consecutive year of returns achieving 7-9% per annum. The spreads between individual national market returns remained stable during this period with the standard deviation of the 25 national returns in the global index falling below the ten year average in each of the last four years.
Source: IPD, KTI
5 IPD Global Performance
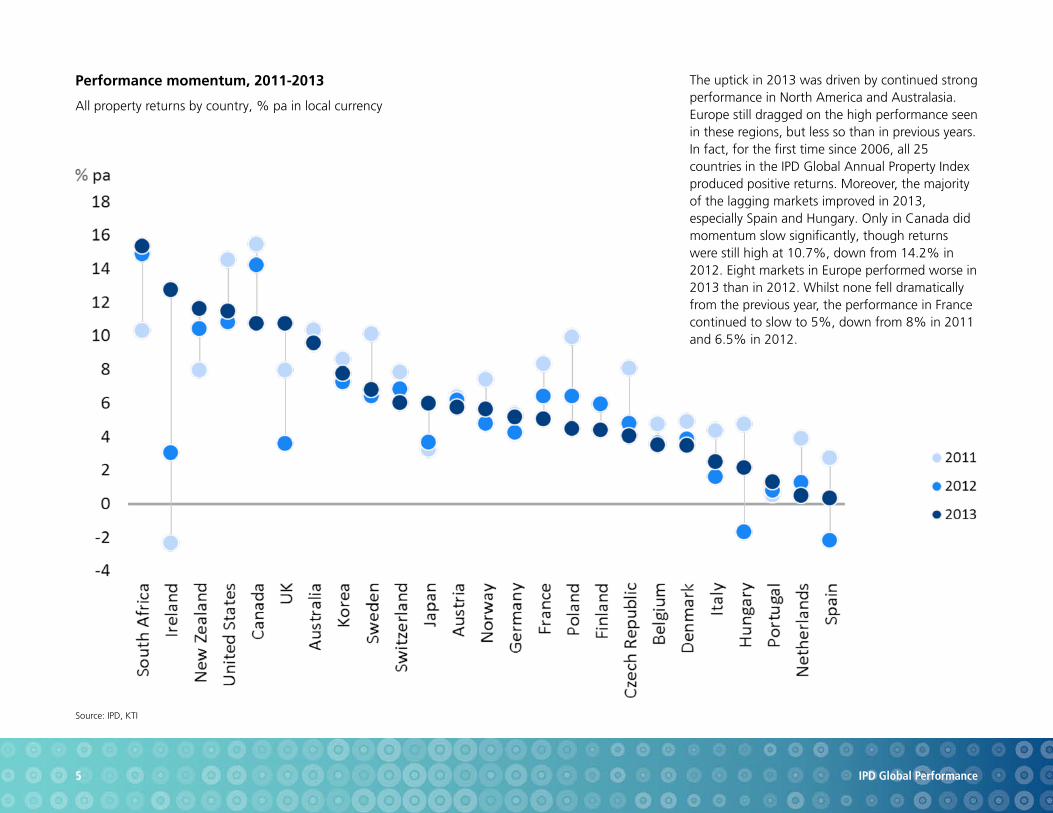
Performance momentum, 2011-2013
All property returns by country, % pa in local currency
The uptick in 2013 was driven by continued strong performance in North America and Australasia. Europe still dragged on the high performance seen in these regions, but less so than in previous years. In fact, for the first time since 2006, all 25 countries in the IPD Global Annual Property Index produced positive returns. Moreover, the majority of the lagging markets improved in 2013, especially Spain and Hungary. Only in Canada did momentum slow significantly, though returns were still high at 10.7%, down from 14.2% in 2012. Eight markets in Europe performed worse in 2013 than in 2012. Whilst none fell dramatically from the previous year, the performance in France continued to slow to 5%, down from 8% in 2011 and 6.5% in 2012.
Source: IPD, KTI
6 IPD Global Performance
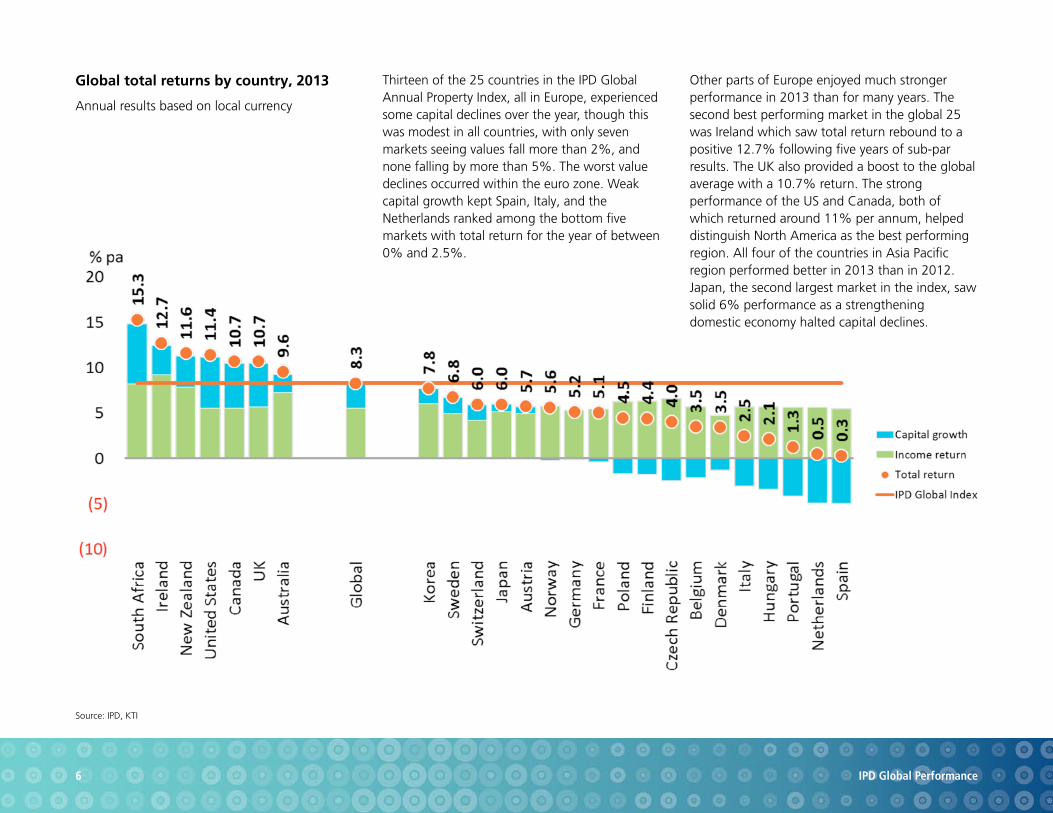
Global total returns by country, 2013
Annual results based on local currency
Thirteen of the 25 countries in the IPD Global Annual Property Index, all in Europe, experienced some capital declines over the year, though this was modest in all countries, with only seven markets seeing values fall more than 2%, and none falling by more than 5%. The worst value declines occurred within the euro zone. Weak capital growth kept Spain, Italy, and the Netherlands ranked among the bottom five markets with total return for the year of between 0% and 2.5%.
Other parts of Europe enjoyed much stronger performance in 2013 than for many years. The second best performing market in the global 25 was Ireland which saw total return rebound to a positive 12.7% following five years of sub-par results. The UK also provided a boost to the global average with a 10.7% return. The strong performance of the US and Canada, both of which returned around 11% per annum, helped distinguish North America as the best performing region. All four of the countries in Asia Pacific region performed better in 2013 than in 2012. Japan, the second largest market in the index, saw solid 6% performance as a strengthening domestic economy halted capital declines.
Notes: 10 year annualised averages not available for Belgium, Czech Republic, Hungary, Korea, and Poland
Source: IPD, KTI
7 IPD Global Performance
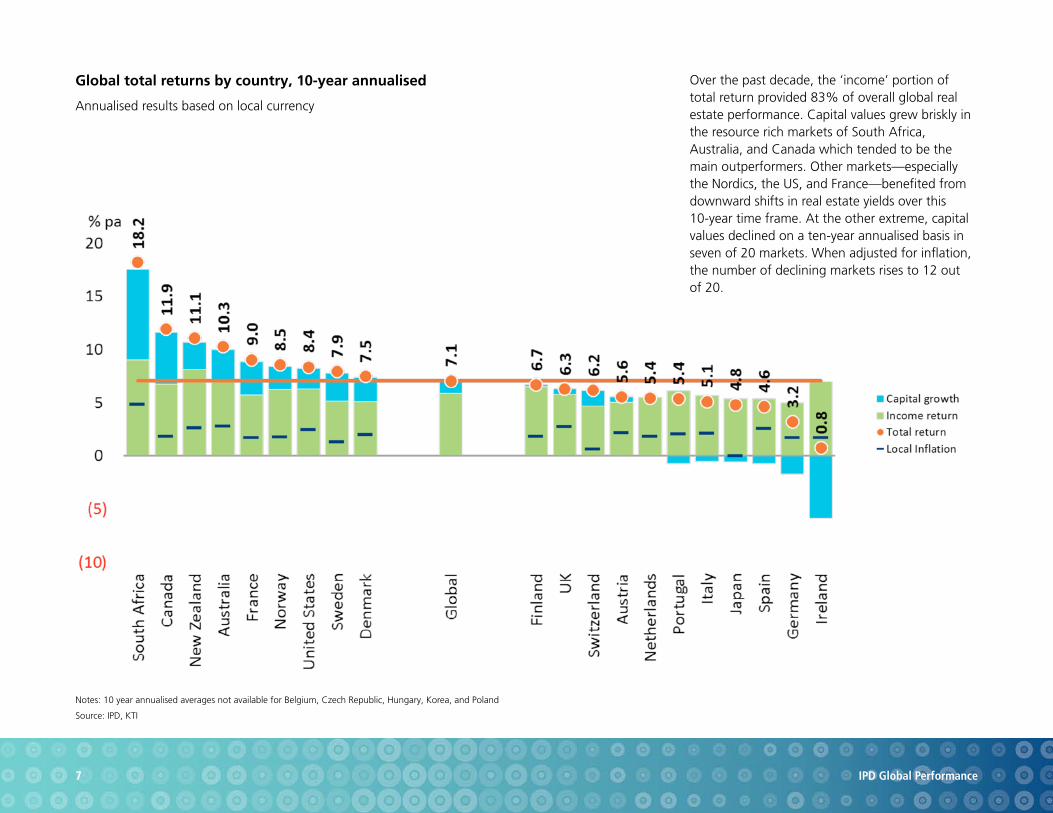
Global total returns by country, 10 -year annualised
Annualised results based on local currency
Over the past decade, the ‘income’ portion of total return provided 83% of overall global real estate performance. Capital values grew briskly in the resource rich markets of South Africa, Australia, and Canada which tended to be the main outperformers. Other markets—especially the Nordics, the US, and France—benefited from downward shifts in real estate yields over this 10-year time frame. At the other extreme, capital values declined on a ten-year annualised basis in seven of 20 markets. When adjusted for inflation, the number of declining markets rises to 12 out of 20.
Source: IPD
8 IPD Global Performance
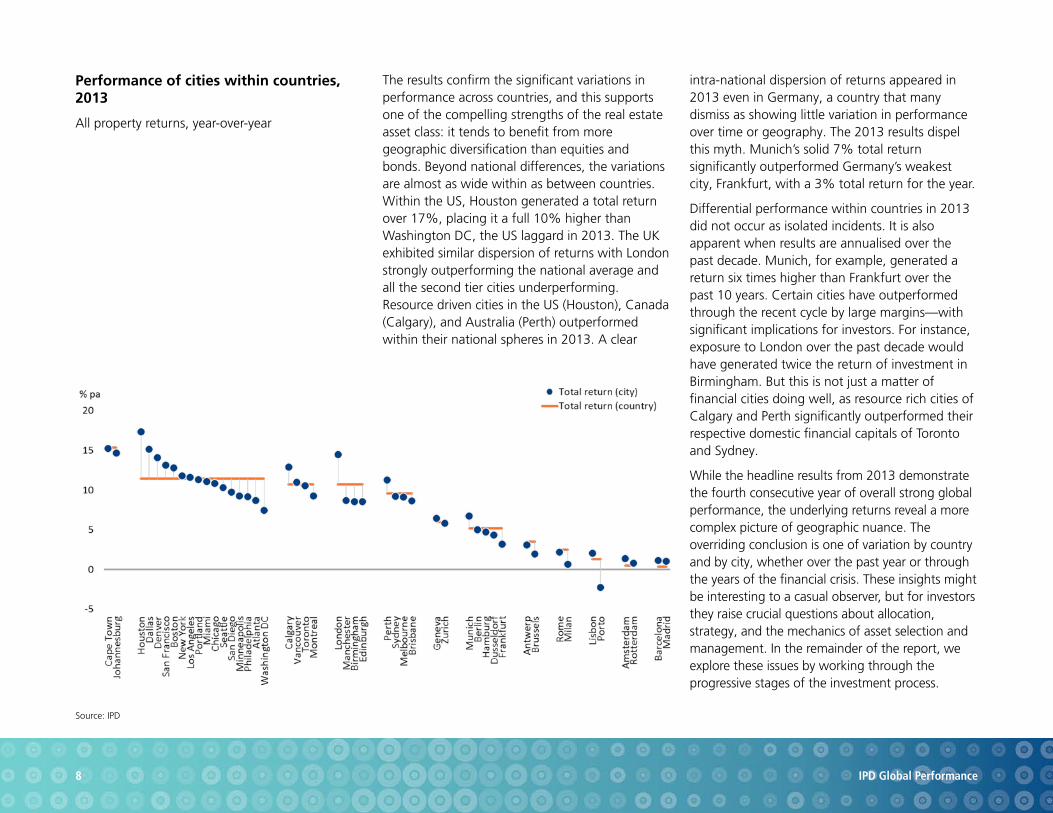
Performance of cities within countries, 2013
All property returns, year -over-year
The results confirm the significant variations in performance across countries, and this supports one of the compelling strengths of the real estate asset class: it tends to benefit from more geographic diversification than equities and bonds. Beyond national differences, the variations are almost as wide within as between countries. Within the US, Houston generated a total return over 17%, placing it a full 10% higher than Washington DC, the US laggard in 2013. The UK exhibited similar dispersion of returns with London strongly outperforming the national average and all the second tier cities underperforming. Resource driven cities in the US (Houston), Canada (Calgary), and Australia (Perth) outperformed within their national spheres in 2013. A clear
intra-national dispersion of returns appeared in 2013 even in Germany, a country that many dismiss as showing little variation in performance over time or geography. The 2013 results dispel this myth. Munich’s solid 7% total return significantly outperformed Germany’s weakest city, Frankfurt, with a 3% total return for the year.
Differential performance within countries in 2013 did not occur as isolated incidents. It is also apparent when results are annualised over the past decade. Munich, for example, generated a return six times higher than Frankfurt over the past 10 years. Certain cities have outperformed through the recent cycle by large margins—with significant implications for investors. For instance, exposure to London over the past decade would have generated twice the return of investment in Birmingham. But this is not just a matter of financial cities doing well, as resource rich cities of Calgary and Perth significantly outperformed their respective domestic financial capitals of Toronto and Sydney.
While the headline results from 2013 demonstrate the fourth consecutive year of overall strong global performance, the underlying returns reveal a more complex picture of geographic nuance. The overriding conclusion is one of variation by country and by city, whether over the past year or through the years of the financial crisis. These insights might be interesting to a casual observer, but for investors they raise crucial questions about allocation, strategy, and the mechanics of asset selection and management. In the remainder of the report, we explore these issues by working through the progressive stages of the investment process.

Section 2
Insights through the Investment Process
10 IPD Global Performance
Investment behaviour and the role of real estate
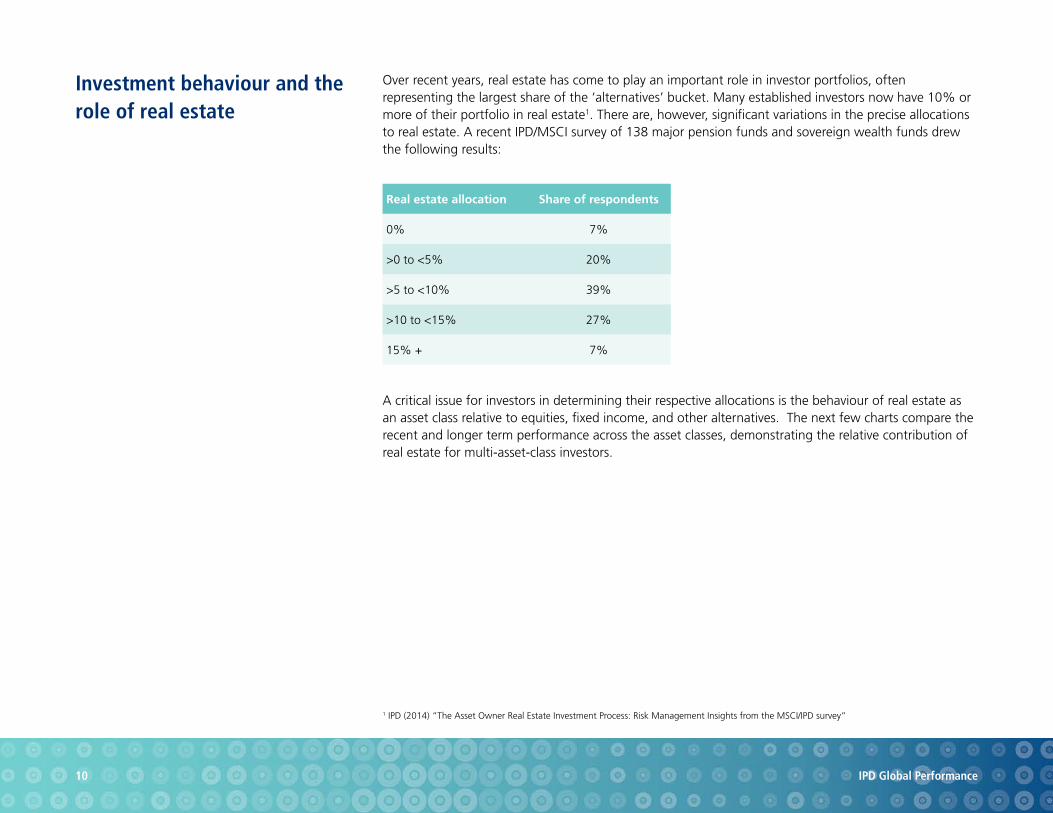
Over recent years, real estate has come to play an important role in investor portfolios, often representing the largest share of the ‘alternatives’ bucket. Many established investors now have 10% or more of their portfolio in real estate1. There are, however, significant variations in the precise allocations to real estate. A recent IPD/MSCI survey of 138 major pension funds and sovereign wealth funds drew the following results:
A critical issue for investors in determining their respective allocations is the behaviour of real estate as an asset class relative to equities, fixed income, and other alternatives. The next few charts compare the recent and longer term performance across the asset classes, demonstrating the relative contribution of real estate for multi-asset-class investors.
1 IPD (2014) “The Asset Owner Real Estate Investment Process: Risk Management Insights from the MSCI/IPD survey”
Real estate allocation Share of respondents
0% 7%
>0 to <5% 20%
>5 to <10% 39%
>10 to <15% 27%
15% + 7%
Notes: All averages as of 2013 YE TR = total return
Sources: IPD (real estate and the fund and asset levels); MSCI (equities and property equities); JP Morgan 7-10 years (bonds)
11 IPD Global Performance
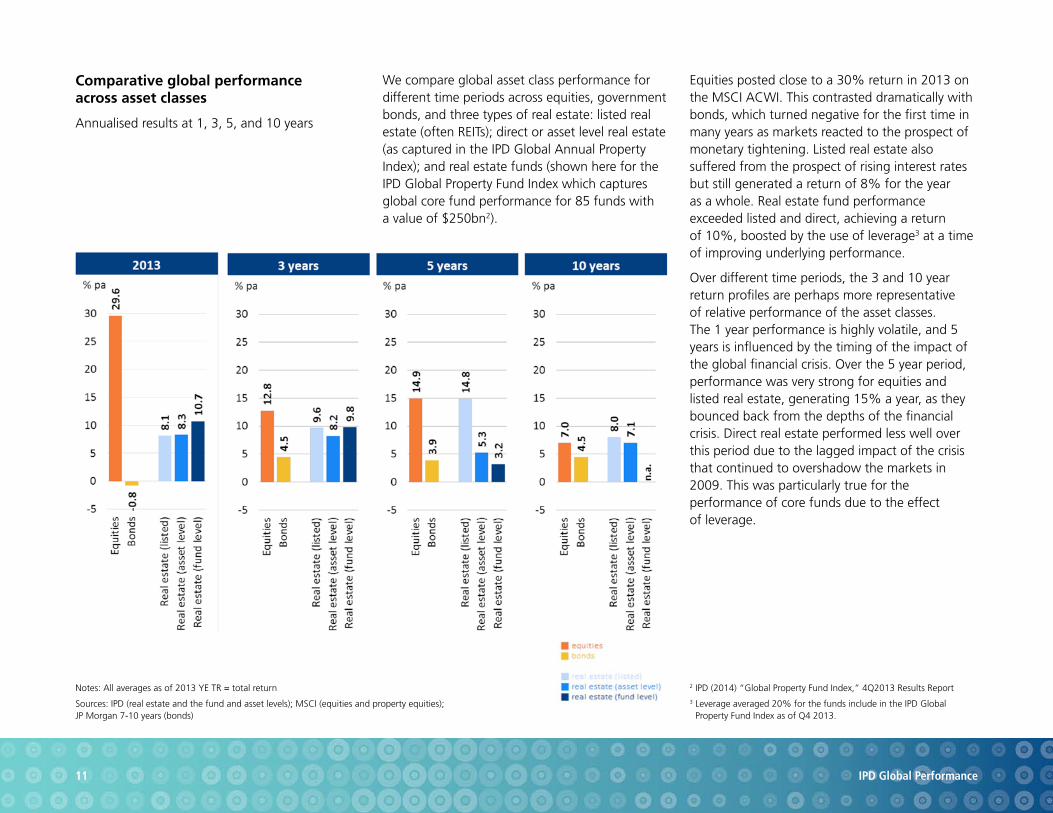
Comparative global performance across asset classes
Annualised results at 1, 3, 5, and 10 years
We compare global asset class performance for different time periods across equities, government bonds, and three types of real estate: listed real estate (often REITs); direct or asset level real estate (as captured in the IPD Global Annual Property Index); and real estate funds (shown here for the IPD Global Property Fund Index which captures global core fund performance for 85 funds with a value of $250bn2).
Equities posted close to a 30% return in 2013 on the MSCI ACWI. This contrasted dramatically with bonds, which turned negative for the first time in many years as markets reacted to the prospect of monetary tightening. Listed real estate also suffered from the prospect of rising interest rates but still generated a return of 8% for the year as a whole. Real estate fund performance exceeded listed and direct, achieving a return of 10%, boosted by the use of leverage3 at a time of improving underlying performance.
Over different time periods, the 3 and 10 year return profiles are perhaps more representative of relative performance of the asset classes. The 1 year performance is highly volatile, and 5 years is influenced by the timing of the impact of the global financial crisis. Over the 5 year period, performance was very strong for equities and listed real estate, generating 15% a year, as they bounced back from the depths of the financial crisis. Direct real estate performed less well over this period due to the lagged impact of the crisis that continued to overshadow the markets in 2009. This was particularly true for the performance of core funds due to the effect of leverage.
2 IPD (2014) “Global Property Fund Index,” 4Q2013 Results Report 3 Leverage averaged 20% for the funds include in the IPD Global
Property Fund Index as of Q4 2013.
12 IPD Global Performance
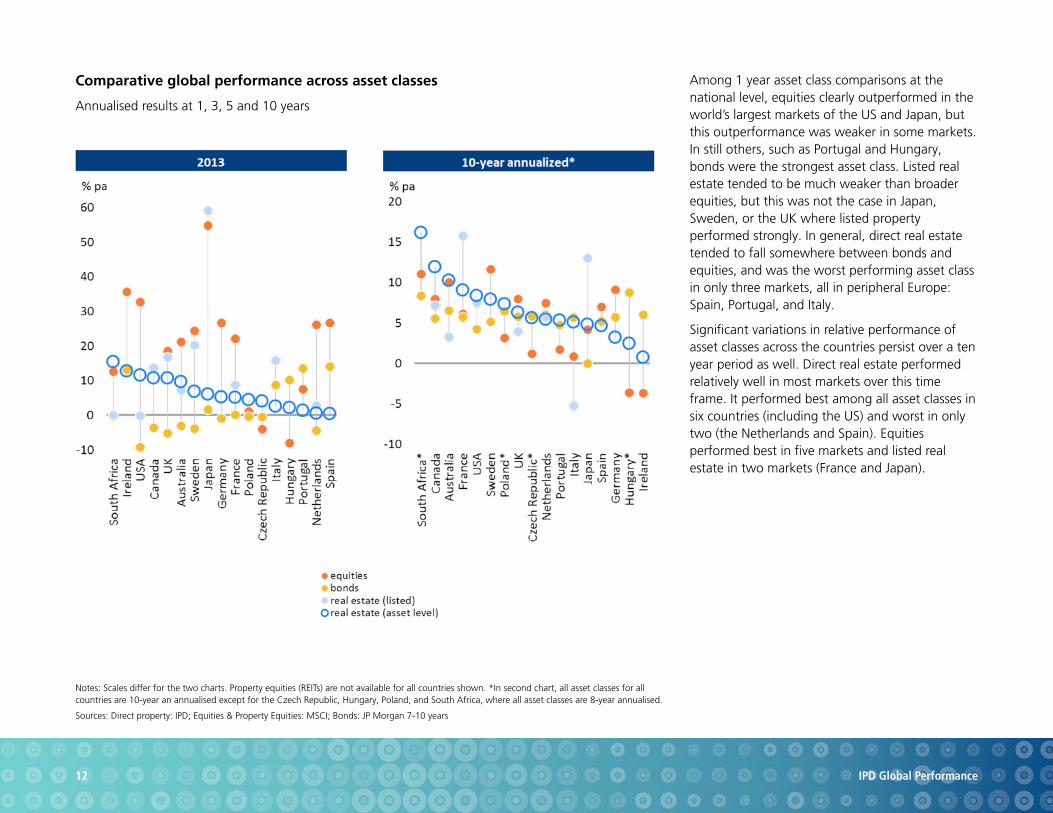
Comparative global performance across asset classes
Annualised results at 1, 3, 5 and 10 years
Among 1 year asset class comparisons at the national level, equities clearly outperformed in the world’s largest markets of the US and Japan, but this outperformance was weaker in some markets. In still others, such as Portugal and Hungary, bonds were the strongest asset class. Listed real estate tended to be much weaker than broader equities, but this was not the case in Japan, Sweden, or the UK where listed property performed strongly. In general, direct real estate tended to fall somewhere between bonds and equities, and was the worst performing asset class in only three markets, all in peripheral Europe: Spain, Portugal, and Italy.
Significant variations in relative performance of asset classes across the countries persist over a ten year period as well. Direct real estate performed relatively well in most markets over this time frame. It performed best among all asset classes in six countries (including the US) and worst in only two (the Netherlands and Spain). Equities performed best in five markets and listed real estate in two markets (France and Japan).
Notes: Scales differ for the two charts. Property equities (REITs) are not available for all countries shown. *In second chart, all asset classes for all countries are 10-year an annualised except for the Czech Republic, Hungary, Poland, and South Africa, where all asset classes are 8-year annualised.
Sources: Direct property: IPD; Equities & Property Equities: MSCI; Bonds: JP Morgan 7-10 years
13 IPD Global Performance
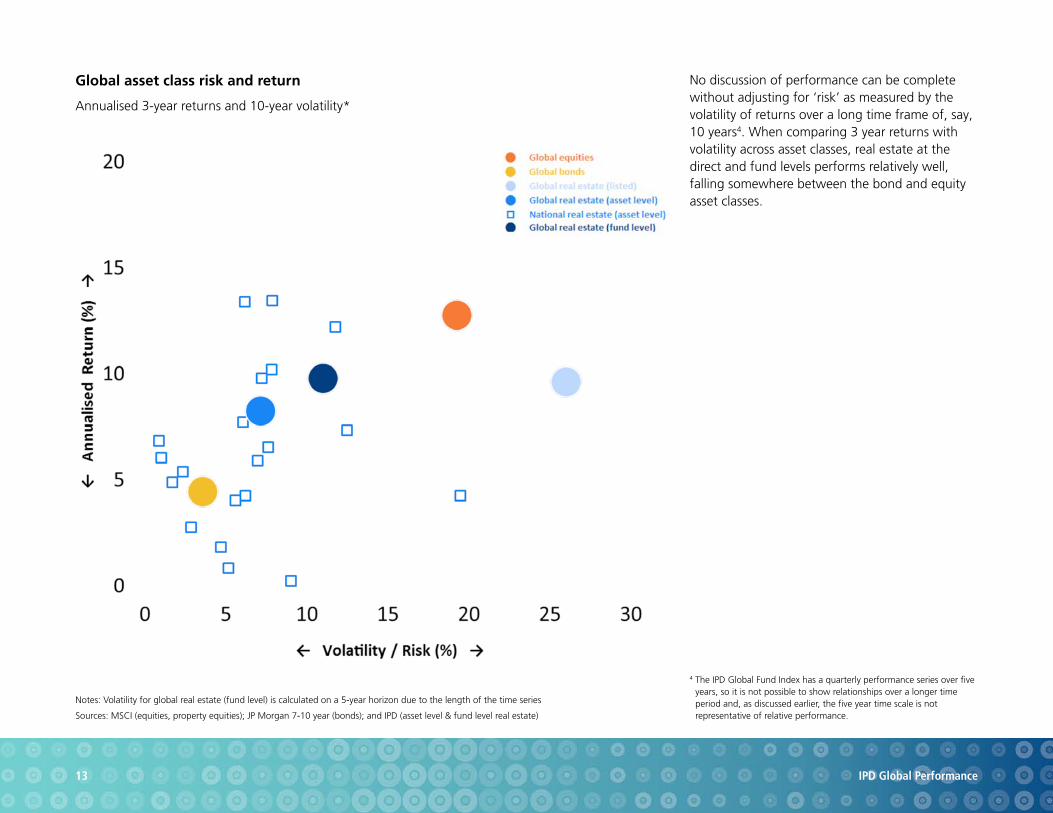
Global asset class risk and return
Annualised 3-year returns and 10-year volatility*
No discussion of performance can be complete without adjusting for ‘risk’ as measured by the volatility of returns over a long time frame of, say, 10 years4. When comparing 3 year returns with volatility across asset classes, real estate at the direct and fund levels performs relatively well, falling somewhere between the bond and equity asset classes.
Notes: Volatility for global real estate (fund level) is calculated on a 5-year horizon due to the length of the time series
Sources: MSCI (equities, property equities); JP Morgan 7-10 year (bonds); and IPD (asset level & fund level real estate)
4 The IPD Global Fund Index has a quarterly performance series over five years, so it is not possible to show relationships over a longer time period and, as discussed earlier, the five year time scale is not representative of relative performance.
14 IPD Global Performance
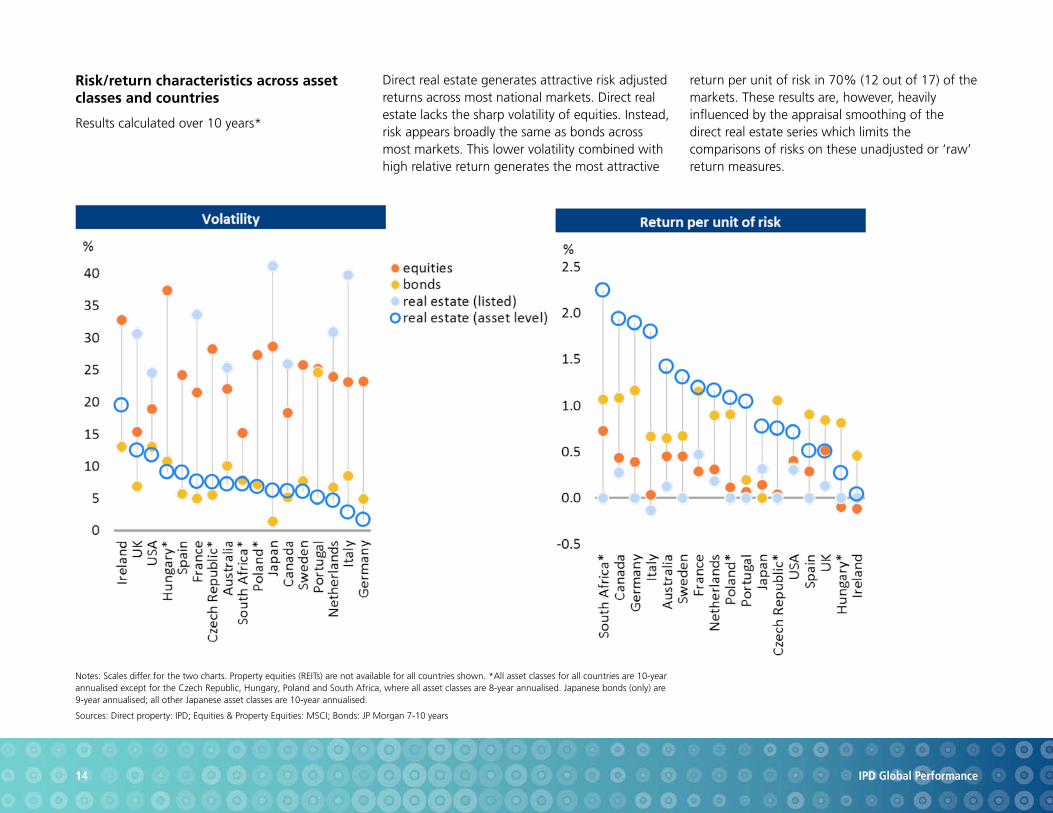
Risk/return characteristics across asset classes and countries
Results calculated over 10 years*
Direct real estate generates attractive risk adjusted returns across most national markets. Direct real estate lacks the sharp volatility of equities. Instead, risk appears broadly the same as bonds across most markets. This lower volatility combined with high relative return generates the most attractive
return per unit of risk in 70% (12 out of 17) of the markets. These results are, however, heavily influenced by the appraisal smoothing of the direct real estate series which limits the comparisons of risks on these unadjusted or ‘raw’ return measures.
Notes: Scales differ for the two charts. Property equities (REITs) are not available for all countries shown. *All asset classes for all countries are 10-year annualised except for the Czech Republic, Hungary, Poland and South Africa, where all asset classes are 8-year annualised. Japanese bonds (only) are 9-year annualised; all other Japanese asset classes are 10-year annualised.
Sources: Direct property: IPD; Equities & Property Equities: MSCI; Bonds: JP Morgan 7-10 years

Source: IPD
15 IPD Global Performance
Limits of appraisal data for measuring market risk
Valuation and transaction based volatility, 10 years to end 2013
A range of techniques can be used to adjust for smoothing, many of which originated from the work of David Geltner to back out the underlying ‘true’ return to real estate5. Since this early work, more attention has been placed on the relationship between ‘valuations’ and ‘transactions’ as this relationship can vary significantly from market to market. IPD produces these comparisons for the major European markets, with the results over the ten years to end 2013 clearly demonstrating big differences across Europe6. For the UK (and to a lesser extent France and the Netherlands), valuation volatility is close to transaction volatility. More significant differences emerge in Germany, Switzerland, Norway, and Denmark, with transactions being far more volatile than the valuations.
Additional work has been undertaken to gauge the true risk of private real estate markets. The BarraOne Private Real Estate model7, for example, involves the use of data for appraised, transaction, and listed real estate. Using a series of Bayesian techniques, more robust estimates of real estate risk can be derived. The appraised data underlying the IPD Global Annual Property Index provides a central input into these risk estimates. Desmoothing enables real estate to be compared much more effectively with other asset classes.
5 Geltner, D. (1991) “Smoothing in appraisal based returns,” Journal of Real Estate Finance and Economics. No. 4, pp. 327-345.
6 IPD (2011) “Quarterly Property Price Indicators”.7 Shepard, P., Liu Y. and Yilin, D (2014 Forthcoming) “The Barra Private
Real Estate Model (PRE2)”.
16 IPD Global Performance
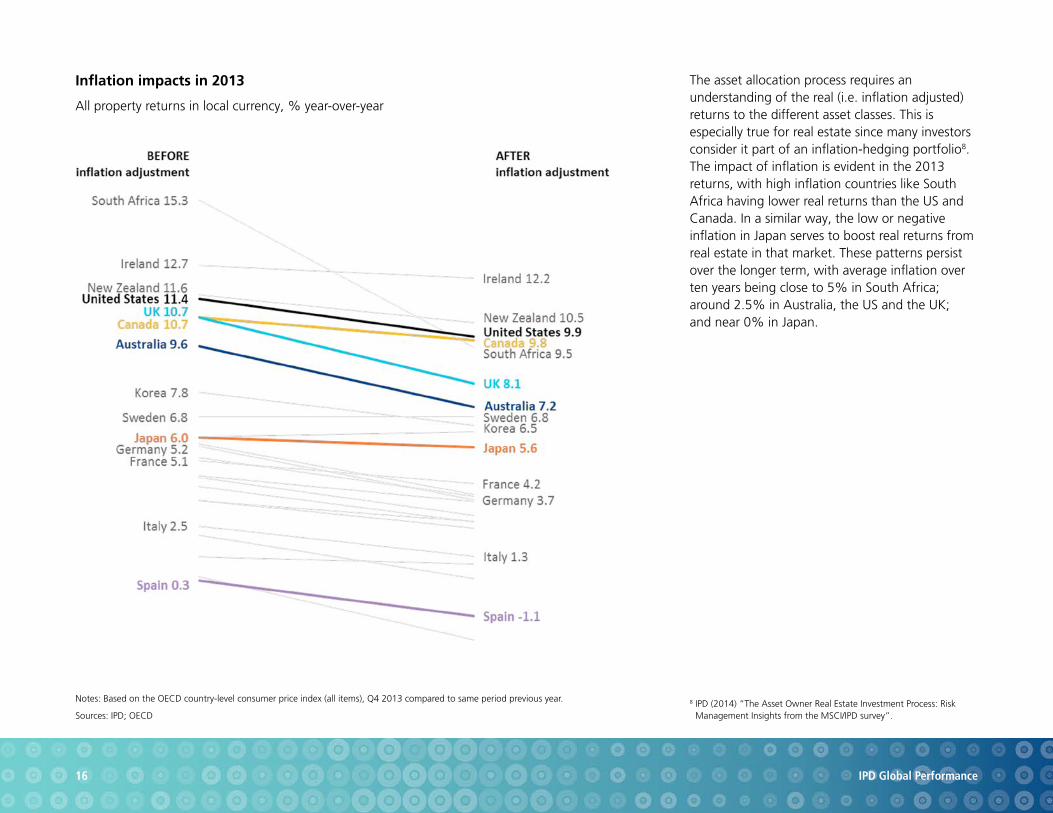
Inflation impacts in 2013
All property returns in local currency, % year-over-year
The asset allocation process requires an understanding of the real (i.e. inflation adjusted) returns to the different asset classes. This is especially true for real estate since many investors consider it part of an inflation-hedging portfolio8. The impact of inflation is evident in the 2013 returns, with high inflation countries like South Africa having lower real returns than the US and Canada. In a similar way, the low or negative inflation in Japan serves to boost real returns from real estate in that market. These patterns persist over the longer term, with average inflation over ten years being close to 5% in South Africa; around 2.5% in Australia, the US and the UK; and near 0% in Japan.
Sources: IPD; OECD
Notes: Based on the OECD country-level consumer price index (all items), Q4 2013 compared to same period previous year. 8 IPD (2014) “The Asset Owner Real Estate Investment Process: Risk Management Insights from the MSCI/IPD survey”.
17 IPD Global Performance
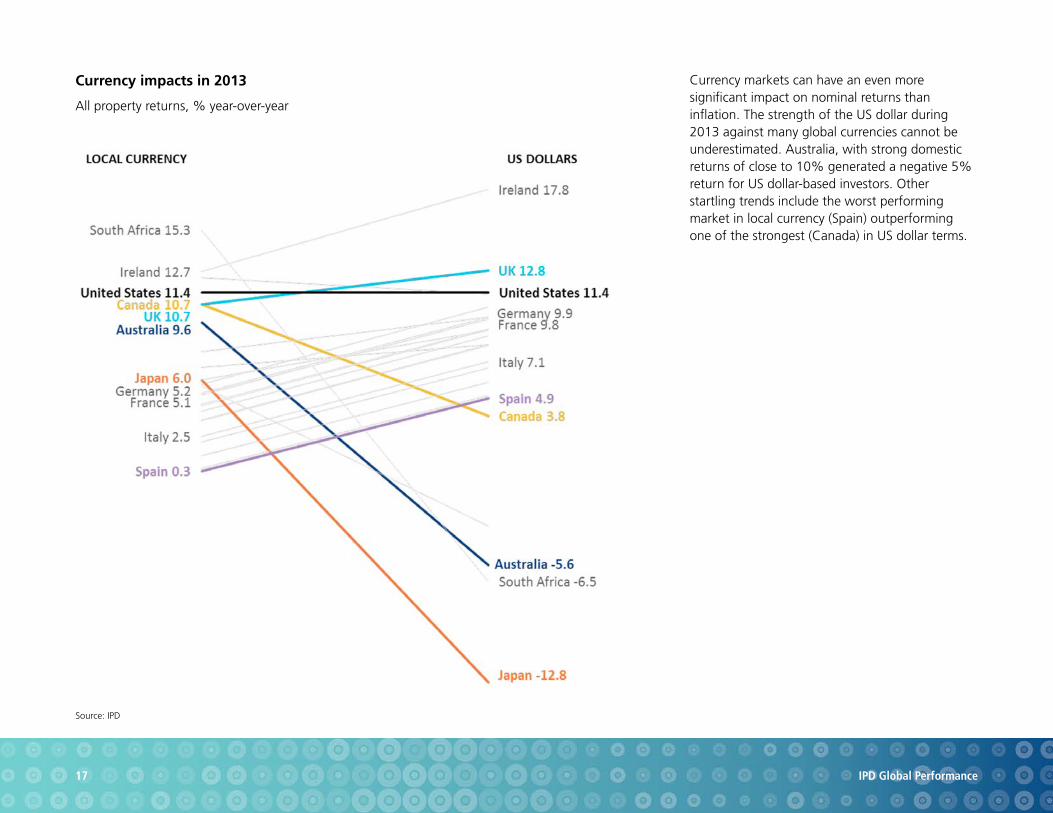
Currency impacts in 2013
All property returns, % year-over-year
Currency markets can have an even more significant impact on nominal returns than inflation. The strength of the US dollar during 2013 against many global currencies cannot be underestimated. Australia, with strong domestic returns of close to 10% generated a negative 5% return for US dollar-based investors. Other startling trends include the worst performing market in local currency (Spain) outperforming one of the strongest (Canada) in US dollar terms.
Source: IPD

18 IPD Global Performance
Strategy within real estate While a global perspective can illuminate the overall evaluation of real estate in a multi-asset-class context, the more extensive use of the IPD’s global datasets tends to be for developing and monitoring strategies within the real estate asset class. Although real estate has historically tended to have a domestic bias, the appetite for foreign real estate has edged up9. Supply and demand factors drive this increasing appetite. The improved availability of execution options has removed some of the supply barriers that existed in previous years. Alongside this, there has been greater demand for foreign investment, whether due to concerns over the pricing of domestic markets, as in Canada and Australia, or the desire to exploit the diversification benefits of international real estate.
9 Cornell University and Hodes Weill & Associates (2013) Institutional Real Estate Allocations Monitor.
19 IPD Global Performance
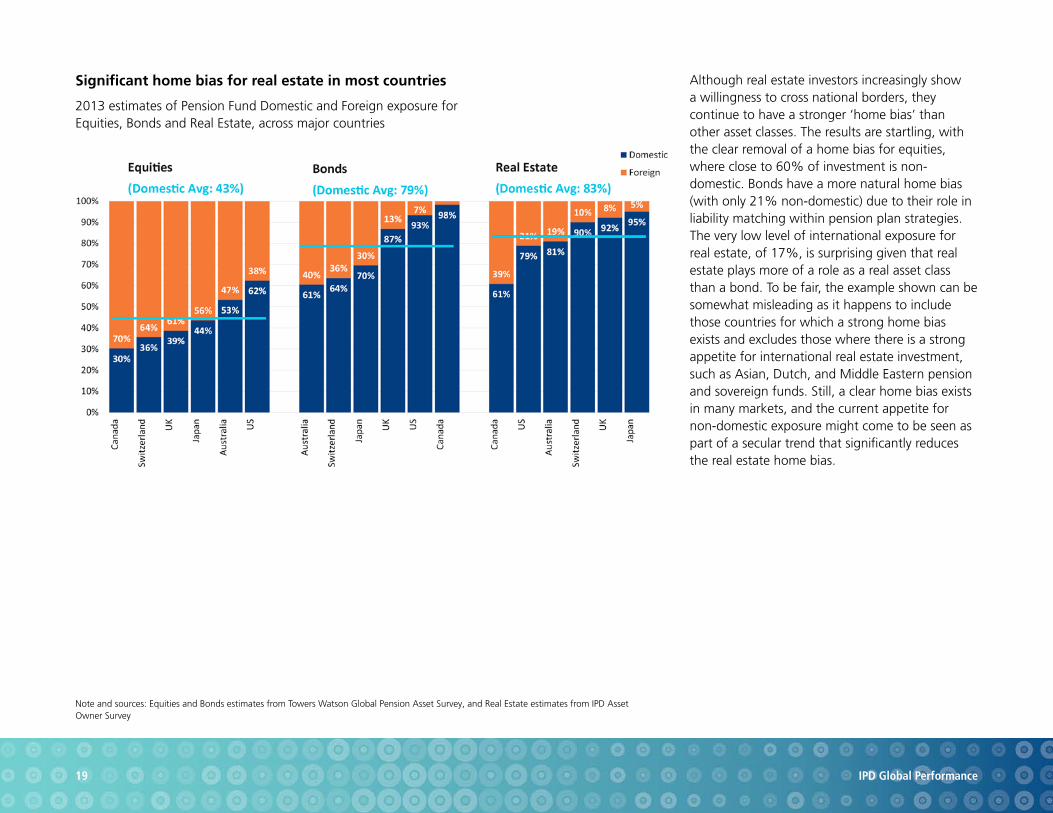
Significant home bias for real estate in most countries
2013 estimates of Pension Fund Domestic and Foreign exposure for Equities, Bonds and Real Estate, across major countries
Although real estate investors increasingly show a willingness to cross national borders, they continue to have a stronger ‘home bias’ than other asset classes. The results are startling, with the clear removal of a home bias for equities, where close to 60% of investment is non-domestic. Bonds have a more natural home bias (with only 21% non-domestic) due to their role in liability matching within pension plan strategies. The very low level of international exposure for real estate, of 17%, is surprising given that real estate plays more of a role as a real asset class than a bond. To be fair, the example shown can be somewhat misleading as it happens to include those countries for which a strong home bias exists and excludes those where there is a strong appetite for international real estate investment, such as Asian, Dutch, and Middle Eastern pension and sovereign funds. Still, a clear home bias exists in many markets, and the current appetite for non-domestic exposure might come to be seen as part of a secular trend that significantly reduces the real estate home bias.
Note and sources: Equities and Bonds estimates from Towers Watson Global Pension Asset Survey, and Real Estate estimates from IPD Asset Owner Survey
20 IPD Global Performance
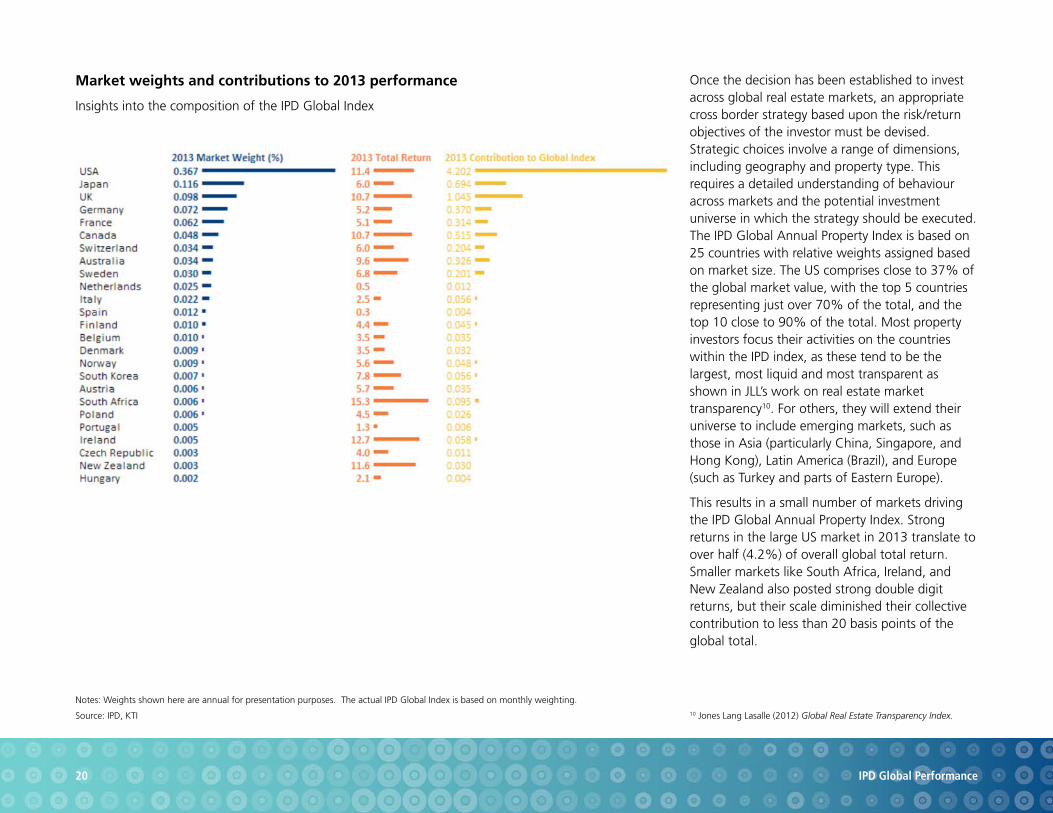
Market weights and contributions to 2013 performance
Insights into the composition of the IPD Global Index
Once the decision has been established to invest across global real estate markets, an appropriate cross border strategy based upon the risk/return objectives of the investor must be devised. Strategic choices involve a range of dimensions, including geography and property type. This requires a detailed understanding of behaviour across markets and the potential investment universe in which the strategy should be executed. The IPD Global Annual Property Index is based on 25 countries with relative weights assigned based on market size. The US comprises close to 37% of the global market value, with the top 5 countries representing just over 70% of the total, and the top 10 close to 90% of the total. Most property investors focus their activities on the countries within the IPD index, as these tend to be the largest, most liquid and most transparent as shown in JLL’s work on real estate market transparency10. For others, they will extend their universe to include emerging markets, such as those in Asia (particularly China, Singapore, and Hong Kong), Latin America (Brazil), and Europe (such as Turkey and parts of Eastern Europe).
This results in a small number of markets driving the IPD Global Annual Property Index. Strong returns in the large US market in 2013 translate to over half (4.2%) of overall global total return. Smaller markets like South Africa, Ireland, and New Zealand also posted strong double digit returns, but their scale diminished their collective contribution to less than 20 basis points of the global total.
Notes: Weights shown here are annual for presentation purposes. The actual IPD Global Index is based on monthly weighting.
Source: IPD, KTI 10 Jones Lang Lasalle (2012) Global Real Estate Transparency Index.
21 IPD Global Performance
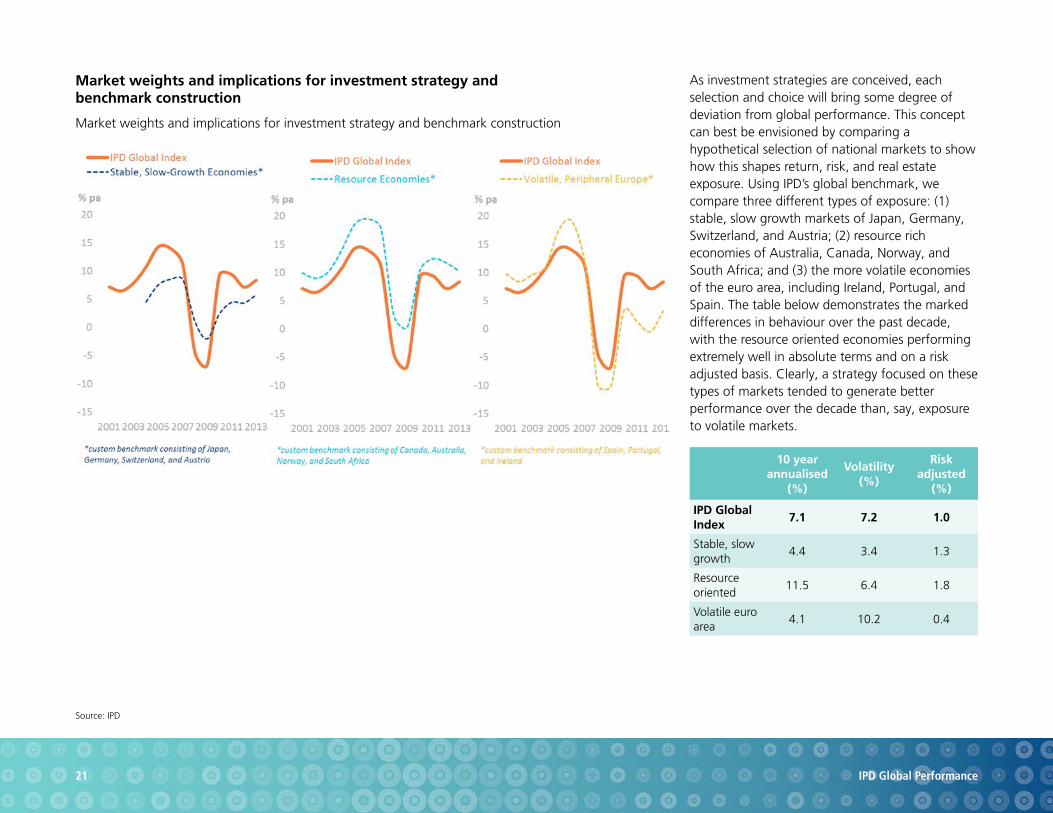
Market weights and implications for investment strategy and benchmark construction
Market weights and implications for investment strategy and benchmark construction
As investment strategies are conceived, each selection and choice will bring some degree of deviation from global performance. This concept can best be envisioned by comparing a hypothetical selection of national markets to show how this shapes return, risk, and real estate exposure. Using IPD’s global benchmark, we compare three different types of exposure: (1) stable, slow growth markets of Japan, Germany, Switzerland, and Austria; (2) resource rich economies of Australia, Canada, Norway, and South Africa; and (3) the more volatile economies of the euro area, including Ireland, Portugal, and Spain. The table below demonstrates the marked differences in behaviour over the past decade, with the resource oriented economies performing extremely well in absolute terms and on a risk adjusted basis. Clearly, a strategy focused on these types of markets tended to generate better performance over the decade than, say, exposure to volatile markets.
Source: IPD
10 year annualised
(%)
Volatility(%)
Risk adjusted
(%)
IPD Global Index
7.1 7.2 1.0
Stable, slow growth
4.4 3.4 1.3
Resource oriented
11.5 6.4 1.8
Volatile euro area
4.1 10.2 0.4
Source: IPD, KTI
22 IPD Global Performance
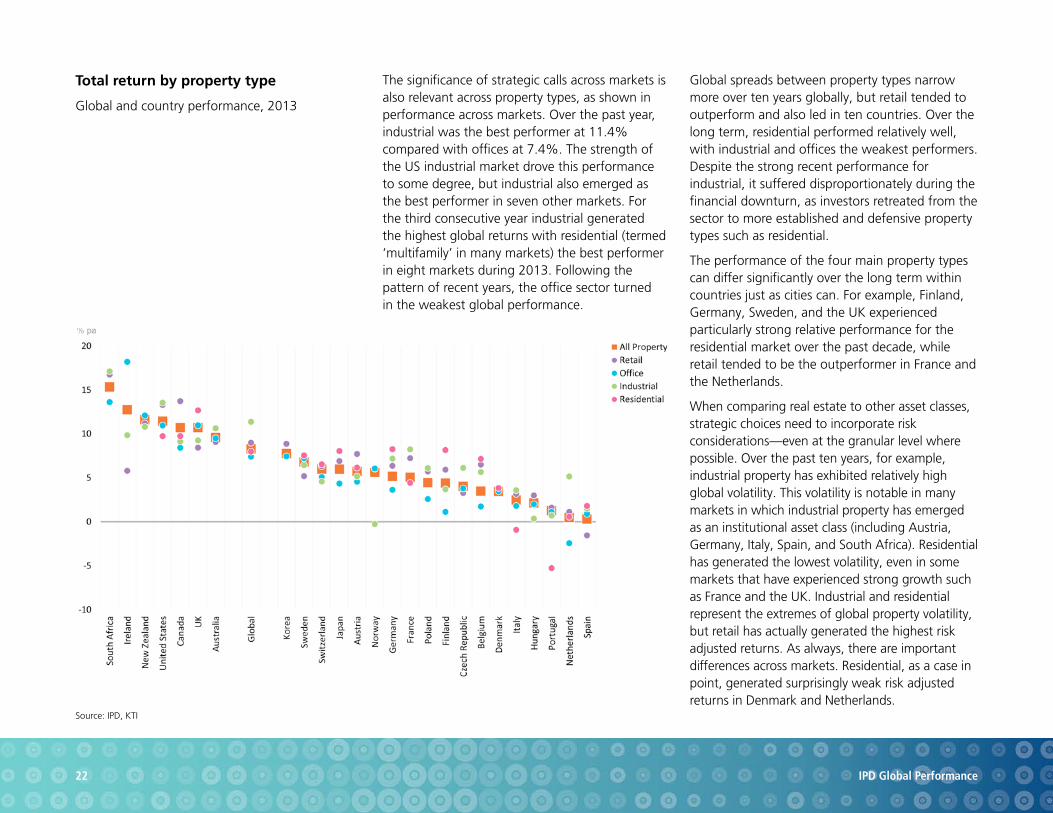
Total return by property type
Global and country performance, 2013
The significance of strategic calls across markets is also relevant across property types, as shown in performance across markets. Over the past year, industrial was the best performer at 11.4% compared with offices at 7.4%. The strength of the US industrial market drove this performance to some degree, but industrial also emerged as the best performer in seven other markets. For the third consecutive year industrial generated the highest global returns with residential (termed ‘multifamily’ in many markets) the best performer in eight markets during 2013. Following the pattern of recent years, the office sector turned in the weakest global performance.
Global spreads between property types narrow more over ten years globally, but retail tended to outperform and also led in ten countries. Over the long term, residential performed relatively well, with industrial and offices the weakest performers. Despite the strong recent performance for industrial, it suffered disproportionately during the financial downturn, as investors retreated from the sector to more established and defensive property types such as residential.
The performance of the four main property types can differ significantly over the long term within countries just as cities can. For example, Finland, Germany, Sweden, and the UK experienced particularly strong relative performance for the residential market over the past decade, while retail tended to be the outperformer in France and the Netherlands.
When comparing real estate to other asset classes, strategic choices need to incorporate risk considerations—even at the granular level where possible. Over the past ten years, for example, industrial property has exhibited relatively high global volatility. This volatility is notable in many markets in which industrial property has emerged as an institutional asset class (including Austria, Germany, Italy, Spain, and South Africa). Residential has generated the lowest volatility, even in some markets that have experienced strong growth such as France and the UK. Industrial and residential represent the extremes of global property volatility, but retail has actually generated the highest risk adjusted returns. As always, there are important differences across markets. Residential, as a case in point, generated surprisingly weak risk adjusted returns in Denmark and Netherlands.
23 IPD Global Performance
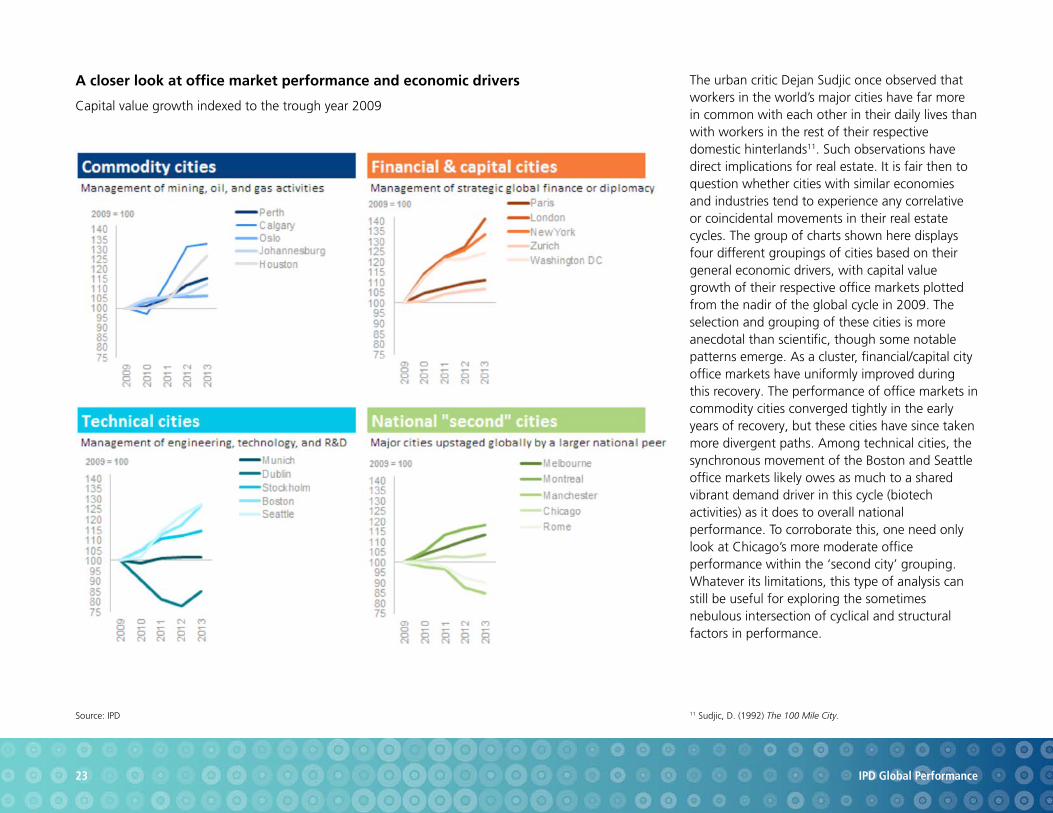
A closer look at office market performance and economic drivers
Capital value growth indexed to the trough year 2009
The urban critic Dejan Sudjic once observed that workers in the world’s major cities have far more in common with each other in their daily lives than with workers in the rest of their respective domestic hinterlands11. Such observations have direct implications for real estate. It is fair then to question whether cities with similar economies and industries tend to experience any correlative or coincidental movements in their real estate cycles. The group of charts shown here displays four different groupings of cities based on their general economic drivers, with capital value growth of their respective office markets plotted from the nadir of the global cycle in 2009. The selection and grouping of these cities is more anecdotal than scientific, though some notable patterns emerge. As a cluster, financial/capital city office markets have uniformly improved during this recovery. The performance of office markets in commodity cities converged tightly in the early years of recovery, but these cities have since taken more divergent paths. Among technical cities, the synchronous movement of the Boston and Seattle office markets likely owes as much to a shared vibrant demand driver in this cycle (biotech activities) as it does to overall national performance. To corroborate this, one need only look at Chicago’s more moderate office performance within the ‘second city’ grouping. Whatever its limitations, this type of analysis can still be useful for exploring the sometimes nebulous intersection of cyclical and structural factors in performance.
Source: IPD 11 Sudjic, D. (1992) The 100 Mile City.
24 IPD Global Performance
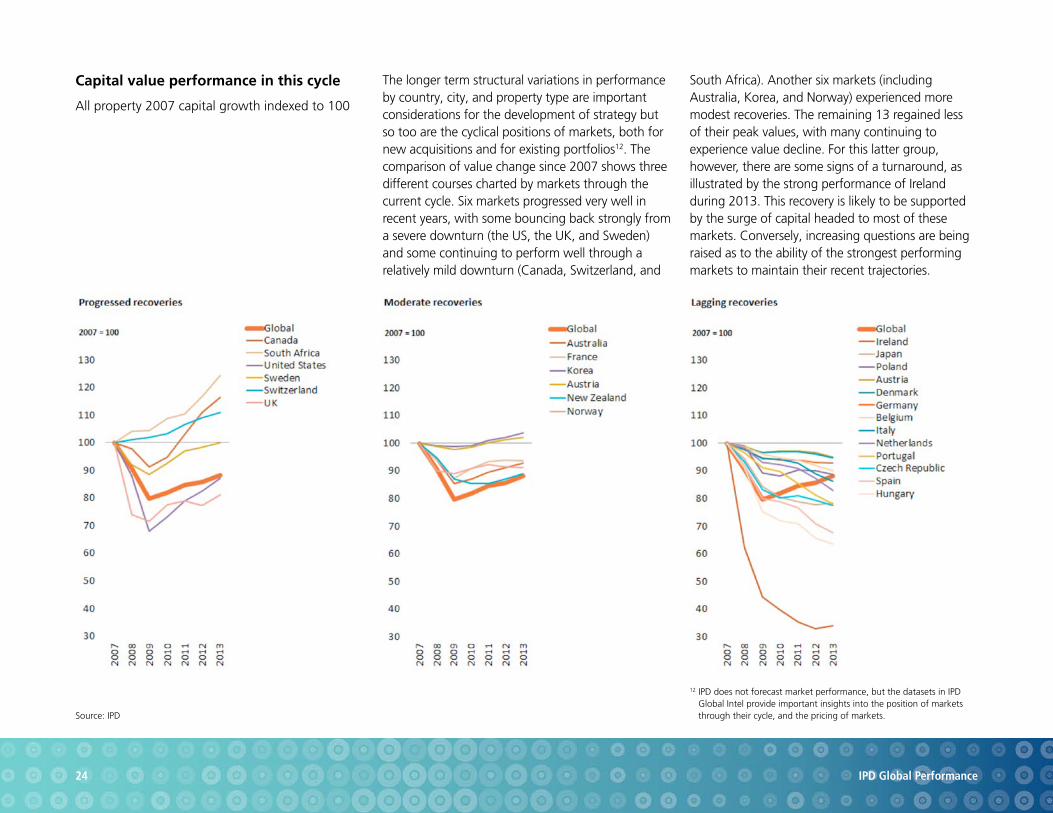
Capital value performance in this cycle
All property 2007 capital growth indexed to 100
The longer term structural variations in performance by country, city, and property type are important considerations for the development of strategy but so too are the cyclical positions of markets, both for new acquisitions and for existing portfolios12. The comparison of value change since 2007 shows three different courses charted by markets through the current cycle. Six markets progressed very well in recent years, with some bouncing back strongly from a severe downturn (the US, the UK, and Sweden) and some continuing to perform well through a relatively mild downturn (Canada, Switzerland, and
South Africa). Another six markets (including Australia, Korea, and Norway) experienced more modest recoveries. The remaining 13 regained less of their peak values, with many continuing to experience value decline. For this latter group, however, there are some signs of a turnaround, as illustrated by the strong performance of Ireland during 2013. This recovery is likely to be supported by the surge of capital headed to most of these markets. Conversely, increasing questions are being raised as to the ability of the strongest performing markets to maintain their recent trajectories.
Source: IPD
12 IPD does not forecast market performance, but the datasets in IPD Global Intel provide important insights into the position of markets through their cycle, and the pricing of markets.
25 IPD Global Performance
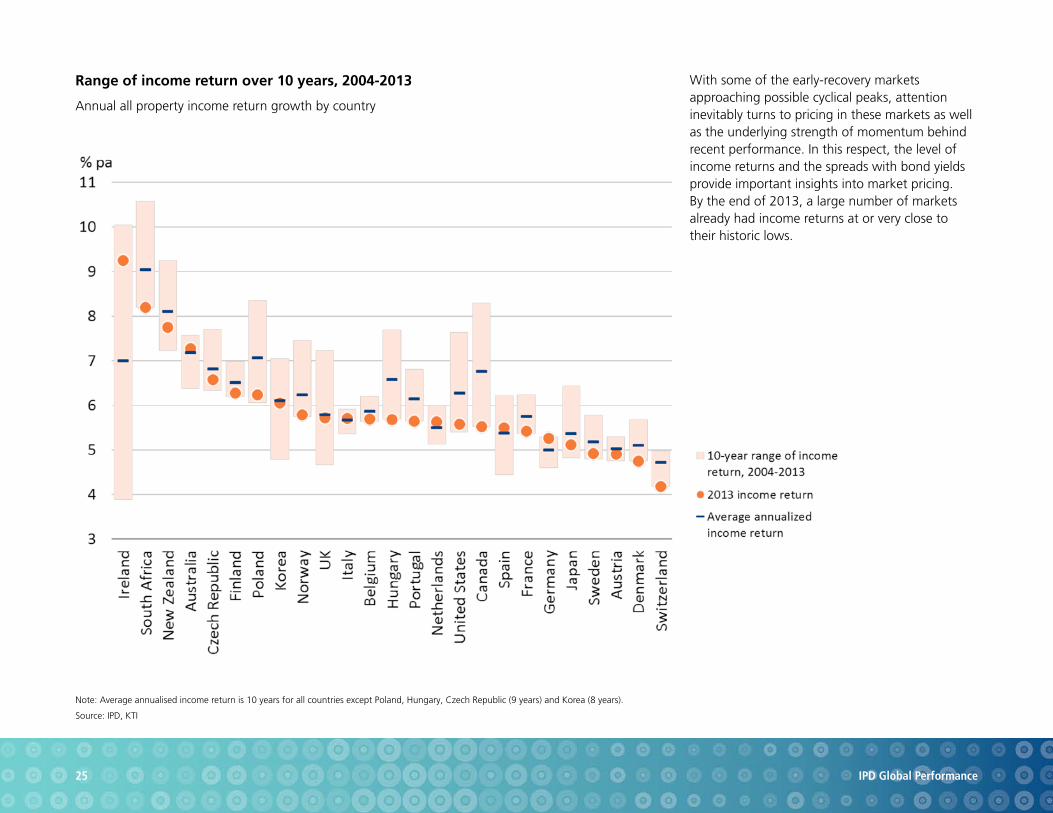
Range of income return over 10 years, 2004-2013
Annual all property income return growth by country
With some of the early-recovery markets approaching possible cyclical peaks, attention inevitably turns to pricing in these markets as well as the underlying strength of momentum behind recent performance. In this respect, the level of income returns and the spreads with bond yields provide important insights into market pricing. By the end of 2013, a large number of markets already had income returns at or very close to their historic lows.
Note: Average annualised income return is 10 years for all countries except Poland, Hungary, Czech Republic (9 years) and Korea (8 years).
Source: IPD, KTI
Source: IPD
26 IPD Global Performance
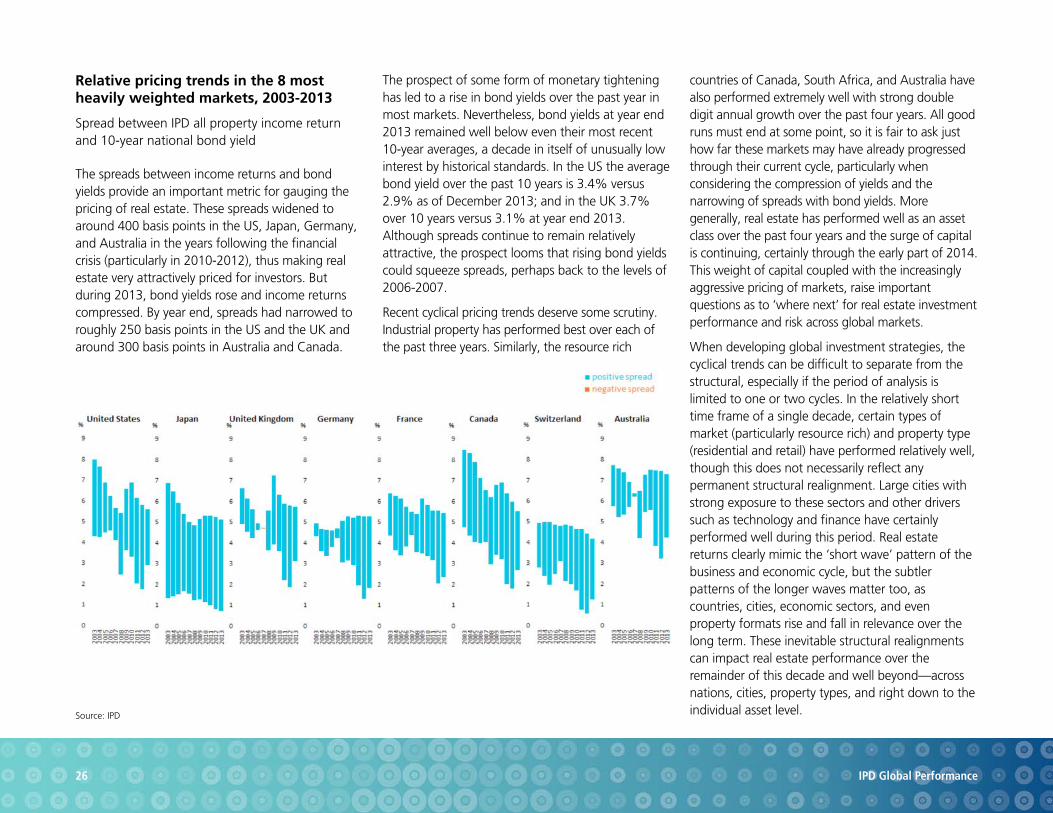
Relative pricing trends in the 8 most heavily weighted markets, 2003-2013
Spread between IPD all property income return and 10-year national bond yield
The spreads between income returns and bond yields provide an important metric for gauging the pricing of real estate. These spreads widened to around 400 basis points in the US, Japan, Germany, and Australia in the years following the financial crisis (particularly in 2010-2012), thus making real estate very attractively priced for investors. But during 2013, bond yields rose and income returns compressed. By year end, spreads had narrowed to roughly 250 basis points in the US and the UK and around 300 basis points in Australia and Canada.
The prospect of some form of monetary tightening has led to a rise in bond yields over the past year in most markets. Nevertheless, bond yields at year end 2013 remained well below even their most recent 10-year averages, a decade in itself of unusually low interest by historical standards. In the US the average bond yield over the past 10 years is 3.4% versus 2.9% as of December 2013; and in the UK 3.7% over 10 years versus 3.1% at year end 2013. Although spreads continue to remain relatively attractive, the prospect looms that rising bond yields could squeeze spreads, perhaps back to the levels of 2006-2007.
Recent cyclical pricing trends deserve some scrutiny. Industrial property has performed best over each of the past three years. Similarly, the resource rich
countries of Canada, South Africa, and Australia have also performed extremely well with strong double digit annual growth over the past four years. All good runs must end at some point, so it is fair to ask just how far these markets may have already progressed through their current cycle, particularly when considering the compression of yields and the narrowing of spreads with bond yields. More generally, real estate has performed well as an asset class over the past four years and the surge of capital is continuing, certainly through the early part of 2014. This weight of capital coupled with the increasingly aggressive pricing of markets, raise important questions as to ‘where next’ for real estate investment performance and risk across global markets.
When developing global investment strategies, the cyclical trends can be difficult to separate from the structural, especially if the period of analysis is limited to one or two cycles. In the relatively short time frame of a single decade, certain types of market (particularly resource rich) and property type (residential and retail) have performed relatively well, though this does not necessarily reflect any permanent structural realignment. Large cities with strong exposure to these sectors and other drivers such as technology and finance have certainly performed well during this period. Real estate returns clearly mimic the ‘short wave’ pattern of the business and economic cycle, but the subtler patterns of the longer waves matter too, as countries, cities, economic sectors, and even property formats rise and fall in relevance over the long term. These inevitable structural realignments can impact real estate performance over the remainder of this decade and well beyond—across nations, cities, property types, and right down to the individual asset level.
27 IPD Global Performance
Implementation issuesand risks
Thus far, this review of 2013 global results has focussed on strategic trends across markets and property types. IPD provides increasingly granular data, drilling down into cities and submarkets that provide important insight into the performance characteristics of different types of real estate. Beyond these strategic insights, IPD’s datasets provide a wealth of information that is used by many clients through the asset management process to improve the performance of portfolios and assets. Two examples of these insights are provided in this section.
28 IPD Global Performance
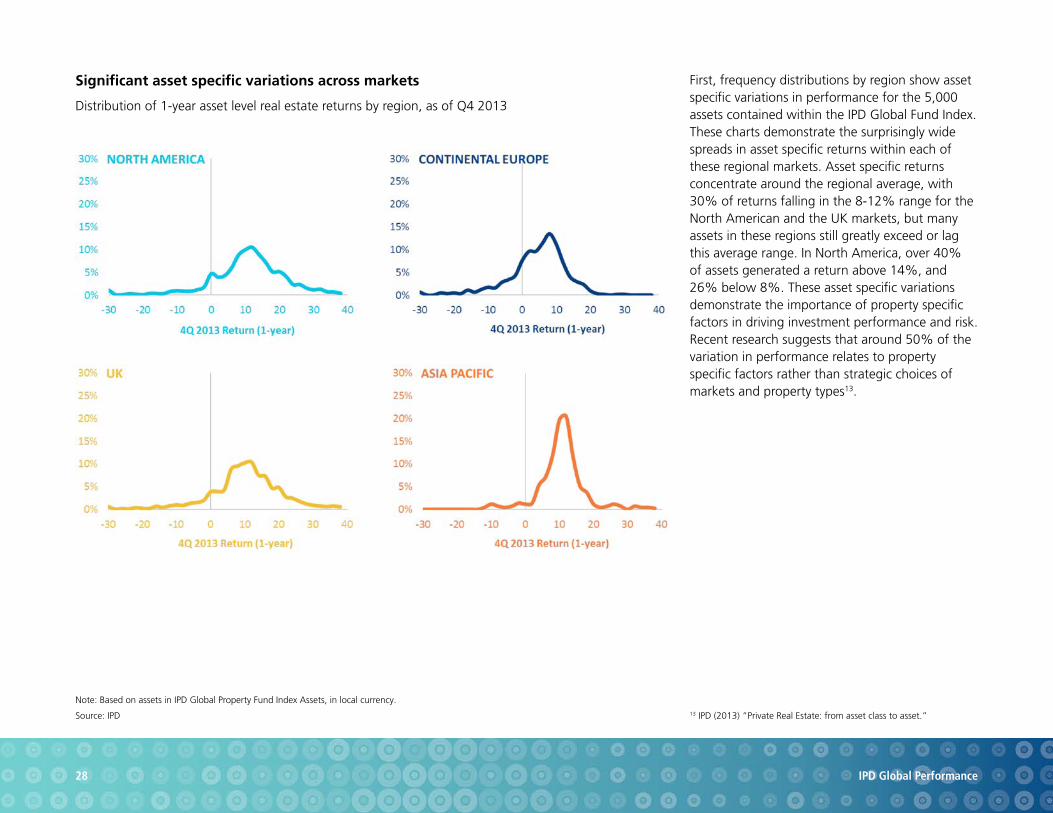
Significant asset specific variations across markets
Distribution of 1-year asset level real estate returns by region, as of Q4 2013
First, frequency distributions by region show asset specific variations in performance for the 5,000 assets contained within the IPD Global Fund Index. These charts demonstrate the surprisingly wide spreads in asset specific returns within each of these regional markets. Asset specific returns concentrate around the regional average, with 30% of returns falling in the 8-12% range for the North American and the UK markets, but many assets in these regions still greatly exceed or lag this average range. In North America, over 40% of assets generated a return above 14%, and 26% below 8%. These asset specific variations demonstrate the importance of property specific factors in driving investment performance and risk. Recent research suggests that around 50% of the variation in performance relates to property specific factors rather than strategic choices of markets and property types13.
13 IPD (2013) “Private Real Estate: from asset class to asset.”
Note: Based on assets in IPD Global Property Fund Index Assets, in local currency.
Source: IPD
29 IPD Global Performance
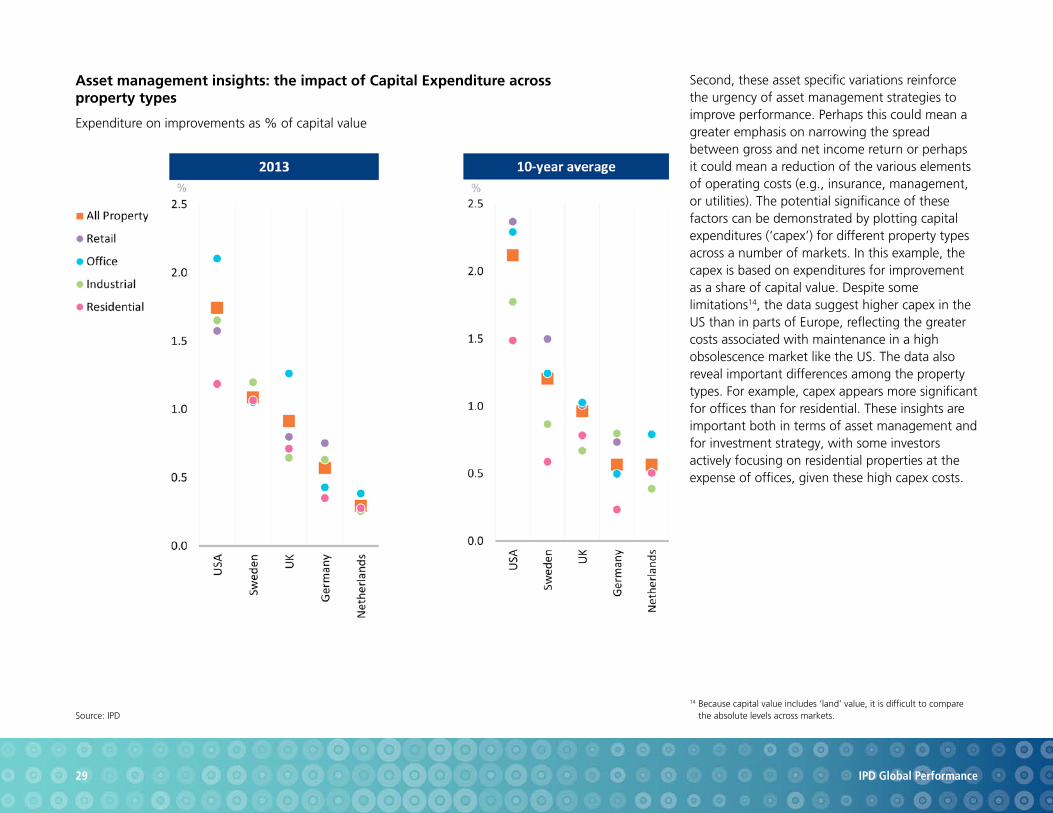
Asset management insights: the impact of Capital Expenditure across property types
Expenditure on improvements as % of capital value
Second, these asset specific variations reinforce the urgency of asset management strategies to improve performance. Perhaps this could mean a greater emphasis on narrowing the spread between gross and net income return or perhaps it could mean a reduction of the various elements of operating costs (e.g., insurance, management, or utilities). The potential significance of these factors can be demonstrated by plotting capital expenditures (‘capex’) for different property types across a number of markets. In this example, the capex is based on expenditures for improvement as a share of capital value. Despite some limitations14, the data suggest higher capex in the US than in parts of Europe, reflecting the greater costs associated with maintenance in a high obsolescence market like the US. The data also reveal important differences among the property types. For example, capex appears more significant for offices than for residential. These insights are important both in terms of asset management and for investment strategy, with some investors actively focusing on residential properties at the expense of offices, given these high capex costs.
14 Because capital value includes ‘land’ value, it is difficult to compare the absolute levels across markets.Source: IPD
30 IPD Global Performance
Conclusion This summary of the 2013 results of the IPD Global Annual Property Index documents the year’s real estate performance as well as the relevance of a carefully crafted investment process through each of the various stages of allocation, strategy, and asset management. The key datasets covered in the report are available through the IPD Global Intel, including national and city level data as well as direct and fund level performance and other important indicators such as the transaction linked indexes. These datasets can provide powerful insights through the investment process. For allocation decisions, this may include a comparison of real estate to other asset classes. For strategic decisions, the geographic breadth and depth of the coverage heightens investor understanding of the performance of national and city markets and property types over the long term and through market cycles. For asset management, the dataset enhances the ability to benchmark various dimensions of costs and income by linking performance variation back to the strategic choices involved in portfolio construction and management. The investment process outlined in this paper, and the broader IPD Global Intel data on which it is based, provides a useful tool for those investors developing, maintaining, and continuously monitoring their global exposure to the real estate asset class.

ipd.com
IPD
Ninth Floor Ten Bishops Square London E1 6EG United Kingdom +44.20.7336.9200
@ipdnews