Embed Size (px)
Citation preview

IPD: Performance, Expectations, and Future Use A Report On Outcomes of a University of Minnesota Survey
September 25th, 2015
Overview Key findings
Challenges and Needs Description of data set
Performance / Expectations / Likelihood (all responses) Performance / Expectations / Likelihood (by stakeholder group)
Survey Still Open! Acknowledgements
Contents
Effective project delivery meets or exceeds owner’s expectations for schedule, cost and quality. There is an emerging body of research that shows more collaborative/integrated delivery is more likely to lead to successful outcomes and high-level team performance. Within that context, this survey takes a snapshot of current perceptions of effectiveness on projects using multiparty agreements, the most formal and contractually binding of the integrated delivery methods. Conducted by the University of Minnesota and sponsored by Canada’s Integrated Project Delivery Alliance, the goal of this survey was to understand the current state of Integrated Project Delivery (IPD). This goal was pursued through use of a broad-based comparative survey. Each survey response collected data for one IPD project from one respondent's experience. If the respondent had multiple IPD project experience, they could take the survey multiple times, entering data for one project each time. Individual stakeholders on the same project could be matched by project name during the data analysis. For the purpose of this survey, IPD was defined as a multi-party agreement. The survey was short and required no preparation. With one specific IPD project in mind, respondents began the survey by verifying the use of a multiparty agreement (those with other types of agreement were thanked and survey ended). For those who confirmed multiparty, survey gathered basic demographic data about the respondent and their project, followed by three questions:
• Comparison of this IPD experience with non-IPD project experience • The meeting of expectations on this project • Likelihood of future use of IPD
Overview
Significantly Positive • Responses are significantly positive, strongly supportive of IPD as a superior delivery method. • Distribution of responses is weighted heavily toward the most positive possible answers, not clustered
around the neutral point. • The overwhelmingly positive response is consistent across all demographics: stakeholder type, project type,
project progress, project averages, and past respondent experience. Owner Expectations • Owners’ expectations were met or exceeded more than architects, contractors, or others. When owners
compare their expectations of IPD at the start of the project to the project outcomes, they overwhelmingly say their expectations were met, exceeded, or significantly exceeded.
Choosing IPD • Reasons for choosing IPD are varied but seem to be most important where there is a desire for more team
integration, a challenging budget, and/or where the owner requires the use of IPD. Diverse Data Set • The 108 response / 59 project data set represents a broad cross-section of building type, project location,
project scope, project progress, and stakeholder background. BIM and Lean tools were used to varying degrees on almost all projects.
For Consideration • Positive survey outcomes may reflect interest, engagement, and approval of early adopter owners and AEC
professionals, and may additionally be influenced by project teams constructed of skilled and motivated practitioners.
Key Findings
Challenges and Needs Respondents had an opportunity to comment on their experience. Some comments reflect challenges and needs: Challenges IPD teams face • Unwillingness to fully embrace IPD, its hard to let go of traditional roles • Understanding of what is IPD (and what it takes to succeed) is uneven in the industry • Negative performance by any single stakeholder can disrupt the whole team • Changes in personnel can have a large negative impact IPD Teams have particular need for: • Alignment and commitment across the team • Strong owner involvement • Strong leadership • Having the right people involved at the right time • Increased and earlier planning • Careful attention to fees/time • Maintaining focus on key project goals • Accountability among team members.
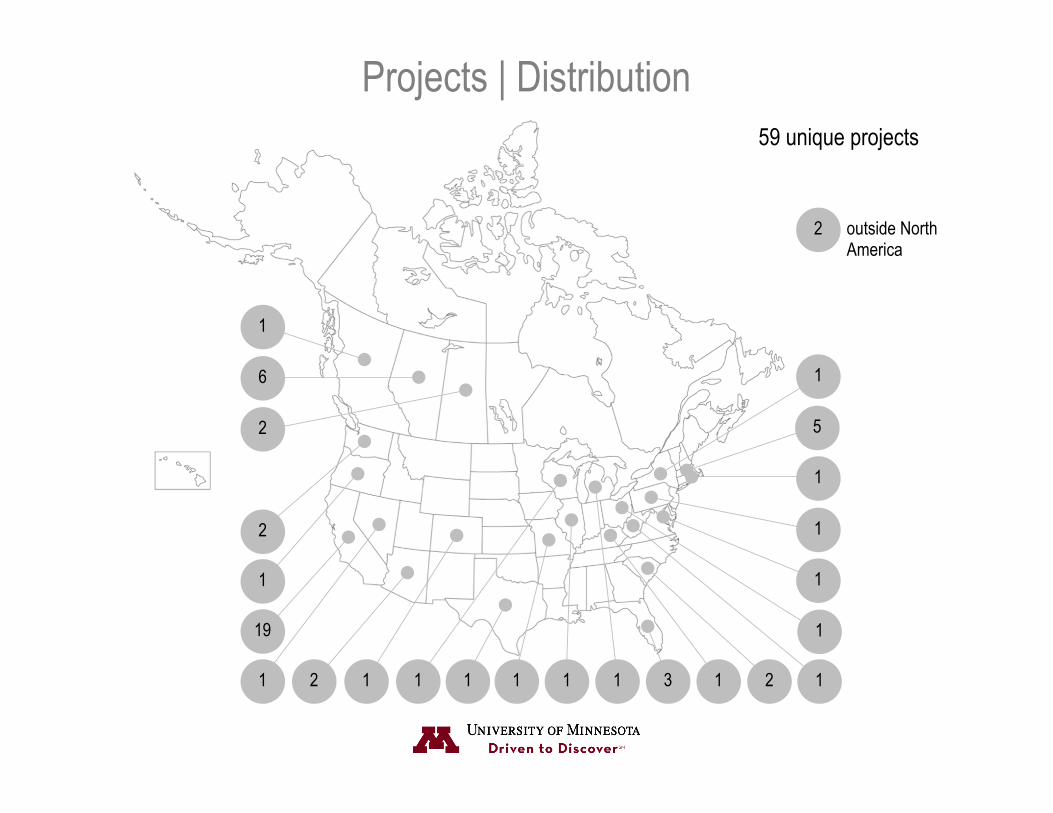
Projects | Distribution
19
1 1 1 2 1 1 1 1
1
1
1
1
5
2 1 3 1
1
1
2
2
6
1
2 outside North America
59 unique projects
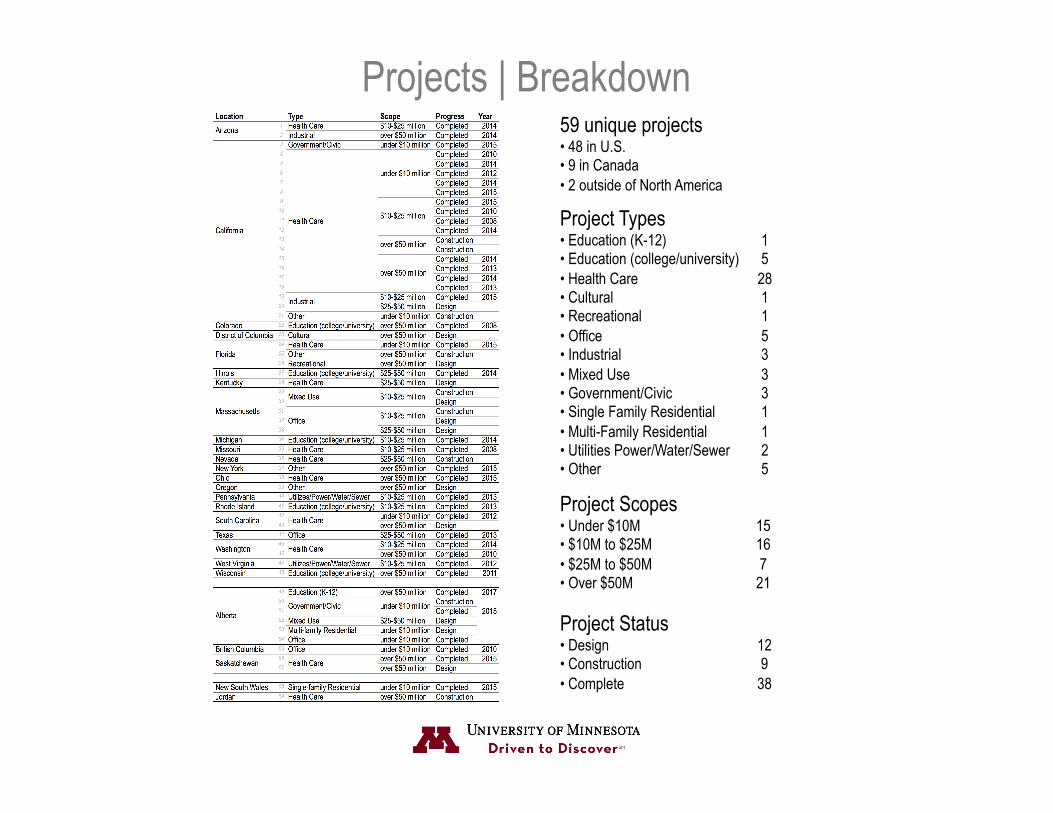
Projects | Breakdown 59 unique projects • 48 in U.S. • 9 in Canada • 2 outside of North America
Project Types • Education (K-12) • Education (college/university) • Health Care • Cultural • Recreational • Office • Industrial • Mixed Use • Government/Civic • Single Family Residential • Multi-Family Residential • Utilities Power/Water/Sewer • Other
1 5
28 1 1 5 3 3 3 1 1 2 5
Project Scopes • Under $10M • $10M to $25M • $25M to $50M • Over $50M
15 16 7
21
Project Status • Design • Construction • Complete
12 9
38
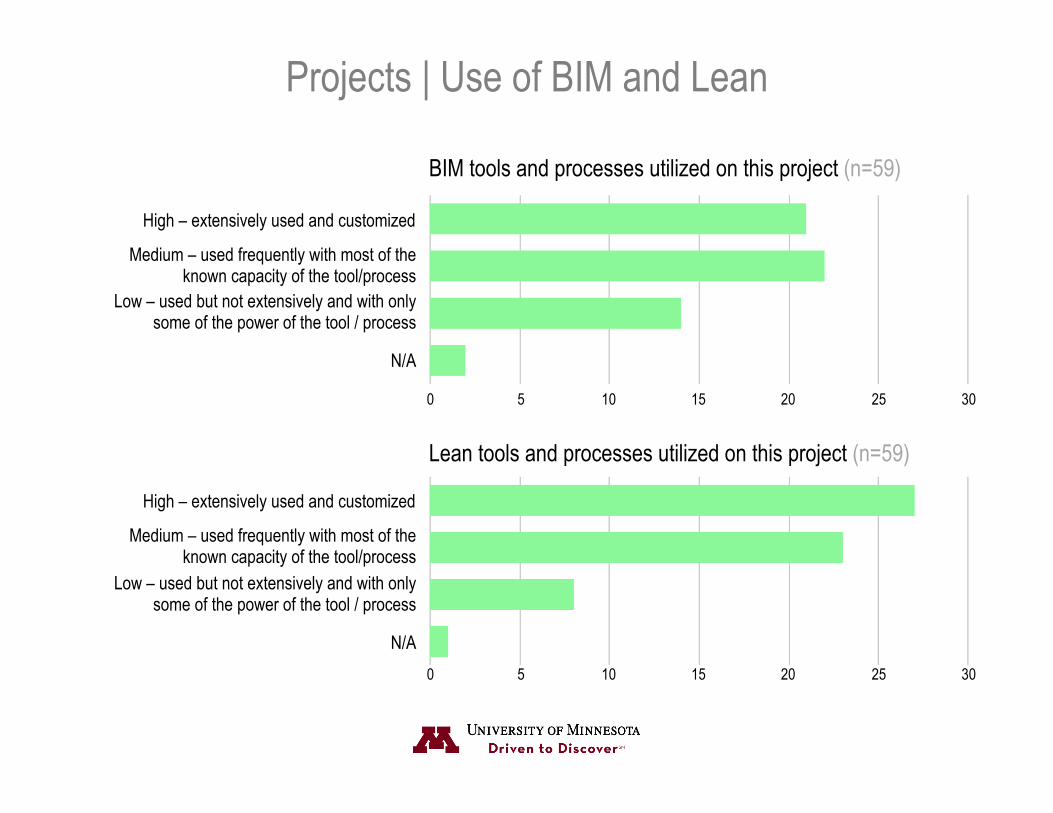
Projects | Use of BIM and Lean
BIM tools and processes utilized on this project (n=59)
N/A
High – extensively used and customized
Medium – used frequently with most of the known capacity of the tool/process
Low – used but not extensively and with only some of the power of the tool / process
N/A
High – extensively used and customized
Medium – used frequently with most of the known capacity of the tool/process
Low – used but not extensively and with only some of the power of the tool / process
Lean tools and processes utilized on this project (n=59)
0 5 10 15 20 25 30
0 5 10 15 20 25 30
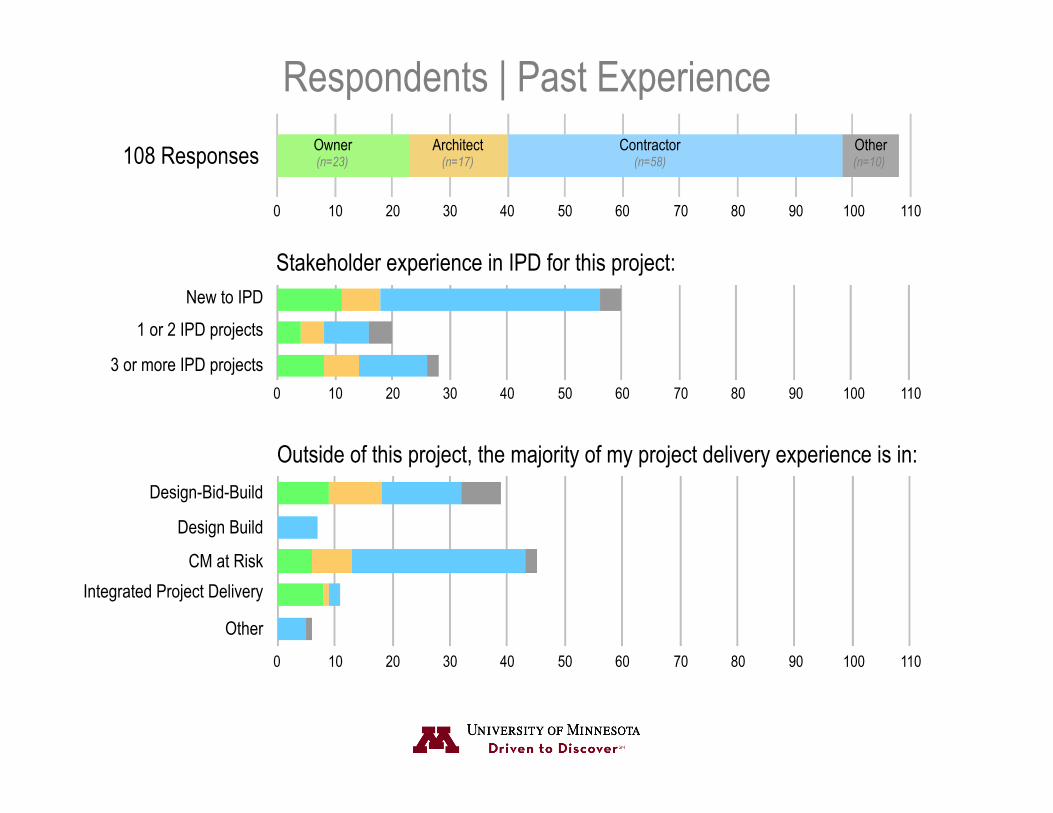
Respondents | Past Experience 108 Responses
Owner (n=23)
Architect (n=17)
Contractor (n=58)
Other (n=10)
New to IPD 1 or 2 IPD projects
3 or more IPD projects
Design-Bid-Build
Design Build
CM at Risk Integrated Project Delivery
Other
0 10 20 30 40 50 60 70 80 90 100 110
0 10 20 30 40 50 60 70 80 90 100 110
Outside of this project, the majority of my project delivery experience is in:
Stakeholder experience in IPD for this project:
0 10 20 30 40 50 60 70 80 90 100 110

Respondents | Why IPD? 108 Responses
Owner (n=23)
Architect (n=17)
Contractor (n=58)
Other (n=10)
0 10 20 30 40 50 60 70 80 90 100 110
Other
Marketing/positioning
Market forces
Desire IPD experience
Desire to repeat IPD
Owner required
Desire more integration
Challenging sched. or budget
Challenging bldg technology
Challenging program
0 10 20 30 40 50 60 70 80 90 100 110
The reason(s) we chose IPD were:
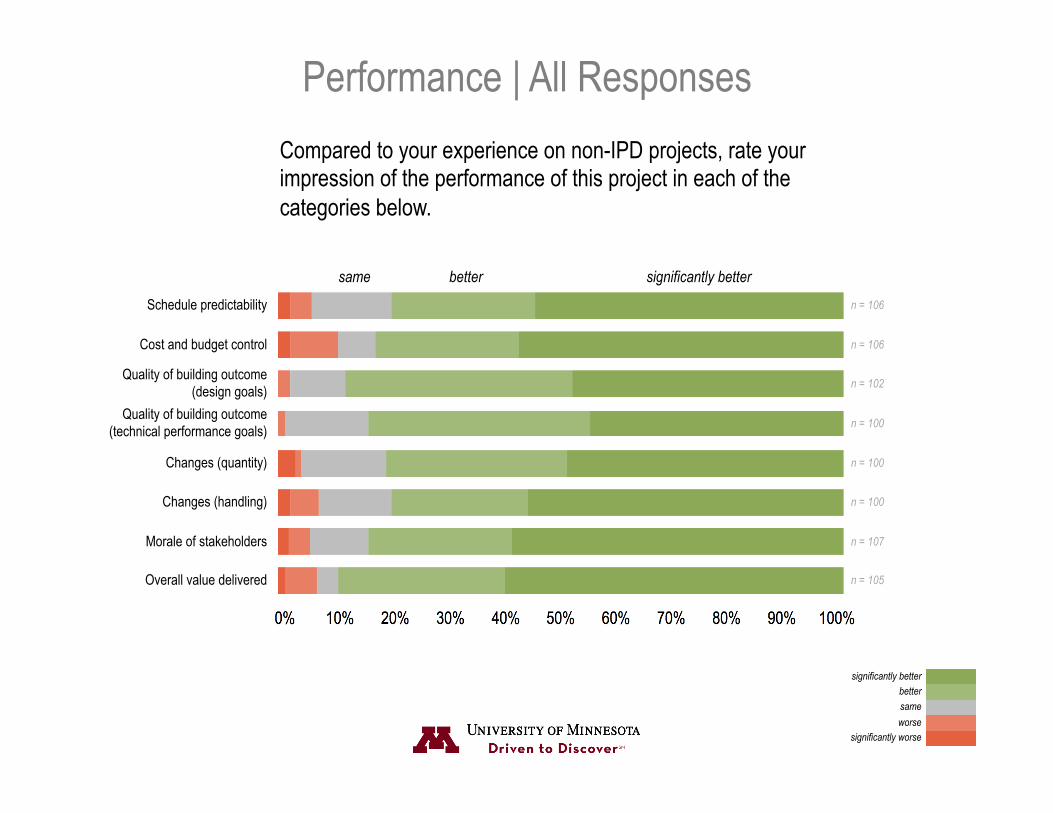
Performance | All Responses Compared to your experience on non-IPD projects, rate your impression of the performance of this project in each of the categories below.
Schedule predictability
Cost and budget control
Overall value delivered
Quality of building outcome (design goals)
Quality of building outcome (technical performance goals)
Changes (quantity)
Changes (handling)
Morale of stakeholders
n = 106
n = 106
n = 105
n = 102
n = 100
n = 100
n = 100
n = 107
significantly better better same
worse significantly worse
same better
significantly better
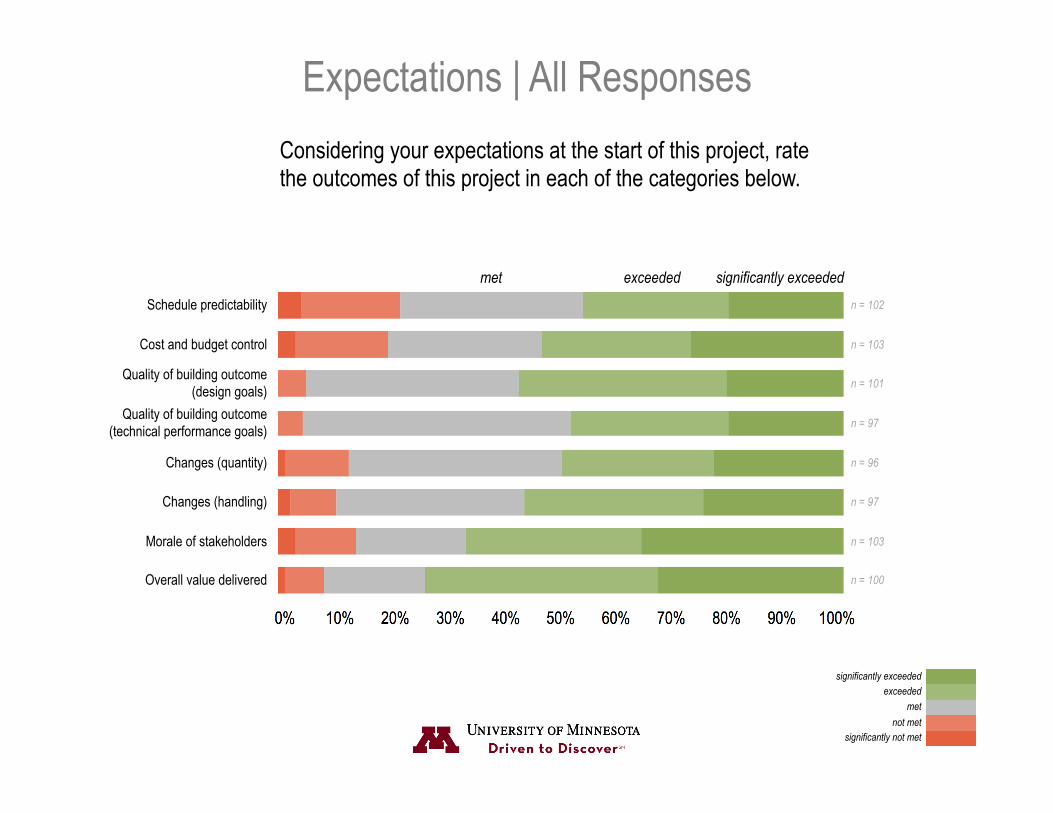
Expectations | All Responses Considering your expectations at the start of this project, rate the outcomes of this project in each of the categories below.
Schedule predictability
Cost and budget control
Overall value delivered
Quality of building outcome (design goals)
Quality of building outcome (technical performance goals)
Changes (quantity)
Changes (handling)
Morale of stakeholders
n = 102
n = 103
n = 100
n = 101
n = 97
n = 96
n = 97
n = 103
significantly exceeded exceeded met
not met significantly not met
met exceeded
significantly exceeded
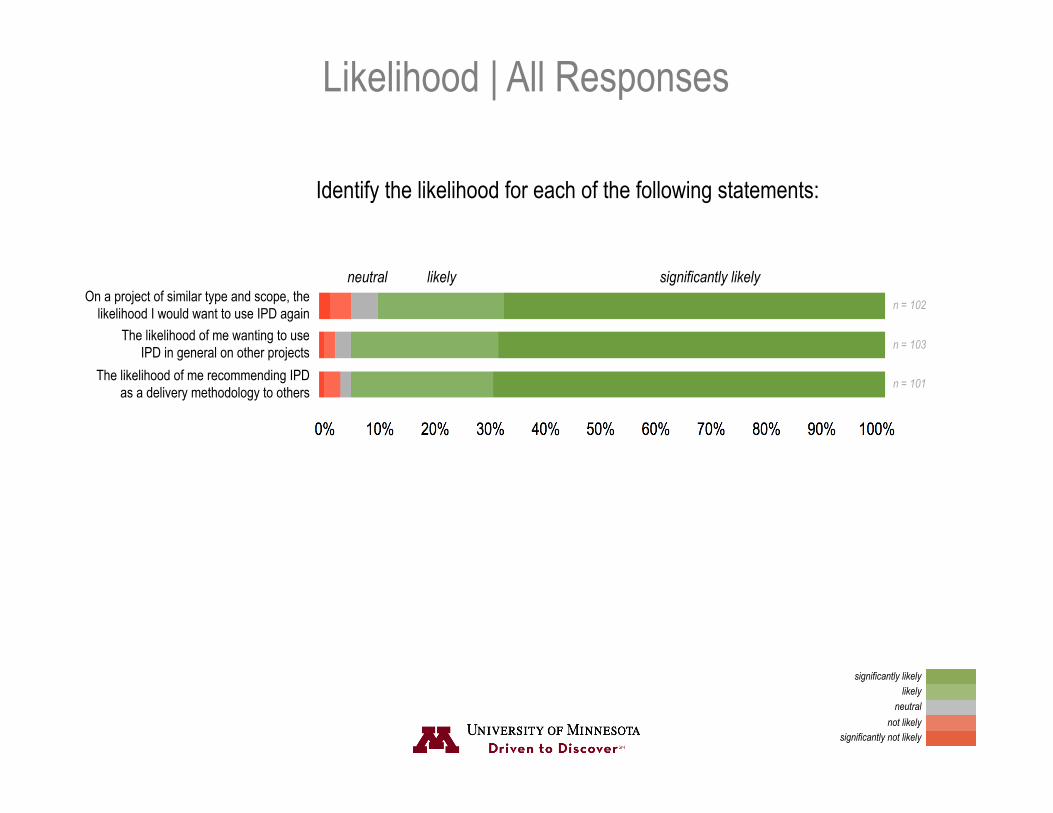
Likelihood | All Responses
Identify the likelihood for each of the following statements:
n = 102
n = 103
n = 101
On a project of similar type and scope, the likelihood I would want to use IPD again
The likelihood of me wanting to use IPD in general on other projects
The likelihood of me recommending IPD as a delivery methodology to others
significantly likely likely neutral
not likely significantly not likely
neutral likely
significantly likely
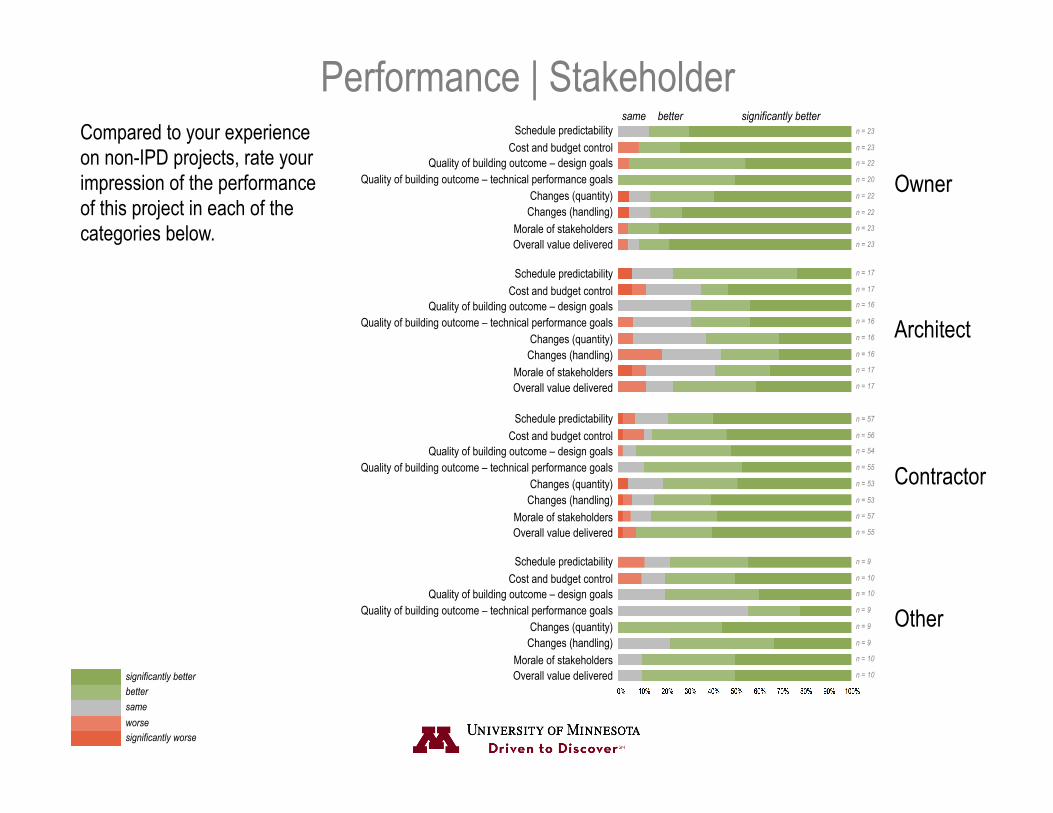
Performance | Stakeholder
worse significantly worse
same better significantly better
Compared to your experience on non-IPD projects, rate your impression of the performance of this project in each of the categories below.
Owner
Architect
Contractor
Other
Schedule predictability Cost and budget control
Overall value delivered
Quality of building outcome – design goals Quality of building outcome – technical performance goals
Changes (quantity) Changes (handling)
Morale of stakeholders
n = 23
n = 23
n = 23
n = 22
n = 20
n = 22
n = 22
n = 23
n = 17
n = 17
n = 17
n = 16
n = 16
n = 16
n = 16
n = 17
n = 57
n = 56
n = 55
n = 54
n = 55
n = 53
n = 53
n = 57
n = 9
n = 10
n = 10
n = 10
n = 9
n = 9
n = 9
n = 10
significantly better better same
Schedule predictability Cost and budget control
Overall value delivered
Quality of building outcome – design goals Quality of building outcome – technical performance goals
Changes (quantity) Changes (handling)
Morale of stakeholders
Schedule predictability Cost and budget control
Overall value delivered
Quality of building outcome – design goals Quality of building outcome – technical performance goals
Changes (quantity) Changes (handling)
Morale of stakeholders
Schedule predictability Cost and budget control
Overall value delivered
Quality of building outcome – design goals Quality of building outcome – technical performance goals
Changes (quantity) Changes (handling)
Morale of stakeholders
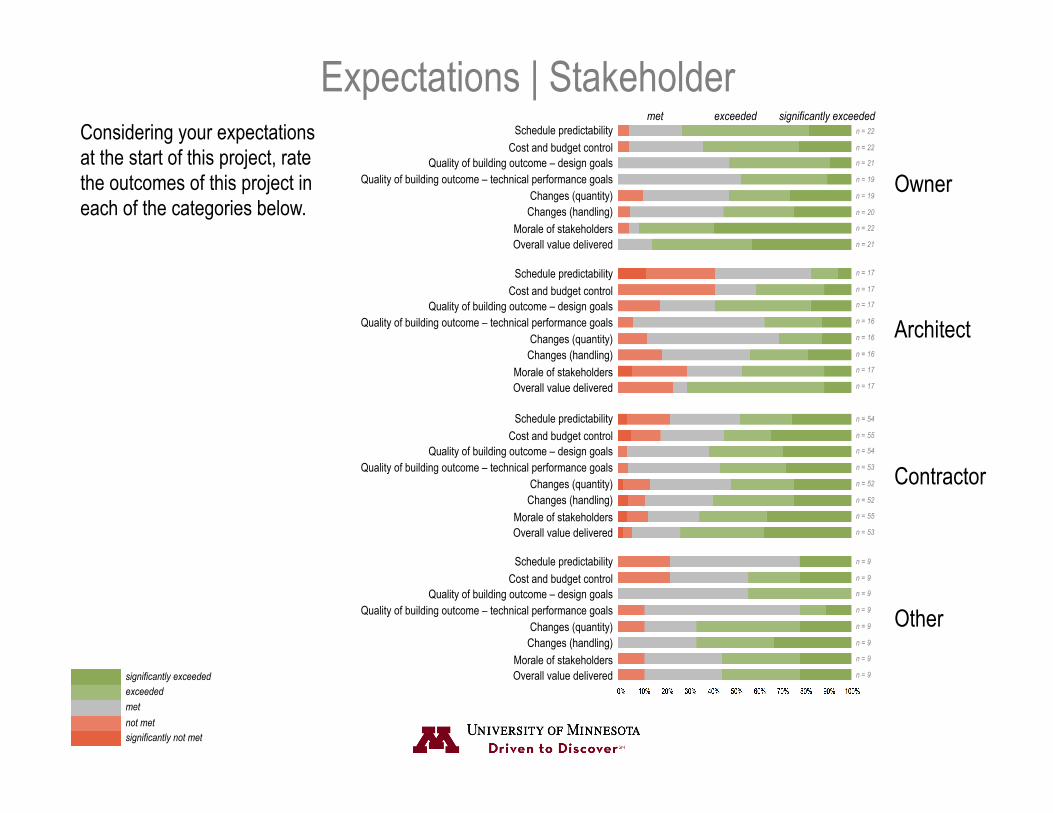
Expectations | Stakeholder
not met significantly not met
met exceeded significantly exceeded
Considering your expectations at the start of this project, rate the outcomes of this project in each of the categories below.
Owner
Architect
Contractor
Other
Schedule predictability Cost and budget control
Overall value delivered
Quality of building outcome – design goals Quality of building outcome – technical performance goals
Changes (quantity) Changes (handling)
Morale of stakeholders
n = 22
n = 22
n = 21
n = 21
n = 19
n = 19
n = 20
n = 22
n = 17
n = 17
n = 17
n = 17
n = 16
n = 16
n = 16
n = 17
n = 54
n = 55
n = 53
n = 54
n = 53
n = 52
n = 52
n = 55
n = 9
n = 9
n = 9
n = 9
n = 9
n = 9
n = 9
n = 9
significantly exceeded exceeded met
Schedule predictability Cost and budget control
Overall value delivered
Quality of building outcome – design goals Quality of building outcome – technical performance goals
Changes (quantity) Changes (handling)
Morale of stakeholders
Schedule predictability Cost and budget control
Overall value delivered
Quality of building outcome – design goals Quality of building outcome – technical performance goals
Changes (quantity) Changes (handling)
Morale of stakeholders
Schedule predictability Cost and budget control
Overall value delivered
Quality of building outcome – design goals Quality of building outcome – technical performance goals
Changes (quantity) Changes (handling)
Morale of stakeholders
On a project of similar type and scope, the likelihood I would want to use IPD again
The likelihood of me wanting to use IPD in general on other projects
The likelihood of me recommending IPD as a delivery methodology to others
n = 23
n = 23
n = 23
On a project of similar type and scope, the likelihood I would want to use IPD again
The likelihood of me wanting to use IPD in general on other projects
The likelihood of me recommending IPD as a delivery methodology to others
On a project of similar type and scope, the likelihood I would want to use IPD again
The likelihood of me wanting to use IPD in general on other projects
The likelihood of me recommending IPD as a delivery methodology to others
On a project of similar type and scope, the likelihood I would want to use IPD again
The likelihood of me wanting to use IPD in general on other projects
The likelihood of me recommending IPD as a delivery methodology to others
n = 17
n = 17
n = 17
n = 58
n = 58
n = 58
n = 10
n = 10
n = 10
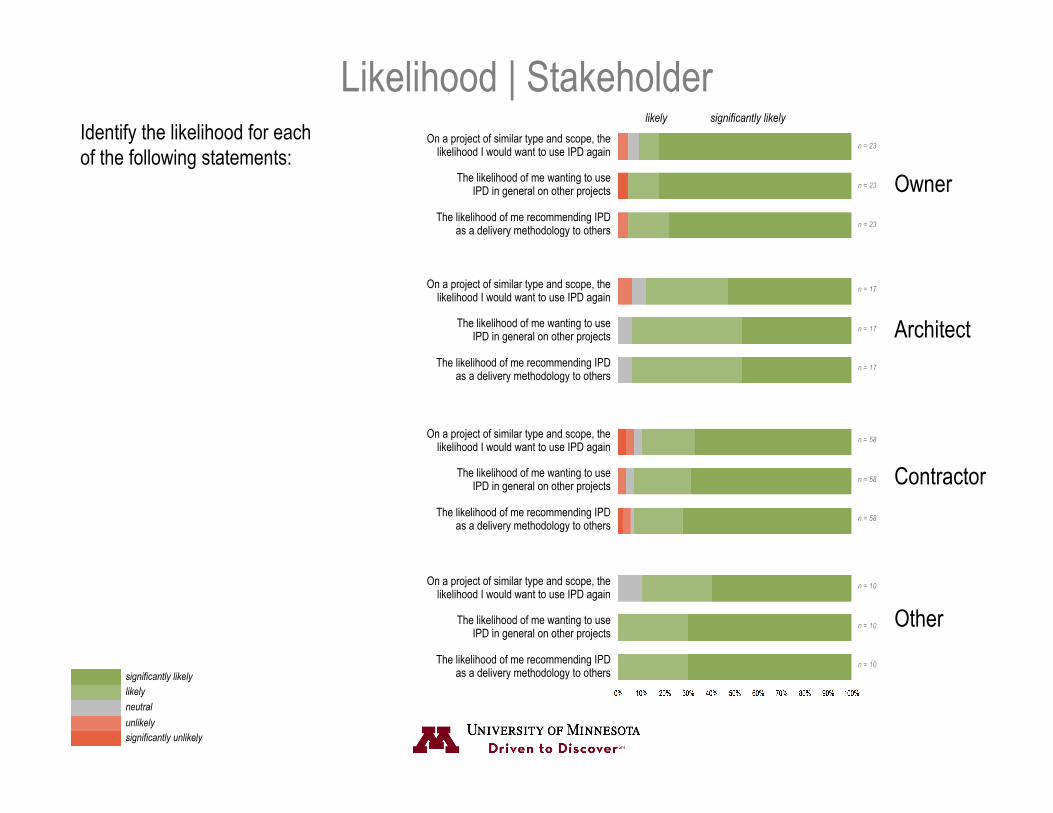
Likelihood | Stakeholder
unlikely significantly unlikely
neutral likely significantly likely
Identify the likelihood for each of the following statements:
Owner
Architect
Contractor
Other
significantly likely likely

The data in this report was collected between July 9th and September 15th 2015. We recognize that many stakeholders on past or current
projects did not have the chance to participate and as such their experiences are not represented in this data set.
To increase the robustness of the report, the survey will remain open
until September 15th 2016, followed by a revised report.
If you are have worked on or are currently working on an IPD project, please take the survey here:
http://survey.az1.qualtrics.com/jfe/form/SV_5uPcumvO8xJu9CZ
Survey Open Through September 2016!
This work was funded by the Integrated Project Delivery Alliance.
The Integrated Project Delivery Alliance (IPDA) is a group of organizations that seek to advance integrated project delivery (IPD) as a delivery method in
Canada. The mission of the IPDA is to promote best practices that enhance IPD. www.ipda.ca
Acknowledgements
Special thanks to the following individuals and organizations for promoting participation in the survey: Associated General Contractors (AGC)
Construction Owner’s Association of America (COAA) Dan Fauchier | ReAlignment Group
David Umstot | Umstot Project and Facilities Solutions, LLC Howard Ashcraft | Hanson Bridgett
Randy Deutsch AIA Rex Miller
P2SL
Project Team Renee Cheng AIA | University of Minnesota | [email protected]
Markku Allison AIA | Scan Consulting | [email protected] Carrie Sturts Dossick PE PhD + Chris Monson RA PhD Candidate


![20150925 presentatie DuBoLimburg handouts [Alleen-lezen]escolimburg2020.be/files/Warmtenetten/20150925... · Leuvense Warmtenetten studiedag DuBoLimburg, 25/09/2015 Daan Van Tassel](https://img.pdfslide.net/doc/110x75/5fad5263a67a42580538720f/20150925-presentatie-dubolimburg-handouts-alleen-lezen-leuvense-warmtenetten-studiedag.jpg)