Embed Size (px)
Citation preview

IPG Investor Presentation
IPG Investor Presentation
March 2018
2IPG Investor Presentation
Safe Harbor Statement• Certain statements and information included in this presentation constitute "forward-looking information" within the meaning of applicable Canadian securities legislation and "forward-looking statements"
within the meaning of Section 27A of the Securities Act of 1933, as amended, and Section 21E of the Securities Exchange Act of 1934, as amended (collectively, "forward-looking statements"), which are made in reliance upon the protections provided by such legislation for forward-looking statements. All statements other than statements of historical facts included in this presentation, including statements regarding the Company's capital allocation priorities, including its investment strategies, acquisition strategies, anticipated annualized dividends and share repurchases, the Company's capital expenditures, including its anticipated cost and return expectations, the Capstone Partnership, including the goal of the Capstone Partnership, the total cash consideration, and the timing and intended use of such consideration, the Midland, North Carolina manufacturing facility expansion, including the goal of the expansion, the total cash consideration, and the timing and intended use of such consideration, the Company’s quarterly cash dividend, and the Company's fourth quarter and full year 2018 outlook, including expected revenue growth, adjusted EBITDA, the effective tax rate and income tax expenses, may constitute forward-looking statements. These forward-looking statements are based on current beliefs, assumptions, expectations, estimates, forecasts and projections made by the Company's management. Words such as "may," "will," "should," "expect," "continue," "intend," "estimate," "anticipate," "plan," "foresee," "believe," or "seek" or the negatives of these terms or variations of them or similar terminology are intended to identify such forward-looking statements. Although the Company believes that the expectations reflected in these forward-looking statements are reasonable, these statements, by their nature, involve risks and uncertainties and are not guarantees of future performance. Such statements are also subject to assumptions concerning, among other things: business conditions and growth or declines in the Company's industry, the Company's customers' industries and the general economy; the anticipated benefits from the Company's manufacturing facility expansions, greenfield developments, manufacturing cost reduction programs and other restructuring efforts; the anticipated benefits from the Company’s acquisitions and partnerships; accounting adjustments; the anticipated benefits from the Company’s capital expenditures; the quality and market reception of the Company's products; the effective tax rate and income tax expenses; the Company's anticipated business strategies; risks and costs inherent in litigation; risks and costs inherent in the Company’s intellectual property; the Company’s ability to maintain and improve quality and customer service; the Company’s ability to retain, and adequately develop and incentivize, its management team and key employees; anticipated trends in the Company's business; anticipated cash flows from the Company’s operations; availability of funds under the Company’s Revolving Credit Facility; the Company's ability to continue to control costs; the impact of raw material price fluctuations; movements in the prices of key inputs such as raw material, energy and labor; government policies, including those specifically regarding the manufacturing industry, such as industrial licensing, environmental regulations, labor and safety regulations, import restrictions and duties, intellectual property laws, excise duties, sales taxes, and value added taxes; accidents and natural disasters; changes to accounting rules and standards; expected strategic and financial benefits from the Company’s ongoing capital investment and mergers and acquisitions programs; and other factors beyond the Company's control. The Company can give no assurance that these statements and expectations will prove to have been correct. Actual outcomes and results may, and often do, differ from what is expressed, implied or projected in such forward-looking statements, and such differences may be material. You are cautioned not to place undue reliance on any forward-looking statement.
• For additional information regarding important factors that could cause actual results to differ materially from those expressed in these forward-looking statements and other risks and uncertainties, and the assumptions underlying the forward-looking statements, you are encouraged to read "Item 3. Key Information - Risk Factors," "Item 5. Operating and Financial Review and Prospects (Management's Discussion & Analysis)" and statements located elsewhere in the Company's annual report on Form 20-F for the year ended December 31, 2016 and the other statements and factors contained in the Company's filings with the Canadian securities regulators and the US Securities and Exchange Commission. Each of these forward-looking statements speaks only as of the date of this presentation. The Company will not update these statements unless applicable securities laws require it to do so.
• This presentation contains certain non-GAAP financial measures as defined under applicable securities legislation, including Adjusted EBITDA, Adjusted EBITDA Margin, Trailing Twelve Month (“TTM”) Adjusted EBITDA, Debt to TTM Adjusted EBITDA, and Leverage Ratio. The Company has included these non-GAAP financial measures because it believes that they allow investors to make a more meaningful comparison between periods of the Company’s performance, underlying business trends and the Company’s ongoing operations. The Company further believes these measures may be useful in comparing its operating performance with the performance of other companies that may have different financing and capital structures, and tax rates. Adjusted EBITDA excludes costs that are not considered by management to be representative of the Company’s underlying core operating performance, including certain non-operating expenses, non-cash expenses and non-recurring expenses. In addition, adjusted EBITDA is used by management to set targets and is a metric that, among others, can be used by the Company’s Compensation Committee to establish performance bonus metrics and payout, and by the Company’s lenders and investors to evaluate the Company’s performance and ability to service its debt, finance capital expenditures and acquisitions, and provide for the payment of dividends to shareholders. The Company has included Leverage Ratio because it believes that it allows investors to make a meaningful comparison of the Company’s liquidity level. In addition, Leverage Ratio is used by management in evaluating the Company’s performance because it believes that it allows management to monitor the Company's liquidity level and evaluate its capacity to deploy capital to meet its strategic objectives. As required by applicable securities legislation, the Company has provided definitions of these non-GAAP measures contained in this presentation, as well as a reconciliation of each of them to the most directly comparable GAAP measure, on its website at http://www.intertapepolymer.com under “Investor Relations” and “Events and Presentations” and “Investor Presentations”. You are encouraged to review the related GAAP financial measures and the reconciliation of non-GAAP measures to their most directly comparable GAAP measures set forth on the website and should consider non-GAAP measures only as a supplement to, not as a substitute for or as a superior measure to, measures of financial performance prepared in accordance with GAAP.
IPG Investor Presentation3
IPG Investor Presentation4
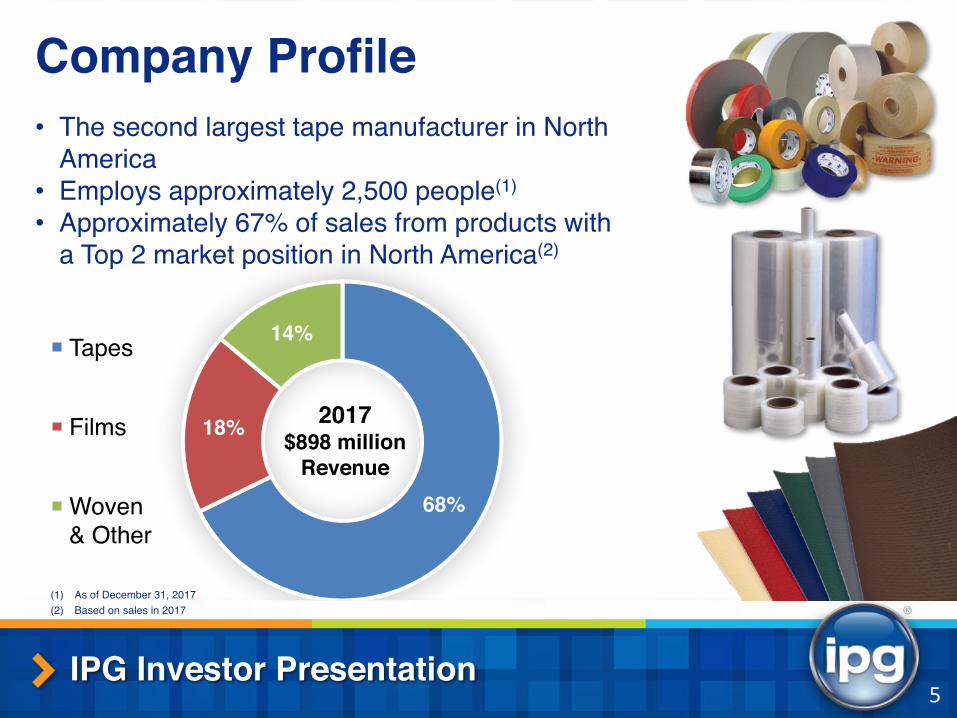
Company Profile• The second largest tape manufacturer in North
America• Employs approximately 2,500 people(1)
• Approximately 67% of sales from products with a Top 2 market position in North America(2)
IPG Investor Presentation5
68%
18%
14% Tapes
Films
Woven & Other
2017$898 million
Revenue
(1) As of December 31, 2017(2) Based on sales in 2017
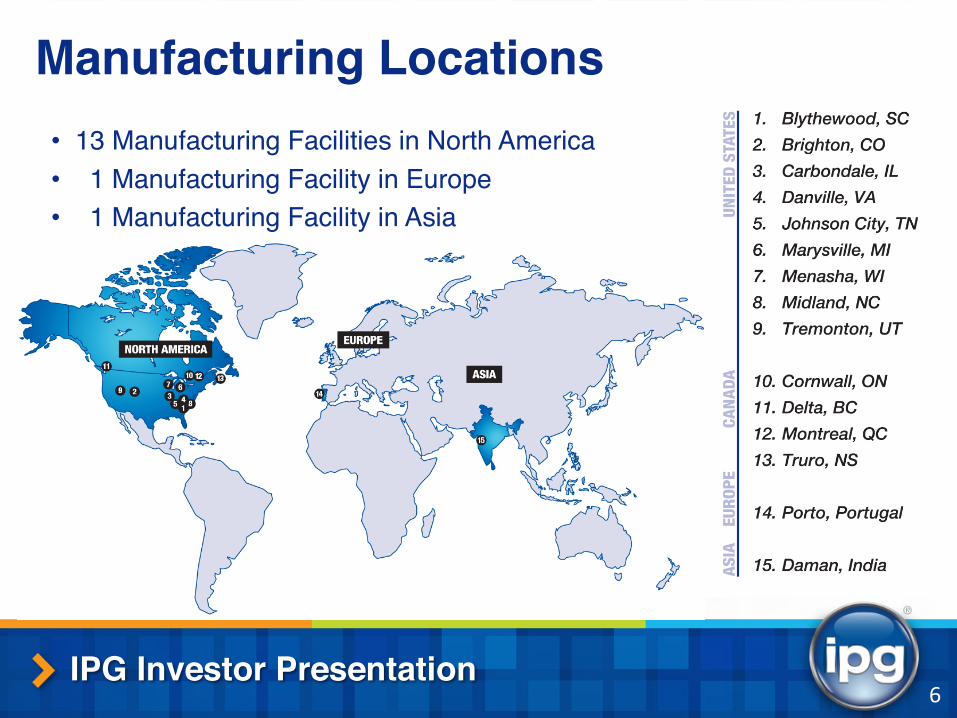
Manufacturing Locations
IPG Investor Presentation6
• 13 Manufacturing Facilities in North America• 1 Manufacturing Facility in Europe• 1 Manufacturing Facility in Asia
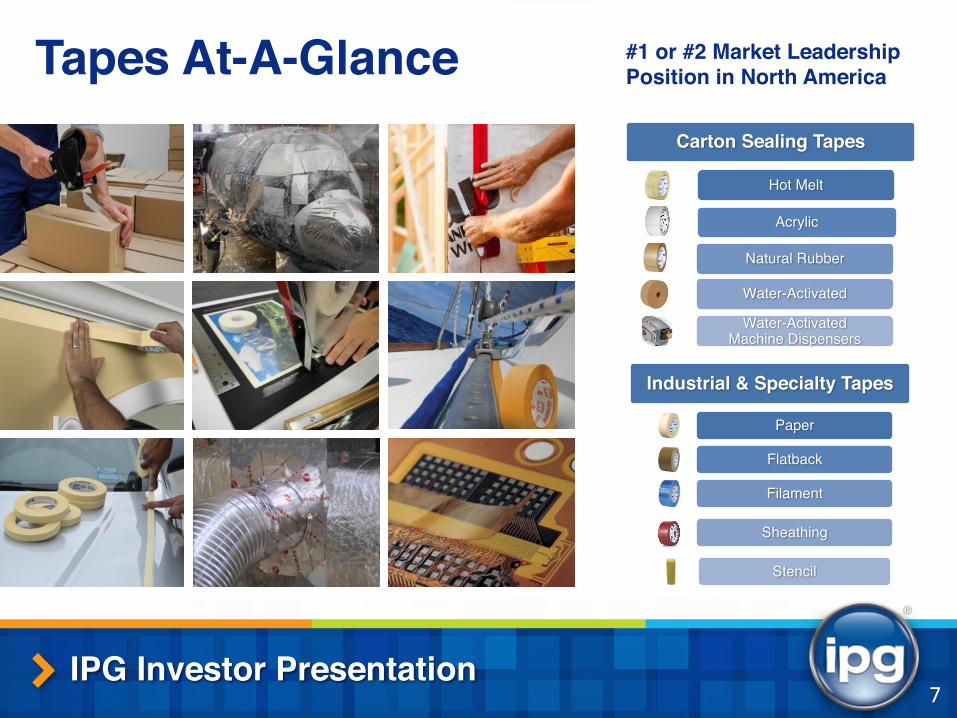
Tapes At-A-Glance #1 or #2 Market Leadership Position in North America
IPG Investor Presentation7
Carton Sealing Tapes
Hot Melt
Acrylic
Natural Rubber
Water-Activated
Water-Activated Machine Dispensers
Industrial & Specialty Tapes
Paper
Flatback
Filament
Sheathing
Stencil
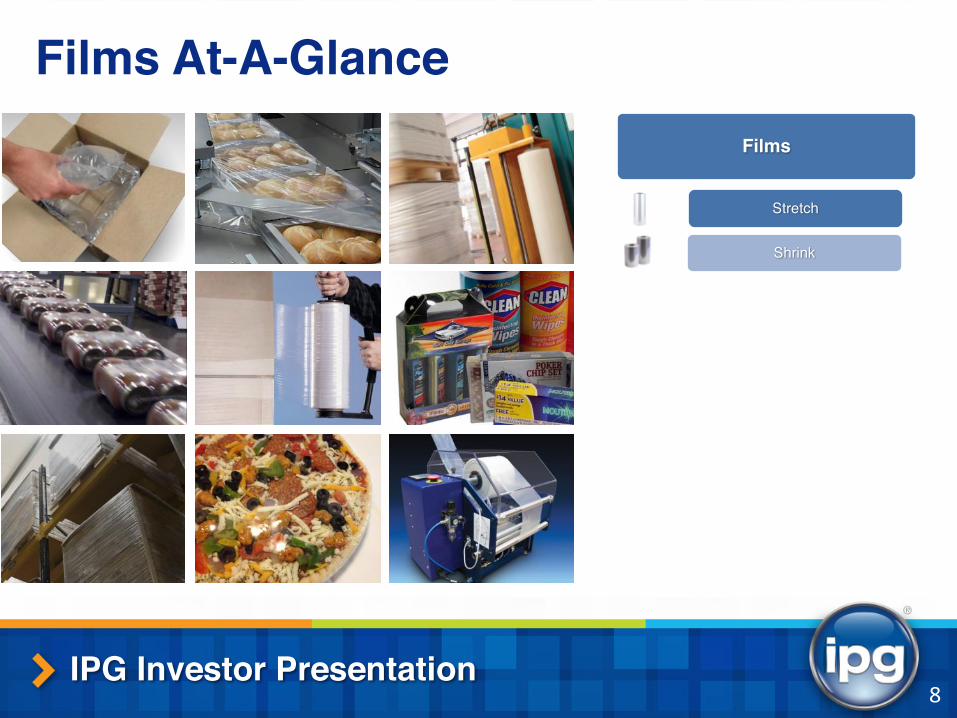
Films At-A-Glance
IPG Investor Presentation8
Films
Stretch
Shrink
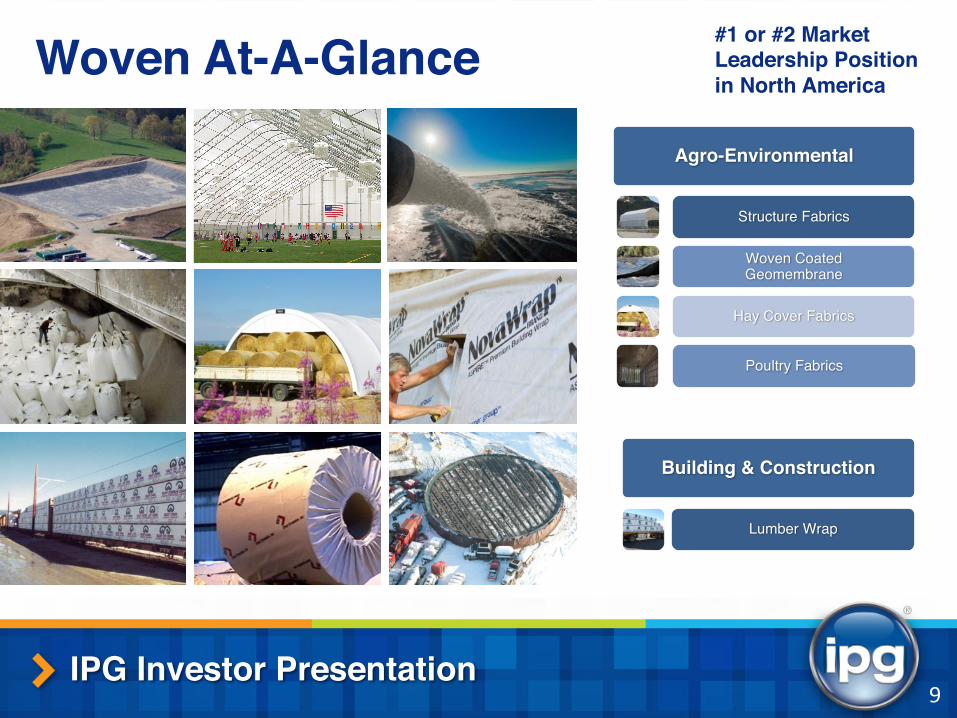
Woven At-A-Glance
IPG Investor Presentation
Agro-Environmental
Structure Fabrics
Woven Coated Geomembrane
Hay Cover Fabrics
Poultry Fabrics
Building & Construction
Lumber Wrap
#1 or #2 Market Leadership Position in North America
9
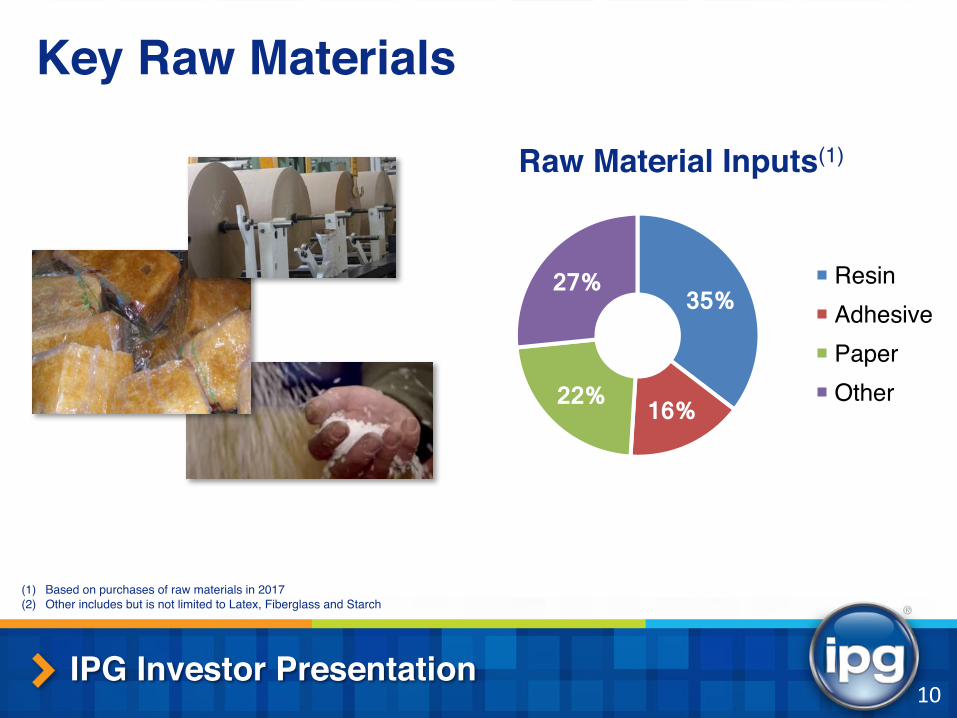
Key Raw Materials
(1) Based on purchases of raw materials in 2017(2) Other includes but is not limited to Latex, Fiberglass and Starch
IPG Investor Presentation10
35%
16% 22%
27%
Raw Material Inputs(1)
ResinAdhesivePaper Other
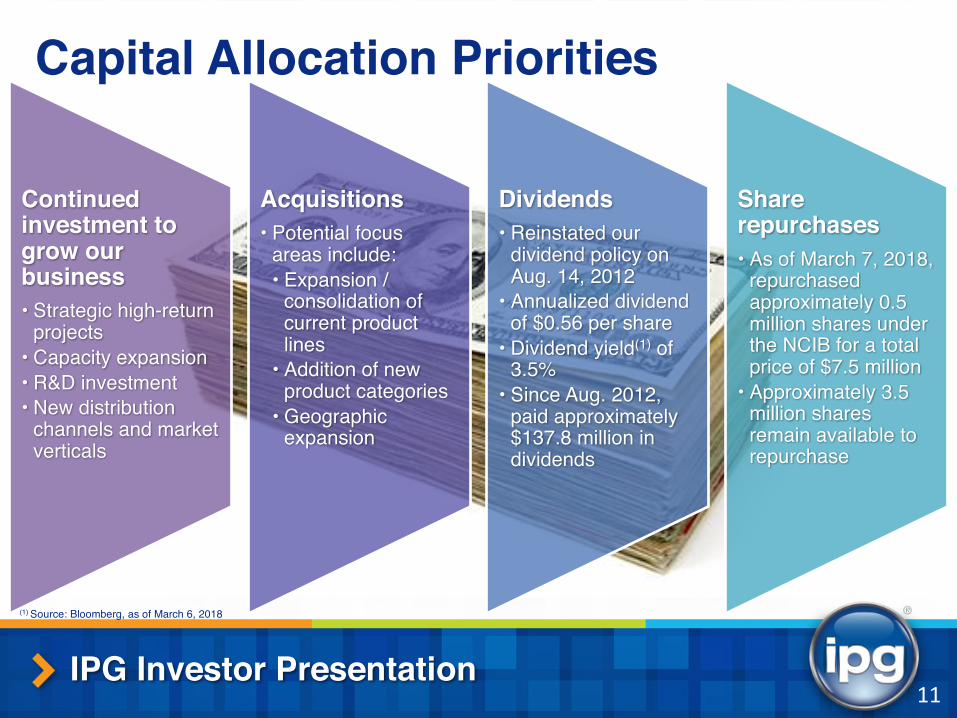
Continued investment to grow our business• Strategic high-return
projects• Capacity expansion• R&D investment• New distribution
channels and market verticals
Acquisitions• Potential focus
areas include:• Expansion /
consolidation of current product lines
• Addition of new product categories
• Geographic expansion
Dividends• Reinstated our
dividend policy on Aug. 14, 2012
• Annualized dividend of $0.56 per share
• Dividend yield(1) of 3.5%
• Since Aug. 2012, paid approximately $137.8 million in dividends
Share repurchases• As of March 7, 2018,
repurchased approximately 0.5 million shares under the NCIB for a total price of $7.5 million
• Approximately 3.5 million shares remain available to repurchase
IPG Investor Presentation11
Capital Allocation Priorities
(1) Source: Bloomberg, as of March 6, 2018
IPG Investor Presentation12
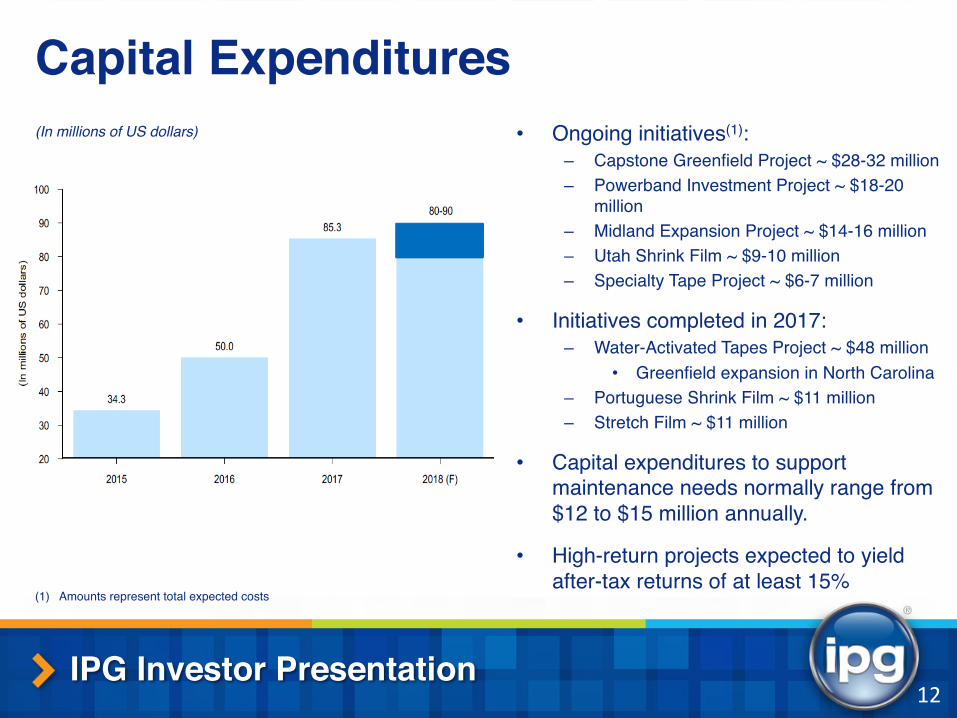
Capital Expenditures(In millions of US dollars)
(1) Amounts represent total expected costs
• Ongoing initiatives(1):– Capstone Greenfield Project ~ $28-32 million– Powerband Investment Project ~ $18-20
million– Midland Expansion Project ~ $14-16 million– Utah Shrink Film ~ $9-10 million– Specialty Tape Project ~ $6-7 million
• Initiatives completed in 2017:– Water-Activated Tapes Project ~ $48 million
• Greenfield expansion in North Carolina– Portuguese Shrink Film ~ $11 million– Stretch Film ~ $11 million
• Capital expenditures to support maintenance needs normally range from $12 to $15 million annually.
• High-return projects expected to yield after-tax returns of at least 15%
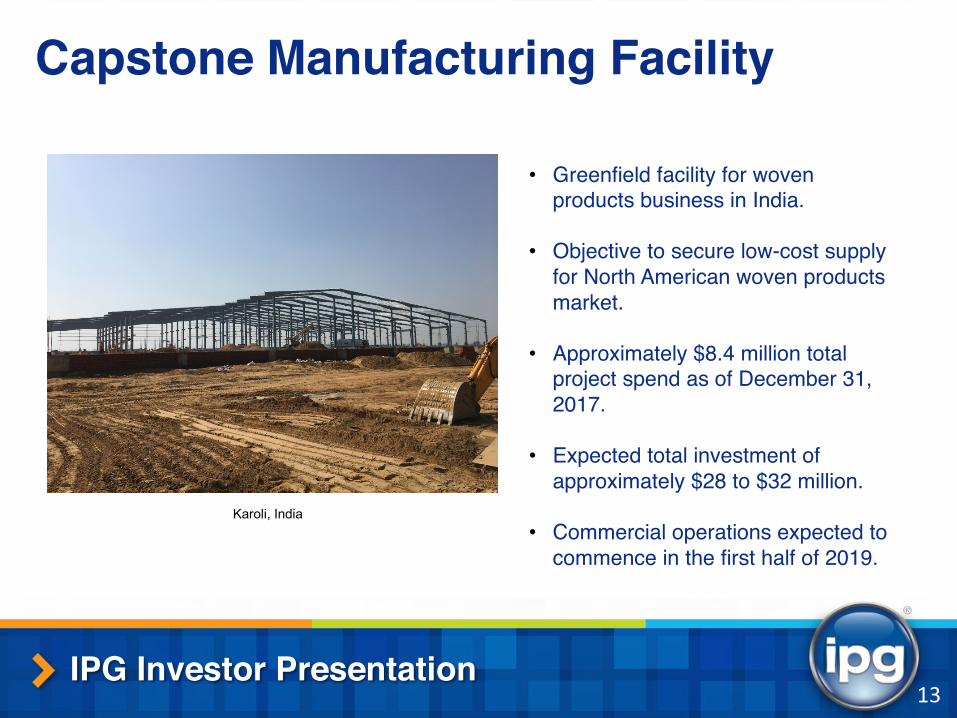
Capstone Manufacturing Facility
IPG Investor Presentation13
• Greenfield facility for woven products business in India.
• Objective to secure low-cost supply for North American woven products market.
• Approximately $8.4 million total project spend as of December 31, 2017.
• Expected total investment of approximately $28 to $32 million.
• Commercial operations expected to commence in the first half of 2019.
Karoli, India
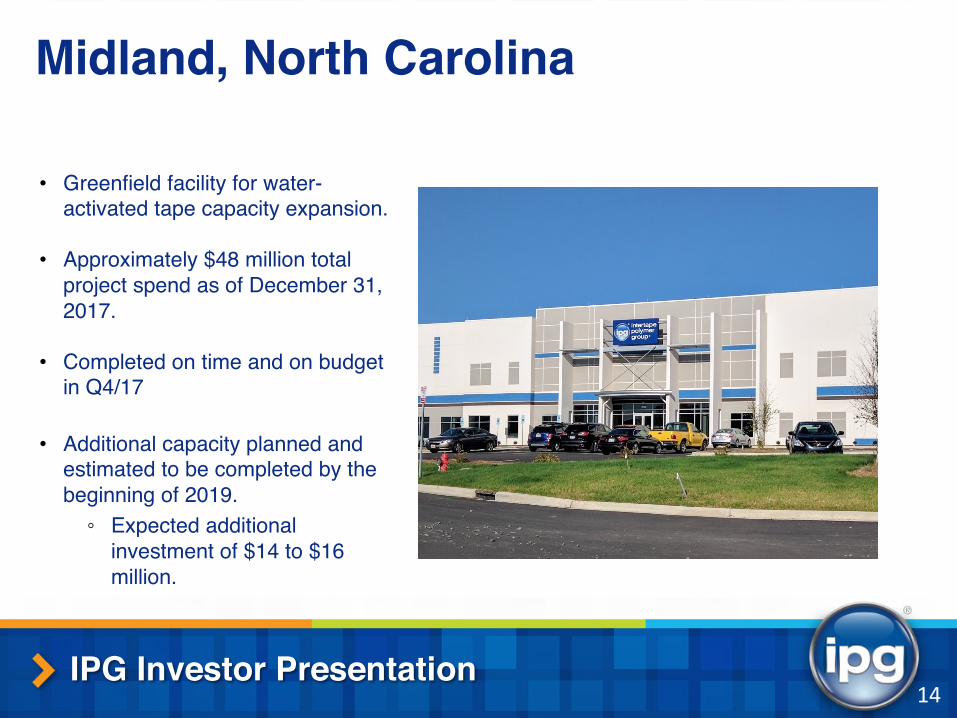
Midland, North Carolina
IPG Investor Presentation14
• Greenfield facility for water-activated tape capacity expansion.
• Approximately $48 million total project spend as of December 31, 2017.
• Completed on time and on budget in Q4/17
• Additional capacity planned and estimated to be completed by the beginning of 2019.
◦ Expected additional investment of $14 to $16 million.
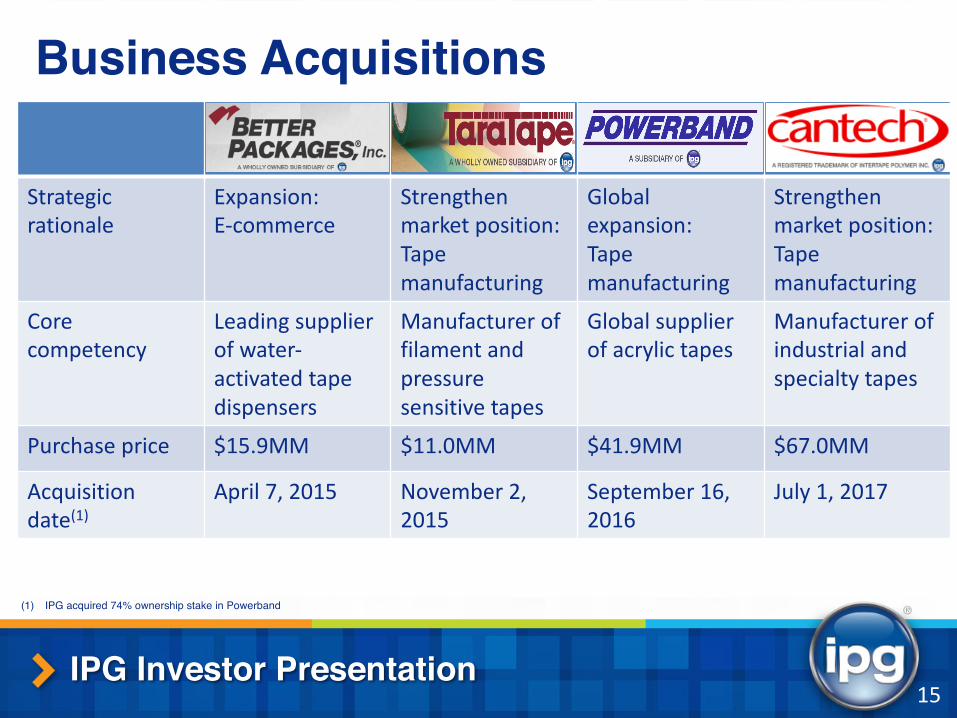
Business Acquisitions
IPG Investor Presentation15
(1) IPG acquired 74% ownership stake in Powerband
Strategicrationale
Expansion:E-commerce
Strengthenmarketposition:Tapemanufacturing
Globalexpansion:Tapemanufacturing
Strengthenmarketposition:Tapemanufacturing
Corecompetency
Leadingsupplierofwater-activatedtapedispensers
Manufacturer offilamentandpressuresensitivetapes
Globalsupplierofacrylictapes
Manufacturer ofindustrialandspecialtytapes
Purchaseprice $15.9MM $11.0MM $41.9MM $67.0MM
Acquisitiondate(1)
April7,2015 November 2,2015
September 16,2016
July1,2017
IPG Investor Presentation16
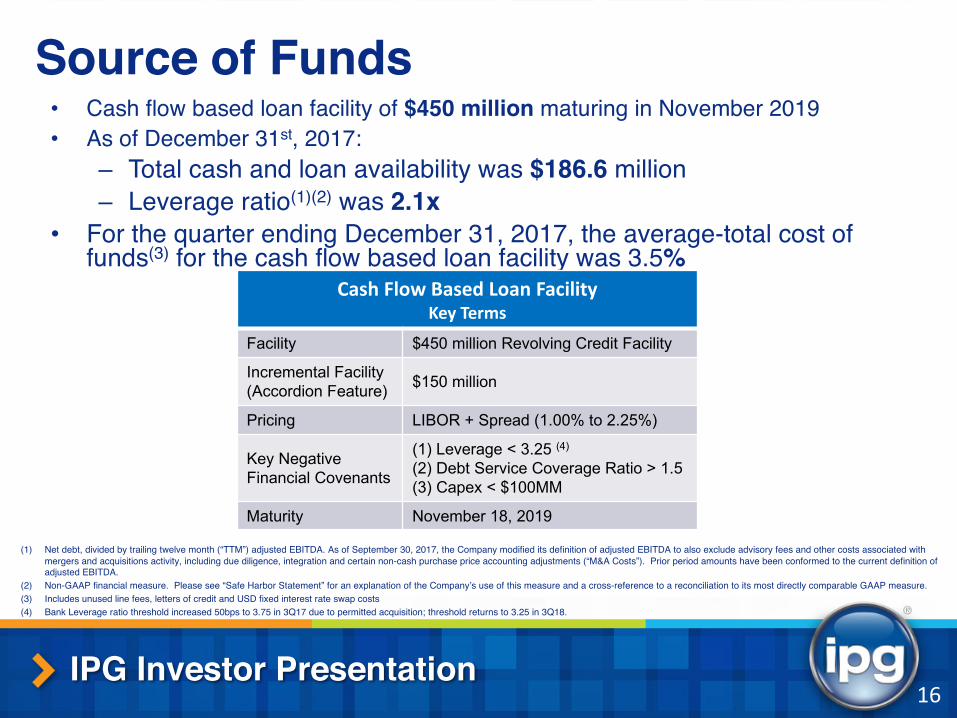
• Cash flow based loan facility of $450 million maturing in November 2019• As of December 31st, 2017:
– Total cash and loan availability was $186.6 million– Leverage ratio(1)(2) was 2.1x
• For the quarter ending December 31, 2017, the average-total cost of funds(3) for the cash flow based loan facility was 3.5%
Source of Funds
(1) Net debt, divided by trailing twelve month (“TTM”) adjusted EBITDA. As of September 30, 2017, the Company modified its definition of adjusted EBITDA to also exclude advisory fees and other costs associated with mergers and acquisitions activity, including due diligence, integration and certain non-cash purchase price accounting adjustments (“M&A Costs”). Prior period amounts have been conformed to the current definition of adjusted EBITDA.
(2) Non-GAAP financial measure. Please see “Safe Harbor Statement” for an explanation of the Company’s use of this measure and a cross-reference to a reconciliation to its most directly comparable GAAP measure.(3) Includes unused line fees, letters of credit and USD fixed interest rate swap costs(4) Bank Leverage ratio threshold increased 50bps to 3.75 in 3Q17 due to permitted acquisition; threshold returns to 3.25 in 3Q18.
Cash FlowBasedLoanFacilityKeyTerms
Facility $450 million Revolving Credit Facility
Incremental Facility (Accordion Feature) $150 million
Pricing LIBOR + Spread (1.00% to 2.25%)
Key Negative Financial Covenants
(1) Leverage < 3.25 (4)
(2) Debt Service Coverage Ratio > 1.5(3) Capex < $100MM
Maturity November 18, 2019
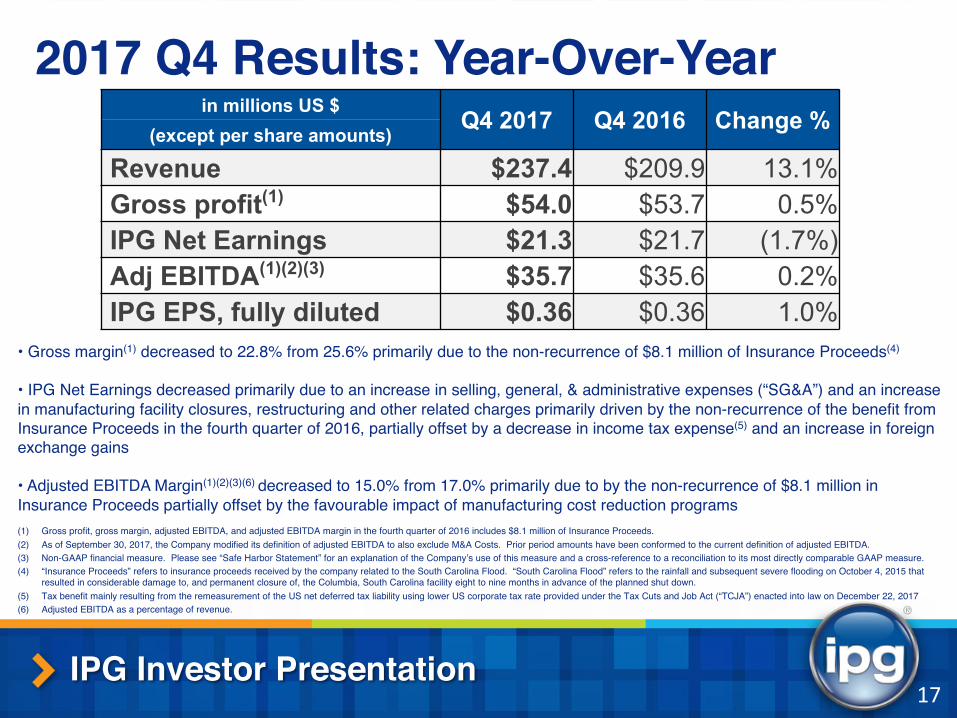
• Gross margin(1) decreased to 22.8% from 25.6% primarily due to the non-recurrence of $8.1 million of Insurance Proceeds(4)
• IPG Net Earnings decreased primarily due to an increase in selling, general, & administrative expenses (“SG&A”) and an increase in manufacturing facility closures, restructuring and other related charges primarily driven by the non-recurrence of the benefit from Insurance Proceeds in the fourth quarter of 2016, partially offset by a decrease in income tax expense(5) and an increase in foreign exchange gains
• Adjusted EBITDA Margin(1)(2)(3)(6) decreased to 15.0% from 17.0% primarily due to by the non-recurrence of $8.1 million in Insurance Proceeds partially offset by the favourable impact of manufacturing cost reduction programs
2017 Q4 Results: Year-Over-Year
IPG Investor Presentation17
in millions US $ Q4 2017 Q4 2016 Change %(except per share amounts)
Revenue $237.4 $209.9 13.1%Gross profit(1) $54.0 $53.7 0.5%IPG Net Earnings $21.3 $21.7 (1.7%)Adj EBITDA(1)(2)(3) $35.7 $35.6 0.2%IPG EPS, fully diluted $0.36 $0.36 1.0%
(1) Gross profit, gross margin, adjusted EBITDA, and adjusted EBITDA margin in the fourth quarter of 2016 includes $8.1 million of Insurance Proceeds. (2) As of September 30, 2017, the Company modified its definition of adjusted EBITDA to also exclude M&A Costs. Prior period amounts have been conformed to the current definition of adjusted EBITDA.(3) Non-GAAP financial measure. Please see “Safe Harbor Statement” for an explanation of the Company’s use of this measure and a cross-reference to a reconciliation to its most directly comparable GAAP measure. (4) “Insurance Proceeds” refers to insurance proceeds received by the company related to the South Carolina Flood. “South Carolina Flood” refers to the rainfall and subsequent severe flooding on October 4, 2015 that
resulted in considerable damage to, and permanent closure of, the Columbia, South Carolina facility eight to nine months in advance of the planned shut down.(5) Tax benefit mainly resulting from the remeasurement of the US net deferred tax liability using lower US corporate tax rate provided under the Tax Cuts and Job Act (“TCJA”) enacted into law on December 22, 2017(6) Adjusted EBITDA as a percentage of revenue.
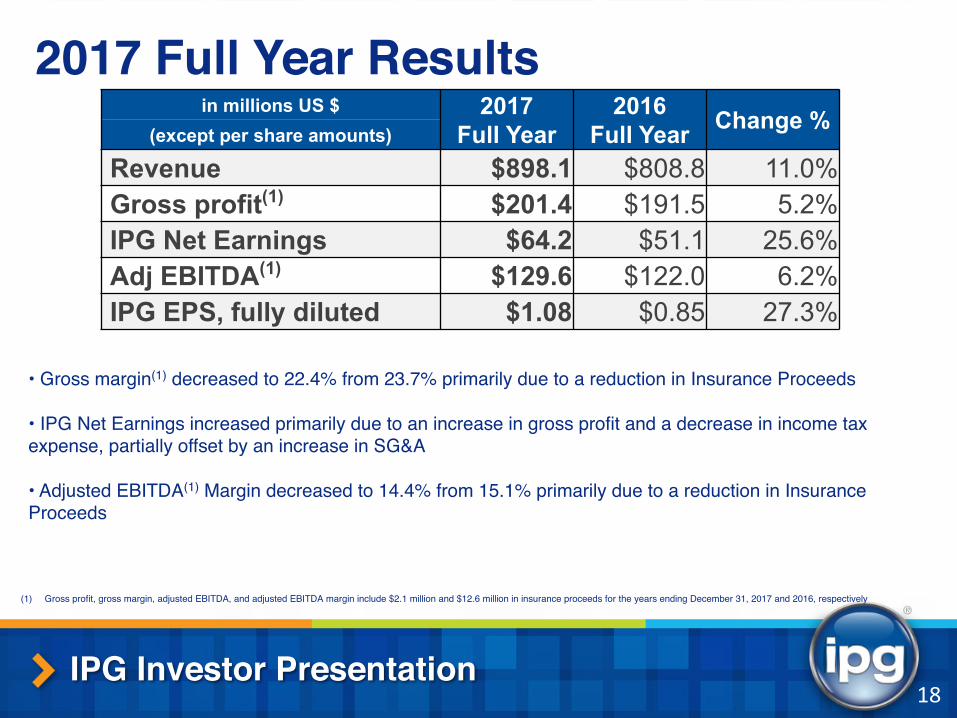
• Gross margin(1) decreased to 22.4% from 23.7% primarily due to a reduction in Insurance Proceeds
• IPG Net Earnings increased primarily due to an increase in gross profit and a decrease in income tax expense, partially offset by an increase in SG&A
• Adjusted EBITDA(1) Margin decreased to 14.4% from 15.1% primarily due to a reduction in Insurance Proceeds
2017 Full Year Results
IPG Investor Presentation18
in millions US $ 2017 Full Year
2016Full Year Change %(except per share amounts)
Revenue $898.1 $808.8 11.0%Gross profit(1) $201.4 $191.5 5.2%IPG Net Earnings $64.2 $51.1 25.6%Adj EBITDA(1) $129.6 $122.0 6.2%IPG EPS, fully diluted $1.08 $0.85 27.3%
(1) Gross profit, gross margin, adjusted EBITDA, and adjusted EBITDA margin include $2.1 million and $12.6 million in insurance proceeds for the years ending December 31, 2017 and 2016, respectively
IPG Investor Presentation19
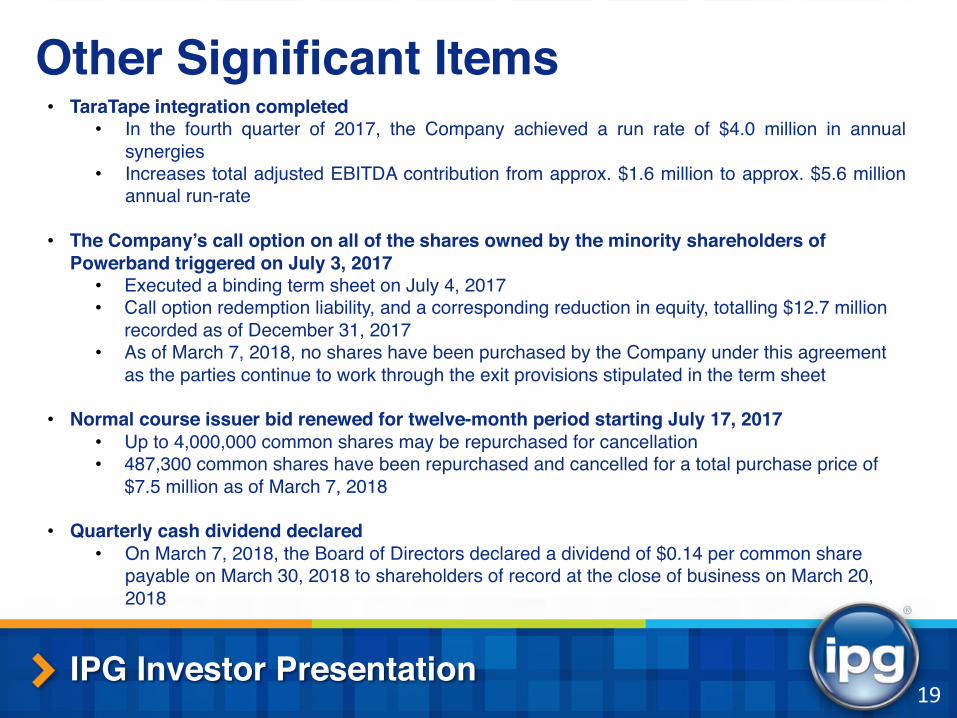
Other Significant Items• TaraTape integration completed
• In the fourth quarter of 2017, the Company achieved a run rate of $4.0 million in annualsynergies
• Increases total adjusted EBITDA contribution from approx. $1.6 million to approx. $5.6 millionannual run-rate
• The Company’s call option on all of the shares owned by the minority shareholders of Powerband triggered on July 3, 2017
• Executed a binding term sheet on July 4, 2017• Call option redemption liability, and a corresponding reduction in equity, totalling $12.7 million
recorded as of December 31, 2017 • As of March 7, 2018, no shares have been purchased by the Company under this agreement
as the parties continue to work through the exit provisions stipulated in the term sheet
• Normal course issuer bid renewed for twelve-month period starting July 17, 2017• Up to 4,000,000 common shares may be repurchased for cancellation • 487,300 common shares have been repurchased and cancelled for a total purchase price of
$7.5 million as of March 7, 2018
• Quarterly cash dividend declared • On March 7, 2018, the Board of Directors declared a dividend of $0.14 per common share
payable on March 30, 2018 to shareholders of record at the close of business on March 20, 2018
IPG Investor Presentation20
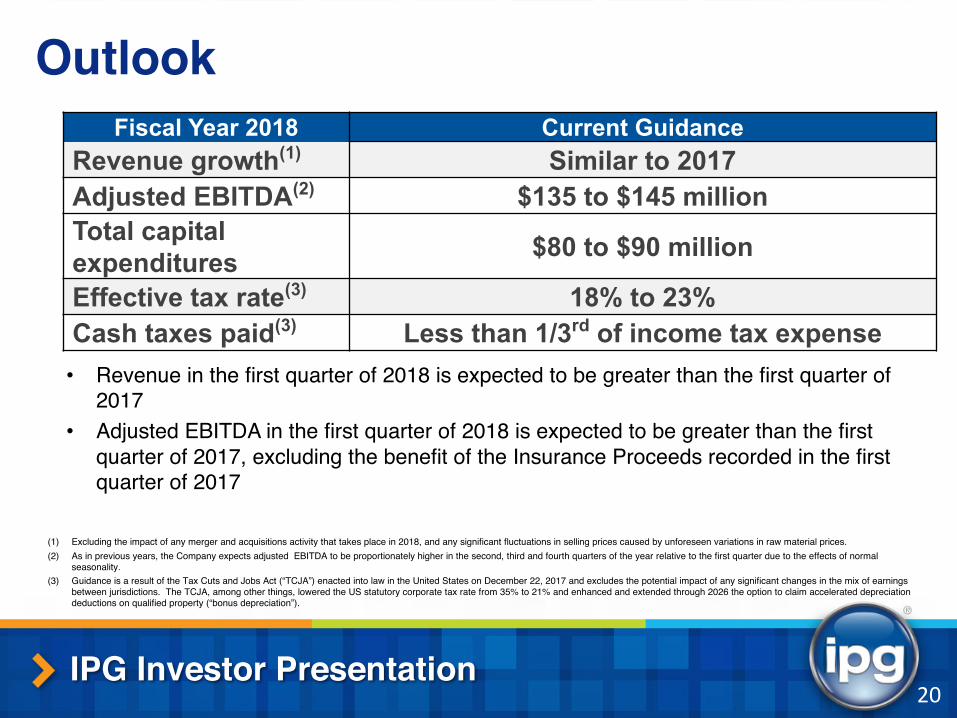
Outlook
• Revenue in the first quarter of 2018 is expected to be greater than the first quarter of 2017
• Adjusted EBITDA in the first quarter of 2018 is expected to be greater than the first quarter of 2017, excluding the benefit of the Insurance Proceeds recorded in the first quarter of 2017
(1) Excluding the impact of any merger and acquisitions activity that takes place in 2018, and any significant fluctuations in selling prices caused by unforeseen variations in raw material prices. (2) As in previous years, the Company expects adjusted EBITDA to be proportionately higher in the second, third and fourth quarters of the year relative to the first quarter due to the effects of normal
seasonality.(3) Guidance is a result of the Tax Cuts and Jobs Act (“TCJA”) enacted into law in the United States on December 22, 2017 and excludes the potential impact of any significant changes in the mix of earnings
between jurisdictions. The TCJA, among other things, lowered the US statutory corporate tax rate from 35% to 21% and enhanced and extended through 2026 the option to claim accelerated depreciation deductions on qualified property (“bonus depreciation”).
Fiscal Year 2018 Current GuidanceRevenue growth(1) Similar to 2017Adjusted EBITDA(2) $135 to $145 millionTotal capital expenditures $80 to $90 million
Effective tax rate(3) 18% to 23%Cash taxes paid(3) Less than 1/3rd of income tax expense
Thank You!
IPG Investor Presentation21