Embed Size (px)
Citation preview
IPGM Antioch-BT
Base map compiled by Illinois State Geological Survey from digital data provided by the United States Geological Survey. Topography and PLSS compiled 1960, digital revision 1993. Planimetry derived from imagery taken 1988.
North American Datum of 1983 (NAD 83)Projection: transverse Mercator10,000-foot ticks: Illinois State Plane coordinate system, west zone (transverse Mercator)1,000-meter ticks: Universal Transverse Mercator grid system, zone 16
Recommended citation:Dixon-Warren, A.B., and S.M. O’Malley, 2004, Bedrock Topography of Antioch Quadrangle,
Lake County, Illinois and Kenosha County, Wisconsin: Illinois State Geological Survey, Illinois Preliminary Geologic Map Series, IPGM Antioch-BT, 1:24,000.
Geology based on fieldwork and data compilation by A.B. Dixon-Warren and S.M. O’Malley, 2003.
Digital cartography by M. Barrett, Illinois State Geological Survey.
This Illinois Preliminary Geologic Map (IPGM) is a lightly edited product, subject to less scientific and cartographic review than our Illinois Geological Quadrangle (IGQ) series. It will not necessarily correspond to the format of IGQ series maps, or to those of other IPGM series maps. Whether or when this map will be upgraded depends on the resourc-es and priorities of the ISGS.
The Illinois State Geological Survey, the Illinois Department of Natural Resources, and the State of Illinois make no guarantee, expressed or implied, regarding the correctness of the interpretations presented in this document and accept no liability for the consequences of decisions made by others on the basis of the information presented here. The geologic interpretations are based on data that may vary with respect to accuracy of geographic location, the type and quantity of data available at each location, and the scientific/technical qualifications of the data sources. Maps or cross sections in this document are not meant to be enlarged.
Illinois Preliminary Geologic Map IPGM Antioch-BT
BEDROCK TOPOGRAPHY OF ANTIOCH QUADRANGLELAKE COUNTY, ILLINOIS AND KENOSHA COUNTY, WISCONSIN
Antigone B. Dixon-Warren and Steven M. O’Malley2004
BASE MAP CONTOUR INTERVAL 10 FEET
NATIONAL GEODETIC VERTICAL DATUM OF 1929
Released by the authority of the State of Illinois: 2004
ADJOINING QUADRANGLES1 Silver Lake2 Paddock Lake3 Pleasant Prairie4 Fox Lake5 Wadsworth6 Wauconda7 Grayslake8 Libertyville
Department of Natural ResourcesILLINOIS STATE GEOLOGICAL SURVEY
William W. Shilts, Chief
� � �
� �
� � �
���� �������� ����� ���� ���� ���� ���� ����
�� � ���������� �
����� ���� ����� �� � � ����
�� �� ���
���� ��������������
������� ������������ �������
��������� ������������ �������
����� ���� ����� ���� ���������� �������
���������� ����
���������� ����� ���� ����� ����� �����
� � �� �
����������� ���������������� ����
��
��
��
���
��
��
��
��
��
��
�For more information contact:Illinois State Geological Survey 615 East Peabody DriveChampaign, Illinois 61820-6964(217) 244-2414http://www.isgs.uiuc.edu
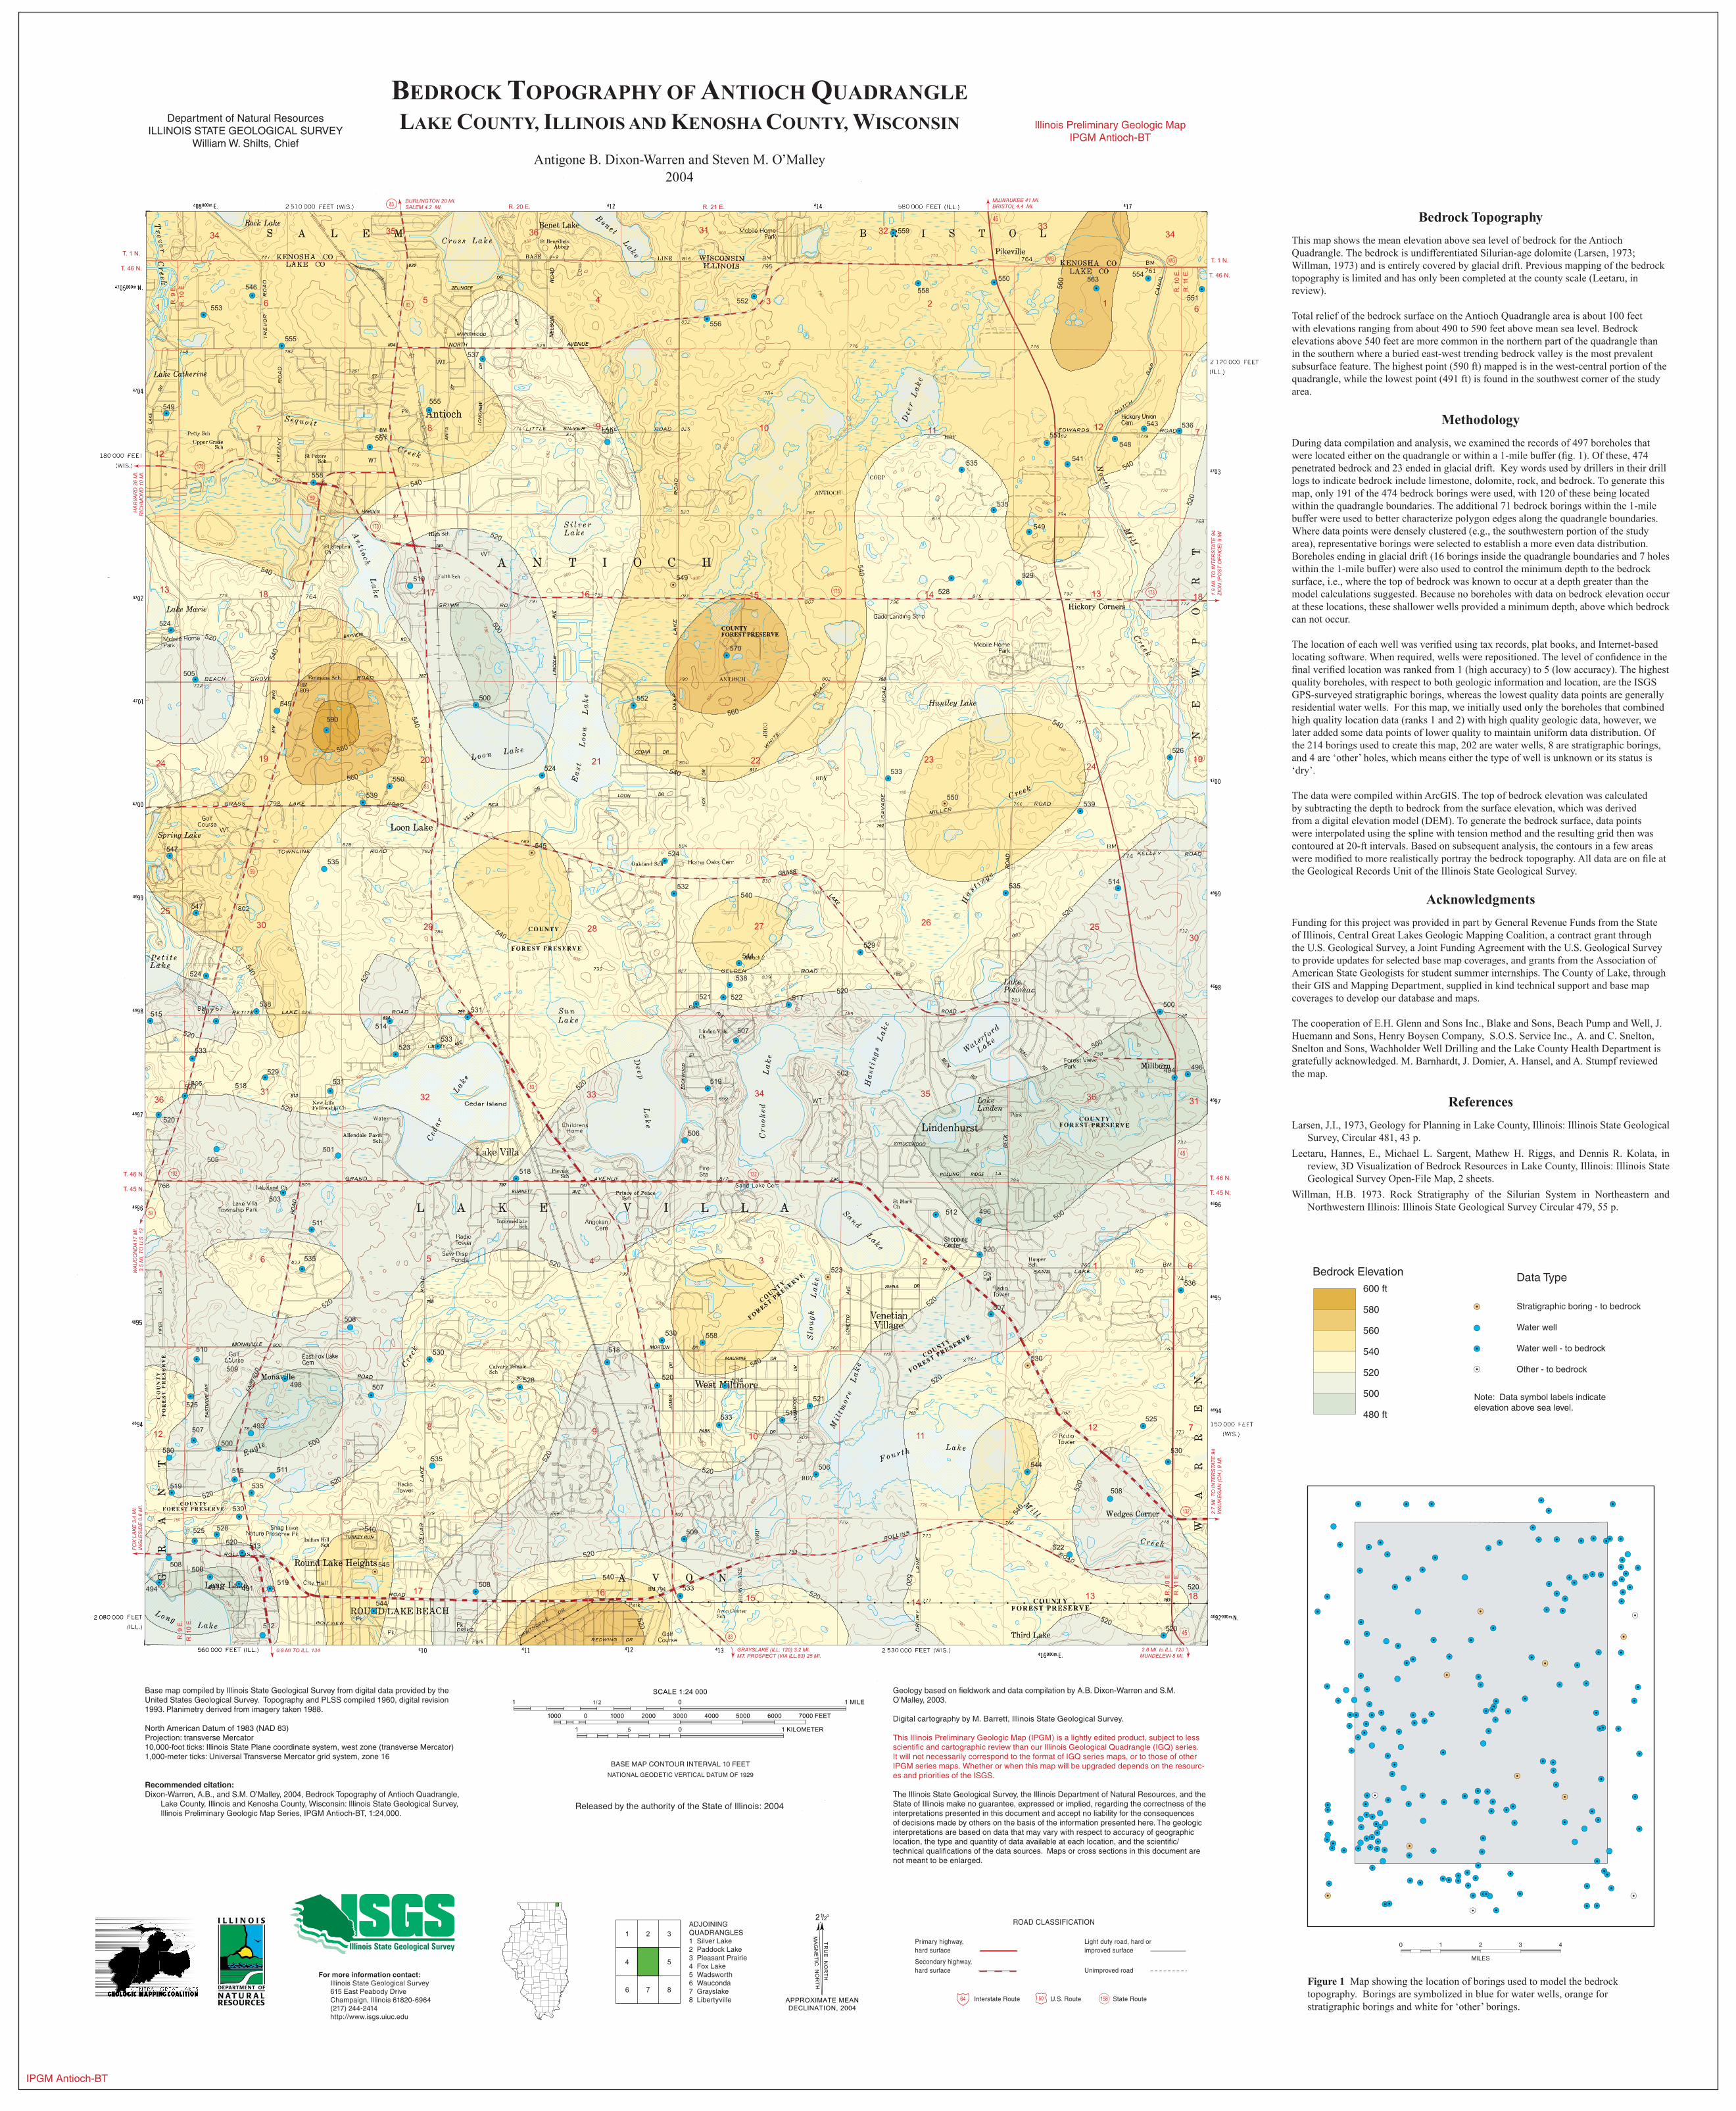
Bedrock Topography
This map shows the mean elevation above sea level of bedrock for the Antioch Quadrangle. The bedrock is undifferentiated Silurian-age dolomite (Larsen, 1973; Willman, 1973) and is entirely covered by glacial drift. Previous mapping of the bedrock topography is limited and has only been completed at the county scale (Leetaru, in review).
Total relief of the bedrock surface on the Antioch Quadrangle area is about 100 feet with elevations ranging from about 490 to 590 feet above mean sea level. Bedrock elevations above 540 feet are more common in the northern part of the quadrangle than in the southern where a buried east-west trending bedrock valley is the most prevalent subsurface feature. The highest point (590 ft) mapped is in the west-central portion of the quadrangle, while the lowest point (491 ft) is found in the southwest corner of the study area.
Methodology
During data compilation and analysis, we examined the records of 497 boreholes that were located either on the quadrangle or within a 1-mile buffer (fig. 1). Of these, 474 penetrated bedrock and 23 ended in glacial drift. Key words used by drillers in their drill logs to indicate bedrock include limestone, dolomite, rock, and bedrock. To generate this map, only 191 of the 474 bedrock borings were used, with 120 of these being located within the quadrangle boundaries. The additional 71 bedrock borings within the 1-mile buffer were used to better characterize polygon edges along the quadrangle boundaries. Where data points were densely clustered (e.g., the southwestern portion of the study area), representative borings were selected to establish a more even data distribution. Boreholes ending in glacial drift (16 borings inside the quadrangle boundaries and 7 holes within the 1-mile buffer) were also used to control the minimum depth to the bedrock surface, i.e., where the top of bedrock was known to occur at a depth greater than the model calculations suggested. Because no boreholes with data on bedrock elevation occur at these locations, these shallower wells provided a minimum depth, above which bedrock can not occur.
The location of each well was verified using tax records, plat books, and Internet-based locating software. When required, wells were repositioned. The level of confidence in the final verified location was ranked from 1 (high accuracy) to 5 (low accuracy). The highest quality boreholes, with respect to both geologic information and location, are the ISGS GPS-surveyed stratigraphic borings, whereas the lowest quality data points are generally residential water wells. For this map, we initially used only the boreholes that combined high quality location data (ranks 1 and 2) with high quality geologic data, however, we later added some data points of lower quality to maintain uniform data distribution. Of the 214 borings used to create this map, 202 are water wells, 8 are stratigraphic borings, and 4 are ‘other’ holes, which means either the type of well is unknown or its status is ‘dry’.
The data were compiled within ArcGIS. The top of bedrock elevation was calculated by subtracting the depth to bedrock from the surface elevation, which was derived from a digital elevation model (DEM). To generate the bedrock surface, data points were interpolated using the spline with tension method and the resulting grid then was contoured at 20-ft intervals. Based on subsequent analysis, the contours in a few areas were modified to more realistically portray the bedrock topography. All data are on file at the Geological Records Unit of the Illinois State Geological Survey.
Acknowledgments
Funding for this project was provided in part by General Revenue Funds from the State of Illinois, Central Great Lakes Geologic Mapping Coalition, a contract grant through the U.S. Geological Survey, a Joint Funding Agreement with the U.S. Geological Survey to provide updates for selected base map coverages, and grants from the Association of American State Geologists for student summer internships. The County of Lake, through their GIS and Mapping Department, supplied in kind technical support and base map coverages to develop our database and maps.
The cooperation of E.H. Glenn and Sons Inc., Blake and Sons, Beach Pump and Well, J. Huemann and Sons, Henry Boysen Company, S.O.S. Service Inc., A. and C. Snelton, Snelton and Sons, Wachholder Well Drilling and the Lake County Health Department is gratefully acknowledged. M. Barnhardt, J. Domier, A. Hansel, and A. Stumpf reviewed the map.
References
Larsen, J.I., 1973, Geology for Planning in Lake County, Illinois: Illinois State Geological Survey, Circular 481, 43 p.
Leetaru, Hannes, E., Michael L. Sargent, Mathew H. Riggs, and Dennis R. Kolata, in review, 3D Visualization of Bedrock Resources in Lake County, Illinois: Illinois State Geological Survey Open-File Map, 2 sheets.
Willman, H.B. 1973. Rock Stratigraphy of the Silurian System in Northeastern and Northwestern Illinois: Illinois State Geological Survey Circular 479, 55 p.
������������������
���
������
����
����
���
���
������
��
��
��
��
Data Type
Stratigraphic boring - to bedrock
Water well
Water well - to bedrock
Other - to bedrock
Note: Data symbol labels indicate elevation above sea level.
���
���
���
���
���
���
���
���
���
���
���
���
���
���
���
���
���
���
���
���
���
���
���
���
���
���
���
���
���
���
���
���
���
���
���
���
���
���
���
���
���
���
���
���
���
���
���
���
���
���
���
���
���
���
���
���
���
���
���
���
���
���
���
���
���
���
���
���
���
���
���
���
���
���
���
���
���
���
���
���
���
���
���
���
���
��� ��������������������������������������
�
�
�
�
�
����
�������
�
����
�������
�
������
��������
��
��
������
������������
��
��
��
����
��������
��
����
������������
����������������
������
��
��
����������
��
���������������������������������������������
��������������
���������������
�������
��������
�������
��������
������������������������
��������������������
���
���
���
��
��������������
������������������
����������������
�����������������
��������
��������
��
��
���
���
��� ���
����
���
���
���
��
��
��
��
��
���������
�������������������������������
��������
��������
������������������������
������������������������
��������
��������
��������
��������
�������
��������
�������
��������
������������������ ������������������������������������������������������������
����������������������������������
"e
"e
"e
"e
"e
"e
"e
"e
"e
"e
"e
"e
"e
"e
"e
"e
"k
"k
"k
"k
"k
"k
"k
"k
"k
"k
"k
"k
"k
"k
"k
"k
"k
"k
"k
"k
"k
"k
"k
"k
"k
"k
"k
"k
"k
"k
"k
"k
"k
"k
"k
"k
"k
"k
"k
"k
"k
"k
"k
"k
"k
"k
"k
"k
"k
"k
"k
"k
"k
"k
"k
"k
"k
"k
"k
"k
"k
"k
"k
"k
"k
"k
"k
"k
"k
"k
"k
"k
"k
"k
"k
"k
"k
"k
"k
"k"k
"k
"k
"k
"k
"k
"k
"k
"k
"k
"k
"k
"k
"k
"k
"k
"k
"k"k
"k
"k
"k
"k
"k
"k
"k
"k
"k
"k
"k
"k
"k
"k
"k
"k
"k
"k
"k
"k
"k
���
���
���
���
���
���
���
���
������
���
���
���
���
���
���
���
���
���
���
���
���
���
���
���
���
���
���
���
���
���
���
���
���
���
���
���
���
���
���
���
���
���
���
���
���
���
���
���
���
���
���
���
���
��� ���
���
���
���
���
���
���
���
���
���
���
���
���
���
���
���
���
���
���
���
���
���
���
���
���
���
���
���
���
���
���
���
���
���
���
���
���
���
���
���
���
���
���
���
���
���
���
���
���
���
���
���
���
���
���
���
���
��� ���
���
���
���
���
���
���
���
���
���
���
���
���
���
���
���
���
���
���
���
���
���
���
���
������
���
���
���
���
���
���
���
���
���
���
���
���
���
���
���
���
���
���
���
���
���
���
���
���
���
���
���
���
���
���
���
���
���
���
���
���
���
���
���
���
���
���
���
���
���
���
���
���
"e
"e
"e
"e
"e
"e
"e
"e
"e
"e
"e
"e
"e
"e
"e
"e"e
"e"e
"e
"e
"e
"e
"k
"k
"k
"k
"k
"k
"k
"k
"k
"k
"k
"k
"k"k
"k
"k
"k
"k
"k
"k"k
"k
"k
"k
"k "k
"k
"k
"k
"k
"k
"k
"k
"k
"k
"k
"k
"k
"k
"k
"k
"k
"k
"k
"k
"k
"k
"k
"k
"k
"k"k
"k
"k
"k
"k
"k
"k
"k
"k
"k
"k
"k
"k
"k
"k
"k
"k
"k"k
"k
"k
"k"k
"k"k
"k
"k
"k"k
"k
"k
"k
"k
"k"k
"k"k
"k
"k
"k
"k
"k
"k
"k
"k "k
"k
"k
"k
"k
"k
"k
"k
"k
"k
"k
"k
"k"k
"k
"k
"k
"k
"k
"k
"k
"k
"k
"k
"k
"k
"k
"k"k
"k
"k
"k "k"k
"k
"k
"k"k
"k
"k
"k "k
"k
"k
"k
"k
"k
"k
"k
"k "k "k
"k"k"k
"k
"k
"k
"k
"k
"k"k
"k
"k
"k
"k
"k
"k
"k
"k
"k
"k
"k
"k
"k"k
"k
"k
"k
"k
"k
"k
"k
"k
"k
"k
"k
"k
"k
"k
"k
"k
"k
"k
"k
Figure 1 Map showing the location of borings used to model the bedrock topography. Borings are symbolized in blue for water wells, orange for stratigraphic borings and white for ‘other’ borings.
MILES
0 1 2 3 4