Embed Size (px)
DESCRIPTION
Irrigation and Nitrogen Management Systems for Enhancing Hard Spring Wheat Protein. J. Stark, E. Souza, B. Brown, and J. Windes University of Idaho. Factors Affecting Grain Protein Concentration and Quality. Variety. Fertility. Water. Temperature ?. 906-R 1986. Grain Protein (%). - PowerPoint PPT Presentation
Citation preview
Irrigation and Nitrogen Management Irrigation and Nitrogen Management Systems for Enhancing Hard Spring Systems for Enhancing Hard Spring
Wheat ProteinWheat Protein
Irrigation and Nitrogen Management Irrigation and Nitrogen Management Systems for Enhancing Hard Spring Systems for Enhancing Hard Spring
Wheat ProteinWheat Protein
J. Stark, E. Souza, B. Brown, and J. WindesJ. Stark, E. Souza, B. Brown, and J. Windes
University of IdahoUniversity of Idaho
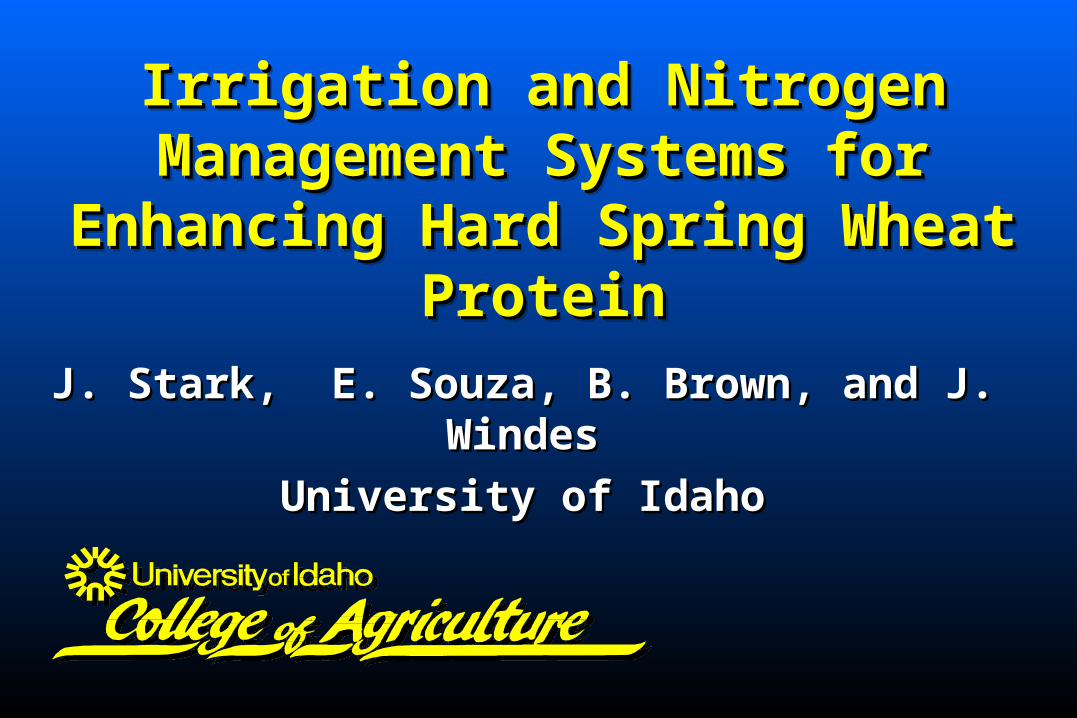
Factors Affecting Grain Protein Factors Affecting Grain Protein ConcentrationConcentration and Qualityand Quality
Factors Affecting Grain Protein Factors Affecting Grain Protein ConcentrationConcentration and Qualityand Quality
FertilityFertilityWaterWater
TemperatureTemperature??
VarietyVariety
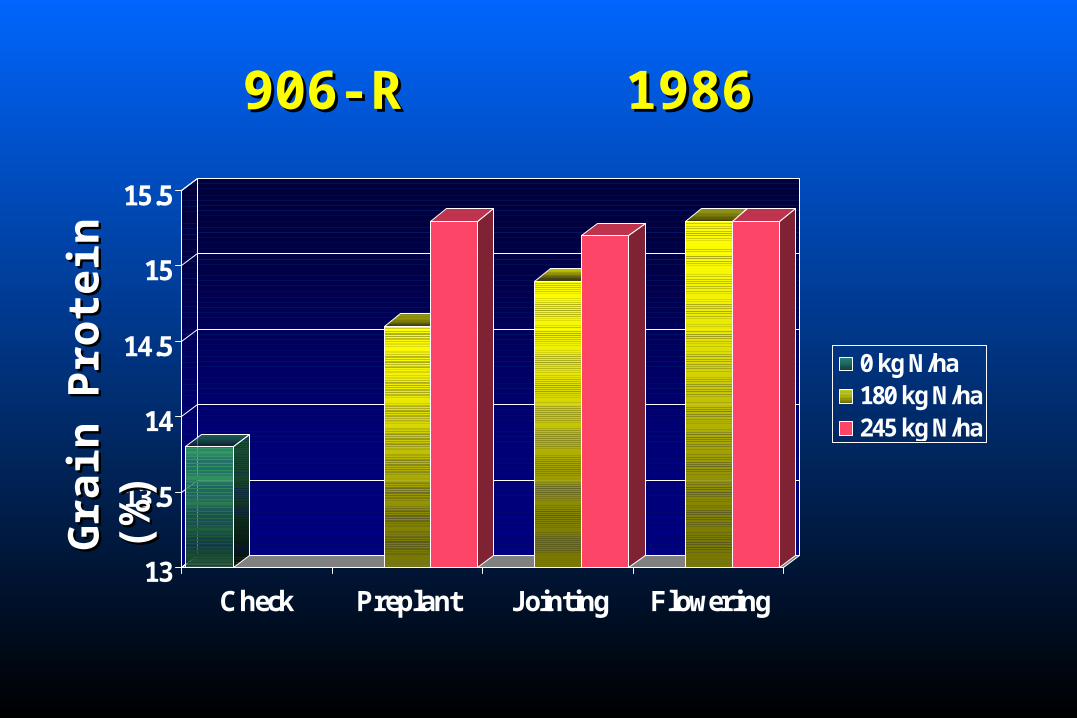
906-R 1986906-R 1986
13
13.5
14
14.5
15
15.5
Check Preplant Jointing Flowering
0 kg N/ha180 kg N/ha245 kg N/ha
Gra
in P
rote
in (
%)
Gra
in P
rote
in (
%)
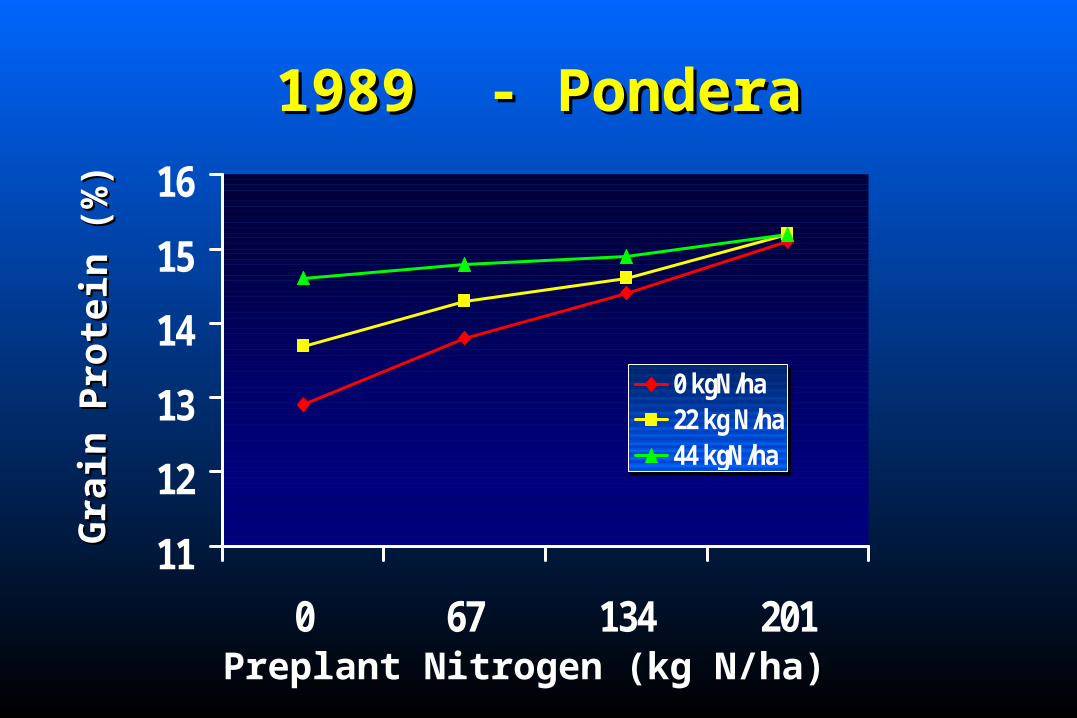
1989 - Pondera1989 - Pondera
11
12
13
14
15
16
0 67 134 201
0 kgN/ha22 kg N/ha44 kgN/ha
Gra
in P
rote
in (
%)
Gra
in P
rote
in (
%)
Preplant Nitrogen (kg N/ha)
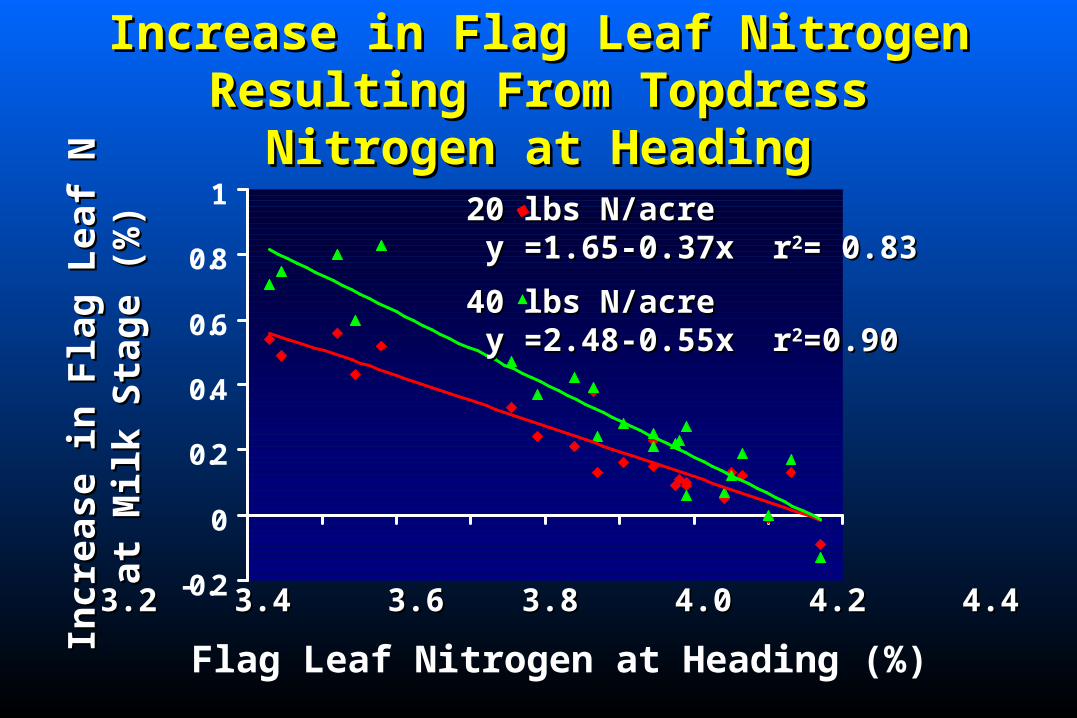
Increase in Flag Leaf Nitrogen Resulting Increase in Flag Leaf Nitrogen Resulting From Topdress Nitrogen at HeadingFrom Topdress Nitrogen at Heading
-0.2
0
0.2
0.4
0.6
0.8
1
Incr
ease
in F
lag
Lea
f N
In
crea
se in
Fla
g L
eaf
N
at M
ilk
Sta
ge (
%)
at M
ilk
Sta
ge (
%)
Flag Leaf Nitrogen at Heading (%)
3.2 3.4 3.6 3.8 4.0 4.2 4.4 4.63.2 3.4 3.6 3.8 4.0 4.2 4.4 4.6
20 lbs N/acre20 lbs N/acre y =1.65-0.37x ry =1.65-0.37x r22= 0.83= 0.83
40 lbs N/acre40 lbs N/acre y =2.48-0.55x ry =2.48-0.55x r22=0.90=0.90
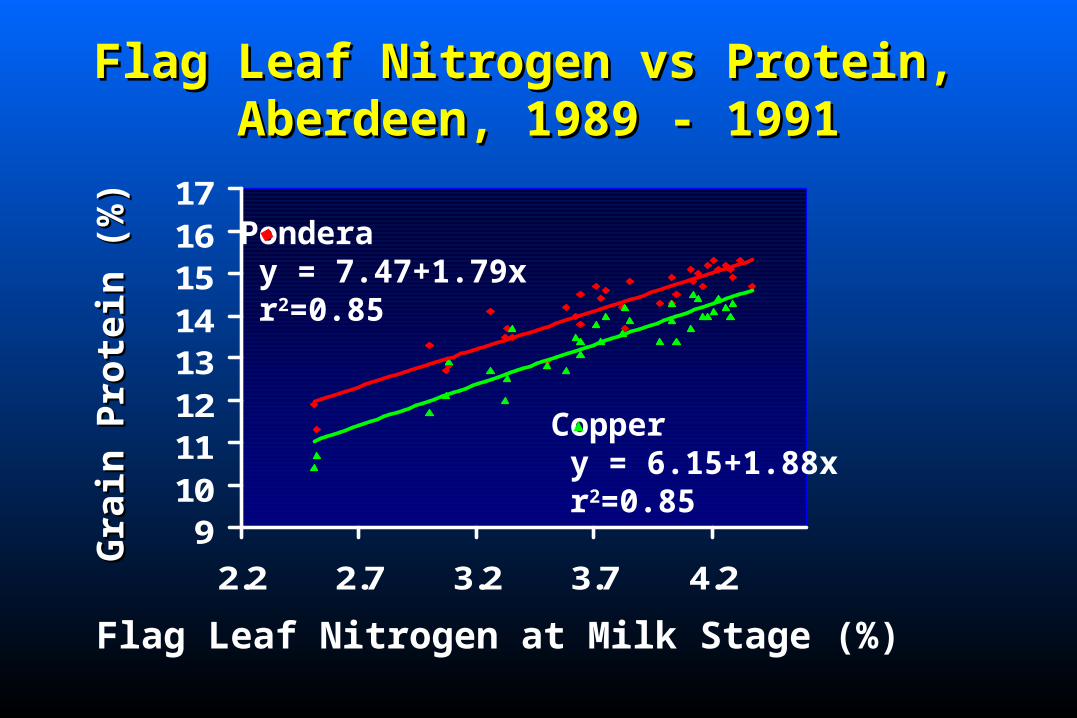
Flag Leaf Nitrogen vs Protein, Flag Leaf Nitrogen vs Protein, Aberdeen, 1989 - 1991Aberdeen, 1989 - 1991
91011121314151617
2.2 2.7 3.2 3.7 4.2
Flag Leaf Nitrogen at Milk Stage (%)
Gra
in P
rote
in (
%)
Gra
in P
rote
in (
%) Pondera
y = 7.47+1.79x r2=0.85
Copper y = 6.15+1.88x r2=0.85
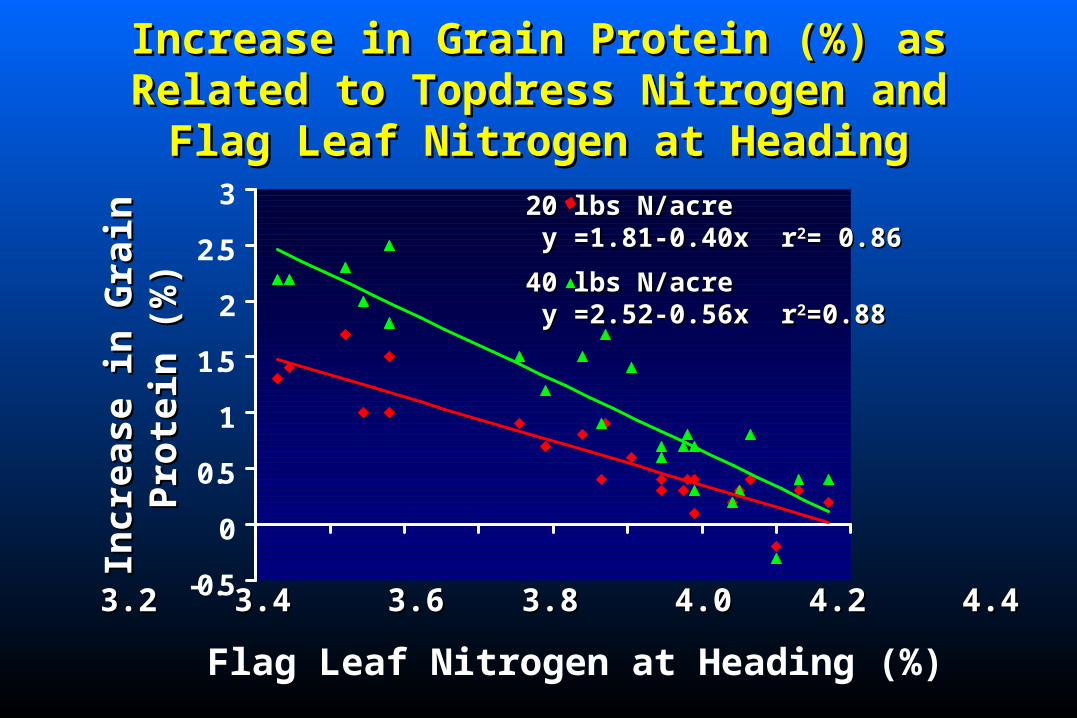
Increase in Grain Protein (%) as Related to Increase in Grain Protein (%) as Related to Topdress Nitrogen and Flag Leaf Nitrogen at Topdress Nitrogen and Flag Leaf Nitrogen at
HeadingHeading
-0.5
0
0.5
1
1.5
2
2.5
3In
crea
se in
Gra
in P
rote
in (
%)
Incr
ease
in G
rain
Pro
tein
(%
)
Flag Leaf Nitrogen at Heading (%)
20 lbs N/acre20 lbs N/acre y =1.81-0.40x ry =1.81-0.40x r22= 0.86= 0.86
40 lbs N/acre40 lbs N/acre y =2.52-0.56x ry =2.52-0.56x r22=0.88=0.88
3.2 3.4 3.6 3.8 4.0 4.2 4.4 4.63.2 3.4 3.6 3.8 4.0 4.2 4.4 4.6
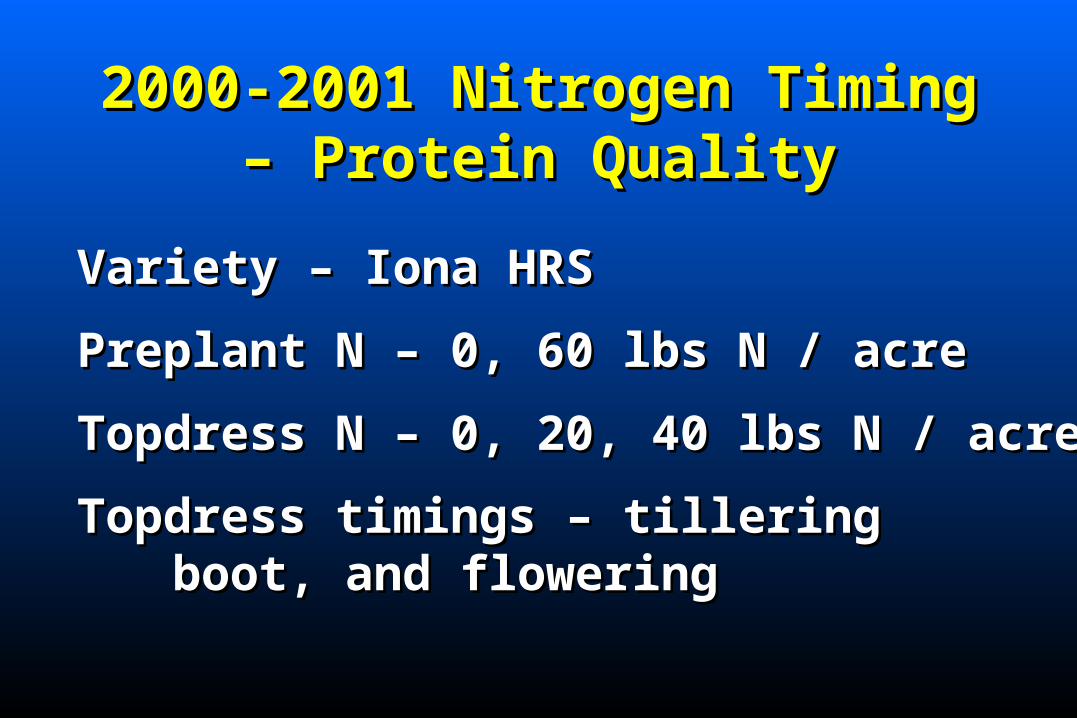
2000-2001 Nitrogen Timing – 2000-2001 Nitrogen Timing – Protein QualityProtein Quality
Variety – Iona HRSVariety – Iona HRS
Preplant N – 0, 60 lbs N / acrePreplant N – 0, 60 lbs N / acre
Topdress N – 0, 20, 40 lbs N / acreTopdress N – 0, 20, 40 lbs N / acre
Topdress timings – tilleringTopdress timings – tilleringboot, and floweringboot, and flowering
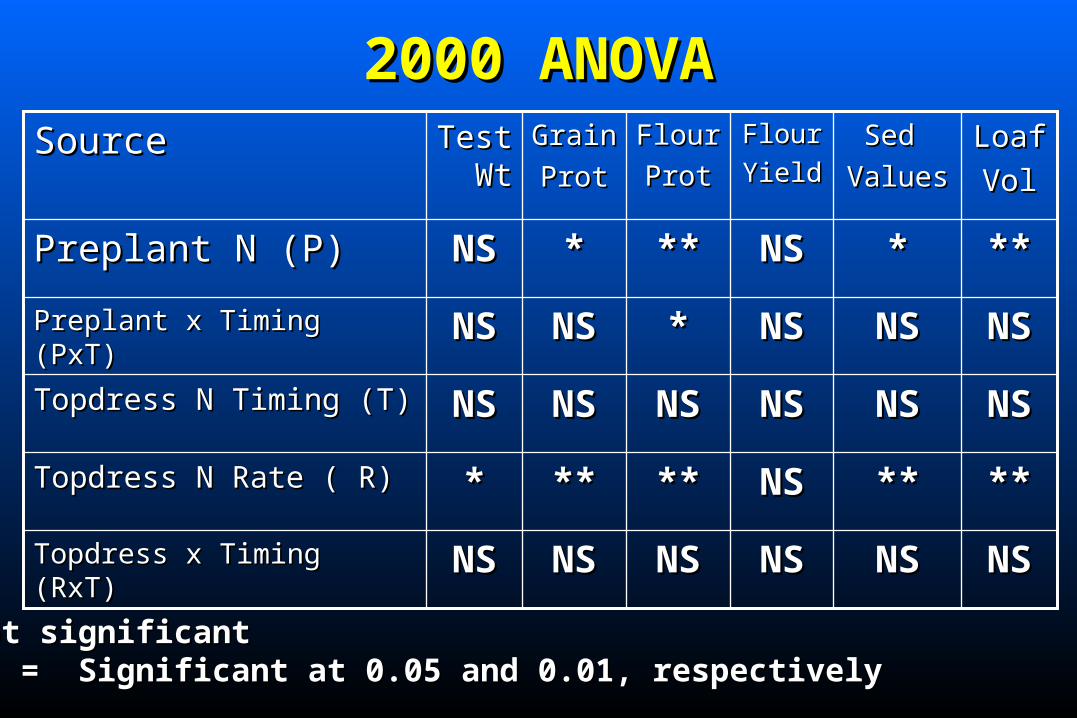
2000 ANOVA2000 ANOVA
NSNSNSNSNSNSNSNSNSNSNSNSTopdress x Timing (RxT)Topdress x Timing (RxT)
********NSNS**********Topdress N Rate ( R)Topdress N Rate ( R)
NSNSNSNSNSNSNSNSNSNSNSNSTopdress N Timing (T)Topdress N Timing (T)
NSNSNSNSNSNS**NSNSNSNSPreplant x Timing (PxT)Preplant x Timing (PxT)
******NSNS******NSNSPreplant N (P)Preplant N (P)
Loaf Loaf
VolVol
Sed Sed
ValuesValues
Flour Flour
YieldYield
Flour Flour
ProtProt
Grain Grain
ProtProt
Test Test Wt Wt
SourceSource
NS = Not significantNS = Not significant* , ** = Significant at 0.05 and 0.01, respectively* , ** = Significant at 0.05 and 0.01, respectively
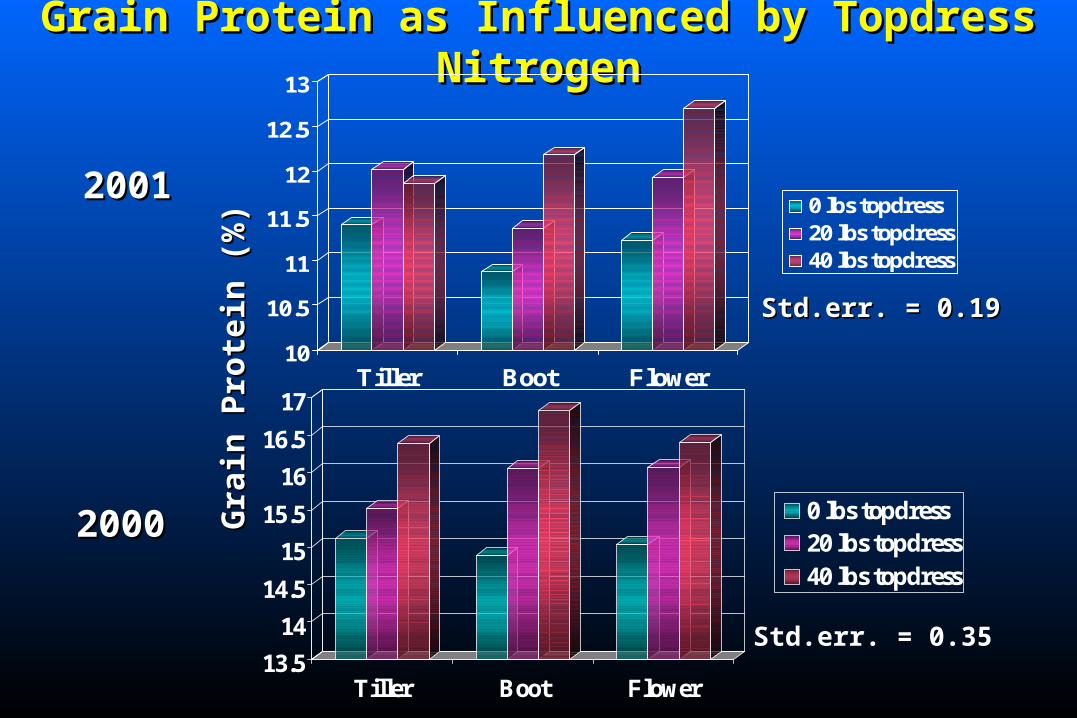
Grain Protein as Influenced by Topdress NitrogenGrain Protein as Influenced by Topdress Nitrogen
10
10.5
11
11.5
12
12.5
13
Tiller Boot Flower
0 lbs topdress20 lbs topdress40 lbs topdress
13.5
14
14.5
15
15.5
16
16.5
17
Tiller Boot Flower
0 lbs topdress20 lbs topdress40 lbs topdress
Gra
in P
rote
in (
%)
Gra
in P
rote
in (
%)
20012001
20002000
Std.err. = 0.35
Std.err. = 0.19Std.err. = 0.19
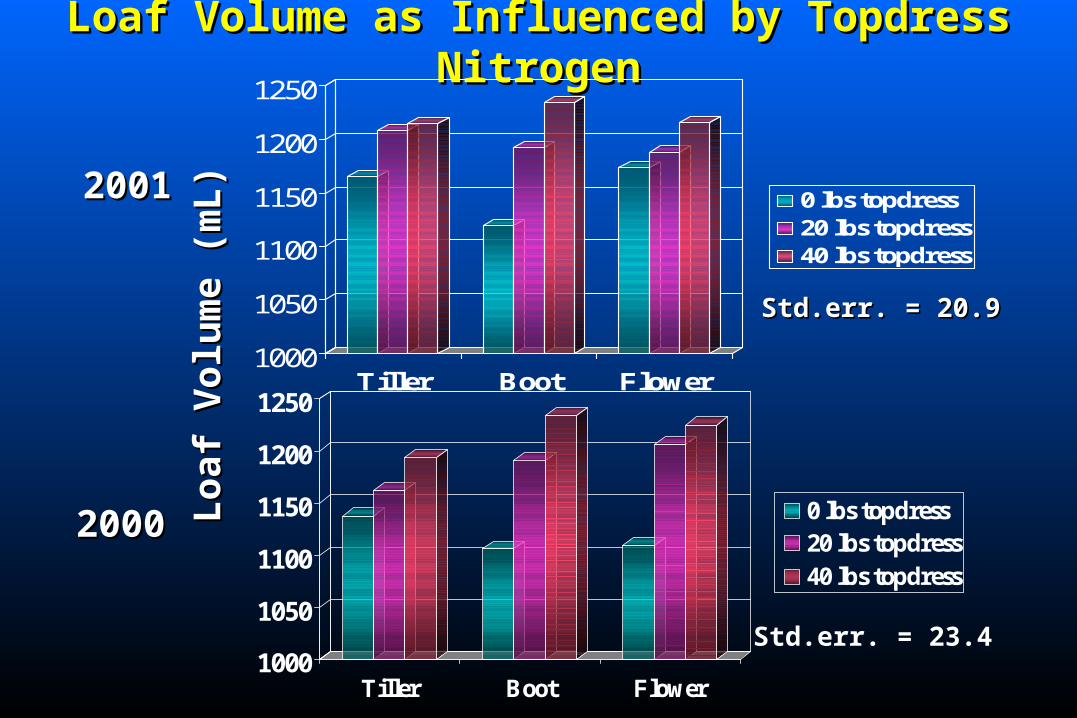
Loaf Volume as Influenced by Topdress NitrogenLoaf Volume as Influenced by Topdress Nitrogen
1000
1050
1100
1150
1200
1250
Tiller Boot Flower
0 lbs topdress20 lbs topdress40 lbs topdress
1000
1050
1100
1150
1200
1250
Tiller Boot Flower
0 lbs topdress20 lbs topdress40 lbs topdress
Loa
f V
olu
me
(mL
)L
oaf
Vol
um
e (m
L)20012001
20002000
Std.err. = 23.4
Std.err. = 20.9Std.err. = 20.9
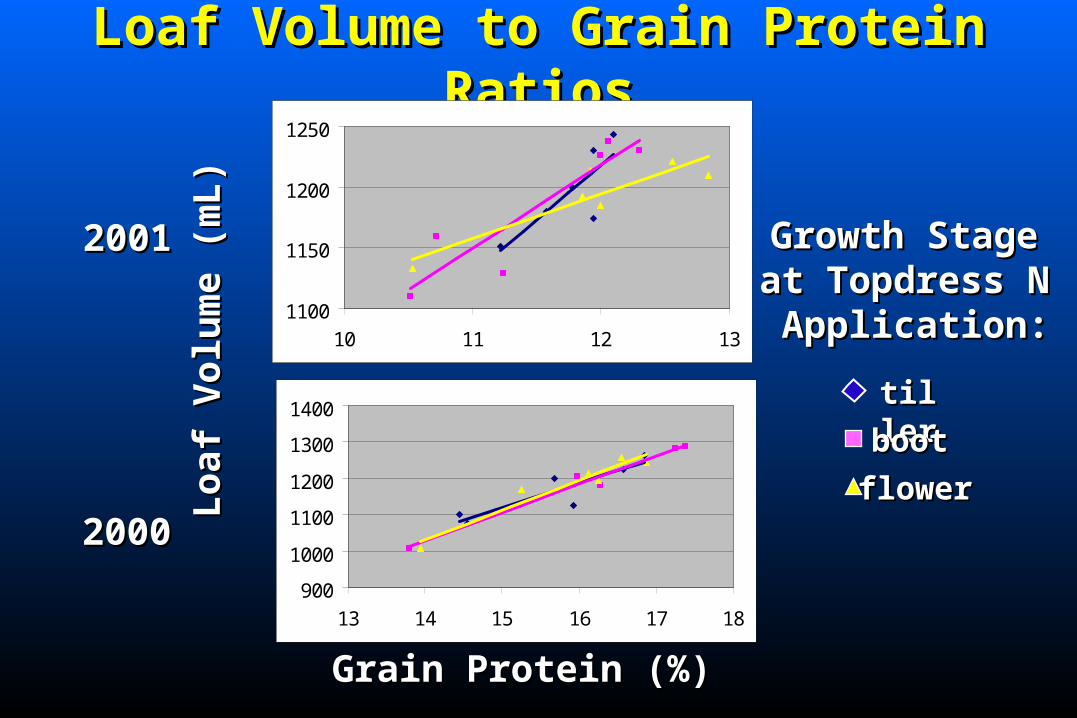
Loaf Volume to Grain Protein RatiosLoaf Volume to Grain Protein Ratios
1100
1150
1200
1250
10 11 12 13
900
1000
1100
1200
1300
1400
13 14 15 16 17 18
20012001
20002000
Loa
f V
olu
me
(mL
)L
oaf
Vol
um
e (m
L)
Grain Protein (%)Grain Protein (%)
tilletillerrbootboot
flowerflower
Growth Stage Growth Stage at Topdress N at Topdress N Application:Application:
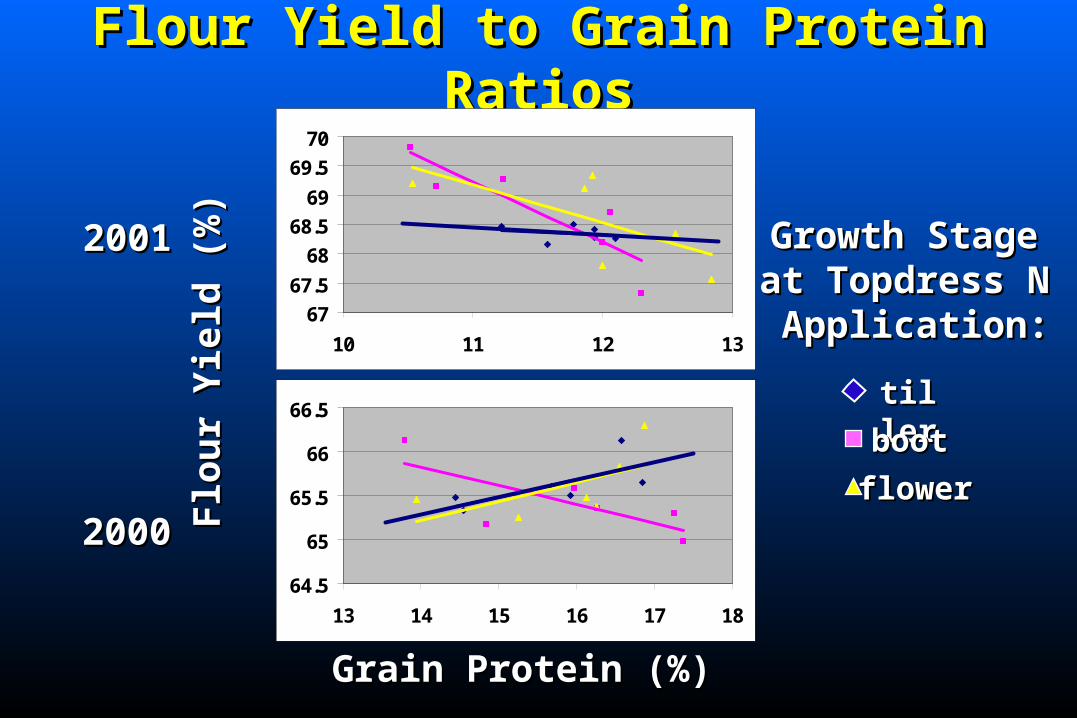
Flour Yield to Grain Protein RatiosFlour Yield to Grain Protein Ratios
20012001
20002000
Flo
ur
Yie
ld (
%)
Flo
ur
Yie
ld (
%)
Grain Protein (%)Grain Protein (%)
tilletillerrbootboot
flowerflower
Growth Stage Growth Stage at Topdress N at Topdress N Application:Application:67
67.5
68
68.5
69
69.5
70
10 11 12 13
64.5
65
65.5
66
66.5
13 14 15 16 17 18
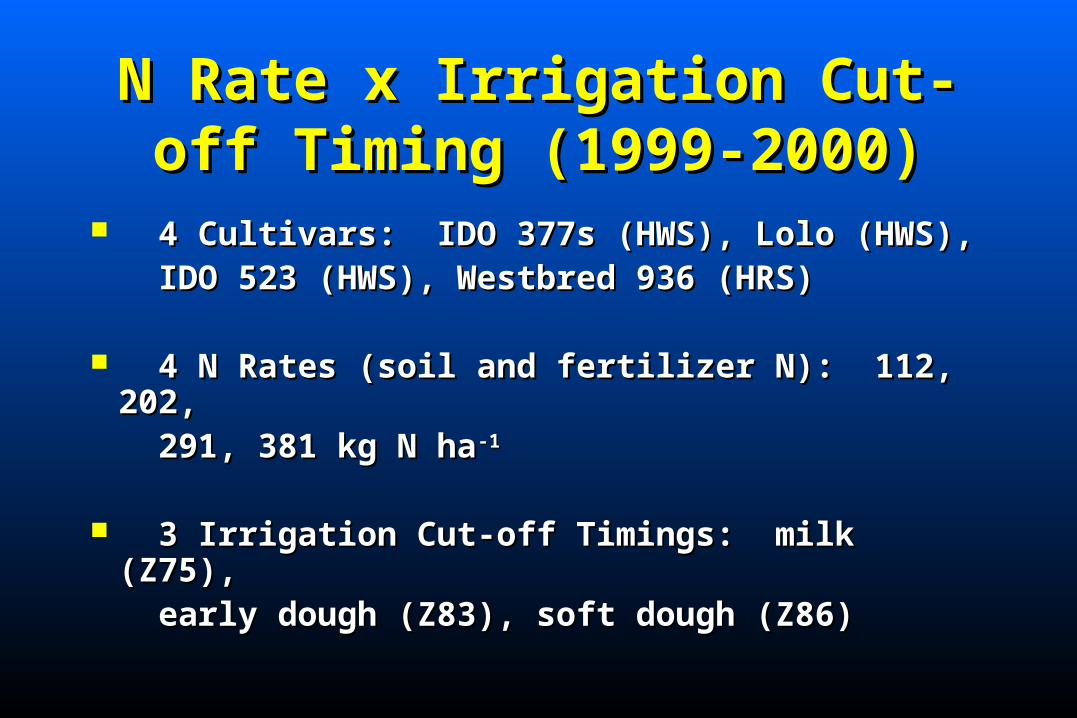
N Rate x Irrigation Cut-off Timing N Rate x Irrigation Cut-off Timing (1999-2000)(1999-2000)
4 Cultivars: IDO 377s (HWS), Lolo (HWS), 4 Cultivars: IDO 377s (HWS), Lolo (HWS), IDO 523 (HWS), Westbred 936 (HRS)IDO 523 (HWS), Westbred 936 (HRS)
4 N Rates (soil and fertilizer N): 112, 202, 4 N Rates (soil and fertilizer N): 112, 202, 291, 381 kg N ha291, 381 kg N ha-1-1
3 Irrigation Cut-off Timings: milk (Z75), 3 Irrigation Cut-off Timings: milk (Z75), early dough (Z83), soft dough (Z86)early dough (Z83), soft dough (Z86)
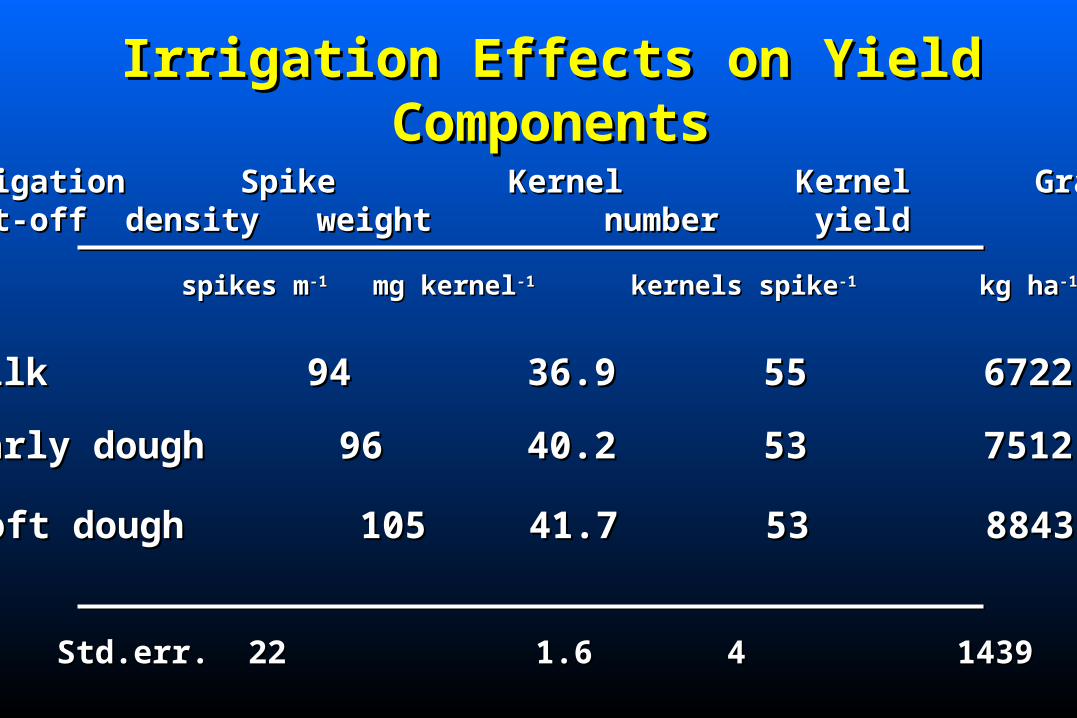
Irrigation Effects on Yield ComponentsIrrigation Effects on Yield Components
IrrigationIrrigation Spike Spike KernelKernel KernelKernel GrainGrain cut-offcut-off densitydensity weightweight numbernumber yield yield
spikes mspikes m-1-1 mg kernelmg kernel-1-1 kernels spike kernels spike-1-1 kg ha kg ha-1-1
MilkMilk 94 94 36.9 36.9 55 55 6722 6722
Soft dough Soft dough 105 105 41.7 41.7 53 53 8843 8843
Early dough 96Early dough 96 40.2 40.2 53 53 7512 7512
Std.err.Std.err. 2222 1.6 1.6 44 1439 1439
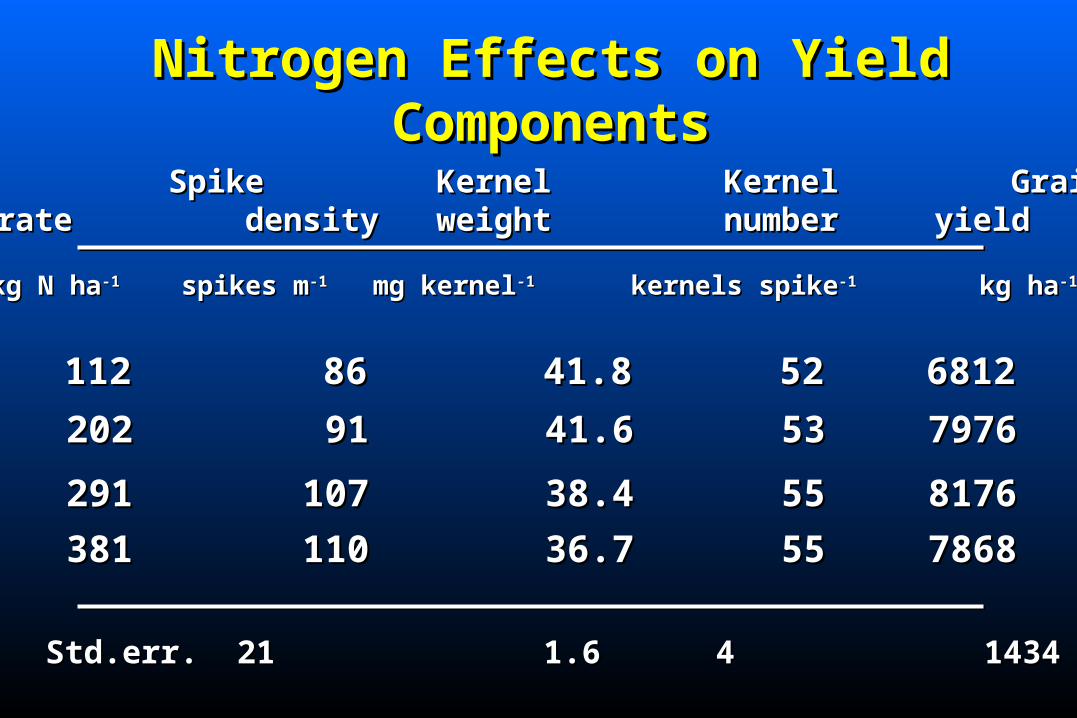
Nitrogen Effects on Yield ComponentsNitrogen Effects on Yield Components
SpikeSpike KernelKernel KernelKernel GrainGrainN rateN rate densitydensity weightweight numbernumber yield yield
kg N hakg N ha-1-1 spikes mspikes m-1-1 mg kernelmg kernel-1-1 kernels spike kernels spike-1-1 kg ha kg ha-1-1
112112 86 86 41.841.8 52 52 68126812
381381 110 110 36.736.7 55 55 78687868
291291 107 107 38.438.4 55 55 81768176
202202 91 91 41.641.6 53 53 79767976
Std.err.Std.err. 2121 1.6 1.6 44 1434 1434
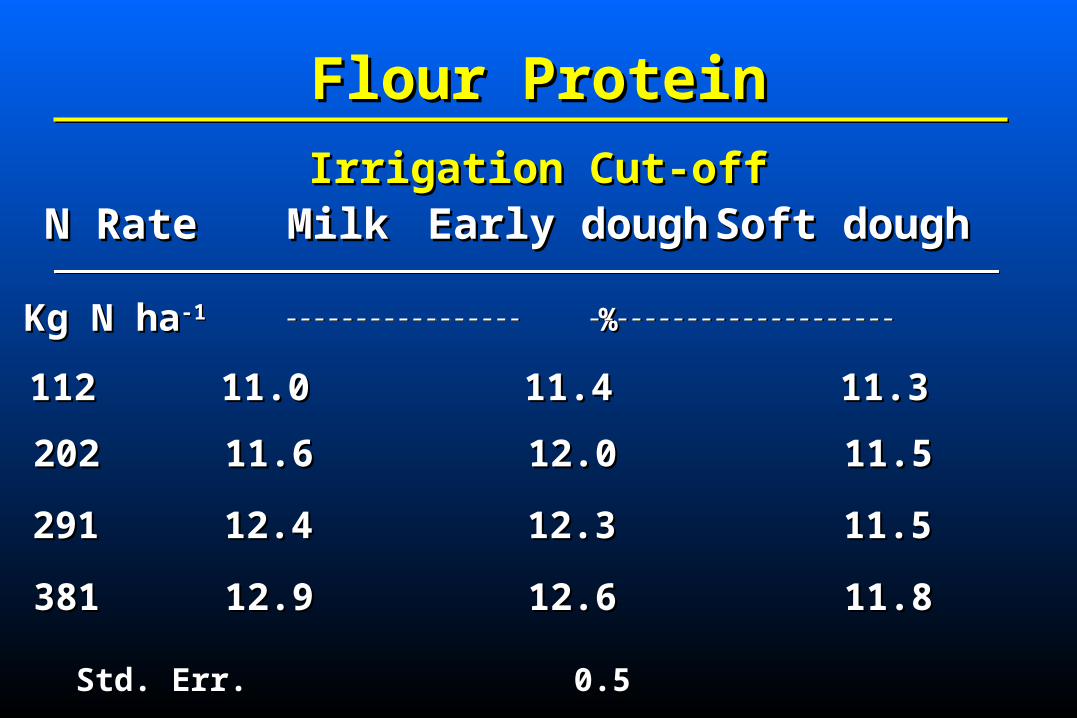
Flour ProteinFlour Protein
Irrigation Cut-offIrrigation Cut-offN RateN Rate Milk Milk Early doughEarly dough Soft doughSoft dough
Kg N haKg N ha-1-1 % %
112112 11.011.0 11.4 11.4 11.3 11.3
202202 11.611.6 12.0 12.0 11.5 11.5
291291 12.412.4 12.3 12.3 11.5 11.5
381381 12.912.9 12.6 12.6 11.8 11.8
Std. Err.Std. Err. 0.5 0.5
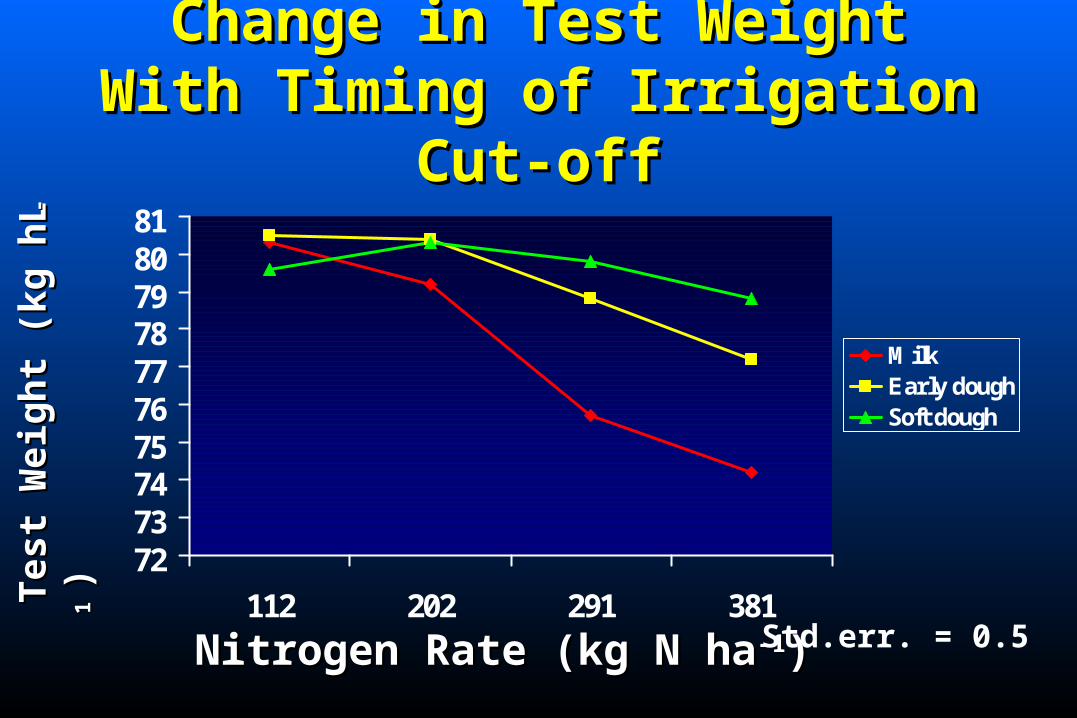
Change in Test Weight With Change in Test Weight With Timing of Irrigation Cut-offTiming of Irrigation Cut-off
72737475767778798081
112 202 291 381
MilkEarly doughSoft dough
Nitrogen Rate (kg N haNitrogen Rate (kg N ha-1-1))
Tes
t W
eigh
t (k
g h
LT
est
Wei
ght
(kg
hL --
11))
Std.err. = 0.5
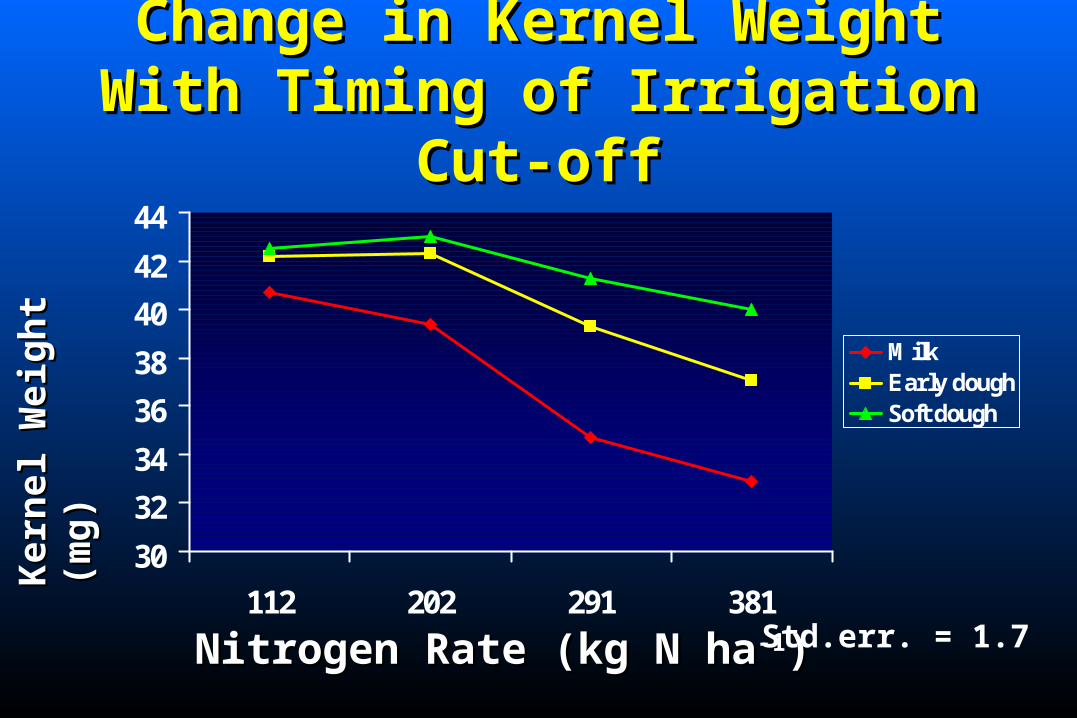
Change in Kernel Weight With Change in Kernel Weight With Timing of Irrigation Cut-offTiming of Irrigation Cut-off
30
32
34
36
38
40
42
44
112 202 291 381
MilkEarly doughSoft dough
Nitrogen Rate (kg N haNitrogen Rate (kg N ha-1-1))
Ker
nel
Wei
ght
Ker
nel
Wei
ght
(mg)
(mg)
Std.err. = 1.7
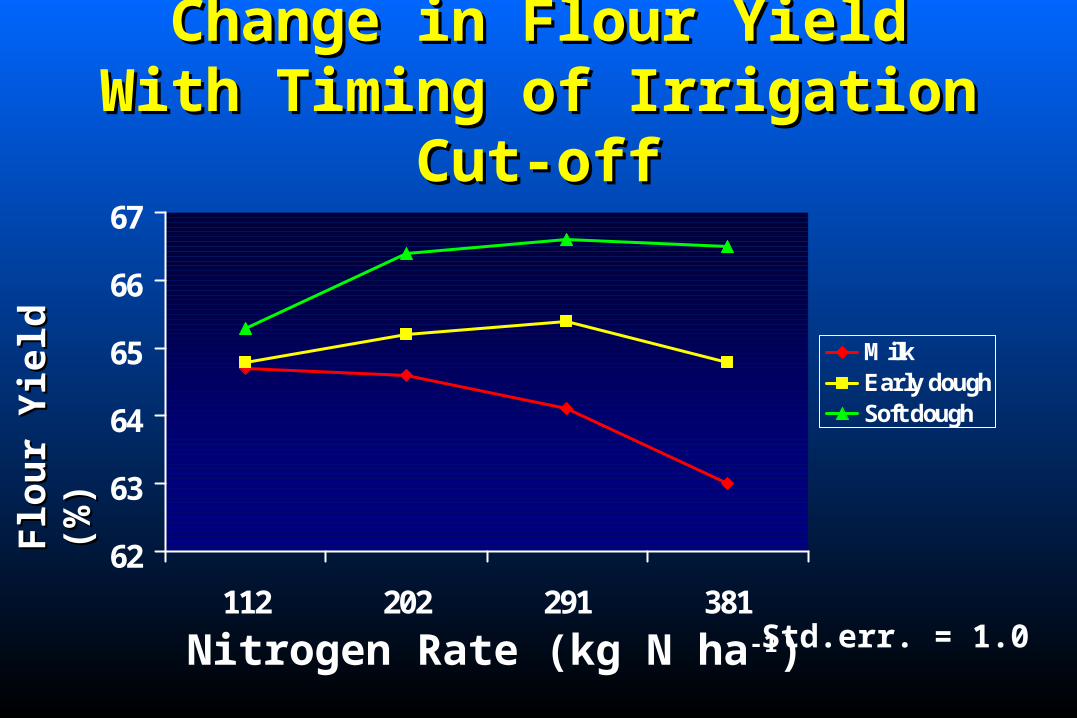
Change in Flour Yield With Change in Flour Yield With Timing of Irrigation Cut-offTiming of Irrigation Cut-off
62
63
64
65
66
67
112 202 291 381
MilkEarly doughSoft dough
Flo
ur
Yie
ld
Flo
ur
Yie
ld
(%)
(%)
Nitrogen Rate (kg N ha-1) Std.err. = 1.0
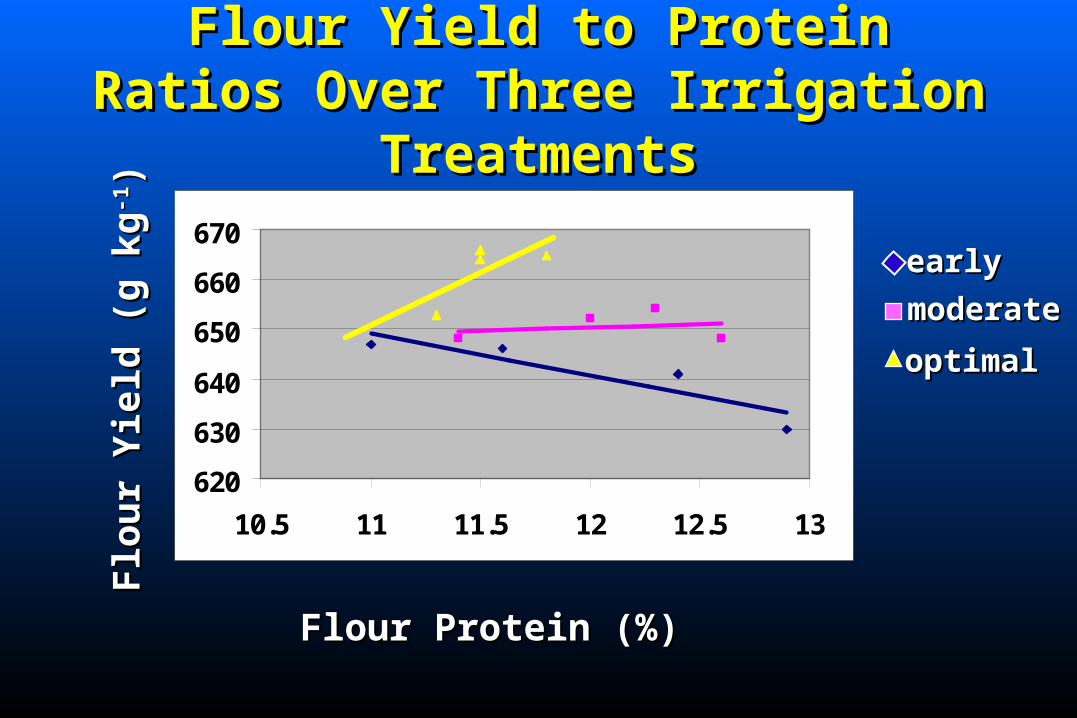
Flour Yield to Protein Ratios Over Flour Yield to Protein Ratios Over Three Irrigation TreatmentsThree Irrigation Treatments
Flo
ur
Yie
ld (
g k
gF
lou
r Y
ield
(g
kg-1-1
))
Flour Protein (%)Flour Protein (%)
620
630
640
650
660
670
10.5 11 11.5 12 12.5 13
earlyearly
moderatemoderate
optimaloptimal
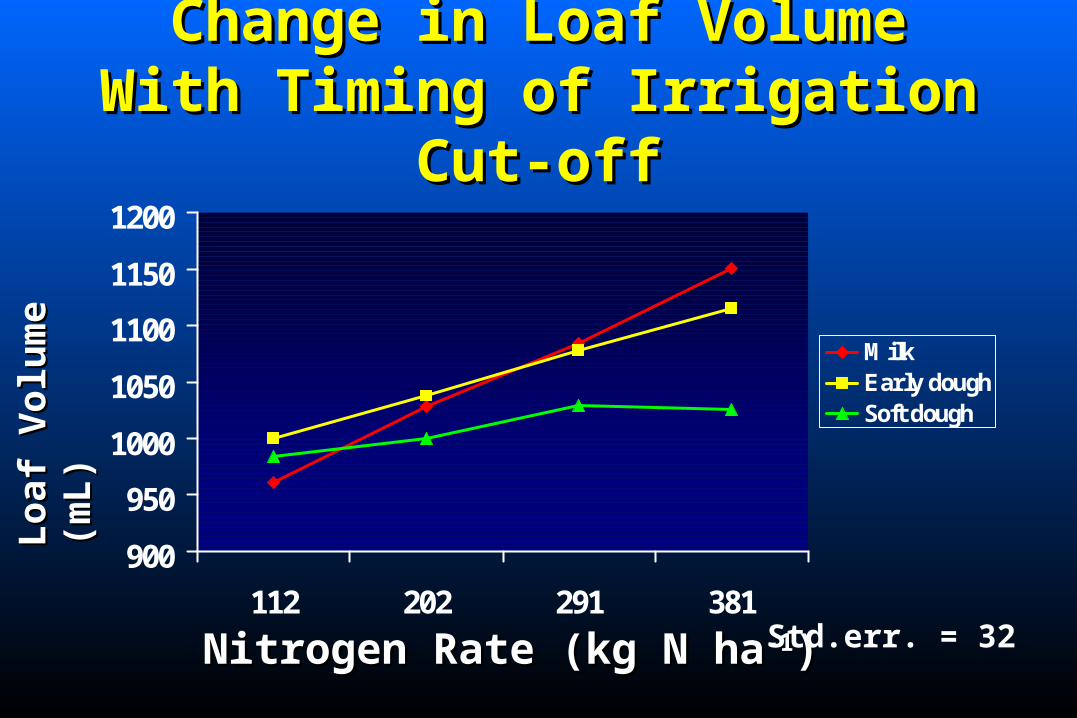
Change in Loaf Volume With Change in Loaf Volume With Timing of Irrigation Cut-offTiming of Irrigation Cut-off
900
950
1000
1050
1100
1150
1200
112 202 291 381
MilkEarly doughSoft dough
Nitrogen Rate (kg N haNitrogen Rate (kg N ha-1-1))
Loa
f V
olu
me
Loa
f V
olu
me
(mL
)(m
L)
Std.err. = 32
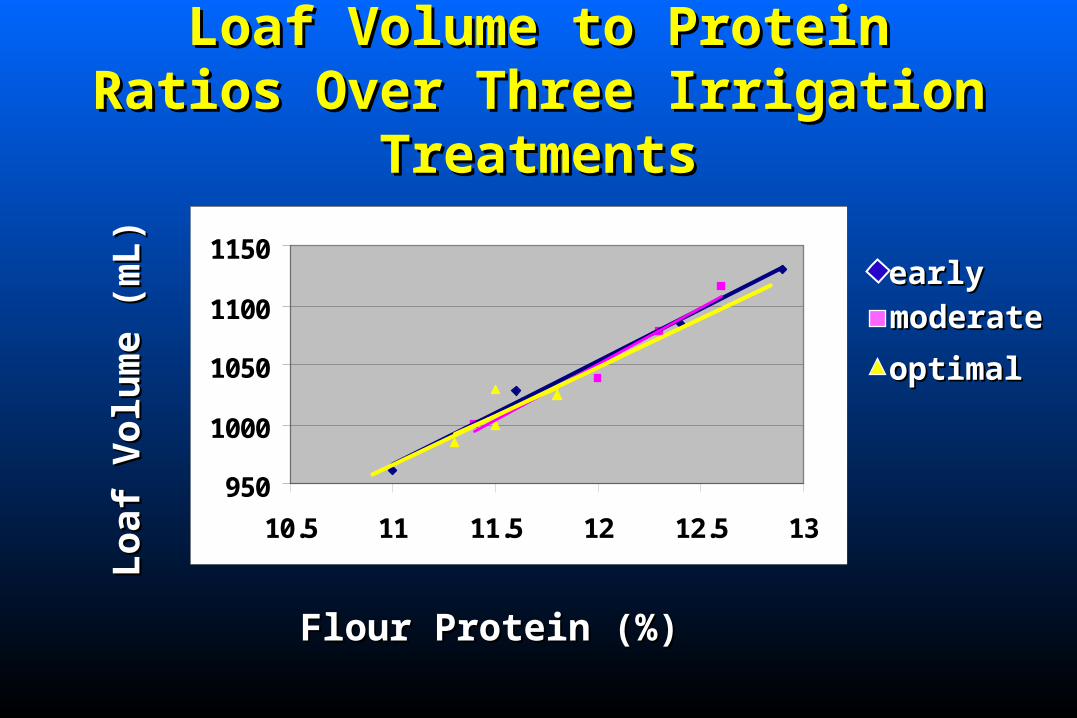
Loaf Volume to Protein Ratios Over Loaf Volume to Protein Ratios Over Three Irrigation TreatmentsThree Irrigation Treatments
Loa
f V
olu
me
(mL
)L
oaf
Vol
um
e (m
L)
Flour Protein (%)Flour Protein (%)
950
1000
1050
1100
1150
10.5 11 11.5 12 12.5 13
earlyearly
moderatemoderate
optimaloptimal
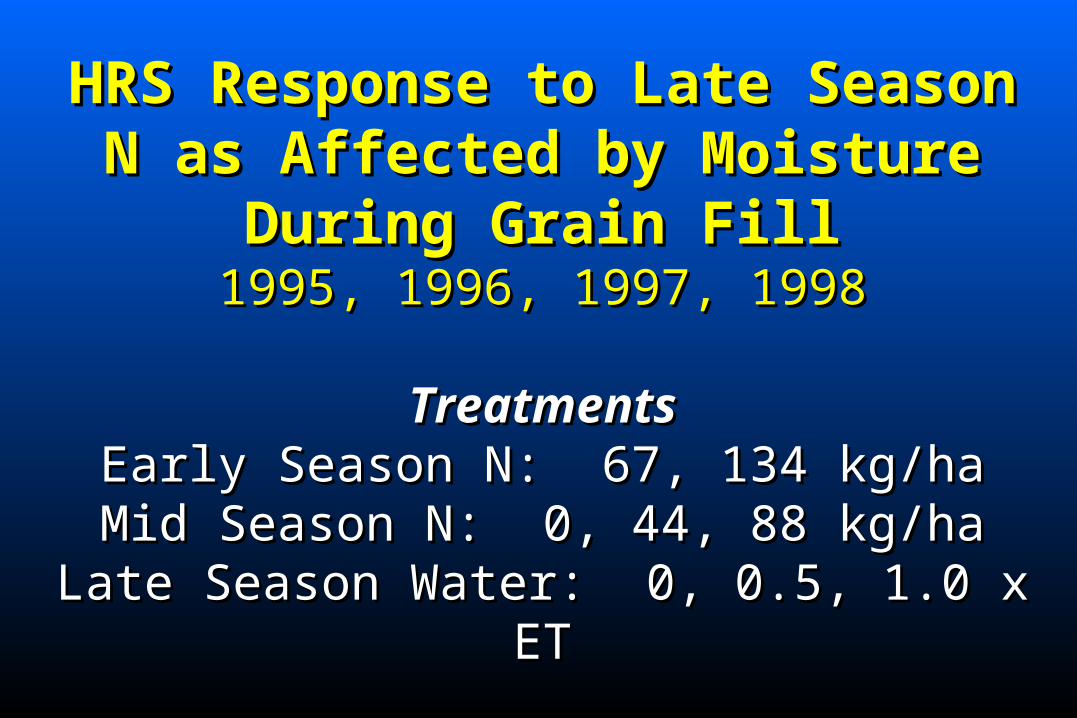
HRS Response to Late Season N as HRS Response to Late Season N as Affected by Moisture During Grain FillAffected by Moisture During Grain Fill
1995, 1996, 1997, 19981995, 1996, 1997, 1998
TreatmentsTreatmentsEarly Season N: 67, 134 kg/haEarly Season N: 67, 134 kg/haMid Season N: 0, 44, 88 kg/haMid Season N: 0, 44, 88 kg/ha
Late Season Water: 0, 0.5, 1.0 x ETLate Season Water: 0, 0.5, 1.0 x ET
RCB - Four ReplicationsRCB - Four Replications
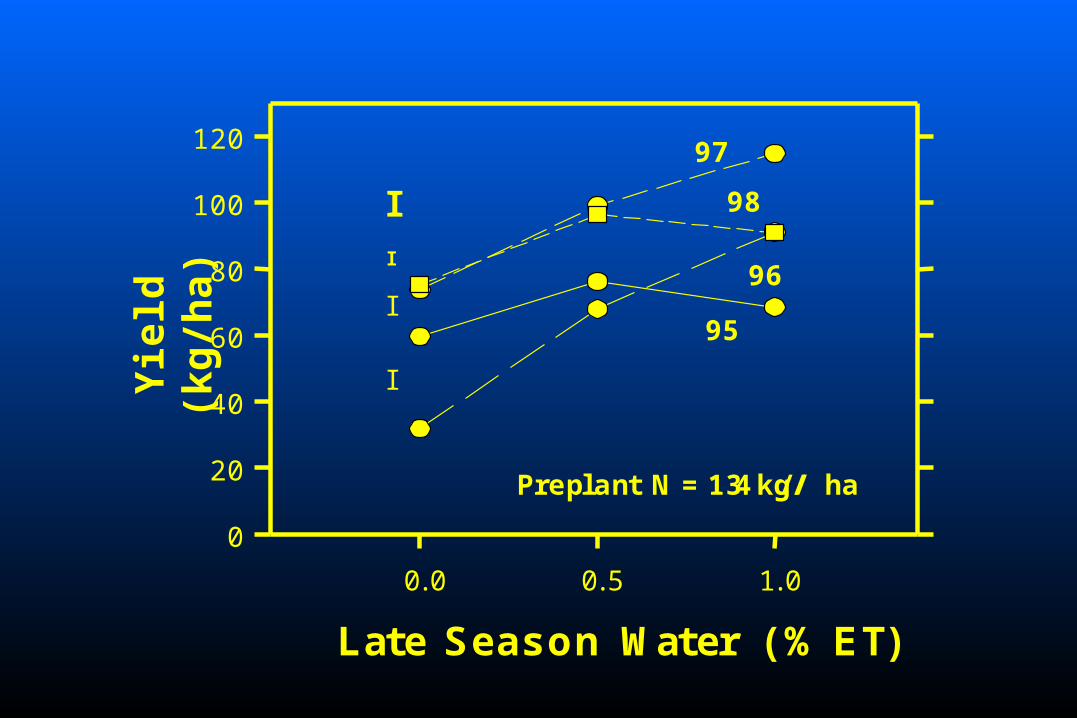
Late Season Water (% ET)
0.0 0.5 1.0
Yie
ld (
kg/h
a)
0
20
40
60
80
100
120
95
97
96
98
Preplant N = 134 kg/ / / ha
I
I
I
I
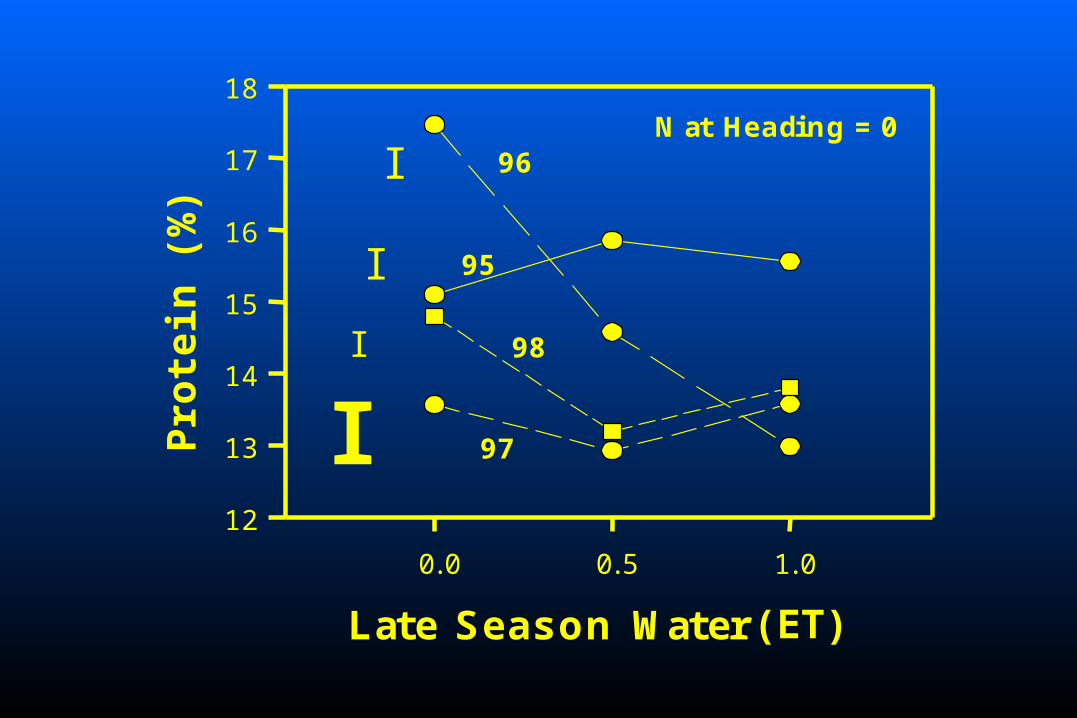
Late Season Water (ET)
0.0 0.5 1.0
Pro
tein
(%
)
12
13
14
15
16
17
18N at Heading = 0
I
I
I
95
97
96
98I
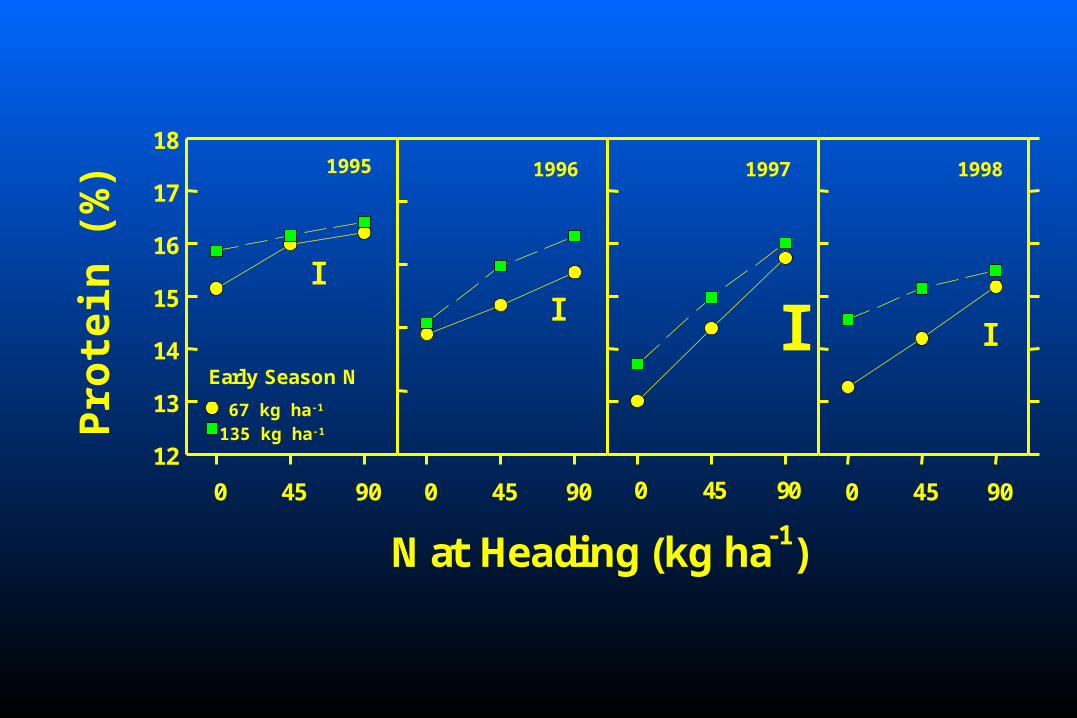
0 45 90
Pro
tein
(%
)
12
13
14
15
16
17
18
N at Heading (kg ha-1)
0 45 90 0 45 900 45 90
II I I
Early Season N
67 kg ha-1
135 kg ha-1
1995 1996 1997 1998
0 45 90
Pro
tein
(%
)
12
13
14
15
16
17
18
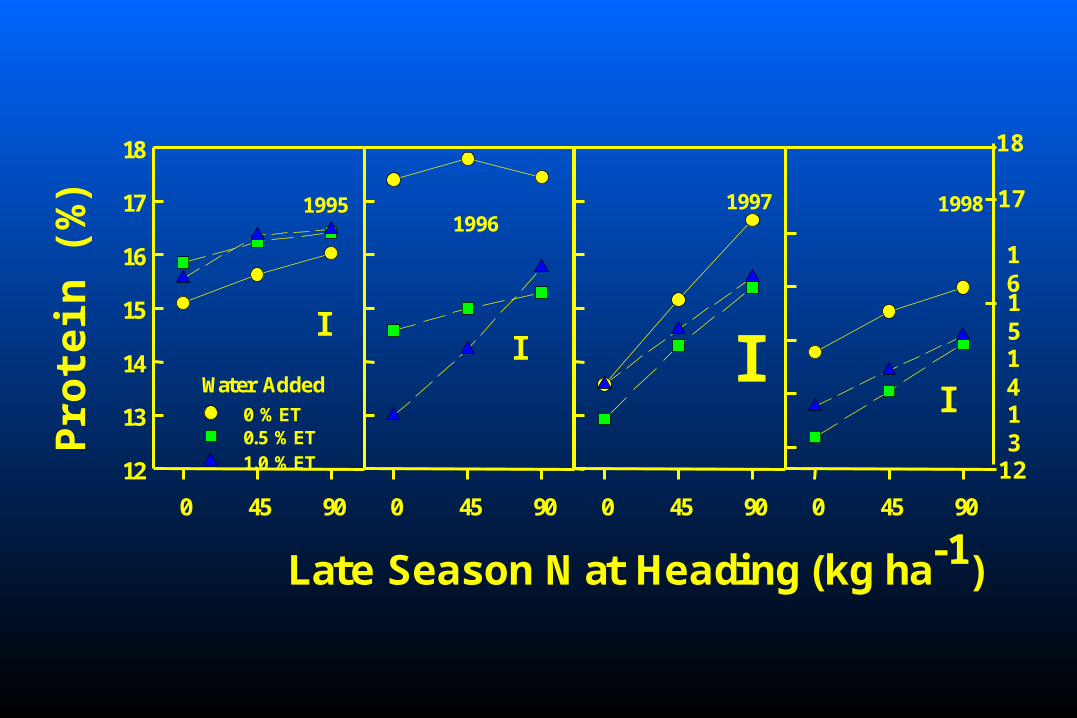
Late Season N at Heading (kg ha-1)
0 45 90 0 45 90
I I
0 45 90
12
13
14
15
16
17
18
I
I
Water Added 0 % ET0.5 % ET1.0 % ET
19951996
1997 1998
0 45 90
Bak
e Vo
lum
e (c
m3)
900
1000
1100
1200
1300
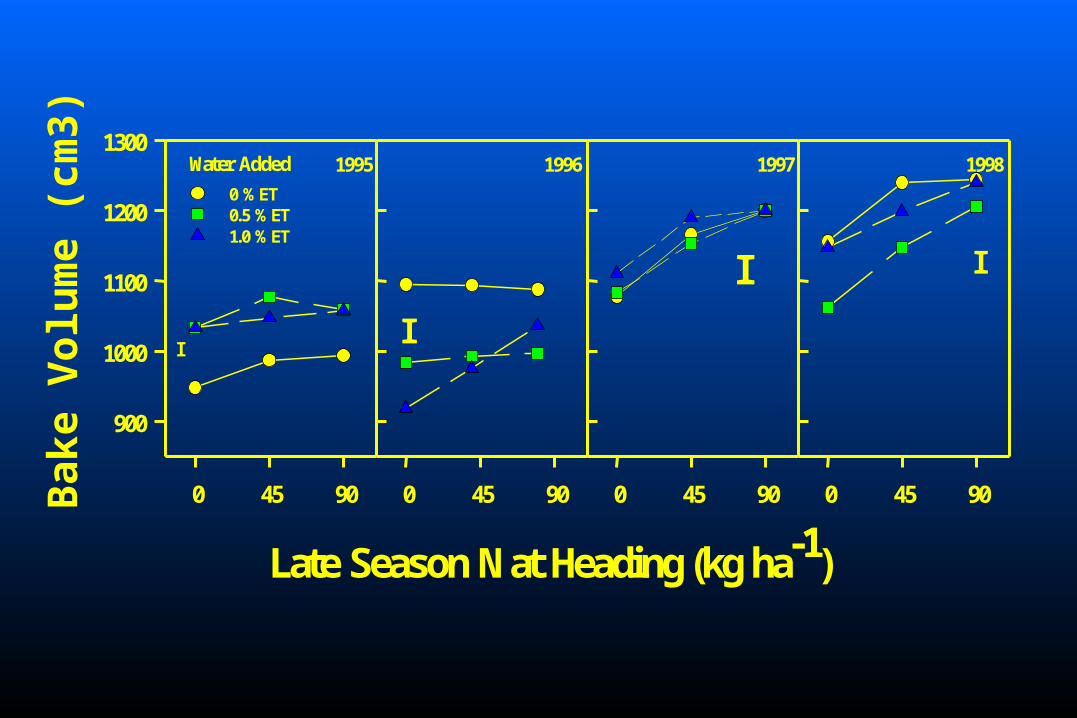
Late Season N at Heading (kg ha-1)
0 45 90 0 45 90
II
I
Water Added
0 % ET0.5 % ET1.0 % ET
0 45 90
I
1995 1996 1997 1998
60
65
70
75
80
85
90
95
100
0 45 90
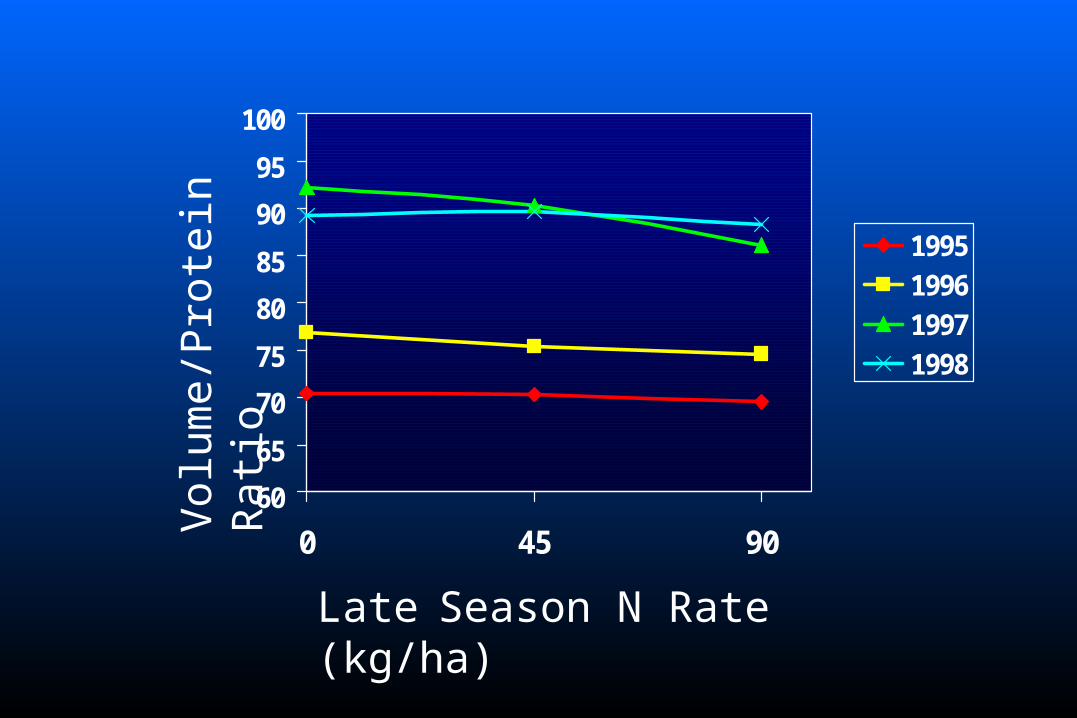
1995199619971998
Late Season N Rate (kg/ha)
Vol
ume/
Pro
tein
Rat
io
60
65
70
75
80
85
90
95
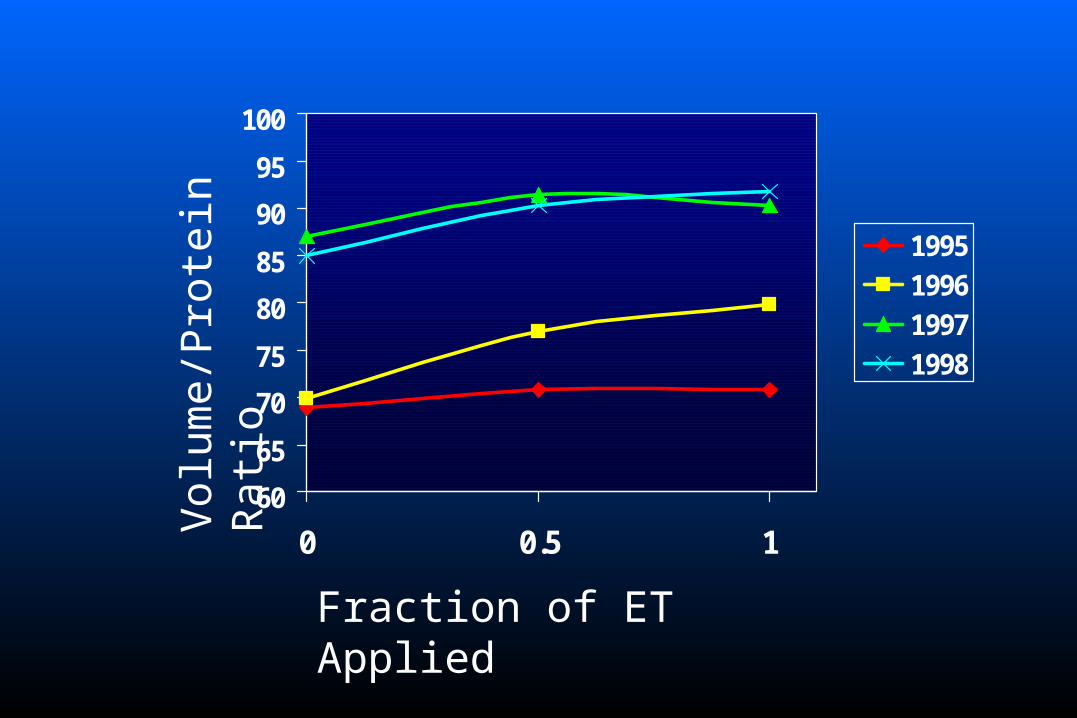
100
0 0.5 1
1995199619971998
Fraction of ET Applied
Vol
ume/
Pro
tein
Rat
io
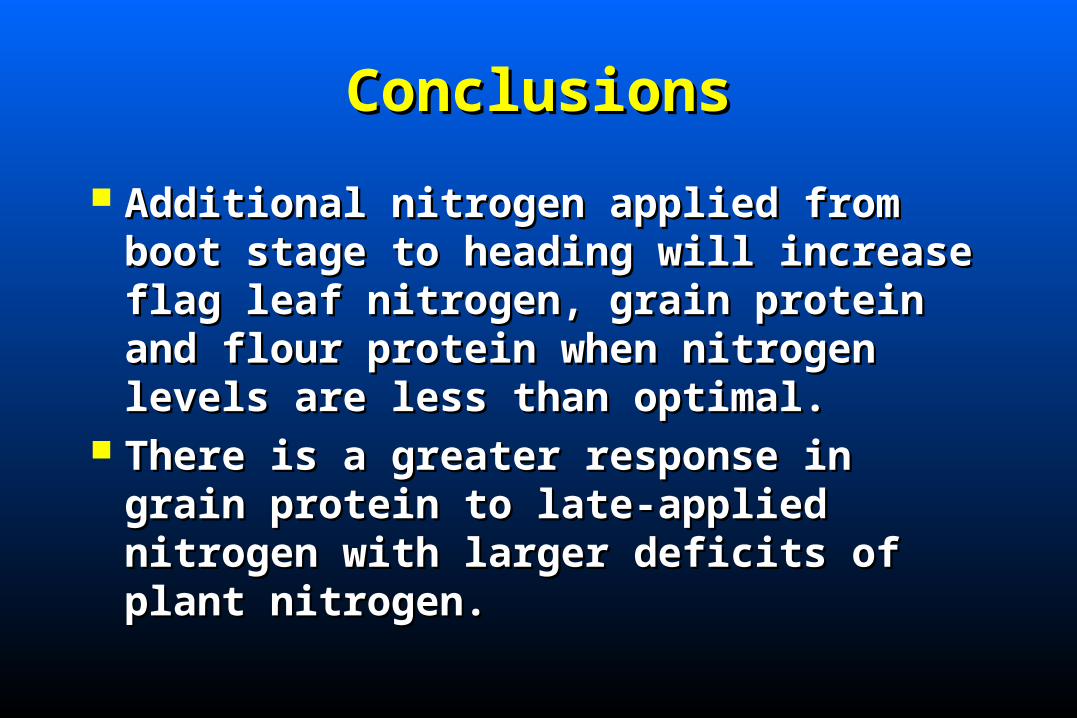
ConclusionsConclusions
Additional nitrogen applied from boot stage to Additional nitrogen applied from boot stage to heading will increase flag leaf nitrogen, grain heading will increase flag leaf nitrogen, grain protein and flour protein when nitrogen levels protein and flour protein when nitrogen levels are less than optimal.are less than optimal.
There is a greater response in grain protein to There is a greater response in grain protein to late-applied nitrogen with larger deficits of late-applied nitrogen with larger deficits of plant nitrogen.plant nitrogen.
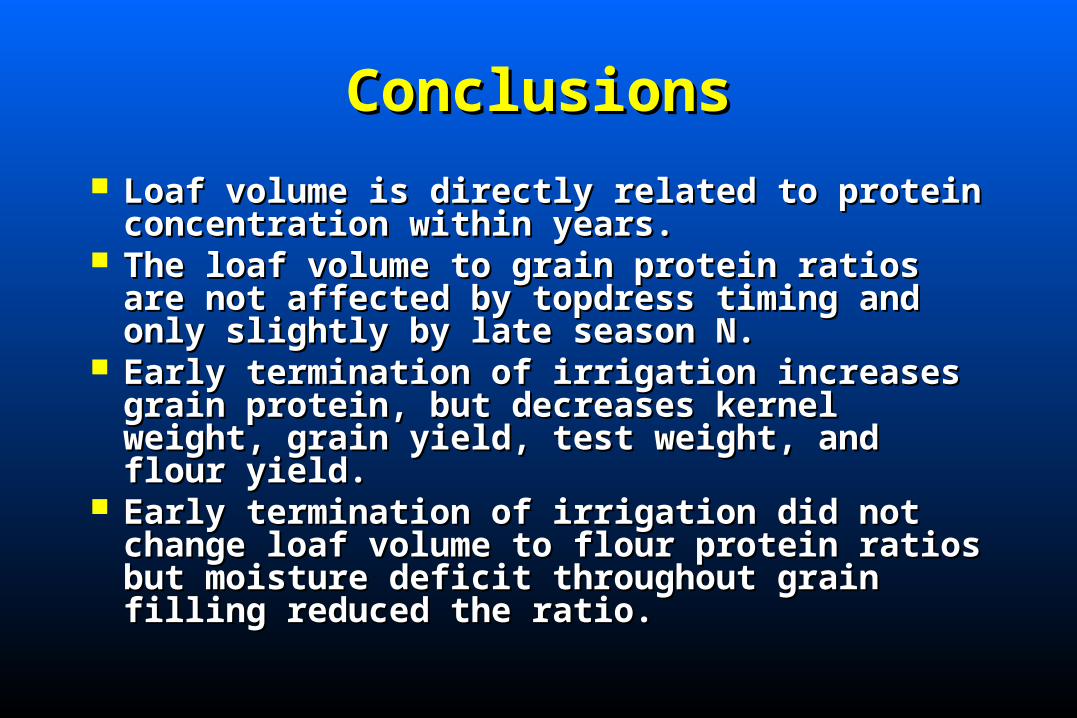
ConclusionsConclusions
Loaf volume is directly related to protein Loaf volume is directly related to protein concentration within years.concentration within years.
The loaf volume to grain protein ratios are not The loaf volume to grain protein ratios are not affected by topdress timing and only slightly by late affected by topdress timing and only slightly by late season N.season N.
Early termination of irrigation increases grain Early termination of irrigation increases grain protein, but decreases kernel weight, grain yield, test protein, but decreases kernel weight, grain yield, test weight, and flour yield.weight, and flour yield.
Early termination of irrigation did not change loaf Early termination of irrigation did not change loaf volume to flour protein ratios but moisture deficit volume to flour protein ratios but moisture deficit throughout grain filling reduced the ratio.throughout grain filling reduced the ratio.
ConclusionConclusion
Inducing late season moisture stress to enhance Inducing late season moisture stress to enhance protein concentration or quality is a poor strategy.protein concentration or quality is a poor strategy.
Late season N enhanced protein concentration and Late season N enhanced protein concentration and protein increases were associated with improved protein increases were associated with improved baking quality.baking quality.