Embed Size (px)
Citation preview
IRS Oversight Board2014 Taxpayer Attitude SurveyDECEMBER 2014
1
Table of Contents
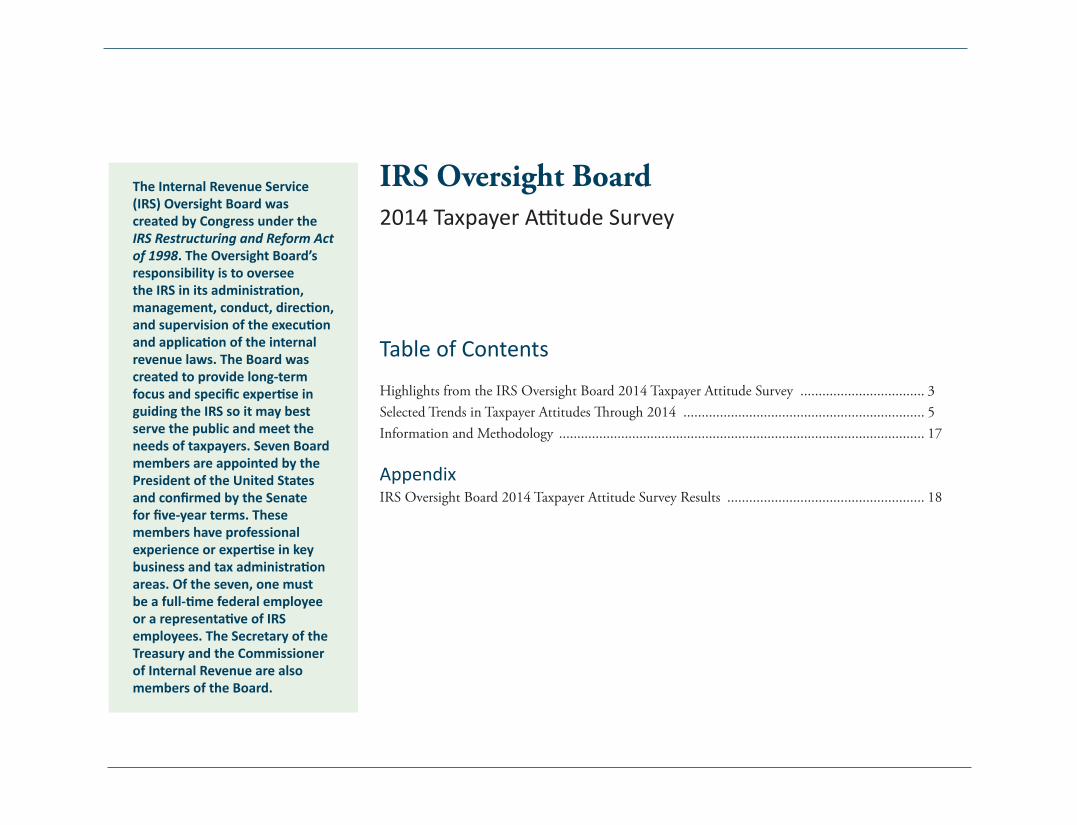
Highlights from the IRS Oversight Board 2014 Taxpayer Attitude Survey .................................. 3Selected Trends in Taxpayer Attitudes Through 2014 .................................................................. 5 Information and Methodology .................................................................................................... 17
AppendixIRS Oversight Board 2014 Taxpayer Attitude Survey Results ...................................................... 18
2014 Taxpayer Attitude Survey
IRS Oversight Board The Internal Revenue Service (IRS) Oversight Board was created by Congress under the IRS Restructuring and Reform Act of 1998. The Oversight Board’s responsibility is to oversee the IRS in its administration, management, conduct, direction, and supervision of the execution and application of the internal revenue laws. The Board was created to provide long-term focus and specific expertise in guiding the IRS so it may best serve the public and meet the needs of taxpayers. Seven Board members are appointed by the President of the United States and confirmed by the Senate for five-year terms. These members have professional experience or expertise in key business and tax administration areas. Of the seven, one must be a full-time federal employee or a representative of IRS employees. The Secretary of the Treasury and the Commissioner of Internal Revenue are also members of the Board.

3
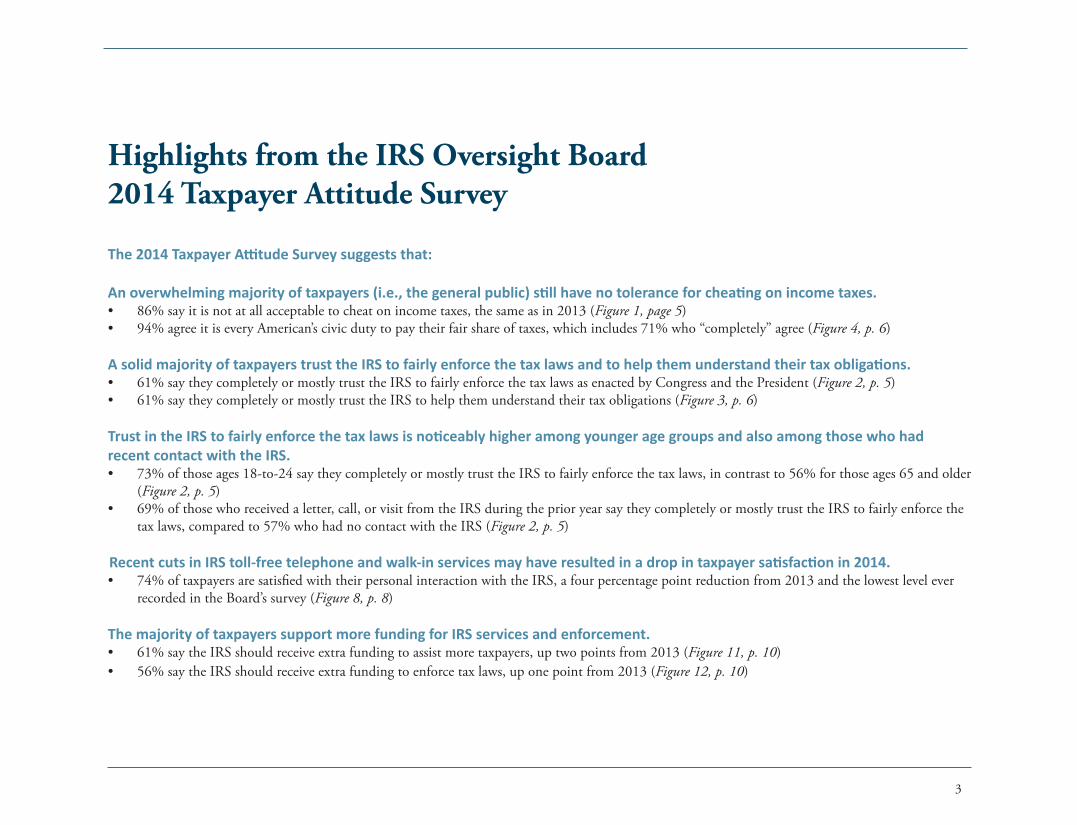
Highlights from the IRS Oversight Board 2014 Taxpayer Attitude Survey
The 2014 Taxpayer Attitude Survey suggests that:
An overwhelming majority of taxpayers (i.e., the general public) still have no tolerance for cheating on income taxes. • 86%sayitisnotatallacceptabletocheatonincometaxes,thesameasin2013(Figure 1, page 5)• 94%agreeitiseveryAmerican’scivicdutytopaytheirfairshareoftaxes,whichincludes71%who“completely”agree(Figure 4, p. 6)
A solid majority of taxpayers trust the IRS to fairly enforce the tax laws and to help them understand their tax obligations. • 61%saytheycompletelyormostlytrusttheIRStofairlyenforcethetaxlawsasenactedbyCongressandthePresident(Figure 2, p. 5)• 61%saytheycompletelyormostlytrusttheIRStohelpthemunderstandtheirtaxobligations(Figure 3, p. 6)
Trust in the IRS to fairly enforce the tax laws is noticeably higher among younger age groups and also among those who had recent contact with the IRS. • 73%ofthoseages18-to-24saytheycompletelyormostlytrusttheIRStofairlyenforcethetaxlaws,incontrastto56%forthoseages65andolder
(Figure 2, p. 5)• 69%ofthosewhoreceivedaletter,call,orvisitfromtheIRSduringtheprioryearsaytheycompletelyormostlytrusttheIRStofairlyenforcethe
taxlaws,comparedto57%whohadnocontactwiththeIRS(Figure 2, p. 5)
Recent cuts in IRS toll-free telephone and walk-in services may have resulted in a drop in taxpayer satisfaction in 2014.• 74%oftaxpayersaresatisfiedwiththeirpersonalinteractionwiththeIRS,afourpercentagepointreductionfrom2013andthelowestlevelever
recordedintheBoard’ssurvey(Figure 8, p. 8)
The majority of taxpayers support more funding for IRS services and enforcement. • 61%saytheIRSshouldreceiveextrafundingtoassistmoretaxpayers,uptwopointsfrom2013(Figure 11, p. 10)• 56%saytheIRSshouldreceiveextrafundingtoenforcetaxlaws,uponepointfrom2013(Figure 12, p. 10)
IRS Oversight Board 2014 Taxpayer Attitude Survey 4
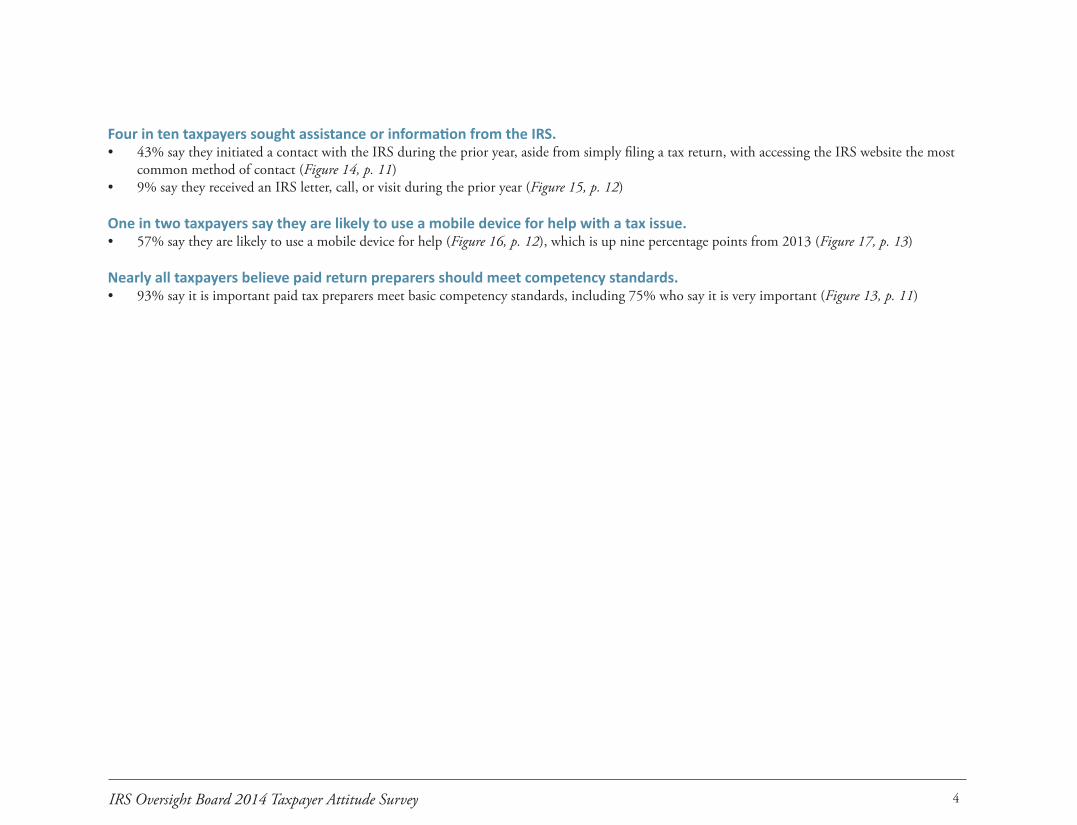
Four in ten taxpayers sought assistance or information from the IRS.• 43%saytheyinitiatedacontactwiththeIRSduringtheprioryear,asidefromsimplyfilingataxreturn,withaccessingtheIRSwebsitethemost
commonmethodofcontact(Figure 14, p. 11)• 9%saytheyreceivedanIRSletter,call,orvisitduringtheprioryear(Figure 15, p. 12)
One in two taxpayers say they are likely to use a mobile device for help with a tax issue.• 57%saytheyarelikelytouseamobiledeviceforhelp(Figure 16, p. 12),whichisupninepercentagepointsfrom2013(Figure 17, p. 13)
Nearly all taxpayers believe paid return preparers should meet competency standards.• 93%sayitisimportantpaidtaxpreparersmeetbasiccompetencystandards,including75%whosayitisveryimportant(Figure 13, p. 11)
5
Selected Trends in Taxpayer Attitudes Through 20141
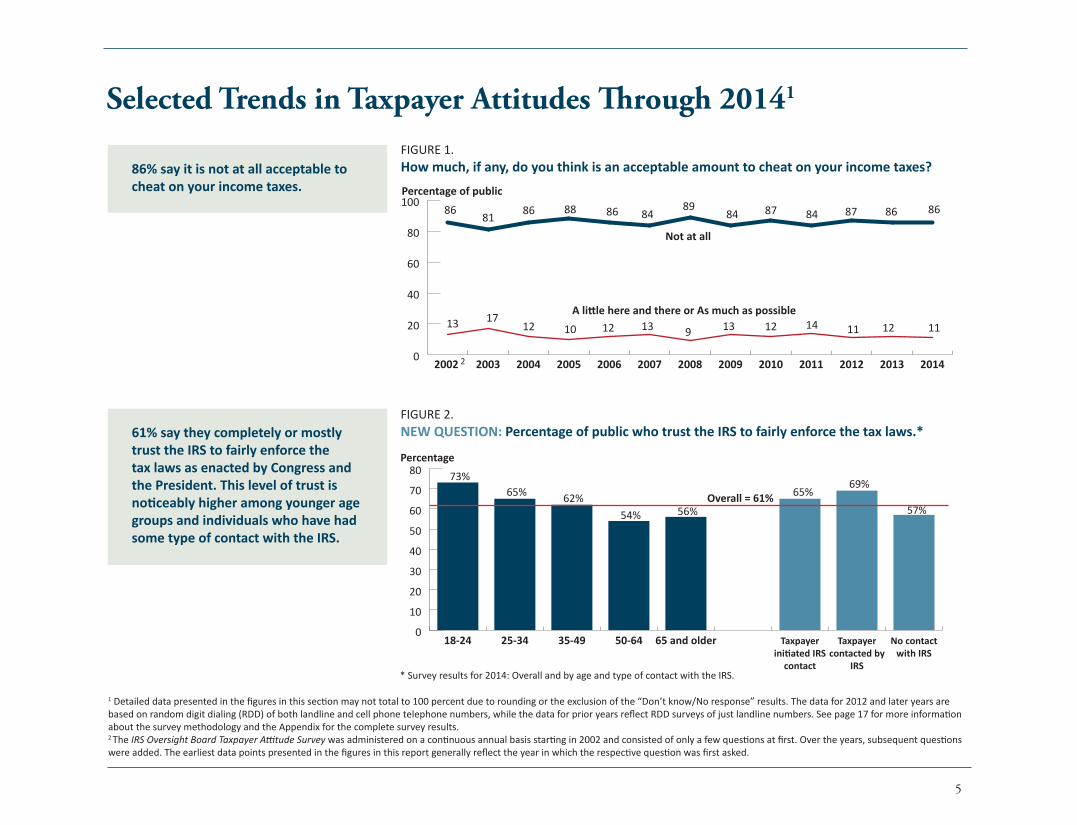
FIGURE 1. How much, if any, do you think is an acceptable amount to cheat on your income taxes?
FIGURE 2.NEW QUESTION: Percentage of public who trust the IRS to fairly enforce the tax laws.*
0
20
40
60
80
100
2014201320122011201020092008200720062005200420032002
Percentage of public
Not at all
A little here and there or As much as possible
86 8784878489
8486888681
111412139131210121713
86
12
2
86
11
0
10
20
30
40
50
60
70
80
No contactwith IRS
Taxpayercontacted by
IRS
Taxpayerinitiated IRS
contact
65 and older50-6435-4925-3418-24
Percentage
73%65% 62%
54% 56%
65%69%
57%Overall = 61%
86% say it is not at all acceptable to cheat on your income taxes.
61% say they completely or mostly trust the IRS to fairly enforce the tax laws as enacted by Congress and the President. This level of trust is noticeably higher among younger age groups and individuals who have had some type of contact with the IRS.
1 Detailed data presented in the figures in this section may not total to 100 percent due to rounding or the exclusion of the “Don’t know/No response” results. The data for 2012 and later years are based on random digit dialing (RDD) of both landline and cell phone telephone numbers, while the data for prior years reflect RDD surveys of just landline numbers. See page 17 for more information about the survey methodology and the Appendix for the complete survey results. 2 The IRS Oversight Board Taxpayer Attitude Survey was administered on a continuous annual basis starting in 2002 and consisted of only a few questions at first. Over the years, subsequent questions were added. The earliest data points presented in the figures in this report generally reflect the year in which the respective question was first asked.
* Survey results for 2014: Overall and by age and type of contact with the IRS.
IRS Oversight Board 2014 Taxpayer Attitude Survey 6
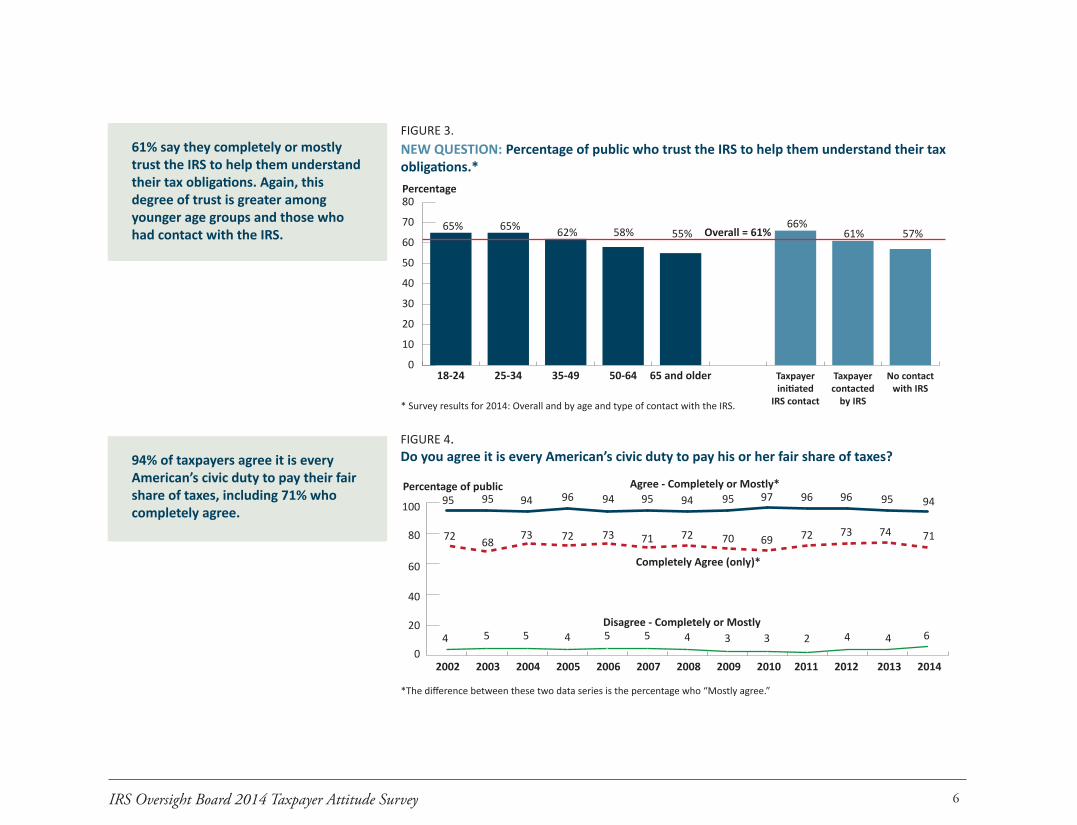
FIGURE 3. NEW QUESTION: Percentage of public who trust the IRS to help them understand their tax obligations.*
FIGURE 4. Do you agree it is every American’s civic duty to pay his or her fair share of taxes?
0
10
20
30
40
50
60
70
80
No contactwith IRS
Taxpayercontacted
by IRS
Taxpayerinitiated
IRS contact
65 and older50-6435-4925-3418-24
Percentage
65% 65% 62% 58% 55%66%
61% 57%Overall = 61%
Percentage of public Agree - Completely or Mostly*
Disagree - Completely or Mostly
95 96969795949594969495
42334554554
Completely Agree (only)*
72 73726970727173727368
2002 2003 2004 2005 2006 2007 2008 2009 2010 2011 2012 2013 2014
100
80
60
40
20
04
95
74
94
71
6
61% say they completely or mostly trust the IRS to help them understand their tax obligations. Again, this degree of trust is greater among younger age groups and those who had contact with the IRS.
94% of taxpayers agree it is every American’s civic duty to pay their fair share of taxes, including 71% who completely agree.
*The difference between these two data series is the percentage who “Mostly agree.”
* Survey results for 2014: Overall and by age and type of contact with the IRS.
IRS Oversight Board 2014 Taxpayer Attitude Survey
7
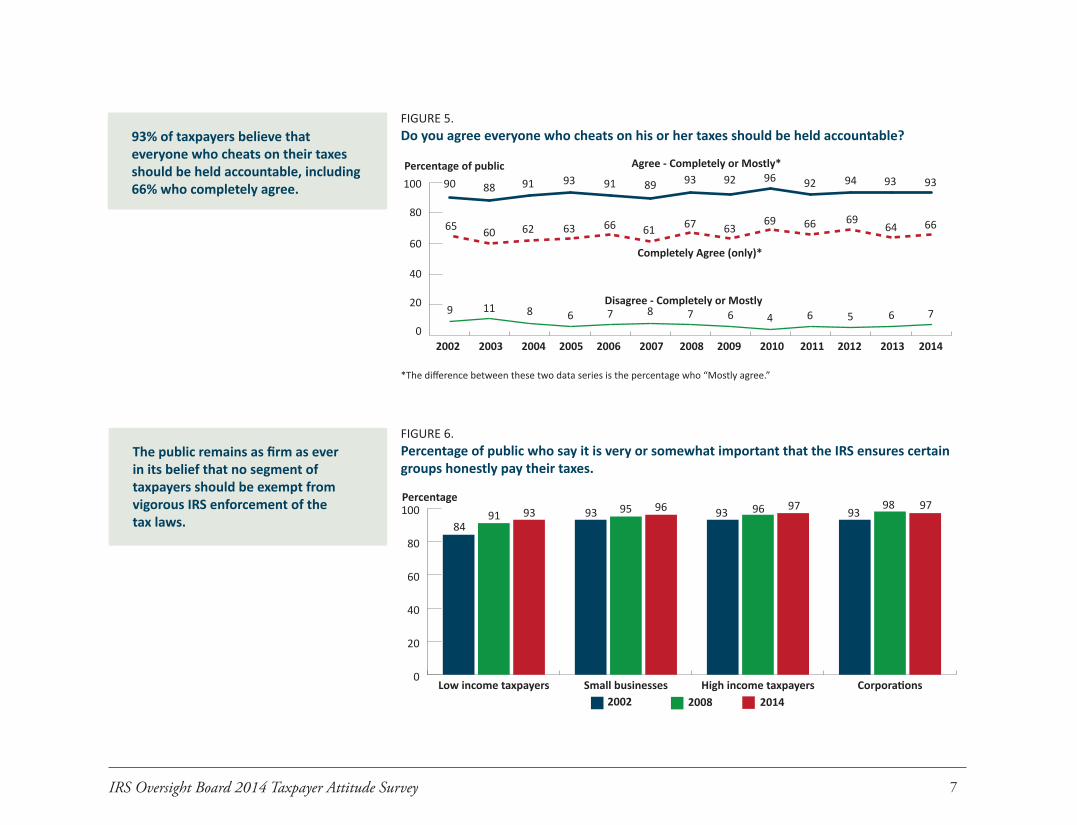
FIGURE 6. Percentage of public who say it is very or somewhat important that the IRS ensures certain groups honestly pay their taxes.
0
20
40
60
80
100
CorporationsHigh income taxpayersSmall businessesLow income taxpayers
Percentage
8491 93 93 95 96 93 96 97 93
98 97
2002 2008 2014
The public remains as firm as ever in its belief that no segment of taxpayers should be exempt from vigorous IRS enforcement of the tax laws.
Percentage of public Agree - Completely or Mostly*
Disagree - Completely or Mostly
90 94929692938991939188
564678768119
Completely Agree (only)*
65 69666963676166636260
2002 2003 2004 2005 2006 2007 2008 2009 2010 2011 2012 2013 2014
100
80
60
40
20
06
93
64
93
66
7
93% of taxpayers believe that everyone who cheats on their taxes should be held accountable, including 66% who completely agree.
FIGURE 5. Do you agree everyone who cheats on his or her taxes should be held accountable?
7
*The difference between these two data series is the percentage who “Mostly agree.”
IRS Oversight Board 2014 Taxpayer Attitude Survey 8
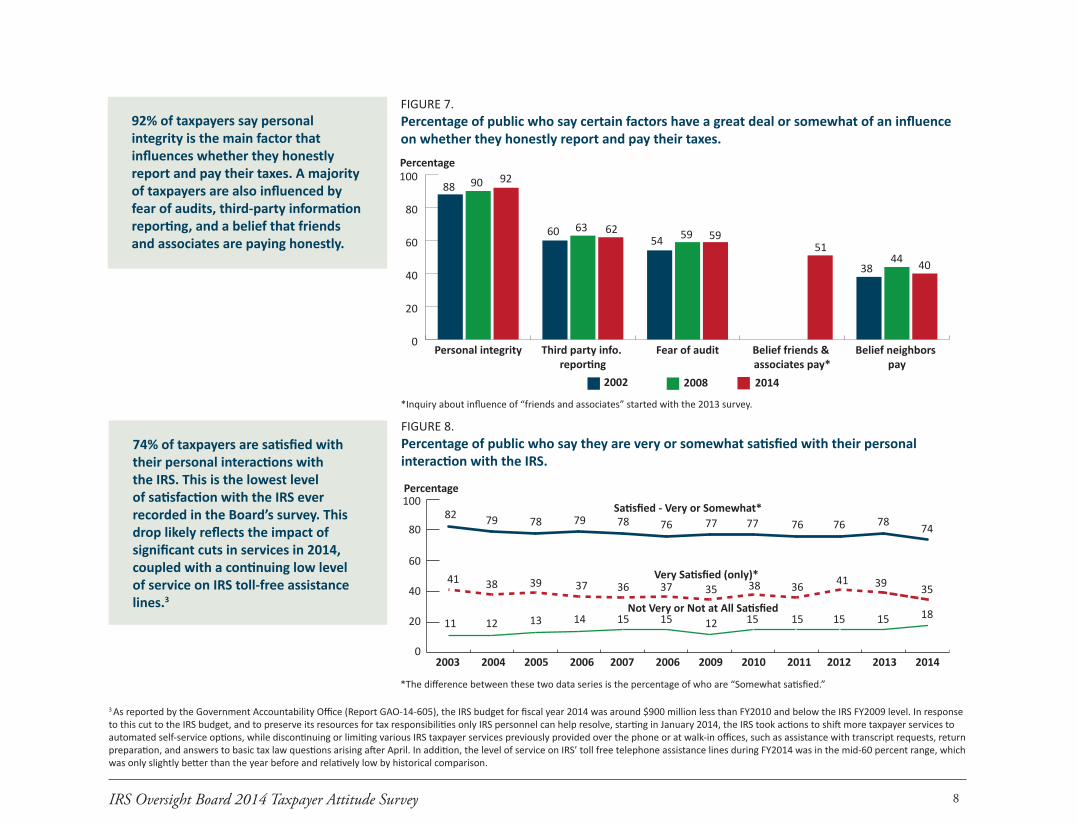
FIGURE 7. Percentage of public who say certain factors have a great deal or somewhat of an influence on whether they honestly report and pay their taxes.
0
20
40
60
80
100
Belief neighbors pay
Belief friends & associates pay*
Fear of auditThird party info. reporting
Personal integrity
Percentage
88 90 92
60 63 6254 59
51
3844 40
2002 2008 2014
59
92% of taxpayers say personal integrity is the main factor that influences whether they honestly report and pay their taxes. A majority of taxpayers are also influenced by fear of audits, third-party information reporting, and a belief that friends and associates are paying honestly.
FIGURE 8. Percentage of public who say they are very or somewhat satisfied with their personal interaction with the IRS.
Percentage
Satisfied - Very or Somewhat*
Not Very or Not at All Satisfied
82 78767677777678797879
151512 15151514131211
Very Satisfied (only)*41 413638353736373938
100
80
60
40
20
02003 2004 2005 2006 2007 2006 2009 2010 2011 2012 2013 2014
39
15
74
35
18
74% of taxpayers are satisfied with their personal interactions with the IRS. This is the lowest level of satisfaction with the IRS ever recorded in the Board’s survey. This drop likely reflects the impact of significant cuts in services in 2014, coupled with a continuing low level of service on IRS toll-free assistance lines.3
*The difference between these two data series is the percentage of who are “Somewhat satisfied.”
3 As reported by the Government Accountability Office (Report GAO-14-605), the IRS budget for fiscal year 2014 was around $900 million less than FY2010 and below the IRS FY2009 level. In response to this cut to the IRS budget, and to preserve its resources for tax responsibilities only IRS personnel can help resolve, starting in January 2014, the IRS took actions to shift more taxpayer services to automated self-service options, while discontinuing or limiting various IRS taxpayer services previously provided over the phone or at walk-in offices, such as assistance with transcript requests, return preparation, and answers to basic tax law questions arising after April. In addition, the level of service on IRS’ toll free telephone assistance lines during FY2014 was in the mid-60 percent range, which was only slightly better than the year before and relatively low by historical comparison.
*Inquiry about influence of “friends and associates” started with the 2013 survey.
IRS Oversight Board 2014 Taxpayer Attitude Survey 9
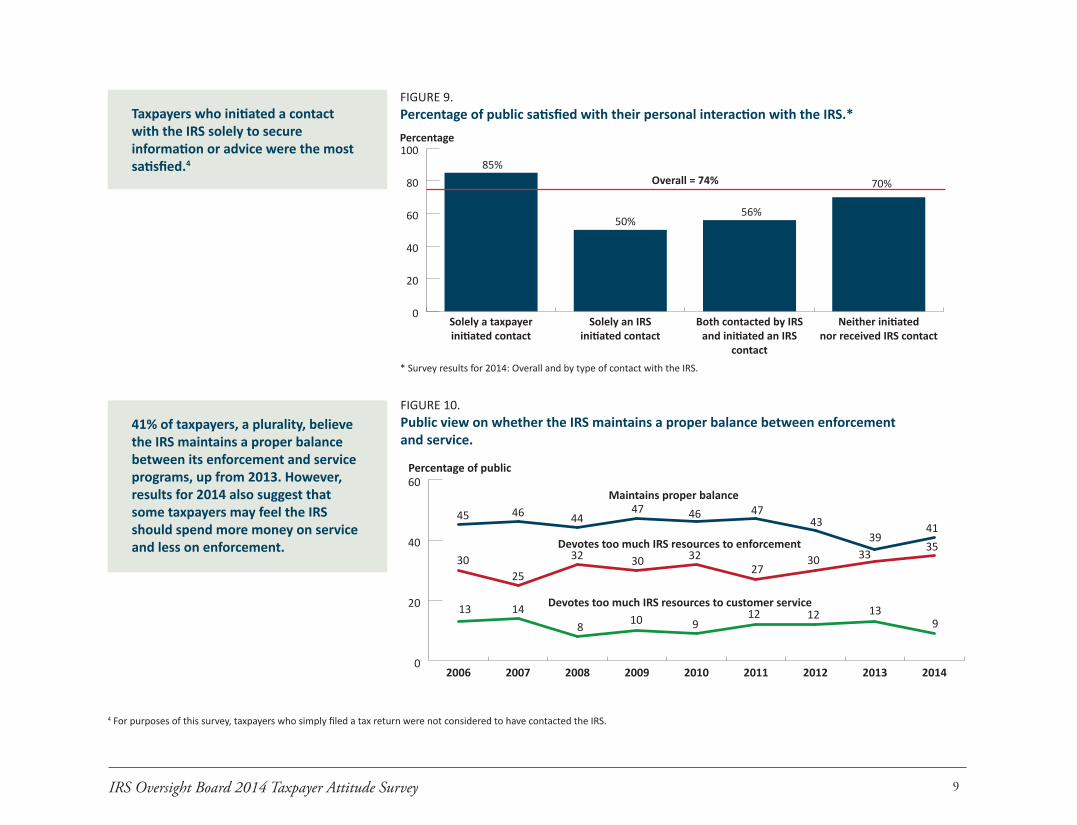
FIGURE 10. Public view on whether the IRS maintains a proper balance between enforcement and service.
0
20
40
60
201420132012201120102009200820072006
Percentage of public
Maintains proper balance
Devotes too much IRS resources to enforcement
Devotes too much IRS resources to customer service
45
30
13
46
25
14
44
32
8
47
30
10
46
32
9
47
27
12
43
30
12
33
13
3941
9
35
41% of taxpayers, a plurality, believe the IRS maintains a proper balance between its enforcement and service programs, up from 2013. However, results for 2014 also suggest that some taxpayers may feel the IRS should spend more money on service and less on enforcement.
FIGURE 9. Percentage of public satisfied with their personal interaction with the IRS.*
0
20
40
60
80
100
Neither initiatednor received IRS contact
Both contacted by IRSand initiated an IRS
contact
Solely an IRSinitiated contact
Solely a taxpayerinitiated contact
Percentage
85%
50%56%
70%Overall = 74%
Taxpayers who initiated a contact with the IRS solely to secure information or advice were the most satisfied.4
3 As reported by the Government Accountability Office (Report GAO-14-605), the IRS budget for fiscal year 2014 was around $900 million less than FY2010 and below the IRS FY2009 level. In response to this cut to the IRS budget, and to preserve its resources for tax responsibilities only IRS personnel can help resolve, starting in January 2014, the IRS took actions to shift more taxpayer services to automated self-service options, while discontinuing or limiting various IRS taxpayer services previously provided over the phone or at walk-in offices, such as assistance with transcript requests, return preparation, and answers to basic tax law questions arising after April. In addition, the level of service on IRS’ toll free telephone assistance lines during FY2014 was in the mid-60 percent range, which was only slightly better than the year before and relatively low by historical comparison.
4 For purposes of this survey, taxpayers who simply filed a tax return were not considered to have contacted the IRS.
* Survey results for 2014: Overall and by type of contact with the IRS.
IRS Oversight Board 2014 Taxpayer Attitude Survey 10
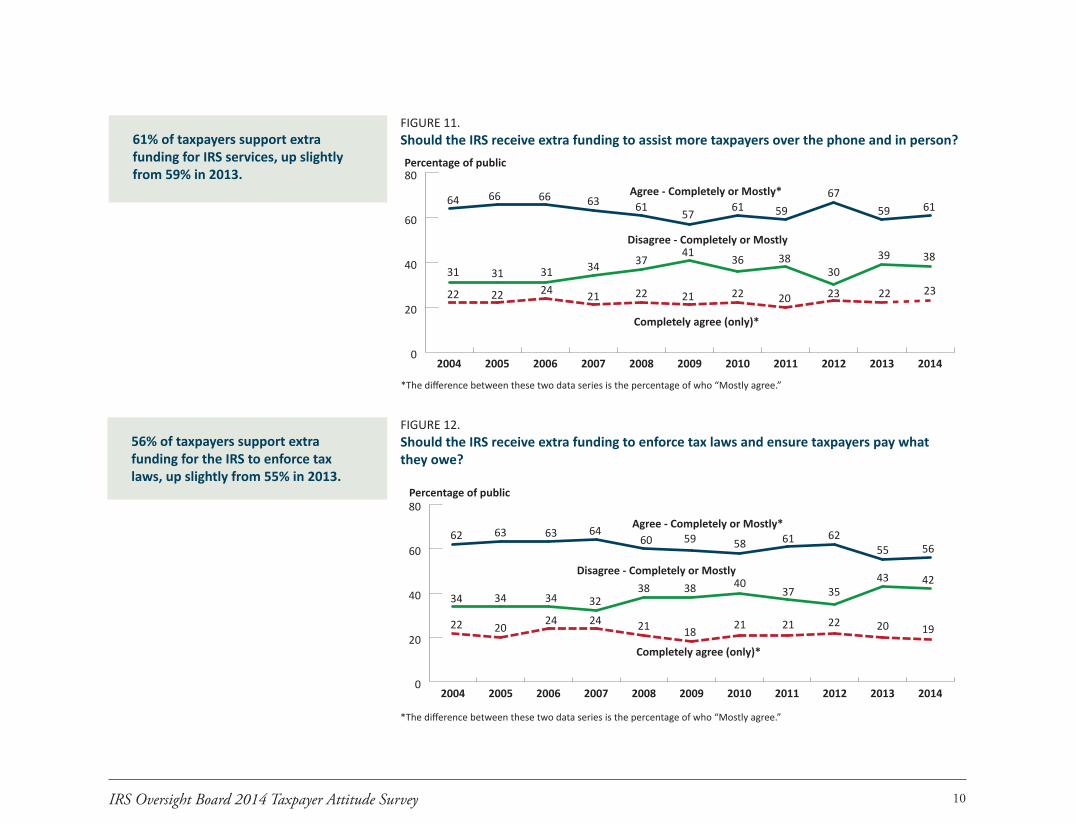
FIGURE 11. Should the IRS receive extra funding to assist more taxpayers over the phone and in person?
61% of taxpayers support extra funding for IRS services, up slightly from 59% in 2013.
0
20
40
60
80
20142013201220112010200920082007200620052004
Percentage of public
Agree - Completely or Mostly*
Disagree - Completely or Mostly
Completely agree (only)*
64
31
22
66
31
22
66
3124
63
34
21
61
37
22
57
41
21
61
36
22
59
38
20
30
23
67
22
39
59
23
38
61
FIGURE 12. Should the IRS receive extra funding to enforce tax laws and ensure taxpayers pay what they owe?
56% of taxpayers support extra funding for the IRS to enforce tax laws, up slightly from 55% in 2013.
0
20
40
60
80
20142013201220112010200920082007200620052004
Percentage of public
Agree - Completely or Mostly*
Disagree - Completely or Mostly
Completely agree (only)*
62
34
22
63
34
20
63
34
24
64
32
24
60
38
21
59
38
18
58
40
21
61
37
21
35
22
62
20
43
55
42
56
19
*The difference between these two data series is the percentage of who “Mostly agree.”
*The difference between these two data series is the percentage of who “Mostly agree.”
IRS Oversight Board 2014 Taxpayer Attitude Survey 11
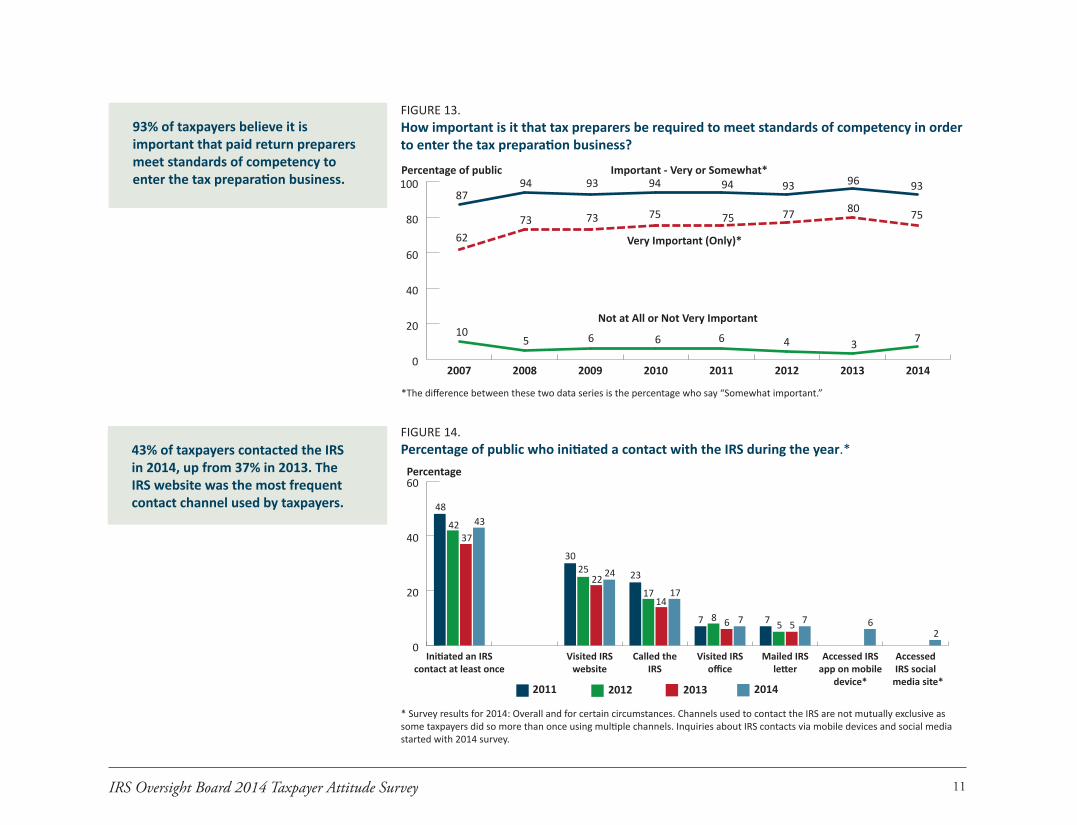
FIGURE 13. How important is it that tax preparers be required to meet standards of competency in order to enter the tax preparation business?
93% of taxpayers believe it is important that paid return preparers meet standards of competency to enter the tax preparation business.
0
20
40
60
80
100
20142013201220112010200920082007
Percentage of public Important - Very or Somewhat*
Very Important (Only)*
Not at All or Not Very Important
87
62
10
94
5
73 73
9493
6
75
6
94
75
6
93
77
4
96
3
80
93
7
75
*The difference between these two data series is the percentage who say “Somewhat important.”
FIGURE 14. Percentage of public who initiated a contact with the IRS during the year.*
43% of taxpayers contacted the IRS in 2014, up from 37% in 2013. The IRS website was the most frequent contact channel used by taxpayers.
0
20
40
60
AccessedIRS social
media site*
Accessed IRS app on mobile
device*
Mailed IRSletter
Visited IRSoffice
Called theIRS
Visited IRSwebsite
Initiated an IRScontact at least once
Percentage
48
4237
30
22 23
17 17
7
2011 2012 2013
25
682
67
2014
14
7 5 5 7
24
43
* Survey results for 2014: Overall and for certain circumstances. Channels used to contact the IRS are not mutually exclusive as some taxpayers did so more than once using multiple channels. Inquiries about IRS contacts via mobile devices and social media started with 2014 survey.
IRS Oversight Board 2014 Taxpayer Attitude Survey 12
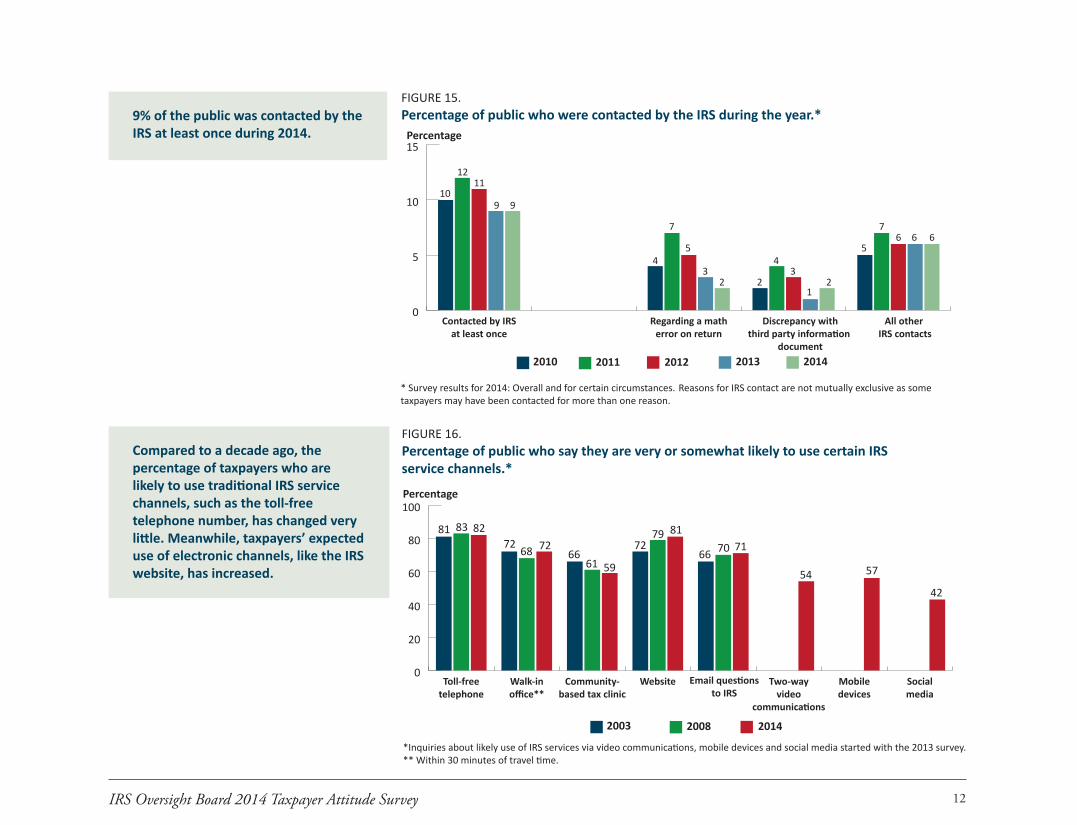
FIGURE 15. Percentage of public who were contacted by the IRS during the year.*
9% of the public was contacted by the IRS at least once during 2014.
0
5
10
15
All other IRS contacts
Discrepancy withthird party information
document
Regarding a matherror on return
Contacted by IRSat least once
Percentage
1211
9
7
5
2 2
2010 2011 2012
34
66
1
2013
32
5
76
4
9
2014
10
* Survey results for 2014: Overall and for certain circumstances. Reasons for IRS contact are not mutually exclusive as some taxpayers may have been contacted for more than one reason.
FIGURE 16. Percentage of public who say they are very or somewhat likely to use certain IRS service channels.*
Compared to a decade ago, the percentage of taxpayers who are likely to use traditional IRS service channels, such as the toll-free telephone number, has changed very little. Meanwhile, taxpayers’ expected use of electronic channels, like the IRS website, has increased.
0
20
40
60
80
100
Socialmedia
Mobiledevices
Two-wayvideo
communications
Email questionsto IRS
WebsiteCommunity-based tax clinic
Walk-inoffice**
Toll-freetelephone
Percentage
81 83 8272 68 72
6661 59
7279 81
2003 2008 2014
717066
42
5754
*Inquiries about likely use of IRS services via video communications, mobile devices and social media started with the 2013 survey.** Within 30 minutes of travel time.
IRS Oversight Board 2014 Taxpayer Attitude Survey 13
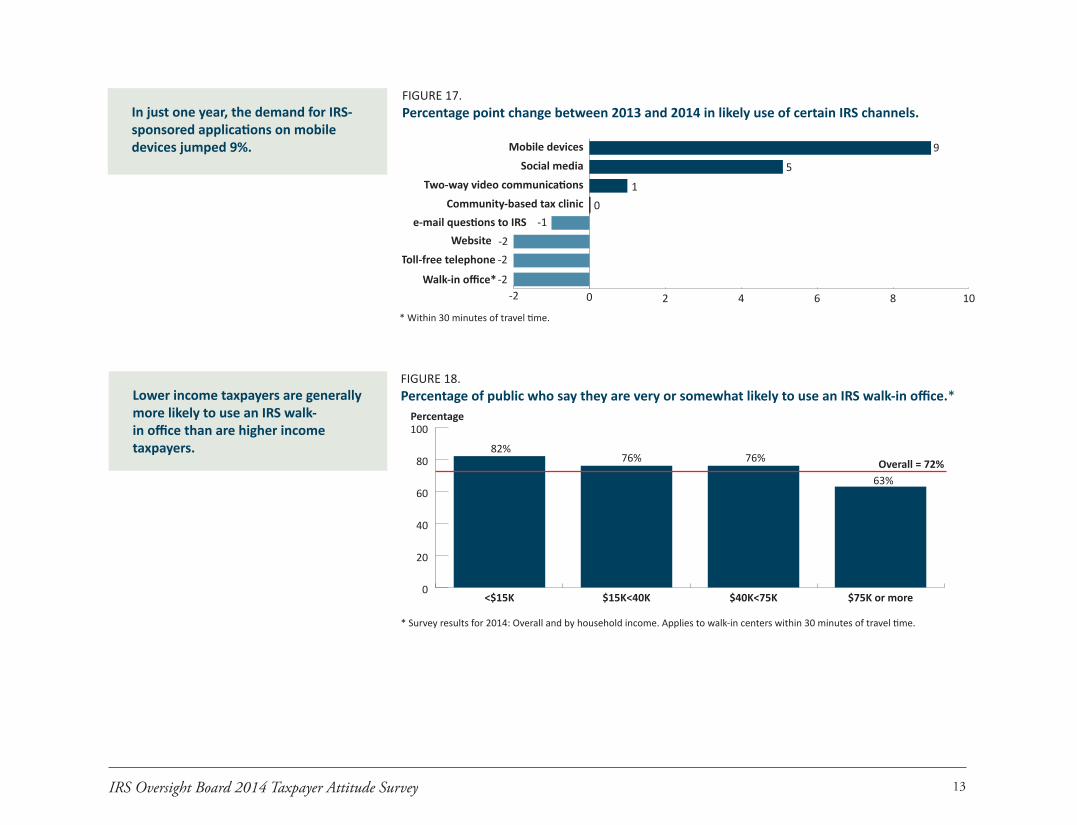
FIGURE 17. Percentage point change between 2013 and 2014 in likely use of certain IRS channels.
In just one year, the demand for IRS-sponsored applications on mobile devices jumped 9%.
-2
1Community-based tax clinic
Two-way video communications
Social media
Mobile devices
0 2 4 6 8 10Walk-in office*
Toll-free telephone
Websitee-mail questions to IRS
-2
-2
-1
5
9
0
-2
* Within 30 minutes of travel time.
FIGURE 18. Percentage of public who say they are very or somewhat likely to use an IRS walk-in office.*
Lower income taxpayers are generally more likely to use an IRS walk-in office than are higher income taxpayers.
0
20
40
60
80
100
$75K or more$40K<75K$15K<40K<$15K
Percentage
82%76% 76%
63%Overall = 72%
* Survey results for 2014: Overall and by household income. Applies to walk-in centers within 30 minutes of travel time.
IRS Oversight Board 2014 Taxpayer Attitude Survey 14
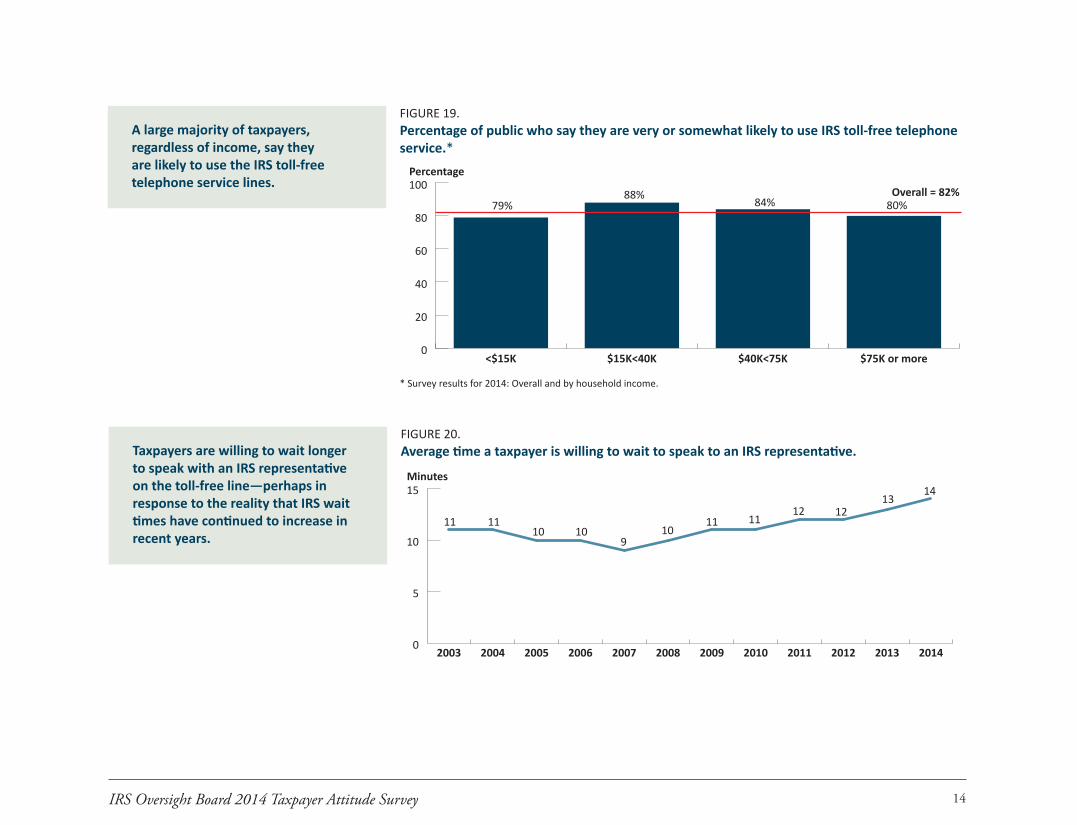
FIGURE 20. Average time a taxpayer is willing to wait to speak to an IRS representative.
Taxpayers are willing to wait longer to speak with an IRS representative on the toll-free line—perhaps in response to the reality that IRS wait times have continued to increase in recent years.
0
5
10
15
201420132012201120102009200820072006200520042003
Minutes
11
131212
111110
91010
11
14
FIGURE 19. Percentage of public who say they are very or somewhat likely to use IRS toll-free telephone service.*
A large majority of taxpayers, regardless of income, say they are likely to use the IRS toll-free telephone service lines.
0
20
40
60
80
100
$75K or more$40K<75K$15K<40K<$15K
Percentage
79%88%
84% 80%Overall = 82%
* Survey results for 2014: Overall and by household income.
IRS Oversight Board 2014 Taxpayer Attitude Survey 15
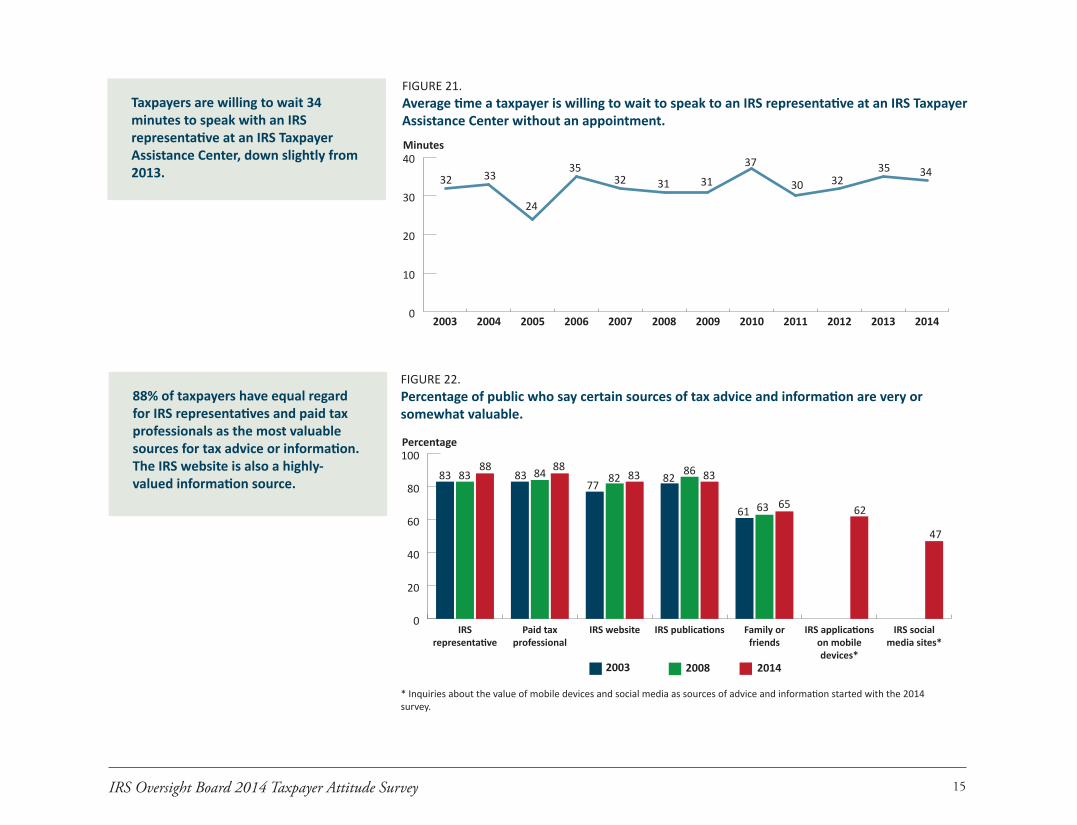
FIGURE 22. Percentage of public who say certain sources of tax advice and information are very or somewhat valuable.
88% of taxpayers have equal regard for IRS representatives and paid tax professionals as the most valuable sources for tax advice or information. The IRS website is also a highly-valued information source.
0
20
40
60
80
100
IRS socialmedia sites*
IRS applicationson mobiledevices*
Family orfriends
IRS publicationsIRS websitePaid taxprofessional
IRSrepresentative
Percentage
83 8388
83 84 88
77 82 83 8682
61
2003 2008 2014
63
83
47
6265
* Inquiries about the value of mobile devices and social media as sources of advice and information started with the 2014 survey.
Taxpayers are willing to wait 34 minutes to speak with an IRS representative at an IRS Taxpayer Assistance Center, down slightly from 2013.
FIGURE 21. Average time a taxpayer is willing to wait to speak to an IRS representative at an IRS Taxpayer Assistance Center without an appointment.
0
10
20
30
40
201420132012201120102009200820072006200520042003
Minutes
3235
3230
37
31313235
24
33 34
IRS Oversight Board 2014 Taxpayer Attitude Survey 16
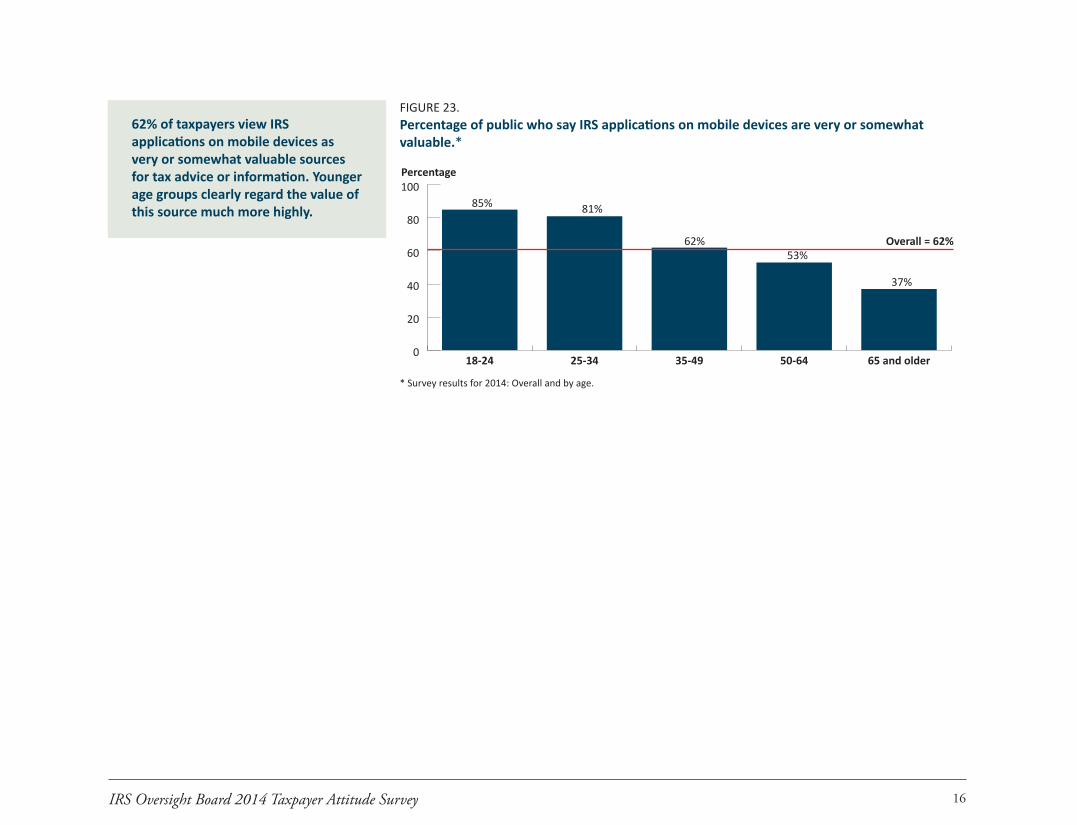
FIGURE 23. Percentage of public who say IRS applications on mobile devices are very or somewhat valuable.*
62% of taxpayers view IRS applications on mobile devices as very or somewhat valuable sources for tax advice or information. Younger age groups clearly regard the value of this source much more highly.
0
20
40
60
80
100
65 and older50-6435-4925-3418-24
Percentage
85% 81%
62%53%
Overall = 62%
37%
* Survey results for 2014: Overall and by age.
17
TheIRSOversightBoardcontractedwithGfKCustomResearch,LLC,toconductthe2014TaxpayerAttitudeSurvey.Atotalof1,002interviewswerecompletedforthe2014survey,madeupofmaleandfemaleU.S.adults,all18yearsofageorolder.ThestudywasconductedfromAugust4toAugust28,2014.Thesurveywascomprisedof701interviewscompletedviarandomdigitdialing(RDD)fromatraditionallandlinetelephonesamplingframeand301interviewscompletedviaRDDfromasamplingofcellphonenumbers,whichincludedcellphoneonlyanddual(landlineandcellphone)users.
AllinterviewswereconductedbytelephonefromtwoGfKphonecenters(TwinFallsandRexburg,ID)usinganinterviewingprocedureknownasCATI—ComputerAssistedTelephoneInterviewing.Interviewerswereprofessionallytrainedandcontinuouslymonitoredandsupervised.AlldatawereenteredandcleanedthroughtheCATIsystemduringtheinterviewingprocess,whicheliminatededitingandkeypunchoperations.
GfKisaleaderintheuseof“blended”RDDsamplesthatincludebothlandlineandcellphones.ThisstudydrewfromRDDprobabilisticsamplingframescreatedforeachtypeofvoiceconnection.TheRDDsamplingsystemiscomputer-basedandprovidesanequalprobabilityofselectionforeachandeverytelephonehousehold.Thesamplerepresentstelephonehouseholdswithbothlistedandunlistedphonesintheirproperproportions.Allsamplenumbersselectedbythisprocedureweresubjecttoanoriginalandatleastfourfollow-upattemptstocompleteaninterview.
UsingcurrentU.S.populationdataasbenchmarks,samplingexpertsinGfKblendedandweightedthetwoparalleltelephonesamplestomaximizetheircombinedvalueasanationallyrepresentativetelephonesample.ThisweightingschemeisbasedonaGfK-developedPropensityScoreAdjustmenttechniquethatappropriatelyweightstherespondentsbasedontheiruseoflandlinesversuscellphones.Thistechniqueaccountsforthecomplexreal-worldbehaviorofdual-usersoflandlinesandcellphones.
Themarginoferroronweighteddatais+/-4.0%forthetotalsampleatthe95%confidencelevel.
Move from Landline to Blended Survey ThefindingsfromthissurveyprovidetheIRSOversightBoardwithavaluabletaxpayercontextthataidsBoardmembersintheirreviewofIRSserviceandenforcementprograms,andinotherBoarddeliberationswhichfallundertheBoard’sstatutorydutytooverseetheIRSinitsadministrationoftheinternalrevenuelaws.TheBoardbroadeneditsannualtaxpayersurveymethodologyin2012toincludecellphonessoastoensurethesurveyremainedreliablyrepresentativeoftheentireU.S.adultpopulation.Asacheckonthistransitionin2012fromalandline-onlysurveytoablendedsurvey,theBoardhadGfKdevelopacomparisonsetofdatareflectingthe2012landline-onlysurveyresultsbyweightingthelandlineinterviewstorepresenttheadultU.S.populationinthemannerusedinpreviousyears. Asubsequentcomparativeanalysisrevealedthatbothsamplesyieldedthesame,ornearlythesame,overallresultsthevastmajorityofthetime.Inaddition,inthefewinstanceswhentheresultsdifferedmoresubstantially,theblendedsamplebroughtthedataclosertothehistoricaltrendinmoreinstancesthandidthelandline-onlysample.Thisindicatedthatuseoftheblendedsurveyresultsisthepreferredapproachoverthelandline-onlyresultseveninthecontextofhistoricaltrendsintheBoard’ssurvey.
Formoreinformationaboutthesurveyandadditionaldetailedinformationavailablefromit,[email protected].
Information and Methodology
18
APPENDIX:
IRS Oversight Board 2014 Taxpayer Attitude Survey Results
APPENDIX: IRS Oversight Board 2014 Taxpayer Attitude Survey Results 19
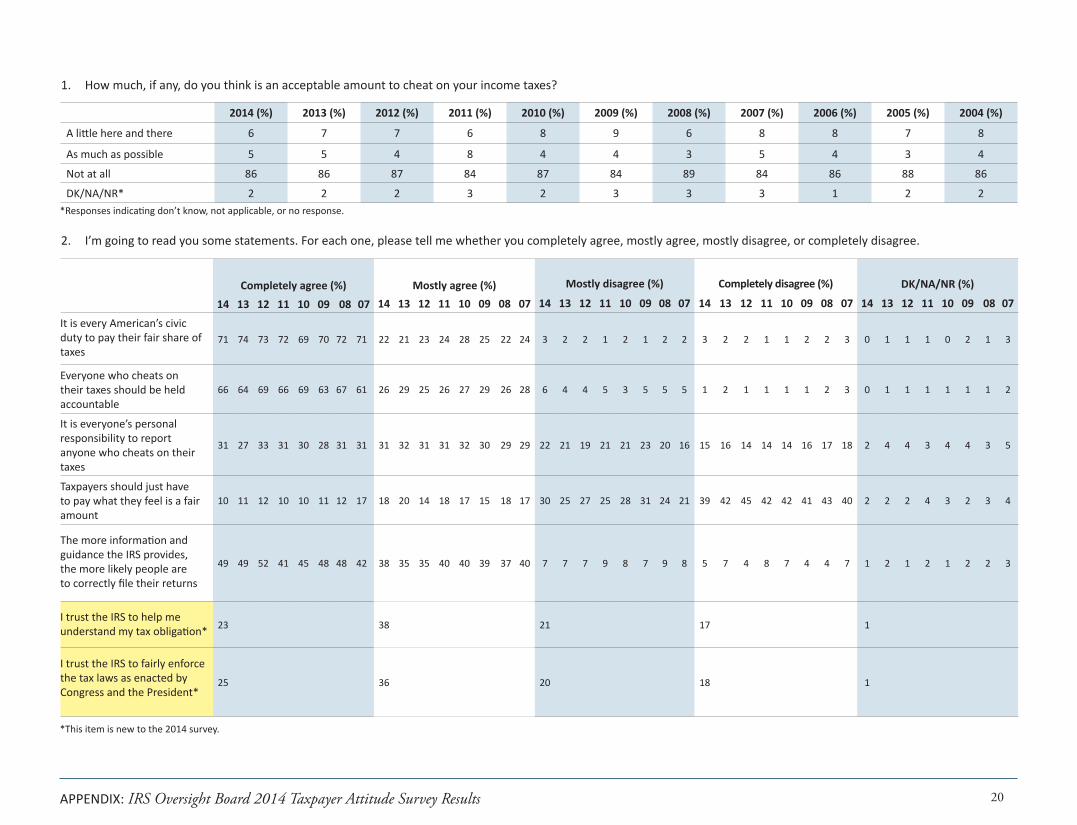
1. How much, if any, do you think is an acceptable amount to cheat on your income taxes?
2. I’m going to read you some statements. For each one, please tell me whether you completely agree, mostly agree, mostly disagree, or completely disagree. [Example: I trust the IRS to fairly enforce the tax laws as enacted by Congress and the President.]
3. How important is it to you, as a taxpayer, that the IRS does each of the following to ensure that all taxpayers honestly pay what they owe? [Example: Ensures small businesses are reporting and paying their taxes honestly.]
4. How much influence does each of the following factors have on whether you report and pay your taxes honestly? [Example: Fear of an audit.]
5. How important is it to you, as a taxpayer, that the IRS provides each of the following services to assist taxpayers? [Example: A toll-free telephone number to answer your questions.]
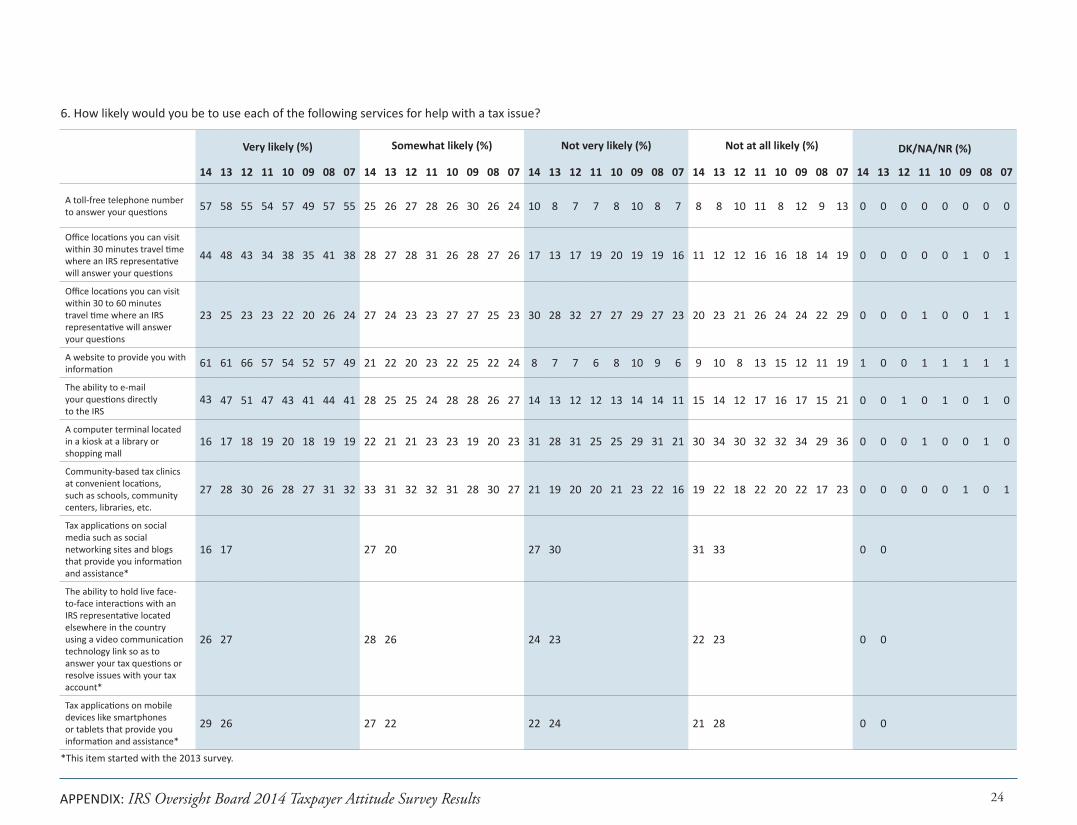
6. How likely would you be to use each of the following services for help with a tax issue? [Example: A toll-free telephone number to answer your questions.]
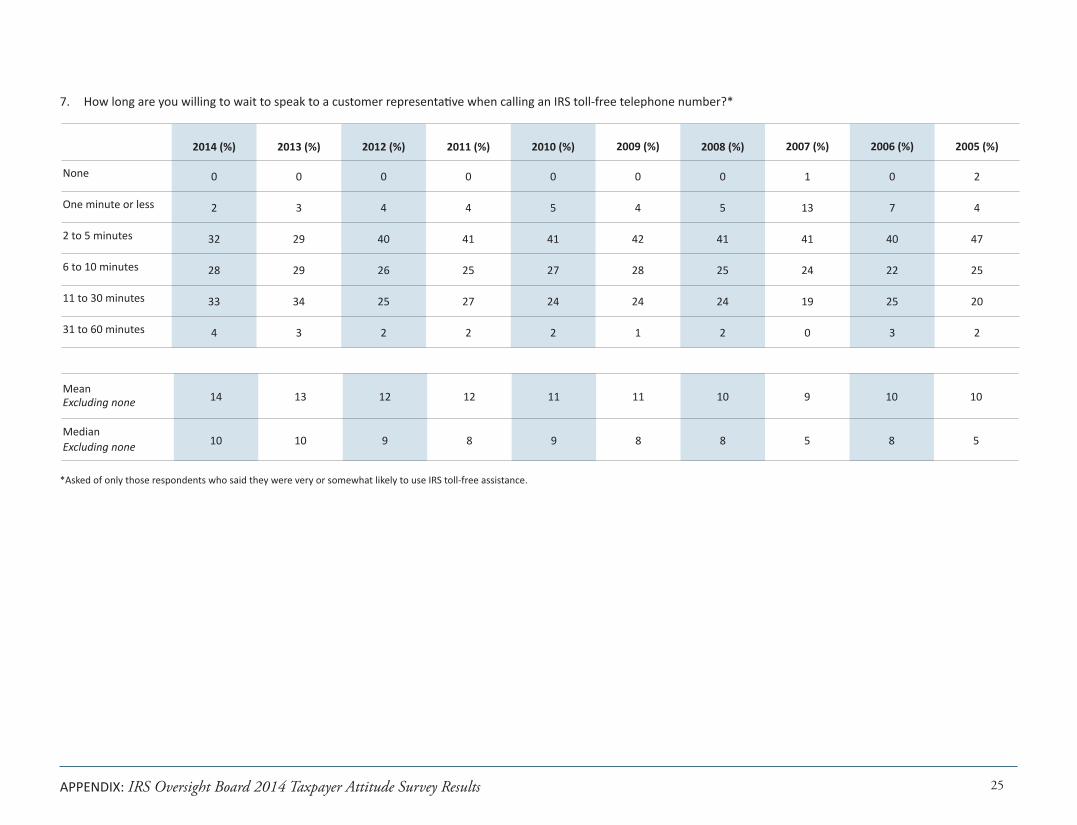
7. How long are you willing to wait to speak to a customer representative when calling an IRS toll-free telephone number?
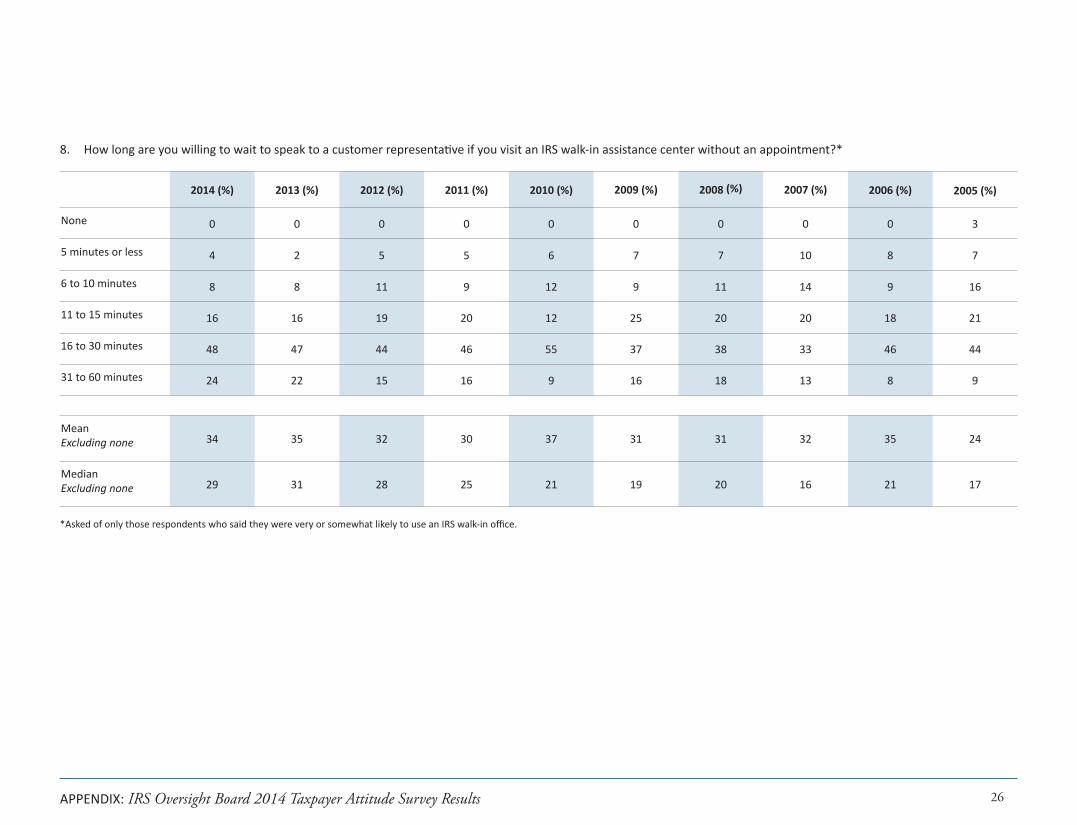
8. How long are you willing to wait to speak to a customer representative if you visit an IRS walk-in assistance center without an appointment?
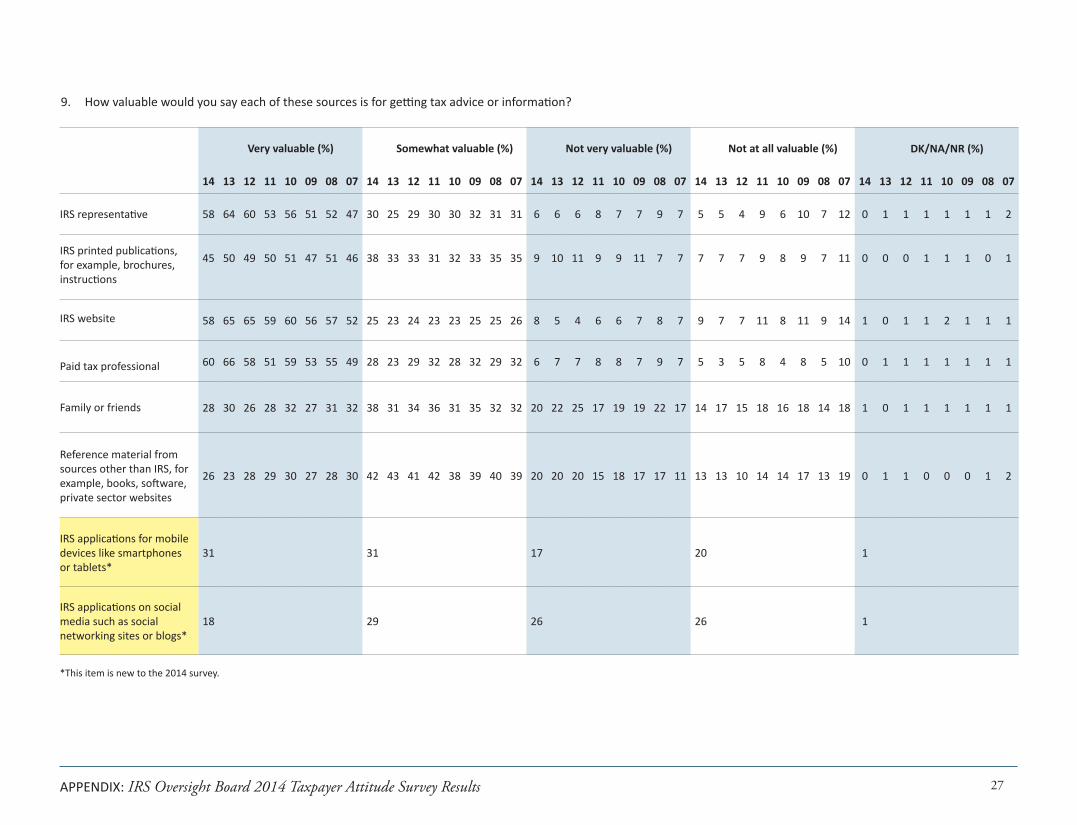
9. How valuable would you say each of these sources is for getting tax advice or information? [Example: IRS website.]
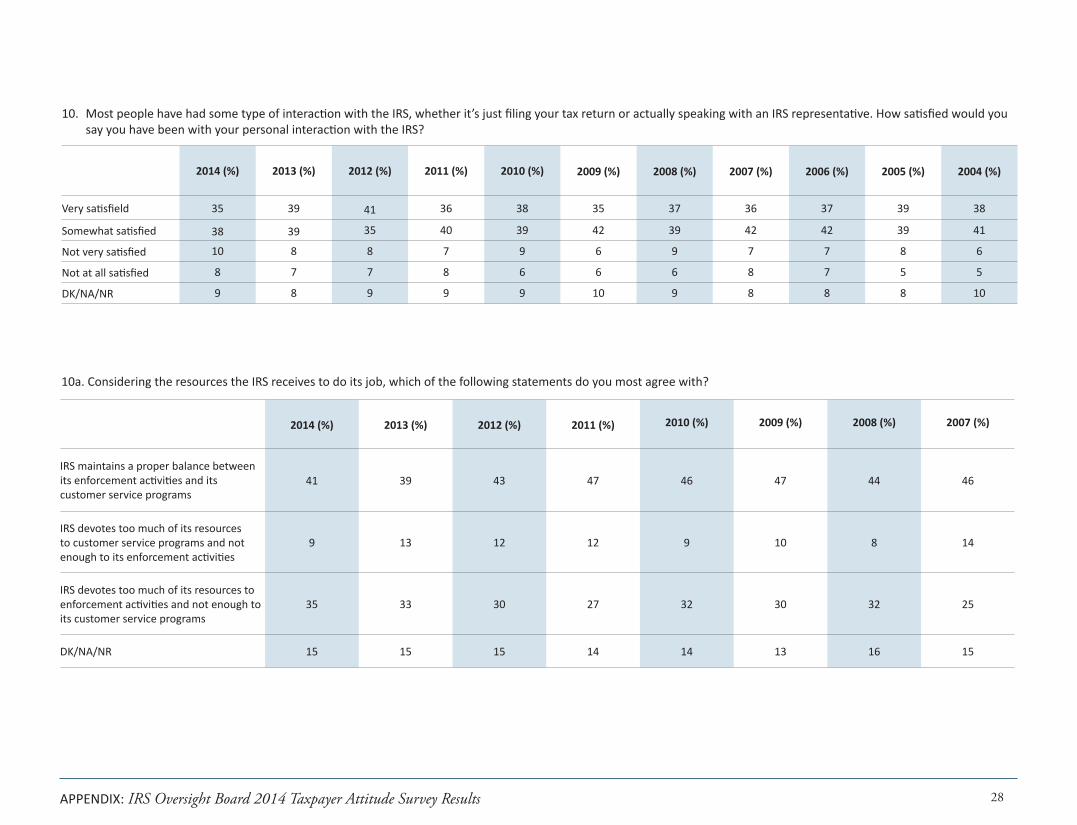
10. Most people have had some type of interaction with the IRS, whether it’s just filing your tax return or actually speaking with an IRS representative. How satisfied would you say you have been with your personal interaction with the IRS?
10a. Considering the resources the IRS receives to do its job, which of the following statements do you most agree with? [Example: IRS maintains a proper balance between its enforcement activities and its customer service programs.]
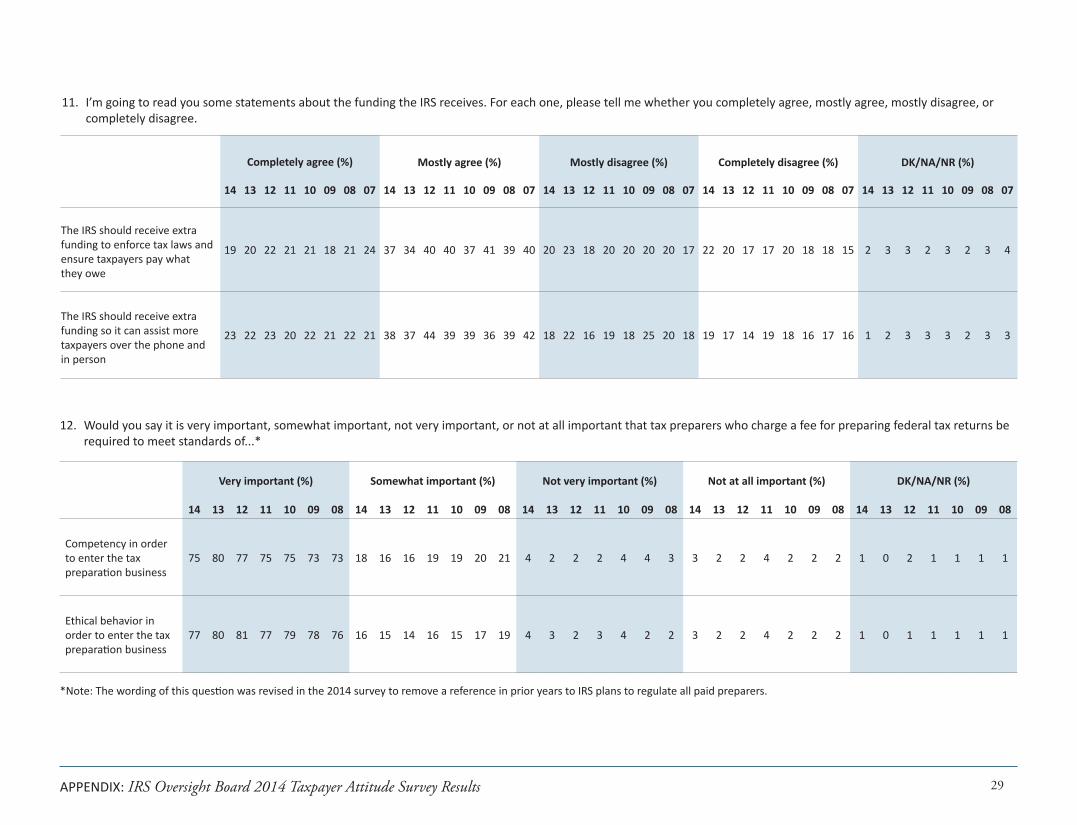
11. I’m going to read you some statements about the funding the IRS receives. For each one, please tell me whether you completely agree, mostly agree, mostly disagree, or completely disagree. [Example: IRS should receive extra funding to enforce tax laws and ensure taxpayers pay what they owe.]
12. How important would you say it is that tax preparers who charge a fee for preparing federal tax returns be required to meet certain standards? [Example: Competency in order to enter the tax preparation business.]
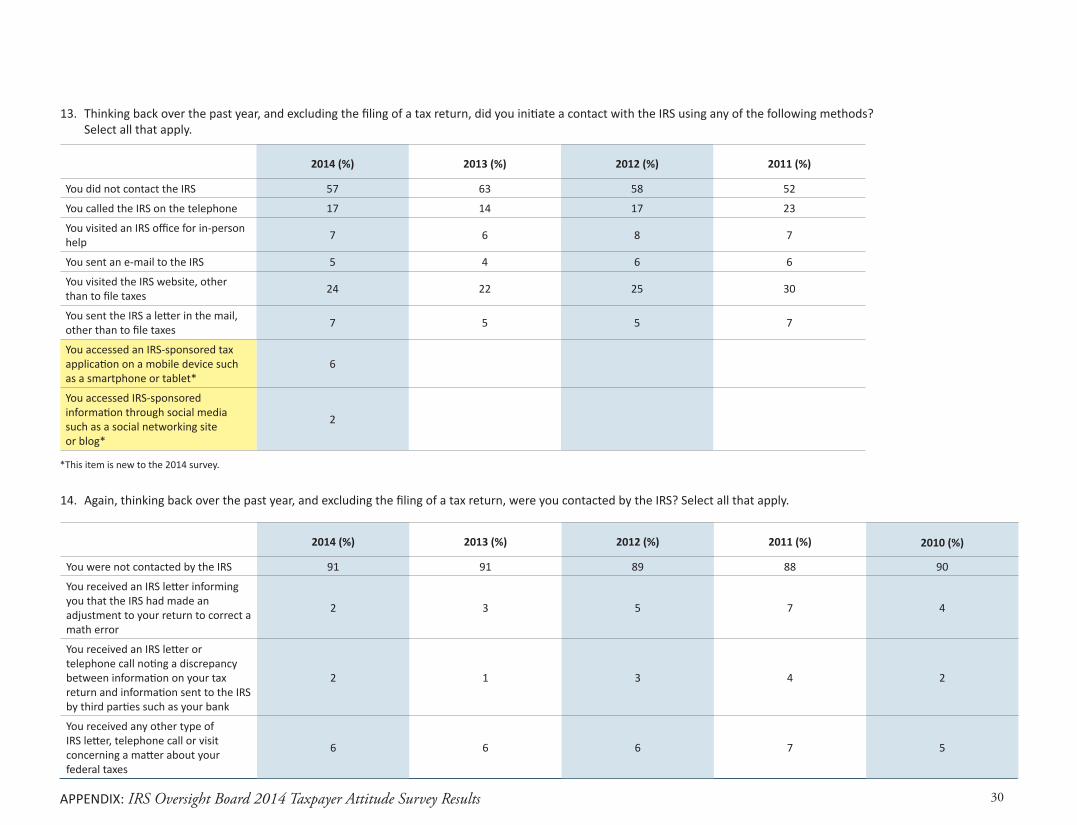
13. Thinking back over the past year, and excluding the filing of a tax return, did you initiate a contact with the IRS using any of the following methods? Select all that apply. [Example: You called the IRS on the telephone.]
14. Again, thinking back over the past year, and excluding the filing of a tax return, were you contacted by the IRS? Select all that apply. [Example: You received an IRS letter informing you that the IRS had made an adjustment to your return to correct a math error.]
Questions at a Glance*
*Complete list of questions and percentage distribution of responses starts on page 20.
APPENDIX: IRS Oversight Board 2014 Taxpayer Attitude Survey Results 20
2014 (%) 2013 (%) 2012 (%) 2011 (%) 2010 (%) 2009 (%) 2008 (%) 2007 (%) 2006 (%) 2005 (%) 2004 (%)
A little here and there 6 7 7 6 8 9 6 8 8 7 8
As much as possible 5 5 4 8 4 4 3 5 4 3 4
Not at all 86 86 87 84 87 84 89 84 86 88 86
DK/NA/NR* 2 2 2 3 2 3 3 3 1 2 2
1. How much, if any, do you think is an acceptable amount to cheat on your income taxes?
2. I’m going to read you some statements. For each one, please tell me whether you completely agree, mostly agree, mostly disagree, or completely disagree.
Completely agree (%) Mostly agree (%) Mostly disagree (%) Completely disagree (%) DK/NA/NR (%)
14 13 12 11 10 09 08 0714 13 12 11 10 09 08 07 14 13 12 11 10 09 08 07 14 13 12 11 10 09 08 07 14 13 12 11 10 09 08 07
It is every American’s civic duty to pay their fair share of taxes
71 74 73 72 69 70 72 71 22 21 23 24 28 25 22 24 3 2 2 1 2 1 2 2 3 2 2 1 1 2 2 3 0 1 1 1 0 2 1 3
Everyone who cheats on their taxes should be held accountable
66 64 69 66 69 63 67 61 26 29 25 26 27 29 26 28 6 4 4 5 3 5 5 5 1 2 1 1 1 1 2 3 0 1 1 1 1 1 1 2
It is everyone’s personal responsibility to report anyone who cheats on their taxes
31 27 33 31 30 28 31 31 31 32 31 31 32 30 29 29 22 21 19 21 21 23 20 16 15 16 14 14 14 16 17 18 2 4 4 3 4 4 3 5
Taxpayers should just have to pay what they feel is a fair amount
10 11 12 10 10 11 12 17 18 20 14 18 17 15 18 17 30 25 27 25 28 31 24 21 39 42 45 42 42 41 43 40 2 2 2 4 3 2 3 4
The more information and guidance the IRS provides, the more likely people are to correctly file their returns
49 49 52 41 45 48 48 42 38 35 35 40 40 39 37 40 7 7 7 9 8 7 9 8 5 7 4 8 7 4 4 7 1 2 1 2 1 2 2 3
I trust the IRS to help me understand my tax obligation* 23 38 21 17 1
I trust the IRS to fairly enforce the tax laws as enacted by Congress and the President*
25 36 20 18 1
*Responses indicating don’t know, not applicable, or no response.
*This item is new to the 2014 survey.
APPENDIX: IRS Oversight Board 2014 Taxpayer Attitude Survey Results
21
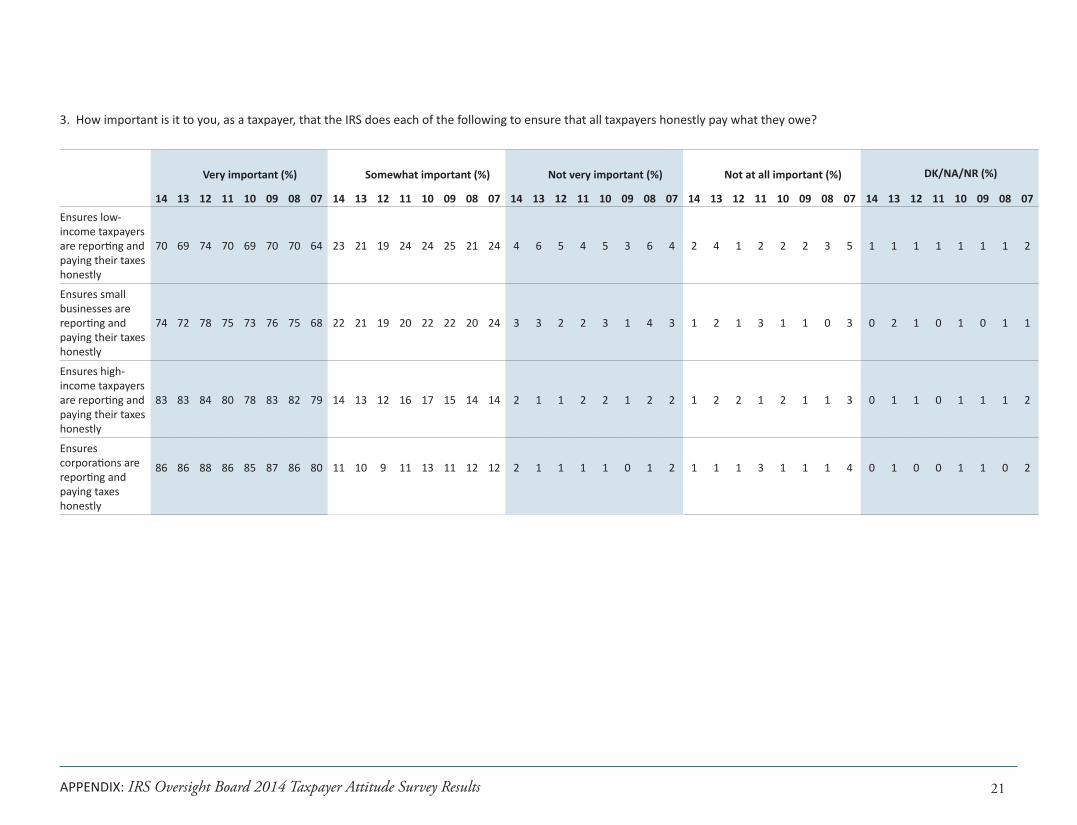
3. How important is it to you, as a taxpayer, that the IRS does each of the following to ensure that all taxpayers honestly pay what they owe?
Very important (%) Somewhat important (%) Not very important (%) Not at all important (%) DK/NA/NR (%)
14 13 12 11 10 09 08 07 14 13 12 11 10 09 08 07 14 13 12 11 10 09 08 07 14 13 12 11 10 09 08 07 14 13 12 11 10 09 08 07Ensures low-income taxpayers are reporting and paying their taxes honestly
70 69 74 70 69 70 70 64 23 21 19 24 24 25 21 24 4 6 5 4 5 3 6 4 2 4 1 2 2 2 3 5 1 1 1 1 1 1 1 2
Ensures small businesses are reporting and paying their taxes honestly
74 72 78 75 73 76 75 68 22 21 19 20 22 22 20 24 3 3 2 2 3 1 4 3 1 2 1 3 1 1 0 3 0 2 1 0 1 0 1 1
Ensures high-income taxpayers are reporting and paying their taxes honestly
83 83 84 80 78 83 82 79 14 13 12 16 17 15 14 14 2 1 1 2 2 1 2 2 1 2 2 1 2 1 1 3 0 1 1 0 1 1 1 2
Ensures corporations are reporting and paying taxes honestly
86 86 88 86 85 87 86 80 11 10 9 11 13 11 12 12 2 1 1 1 1 0 1 2 1 1 1 3 1 1 1 4 0 1 0 0 1 1 0 2
21
APPENDIX: IRS Oversight Board 2014 Taxpayer Attitude Survey Results 22
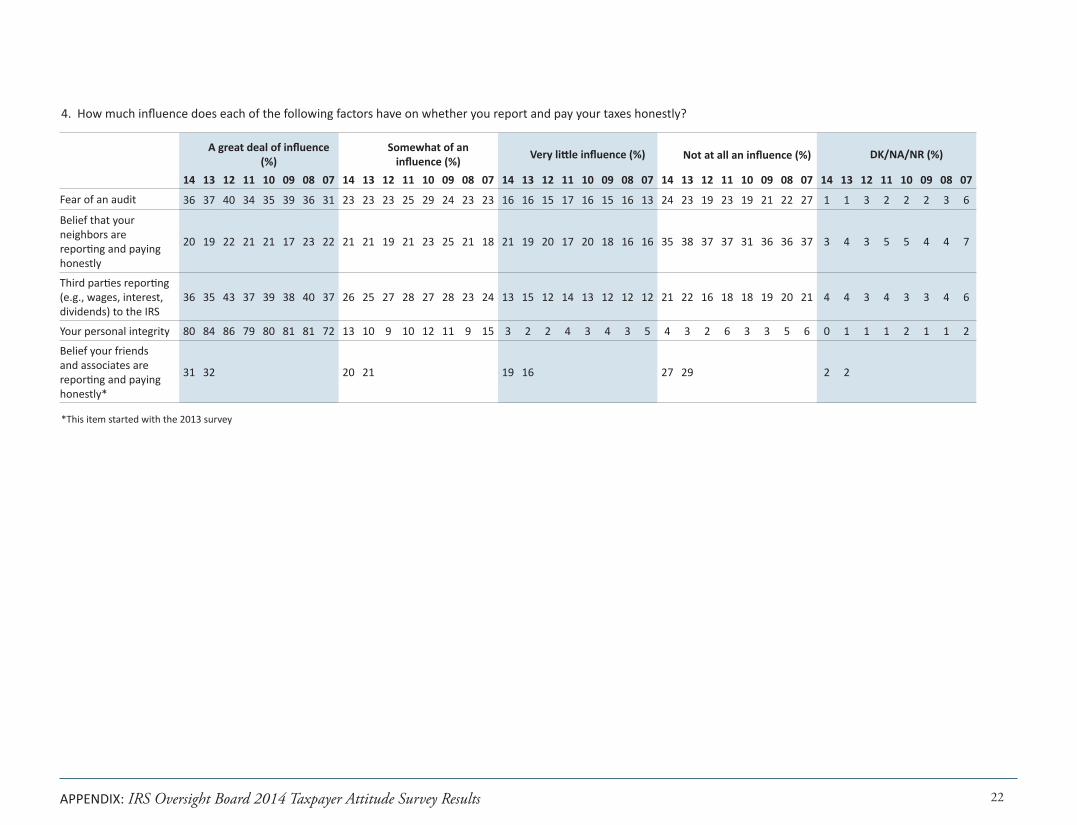
A great deal of influence (%)
Somewhat of an influence (%) Very little influence (%) Not at all an influence (%) DK/NA/NR (%)
14 13 12 11 10 09 08 07 14 13 12 11 10 09 08 07 14 13 12 11 10 09 08 07 14 13 12 11 10 09 08 07 14 13 12 11 10 09 08 07
Fear of an audit 36 37 40 34 35 39 36 31 23 23 23 25 29 24 23 23 16 16 15 17 16 15 16 13 24 23 19 23 19 21 22 27 1 1 3 2 2 2 3 6
Belief that your neighbors are reporting and paying honestly
20 19 22 21 21 17 23 22 21 21 19 21 23 25 21 18 21 19 20 17 20 18 16 16 35 38 37 37 31 36 36 37 3 4 3 5 5 4 4 7
Third parties reporting (e.g., wages, interest, dividends) to the IRS
36 35 43 37 39 38 40 37 26 25 27 28 27 28 23 24 13 15 12 14 13 12 12 12 21 22 16 18 18 19 20 21 4 4 3 4 3 3 4 6
Your personal integrity 80 84 86 79 80 81 81 72 13 10 9 10 12 11 9 15 3 2 2 4 3 4 3 5 4 3 2 6 3 3 5 6 0 1 1 1 2 1 1 2
Belief your friends and associates are reporting and paying honestly*
31 32 20 21 19 16 27 29 2 2
4. How much influence does each of the following factors have on whether you report and pay your taxes honestly?
*This item started with the 2013 survey
APPENDIX: IRS Oversight Board 2014 Taxpayer Attitude Survey Results 23
*This item started with the 2013 survey
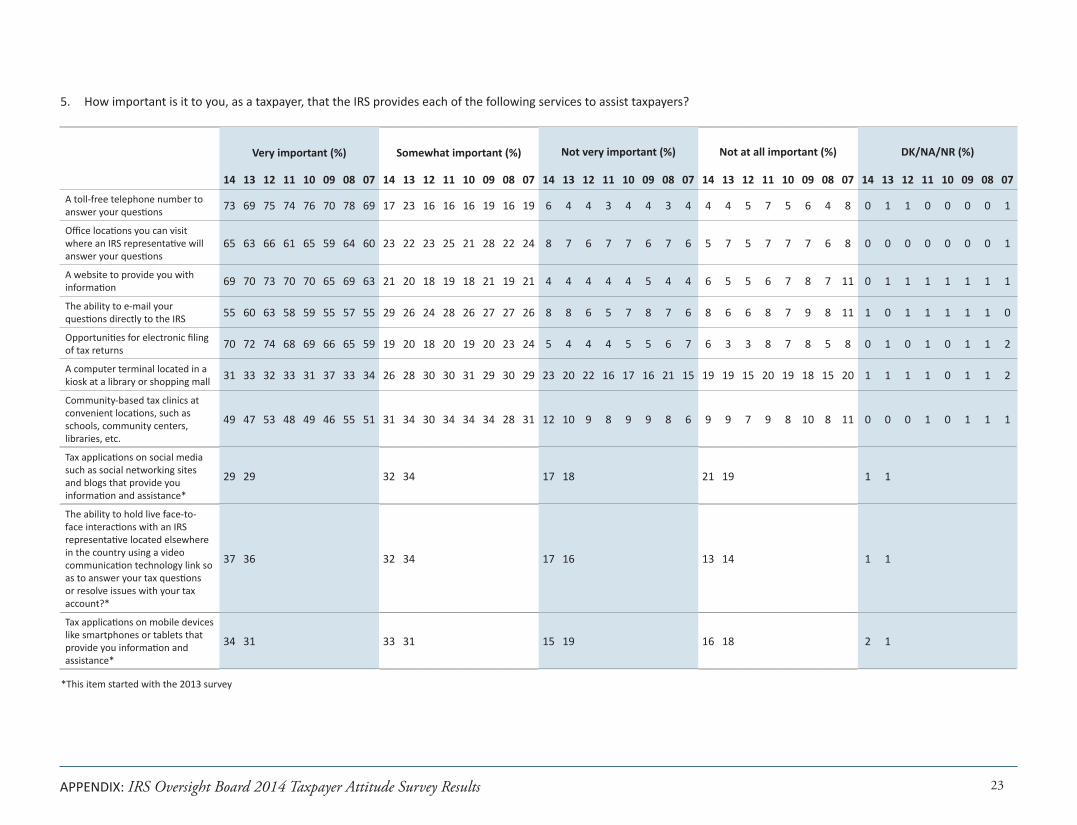
5. How important is it to you, as a taxpayer, that the IRS provides each of the following services to assist taxpayers?
Very important (%) Somewhat important (%) Not very important (%) Not at all important (%) DK/NA/NR (%)
14 13 12 11 10 09 08 07 14 13 12 11 10 09 08 07 14 13 12 11 10 09 08 07 14 13 12 11 10 09 08 07 14 13 12 11 10 09 08 07
A toll-free telephone number to answer your questions 73 69 75 74 76 70 78 69 17 23 16 16 16 19 16 19 6 4 4 3 4 4 3 4 4 4 5 7 5 6 4 8 0 1 1 0 0 0 0 1
Office locations you can visit where an IRS representative will answer your questions
65 63 66 61 65 59 64 60 23 22 23 25 21 28 22 24 8 7 6 7 7 6 7 6 5 7 5 7 7 7 6 8 0 0 0 0 0 0 0 1
A website to provide you with information 69 70 73 70 70 65 69 63 21 20 18 19 18 21 19 21 4 4 4 4 4 5 4 4 6 5 5 6 7 8 7 11 0 1 1 1 1 1 1 1
The ability to e-mail your questions directly to the IRS 55 60 63 58 59 55 57 55 29 26 24 28 26 27 27 26 8 8 6 5 7 8 7 6 8 6 6 8 7 9 8 11 1 0 1 1 1 1 1 0
Opportunities for electronic filing of tax returns 70 72 74 68 69 66 65 59 19 20 18 20 19 20 23 24 5 4 4 4 5 5 6 7 6 3 3 8 7 8 5 8 0 1 0 1 0 1 1 2
A computer terminal located in a kiosk at a library or shopping mall 31 33 32 33 31 37 33 34 26 28 30 30 31 29 30 29 23 20 22 16 17 16 21 15 19 19 15 20 19 18 15 20 1 1 1 1 0 1 1 2
Community-based tax clinics at convenient locations, such as schools, community centers, libraries, etc.
49 47 53 48 49 46 55 51 31 34 30 34 34 34 28 31 12 10 9 8 9 9 8 6 9 9 7 9 8 10 8 11 0 0 0 1 0 1 1 1
Tax applications on social media such as social networking sites and blogs that provide you information and assistance*
29 29 32 34 17 18 21 19 1 1
The ability to hold live face-to-face interactions with an IRS representative located elsewhere in the country using a video communication technology link so as to answer your tax questions or resolve issues with your tax account?*
37 36 32 34 17 16 13 14 1 1
Tax applications on mobile devices like smartphones or tablets that provide you information and assistance*
34 31 33 31 15 19 16 18 2 1
APPENDIX: IRS Oversight Board 2014 Taxpayer Attitude Survey Results 24
Very likely (%) Somewhat likely (%) Not very likely (%) Not at all likely (%) DK/NA/NR (%)
14 13 12 11 10 09 08 07 14 13 12 11 10 09 08 07 14 13 12 11 10 09 08 07 14 13 12 11 10 09 08 07 14 13 12 11 10 09 08 07
A toll-free telephone number to answer your questions 57 58 55 54 57 49 57 55 25 26 27 28 26 30 26 24 10 8 7 7 8 10 8 7 8 8 10 11 8 12 9 13 0 0 0 0 0 0 0 0
Office locations you can visit within 30 minutes travel time where an IRS representative will answer your questions
44 48 43 34 38 35 41 38 28 27 28 31 26 28 27 26 17 13 17 19 20 19 19 16 11 12 12 16 16 18 14 19 0 0 0 0 0 1 0 1
Office locations you can visit within 30 to 60 minutes travel time where an IRS representative will answer your questions
23 25 23 23 22 20 26 24 27 24 23 23 27 27 25 23 30 28 32 27 27 29 27 23 20 23 21 26 24 24 22 29 0 0 0 1 0 0 1 1
A website to provide you with information 61 61 66 57 54 52 57 49 21 22 20 23 22 25 22 24 8 7 7 6 8 10 9 6 9 10 8 13 15 12 11 19 1 0 0 1 1 1 1 1
The ability to e-mail your questions directly to the IRS
43 47 51 47 43 41 44 41 28 25 25 24 28 28 26 27 14 13 12 12 13 14 14 11 15 14 12 17 16 17 15 21 0 0 1 0 1 0 1 0
A computer terminal located in a kiosk at a library or shopping mall
16 17 18 19 20 18 19 19 22 21 21 23 23 19 20 23 31 28 31 25 25 29 31 21 30 34 30 32 32 34 29 36 0 0 0 1 0 0 1 0
Community-based tax clinics at convenient locations, such as schools, community centers, libraries, etc.
27 28 30 26 28 27 31 32 33 31 32 32 31 28 30 27 21 19 20 20 21 23 22 16 19 22 18 22 20 22 17 23 0 0 0 0 0 1 0 1
Tax applications on social media such as social networking sites and blogs that provide you information and assistance*
16 17 27 20 27 30 31 33 0 0
The ability to hold live face-to-face interactions with an IRS representative located elsewhere in the country using a video communication technology link so as to answer your tax questions or resolve issues with your tax account*
26 27 28 26 24 23 22 23 0 0
Tax applications on mobile devices like smartphones or tablets that provide you information and assistance*
29 26 27 22 22 24 21 28 0 0
6. How likely would you be to use each of the following services for help with a tax issue?
*This item started with the 2013 survey.
APPENDIX: IRS Oversight Board 2014 Taxpayer Attitude Survey Results 25
7. How long are you willing to wait to speak to a customer representative when calling an IRS toll-free telephone number?*
2014 (%) 2013 (%) 2012 (%) 2011 (%) 2010 (%) 2009 (%) 2008 (%) 2007 (%) 2006 (%) 2005 (%)
None 0 0 0 0 0 0 0 1 0 2
One minute or less 2 3 4 4 5 4 5 13 7 4
2 to 5 minutes 32 29 40 41 41 42 41 41 40 47
6 to 10 minutes 28 29 26 25 27 28 25 24 22 25
11 to 30 minutes 33 34 25 27 24 24 24 19 25 20
31 to 60 minutes 4 3 2 2 2 1 2 0 3 2
MeanExcluding none
14 13 12 12 11 11 10 9 10 10
MedianExcluding none
10 10 9 8 9 8 8 5 8 5
*Asked of only those respondents who said they were very or somewhat likely to use IRS toll-free assistance.
APPENDIX: IRS Oversight Board 2014 Taxpayer Attitude Survey Results 26
2014 (%) 2013 (%) 2012 (%) 2011 (%) 2010 (%) 2009 (%) 2008 (%) 2007 (%) 2006 (%) 2005 (%)
None 0 0 0 0 0 0 0 0 0 3
5 minutes or less 4 2 5 5 6 7 7 10 8 7
6 to 10 minutes 8 8 11 9 12 9 11 14 9 16
11 to 15 minutes 16 16 19 20 12 25 20 20 18 21
16 to 30 minutes 48 47 44 46 55 37 38 33 46 44
31 to 60 minutes 24 22 15 16 9 16 18 13 8 9
Mean
Excluding none 34 35 32 30 37 31 31 32 35 24
Median
Excluding none 29 31 28 25 21 19 20 16 21 17
8. How long are you willing to wait to speak to a customer representative if you visit an IRS walk-in assistance center without an appointment?*
*Asked of only those respondents who said they were very or somewhat likely to use an IRS walk-in office.
APPENDIX: IRS Oversight Board 2014 Taxpayer Attitude Survey Results 27
Very valuable (%) Somewhat valuable (%) Not very valuable (%)
Not at all valuable (%) DK/NA/NR (%)
14 13 12 11 10 09 08 07 14 13 12 11 10 09 08 07 14 13 12 11 10 09 08 07 14 13 12 11 10 09 08 07 14 13 12 11 10 09 08 07
IRS representative 58 64 60 53 56 51 52 47 30 25 29 30 30 32 31 31 6 6 6 8 7 7 9 7 5 5 4 9 6 10 7 12 0 1 1 1 1 1 1 2
IRS printed publications, for example, brochures, instructions
45 50 49 50 51 47 51 46 38 33 33 31 32 33 35 35 9 10 11 9 9 11 7 7 7 7 7 9 8 9 7 11 0 0 0 1 1 1 0 1
IRS website 58 65 65 59 60 56 57 52 25 23 24 23 23 25 25 26 8 5 4 6 6 7 8 7 9 7 7 11 8 11 9 14 1 0 1 1 2 1 1 1
Paid tax professional 60 66 58 51 59 53 55 49 28 23 29 32 28 32 29 32 6 7 7 8 8 7 9 7 5 3 5 8 4 8 5 10 0 1 1 1 1 1 1 1
Family or friends 28 30 26 28 32 27 31 32 38 31 34 36 31 35 32 32 20 22 25 17 19 19 22 17 14 17 15 18 16 18 14 18 1 0 1 1 1 1 1 1
Reference material from sources other than IRS, for example, books, software, private sector websites
26 23 28 29 30 27 28 30 42 43 41 42 38 39 40 39 20 20 20 15 18 17 17 11 13 13 10 14 14 17 13 19 0 1 1 0 0 0 1 2
IRS applications for mobile devices like smartphones or tablets*
31 31 17 20 1
IRS applications on social media such as social networking sites or blogs*
18 29 26 26 1
9. How valuable would you say each of these sources is for getting tax advice or information?
*This item is new to the 2014 survey.
APPENDIX: IRS Oversight Board 2014 Taxpayer Attitude Survey Results 28
2014 (%) 2013 (%) 2012 (%) 2011 (%) 2010 (%) 2009 (%) 2008 (%) 2007 (%) 2006 (%) 2005 (%) 2004 (%)
Very satisfield 35 39 41 36 38 35 37 36 37 39 38
Somewhat satisfied 38 39 35 40 39 42 39 42 42 39 41
Not very satisfied 10 8 8 7 9 6 9 7 7 8 6
Not at all satisfied 8 7 7 8 6 6 6 8 7 5 5
DK/NA/NR 9 8 9 9 9 10 9 8 8 8 10
10. Most people have had some type of interaction with the IRS, whether it’s just filing your tax return or actually speaking with an IRS representative. How satisfied would you say you have been with your personal interaction with the IRS?
10a. Considering the resources the IRS receives to do its job, which of the following statements do you most agree with?
2014 (%) 2013 (%) 2012 (%) 2011 (%) 2010 (%) 2009 (%) 2008 (%) 2007 (%)
IRS maintains a proper balance between its enforcement activities and its customer service programs
41 39 43 47 46 47 44 46
IRS devotes too much of its resources to customer service programs and not enough to its enforcement activities
9 13 12 12 9 10 8 14
IRS devotes too much of its resources to enforcement activities and not enough to its customer service programs
35 33 30 27 32 30 32 25
DK/NA/NR 15 15 15 14 14 13 16 15
APPENDIX: IRS Oversight Board 2014 Taxpayer Attitude Survey Results 29
Completely agree (%) Mostly agree (%) Mostly disagree (%) Completely disagree (%) DK/NA/NR (%)
14 13 12 11 10 09 08 07 14 13 12 11 10 09 08 07 14 13 12 11 10 09 08 07 14 13 12 11 10 09 08 07 14 13 12 11 10 09 08 07
The IRS should receive extra funding to enforce tax laws and ensure taxpayers pay what they owe
19 20 22 21 21 18 21 24 37 34 40 40 37 41 39 40 20 23 18 20 20 20 20 17 22 20 17 17 20 18 18 15 2 3 3 2 3 2 3 4
The IRS should receive extra funding so it can assist more taxpayers over the phone and in person
23 22 23 20 22 21 22 21 38 37 44 39 39 36 39 42 18 22 16 19 18 25 20 18 19 17 14 19 18 16 17 16 1 2 3 3 3 2 3 3
11. I’m going to read you some statements about the funding the IRS receives. For each one, please tell me whether you completely agree, mostly agree, mostly disagree, or completely disagree.
12. Would you say it is very important, somewhat important, not very important, or not at all important that tax preparers who charge a fee for preparing federal tax returns be required to meet standards of...*
Very important (%) Somewhat important (%) Not very important (%) Not at all important (%) DK/NA/NR (%)
14 13 12 11 10 09 08 14 13 12 11 10 09 08 14 13 12 11 10 09 08 14 13 12 11 10 09 08 14 13 12 11 10 09 08
Competency in order to enter the tax preparation business
75 80 77 75 75 73 73 18 16 16 19 19 20 21 4 2 2 2 4 4 3 3 2 2 4 2 2 2 1 0 2 1 1 1 1
Ethical behavior in order to enter the tax preparation business
77 80 81 77 79 78 76 16 15 14 16 15 17 19 4 3 2 3 4 2 2 3 2 2 4 2 2 2 1 0 1 1 1 1 1
*Note: The wording of this question was revised in the 2014 survey to remove a reference in prior years to IRS plans to regulate all paid preparers.
APPENDIX: IRS Oversight Board 2014 Taxpayer Attitude Survey Results 30
13. Thinking back over the past year, and excluding the filing of a tax return, did you initiate a contact with the IRS using any of the following methods? Select all that apply.
2014 (%) 2013 (%) 2012 (%) 2011 (%)
You did not contact the IRS 57 63 58 52
You called the IRS on the telephone 17 14 17 23
You visited an IRS office for in-person help 7 6 8 7
You sent an e-mail to the IRS 5 4 6 6
You visited the IRS website, other than to file taxes 24 22 25 30
You sent the IRS a letter in the mail, other than to file taxes 7 5 5 7
You accessed an IRS-sponsored tax application on a mobile device such as a smartphone or tablet*
6
You accessed IRS-sponsored information through social media such as a social networking site or blog*
2
14. Again, thinking back over the past year, and excluding the filing of a tax return, were you contacted by the IRS? Select all that apply.
2014 (%) 2013 (%) 2012 (%) 2011 (%) 2010 (%)
You were not contacted by the IRS 91 91 89 88 90
You received an IRS letter informing you that the IRS had made an adjustment to your return to correct a math error
2 3 5 7 4
You received an IRS letter or telephone call noting a discrepancy between information on your tax return and information sent to the IRS by third parties such as your bank
2 1 3 4 2
You received any other type of IRS letter, telephone call or visit concerning a matter about your federal taxes
6 6 6 7 5
*This item is new to the 2014 survey.
IRS Oversight Board1500 Pennsylvania Avenue, NWWashington, DC 20220
www.irsoversightboard.treas.gov
Ph: 202-622-2581
Lisa McLaneStaff Director

![COMPUTER MATCHING AGREEMENT BETWEEN THE TREASURY … · cc. Taxpayer Delinquent Account (TDA) Files [Treasury/IRS 26.019] dd. Taxpayer Delinquency Investigation (TDI) Files [Treasury/IRS](https://img.pdfslide.net/doc/110x75/5f9a2d303a1c4a02a93e91f3/computer-matching-agreement-between-the-treasury-cc-taxpayer-delinquent-account.jpg)


![COMPUTER MATCHING AGREEMENT...Taxpayer Delinquent Accounts (TDA) Files [Treasury/IRS 26.019] bb. Taxpayer Delinquency Investigation (TDI) Files [Treasury/IRS 26.020] cc. Identification](https://img.pdfslide.net/doc/110x75/5f9a2d7c8e59c86d9d3a5b6a/computer-matching-agreement-taxpayer-delinquent-accounts-tda-files-treasuryirs.jpg)