Embed Size (px)
Citation preview
IDEM 2007 Indiana Solid Waste Facility Report Page 1
The 2007 Summary of Indiana Solid Waste Facility Data is the sixteenth in the series of annual
reports of solid waste facility activities in Indiana. The information is compiled from solid waste facility
quarterly reports submitted to the Indiana Department of Environmental Management (IDEM). The
IDEM Office of Land Quality publishes the 2007 Summary of Indiana Solid Waste Facility Data to
provide information to the public about solid waste processing and disposal activities in Indiana. This
report was prepared by staff of the Data Services Section.
Contributors: Sarah Germann
Michelle Weddle
Nicholas Staller
Project Coordinator: Michelle Weddle
Cover Design: Lorie Finch
For additional information, please call the IDEM Office of Land Quality at (317) 233-4624.
IDEM 2007 Indiana Solid Waste Facility Report Page 2
Table of Contents
Page Introduction 5 Solid Waste Data Framework 7 – Solid Waste Types 7 – Solid Waste Facilities 7 – Origin of Waste 11 Solid Waste Land Disposal Facilities 14 – Municipal Solid Waste Landfills 16 – Other Solid Waste Land Disposal Facilities 20 Solid Waste Processing Facilities 24 – Solid Waste Incinerators 25 – Transfer Stations 26 – Other Processing Facilities 27 Out-of-State Waste 28 Remaining Municipal Solid Waste Landfill Capacity 37 2007 Solid Waste Facility Profiles Separate (Ordered alphabetically by county location of facility) Document
IDEM 2007 Indiana Solid Waste Facility Report Page 3
List of Figures Page Page Figure 1: Current Solid Waste Categories for Facility Quarterly Reports 7 Figure 2: Municipal Solid Waste Landfill Ownership by Percent During 2007 11 Figure 3: Waste Disposal Pathways 11 Figure 4: Disposal of Solid Waste by Landfill Type During 2007 14 Figure 5: Disposal of Solid Waste by Waste Type During 2007 14 Figure 6: Annual Disposal at All Solid Waste Land Disposal Facilities 15 Figure 7: Disposal of Solid Waste at Municipal Solid Waste Landfills by Waste Type During 2007 16 Figure 8: Annual Disposal at Municipal Solid Waste Landfills 17 Figure 9: Annual Disposal at Municipal Solid Waste Landfills by Waste Origin 17 Figure 10: Distribution of Disposal at Municipal Solid Waste Landfills During 2007 18
Figure 11: Annual Disposal at Construction-Demolition Sites by Waste Origin 20 Figure 12: Annual Disposal at Restricted Waste Sites by Waste Type 21 Figure 13: Transfer Station Waste Management 26 Figure 14: Destination of Waste Sent from Transfer Stations During 2007 27 Figure 15: Annual Waste Imports by Region of Origin 28 Figure 16: Annual Waste Imports by State of Origin 30 Figure 17: Annual Amount of Out-of-State Waste Received by Solid Waste Facilities 31 Figure 18: Distribution of Disposal of Out-of-State Waste Disposed at Indiana Solid Waste Facilities During 2007 33 Figure 19: Origin of Waste Disposed and Incinerated in Indiana During 2007 36
IDEM 2007 Indiana Solid Waste Facility Report Page 4
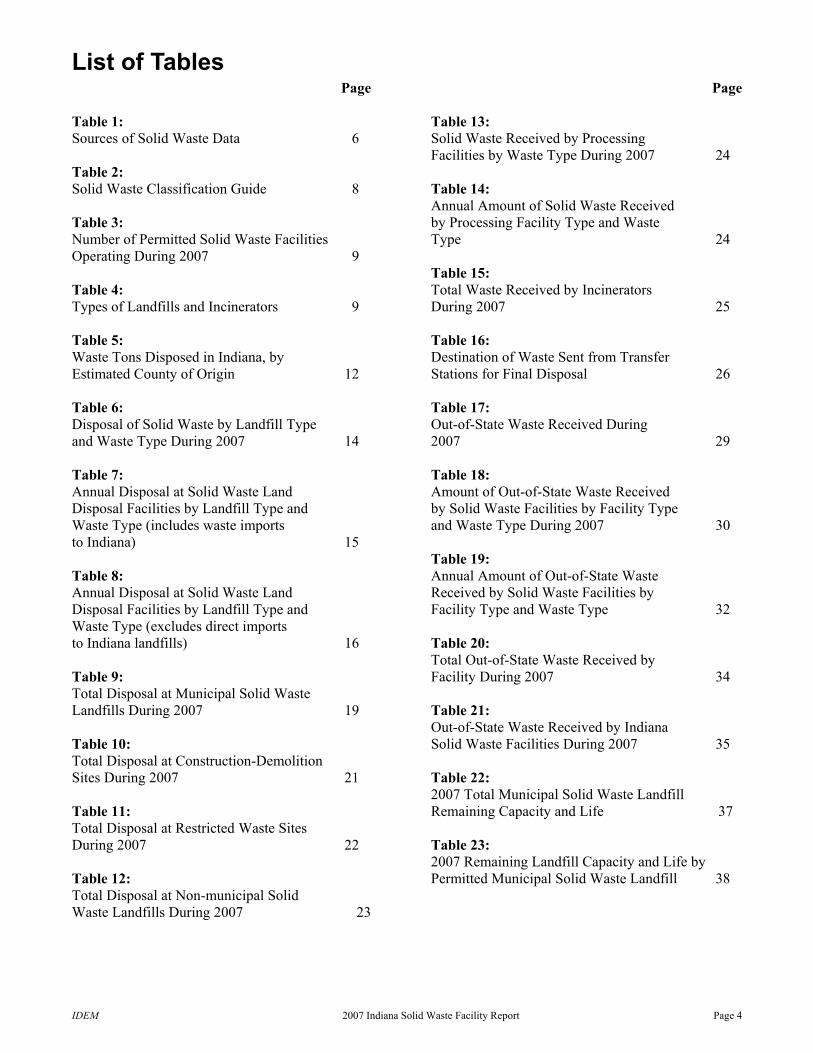
List of Tables Page Page Table 1: Sources of Solid Waste Data 6 Table 2: Solid Waste Classification Guide 8 Table 3: Number of Permitted Solid Waste Facilities Operating During 2007 9 Table 4: Types of Landfills and Incinerators 9 Table 5: Waste Tons Disposed in Indiana, by Estimated County of Origin 12 Table 6: Disposal of Solid Waste by Landfill Type and Waste Type During 2007 14 Table 7: Annual Disposal at Solid Waste Land Disposal Facilities by Landfill Type and Waste Type (includes waste imports to Indiana) 15 Table 8: Annual Disposal at Solid Waste Land Disposal Facilities by Landfill Type and Waste Type (excludes direct imports to Indiana landfills) 16 Table 9: Total Disposal at Municipal Solid Waste Landfills During 2007 19 Table 10: Total Disposal at Construction-Demolition Sites During 2007 21 Table 11: Total Disposal at Restricted Waste Sites During 2007 22 Table 12: Total Disposal at Non-municipal Solid Waste Landfills During 2007 23
Table 13: Solid Waste Received by Processing Facilities by Waste Type During 2007 24 Table 14: Annual Amount of Solid Waste Received by Processing Facility Type and Waste Type 24 Table 15: Total Waste Received by Incinerators During 2007 25 Table 16: Destination of Waste Sent from Transfer Stations for Final Disposal 26 Table 17: Out-of-State Waste Received During 2007 29 Table 18: Amount of Out-of-State Waste Received by Solid Waste Facilities by Facility Type and Waste Type During 2007 30 Table 19: Annual Amount of Out-of-State Waste Received by Solid Waste Facilities by Facility Type and Waste Type 32 Table 20: Total Out-of-State Waste Received by Facility During 2007 34 Table 21: Out-of-State Waste Received by Indiana Solid Waste Facilities During 2007 35 Table 22: 2007 Total Municipal Solid Waste Landfill Remaining Capacity and Life 37 Table 23: 2007 Remaining Landfill Capacity and Life by Permitted Municipal Solid Waste Landfill 38
IDEM 2007 Indiana Solid Waste Facility Report Page 5
Introduction This report is the sixteenth annual summary of Indiana’s solid waste facility data. It is intended to provide information about Indiana’s solid waste management. The report provides solid waste facility information for 2007 and contains:
a summary of existing solid waste facilities;
a summary of the amount, origin, and types of solid waste received at land disposal facilities and processing facilities; and
a summary of out-of- state waste imports.
This report was compiled from the solid waste facility quarterly reports submitted to IDEM by owners and operators of facilities that manage non-hazardous solid waste. Rules passed by the Solid Waste Management Board require all solid waste land disposal facilities (329 IAC 10-14-1) and processing facilities (329 IAC 11-14-1) to submit information to IDEM on a quarterly basis describing the origin, type, and amount of solid waste received by these facilities. Processing facilities must also report the amounts and destinations of waste transported off-site for recovery or disposal. Reports submitted to IDEM are on file and available for public review. This report emphasizes graphs, tables, and figures. Discussion text is included only as necessary to guide the reader through the report and to provide a context for the graphs and tables. Several sections that were included in previous releases of this report are not present in this year’s report. Much of the information in these sections has been duplicated from year to year and/or is available in other IDEM publications. Table 1 shows how to obtain this information in addition to other information that may interest readers of this report.
Previous reports summarized municipal solid waste (MSW) landfill capacity from amounts reported by facilities or from estimates made by IDEM. Beginning in 1996, landfills were required by regulation to submit contour maps annually based on
surveys conducted between October 1 and December 31 of each year. IDEM uses this information to calculate accurate and precise totals for both airspace and waste capacity. Beginning in 2007, landfills are now required to conduct surveys between December 1 and March 31, and submit the maps to IDEM June 15. This information can be found beginning on page 37.
Prior to 1996, facilities reported non-municipal waste only as Construction-Demolition Waste and Special/Other Waste. In 1996, IDEM added categories for Special Waste, which included Foundry Wastes and Other Special Wastes, for Coal Ash, and for Flue Gas Desulfurization by-products. Legislation enacted since the beginning of the period covered by the 2000 Summary of Indiana Solid Waste Facility Data report eliminated Special Waste as a classification. To reflect this, Foundry Wastes, which was previously under Special Waste, is retained as a separate category under its own name. Other Special Wastes is no longer a separate sub-category. Any waste previously classified as Special Waste or Industrial Waste that does not fit any of the existing available categories is reported now under the category Other Waste. Coal Ash and Flue Gas Desulfurization are retained as classifications. Because of the changes in classification types through the years covered by the 2007 Summary of Indiana Solid Waste Facility Data report, information for disposal by waste type by year will continue to be grouped as municipal waste and non-municipal waste to make comparisons among years meaningful.
IDEM 2007 Indiana Solid Waste Facility Report Page 6
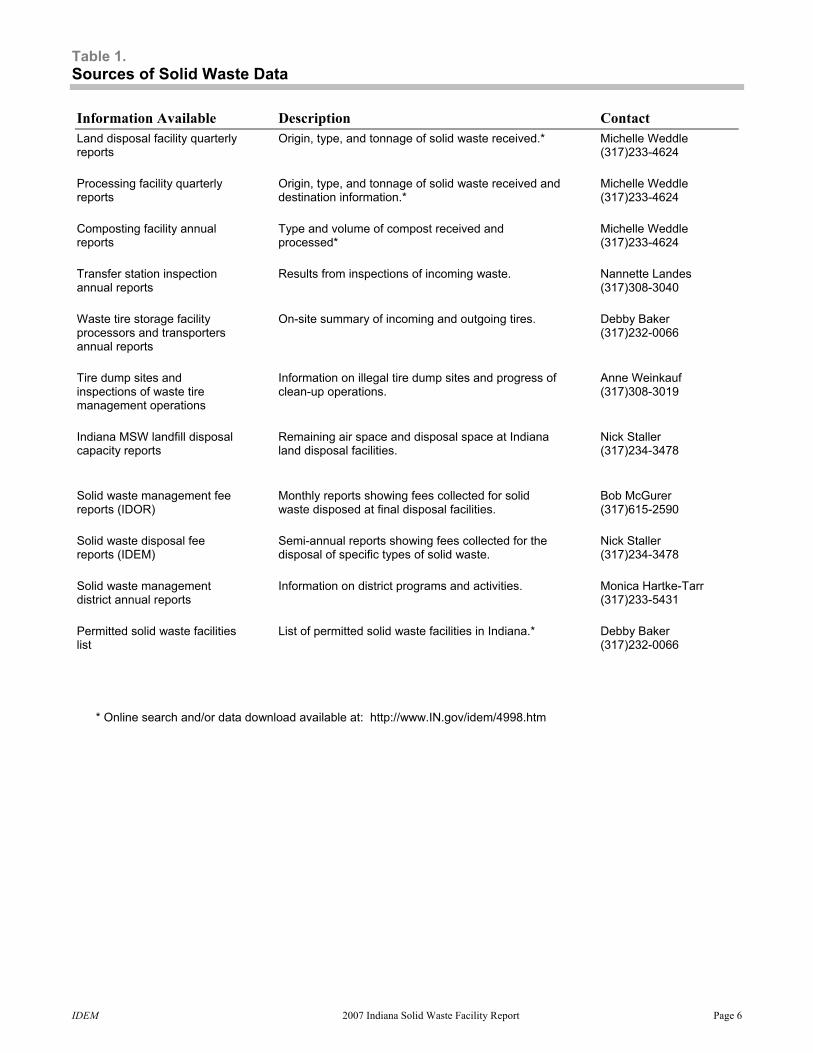
Table 1. Sources of Solid Waste Data
Information Available Description Contact Land disposal facility quarterly reports
Origin, type, and tonnage of solid waste received.* Michelle Weddle (317)233-4624
Processing facility quarterly reports
Origin, type, and tonnage of solid waste received and destination information.*
Michelle Weddle (317)233-4624
Composting facility annual reports
Type and volume of compost received and processed*
Michelle Weddle (317)233-4624
Transfer station inspection annual reports
Results from inspections of incoming waste. Nannette Landes (317)308-3040
Waste tire storage facility processors and transporters annual reports
On-site summary of incoming and outgoing tires. Debby Baker (317)232-0066
Tire dump sites and inspections of waste tire management operations
Information on illegal tire dump sites and progress of clean-up operations.
Anne Weinkauf (317)308-3019
Indiana MSW landfill disposal capacity reports
Remaining air space and disposal space at Indiana land disposal facilities.
Nick Staller (317)234-3478
Solid waste management fee reports (IDOR)
Monthly reports showing fees collected for solid waste disposed at final disposal facilities.
Bob McGurer (317)615-2590
Solid waste disposal fee reports (IDEM)
Semi-annual reports showing fees collected for the disposal of specific types of solid waste.
Nick Staller (317)234-3478
Solid waste management district annual reports
Information on district programs and activities. Monica Hartke-Tarr (317)233-5431
Permitted solid waste facilities list
List of permitted solid waste facilities in Indiana.* Debby Baker (317)232-0066
* Online search and/or data download available at: http://www.IN.gov/idem/4998.htm
IDEM 2007 Indiana Solid Waste Facility Report Page 7
Solid Waste Data Framework Several factors must be considered when discussing solid waste disposal in Indiana:
type and quantity of the waste disposed; type and ownership of the facility that
received the waste; and origin of the waste received.
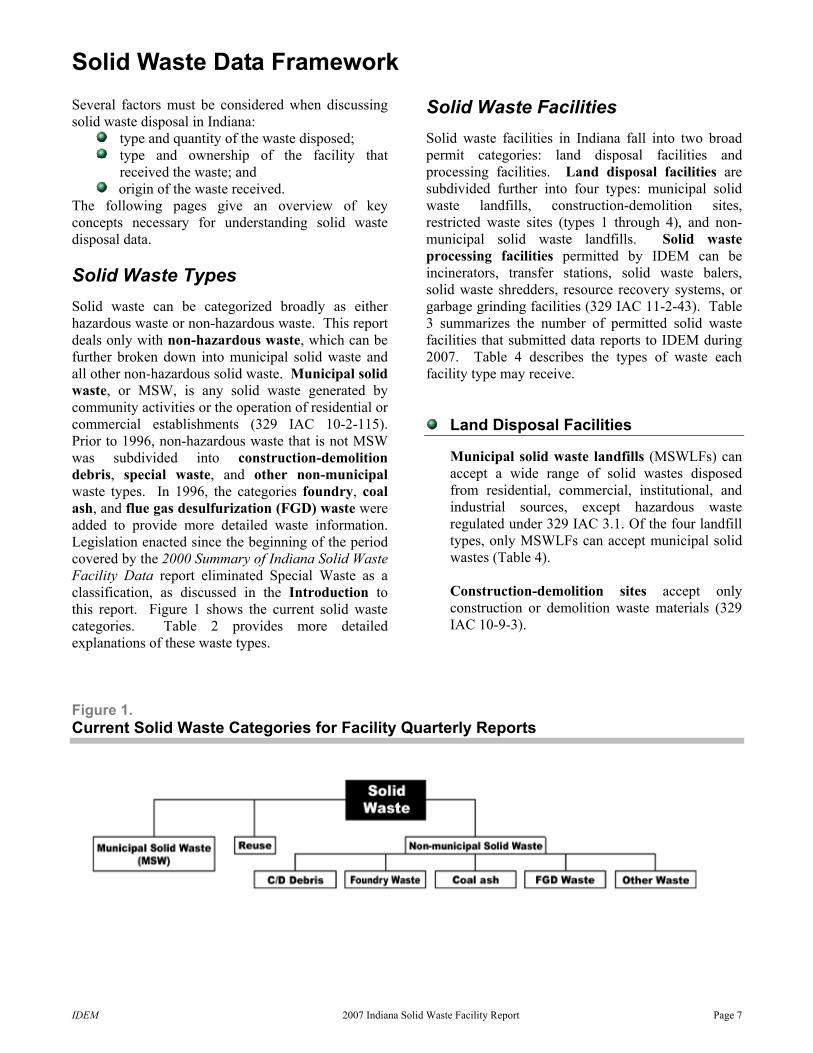
The following pages give an overview of key concepts necessary for understanding solid waste disposal data. Solid Waste Types Solid waste can be categorized broadly as either hazardous waste or non-hazardous waste. This report deals only with non-hazardous waste, which can be further broken down into municipal solid waste and all other non-hazardous solid waste. Municipal solid waste, or MSW, is any solid waste generated by community activities or the operation of residential or commercial establishments (329 IAC 10-2-115). Prior to 1996, non-hazardous waste that is not MSW was subdivided into construction-demolition debris, special waste, and other non-municipal waste types. In 1996, the categories foundry, coal ash, and flue gas desulfurization (FGD) waste were added to provide more detailed waste information. Legislation enacted since the beginning of the period covered by the 2000 Summary of Indiana Solid Waste Facility Data report eliminated Special Waste as a classification, as discussed in the Introduction to this report. Figure 1 shows the current solid waste categories. Table 2 provides more detailed explanations of these waste types.
Solid Waste Facilities Solid waste facilities in Indiana fall into two broad permit categories: land disposal facilities and processing facilities. Land disposal facilities are subdivided further into four types: municipal solid waste landfills, construction-demolition sites, restricted waste sites (types 1 through 4), and non-municipal solid waste landfills. Solid waste processing facilities permitted by IDEM can be incinerators, transfer stations, solid waste balers, solid waste shredders, resource recovery systems, or garbage grinding facilities (329 IAC 11-2-43). Table 3 summarizes the number of permitted solid waste facilities that submitted data reports to IDEM during 2007. Table 4 describes the types of waste each facility type may receive.
Land Disposal Facilities
Municipal solid waste landfills (MSWLFs) can accept a wide range of solid wastes disposed from residential, commercial, institutional, and industrial sources, except hazardous waste regulated under 329 IAC 3.1. Of the four landfill types, only MSWLFs can accept municipal solid wastes (Table 4). Construction-demolition sites accept only construction or demolition waste materials (329 IAC 10-9-3).
Figure 1. Current Solid Waste Categories for Facility Quarterly Reports
IDEM 2007 Indiana Solid Waste Facility Report Page 8
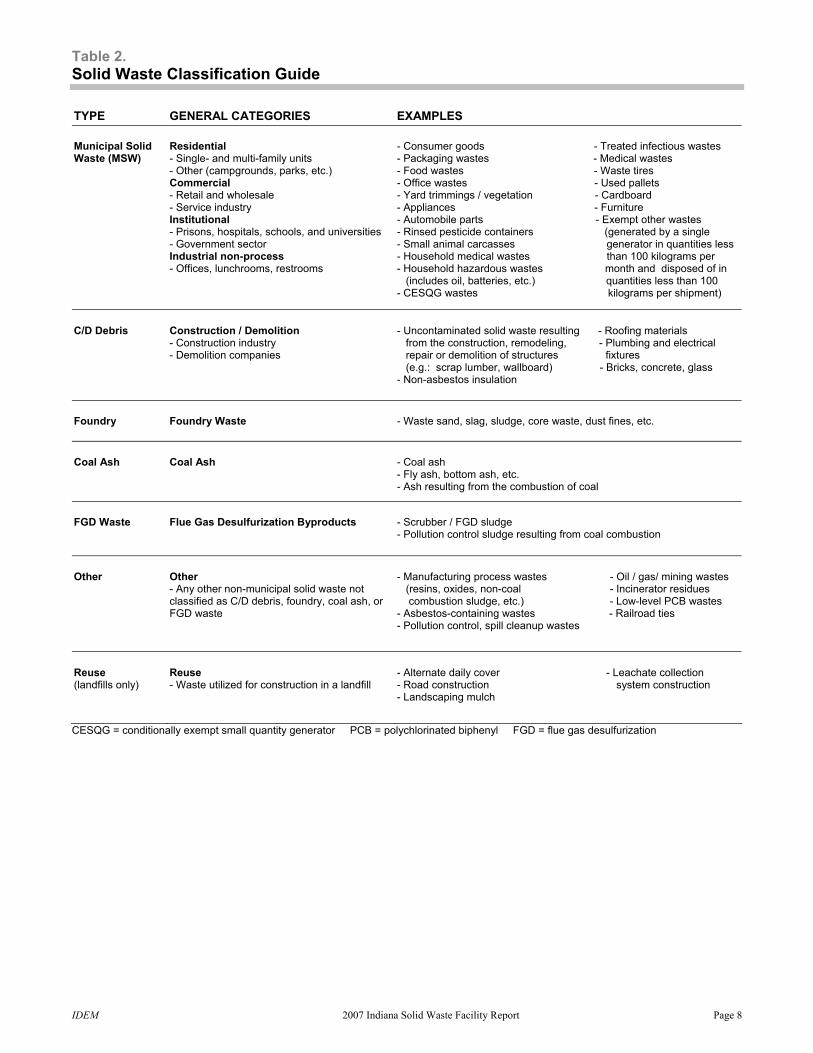
Table 2. Solid Waste Classification Guide TYPE GENERAL CATEGORIES EXAMPLES Municipal Solid Waste (MSW)
Residential - Single- and multi-family units - Other (campgrounds, parks, etc.) Commercial - Retail and wholesale - Service industry Institutional - Prisons, hospitals, schools, and universities - Government sector Industrial non-process - Offices, lunchrooms, restrooms
- Consumer goods - Treated infectious wastes - Packaging wastes - Medical wastes - Food wastes - Waste tires - Office wastes - Used pallets - Yard trimmings / vegetation - Cardboard - Appliances - Furniture - Automobile parts - Exempt other wastes - Rinsed pesticide containers (generated by a single - Small animal carcasses generator in quantities less - Household medical wastes than 100 kilograms per - Household hazardous wastes month and disposed of in (includes oil, batteries, etc.) quantities less than 100 - CESQG wastes kilograms per shipment)
C/D Debris
Construction / Demolition - Construction industry - Demolition companies
- Uncontaminated solid waste resulting - Roofing materials from the construction, remodeling, - Plumbing and electrical repair or demolition of structures fixtures (e.g.: scrap lumber, wallboard) - Bricks, concrete, glass - Non-asbestos insulation
Foundry Foundry Waste - Waste sand, slag, sludge, core waste, dust fines, etc.
Coal Ash
Coal Ash
- Coal ash - Fly ash, bottom ash, etc. - Ash resulting from the combustion of coal
FGD Waste
Flue Gas Desulfurization Byproducts
- Scrubber / FGD sludge - Pollution control sludge resulting from coal combustion
Other
Other - Any other non-municipal solid waste not classified as C/D debris, foundry, coal ash, or FGD waste
- Manufacturing process wastes - Oil / gas/ mining wastes (resins, oxides, non-coal - Incinerator residues combustion sludge, etc.) - Low-level PCB wastes - Asbestos-containing wastes - Railroad ties - Pollution control, spill cleanup wastes
Reuse (landfills only)
Reuse - Waste utilized for construction in a landfill
- Alternate daily cover - Leachate collection - Road construction system construction - Landscaping mulch
CESQG = conditionally exempt small quantity generator PCB = polychlorinated biphenyl FGD = flue gas desulfurization
IDEM 2007 Indiana Solid Waste Facility Report Page 9
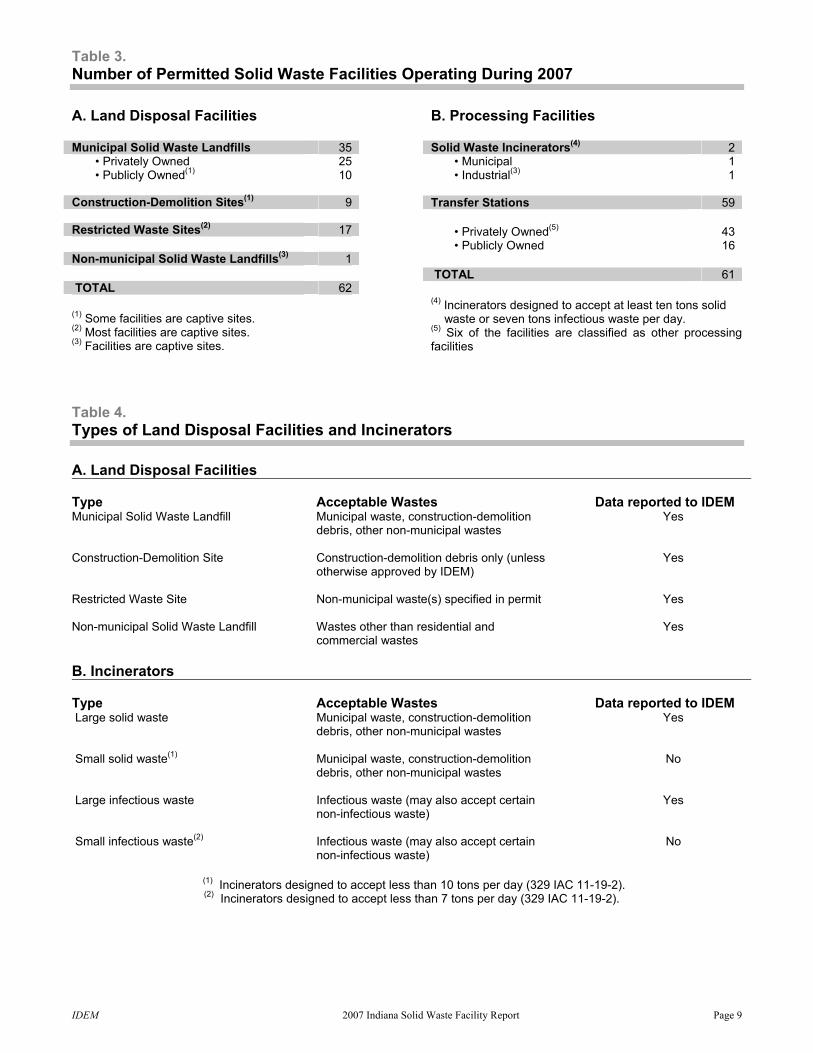
Table 3. Number of Permitted Solid Waste Facilities Operating During 2007 A. Land Disposal Facilities Municipal Solid Waste Landfills 35 • Privately Owned 25 • Publicly Owned(1) 10 Construction-Demolition Sites(1) 9 Restricted Waste Sites(2) 17 Non-municipal Solid Waste Landfills(3) 1 TOTAL 62 (1) Some facilities are captive sites. (2) Most facilities are captive sites. (3) Facilities are captive sites.
B. Processing Facilities Solid Waste Incinerators(4) 2 • Municipal 1 • Industrial(3) 1 Transfer Stations 59 • Privately Owned(5) 43 • Publicly Owned 16 TOTAL 61 (4) Incinerators designed to accept at least ten tons solid waste or seven tons infectious waste per day. (5) Six of the facilities are classified as other processing facilities
Table 4. Types of Land Disposal Facilities and Incinerators A. Land Disposal Facilities Type Acceptable Wastes Data reported to IDEM Municipal Solid Waste Landfill Municipal waste, construction-demolition Yes debris, other non-municipal wastes Construction-Demolition Site Construction-demolition debris only (unless Yes otherwise approved by IDEM) Restricted Waste Site Non-municipal waste(s) specified in permit Yes Non-municipal Solid Waste Landfill Wastes other than residential and Yes commercial wastes B. Incinerators Type Acceptable Wastes Data reported to IDEM Large solid waste Municipal waste, construction-demolition Yes debris, other non-municipal wastes Small solid waste(1) Municipal waste, construction-demolition No debris, other non-municipal wastes Large infectious waste Infectious waste (may also accept certain Yes non-infectious waste) Small infectious waste(2) Infectious waste (may also accept certain No non-infectious waste)
(1) Incinerators designed to accept less than 10 tons per day (329 IAC 11-19-2). (2) Incinerators designed to accept less than 7 tons per day (329 IAC 11-19-2).
IDEM 2007 Indiana Solid Waste Facility Report Page 10
Restricted waste sites can accept only materials specified in their landfill permits as determined by the classification criteria in 329 IAC 10-9-4. Coal combustion by-products comprise the largest portion of the waste tonnage disposed at restricted waste sites. Like restricted waste sites, non-municipal solid waste landfills can accept only materials specified in their landfill permits. But non-municipal solid waste landfills have more stringent design standards than restricted waste sites. Most of Indiana’s non-municipal solid waste landfills are currently captive facilities and therefore, are not available for public use. In addition to the facility standards discussed here, each individual site may dispose of other materials not included in the above definitions according to its permit.
Processing Facilities
The term incinerator is defined broadly as an engineered facility designed to burn solid waste under controlled conditions. As Table 4 shows, incinerators in Indiana are categorized and regulated as either solid waste incinerators or infectious waste incinerators. Solid waste incinerators with a design capacity of at least 10 tons per day and infectious waste incinerators with a design capacity of at least 7 tons per day must obtain a solid waste permit under Indiana solid waste rules 329 IAC 11-9 and 329 IAC 11-17. Other incinerators must notify IDEM and comply with certain operational requirements as stated in 329 IAC 11-19-2 and are deemed to be permitted. Although incinerators are permitted and regulated under the category of processing facilities, they are considered to be final disposal facilities for planning and disposal fee purposes, as evident in statutory language. The disposal reduction goal language of P.L. 10-1990 also categorizes incineration as a final disposal method. A transfer station is a facility at which solid waste is transferred from a vehicle or container to another vehicle or container for transportation purposes (329 IAC 11-2-47). Transfer stations may manage
materials in other ways according to their individual permits. For example, activities at a permitted transfer station may involve only the consolidation of waste loads for further transport, or may also incorporate some form of materials recovery, during which recyclables are segregated for recycling or reuse. Tire, paper, and medical waste processing sites also are defined as processing facilities by statute. In 2007, nine processing facilities were in operation during the year.
Accuracy of Facility Reports
IDEM conservatively estimates that municipal solid waste tonnages may be over-reported by 20 to 40 percent due to some loads of municipal solid waste being mixed with non-municipal solid waste but identified only as municipal solid waste. According to studies in other states, construction-demolition wastes alone can constitute as much as one-third of municipal solid waste. The portion of municipal solid waste that is actually other non-municipal waste is unknown. Because of these uncertainties, caution should be used when attempting to draw conclusions regarding exact amounts of particular waste types.
IDEM 2007 Indiana Solid Waste Facility Report Page 11
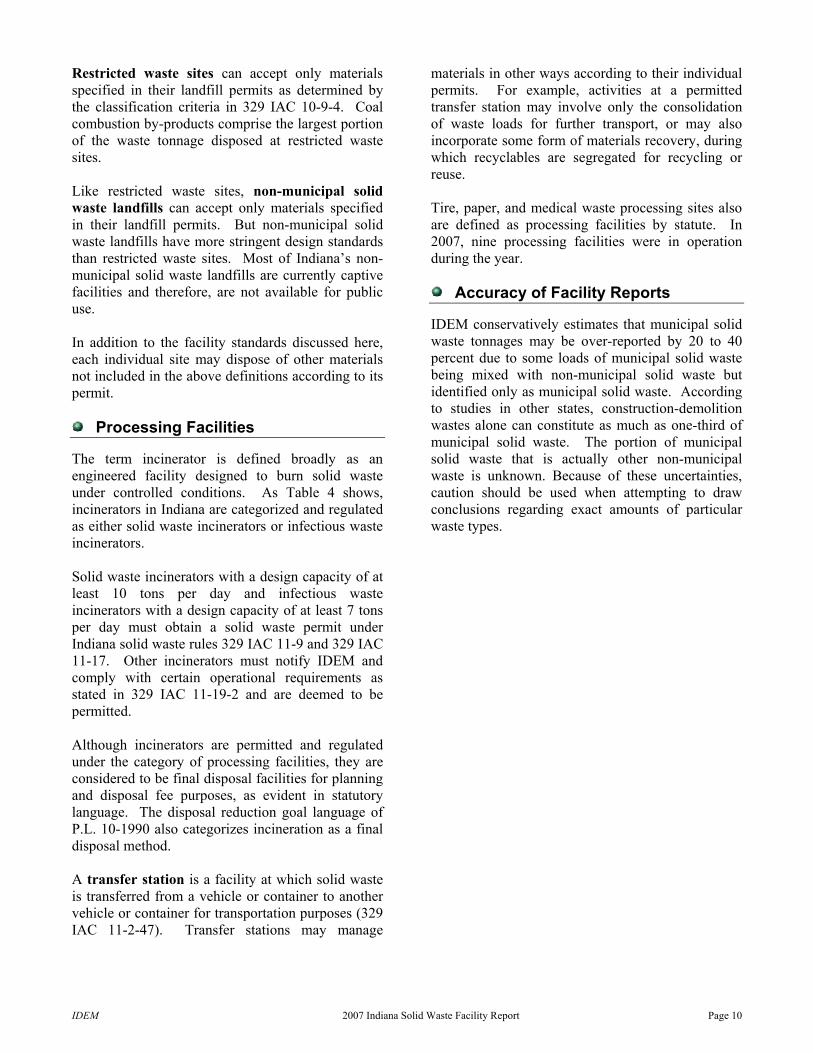
Municipal Solid Waste Landfill Ownership
Since the facility quarterly report program began in 1991, more of Indiana MSW landfills have been owned privately than owned publicly (Table 3). Figure 2 shows the percentages of private and public ownership of MSW landfills in 2007. Most construction-demolition sites and restricted waste sites are privately owned. About seventy-seven percent of Indiana’s transfer stations and other permitted processing facilities are privately owned. Figure 2. Municipal Solid Waste Landfill Ownership by Percent During 2007
Public29%
Private71%
Note: For 2007, there are 10 publicly owned facilities and 25 privately owned facilities.
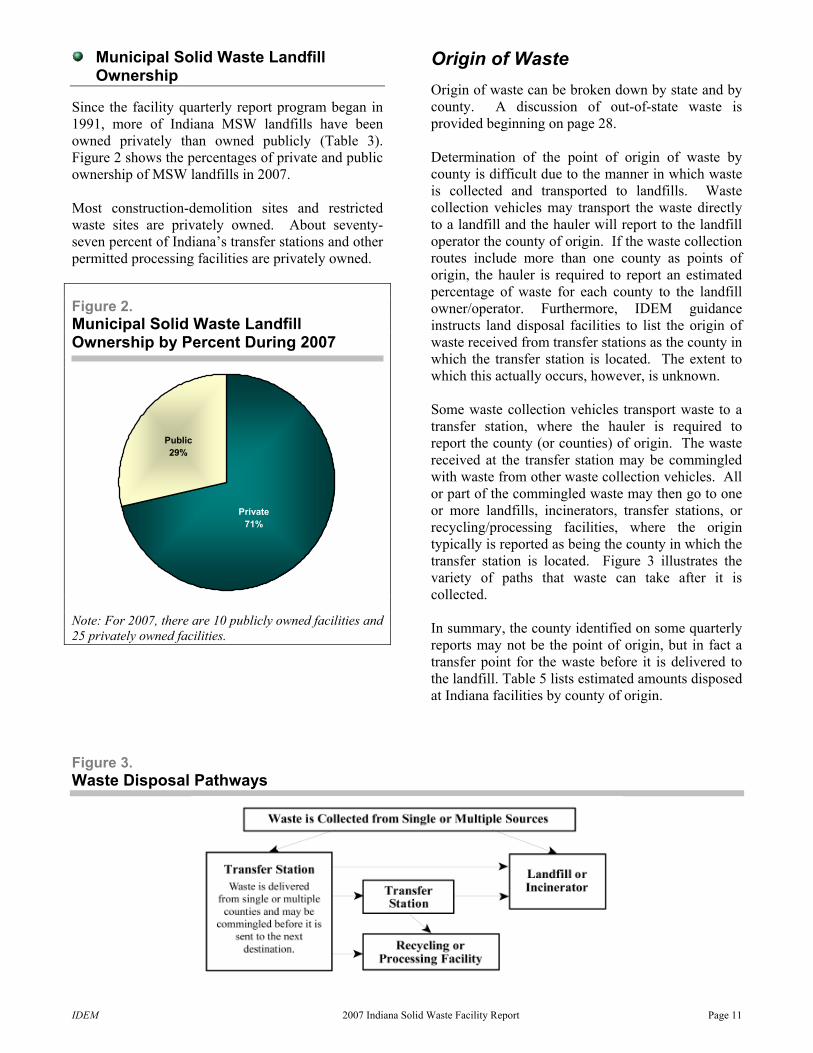
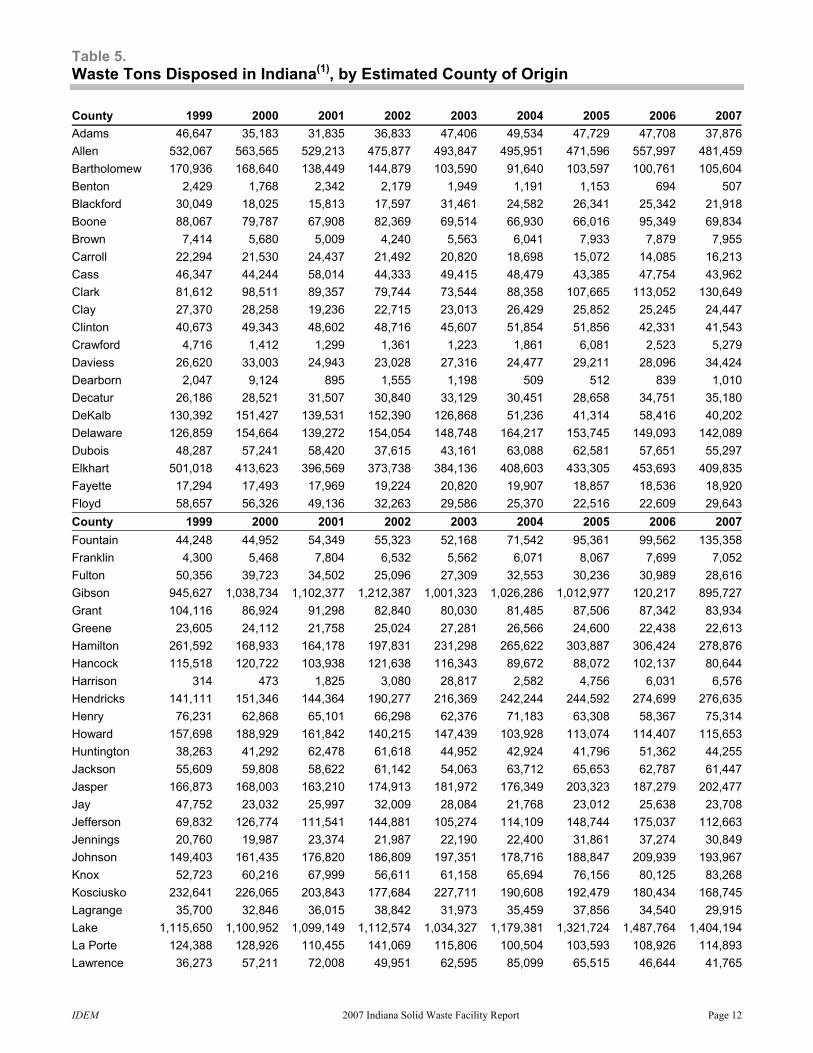
Origin of Waste Origin of waste can be broken down by state and by county. A discussion of out-of-state waste is provided beginning on page 28. Determination of the point of origin of waste by county is difficult due to the manner in which waste is collected and transported to landfills. Waste collection vehicles may transport the waste directly to a landfill and the hauler will report to the landfill operator the county of origin. If the waste collection routes include more than one county as points of origin, the hauler is required to report an estimated percentage of waste for each county to the landfill owner/operator. Furthermore, IDEM guidance instructs land disposal facilities to list the origin of waste received from transfer stations as the county in which the transfer station is located. The extent to which this actually occurs, however, is unknown. Some waste collection vehicles transport waste to a transfer station, where the hauler is required to report the county (or counties) of origin. The waste received at the transfer station may be commingled with waste from other waste collection vehicles. All or part of the commingled waste may then go to one or more landfills, incinerators, transfer stations, or recycling/processing facilities, where the origin typically is reported as being the county in which the transfer station is located. Figure 3 illustrates the variety of paths that waste can take after it is collected. In summary, the county identified on some quarterly reports may not be the point of origin, but in fact a transfer point for the waste before it is delivered to the landfill. Table 5 lists estimated amounts disposed at Indiana facilities by county of origin.
Figure 3. Waste Disposal Pathways
IDEM 2007 Indiana Solid Waste Facility Report Page 12
Table 5. Waste Tons Disposed in Indiana(1), by Estimated County of Origin County 1999 2000 2001 2002 2003 2004 2005 2006 2007Adams 46,647 35,183 31,835 36,833 47,406 49,534 47,729 47,708 37,876Allen 532,067 563,565 529,213 475,877 493,847 495,951 471,596 557,997 481,459Bartholomew 170,936 168,640 138,449 144,879 103,590 91,640 103,597 100,761 105,604Benton 2,429 1,768 2,342 2,179 1,949 1,191 1,153 694 507Blackford 30,049 18,025 15,813 17,597 31,461 24,582 26,341 25,342 21,918Boone 88,067 79,787 67,908 82,369 69,514 66,930 66,016 95,349 69,834Brown 7,414 5,680 5,009 4,240 5,563 6,041 7,933 7,879 7,955Carroll 22,294 21,530 24,437 21,492 20,820 18,698 15,072 14,085 16,213Cass 46,347 44,244 58,014 44,333 49,415 48,479 43,385 47,754 43,962Clark 81,612 98,511 89,357 79,744 73,544 88,358 107,665 113,052 130,649Clay 27,370 28,258 19,236 22,715 23,013 26,429 25,852 25,245 24,447Clinton 40,673 49,343 48,602 48,716 45,607 51,854 51,856 42,331 41,543Crawford 4,716 1,412 1,299 1,361 1,223 1,861 6,081 2,523 5,279Daviess 26,620 33,003 24,943 23,028 27,316 24,477 29,211 28,096 34,424Dearborn 2,047 9,124 895 1,555 1,198 509 512 839 1,010Decatur 26,186 28,521 31,507 30,840 33,129 30,451 28,658 34,751 35,180DeKalb 130,392 151,427 139,531 152,390 126,868 51,236 41,314 58,416 40,202Delaware 126,859 154,664 139,272 154,054 148,748 164,217 153,745 149,093 142,089Dubois 48,287 57,241 58,420 37,615 43,161 63,088 62,581 57,651 55,297Elkhart 501,018 413,623 396,569 373,738 384,136 408,603 433,305 453,693 409,835Fayette 17,294 17,493 17,969 19,224 20,820 19,907 18,857 18,536 18,920Floyd 58,657 56,326 49,136 32,263 29,586 25,370 22,516 22,609 29,643County 1999 2000 2001 2002 2003 2004 2005 2006 2007Fountain 44,248 44,952 54,349 55,323 52,168 71,542 95,361 99,562 135,358Franklin 4,300 5,468 7,804 6,532 5,562 6,071 8,067 7,699 7,052Fulton 50,356 39,723 34,502 25,096 27,309 32,553 30,236 30,989 28,616Gibson 945,627 1,038,734 1,102,377 1,212,387 1,001,323 1,026,286 1,012,977 120,217 895,727Grant 104,116 86,924 91,298 82,840 80,030 81,485 87,506 87,342 83,934Greene 23,605 24,112 21,758 25,024 27,281 26,566 24,600 22,438 22,613Hamilton 261,592 168,933 164,178 197,831 231,298 265,622 303,887 306,424 278,876Hancock 115,518 120,722 103,938 121,638 116,343 89,672 88,072 102,137 80,644Harrison 314 473 1,825 3,080 28,817 2,582 4,756 6,031 6,576Hendricks 141,111 151,346 144,364 190,277 216,369 242,244 244,592 274,699 276,635Henry 76,231 62,868 65,101 66,298 62,376 71,183 63,308 58,367 75,314Howard 157,698 188,929 161,842 140,215 147,439 103,928 113,074 114,407 115,653Huntington 38,263 41,292 62,478 61,618 44,952 42,924 41,796 51,362 44,255Jackson 55,609 59,808 58,622 61,142 54,063 63,712 65,653 62,787 61,447Jasper 166,873 168,003 163,210 174,913 181,972 176,349 203,323 187,279 202,477Jay 47,752 23,032 25,997 32,009 28,084 21,768 23,012 25,638 23,708Jefferson 69,832 126,774 111,541 144,881 105,274 114,109 148,744 175,037 112,663Jennings 20,760 19,987 23,374 21,987 22,190 22,400 31,861 37,274 30,849Johnson 149,403 161,435 176,820 186,809 197,351 178,716 188,847 209,939 193,967Knox 52,723 60,216 67,999 56,611 61,158 65,694 76,156 80,125 83,268Kosciusko 232,641 226,065 203,843 177,684 227,711 190,608 192,479 180,434 168,745Lagrange 35,700 32,846 36,015 38,842 31,973 35,459 37,856 34,540 29,915Lake 1,115,650 1,100,952 1,099,149 1,112,574 1,034,327 1,179,381 1,321,724 1,487,764 1,404,194La Porte 124,388 128,926 110,455 141,069 115,806 100,504 103,593 108,926 114,893Lawrence 36,273 57,211 72,008 49,951 62,595 85,099 65,515 46,644 41,765
IDEM 2007 Indiana Solid Waste Facility Report Page 13
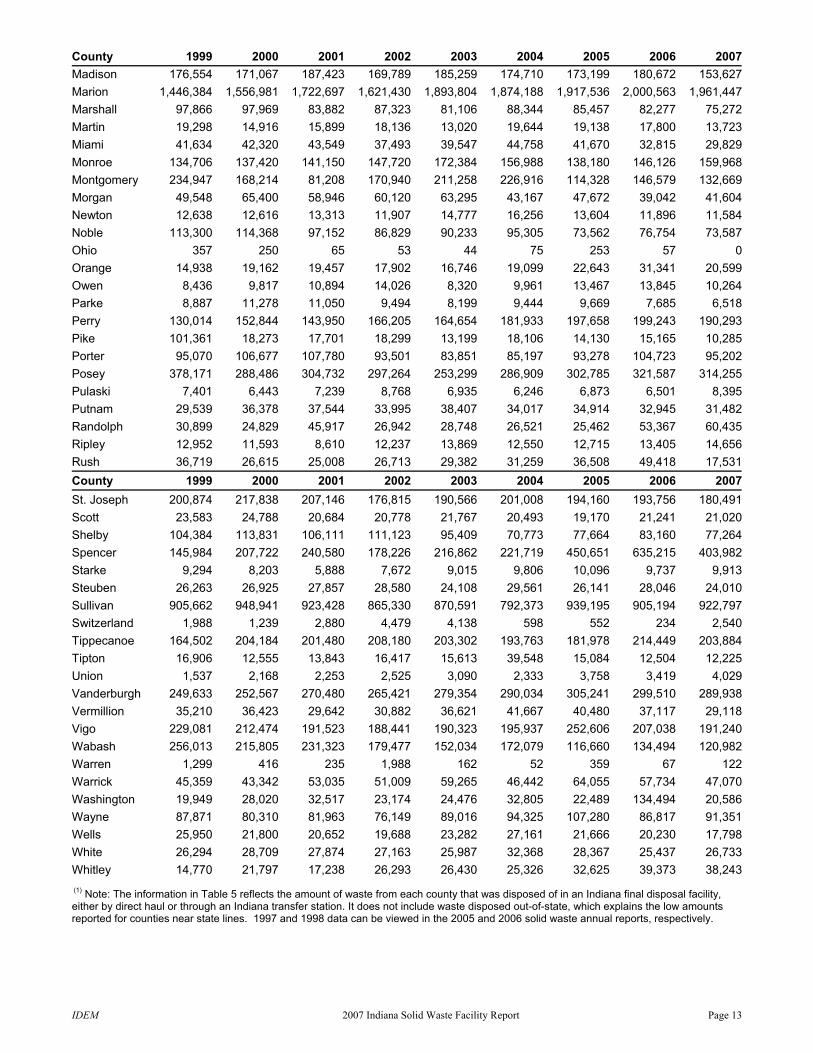
County 1999 2000 2001 2002 2003 2004 2005 2006 2007Madison 176,554 171,067 187,423 169,789 185,259 174,710 173,199 180,672 153,627Marion 1,446,384 1,556,981 1,722,697 1,621,430 1,893,804 1,874,188 1,917,536 2,000,563 1,961,447Marshall 97,866 97,969 83,882 87,323 81,106 88,344 85,457 82,277 75,272Martin 19,298 14,916 15,899 18,136 13,020 19,644 19,138 17,800 13,723Miami 41,634 42,320 43,549 37,493 39,547 44,758 41,670 32,815 29,829Monroe 134,706 137,420 141,150 147,720 172,384 156,988 138,180 146,126 159,968Montgomery 234,947 168,214 81,208 170,940 211,258 226,916 114,328 146,579 132,669Morgan 49,548 65,400 58,946 60,120 63,295 43,167 47,672 39,042 41,604Newton 12,638 12,616 13,313 11,907 14,777 16,256 13,604 11,896 11,584Noble 113,300 114,368 97,152 86,829 90,233 95,305 73,562 76,754 73,587Ohio 357 250 65 53 44 75 253 57 0Orange 14,938 19,162 19,457 17,902 16,746 19,099 22,643 31,341 20,599Owen 8,436 9,817 10,894 14,026 8,320 9,961 13,467 13,845 10,264Parke 8,887 11,278 11,050 9,494 8,199 9,444 9,669 7,685 6,518Perry 130,014 152,844 143,950 166,205 164,654 181,933 197,658 199,243 190,293Pike 101,361 18,273 17,701 18,299 13,199 18,106 14,130 15,165 10,285Porter 95,070 106,677 107,780 93,501 83,851 85,197 93,278 104,723 95,202Posey 378,171 288,486 304,732 297,264 253,299 286,909 302,785 321,587 314,255Pulaski 7,401 6,443 7,239 8,768 6,935 6,246 6,873 6,501 8,395Putnam 29,539 36,378 37,544 33,995 38,407 34,017 34,914 32,945 31,482Randolph 30,899 24,829 45,917 26,942 28,748 26,521 25,462 53,367 60,435Ripley 12,952 11,593 8,610 12,237 13,869 12,550 12,715 13,405 14,656Rush 36,719 26,615 25,008 26,713 29,382 31,259 36,508 49,418 17,531County 1999 2000 2001 2002 2003 2004 2005 2006 2007St. Joseph 200,874 217,838 207,146 176,815 190,566 201,008 194,160 193,756 180,491Scott 23,583 24,788 20,684 20,778 21,767 20,493 19,170 21,241 21,020Shelby 104,384 113,831 106,111 111,123 95,409 70,773 77,664 83,160 77,264Spencer 145,984 207,722 240,580 178,226 216,862 221,719 450,651 635,215 403,982Starke 9,294 8,203 5,888 7,672 9,015 9,806 10,096 9,737 9,913Steuben 26,263 26,925 27,857 28,580 24,108 29,561 26,141 28,046 24,010Sullivan 905,662 948,941 923,428 865,330 870,591 792,373 939,195 905,194 922,797Switzerland 1,988 1,239 2,880 4,479 4,138 598 552 234 2,540Tippecanoe 164,502 204,184 201,480 208,180 203,302 193,763 181,978 214,449 203,884Tipton 16,906 12,555 13,843 16,417 15,613 39,548 15,084 12,504 12,225Union 1,537 2,168 2,253 2,525 3,090 2,333 3,758 3,419 4,029Vanderburgh 249,633 252,567 270,480 265,421 279,354 290,034 305,241 299,510 289,938Vermillion 35,210 36,423 29,642 30,882 36,621 41,667 40,480 37,117 29,118Vigo 229,081 212,474 191,523 188,441 190,323 195,937 252,606 207,038 191,240Wabash 256,013 215,805 231,323 179,477 152,034 172,079 116,660 134,494 120,982Warren 1,299 416 235 1,988 162 52 359 67 122Warrick 45,359 43,342 53,035 51,009 59,265 46,442 64,055 57,734 47,070Washington 19,949 28,020 32,517 23,174 24,476 32,805 22,489 134,494 20,586Wayne 87,871 80,310 81,963 76,149 89,016 94,325 107,280 86,817 91,351Wells 25,950 21,800 20,652 19,688 23,282 27,161 21,666 20,230 17,798White 26,294 28,709 27,874 27,163 25,987 32,368 28,367 25,437 26,733Whitley 14,770 21,797 17,238 26,293 26,430 25,326 32,625 39,373 38,243 (1) Note: The information in Table 5 reflects the amount of waste from each county that was disposed of in an Indiana final disposal facility, either by direct haul or through an Indiana transfer station. It does not include waste disposed out-of-state, which explains the low amounts reported for counties near state lines. 1997 and 1998 data can be viewed in the 2005 and 2006 solid waste annual reports, respectively.
IDEM 2007 Indiana Solid Waste Facility Report Page 14
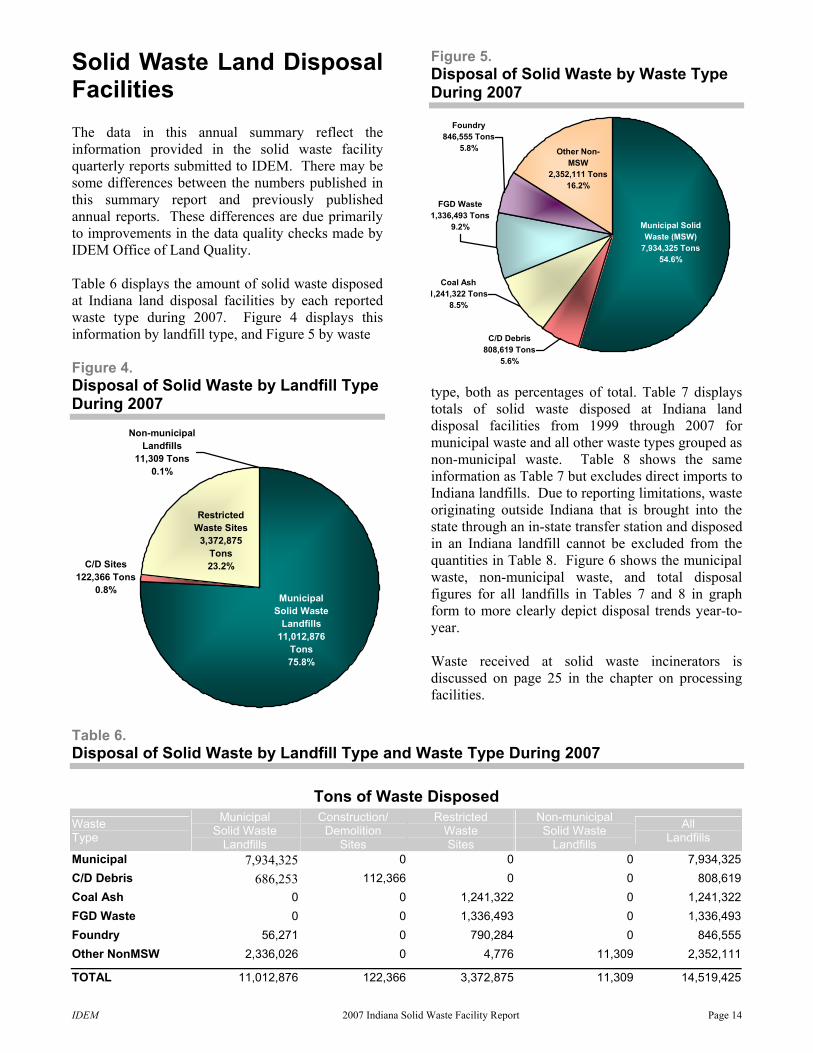
Solid Waste Land Disposal Facilities The data in this annual summary reflect the information provided in the solid waste facility quarterly reports submitted to IDEM. There may be some differences between the numbers published in this summary report and previously published annual reports. These differences are due primarily to improvements in the data quality checks made by IDEM Office of Land Quality. Table 6 displays the amount of solid waste disposed at Indiana land disposal facilities by each reported waste type during 2007. Figure 4 displays this information by landfill type, and Figure 5 by waste Figure 4. Disposal of Solid Waste by Landfill Type During 2007
Municipal Solid Waste
Landfills11,012,876
Tons75.8%
Non-municipal Landfills
11,309 Tons0.1%
Restricted Waste Sites
3,372,875 Tons23.2%C/D Sites
122,366 Tons0.8%
Figure 5. Disposal of Solid Waste by Waste Type During 2007
Coal Ash1,241,322 Tons
8.5%
FGD Waste 1,336,493 Tons
9.2% Municipal Solid Waste (MSW)
7,934,325 Tons54.6%
Other Non-MSW
2,352,111 Tons16.2%
C/D Debris808,619 Tons
5.6%
Foundry846,555 Tons
5.8%
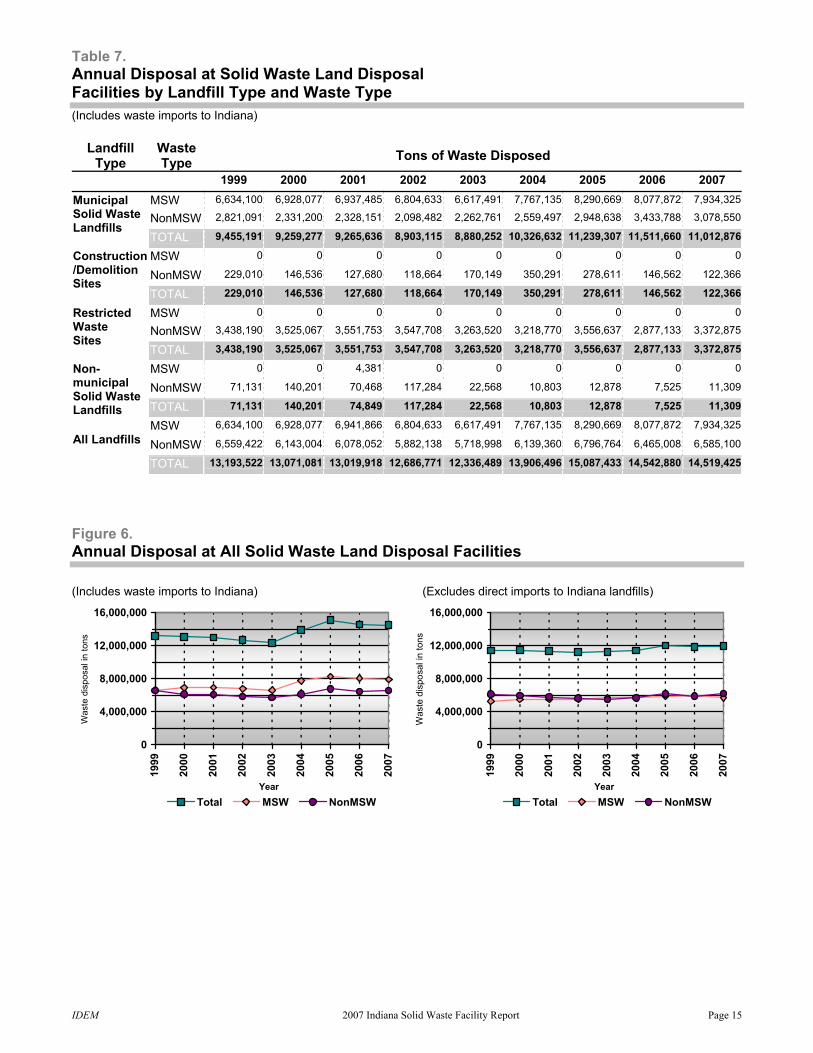
type, both as percentages of total. Table 7 displays totals of solid waste disposed at Indiana land disposal facilities from 1999 through 2007 for municipal waste and all other waste types grouped as non-municipal waste. Table 8 shows the same information as Table 7 but excludes direct imports to Indiana landfills. Due to reporting limitations, waste originating outside Indiana that is brought into the state through an in-state transfer station and disposed in an Indiana landfill cannot be excluded from the quantities in Table 8. Figure 6 shows the municipal waste, non-municipal waste, and total disposal figures for all landfills in Tables 7 and 8 in graph form to more clearly depict disposal trends year-to-year. Waste received at solid waste incinerators is discussed on page 25 in the chapter on processing facilities.
Table 6. Disposal of Solid Waste by Landfill Type and Waste Type During 2007
Tons of Waste Disposed Waste Type
Municipal Solid Waste
Landfills
Construction/ Demolition
Sites
Restricted Waste Sites
Non-municipal Solid Waste
Landfills
All Landfills
Municipal 7,934,325 0 0 0 7,934,325C/D Debris 686,253 112,366 0 0 808,619Coal Ash 0 0 1,241,322 0 1,241,322FGD Waste 0 0 1,336,493 0 1,336,493Foundry 56,271 0 790,284 0 846,555Other NonMSW 2,336,026 0 4,776 11,309 2,352,111
TOTAL 11,012,876 122,366 3,372,875 11,309 14,519,425
IDEM 2007 Indiana Solid Waste Facility Report Page 15
Table 7. Annual Disposal at Solid Waste Land Disposal Facilities by Landfill Type and Waste Type (Includes waste imports to Indiana)
Landfill Type
Waste Type Tons of Waste Disposed
1999 2000 2001 2002 2003 2004 2005 2006 2007 MSW 6,634,100 6,928,077 6,937,485 6,804,633 6,617,491 7,767,135 8,290,669 8,077,872 7,934,325
NonMSW 2,821,091 2,331,200 2,328,151 2,098,482 2,262,761 2,559,497 2,948,638 3,433,788 3,078,550Municipal Solid Waste Landfills
TOTAL 9,455,191 9,259,277 9,265,636 8,903,115 8,880,252 10,326,632 11,239,307 11,511,660 11,012,876
MSW 0 0 0 0 0 0 0 0 0
NonMSW 229,010 146,536 127,680 118,664 170,149 350,291 278,611 146,562 122,366
Construction/Demolition Sites
TOTAL 229,010 146,536 127,680 118,664 170,149 350,291 278,611 146,562 122,366
MSW 0 0 0 0 0 0 0 0 0
NonMSW 3,438,190 3,525,067 3,551,753 3,547,708 3,263,520 3,218,770 3,556,637 2,877,133 3,372,875Restricted Waste Sites
TOTAL 3,438,190 3,525,067 3,551,753 3,547,708 3,263,520 3,218,770 3,556,637 2,877,133 3,372,875
MSW 0 0 4,381 0 0 0 0 0 0
NonMSW 71,131 140,201 70,468 117,284 22,568 10,803 12,878 7,525 11,309
Non-municipal Solid Waste Landfills TOTAL 71,131 140,201 74,849 117,284 22,568 10,803 12,878 7,525 11,309
MSW 6,634,100 6,928,077 6,941,866 6,804,633 6,617,491 7,767,135 8,290,669 8,077,872 7,934,325
NonMSW 6,559,422 6,143,004 6,078,052 5,882,138 5,718,998 6,139,360 6,796,764 6,465,008 6,585,100
All Landfills
TOTAL 13,193,522 13,071,081 13,019,918 12,686,771 12,336,489 13,906,496 15,087,433 14,542,880 14,519,425
Figure 6. Annual Disposal at All Solid Waste Land Disposal Facilities (Includes waste imports to Indiana) (Excludes direct imports to Indiana landfills)
0
4,000,000
8,000,000
12,000,000
16,000,000
1999
2000
2001
2002
2003
2004
2005
2006
2007
Year
Was
te d
ispo
sal i
n to
ns
Total MSW NonMSW
0
4,000,000
8,000,000
12,000,000
16,000,000
1999
2000
2001
2002
2003
2004
2005
2006
2007
Year
Was
te d
ispo
sal i
n to
ns
Total MSW NonMSW
IDEM 2007 Indiana Solid Waste Facility Report Page 16
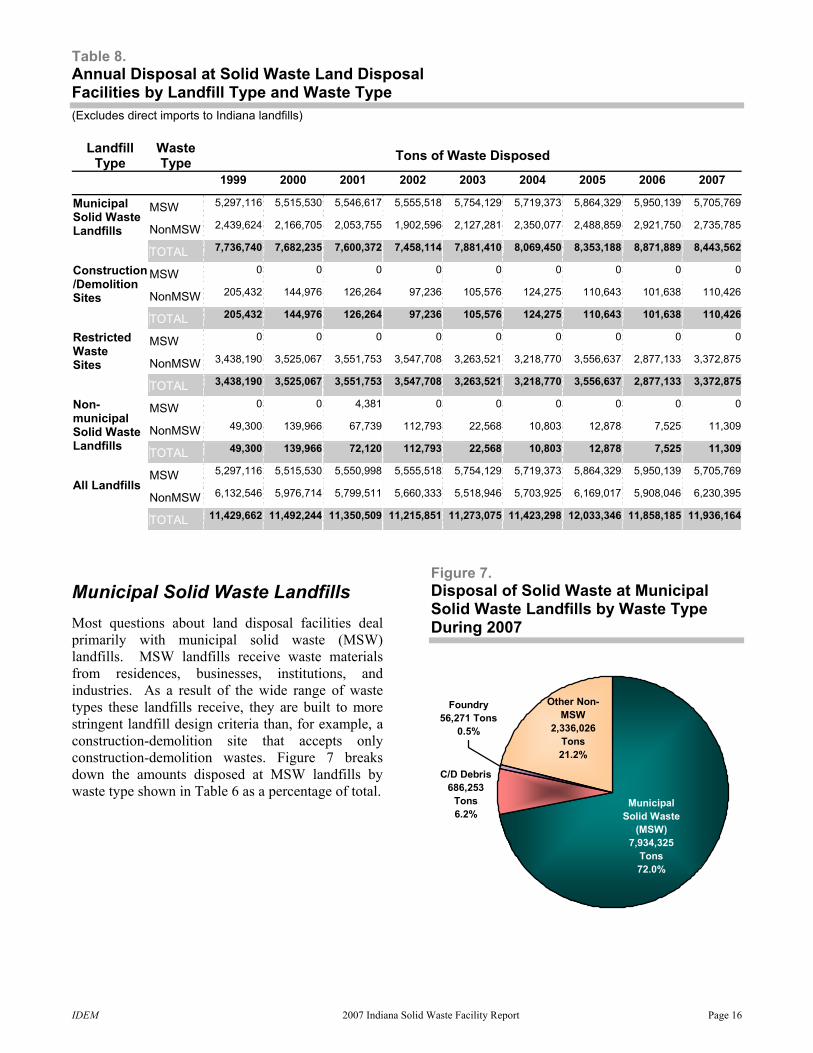
Table 8. Annual Disposal at Solid Waste Land Disposal Facilities by Landfill Type and Waste Type (Excludes direct imports to Indiana landfills)
Landfill Type
Waste Type Tons of Waste Disposed
1999 2000 2001 2002 2003 2004 2005 2006 2007
MSW 5,297,116 5,515,530 5,546,617 5,555,518 5,754,129 5,719,373 5,864,329 5,950,139 5,705,769
NonMSW 2,439,624 2,166,705 2,053,755 1,902,596 2,127,281 2,350,077 2,488,859 2,921,750 2,735,785
Municipal Solid Waste Landfills
TOTAL 7,736,740 7,682,235 7,600,372 7,458,114 7,881,410 8,069,450 8,353,188 8,871,889 8,443,562
MSW 0 0 0 0 0 0 0 0 0
NonMSW 205,432 144,976 126,264 97,236 105,576 124,275 110,643 101,638 110,426
Construction/Demolition Sites
TOTAL 205,432 144,976 126,264 97,236 105,576 124,275 110,643 101,638 110,426
MSW 0 0 0 0 0 0 0 0 0
NonMSW 3,438,190 3,525,067 3,551,753 3,547,708 3,263,521 3,218,770 3,556,637 2,877,133 3,372,875
Restricted Waste Sites
TOTAL 3,438,190 3,525,067 3,551,753 3,547,708 3,263,521 3,218,770 3,556,637 2,877,133 3,372,875
MSW 0 0 4,381 0 0 0 0 0 0
NonMSW 49,300 139,966 67,739 112,793 22,568 10,803 12,878 7,525 11,309
Non-municipal Solid Waste Landfills TOTAL 49,300 139,966 72,120 112,793 22,568 10,803 12,878 7,525 11,309
MSW 5,297,116 5,515,530 5,550,998 5,555,518 5,754,129 5,719,373 5,864,329 5,950,139 5,705,769
NonMSW 6,132,546 5,976,714 5,799,511 5,660,333 5,518,946 5,703,925 6,169,017 5,908,046 6,230,395
All Landfills
TOTAL 11,429,662 11,492,244 11,350,509 11,215,851 11,273,075 11,423,298 12,033,346 11,858,185 11,936,164
Municipal Solid Waste Landfills Most questions about land disposal facilities deal primarily with municipal solid waste (MSW) landfills. MSW landfills receive waste materials from residences, businesses, institutions, and industries. As a result of the wide range of waste types these landfills receive, they are built to more stringent landfill design criteria than, for example, a construction-demolition site that accepts only construction-demolition wastes. Figure 7 breaks down the amounts disposed at MSW landfills by waste type shown in Table 6 as a percentage of total.
Figure 7. Disposal of Solid Waste at Municipal Solid Waste Landfills by Waste Type During 2007
Municipal Solid Waste
(MSW)7,934,325
Tons72.0%
Other Non-MSW
2,336,026 Tons21.2%
Foundry56,271 Tons
0.5%
C/D Debris686,253
Tons6.2%
IDEM 2007 Indiana Solid Waste Facility Report Page 17
Figure 8. Annual Disposal at Municipal Solid Waste Landfills (Includes waste imports to Indiana) (Excludes direct imports to Indiana landfills)
0
4,000,000
8,000,000
12,000,000
16,000,000
1999
2000
2001
2002
2003
2004
2005
2006
2007
Year
Was
te d
ispo
sal i
n to
ns
Total MSW NonMSW
0
4,000,000
8,000,000
12,000,000
1999
2000
2001
2002
2003
2004
2005
2006
2007
Year
Was
te d
ispo
sal i
n to
ns
Total MSW NonMSW
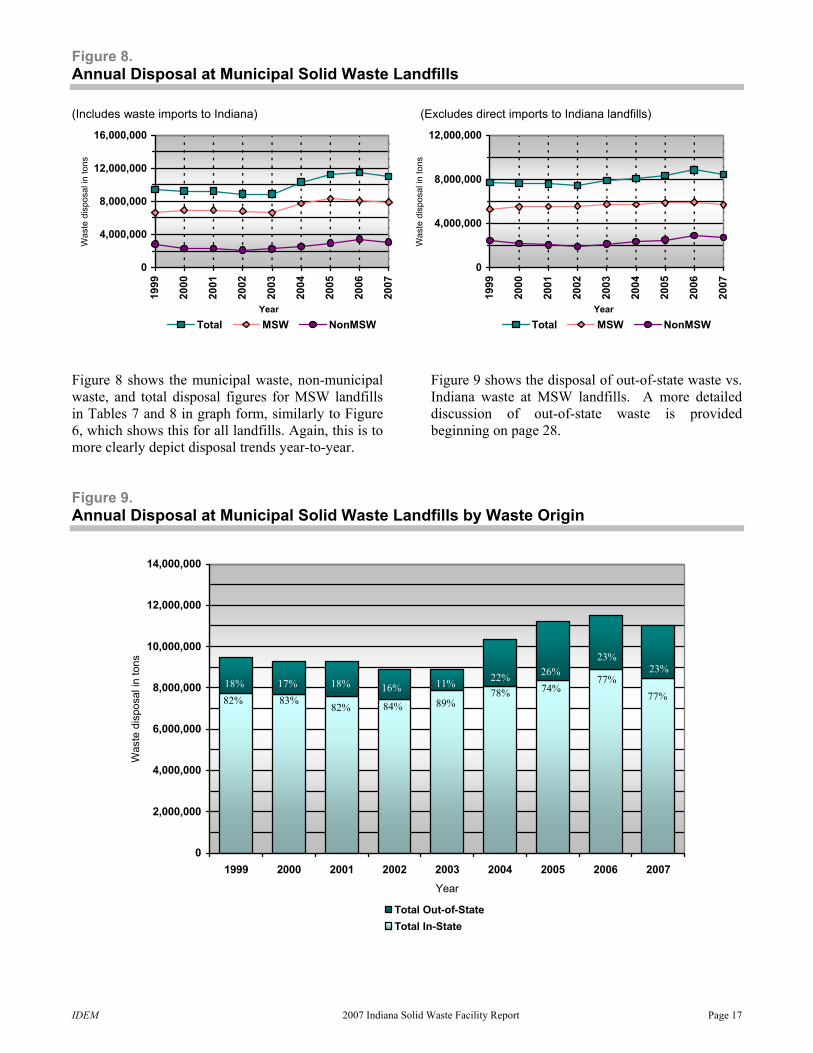
Figure 8 shows the municipal waste, non-municipal waste, and total disposal figures for MSW landfills in Tables 7 and 8 in graph form, similarly to Figure 6, which shows this for all landfills. Again, this is to more clearly depict disposal trends year-to-year.
Figure 9 shows the disposal of out-of-state waste vs. Indiana waste at MSW landfills. A more detailed discussion of out-of-state waste is provided beginning on page 28.
Figure 9. Annual Disposal at Municipal Solid Waste Landfills by Waste Origin
0
2,000,000
4,000,000
6,000,000
8,000,000
10,000,000
12,000,000
14,000,000
1999 2000 2001 2002 2003 2004 2005 2006 2007Year
Was
te d
ispo
sal i
n to
ns
Total Out-of-StateTotal In-State
23%
77%
82% 83% 82%
84%
89%
78% 74% 18% 17% 18%
16% 11%
22% 26%
23%
77%
IDEM 2007 Indiana Solid Waste Facility Report Page 18
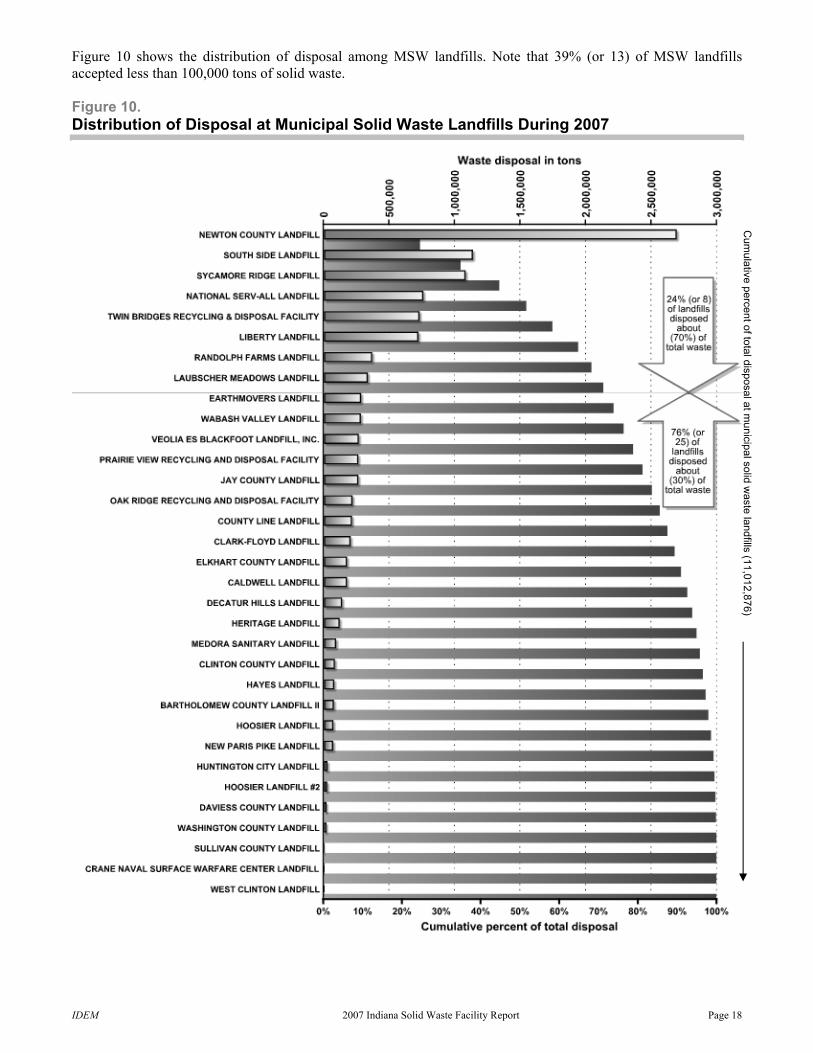
Figure 10 shows the distribution of disposal among MSW landfills. Note that 39% (or 13) of MSW landfills accepted less than 100,000 tons of solid waste. Figure 10. Distribution of Disposal at Municipal Solid Waste Landfills During 2007
Cum
ulative percent of total disposal at municipal solid w
aste landfills (11,012,876)
IDEM 2007 Indiana Solid Waste Facility Report Page 19
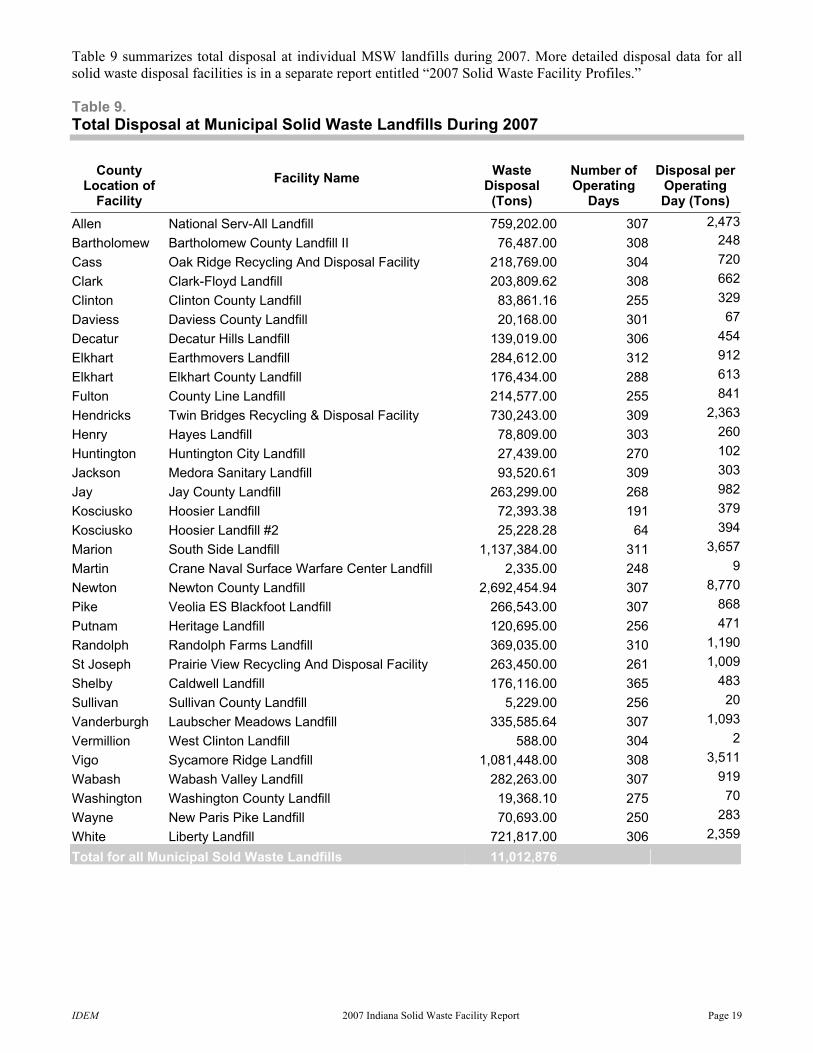
Table 9 summarizes total disposal at individual MSW landfills during 2007. More detailed disposal data for all solid waste disposal facilities is in a separate report entitled “2007 Solid Waste Facility Profiles.” Table 9. Total Disposal at Municipal Solid Waste Landfills During 2007
County Location of
Facility Facility Name
Waste
Disposal (Tons)
Number of Operating
Days
Disposal perOperating Day (Tons)
Allen National Serv-All Landfill 759,202.00 307 2,473Bartholomew Bartholomew County Landfill II 76,487.00 308 248Cass Oak Ridge Recycling And Disposal Facility 218,769.00 304 720Clark Clark-Floyd Landfill 203,809.62 308 662Clinton Clinton County Landfill 83,861.16 255 329Daviess Daviess County Landfill 20,168.00 301 67Decatur Decatur Hills Landfill 139,019.00 306 454Elkhart Earthmovers Landfill 284,612.00 312 912Elkhart Elkhart County Landfill 176,434.00 288 613Fulton County Line Landfill 214,577.00 255 841Hendricks Twin Bridges Recycling & Disposal Facility 730,243.00 309 2,363Henry Hayes Landfill 78,809.00 303 260Huntington Huntington City Landfill 27,439.00 270 102Jackson Medora Sanitary Landfill 93,520.61 309 303Jay Jay County Landfill 263,299.00 268 982Kosciusko Hoosier Landfill 72,393.38 191 379Kosciusko Hoosier Landfill #2 25,228.28 64 394Marion South Side Landfill 1,137,384.00 311 3,657Martin Crane Naval Surface Warfare Center Landfill 2,335.00 248 9Newton Newton County Landfill 2,692,454.94 307 8,770Pike Veolia ES Blackfoot Landfill 266,543.00 307 868Putnam Heritage Landfill 120,695.00 256 471Randolph Randolph Farms Landfill 369,035.00 310 1,190St Joseph Prairie View Recycling And Disposal Facility 263,450.00 261 1,009Shelby Caldwell Landfill 176,116.00 365 483Sullivan Sullivan County Landfill 5,229.00 256 20Vanderburgh Laubscher Meadows Landfill 335,585.64 307 1,093Vermillion West Clinton Landfill 588.00 304 2Vigo Sycamore Ridge Landfill 1,081,448.00 308 3,511Wabash Wabash Valley Landfill 282,263.00 307 919Washington Washington County Landfill 19,368.10 275 70Wayne New Paris Pike Landfill 70,693.00 250 283White Liberty Landfill 721,817.00 306 2,359
Total for all Municipal Sold Waste Landfills 11,012,876
IDEM 2007 Indiana Solid Waste Facility Report Page 20
Other Solid Waste Land Disposal Facilities
Construction-Demolition Sites
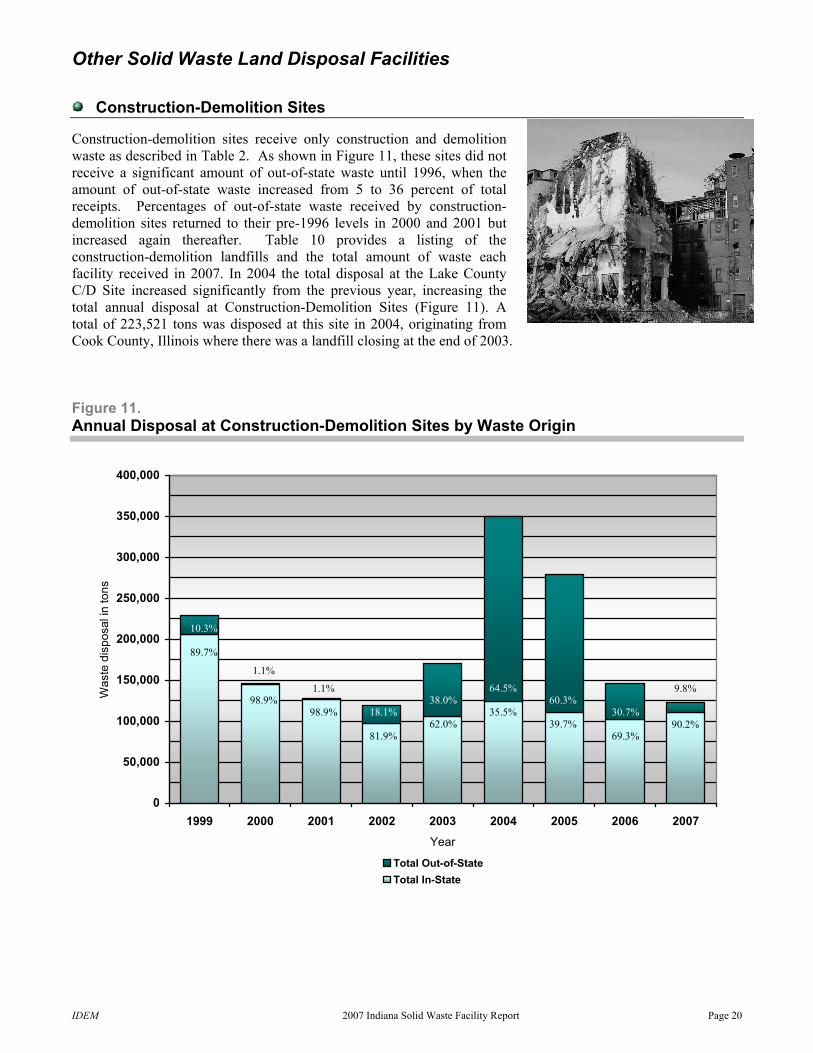
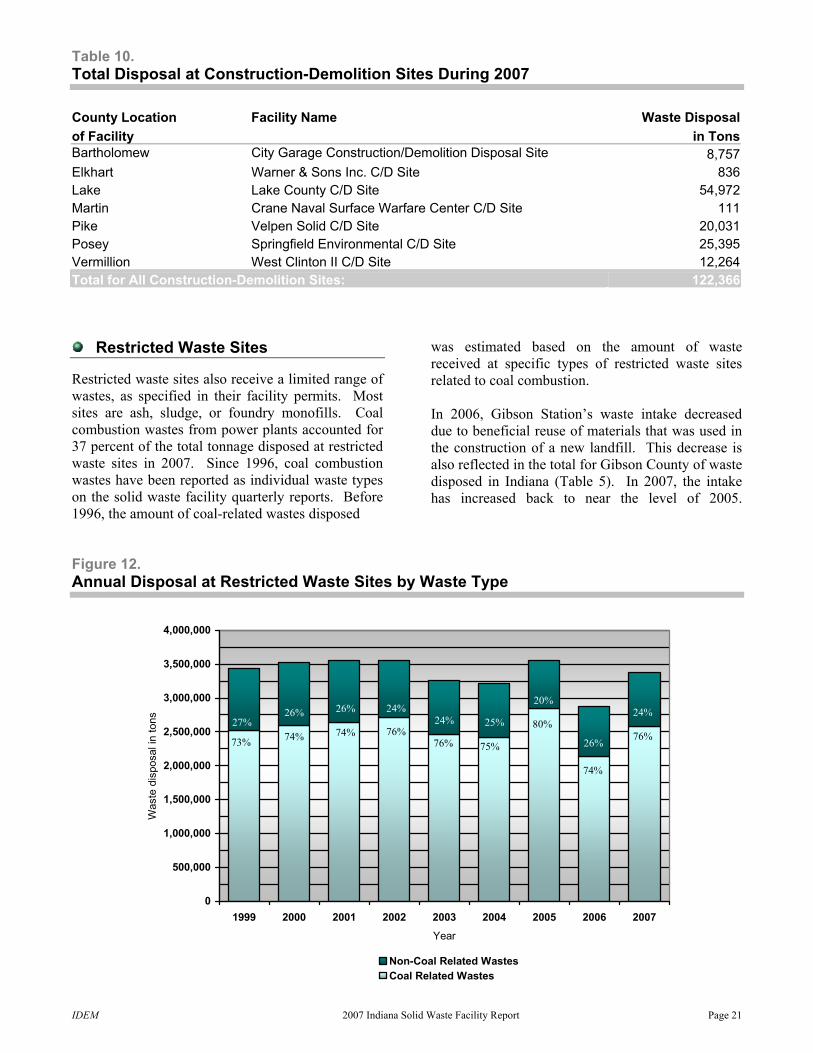
Construction-demolition sites receive only construction and demolition waste as described in Table 2. As shown in Figure 11, these sites did not receive a significant amount of out-of-state waste until 1996, when the amount of out-of-state waste increased from 5 to 36 percent of total receipts. Percentages of out-of-state waste received by construction-demolition sites returned to their pre-1996 levels in 2000 and 2001 but increased again thereafter. Table 10 provides a listing of the construction-demolition landfills and the total amount of waste each facility received in 2007. In 2004 the total disposal at the Lake County C/D Site increased significantly from the previous year, increasing the total annual disposal at Construction-Demolition Sites (Figure 11). A total of 223,521 tons was disposed at this site in 2004, originating from Cook County, Illinois where there was a landfill closing at the end of 2003. Figure 11. Annual Disposal at Construction-Demolition Sites by Waste Origin
0
50,000
100,000
150,000
200,000
250,000
300,000
350,000
400,000
1999 2000 2001 2002 2003 2004 2005 2006 2007Year
Was
te d
ispo
sal i
n to
ns
Total Out-of-StateTotal In-State
69.3%
89.7%
98.9%
81.9%
98.9% 62.0%
35.5% 39.7%
1.1%
1.1%
10.3%
30.7% 18.1% 38.0%
64.5% 60.3%
9.8%
90.2%
IDEM 2007 Indiana Solid Waste Facility Report Page 21
Table 10. Total Disposal at Construction-Demolition Sites During 2007 County Location Facility Name Waste Disposalof Facility in TonsBartholomew City Garage Construction/Demolition Disposal Site 8,757Elkhart Warner & Sons Inc. C/D Site 836Lake Lake County C/D Site 54,972Martin Crane Naval Surface Warfare Center C/D Site 111Pike Velpen Solid C/D Site 20,031Posey Springfield Environmental C/D Site 25,395Vermillion West Clinton II C/D Site 12,264Total for All Construction-Demolition Sites: 122,366
Restricted Waste Sites
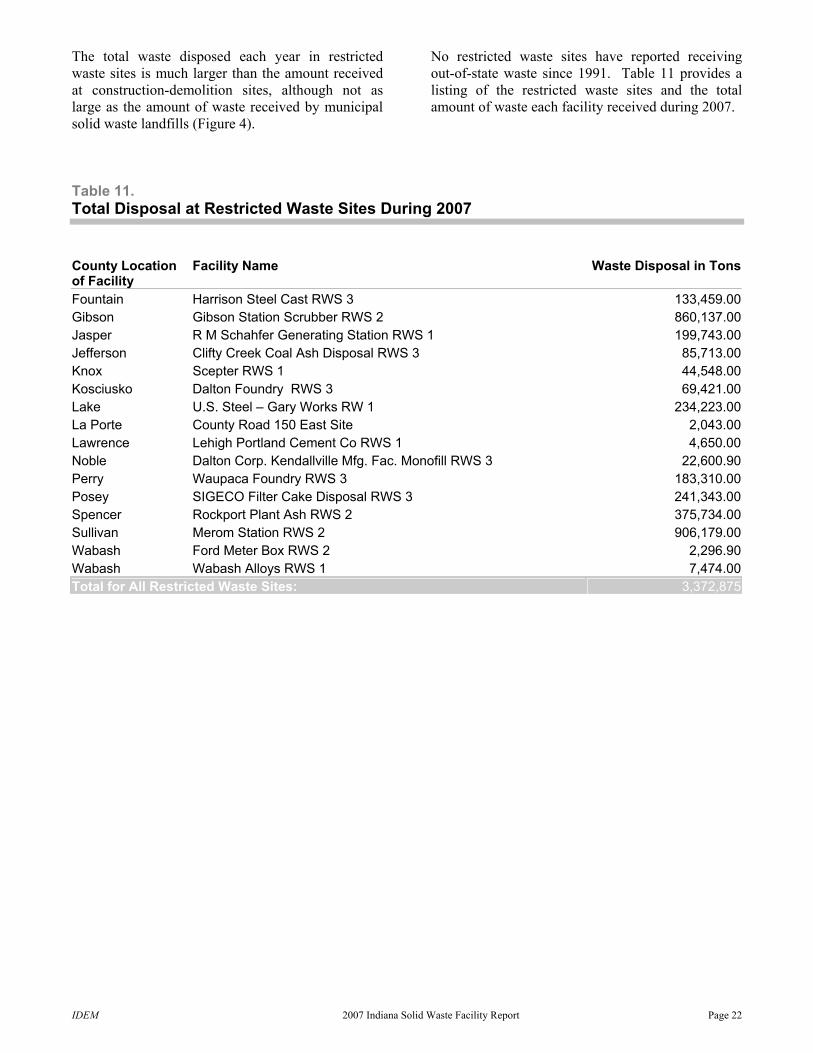
Restricted waste sites also receive a limited range of wastes, as specified in their facility permits. Most sites are ash, sludge, or foundry monofills. Coal combustion wastes from power plants accounted for 37 percent of the total tonnage disposed at restricted waste sites in 2007. Since 1996, coal combustion wastes have been reported as individual waste types on the solid waste facility quarterly reports. Before 1996, the amount of coal-related wastes disposed
was estimated based on the amount of waste received at specific types of restricted waste sites related to coal combustion. In 2006, Gibson Station’s waste intake decreased due to beneficial reuse of materials that was used in the construction of a new landfill. This decrease is also reflected in the total for Gibson County of waste disposed in Indiana (Table 5). In 2007, the intake has increased back to near the level of 2005.
Figure 12. Annual Disposal at Restricted Waste Sites by Waste Type
0
500,000
1,000,000
1,500,000
2,000,000
2,500,000
3,000,000
3,500,000
4,000,000
1999 2000 2001 2002 2003 2004 2005 2006 2007
Year
Was
te d
ispo
sal i
n to
ns
Non-Coal Related WastesCoal Related Wastes
74%
73% 74% 74% 76% 76% 75%
80%
26%
27% 26% 26% 24%
24% 25%
20%
76%
24%
IDEM 2007 Indiana Solid Waste Facility Report Page 22
The total waste disposed each year in restricted waste sites is much larger than the amount received at construction-demolition sites, although not as large as the amount of waste received by municipal solid waste landfills (Figure 4).
No restricted waste sites have reported receiving out-of-state waste since 1991. Table 11 provides a listing of the restricted waste sites and the total amount of waste each facility received during 2007.
Table 11. Total Disposal at Restricted Waste Sites During 2007
County Location of Facility
Facility Name
Waste Disposal in Tons
Fountain Harrison Steel Cast RWS 3 133,459.00Gibson Gibson Station Scrubber RWS 2 860,137.00Jasper R M Schahfer Generating Station RWS 1 199,743.00Jefferson Clifty Creek Coal Ash Disposal RWS 3 85,713.00Knox Scepter RWS 1 44,548.00Kosciusko Dalton Foundry RWS 3 69,421.00Lake U.S. Steel – Gary Works RW 1 234,223.00La Porte County Road 150 East Site 2,043.00Lawrence Lehigh Portland Cement Co RWS 1 4,650.00Noble Dalton Corp. Kendallville Mfg. Fac. Monofill RWS 3 22,600.90Perry Waupaca Foundry RWS 3 183,310.00Posey SIGECO Filter Cake Disposal RWS 3 241,343.00Spencer Rockport Plant Ash RWS 2 375,734.00Sullivan Merom Station RWS 2 906,179.00Wabash Ford Meter Box RWS 2 2,296.90Wabash Wabash Alloys RWS 1 7,474.00Total for All Restricted Waste Sites: 3,372,875
IDEM 2007 Indiana Solid Waste Facility Report Page 23
Non-municipal Solid Waste Landfills
The 1996 rules introduced the terms municipal solid waste (MSW) landfill and non-municipal solid waste (Non-MSW) landfill, which have been used throughout this report. In previous reports, Non-MSW landfills were grouped with MSW landfills under the general heading of “sanitary landfills.” MSW landfills were discussed earlier in this section.
Historically there have been only a few Non-MSW landfills in Indiana, all captive facilities, not available for public use. Non-MSW landfills receive any type of waste described in Table 2 except MSW, pursuant to the specifications of their permits. Table 12 provides a detail of the Non-MSW landfill operating in 2007 and the total amount of waste it received.
Table 12. Total Disposal at Non-municipal Solid Waste Landfills During 2007
County Location of Facility Facility Name Waste Disposal in Tons
Monroe Dillman Road Waste Water Treatment Plant Landfill 11,309
Total for All Non-municipal Landfills: 11,309
IDEM 2007 Indiana Solid Waste Facility Report Page 24
Solid Waste Processing Facilities Solid waste processing facilities include:
solid waste incinerators; transfer stations; and other processing facilities.
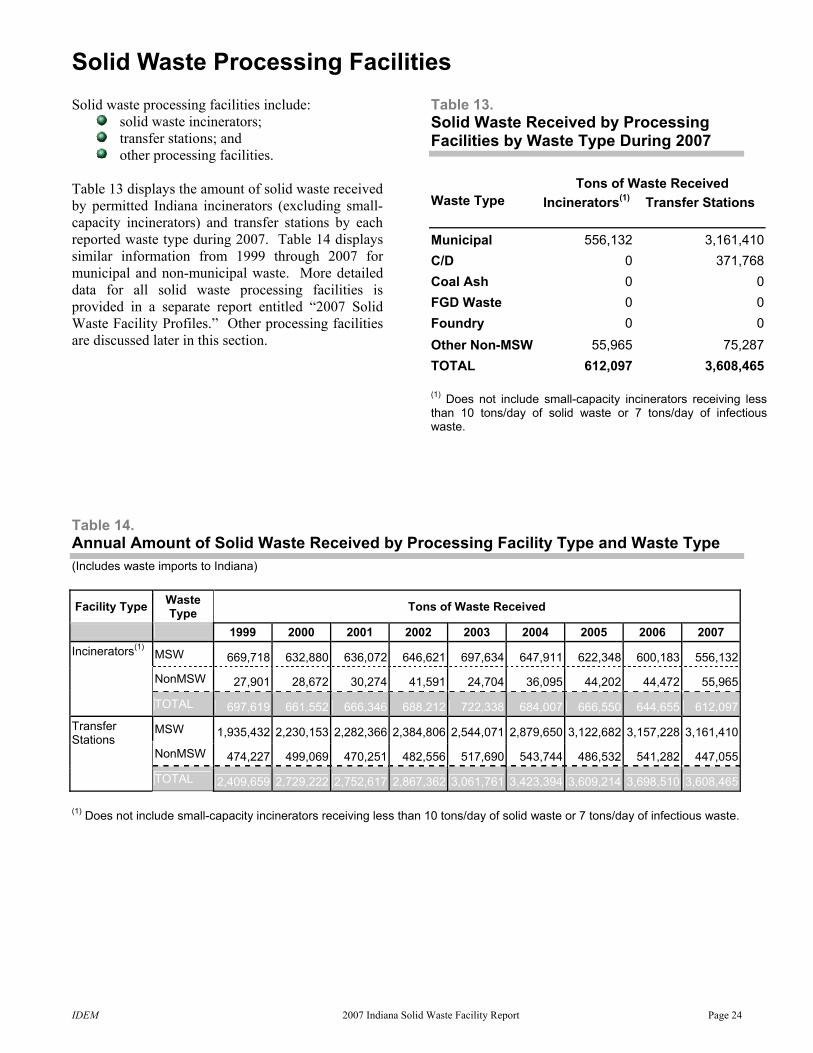
Table 13 displays the amount of solid waste received by permitted Indiana incinerators (excluding small-capacity incinerators) and transfer stations by each reported waste type during 2007. Table 14 displays similar information from 1999 through 2007 for municipal and non-municipal waste. More detailed data for all solid waste processing facilities is provided in a separate report entitled “2007 Solid Waste Facility Profiles.” Other processing facilities are discussed later in this section.
Table 13. Solid Waste Received by Processing Facilities by Waste Type During 2007
Tons of Waste Received Waste Type
Incinerators(1)
Transfer Stations
Municipal 556,132 3,161,410C/D 0 371,768Coal Ash 0 0FGD Waste 0 0Foundry 0 0Other Non-MSW 55,965 75,287TOTAL 612,097 3,608,465 (1) Does not include small-capacity incinerators receiving lessthan 10 tons/day of solid waste or 7 tons/day of infectious waste.
Table 14. Annual Amount of Solid Waste Received by Processing Facility Type and Waste Type (Includes waste imports to Indiana)
Facility Type Waste Type Tons of Waste Received
1999 2000 2001 2002 2003 2004 2005 2006 2007
MSW 669,718 632,880 636,072 646,621 697,634 647,911 622,348 600,183 556,132
NonMSW 27,901 28,672 30,274 41,591 24,704 36,095 44,202 44,472 55,965
Incinerators(1)
TOTAL 697,619 661,552 666,346 688,212 722,338 684,007 666,550 644,655 612,097
MSW 1,935,432 2,230,153 2,282,366 2,384,806 2,544,071 2,879,650 3,122,682 3,157,228 3,161,410
NonMSW 474,227 499,069 470,251 482,556 517,690 543,744 486,532 541,282 447,055
Transfer Stations
TOTAL 2,409,659 2,729,222 2,752,617 2,867,362 3,061,761 3,423,394 3,609,214 3,698,510 3,608,465 (1) Does not include small-capacity incinerators receiving less than 10 tons/day of solid waste or 7 tons/day of infectious waste.
IDEM 2007 Indiana Solid Waste Facility Report Page 25
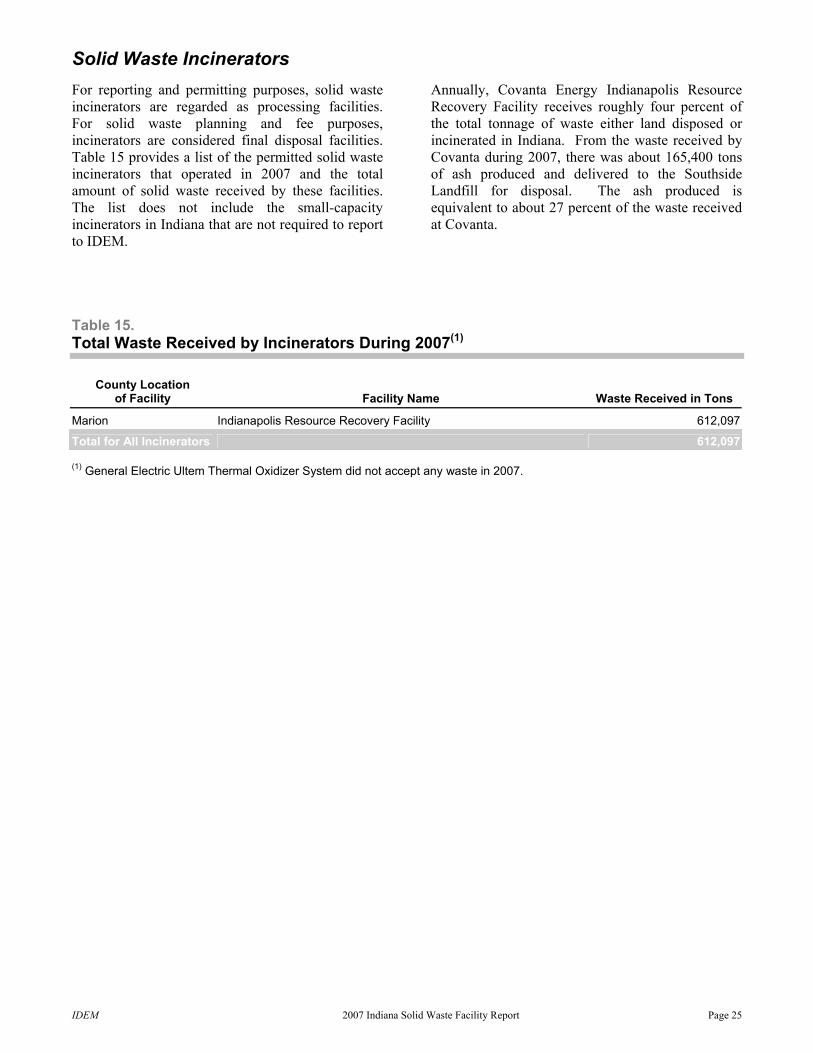
Solid Waste Incinerators For reporting and permitting purposes, solid waste incinerators are regarded as processing facilities. For solid waste planning and fee purposes, incinerators are considered final disposal facilities. Table 15 provides a list of the permitted solid waste incinerators that operated in 2007 and the total amount of solid waste received by these facilities. The list does not include the small-capacity incinerators in Indiana that are not required to report to IDEM.
Annually, Covanta Energy Indianapolis Resource Recovery Facility receives roughly four percent of the total tonnage of waste either land disposed or incinerated in Indiana. From the waste received by Covanta during 2007, there was about 165,400 tons of ash produced and delivered to the Southside Landfill for disposal. The ash produced is equivalent to about 27 percent of the waste received at Covanta.
Table 15. Total Waste Received by Incinerators During 2007(1)
County Location of Facility Facility Name Waste Received in Tons
Marion Indianapolis Resource Recovery Facility 612,097
Total for All Incinerators 612,097
(1) General Electric Ultem Thermal Oxidizer System did not accept any waste in 2007.
IDEM 2007 Indiana Solid Waste Facility Report Page 26
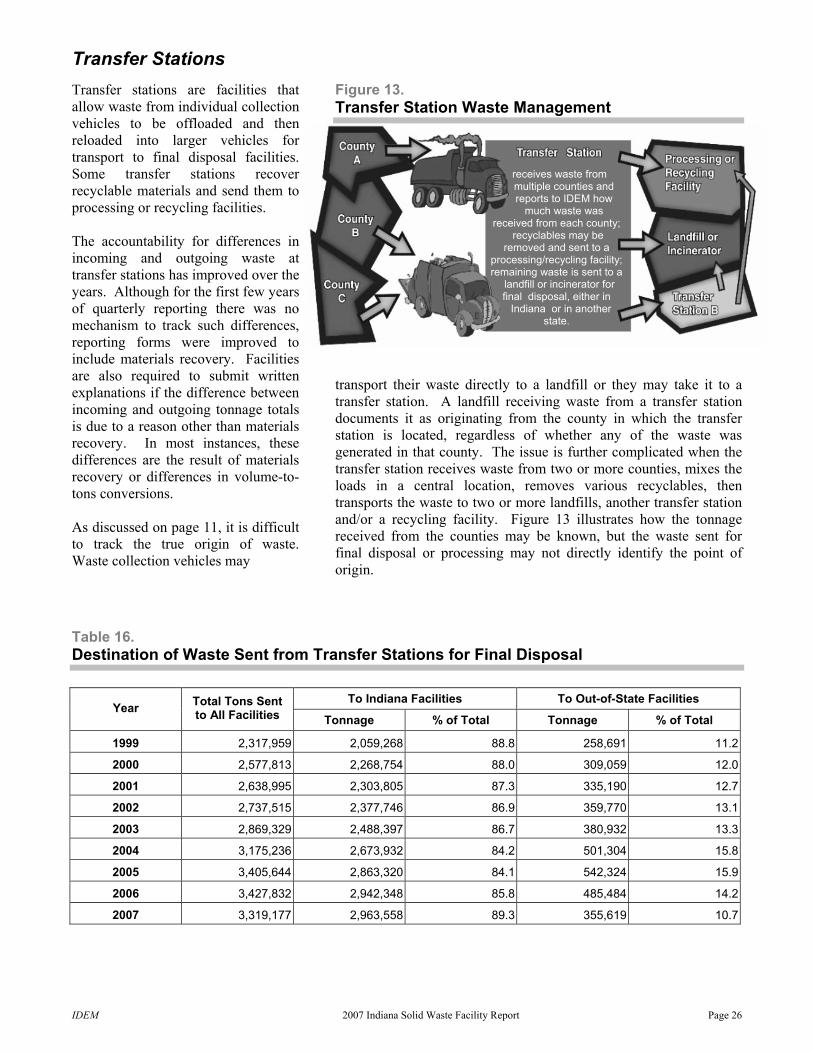
Transfer Stations Transfer stations are facilities that allow waste from individual collection vehicles to be offloaded and then reloaded into larger vehicles for transport to final disposal facilities. Some transfer stations recover recyclable materials and send them to processing or recycling facilities. The accountability for differences in incoming and outgoing waste at transfer stations has improved over the years. Although for the first few years of quarterly reporting there was no mechanism to track such differences, reporting forms were improved to include materials recovery. Facilities are also required to submit written explanations if the difference between incoming and outgoing tonnage totals is due to a reason other than materials recovery. In most instances, these differences are the result of materials recovery or differences in volume-to-tons conversions. As discussed on page 11, it is difficult to track the true origin of waste. Waste collection vehicles may
Figure 13. Transfer Station Waste Management transport their waste directly to a landfill or they may take it to a transfer station. A landfill receiving waste from a transfer station documents it as originating from the county in which the transfer station is located, regardless of whether any of the waste was generated in that county. The issue is further complicated when the transfer station receives waste from two or more counties, mixes the loads in a central location, removes various recyclables, then transports the waste to two or more landfills, another transfer station and/or a recycling facility. Figure 13 illustrates how the tonnage received from the counties may be known, but the waste sent for final disposal or processing may not directly identify the point of origin.
Table 16. Destination of Waste Sent from Transfer Stations for Final Disposal
To Indiana Facilities To Out-of-State Facilities Year Total Tons Sent
to All Facilities Tonnage % of Total Tonnage % of Total
1999 2,317,959 2,059,268 88.8 258,691 11.2
2000 2,577,813 2,268,754 88.0 309,059 12.0
2001 2,638,995 2,303,805 87.3 335,190 12.7
2002 2,737,515 2,377,746 86.9 359,770 13.1
2003 2,869,329 2,488,397 86.7 380,932 13.3
2004 3,175,236 2,673,932 84.2 501,304 15.8
2005 3,405,644 2,863,320 84.1 542,324 15.9
2006 3,427,832 2,942,348 85.8 485,484 14.2
2007 3,319,177 2,963,558 89.3 355,619 10.7
receives waste from multiple counties and reports to IDEM how
much waste was received from each county;
recyclables may be removed and sent to a
processing/recycling facility; remaining waste is sent to a
landfill or incinerator for final disposal, either in Indiana or in another
state.
IDEM 2007 Indiana Solid Waste Facility Report Page 27
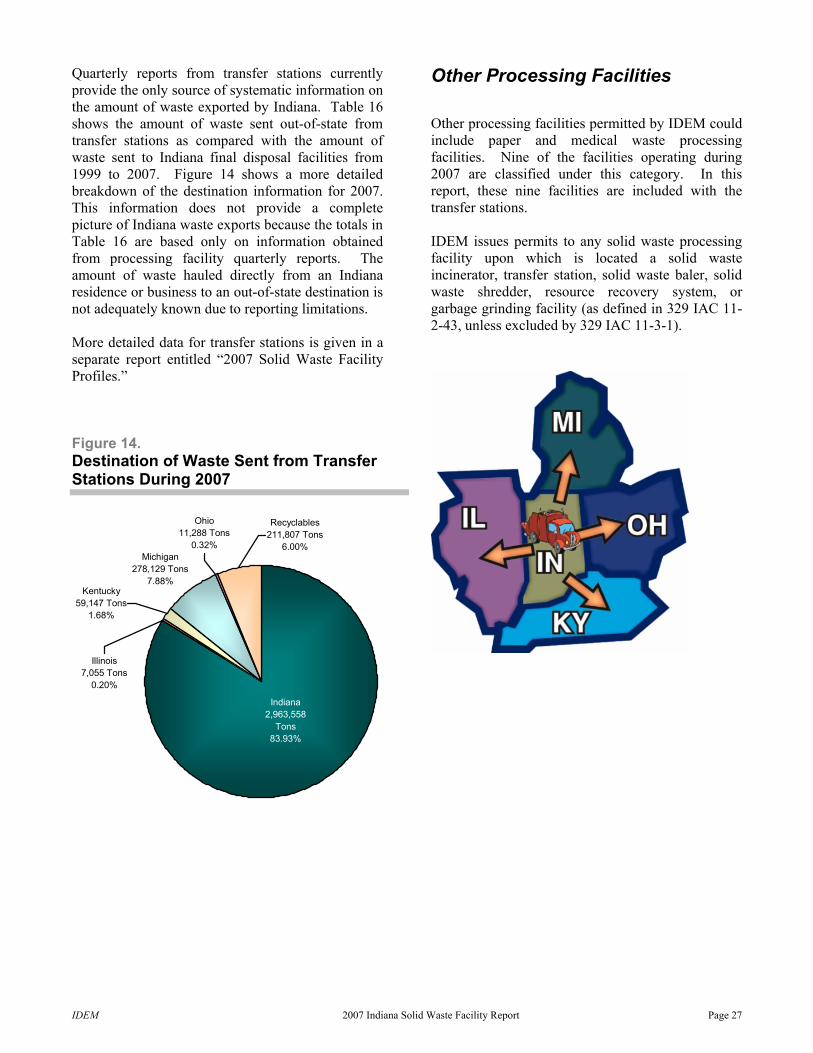
Quarterly reports from transfer stations currently provide the only source of systematic information on the amount of waste exported by Indiana. Table 16 shows the amount of waste sent out-of-state from transfer stations as compared with the amount of waste sent to Indiana final disposal facilities from 1999 to 2007. Figure 14 shows a more detailed breakdown of the destination information for 2007. This information does not provide a complete picture of Indiana waste exports because the totals in Table 16 are based only on information obtained from processing facility quarterly reports. The amount of waste hauled directly from an Indiana residence or business to an out-of-state destination is not adequately known due to reporting limitations. More detailed data for transfer stations is given in a separate report entitled “2007 Solid Waste Facility Profiles.”
Other Processing Facilities Other processing facilities permitted by IDEM could include paper and medical waste processing facilities. Nine of the facilities operating during 2007 are classified under this category. In this report, these nine facilities are included with the transfer stations. IDEM issues permits to any solid waste processing facility upon which is located a solid waste incinerator, transfer station, solid waste baler, solid waste shredder, resource recovery system, or garbage grinding facility (as defined in 329 IAC 11-2-43, unless excluded by 329 IAC 11-3-1).
Figure 14. Destination of Waste Sent from Transfer Stations During 2007
Ohio11,288 Tons
0.32%Michigan
278,129 Tons7.88%
Illinois7,055 Tons
0.20%
Kentucky59,147 Tons
1.68%
Recyclables211,807 Tons
6.00%
Indiana2,963,558
Tons83.93%
IDEM 2007 Indiana Solid Waste Facility Report Page 28
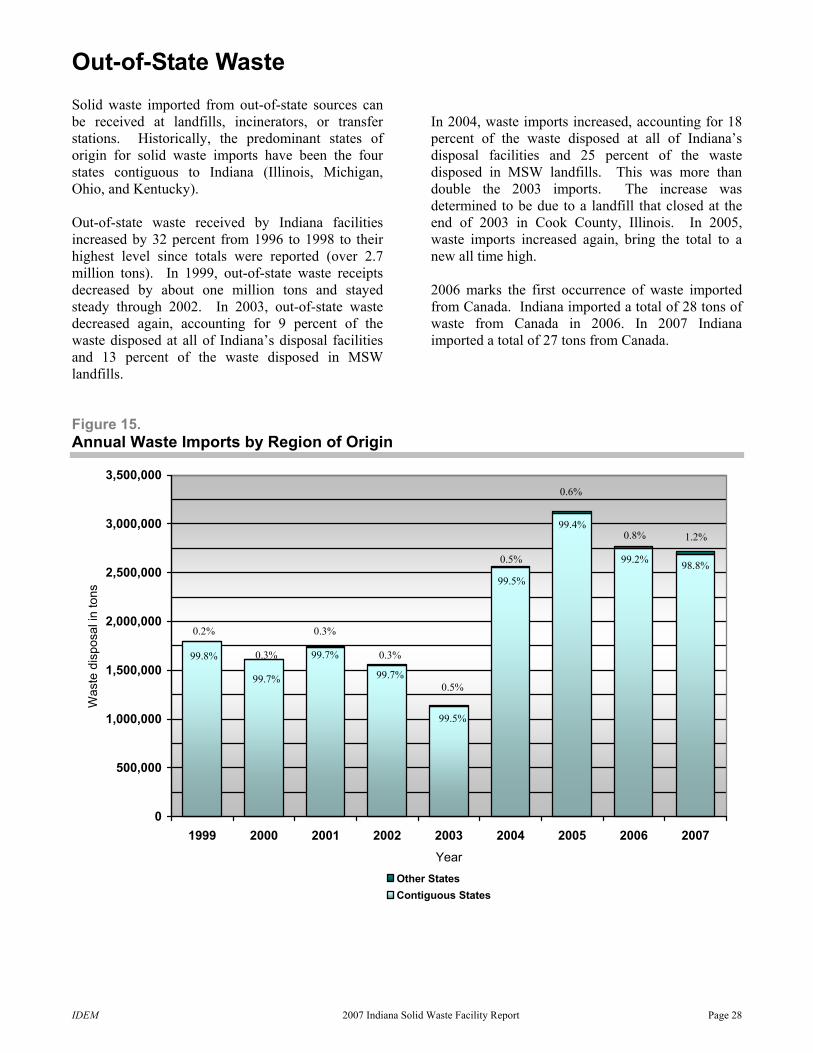
Out-of-State Waste Solid waste imported from out-of-state sources can be received at landfills, incinerators, or transfer stations. Historically, the predominant states of origin for solid waste imports have been the four states contiguous to Indiana (Illinois, Michigan, Ohio, and Kentucky). Out-of-state waste received by Indiana facilities increased by 32 percent from 1996 to 1998 to their highest level since totals were reported (over 2.7 million tons). In 1999, out-of-state waste receipts decreased by about one million tons and stayed steady through 2002. In 2003, out-of-state waste decreased again, accounting for 9 percent of the waste disposed at all of Indiana’s disposal facilities and 13 percent of the waste disposed in MSW landfills.
In 2004, waste imports increased, accounting for 18 percent of the waste disposed at all of Indiana’s disposal facilities and 25 percent of the waste disposed in MSW landfills. This was more than double the 2003 imports. The increase was determined to be due to a landfill that closed at the end of 2003 in Cook County, Illinois. In 2005, waste imports increased again, bring the total to a new all time high. 2006 marks the first occurrence of waste imported from Canada. Indiana imported a total of 28 tons of waste from Canada in 2006. In 2007 Indiana imported a total of 27 tons from Canada.
Figure 15. Annual Waste Imports by Region of Origin
0
500,000
1,000,000
1,500,000
2,000,000
2,500,000
3,000,000
3,500,000
1999 2000 2001 2002 2003 2004 2005 2006 2007Year
Was
te d
ispo
sal i
n to
ns
Other StatesContiguous States
99.2% 98.8%
99.8%
99.7%
99.7%
99.7%
99.5%
99.5%
99.4%
0.8% 1.2%
0.2% 0.3%
0.3%
0.3%
0.5%
0.5%
0.6%
IDEM 2007 Indiana Solid Waste Facility Report Page 29
Table 17. Out-of-State Waste Received During 2007(1)
Total Tons: State Tons State Tons State Tons State TonsCounty Name Received County Name Received County Name Received County Name ReceivedILLINOIS 2,250,834 OHIO (cont’d) MICHIGAN (cont’d) TEXAS 1,431
ADAMS 2 DEFIANCE 27 OAKLAND 209 DALLAS 55BOND <1 FRANKLIN 712 OCEANA <1 HARRIS 4BOONE 1 GUERNSEY 5 OGEMAW 5 SHELBY 1,366BUREAU <1 HAMILTON 5,059 OTTAWA <1 TARRANT 6CALHOUN <1 LOGAN 165 ROSCOMMON <1 VIRGINIA 1,229CARROLL 1 MERCER 17,051 ST. CLAIR 29 RICHMOND CITY 1,229CHAMPAIGN 352 MIAMI 90,742 ST. JOSEPH 335 KANSAS 1,044CHRISTIAN 10 MONTGOMERY 349 WASHTENAW 310 ATCHISON 1CLARK 4,585 PAULDING 223 WAYNE 254 DONIPHAN 718CLAY 7 PORTAGE 3 WEXFORD 6 JOHNSON 318COLES 23 PUTNAM 66 IOWA 8,724 WYANDOTTE 6COOK 2,035,173 SHELBY 7,372 CERRO GORDO 64 WEST VIRGINIA 773CRAWFORD 10,855 SUMMIT 3 CLINTON 22 CABELL 5DE KALB 61 UNION 23 DES MOINES 27 KANAWHA 73DE WITT 1 VAN WERT 17,035 DUBUQUE <1 PUTNAM 694DOUGLAS 1 WARREN 314 FRANKLIN <1 WAYNE 1DU PAGE 1,640 WILLIAMS 166 JOHNSON 8,548 NEW JERSEY 584EDGAR 18,142 WOOD 7 LINN 1 GLOUCESTER 6EFFINGHAM 21 KENTUCKY 122,061 MONONA <1 UNION 578FAYETTE <1 ADAIR 2 O'BRIEN <1 CALIFORNIA 574FORD 1 ANDERSON 31 PLYMOUTH <1 RIVERSIDE 551FRANKLIN 785 BELL 1 POLK 23 SAN BERNARDINO 23FULTON 1 BOURBON 38 SCOTT 25 PENNSYLVANIA 394IROQUOIS 124 BOYLE 6 WINNEBAGO <1 BUCKS 74JASPER 109 BULLITT 122 WOODBURY 15 LANCASTER 3KANE 111 CARROLL 1,060 ARKANSAS 5,916 MCKEAN 301KANKAKEE 133,666 CHRISTIAN 2 COLUMBIA 5 MONTGOMERY 14KENDALL 3 CLARK 2 SALINE 5,911 NORTHAMPTON 2KNOX 76 CLAY 1 WISCONSIN 4,298 DELAWARE 308LA SALLE 20 CRITTENDEN 2 BROWN 75 NEW CASTLE 308LAKE 34,194 DAVIESS 128 COLUMBIA 1 ALABAMA 222LAWRENCE 4,178 FAYETTE 22 DANE 33 DALLAS 222LEE 4 FLOYD 1 DODGE 1 UTAH 194LIVINGSTON 5 FRANKLIN 1 GRANT 1 SALT LAKE 194LOGAN 19 GREENUP 1 KENOSHA 112 NEW HAMPSHIRE 163MACON 106 HANCOCK 14 MILWAUKEE 445 MERRIMACK 163MACOUPIN 2 HARDIN 165 OUTAGAMIE 2 MASSACHUSETTS 141MADISON 68 HENDERSON 64,713 OZAUKEE 43 ESSEX 141MARION 17 HENRY 1,203 RACINE <1 MISSISSIPPI 117MASON 3,333 HOPKINS 11 ROCK 52 COAHOMA 2MCHENRY 104 JEFFERSON 50,572 SAUK 1 WASHINGTON 115MCLEAN 106 JESSAMINE 125 SHEBOYGAN <1 ARIZONA 81MENARD 1 MADISON 1 WALWORTH 5 MARICOPA 9MONROE <1 MARION 17 WASHINGTON 1 PINAL 72MONTGOMERY <1 METCALFE 12 WAUKESHA 3,525 FLORIDA 49MORGAN 2 MONTGOMERY 23 MISSOURI 3,063 HILLSBOROUGH 5MOULTRIE <1 MUHLENBERG 2 BOONE <1 SEMINOLE 44OGLE 2 OWEN 7 BUCHANAN 4 OKLAHOMA 47PEORIA 148 PULASKI 1 CAMDEN 1 OKLAHOMA 47PIATT 26 ROCKCASTLE 4 CAPE GIRARDEAU 82 NEW YORK 45RICHLAND 2 SCOTT 3,435 CLAY 74 CLINTON 21ROCK ISLAND 6 SHELBY 3 FRANKLIN 157 ERIE 24SANGAMON 125 UNION 2 JACKSON 1,569 NORTH CAROLINA 43ST. CLAIR 59 WARREN 233 LINCOLN 6 FORSYTH 43STEPHENSON 13 WASHINGTON 7 MACON 14 COLORADO 37TAZEWELL 154 WEBSTER 7 PLATTE 29 EL PASO 37UNION <1 WHITLEY 79 ST. CHARLES 335 CANADA 27VERMILION 1,038 WOODFORD 5 ST. FRANCOIS <1 UNKNOWN 27WABASH 116 MICHIGAN 88,716 ST. LOUIS 607 LOUISIANA 16WARREN 2 ALLEGAN 342 ST. LOUIS CITY 12 BOSSIER 1WASHINGTON 62 BENZIE 1 WASHINGTON 173 LINCOLN 9WAYNE <1 BERRIEN 2,510 TENNESSEE 2,879 MOREHOUSE 3WHITESIDE 9 BRANCH 63,745 GIBSON 12 ST. LANDRY 3WILL 871 CALHOUN 41 HAMBLEN 6 MINNESOTA 12WILLIAMSON 6 CASS 1,403 HICKMAN 3 HENNEPIN 12WINNEBAGO 279 CHARLEVOIX 4,991 HUMPHREYS 338 GEORGIA 4WOODFORD 9 CRAWFORD 6 MARION 3 DOUGLAS 2
OHIO 226,398 EATON 21 OBION 2 FULTON 2ALLEN 75,627 GRAND 92 ROBERTSON 20 MARYLAND 1AUGLAIZE 1,005 HILLSDALE 13,001 SHELBY 2,489 CECIL 1BUTLER 7 JACKSON 18 SMITH 4CHAMPAIGN 1,869 KALAMAZOO 346 TIPTON 2CLARK 1 KENT 821CLINTON 20 LIVINGSTON 19CUYAHOGA 249 MACOMB 126DARKE 8,299 MUSKEGON 85
(1) About 9,333 tons were sent back to out-of-state facilities by Indiana transfer stations.
IDEM 2007 Indiana Solid Waste Facility Report Page 30
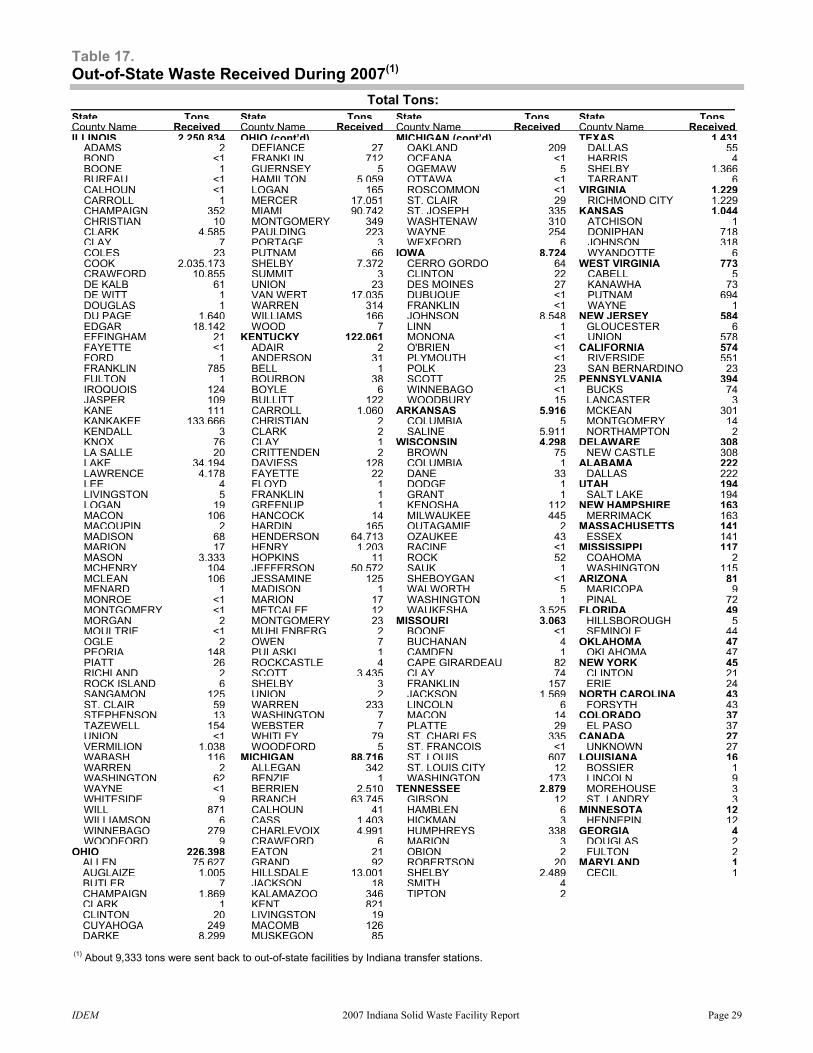
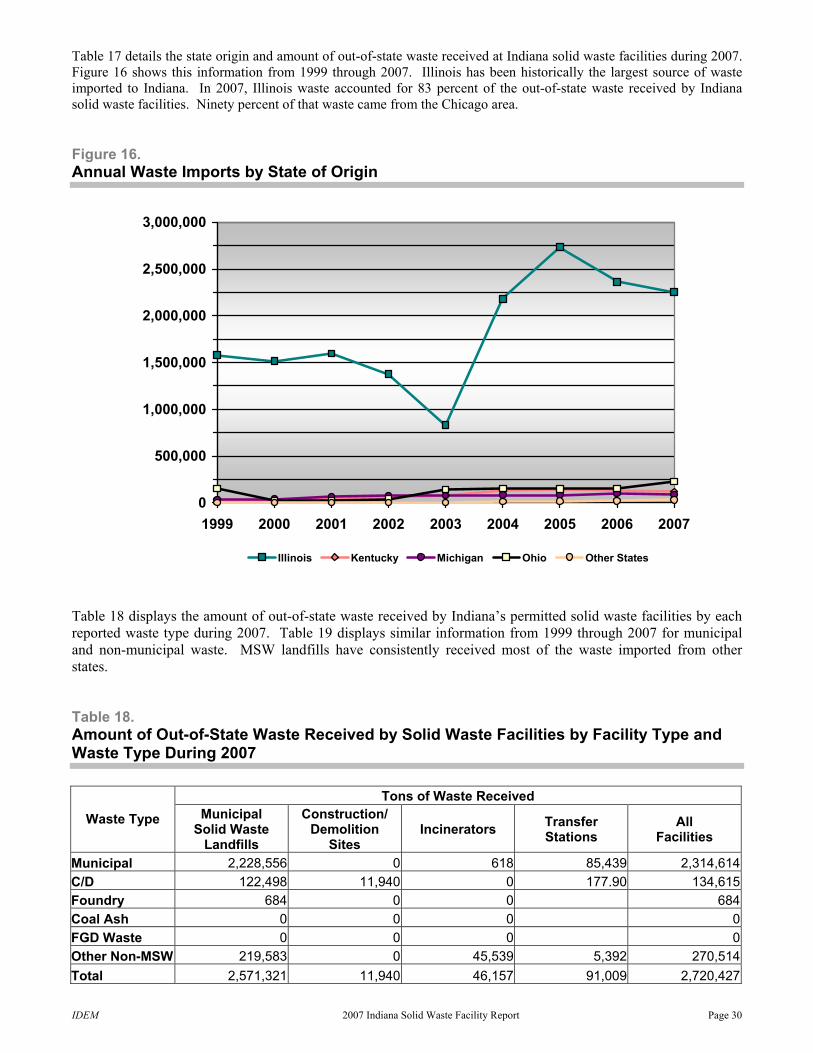
Table 17 details the state origin and amount of out-of-state waste received at Indiana solid waste facilities during 2007. Figure 16 shows this information from 1999 through 2007. Illinois has been historically the largest source of waste imported to Indiana. In 2007, Illinois waste accounted for 83 percent of the out-of-state waste received by Indiana solid waste facilities. Ninety percent of that waste came from the Chicago area. Figure 16. Annual Waste Imports by State of Origin
0
500,000
1,000,000
1,500,000
2,000,000
2,500,000
3,000,000
1999 2000 2001 2002 2003 2004 2005 2006 2007
Illinois Kentucky Michigan Ohio Other States
Table 18 displays the amount of out-of-state waste received by Indiana’s permitted solid waste facilities by each reported waste type during 2007. Table 19 displays similar information from 1999 through 2007 for municipal and non-municipal waste. MSW landfills have consistently received most of the waste imported from other states. Table 18. Amount of Out-of-State Waste Received by Solid Waste Facilities by Facility Type and Waste Type During 2007
Tons of Waste Received Waste Type Municipal
Solid Waste Landfills
Construction/ Demolition
Sites Incinerators Transfer
Stations All
Facilities
Municipal 2,228,556 0 618 85,439 2,314,614C/D 122,498 11,940 0 177.90 134,615Foundry 684 0 0 684Coal Ash 0 0 0 0FGD Waste 0 0 0 0Other Non-MSW 219,583 0 45,539 5,392 270,514Total 2,571,321 11,940 46,157 91,009 2,720,427
IDEM 2007 Indiana Solid Waste Facility Report Page 31
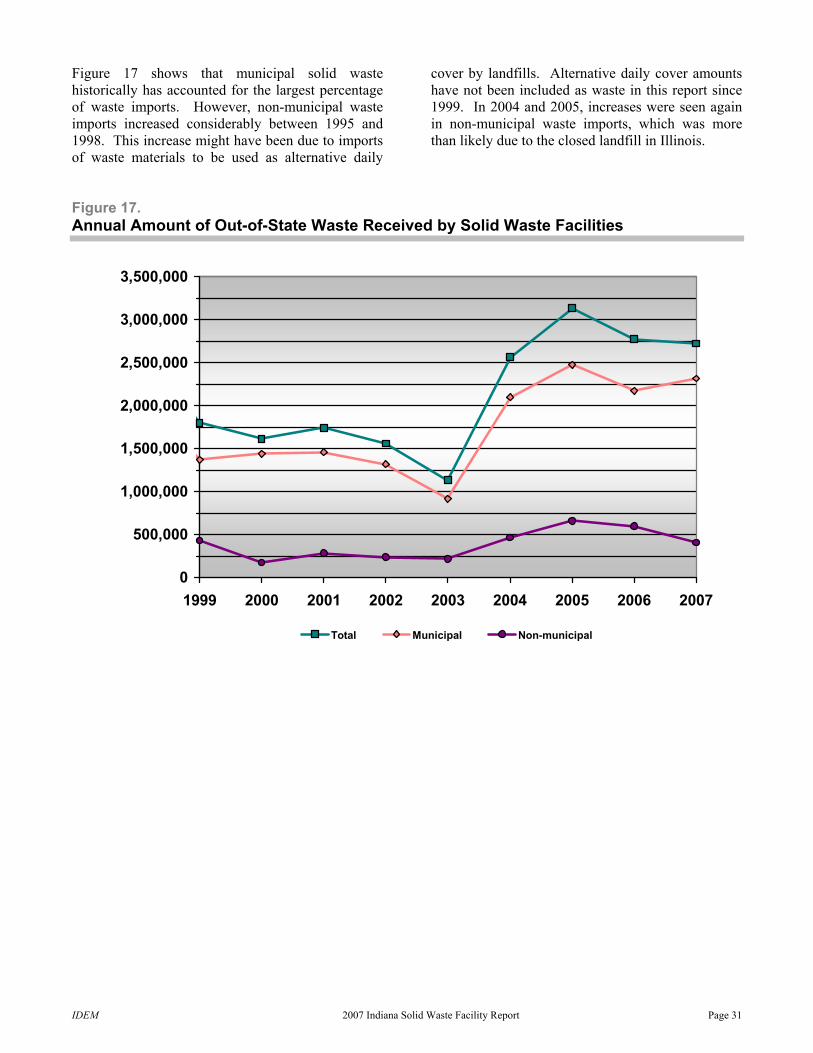
Figure 17 shows that municipal solid waste historically has accounted for the largest percentage of waste imports. However, non-municipal waste imports increased considerably between 1995 and 1998. This increase might have been due to imports of waste materials to be used as alternative daily
cover by landfills. Alternative daily cover amounts have not been included as waste in this report since 1999. In 2004 and 2005, increases were seen again in non-municipal waste imports, which was more than likely due to the closed landfill in Illinois.
Figure 17. Annual Amount of Out-of-State Waste Received by Solid Waste Facilities
0
500,000
1,000,000
1,500,000
2,000,000
2,500,000
3,000,000
3,500,000
1999 2000 2001 2002 2003 2004 2005 2006 2007
Total Municipal Non-municipal
IDEM 2007 Indiana Solid Waste Facility Report Page 32
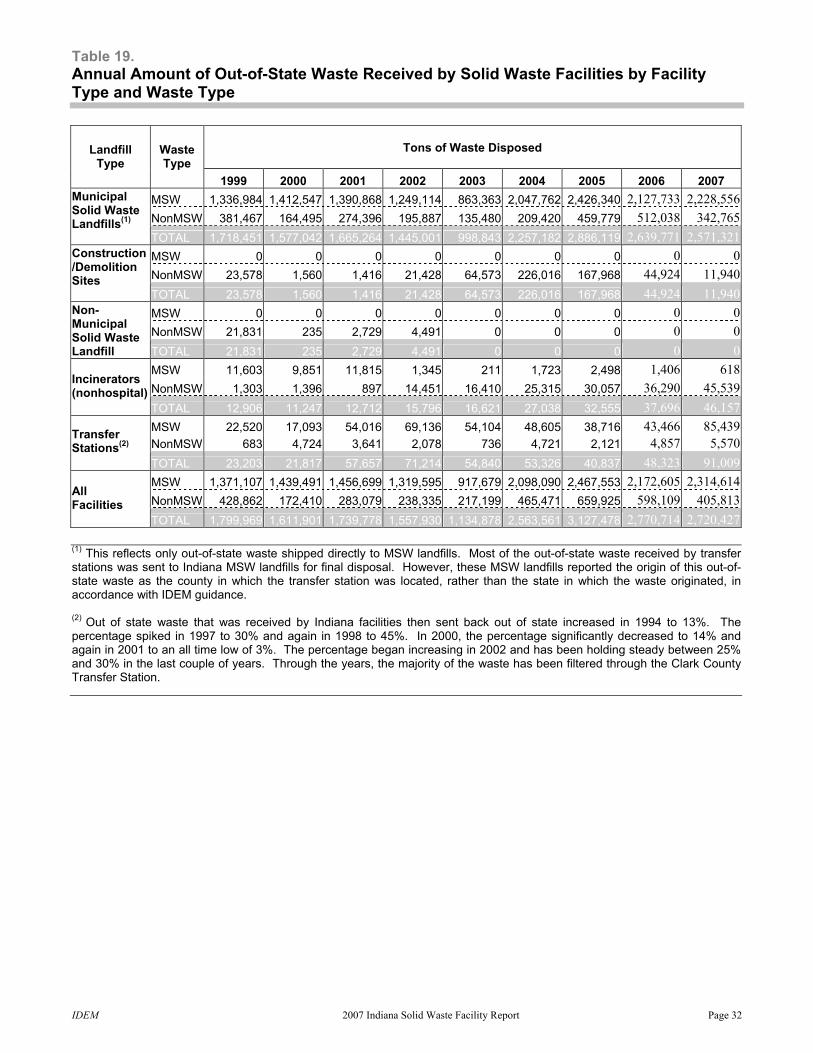
Table 19. Annual Amount of Out-of-State Waste Received by Solid Waste Facilities by Facility Type and Waste Type
Tons of Waste Disposed
Landfill
Type Waste Type
1999 2000 2001 2002 2003 2004 2005 2006 2007 MSW 1,336,984 1,412,547 1,390,868 1,249,114 863,363 2,047,762 2,426,340 2,127,733 2,228,556NonMSW 381,467 164,495 274,396 195,887 135,480 209,420 459,779 512,038 342,765
Municipal Solid Waste Landfills(1)
TOTAL 1,718,451 1,577,042 1,665,264 1,445,001 998,843 2,257,182 2,886,119 2,639,771 2,571,321MSW 0 0 0 0 0 0 0 0 0NonMSW 23,578 1,560 1,416 21,428 64,573 226,016 167,968 44,924 11,940
Construction/Demolition Sites TOTAL 23,578 1,560 1,416 21,428 64,573 226,016 167,968 44,924 11,940
MSW 0 0 0 0 0 0 0 0 0NonMSW 21,831 235 2,729 4,491 0 0 0 0 0
Non-Municipal Solid Waste Landfill TOTAL 21,831 235 2,729 4,491 0 0 0 0 0
MSW 11,603 9,851 11,815 1,345 211 1,723 2,498 1,406 618NonMSW 1,303 1,396 897 14,451 16,410 25,315 30,057 36,290 45,539
Incinerators (nonhospital) TOTAL 12,906 11,247 12,712 15,796 16,621 27,038 32,555 37,696 46,157
MSW 22,520 17,093 54,016 69,136 54,104 48,605 38,716 43,466 85,439NonMSW 683 4,724 3,641 2,078 736 4,721 2,121 4,857 5,570
Transfer Stations(2) TOTAL 23,203 21,817 57,657 71,214 54,840 53,326 40,837 48,323 91,009
MSW 1,371,107 1,439,491 1,456,699 1,319,595 917,679 2,098,090 2,467,553 2,172,605 2,314,614NonMSW 428,862 172,410 283,079 238,335 217,199 465,471 659,925 598,109 405,813
All Facilities TOTAL 1,799,969 1,611,901 1,739,778 1,557,930 1,134,878 2,563,561 3,127,478 2,770,714 2,720,427 (1) This reflects only out-of-state waste shipped directly to MSW landfills. Most of the out-of-state waste received by transfer stations was sent to Indiana MSW landfills for final disposal. However, these MSW landfills reported the origin of this out-of-state waste as the county in which the transfer station was located, rather than the state in which the waste originated, in accordance with IDEM guidance. (2) Out of state waste that was received by Indiana facilities then sent back out of state increased in 1994 to 13%. The percentage spiked in 1997 to 30% and again in 1998 to 45%. In 2000, the percentage significantly decreased to 14% and again in 2001 to an all time low of 3%. The percentage began increasing in 2002 and has been holding steady between 25% and 30% in the last couple of years. Through the years, the majority of the waste has been filtered through the Clark County Transfer Station.
IDEM 2007 Indiana Solid Waste Facility Report Page 33
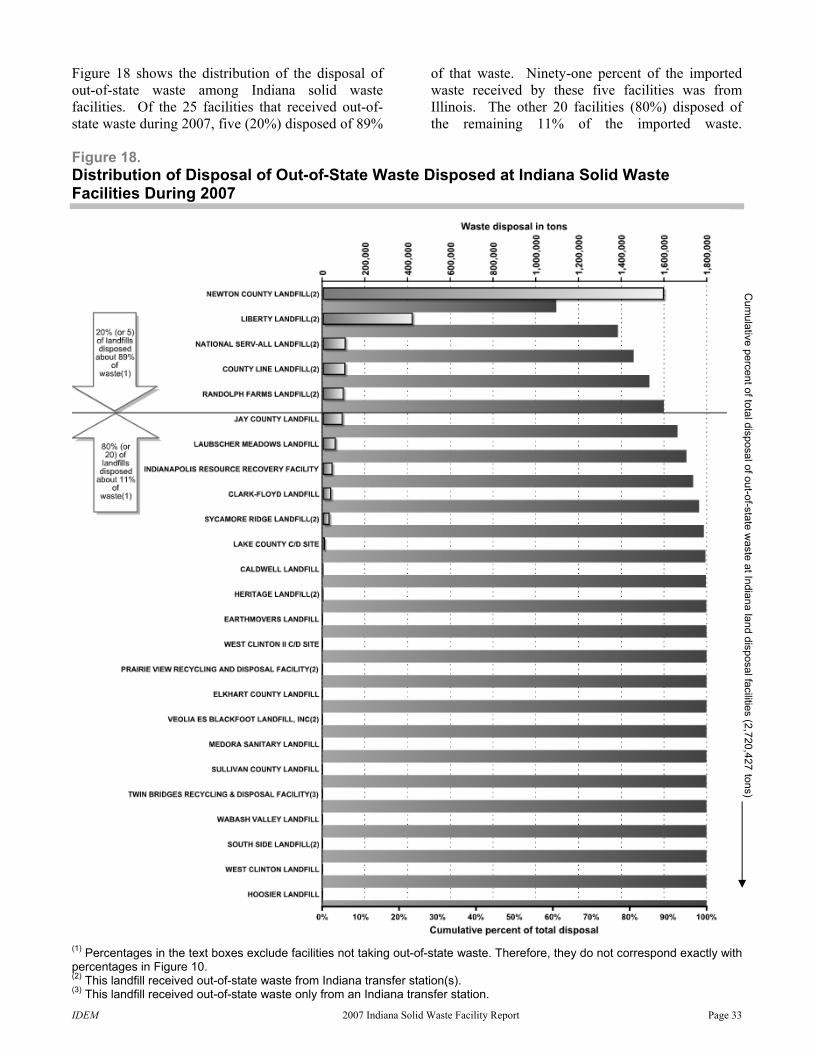
Figure 18 shows the distribution of the disposal of out-of-state waste among Indiana solid waste facilities. Of the 25 facilities that received out-of-state waste during 2007, five (20%) disposed of 89%
of that waste. Ninety-one percent of the imported waste received by these five facilities was from Illinois. The other 20 facilities (80%) disposed of the remaining 11% of the imported waste.
Figure 18. Distribution of Disposal of Out-of-State Waste Disposed at Indiana Solid Waste Facilities During 2007
(1) Percentages in the text boxes exclude facilities not taking out-of-state waste. Therefore, they do not correspond exactly with percentages in Figure 10. (2) This landfill received out-of-state waste from Indiana transfer station(s). (3) This landfill received out-of-state waste only from an Indiana transfer station.
Cum
ulative percent of total disposal of out-of-state waste at Indiana land disposal facilities (2,720,427
tons)
IDEM 2007 Indiana Solid Waste Facility Report Page 34
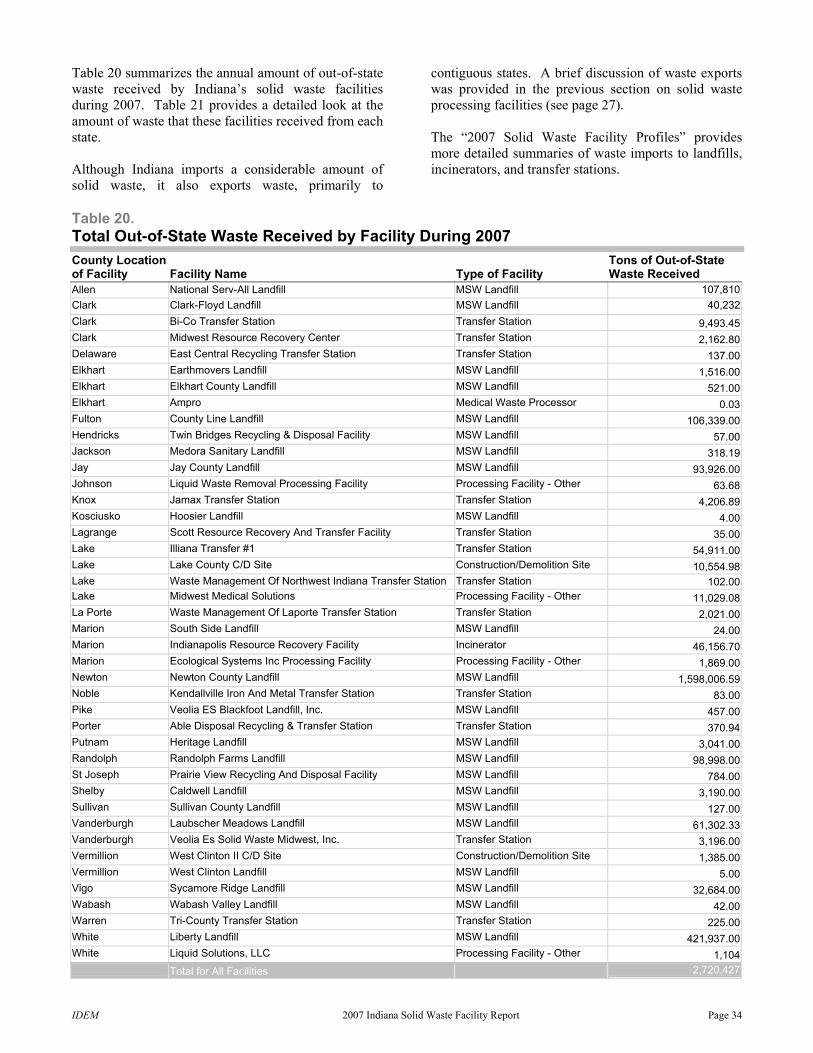
Table 20 summarizes the annual amount of out-of-state waste received by Indiana’s solid waste facilities during 2007. Table 21 provides a detailed look at the amount of waste that these facilities received from each state. Although Indiana imports a considerable amount of solid waste, it also exports waste, primarily to
contiguous states. A brief discussion of waste exports was provided in the previous section on solid waste processing facilities (see page 27). The “2007 Solid Waste Facility Profiles” provides more detailed summaries of waste imports to landfills, incinerators, and transfer stations.
Table 20. Total Out-of-State Waste Received by Facility During 2007 County Location of Facility Facility Name Type of Facility
Tons of Out-of-State Waste Received
Allen National Serv-All Landfill MSW Landfill 107,810Clark Clark-Floyd Landfill MSW Landfill 40,232Clark Bi-Co Transfer Station Transfer Station 9,493.45Clark Midwest Resource Recovery Center Transfer Station 2,162.80Delaware East Central Recycling Transfer Station Transfer Station 137.00Elkhart Earthmovers Landfill MSW Landfill 1,516.00Elkhart Elkhart County Landfill MSW Landfill 521.00Elkhart Ampro Medical Waste Processor 0.03Fulton County Line Landfill MSW Landfill 106,339.00Hendricks Twin Bridges Recycling & Disposal Facility MSW Landfill 57.00Jackson Medora Sanitary Landfill MSW Landfill 318.19Jay Jay County Landfill MSW Landfill 93,926.00Johnson Liquid Waste Removal Processing Facility Processing Facility - Other 63.68Knox Jamax Transfer Station Transfer Station 4,206.89Kosciusko Hoosier Landfill MSW Landfill 4.00Lagrange Scott Resource Recovery And Transfer Facility Transfer Station 35.00Lake Illiana Transfer #1 Transfer Station 54,911.00Lake Lake County C/D Site Construction/Demolition Site 10,554.98Lake Waste Management Of Northwest Indiana Transfer Station Transfer Station 102.00Lake Midwest Medical Solutions Processing Facility - Other 11,029.08La Porte Waste Management Of Laporte Transfer Station Transfer Station 2,021.00Marion South Side Landfill MSW Landfill 24.00Marion Indianapolis Resource Recovery Facility Incinerator 46,156.70Marion Ecological Systems Inc Processing Facility Processing Facility - Other 1,869.00Newton Newton County Landfill MSW Landfill 1,598,006.59Noble Kendallville Iron And Metal Transfer Station Transfer Station 83.00Pike Veolia ES Blackfoot Landfill, Inc. MSW Landfill 457.00Porter Able Disposal Recycling & Transfer Station Transfer Station 370.94Putnam Heritage Landfill MSW Landfill 3,041.00Randolph Randolph Farms Landfill MSW Landfill 98,998.00St Joseph Prairie View Recycling And Disposal Facility MSW Landfill 784.00Shelby Caldwell Landfill MSW Landfill 3,190.00Sullivan Sullivan County Landfill MSW Landfill 127.00Vanderburgh Laubscher Meadows Landfill MSW Landfill 61,302.33Vanderburgh Veolia Es Solid Waste Midwest, Inc. Transfer Station 3,196.00Vermillion West Clinton II C/D Site Construction/Demolition Site 1,385.00Vermillion West Clinton Landfill MSW Landfill 5.00Vigo Sycamore Ridge Landfill MSW Landfill 32,684.00Wabash Wabash Valley Landfill MSW Landfill 42.00Warren Tri-County Transfer Station Transfer Station 225.00White Liberty Landfill MSW Landfill 421,937.00White Liquid Solutions, LLC Processing Facility - Other 1,104 Total for All Facilities 2,720,427
IDEM 2007 Indiana Solid Waste Facility Report Page 35
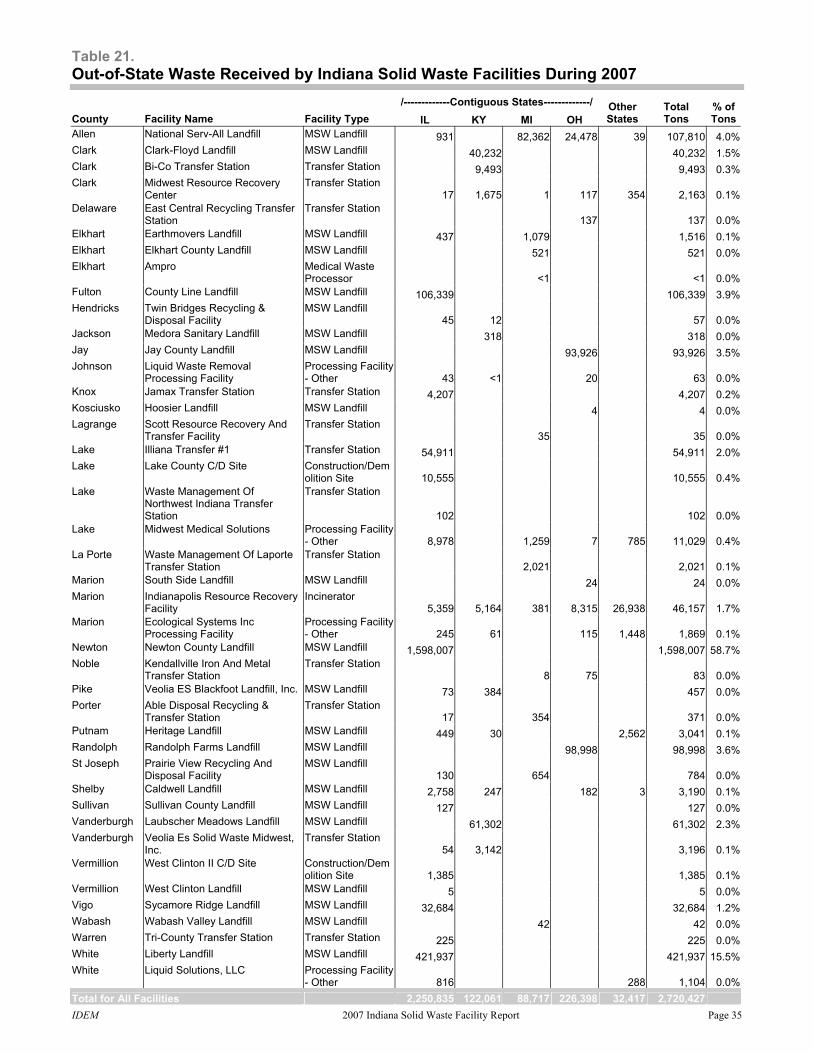
Table 21. Out-of-State Waste Received by Indiana Solid Waste Facilities During 2007
/-------------Contiguous States-------------/ County Facility Name Facility Type IL KY MI OH
Other States
Total Tons
% ofTons
Allen National Serv-All Landfill MSW Landfill 931 82,362 24,478 39 107,810 4.0%Clark Clark-Floyd Landfill MSW Landfill 40,232 40,232 1.5%Clark Bi-Co Transfer Station Transfer Station 9,493 9,493 0.3%Clark Midwest Resource Recovery
Center Transfer Station
17 1,675 1 117 354 2,163 0.1%Delaware East Central Recycling Transfer
Station Transfer Station
137 137 0.0%Elkhart Earthmovers Landfill MSW Landfill 437 1,079 1,516 0.1%Elkhart Elkhart County Landfill MSW Landfill 521 521 0.0%Elkhart Ampro Medical Waste
Processor
<1 <1 0.0%Fulton County Line Landfill MSW Landfill 106,339 106,339 3.9%Hendricks Twin Bridges Recycling &
Disposal Facility MSW Landfill
45 12 57 0.0%Jackson Medora Sanitary Landfill MSW Landfill 318 318 0.0%Jay Jay County Landfill MSW Landfill 93,926 93,926 3.5%Johnson Liquid Waste Removal
Processing Facility Processing Facility - Other 43 <1 20 63 0.0%
Knox Jamax Transfer Station Transfer Station 4,207 4,207 0.2%Kosciusko Hoosier Landfill MSW Landfill 4 4 0.0%Lagrange Scott Resource Recovery And
Transfer Facility Transfer Station
35 35 0.0%Lake Illiana Transfer #1 Transfer Station 54,911 54,911 2.0%Lake Lake County C/D Site Construction/Dem
olition Site 10,555 10,555 0.4%Lake Waste Management Of
Northwest Indiana Transfer Station
Transfer Station
102 102 0.0%Lake Midwest Medical Solutions Processing Facility
- Other 8,978 1,259 7 785 11,029 0.4%La Porte Waste Management Of Laporte
Transfer Station Transfer Station
2,021 2,021 0.1%Marion South Side Landfill MSW Landfill 24 24 0.0%Marion Indianapolis Resource Recovery
Facility Incinerator
5,359 5,164 381 8,315 26,938 46,157 1.7%Marion Ecological Systems Inc
Processing Facility Processing Facility - Other 245 61 115 1,448 1,869 0.1%
Newton Newton County Landfill MSW Landfill 1,598,007 1,598,007 58.7%Noble Kendallville Iron And Metal
Transfer Station Transfer Station
8 75 83 0.0%Pike Veolia ES Blackfoot Landfill, Inc. MSW Landfill 73 384 457 0.0%Porter Able Disposal Recycling &
Transfer Station Transfer Station
17 354 371 0.0%Putnam Heritage Landfill MSW Landfill 449 30 2,562 3,041 0.1%Randolph Randolph Farms Landfill MSW Landfill 98,998 98,998 3.6%St Joseph Prairie View Recycling And
Disposal Facility MSW Landfill
130 654 784 0.0%Shelby Caldwell Landfill MSW Landfill 2,758 247 182 3 3,190 0.1%Sullivan Sullivan County Landfill MSW Landfill 127 127 0.0%Vanderburgh Laubscher Meadows Landfill MSW Landfill 61,302 61,302 2.3%Vanderburgh Veolia Es Solid Waste Midwest,
Inc. Transfer Station
54 3,142 3,196 0.1%Vermillion West Clinton II C/D Site Construction/Dem
olition Site 1,385 1,385 0.1%Vermillion West Clinton Landfill MSW Landfill 5 5 0.0%Vigo Sycamore Ridge Landfill MSW Landfill 32,684 32,684 1.2%Wabash Wabash Valley Landfill MSW Landfill 42 42 0.0%Warren Tri-County Transfer Station Transfer Station 225 225 0.0%White Liberty Landfill MSW Landfill 421,937 421,937 15.5%White Liquid Solutions, LLC Processing Facility
- Other 816 288 1,104 0.0%Total for All Facilities 2,250,835 122,061 88,717 226,398 32,417 2,720,427
IDEM 2007 Indiana Solid Waste Facility Report Page 36
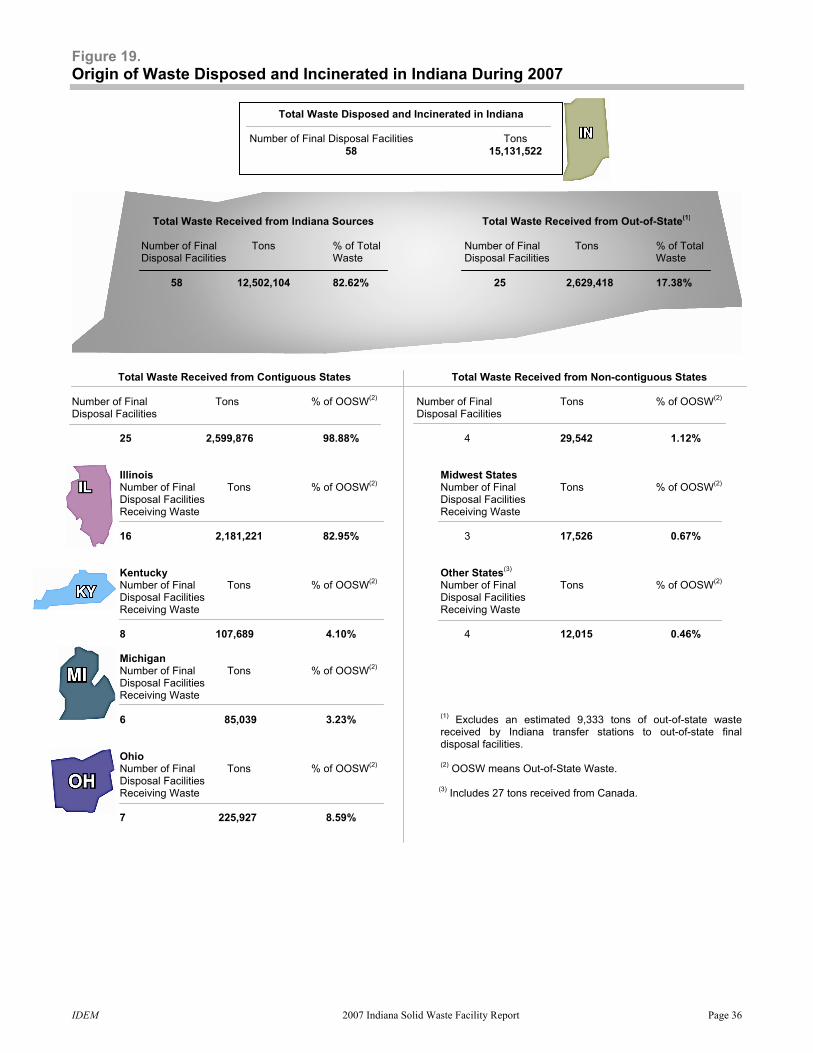
Figure 19. Origin of Waste Disposed and Incinerated in Indiana During 2007
Total Waste Received from Contiguous States Number of Final Tons % of OOSW(2) Disposal Facilities 25 2,599,876 98.88% Illinois Number of Final Tons % of OOSW(2) Disposal Facilities Receiving Waste 16 2,181,221 82.95% Kentucky Number of Final Tons % of OOSW(2) Disposal Facilities Receiving Waste 8 107,689 4.10% Michigan Number of Final Tons % of OOSW(2) Disposal Facilities Receiving Waste 6 85,039 3.23% Ohio Number of Final Tons % of OOSW(2) Disposal Facilities Receiving Waste 7 225,927 8.59%
Total Waste Received from Non-contiguous States Number of Final Tons % of OOSW(2) Disposal Facilities 4 29,542 1.12% Midwest States Number of Final Tons % of OOSW(2) Disposal Facilities Receiving Waste 3 17,526 0.67% Other States(3) Number of Final Tons % of OOSW(2) Disposal Facilities Receiving Waste 4 12,015 0.46% (1) Excludes an estimated 9,333 tons of out-of-state waste received by Indiana transfer stations to out-of-state final disposal facilities. (2) OOSW means Out-of-State Waste. (3) Includes 27 tons received from Canada.
Total Waste Disposed and Incinerated in Indiana
Number of Final Disposal Facilities Tons 58 15,131,522
Total Waste Received from Indiana Sources Number of Final Tons % of Total Disposal Facilities Waste 58 12,502,104 82.62%
Total Waste Received from Out-of-State(1) Number of Final Tons % of Total Disposal Facilities Waste 25 2,629,418 17.38%
IDEM 2007 Indiana Solid Waste Facility Report Page 37
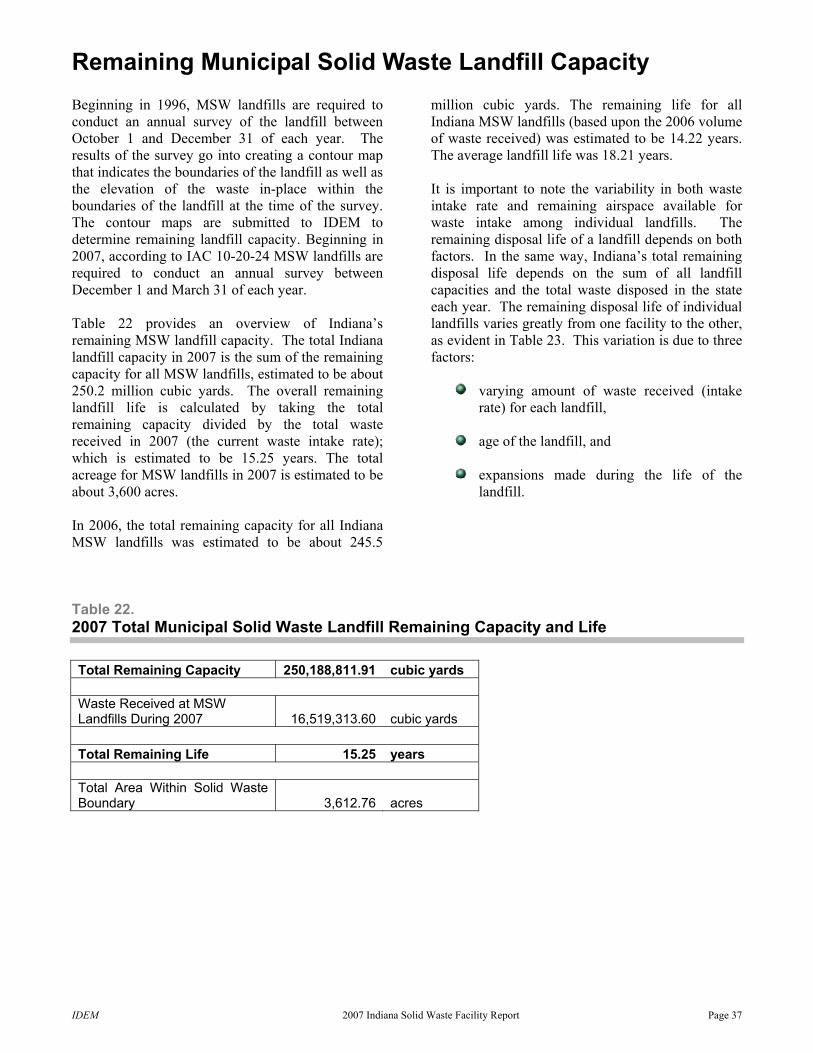
Remaining Municipal Solid Waste Landfill Capacity Beginning in 1996, MSW landfills are required to conduct an annual survey of the landfill between October 1 and December 31 of each year. The results of the survey go into creating a contour map that indicates the boundaries of the landfill as well as the elevation of the waste in-place within the boundaries of the landfill at the time of the survey. The contour maps are submitted to IDEM to determine remaining landfill capacity. Beginning in 2007, according to IAC 10-20-24 MSW landfills are required to conduct an annual survey between December 1 and March 31 of each year. Table 22 provides an overview of Indiana’s remaining MSW landfill capacity. The total Indiana landfill capacity in 2007 is the sum of the remaining capacity for all MSW landfills, estimated to be about 250.2 million cubic yards. The overall remaining landfill life is calculated by taking the total remaining capacity divided by the total waste received in 2007 (the current waste intake rate); which is estimated to be 15.25 years. The total acreage for MSW landfills in 2007 is estimated to be about 3,600 acres. In 2006, the total remaining capacity for all Indiana MSW landfills was estimated to be about 245.5
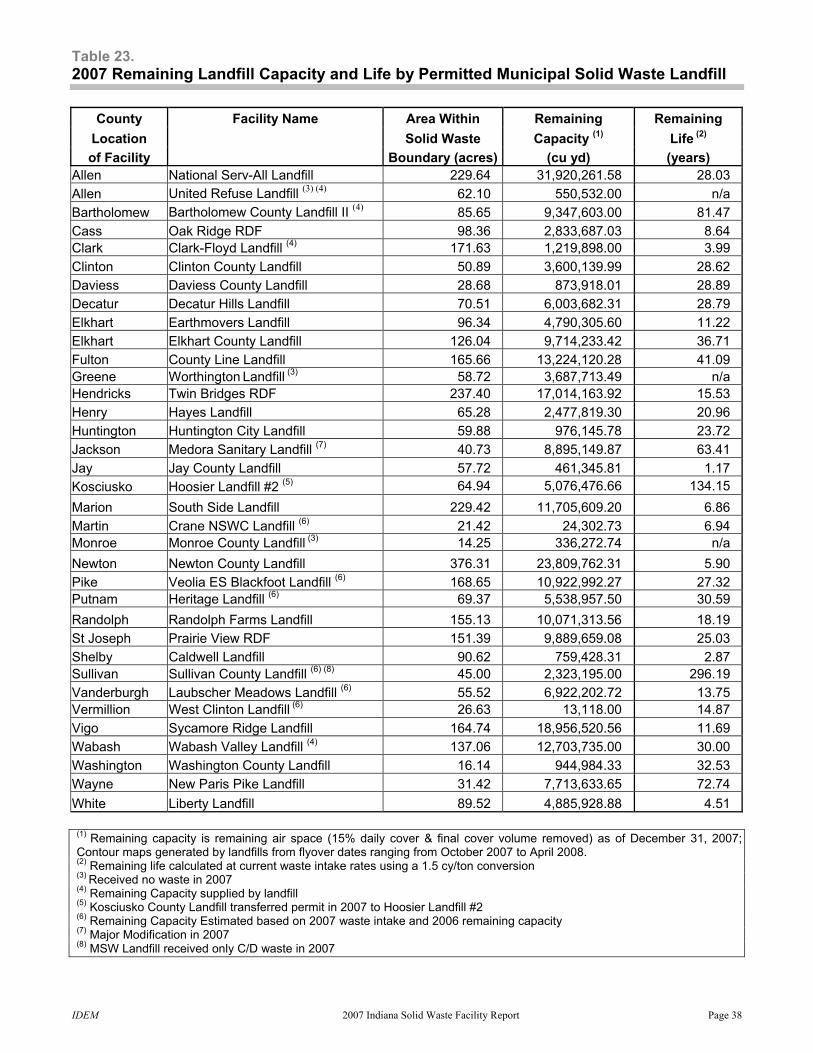
million cubic yards. The remaining life for all Indiana MSW landfills (based upon the 2006 volume of waste received) was estimated to be 14.22 years. The average landfill life was 18.21 years. It is important to note the variability in both waste intake rate and remaining airspace available for waste intake among individual landfills. The remaining disposal life of a landfill depends on both factors. In the same way, Indiana’s total remaining disposal life depends on the sum of all landfill capacities and the total waste disposed in the state each year. The remaining disposal life of individual landfills varies greatly from one facility to the other, as evident in Table 23. This variation is due to three factors:
varying amount of waste received (intake rate) for each landfill,
age of the landfill, and
expansions made during the life of the
landfill.
Table 22. 2007 Total Municipal Solid Waste Landfill Remaining Capacity and Life Total Remaining Capacity 250,188,811.91 cubic yards Waste Received at MSW Landfills During 2007 16,519,313.60 cubic yards Total Remaining Life 15.25 years Total Area Within Solid Waste Boundary 3,612.76 acres
IDEM 2007 Indiana Solid Waste Facility Report Page 38
Table 23. 2007 Remaining Landfill Capacity and Life by Permitted Municipal Solid Waste Landfill
County Facility Name Area Within Remaining Remaining Location Solid Waste Capacity (1) Life (2) of Facility Boundary (acres) (cu yd) (years)
Allen National Serv-All Landfill 229.64 31,920,261.58 28.03 Allen United Refuse Landfill (3) (4) 62.10 550,532.00 n/a Bartholomew Bartholomew County Landfill II (4) 85.65 9,347,603.00 81.47 Cass Oak Ridge RDF 98.36 2,833,687.03 8.64 Clark Clark-Floyd Landfill (4) 171.63 1,219,898.00 3.99 Clinton Clinton County Landfill 50.89 3,600,139.99 28.62 Daviess Daviess County Landfill 28.68 873,918.01 28.89 Decatur Decatur Hills Landfill 70.51 6,003,682.31 28.79 Elkhart Earthmovers Landfill 96.34 4,790,305.60 11.22 Elkhart Elkhart County Landfill 126.04 9,714,233.42 36.71 Fulton County Line Landfill 165.66 13,224,120.28 41.09 Greene Worthington Landfill (3) 58.72 3,687,713.49 n/a Hendricks Twin Bridges RDF 237.40 17,014,163.92 15.53 Henry Hayes Landfill 65.28 2,477,819.30 20.96 Huntington Huntington City Landfill 59.88 976,145.78 23.72 Jackson Medora Sanitary Landfill (7) 40.73 8,895,149.87 63.41 Jay Jay County Landfill 57.72 461,345.81 1.17 Kosciusko Hoosier Landfill #2 (5) 64.94 5,076,476.66 134.15 Marion South Side Landfill 229.42 11,705,609.20 6.86 Martin Crane NSWC Landfill (6) 21.42 24,302.73 6.94 Monroe Monroe County Landfill (3) 14.25 336,272.74 n/a Newton Newton County Landfill 376.31 23,809,762.31 5.90 Pike Veolia ES Blackfoot Landfill (6) 168.65 10,922,992.27 27.32 Putnam Heritage Landfill (6) 69.37 5,538,957.50 30.59 Randolph Randolph Farms Landfill 155.13 10,071,313.56 18.19 St Joseph Prairie View RDF 151.39 9,889,659.08 25.03 Shelby Caldwell Landfill 90.62 759,428.31 2.87 Sullivan Sullivan County Landfill (6) (8) 45.00 2,323,195.00 296.19 Vanderburgh Laubscher Meadows Landfill (6) 55.52 6,922,202.72 13.75 Vermillion West Clinton Landfill (6) 26.63 13,118.00 14.87 Vigo Sycamore Ridge Landfill 164.74 18,956,520.56 11.69 Wabash Wabash Valley Landfill (4) 137.06 12,703,735.00 30.00 Washington Washington County Landfill 16.14 944,984.33 32.53 Wayne New Paris Pike Landfill 31.42 7,713,633.65 72.74 White Liberty Landfill 89.52 4,885,928.88 4.51
(1) Remaining capacity is remaining air space (15% daily cover & final cover volume removed) as of December 31, 2007; Contour maps generated by landfills from flyover dates ranging from October 2007 to April 2008. (2) Remaining life calculated at current waste intake rates using a 1.5 cy/ton conversion (3) Received no waste in 2007 (4) Remaining Capacity supplied by landfill (5) Kosciusko County Landfill transferred permit in 2007 to Hoosier Landfill #2 (6) Remaining Capacity Estimated based on 2007 waste intake and 2006 remaining capacity (7) Major Modification in 2007 (8) MSW Landfill received only C/D waste in 2007