Embed Size (px)
Citation preview
Isle of Man
Business Confidence
Survey 2017
Economic Affairs
Cabinet Office
February 2018
GD 2018/0005
1
Contents Executive Summary ....................................................................................................... 2
Context ........................................................................................................................ 3
Index of Business Confidence ......................................................................................... 4
Manufacturing Sector .................................................................................................... 6
Manufacturing Sector: Current Indicators ..................................................................... 6
Manufacturing Sector: Future Indicators ...................................................................... 9
Manufacturing Sector: Employment Indicators ............................................................. 10
Services Sector ............................................................................................................ 12
Services Sector: Current Indicators............................................................................. 12
Services Sector: Future Indicators .............................................................................. 13
Services Sector: Employment Indicators ..................................................................... 14
Retail and Wholesale Sector .......................................................................................... 16
Retail and Wholesale: Current Indicators .................................................................... 16
Retail and Wholesale: Future indicators ...................................................................... 17
Retail and Wholesale: Employment indicators .............................................................. 19
Construction ................................................................................................................ 20
Construction Sector: Current Indicators ...................................................................... 20
Construction Sector: Future Indicators ........................................................................ 22
Construction Sector: Employment Indicators ............................................................... 23
Financial Services ......................................................................................................... 24
Financial Services: Current Indicators ......................................................................... 24
Financial Services: Future Indicators........................................................................... 27
Financial Services: Employment Indicators .................................................................. 29
Satisfaction.................................................................................................................. 30
Flexible Working .......................................................................................................... 35
Living Wage ................................................................................................................ 37
Cyber Risk and Cybercrime ........................................................................................... 38
Qualitative Data ........................................................................................................... 40
Appendix 1: Methodology ............................................................................................. 41
Appendix 2: 2017 Questionnaire .................................................................................... 43
2
Executive Summary
The Isle of Man 2017 Business Confidence Index overall score is 115.39,
which indicates a general business environment of optimism and the
anticipation of growth.
The most confident sector is Financial Services (Index=127.25) followed by
Retail/Wholesale (Index=122.98), while the least confident sector at this time
is Construction (Index=-102.40)
Employers across all sectors anticipate an increase in employment
Employers across all sectors are, on average, more optimistic about business
growth over the next six months as compared to growth observed over the
previous six months
The majority of businesses (58.2%) indicate that they already pay all
employees at or above the proposed Isle of Man Living Wage
The majority of businesses (70.7%) offer at least one form of flexible working
arrangement to at least some of their employees
Employers on average are satisfied with the quality of business-adjacent
services available on the Isle of Man, but tend to be less satisfied with the
cost of services
One in four employers is satisfied with the current work permit system
Nearly three-quarters (71.3%) of employers feel that it is easy to do business
on the Isle of Man
3
Context
The IOM Business Confidence Survey is a survey of local employers, designed to
gauge business activity, optimism, planning, staffing and investment for all sectors
of the economy.
Business surveys provide essential information for economic monitoring, short-term
forecasting and economic research. Business confidence surveys are widely used to
detect turning points in the economic cycle. The IOM Business Confidence Survey is
designed to complement official economic statistics, which are often available on
delayed cycles.
The IOM Business Confidence Survey is designed to reflect the European
Harmonized Consumer and Business Survey, which has been used across the EU, EA
and UK since 2007.
In successive years, the survey will compile indices of employers’ high-level
assessments of business activity, new business, capacity utilisation, product prices,
turnover, employment, and business optimism. Broader topics covered in the
questionnaire include the quality and cost of various business-adjacent services,
regulation, and the ease of doing business on the Isle of Man.
In addition, the 2017 Business Confidence Survey asked employers’ perspective on:
the skills gap
the living wage
cybersecurity
the work permit system
flexible working arrangements
4
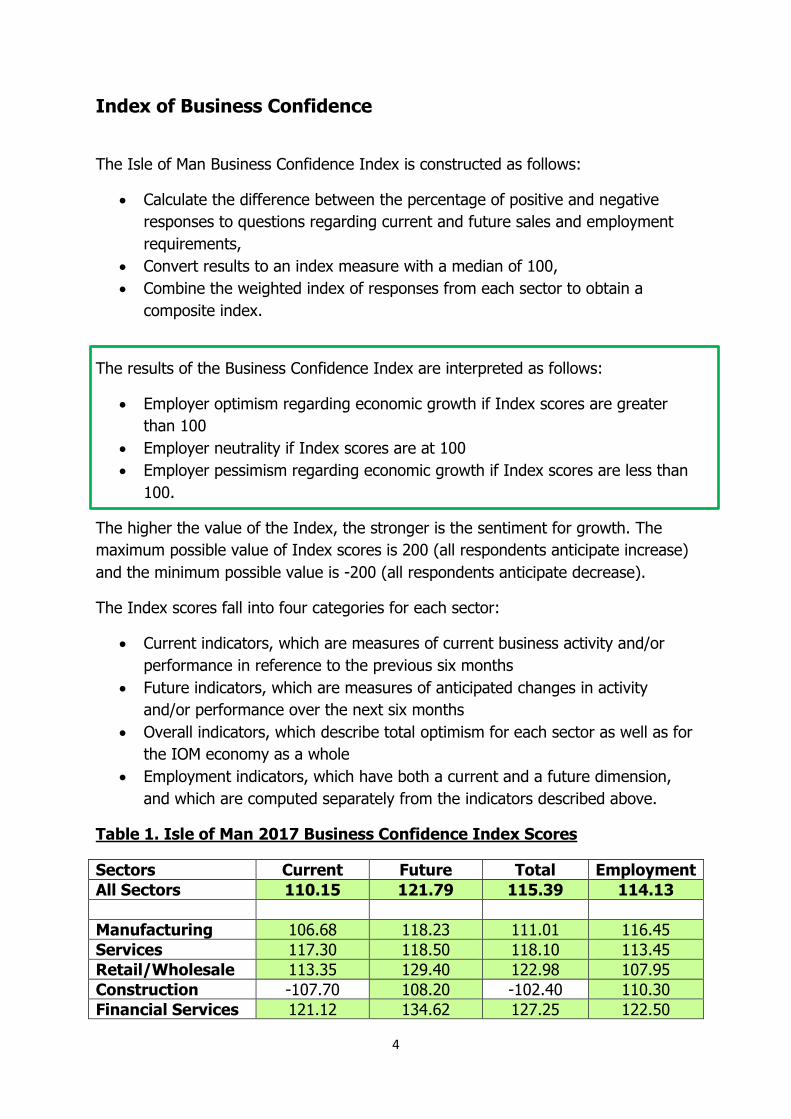
Index of Business Confidence
The Isle of Man Business Confidence Index is constructed as follows:
Calculate the difference between the percentage of positive and negative
responses to questions regarding current and future sales and employment
requirements,
Convert results to an index measure with a median of 100,
Combine the weighted index of responses from each sector to obtain a
composite index.
The results of the Business Confidence Index are interpreted as follows:
Employer optimism regarding economic growth if Index scores are greater
than 100
Employer neutrality if Index scores are at 100
Employer pessimism regarding economic growth if Index scores are less than
100.
The higher the value of the Index, the stronger is the sentiment for growth. The
maximum possible value of Index scores is 200 (all respondents anticipate increase)
and the minimum possible value is -200 (all respondents anticipate decrease).
The Index scores fall into four categories for each sector:
Current indicators, which are measures of current business activity and/or
performance in reference to the previous six months
Future indicators, which are measures of anticipated changes in activity
and/or performance over the next six months
Overall indicators, which describe total optimism for each sector as well as for
the IOM economy as a whole
Employment indicators, which have both a current and a future dimension,
and which are computed separately from the indicators described above.
Table 1. Isle of Man 2017 Business Confidence Index Scores
Sectors Current Future Total Employment
All Sectors 110.15 121.79 115.39 114.13
Manufacturing 106.68 118.23 111.01 116.45
Services 117.30 118.50 118.10 113.45
Retail/Wholesale 113.35 129.40 122.98 107.95
Construction -107.70 108.20 -102.40 110.30
Financial Services 121.12 134.62 127.25 122.50
5
As indicated in Table 1 above, the majority of sectors of the Isle of Man economy
are currently optimistic; the current exception is the Construction sector, although it
must be pointed out that employers in Construction indicate optimism for the near
future, particularly in terms of employment. Please see Appendix 1 for a discussion
of the weighting formula applied to the Index scores.
The 2017 Business Confidence Survey establishes a baseline of index measures for
employer optimism and employment intentions. In future iterations of the survey, a
time series of measures will be built that will serve to track changes in business
confidence on an annual basis. Consequently, future reports in this series will
present data in a different format from the presentation used in this report.
NOTE ON ECONOMIC SECTORS
The Isle of Man has twenty-four economic sectors, as identified by the National
Income accounts. A number of these sectors are disproportionately small, with fewer
than five employers and fewer than twenty employees; while these sectors were not
systematically excluded from the sample, they naturally failed to be selected.1
The sample was subjected to a two-stage sampling procedure with post-hoc
stratification weighting based upon number of employees. Please see Appendix 1.
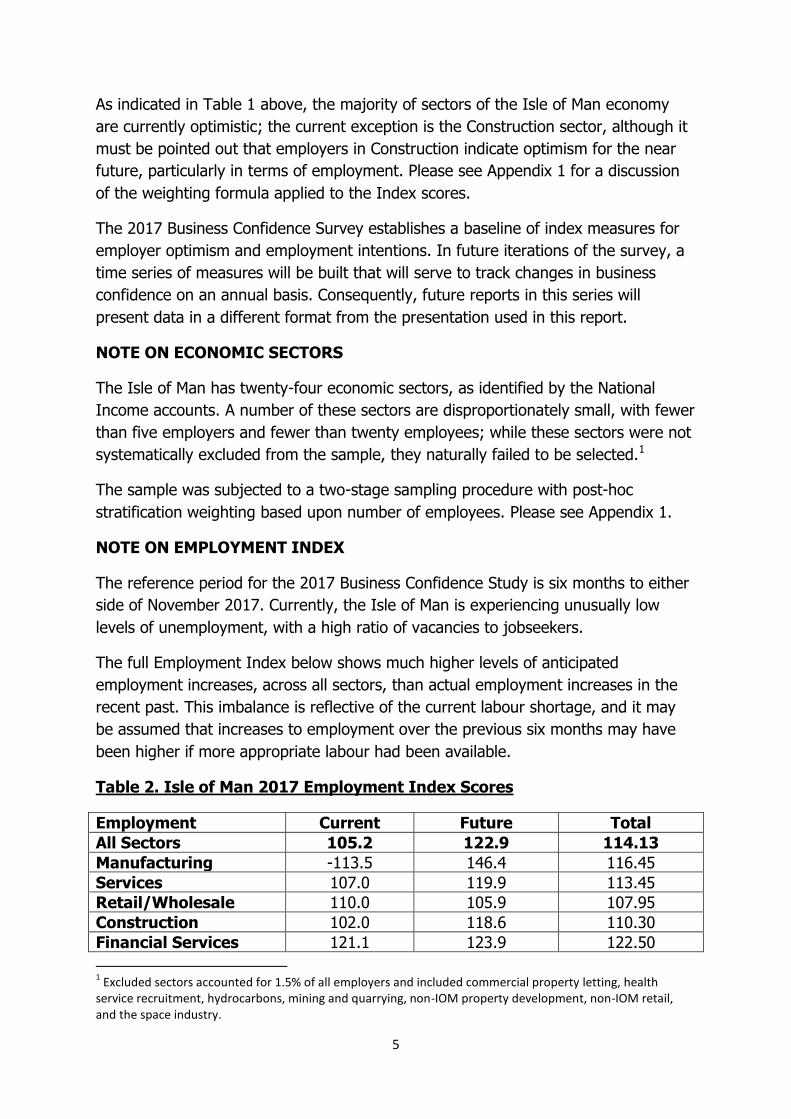
NOTE ON EMPLOYMENT INDEX
The reference period for the 2017 Business Confidence Study is six months to either
side of November 2017. Currently, the Isle of Man is experiencing unusually low
levels of unemployment, with a high ratio of vacancies to jobseekers.
The full Employment Index below shows much higher levels of anticipated
employment increases, across all sectors, than actual employment increases in the
recent past. This imbalance is reflective of the current labour shortage, and it may
be assumed that increases to employment over the previous six months may have
been higher if more appropriate labour had been available.
Table 2. Isle of Man 2017 Employment Index Scores
Employment Current Future Total
All Sectors 105.2 122.9 114.13
Manufacturing -113.5 146.4 116.45
Services 107.0 119.9 113.45
Retail/Wholesale 110.0 105.9 107.95
Construction 102.0 118.6 110.30
Financial Services 121.1 123.9 122.50
1 Excluded sectors accounted for 1.5% of all employers and included commercial property letting, health
service recruitment, hydrocarbons, mining and quarrying, non-IOM property development, non-IOM retail, and the space industry.
6
Manufacturing Sector
The Manufacturing sector accounts for 15.7% of the Isle of Man economy in terms
of employment, and includes:
Agriculture, Forestry, and Fisheries
Mining and Quarrying
General Manufacturing
Manufacturing (Food and Drink)
Manufacturing (Engineering)
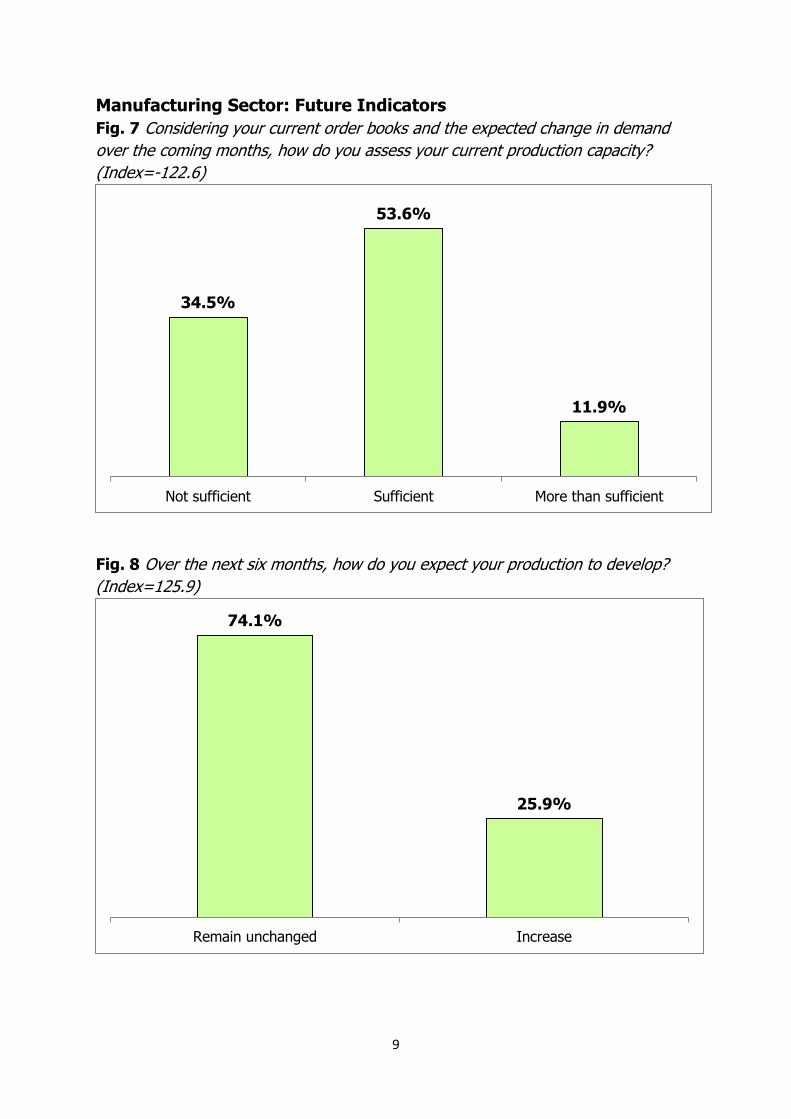
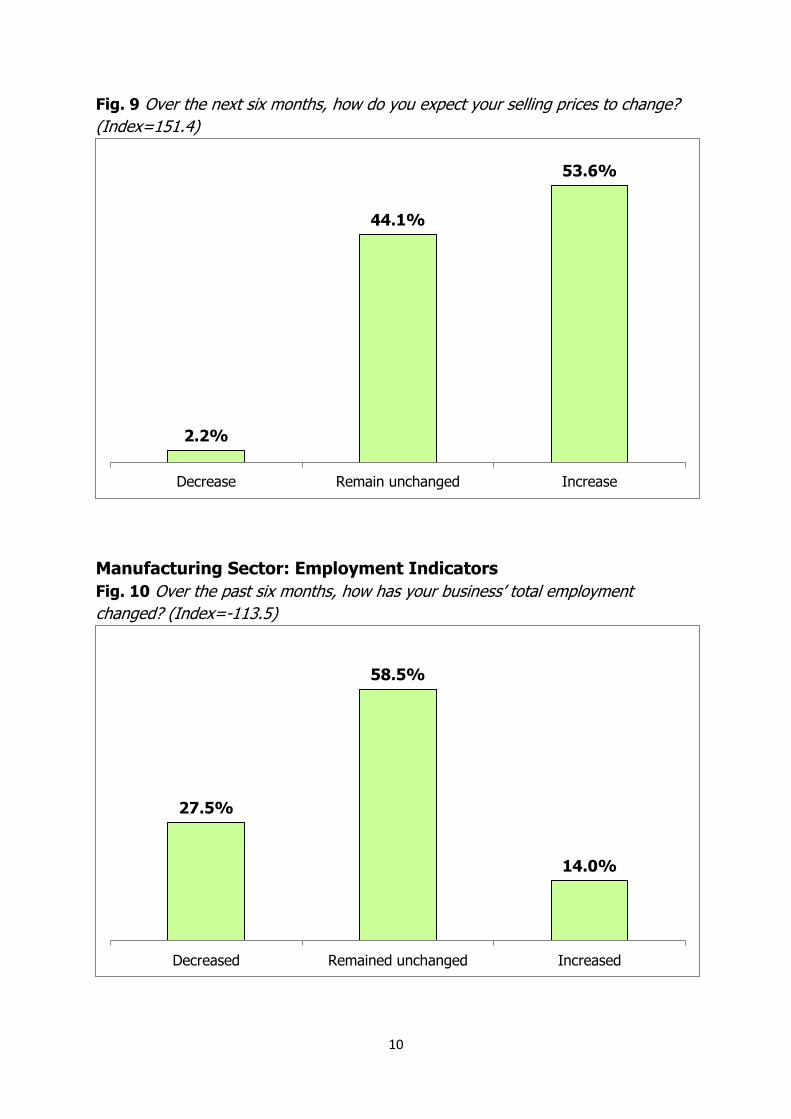
The Manufacturing sector is optimistic for the near future, and anticipates increased
production capacity, significant price increases, and the strongest growth in hiring of
all sectors. Manufacturing is currently the sector with the strongest employment
‘pull’, with no employers seeking to reduce employment and nearly half seeking to
increase levels of staffing.
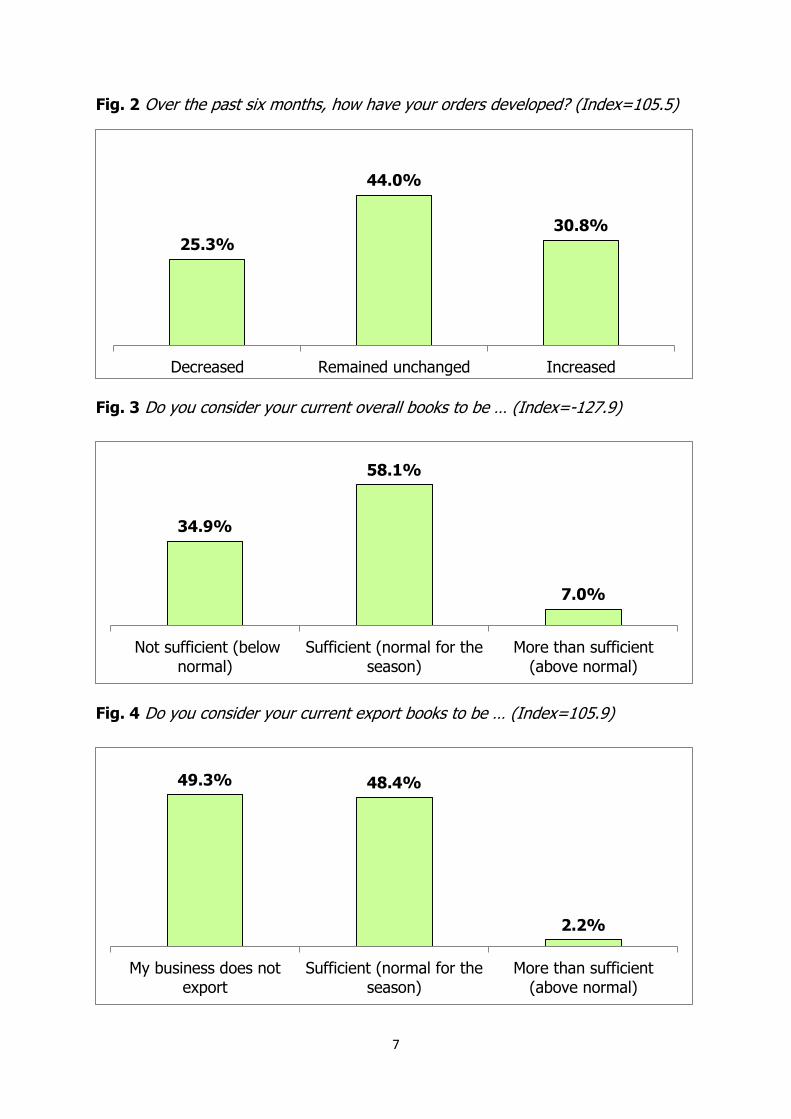
However, employers also indicate that the six months previous to the 2017 Business
Confidence Survey saw some businesses face a decrease in orders, despite a sector-
wide maintenance or increase of production. One in three manufacturers feel that
their current order books are not sufficient, although exporting manufacturers widely
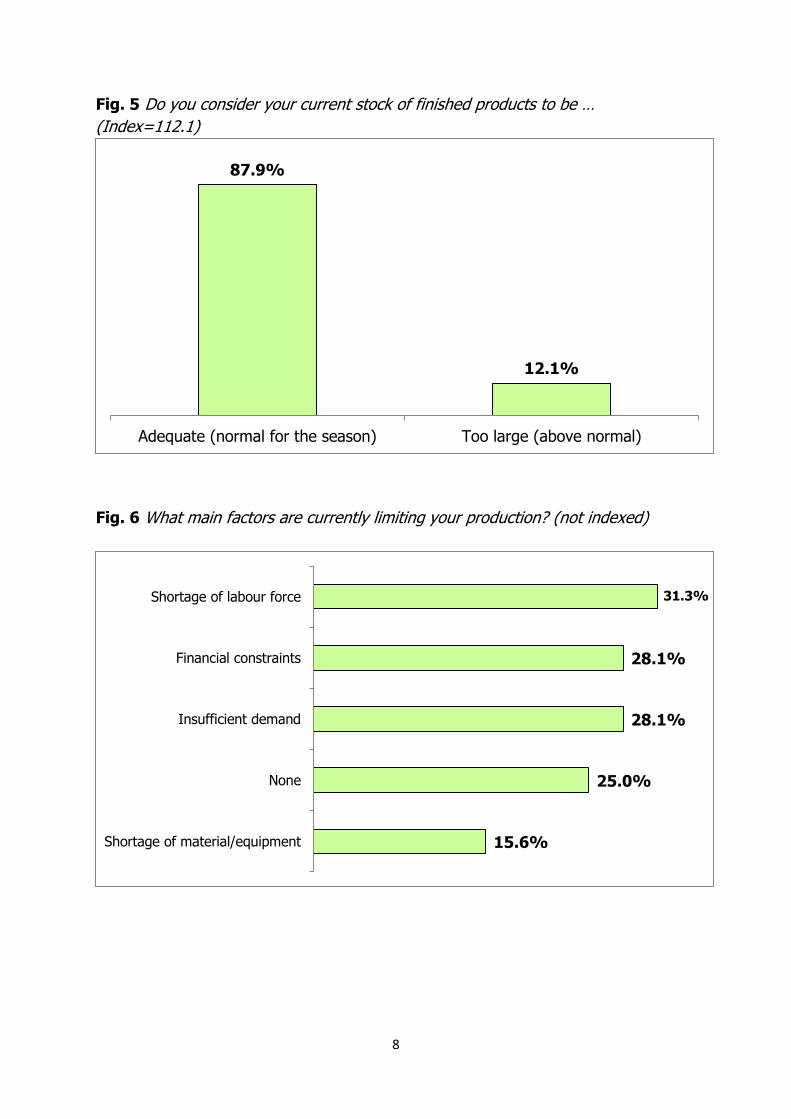
indicate that export orders are currently normal. One in eight manufacturers report
that they are currently oversupplied.
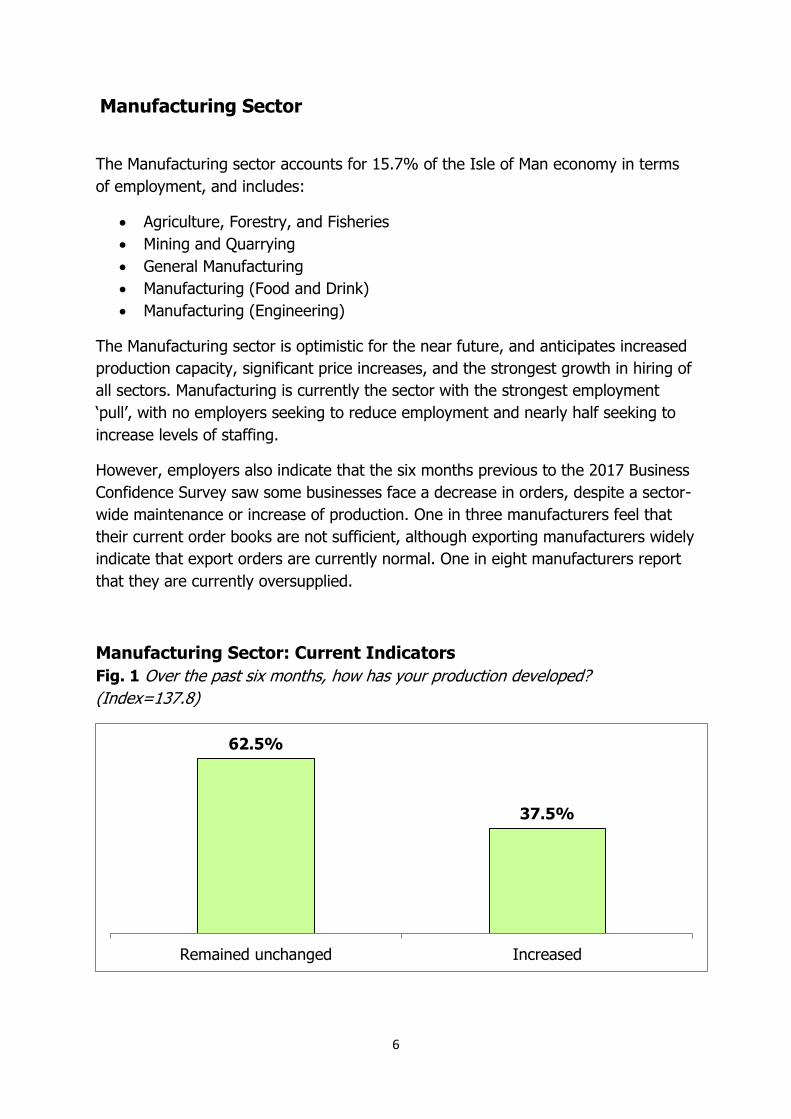
Manufacturing Sector: Current Indicators
Fig. 1 Over the past six months, how has your production developed?
(Index=137.8)
62.5%
37.5%
Remained unchanged Increased
7
Fig. 2 Over the past six months, how have your orders developed? (Index=105.5)
Fig. 3 Do you consider your current overall books to be … (Index=-127.9)
Fig. 4 Do you consider your current export books to be … (Index=105.9)
25.3%
44.0%
30.8%
Decreased Remained unchanged Increased
34.9%
58.1%
7.0%
Not sufficient (belownormal)
Sufficient (normal for theseason)
More than sufficient(above normal)
49.3% 48.4%
2.2%
My business does notexport
Sufficient (normal for theseason)
More than sufficient(above normal)
8
Fig. 5 Do you consider your current stock of finished products to be …
(Index=112.1)
Fig. 6 What main factors are currently limiting your production? (not indexed)
87.9%
12.1%
Adequate (normal for the season) Too large (above normal)
15.6%
25.0%
28.1%
28.1%
31.3%
Shortage of material/equipment
None
Insufficient demand
Financial constraints
Shortage of labour force
9
Manufacturing Sector: Future Indicators
Fig. 7 Considering your current order books and the expected change in demand
over the coming months, how do you assess your current production capacity?
(Index=-122.6)
Fig. 8 Over the next six months, how do you expect your production to develop?
(Index=125.9)
34.5%
53.6%
11.9%
Not sufficient Sufficient More than sufficient
74.1%
25.9%
Remain unchanged Increase
10
Fig. 9 Over the next six months, how do you expect your selling prices to change?
(Index=151.4)
Manufacturing Sector: Employment Indicators
Fig. 10 Over the past six months, how has your business’ total employment
changed? (Index=-113.5)
2.2%
44.1%
53.6%
Decrease Remain unchanged Increase
27.5%
58.5%
14.0%
Decreased Remained unchanged Increased
11
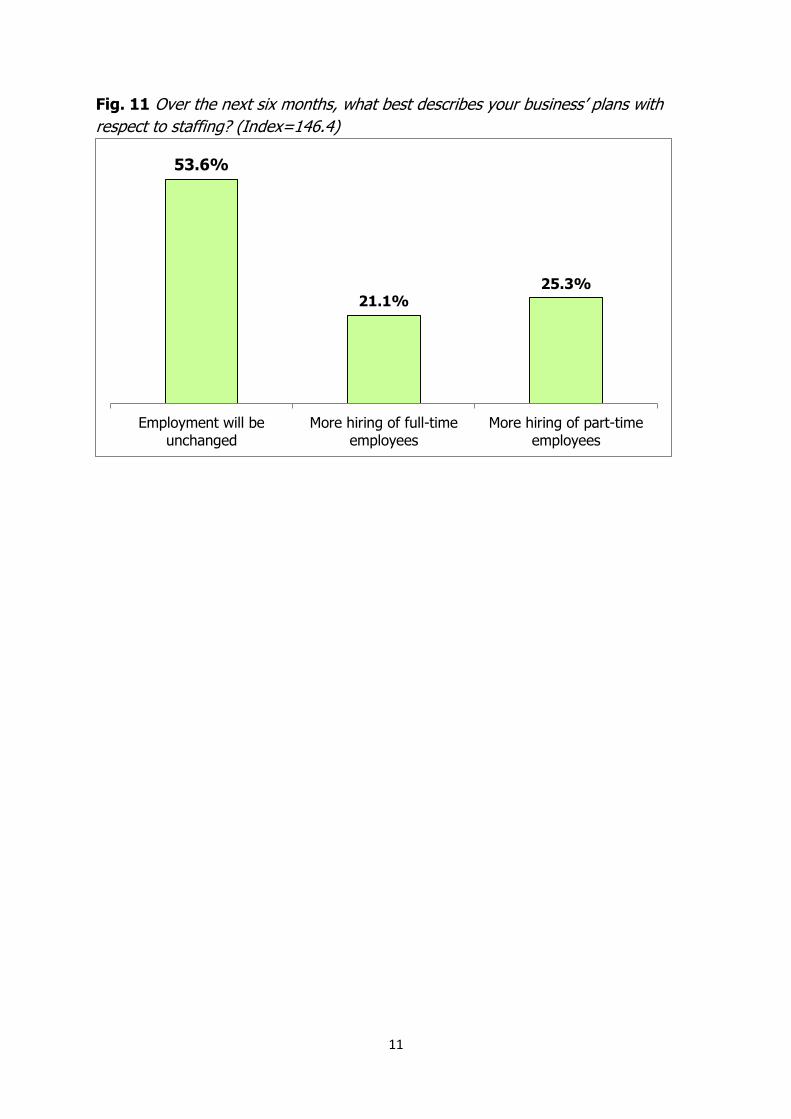
Fig. 11 Over the next six months, what best describes your business’ plans with
respect to staffing? (Index=146.4)
53.6%
21.1% 25.3%
Employment will beunchanged
More hiring of full-timeemployees
More hiring of part-timeemployees
12
Services Sector
The Services sector accounts for 42.3% of the Isle of Man economy in terms of
employment, and includes:
Catering and Entertainment
Charitable and Third Sector
Services
Education
e-Gaming
Information and
Communications Technology
Legal and Accountancy
Services
Media and Creative Services
Medical and Health Services
Other Professional Services
Shipping and Aircraft
Tourist Accommodation
Transport and Communications
Utilities
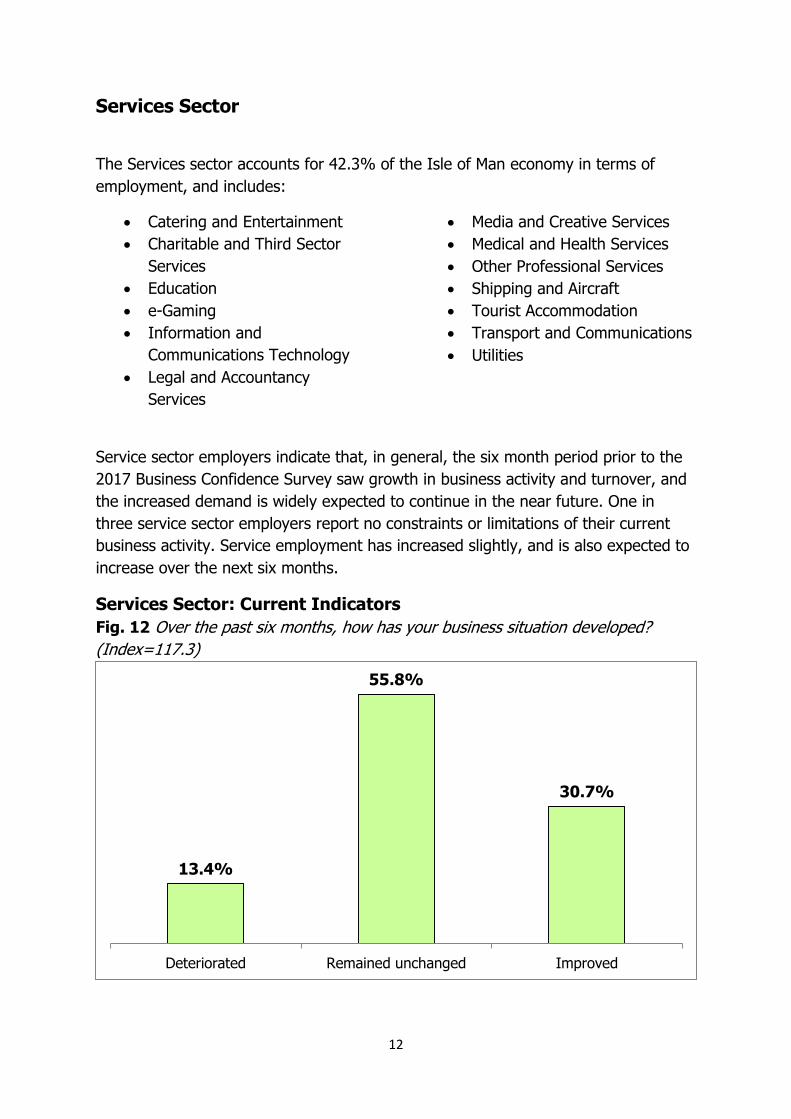
Service sector employers indicate that, in general, the six month period prior to the
2017 Business Confidence Survey saw growth in business activity and turnover, and
the increased demand is widely expected to continue in the near future. One in
three service sector employers report no constraints or limitations of their current
business activity. Service employment has increased slightly, and is also expected to
increase over the next six months.
Services Sector: Current Indicators
Fig. 12 Over the past six months, how has your business situation developed?
(Index=117.3)
13.4%
55.8%
30.7%
Deteriorated Remained unchanged Improved
13
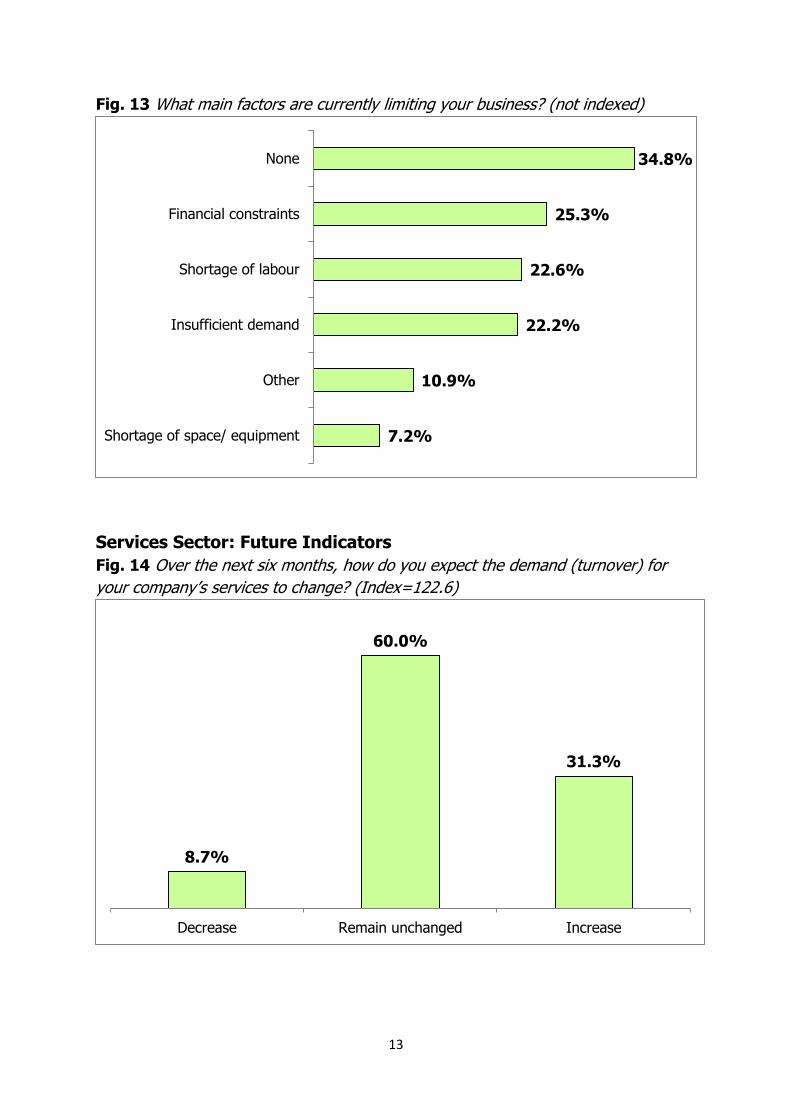
Fig. 13 What main factors are currently limiting your business? (not indexed)
Services Sector: Future Indicators
Fig. 14 Over the next six months, how do you expect the demand (turnover) for
your company’s services to change? (Index=122.6)
7.2%
10.9%
22.2%
22.6%
25.3%
34.8%
Shortage of space/ equipment
Other
Insufficient demand
Shortage of labour
Financial constraints
None
8.7%
60.0%
31.3%
Decrease Remain unchanged Increase
14
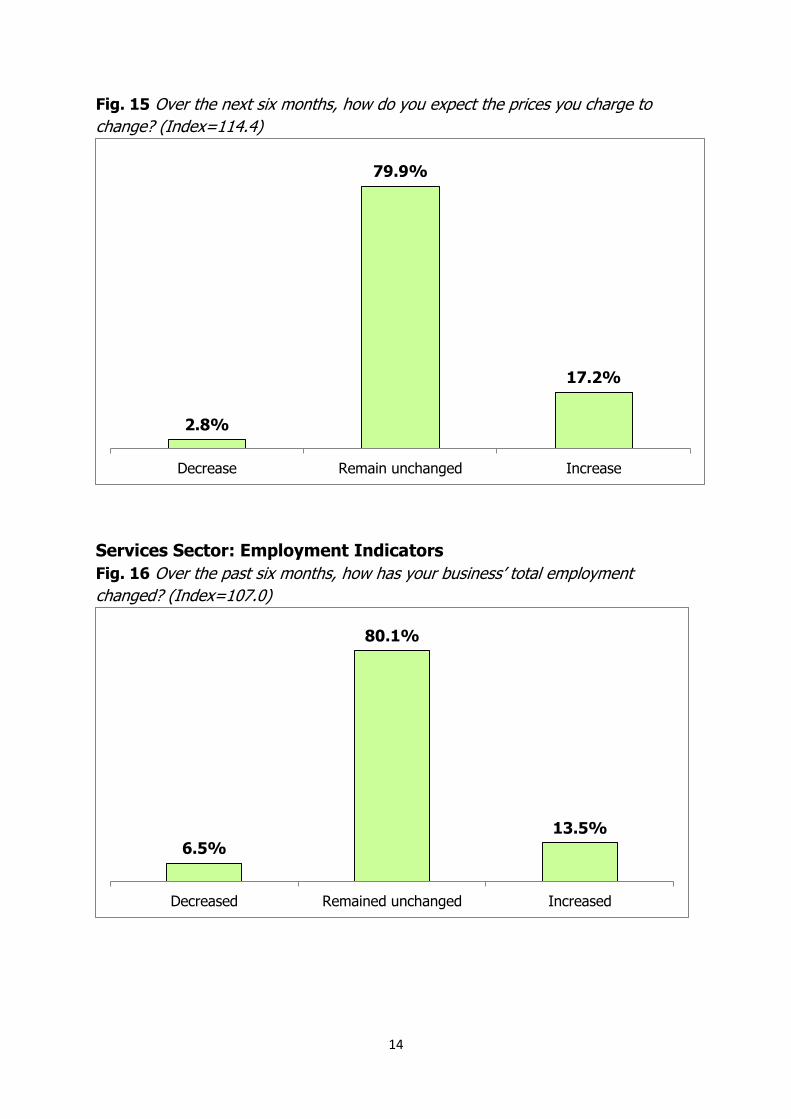
Fig. 15 Over the next six months, how do you expect the prices you charge to
change? (Index=114.4)
Services Sector: Employment Indicators
Fig. 16 Over the past six months, how has your business’ total employment
changed? (Index=107.0)
2.8%
79.9%
17.2%
Decrease Remain unchanged Increase
6.5%
80.1%
13.5%
Decreased Remained unchanged Increased
15
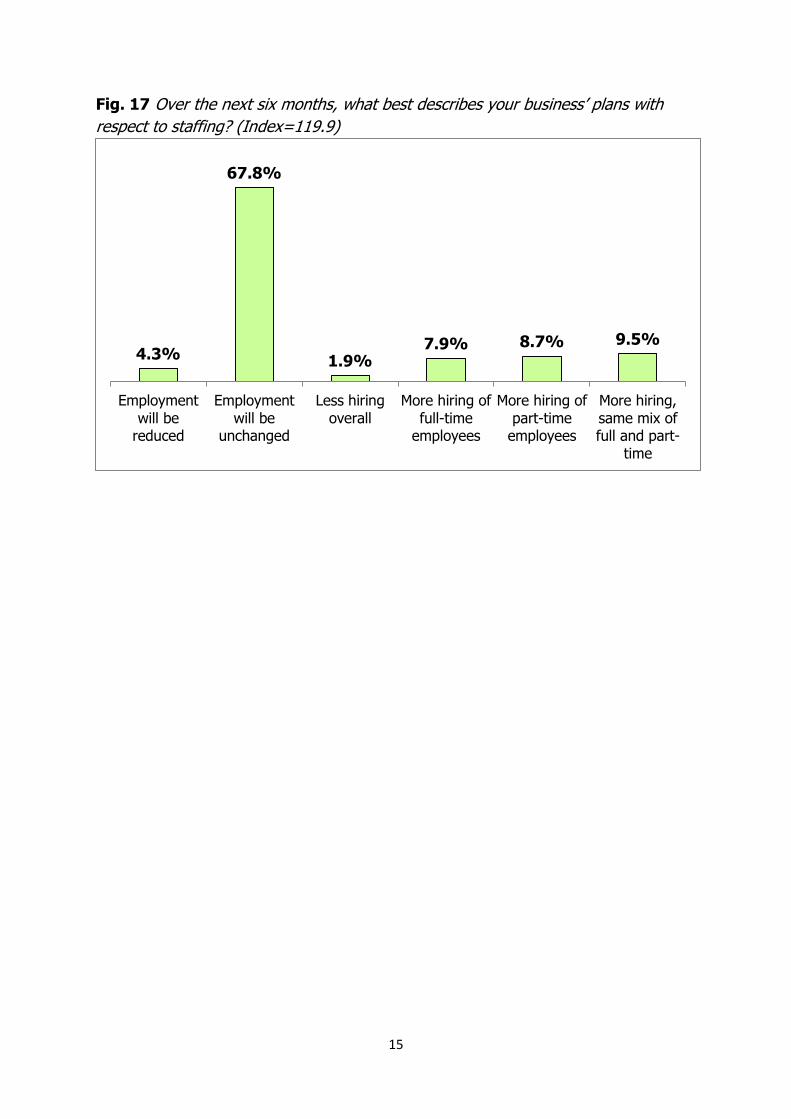
Fig. 17 Over the next six months, what best describes your business’ plans with
respect to staffing? (Index=119.9)
4.3%
67.8%
1.9% 7.9% 8.7% 9.5%
Employmentwill be
reduced
Employmentwill be
unchanged
Less hiringoverall
More hiring offull-time
employees
More hiring ofpart-time
employees
More hiring,same mix offull and part-
time
16
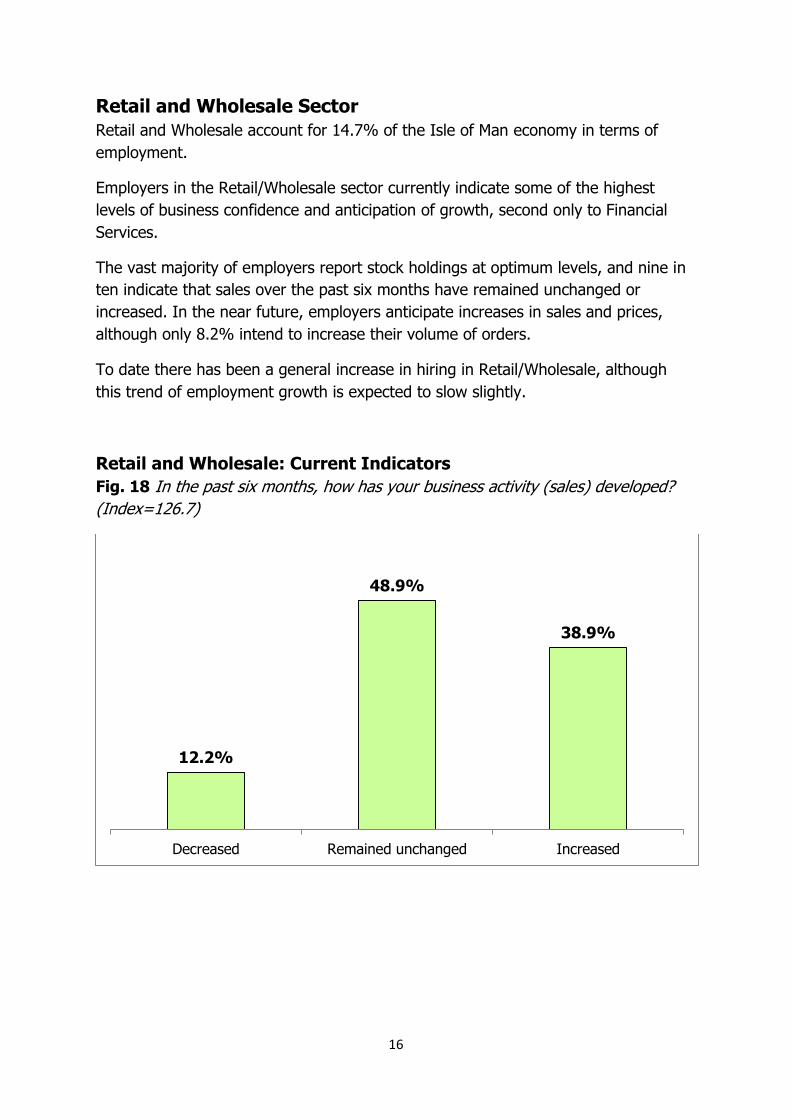
Retail and Wholesale Sector
Retail and Wholesale account for 14.7% of the Isle of Man economy in terms of
employment.
Employers in the Retail/Wholesale sector currently indicate some of the highest
levels of business confidence and anticipation of growth, second only to Financial
Services.
The vast majority of employers report stock holdings at optimum levels, and nine in
ten indicate that sales over the past six months have remained unchanged or
increased. In the near future, employers anticipate increases in sales and prices,
although only 8.2% intend to increase their volume of orders.
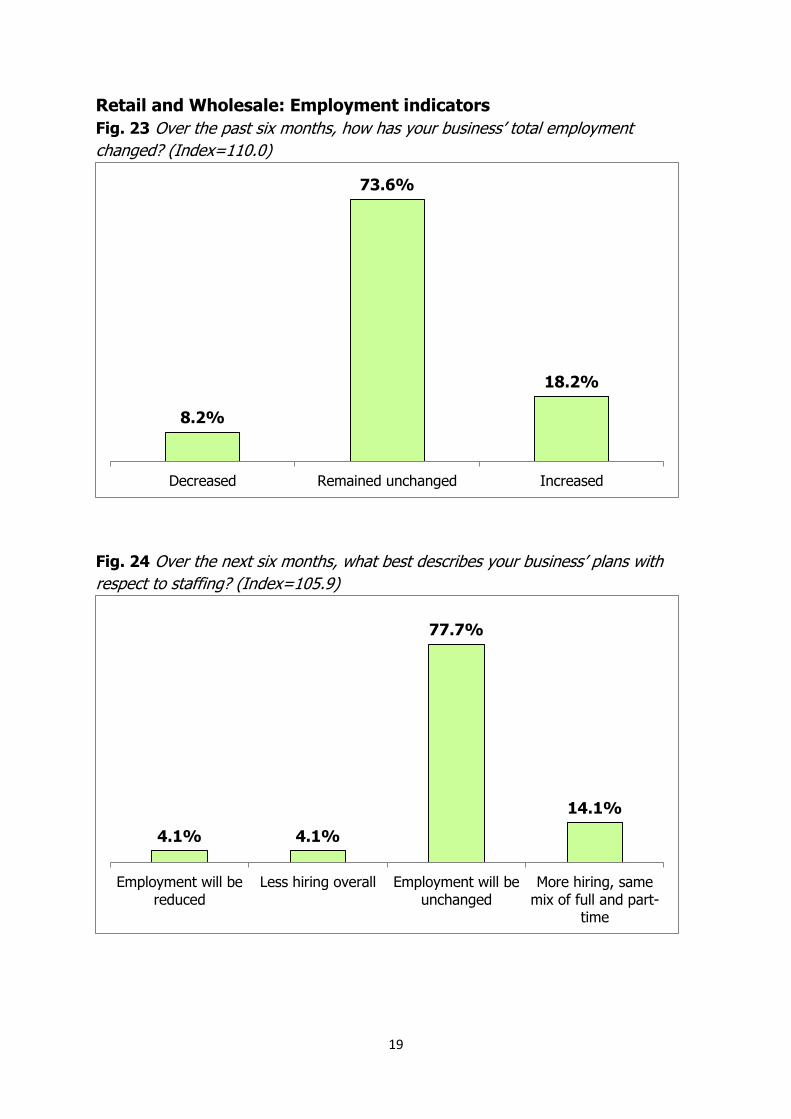
To date there has been a general increase in hiring in Retail/Wholesale, although
this trend of employment growth is expected to slow slightly.
Retail and Wholesale: Current Indicators
Fig. 18 In the past six months, how has your business activity (sales) developed?
(Index=126.7)
12.2%
48.9%
38.9%
Decreased Remained unchanged Increased
17
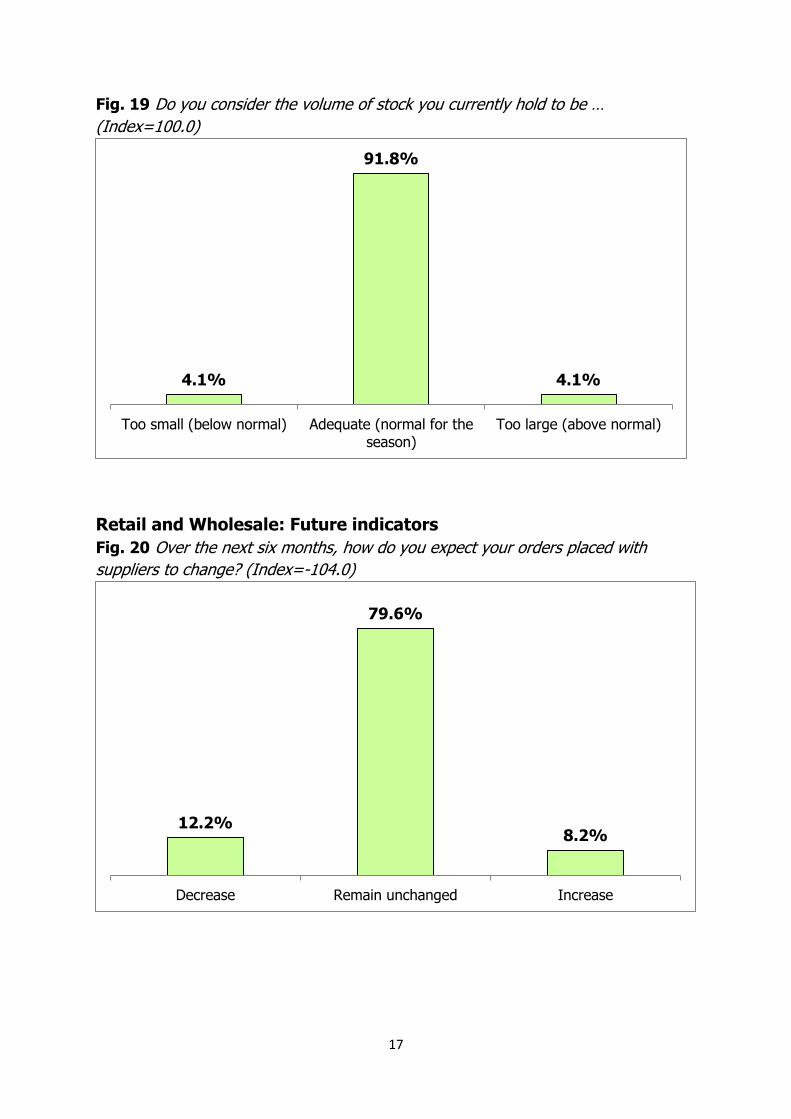
Fig. 19 Do you consider the volume of stock you currently hold to be …
(Index=100.0)
Retail and Wholesale: Future indicators
Fig. 20 Over the next six months, how do you expect your orders placed with
suppliers to change? (Index=-104.0)
4.1%
91.8%
4.1%
Too small (below normal) Adequate (normal for theseason)
Too large (above normal)
12.2%
79.6%
8.2%
Decrease Remain unchanged Increase
18
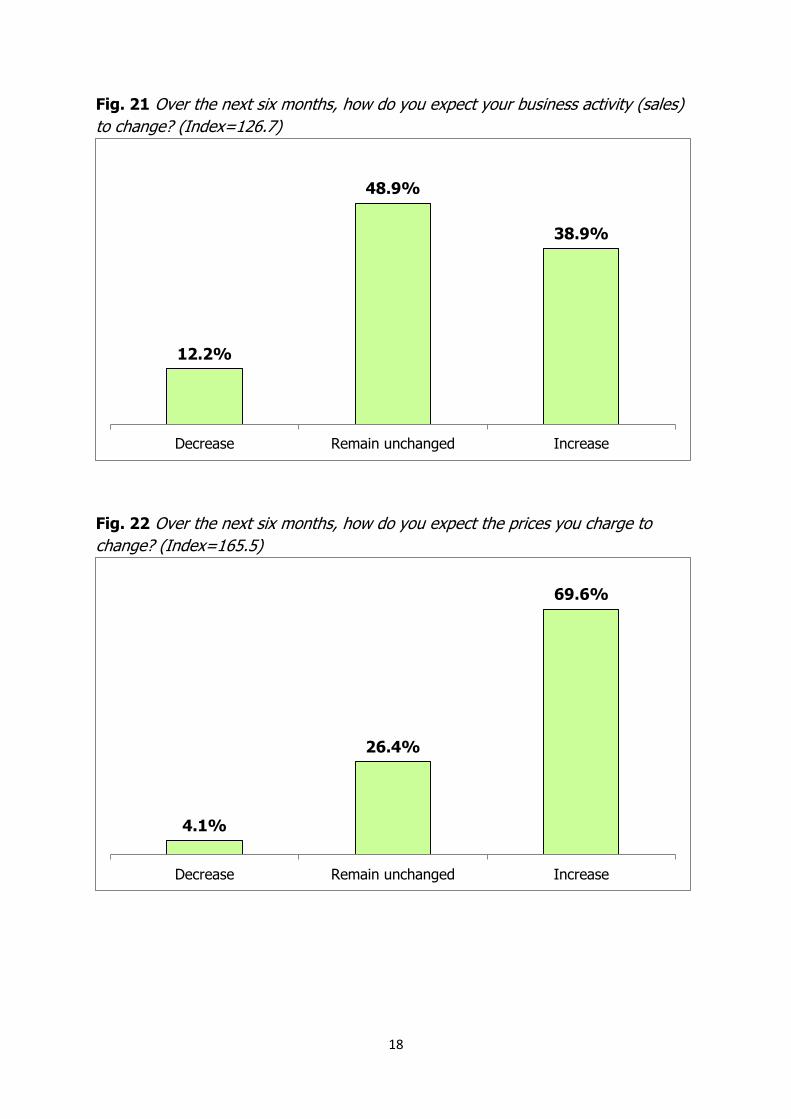
Fig. 21 Over the next six months, how do you expect your business activity (sales)
to change? (Index=126.7)
Fig. 22 Over the next six months, how do you expect the prices you charge to
change? (Index=165.5)
12.2%
48.9%
38.9%
Decrease Remain unchanged Increase
4.1%
26.4%
69.6%
Decrease Remain unchanged Increase
19
Retail and Wholesale: Employment indicators
Fig. 23 Over the past six months, how has your business’ total employment
changed? (Index=110.0)
Fig. 24 Over the next six months, what best describes your business’ plans with
respect to staffing? (Index=105.9)
8.2%
73.6%
18.2%
Decreased Remained unchanged Increased
4.1% 4.1%
77.7%
14.1%
Employment will bereduced
Less hiring overall Employment will beunchanged
More hiring, samemix of full and part-
time
20
Construction
Construction and Trades/Contractors account for 7.1% of the Isle of Man economy
in terms of employment.
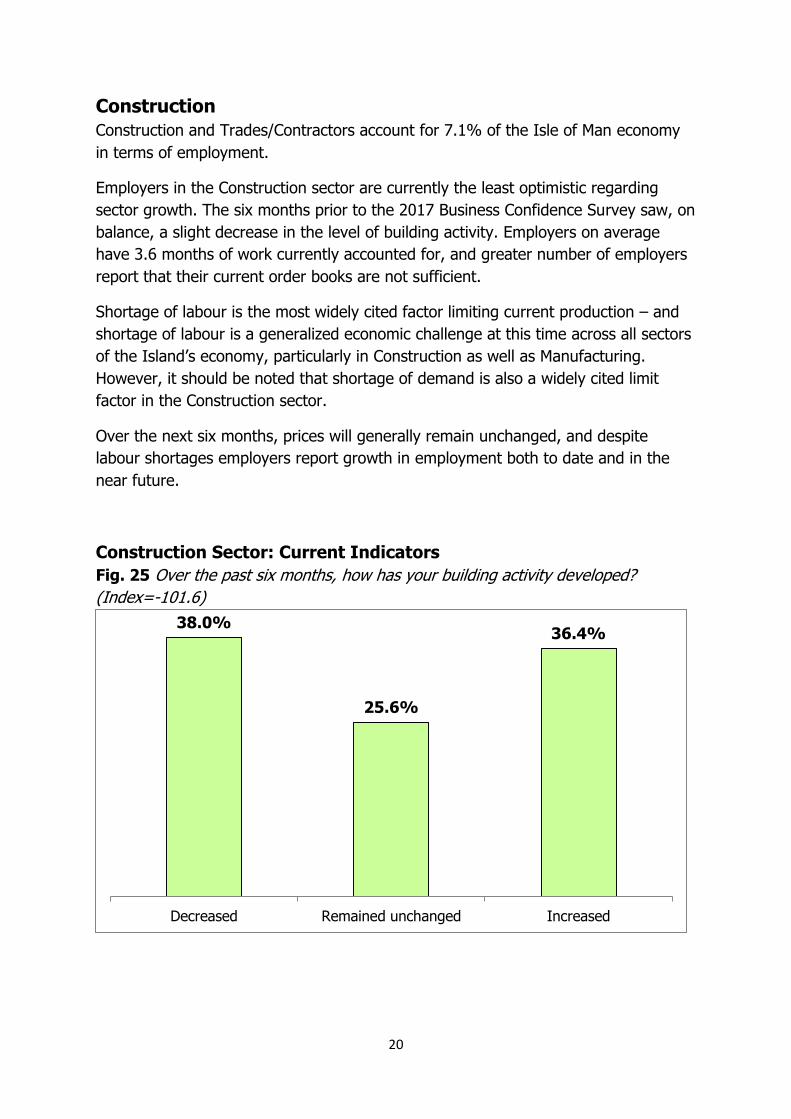
Employers in the Construction sector are currently the least optimistic regarding
sector growth. The six months prior to the 2017 Business Confidence Survey saw, on
balance, a slight decrease in the level of building activity. Employers on average
have 3.6 months of work currently accounted for, and greater number of employers
report that their current order books are not sufficient.
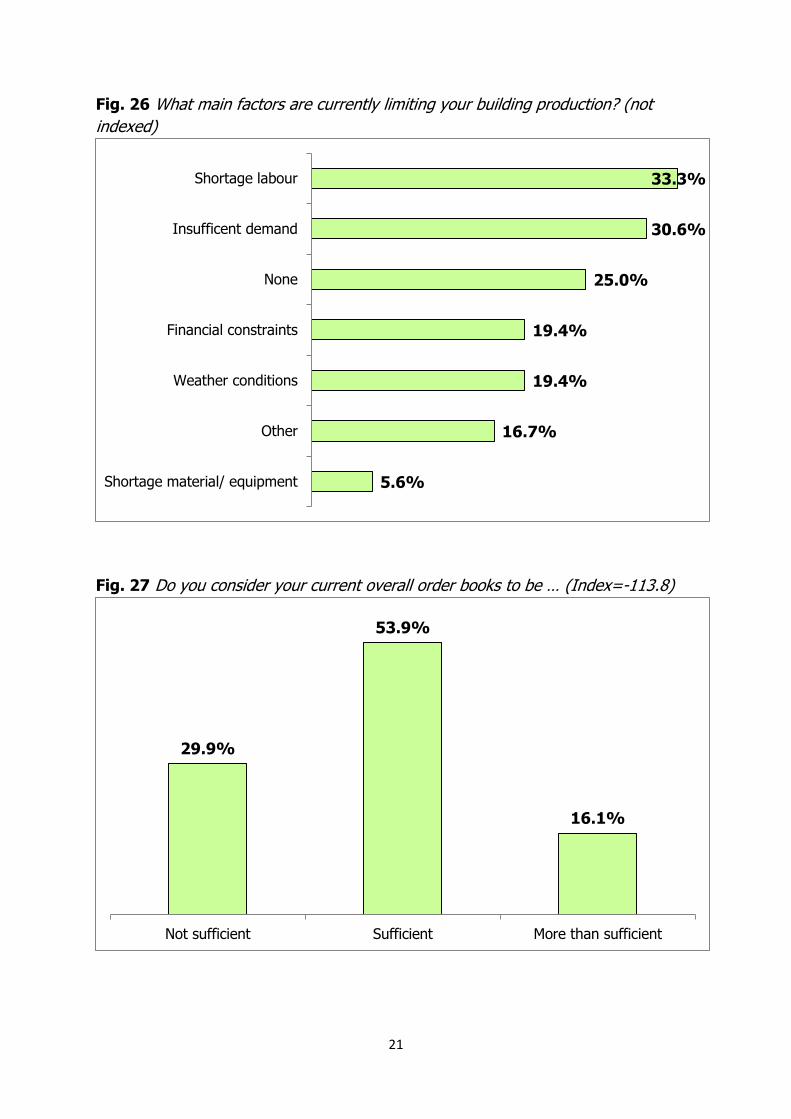
Shortage of labour is the most widely cited factor limiting current production – and
shortage of labour is a generalized economic challenge at this time across all sectors
of the Island’s economy, particularly in Construction as well as Manufacturing.
However, it should be noted that shortage of demand is also a widely cited limit
factor in the Construction sector.
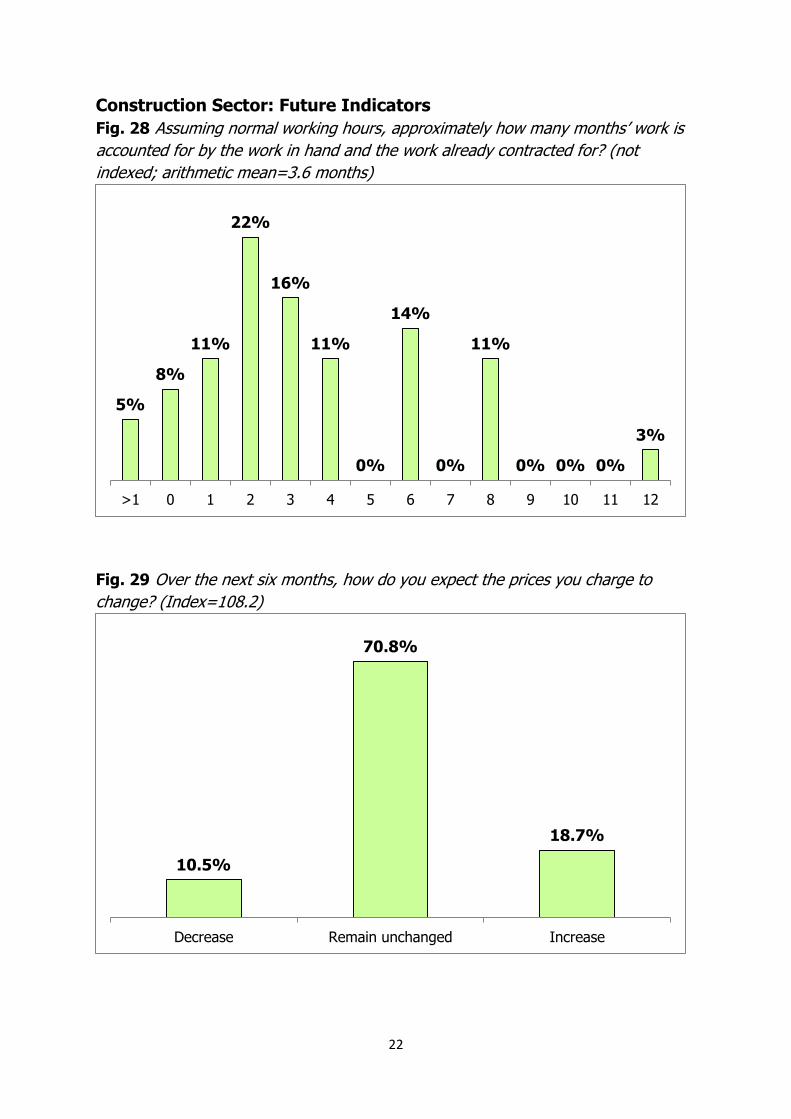
Over the next six months, prices will generally remain unchanged, and despite
labour shortages employers report growth in employment both to date and in the
near future.
Construction Sector: Current Indicators
Fig. 25 Over the past six months, how has your building activity developed?
(Index=-101.6)
38.0%
25.6%
36.4%
Decreased Remained unchanged Increased
21
Fig. 26 What main factors are currently limiting your building production? (not
indexed)
Fig. 27 Do you consider your current overall order books to be … (Index=-113.8)
5.6%
16.7%
19.4%
19.4%
25.0%
30.6%
33.3%
Shortage material/ equipment
Other
Weather conditions
Financial constraints
None
Insufficent demand
Shortage labour
29.9%
53.9%
16.1%
Not sufficient Sufficient More than sufficient
22
Construction Sector: Future Indicators
Fig. 28 Assuming normal working hours, approximately how many months’ work is
accounted for by the work in hand and the work already contracted for? (not
indexed; arithmetic mean=3.6 months)
Fig. 29 Over the next six months, how do you expect the prices you charge to
change? (Index=108.2)
5%
8%
11%
22%
16%
11%
0%
14%
0%
11%
0% 0% 0%
3%
>1 0 1 2 3 4 5 6 7 8 9 10 11 12
10.5%
70.8%
18.7%
Decrease Remain unchanged Increase
23
Construction Sector: Employment Indicators
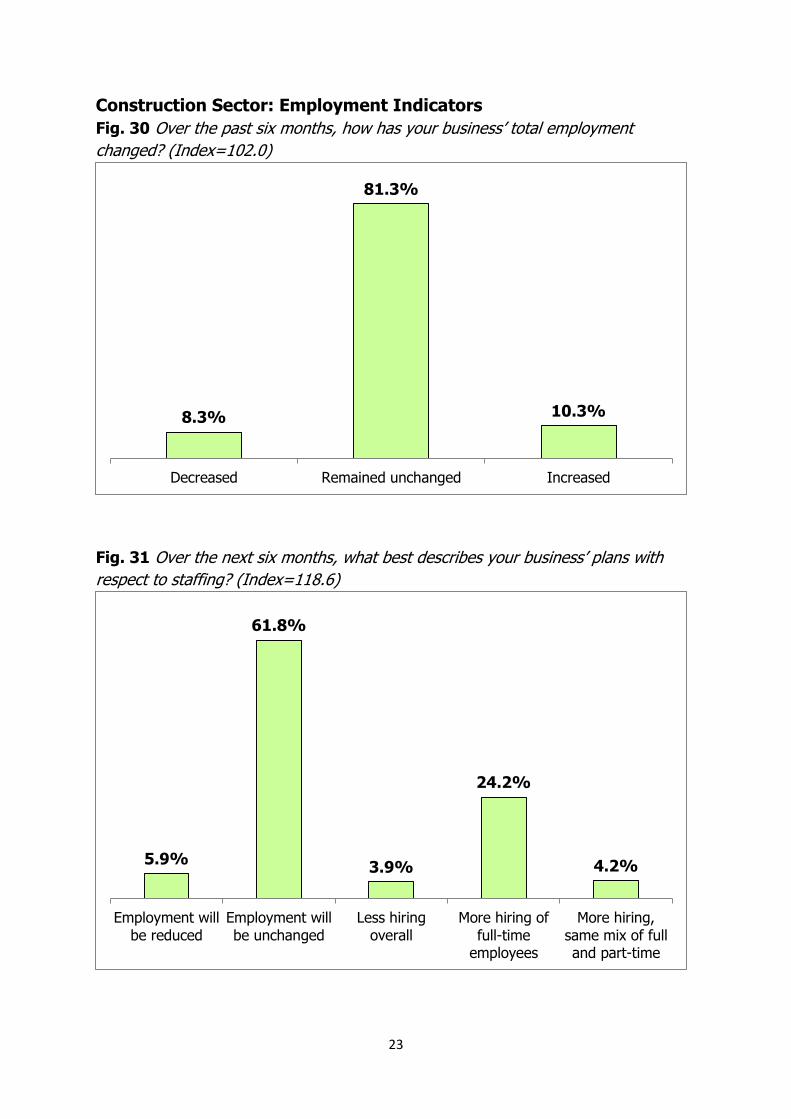
Fig. 30 Over the past six months, how has your business’ total employment
changed? (Index=102.0)
Fig. 31 Over the next six months, what best describes your business’ plans with
respect to staffing? (Index=118.6)
8.3%
81.3%
10.3%
Decreased Remained unchanged Increased
5.9%
61.8%
3.9%
24.2%
4.2%
Employment willbe reduced
Employment willbe unchanged
Less hiringoverall
More hiring offull-time
employees
More hiring,same mix of fulland part-time
24
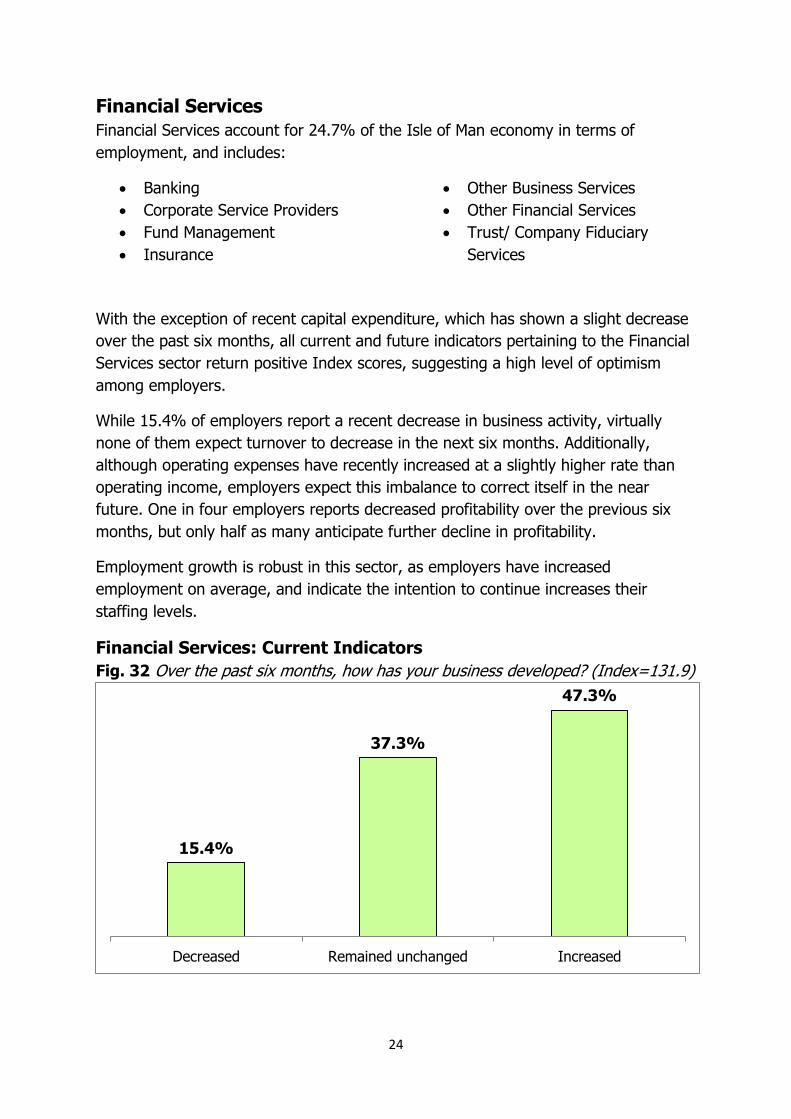
Financial Services
Financial Services account for 24.7% of the Isle of Man economy in terms of
employment, and includes:
Banking
Corporate Service Providers
Fund Management
Insurance
Other Business Services
Other Financial Services
Trust/ Company Fiduciary
Services
With the exception of recent capital expenditure, which has shown a slight decrease
over the past six months, all current and future indicators pertaining to the Financial
Services sector return positive Index scores, suggesting a high level of optimism
among employers.
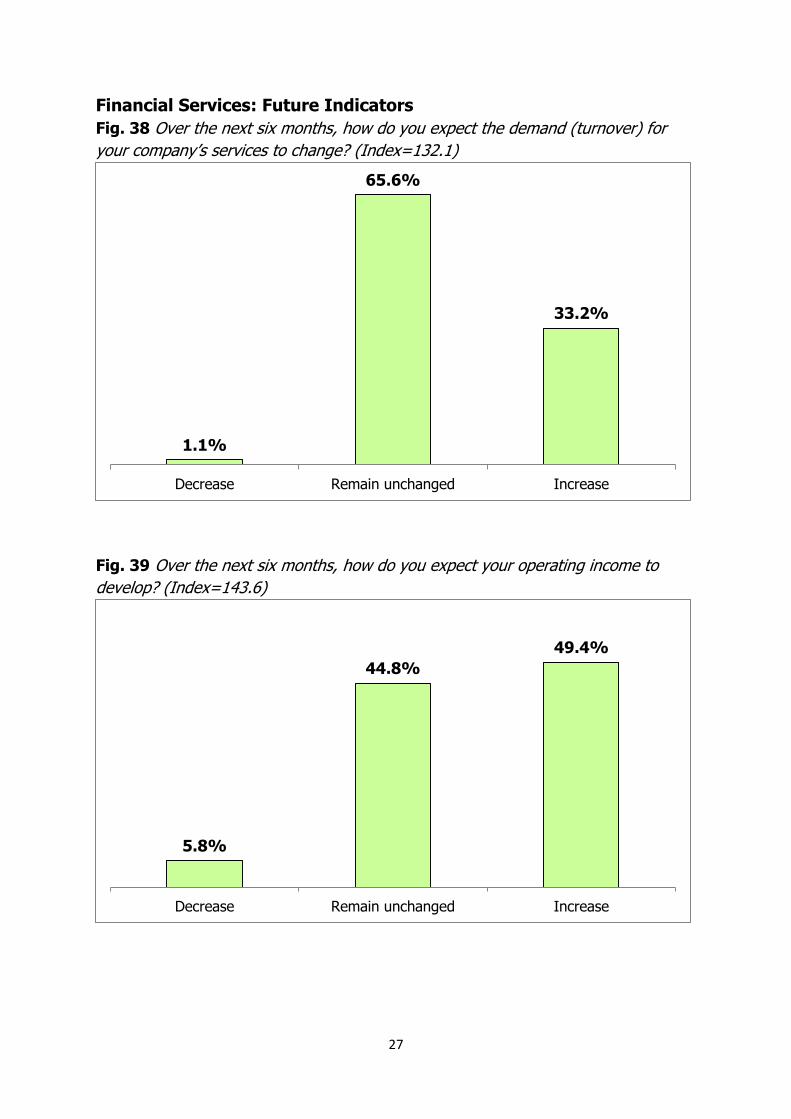
While 15.4% of employers report a recent decrease in business activity, virtually
none of them expect turnover to decrease in the next six months. Additionally,
although operating expenses have recently increased at a slightly higher rate than
operating income, employers expect this imbalance to correct itself in the near
future. One in four employers reports decreased profitability over the previous six
months, but only half as many anticipate further decline in profitability.
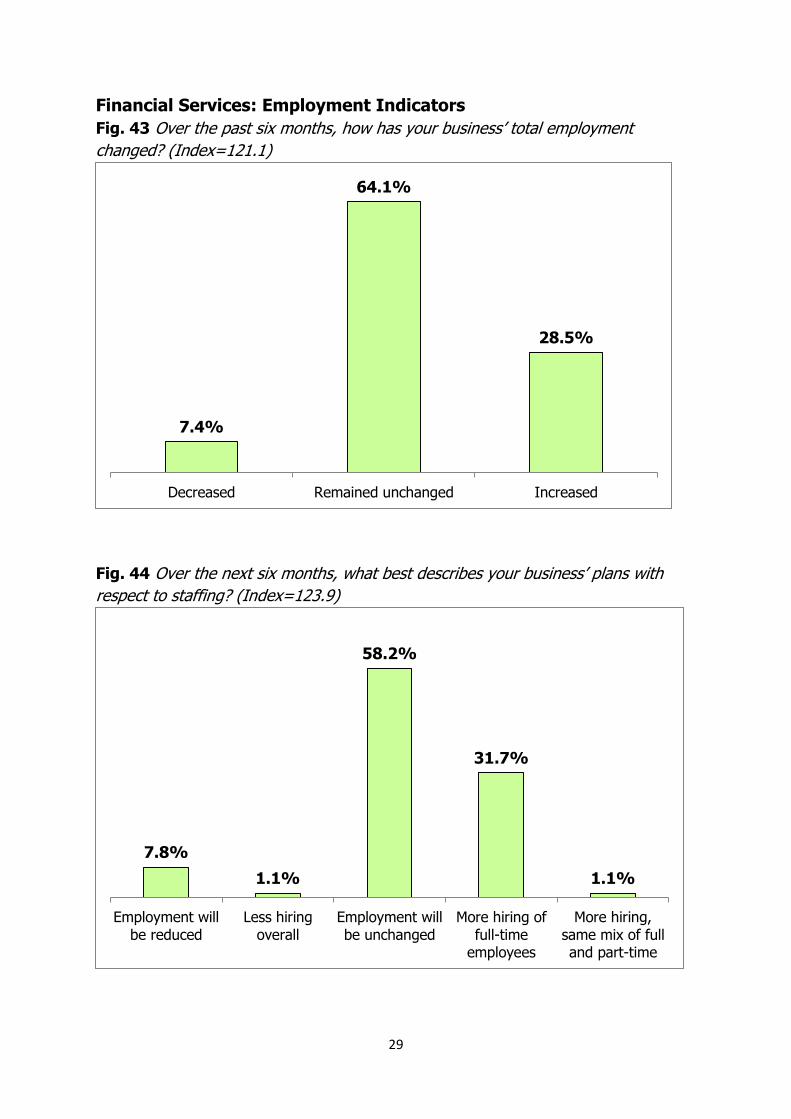
Employment growth is robust in this sector, as employers have increased
employment on average, and indicate the intention to continue increases their
staffing levels.
Financial Services: Current Indicators
Fig. 32 Over the past six months, how has your business developed? (Index=131.9)
15.4%
37.3%
47.3%
Decreased Remained unchanged Increased
25
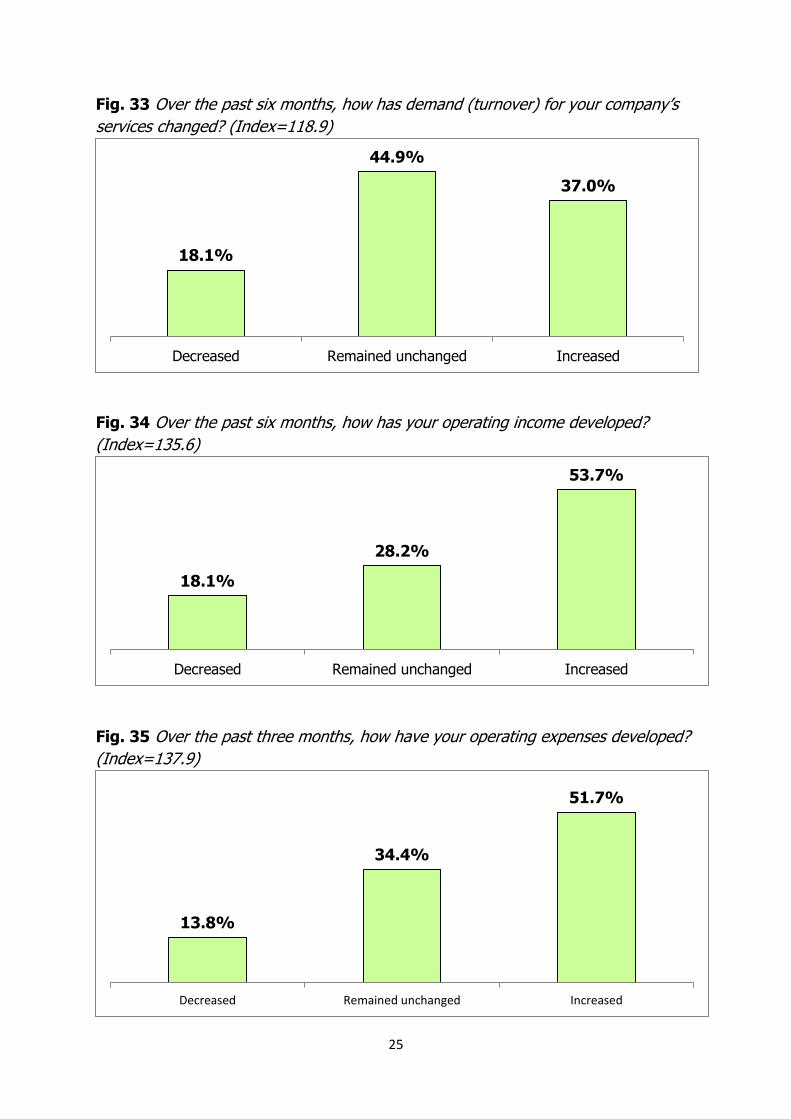
Fig. 33 Over the past six months, how has demand (turnover) for your company’s
services changed? (Index=118.9)
Fig. 34 Over the past six months, how has your operating income developed?
(Index=135.6)
Fig. 35 Over the past three months, how have your operating expenses developed?
(Index=137.9)
18.1%
44.9%
37.0%
Decreased Remained unchanged Increased
18.1%
28.2%
53.7%
Decreased Remained unchanged Increased
13.8%
34.4%
51.7%
Decreased Remained unchanged Increased
26
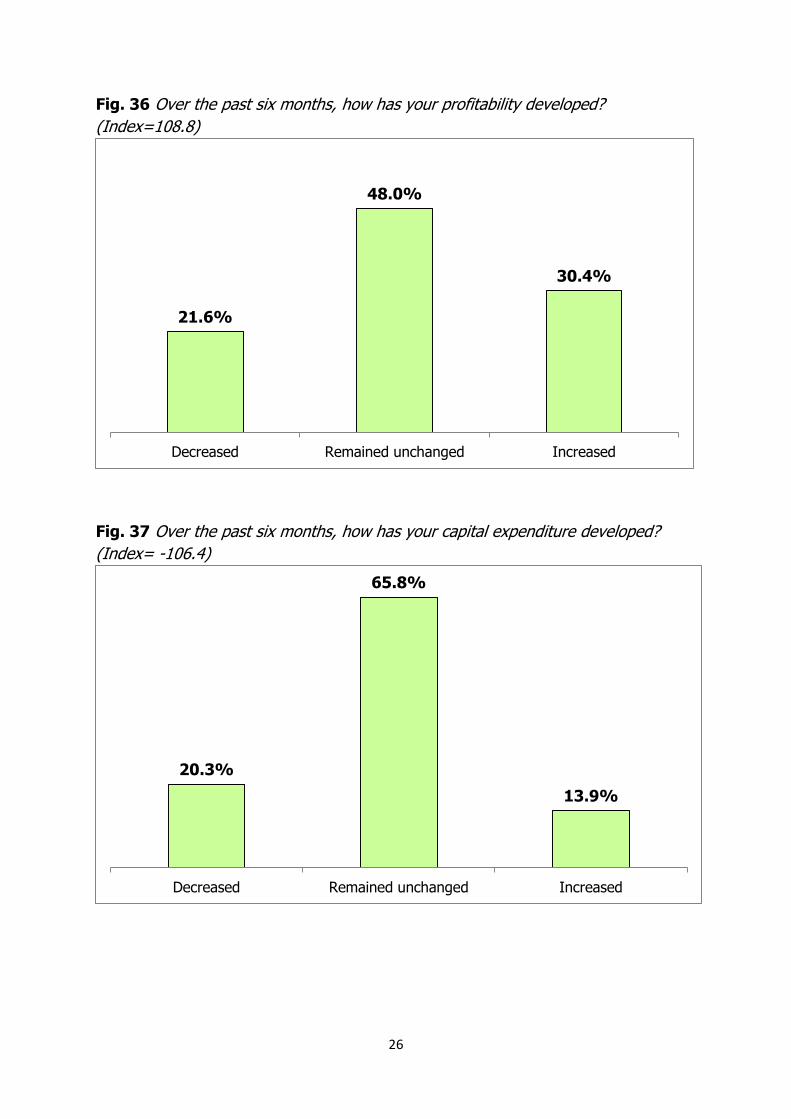
Fig. 36 Over the past six months, how has your profitability developed?
(Index=108.8)
Fig. 37 Over the past six months, how has your capital expenditure developed?
(Index= -106.4)
21.6%
48.0%
30.4%
Decreased Remained unchanged Increased
20.3%
65.8%
13.9%
Decreased Remained unchanged Increased
27
Financial Services: Future Indicators
Fig. 38 Over the next six months, how do you expect the demand (turnover) for
your company’s services to change? (Index=132.1)
Fig. 39 Over the next six months, how do you expect your operating income to
develop? (Index=143.6)
1.1%
65.6%
33.2%
Decrease Remain unchanged Increase
5.8%
44.8%
49.4%
Decrease Remain unchanged Increase
28
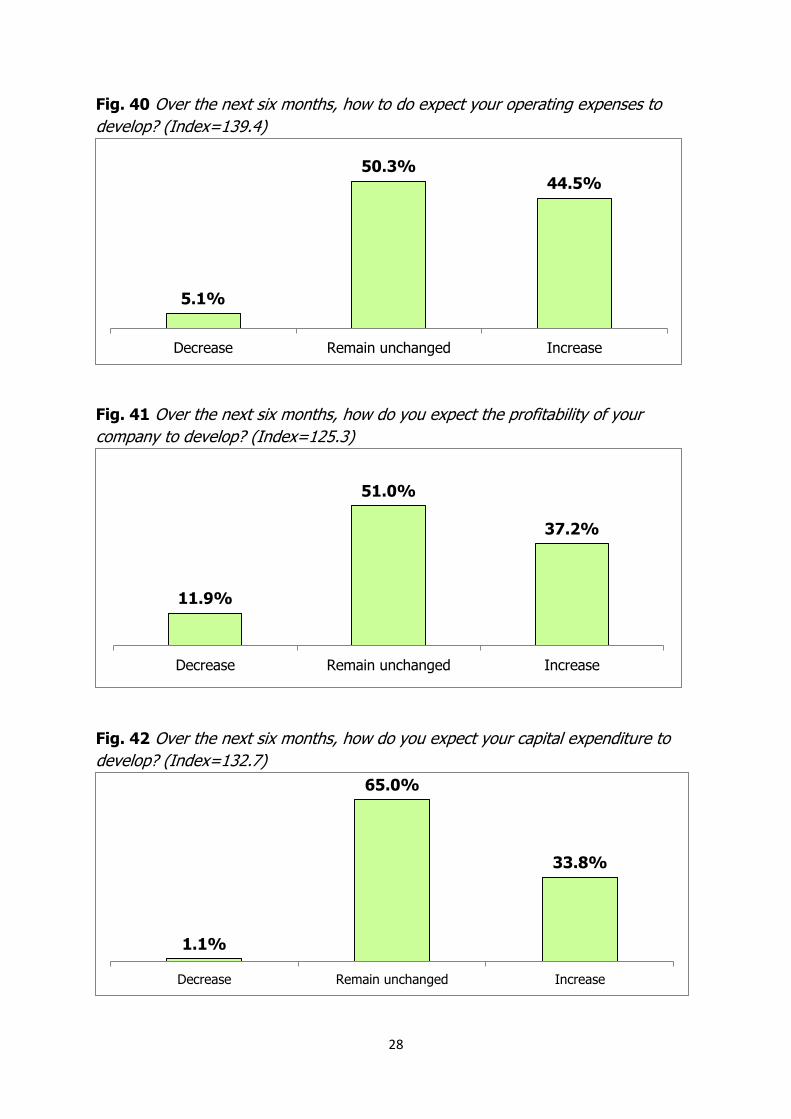
Fig. 40 Over the next six months, how to do expect your operating expenses to
develop? (Index=139.4)
Fig. 41 Over the next six months, how do you expect the profitability of your
company to develop? (Index=125.3)
Fig. 42 Over the next six months, how do you expect your capital expenditure to
develop? (Index=132.7)
5.1%
50.3% 44.5%
Decrease Remain unchanged Increase
11.9%
51.0%
37.2%
Decrease Remain unchanged Increase
1.1%
65.0%
33.8%
Decrease Remain unchanged Increase
29
Financial Services: Employment Indicators
Fig. 43 Over the past six months, how has your business’ total employment
changed? (Index=121.1)
Fig. 44 Over the next six months, what best describes your business’ plans with
respect to staffing? (Index=123.9)
7.4%
64.1%
28.5%
Decreased Remained unchanged Increased
7.8%
1.1%
58.2%
31.7%
1.1%
Employment willbe reduced
Less hiringoverall
Employment willbe unchanged
More hiring offull-time
employees
More hiring,same mix of fulland part-time
30
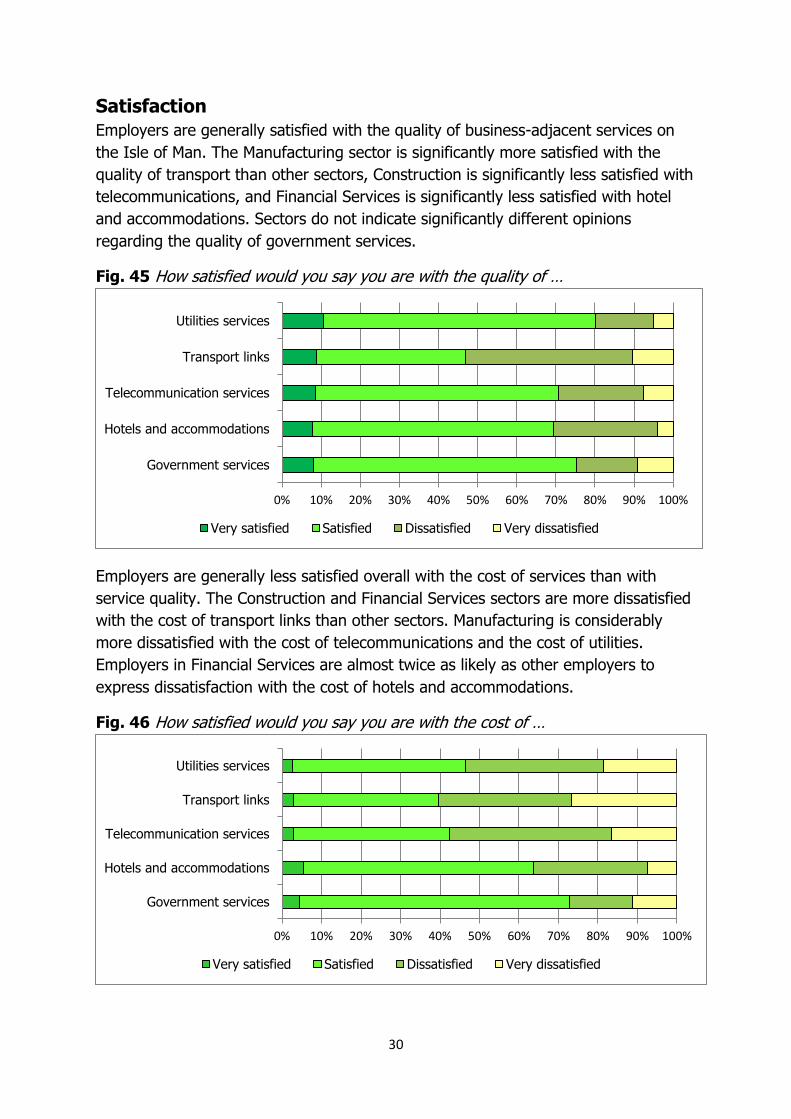
Satisfaction
Employers are generally satisfied with the quality of business-adjacent services on
the Isle of Man. The Manufacturing sector is significantly more satisfied with the
quality of transport than other sectors, Construction is significantly less satisfied with
telecommunications, and Financial Services is significantly less satisfied with hotel
and accommodations. Sectors do not indicate significantly different opinions
regarding the quality of government services.
Fig. 45 How satisfied would you say you are with the quality of …
Employers are generally less satisfied overall with the cost of services than with
service quality. The Construction and Financial Services sectors are more dissatisfied
with the cost of transport links than other sectors. Manufacturing is considerably
more dissatisfied with the cost of telecommunications and the cost of utilities.
Employers in Financial Services are almost twice as likely as other employers to
express dissatisfaction with the cost of hotels and accommodations.
Fig. 46 How satisfied would you say you are with the cost of …
0% 10% 20% 30% 40% 50% 60% 70% 80% 90% 100%
Government services
Hotels and accommodations
Telecommunication services
Transport links
Utilities services
Very satisfied Satisfied Dissatisfied Very dissatisfied
0% 10% 20% 30% 40% 50% 60% 70% 80% 90% 100%
Government services
Hotels and accommodations
Telecommunication services
Transport links
Utilities services
Very satisfied Satisfied Dissatisfied Very dissatisfied
31
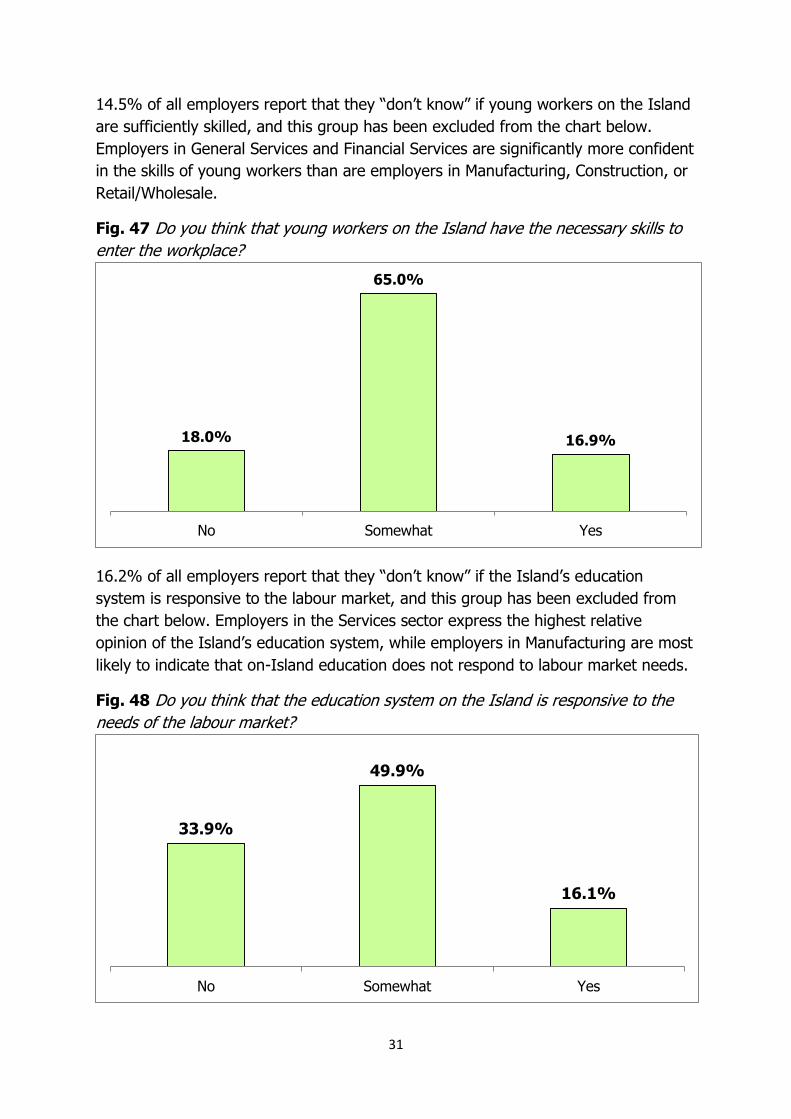
14.5% of all employers report that they “don’t know” if young workers on the Island
are sufficiently skilled, and this group has been excluded from the chart below.
Employers in General Services and Financial Services are significantly more confident
in the skills of young workers than are employers in Manufacturing, Construction, or
Retail/Wholesale.
Fig. 47 Do you think that young workers on the Island have the necessary skills to
enter the workplace?
16.2% of all employers report that they “don’t know” if the Island’s education
system is responsive to the labour market, and this group has been excluded from
the chart below. Employers in the Services sector express the highest relative
opinion of the Island’s education system, while employers in Manufacturing are most
likely to indicate that on-Island education does not respond to labour market needs.
Fig. 48 Do you think that the education system on the Island is responsive to the
needs of the labour market?
18.0%
65.0%
16.9%
No Somewhat Yes
33.9%
49.9%
16.1%
No Somewhat Yes
32
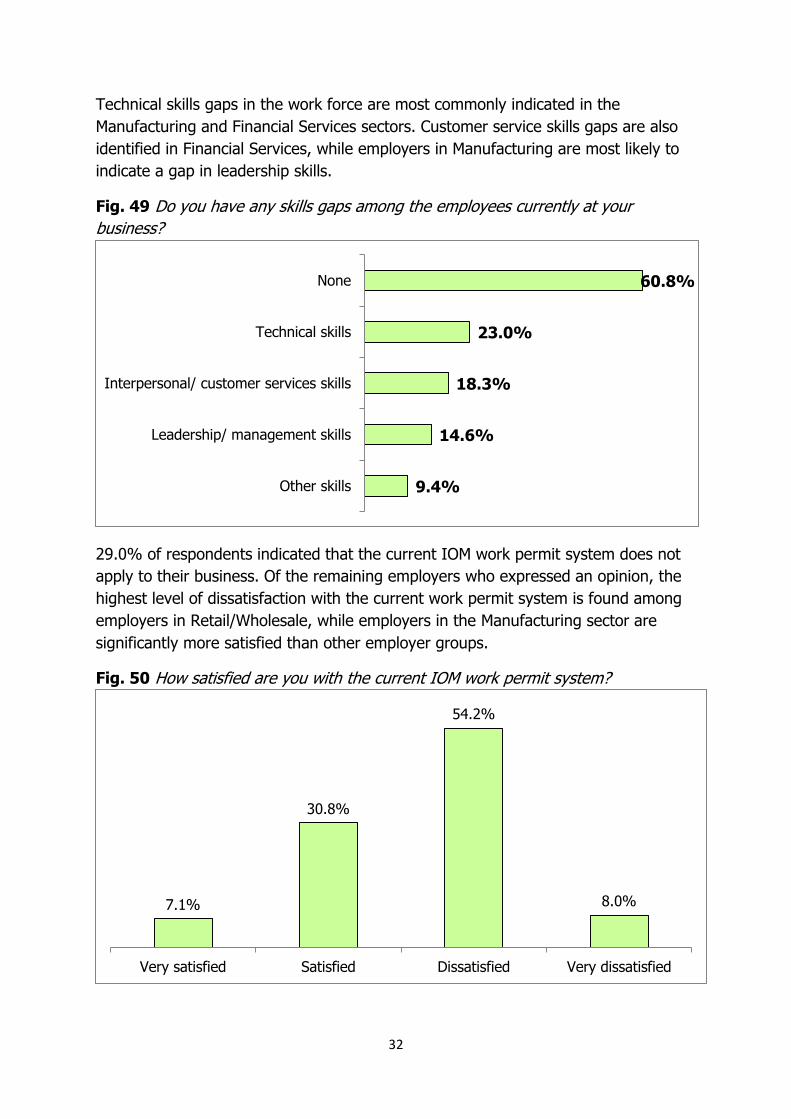
Technical skills gaps in the work force are most commonly indicated in the
Manufacturing and Financial Services sectors. Customer service skills gaps are also
identified in Financial Services, while employers in Manufacturing are most likely to
indicate a gap in leadership skills.
Fig. 49 Do you have any skills gaps among the employees currently at your
business?
29.0% of respondents indicated that the current IOM work permit system does not
apply to their business. Of the remaining employers who expressed an opinion, the
highest level of dissatisfaction with the current work permit system is found among
employers in Retail/Wholesale, while employers in the Manufacturing sector are
significantly more satisfied than other employer groups.
Fig. 50 How satisfied are you with the current IOM work permit system?
9.4%
14.6%
18.3%
23.0%
60.8%
Other skills
Leadership/ management skills
Interpersonal/ customer services skills
Technical skills
None
7.1%
30.8%
54.2%
8.0%
Very satisfied Satisfied Dissatisfied Very dissatisfied
33
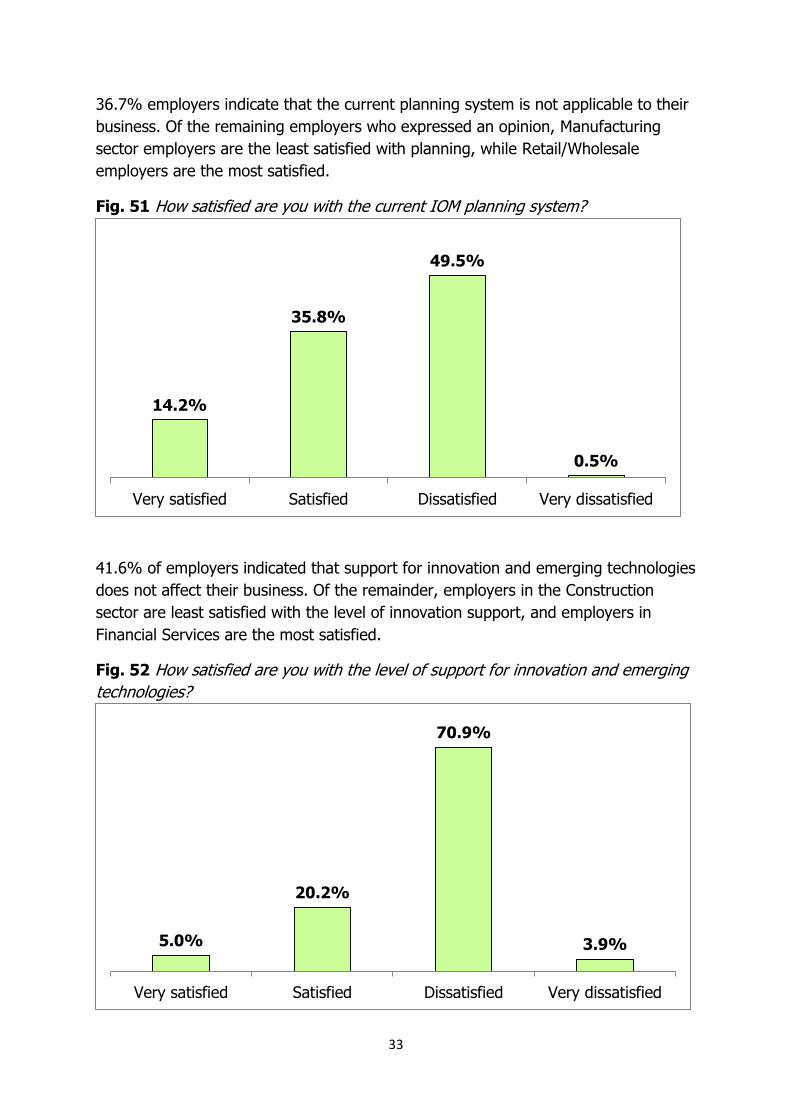
36.7% employers indicate that the current planning system is not applicable to their
business. Of the remaining employers who expressed an opinion, Manufacturing
sector employers are the least satisfied with planning, while Retail/Wholesale
employers are the most satisfied.
Fig. 51 How satisfied are you with the current IOM planning system?
41.6% of employers indicated that support for innovation and emerging technologies
does not affect their business. Of the remainder, employers in the Construction
sector are least satisfied with the level of innovation support, and employers in
Financial Services are the most satisfied.
Fig. 52 How satisfied are you with the level of support for innovation and emerging
technologies?
14.2%
35.8%
49.5%
0.5%
Very satisfied Satisfied Dissatisfied Very dissatisfied
5.0%
20.2%
70.9%
3.9%
Very satisfied Satisfied Dissatisfied Very dissatisfied
34
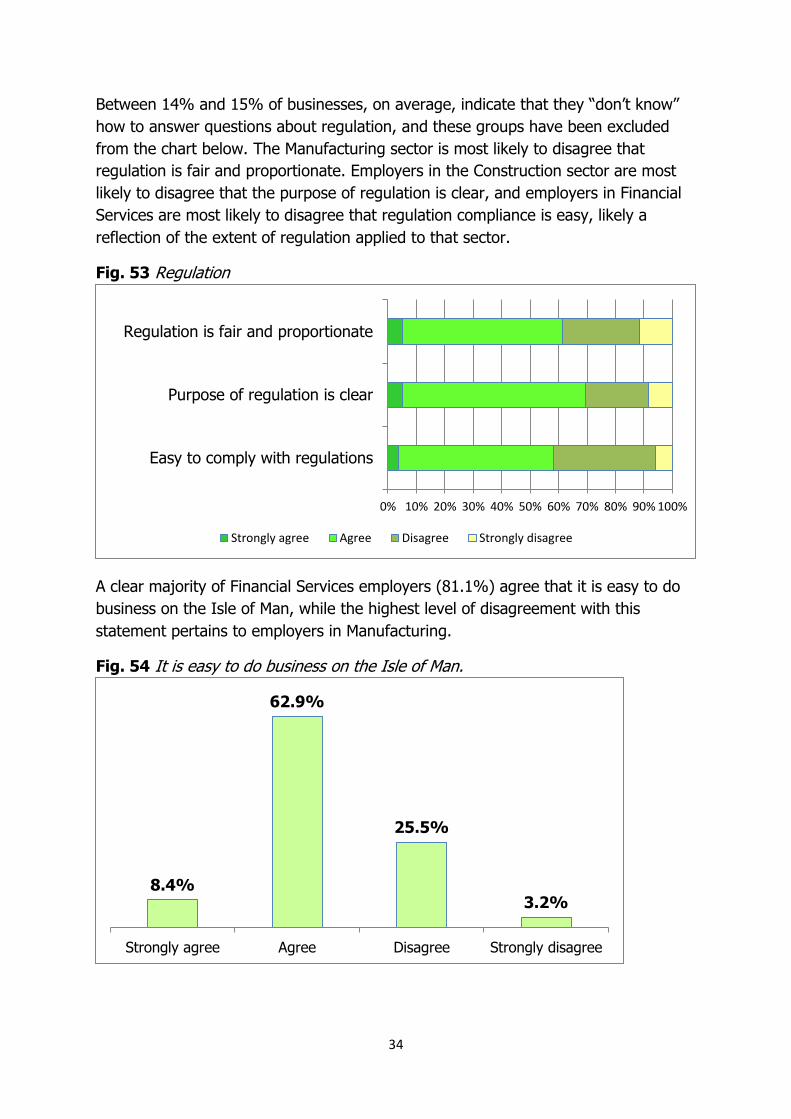
Between 14% and 15% of businesses, on average, indicate that they “don’t know”
how to answer questions about regulation, and these groups have been excluded
from the chart below. The Manufacturing sector is most likely to disagree that
regulation is fair and proportionate. Employers in the Construction sector are most
likely to disagree that the purpose of regulation is clear, and employers in Financial
Services are most likely to disagree that regulation compliance is easy, likely a
reflection of the extent of regulation applied to that sector.
Fig. 53 Regulation
A clear majority of Financial Services employers (81.1%) agree that it is easy to do
business on the Isle of Man, while the highest level of disagreement with this
statement pertains to employers in Manufacturing.
Fig. 54 It is easy to do business on the Isle of Man.
0% 10% 20% 30% 40% 50% 60% 70% 80% 90% 100%
Easy to comply with regulations
Purpose of regulation is clear
Regulation is fair and proportionate
Strongly agree Agree Disagree Strongly disagree
8.4%
62.9%
25.5%
3.2%
Strongly agree Agree Disagree Strongly disagree
35
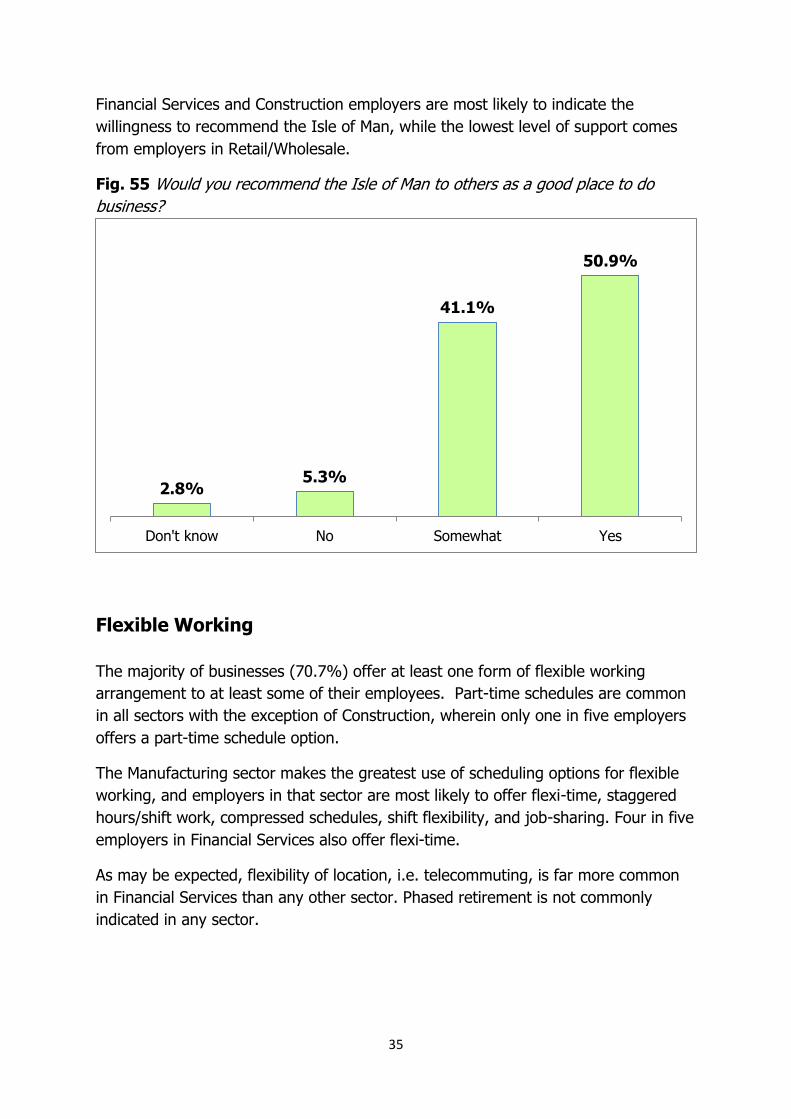
Financial Services and Construction employers are most likely to indicate the
willingness to recommend the Isle of Man, while the lowest level of support comes
from employers in Retail/Wholesale.
Fig. 55 Would you recommend the Isle of Man to others as a good place to do
business?
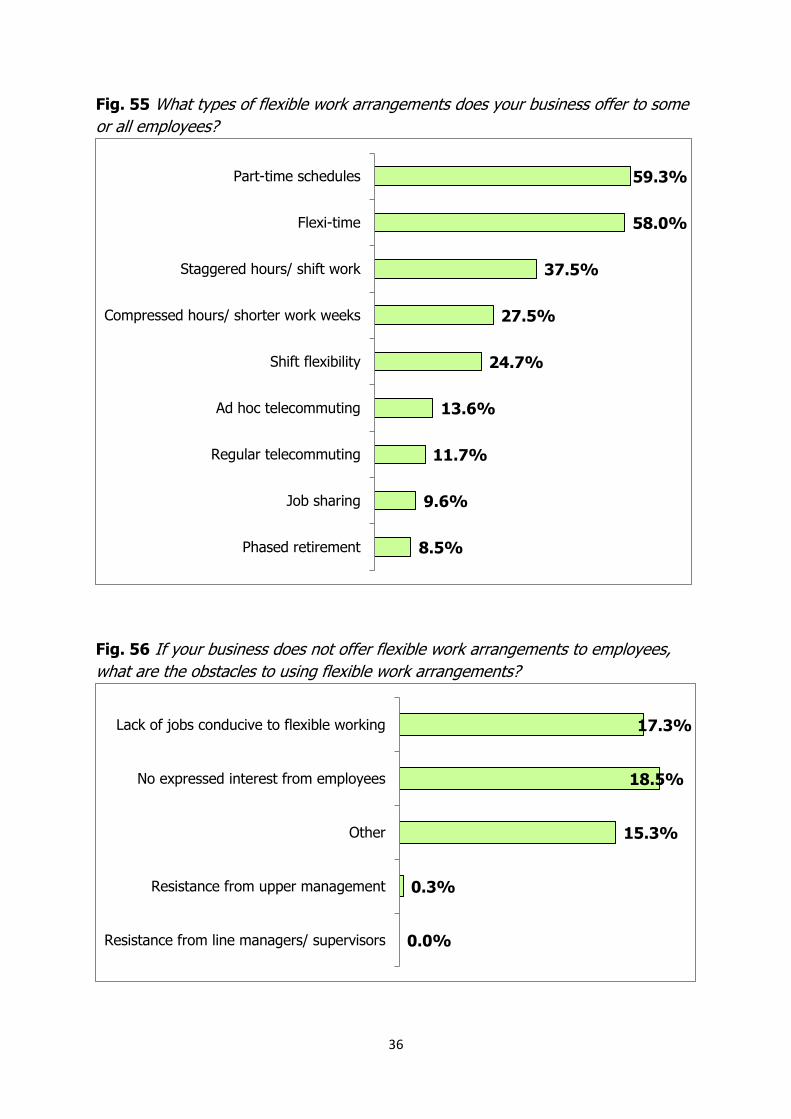
Flexible Working
The majority of businesses (70.7%) offer at least one form of flexible working
arrangement to at least some of their employees. Part-time schedules are common
in all sectors with the exception of Construction, wherein only one in five employers
offers a part-time schedule option.
The Manufacturing sector makes the greatest use of scheduling options for flexible
working, and employers in that sector are most likely to offer flexi-time, staggered
hours/shift work, compressed schedules, shift flexibility, and job-sharing. Four in five
employers in Financial Services also offer flexi-time.
As may be expected, flexibility of location, i.e. telecommuting, is far more common
in Financial Services than any other sector. Phased retirement is not commonly
indicated in any sector.
2.8% 5.3%
41.1%
50.9%
Don't know No Somewhat Yes
36
Fig. 55 What types of flexible work arrangements does your business offer to some
or all employees?
Fig. 56 If your business does not offer flexible work arrangements to employees,
what are the obstacles to using flexible work arrangements?
8.5%
9.6%
11.7%
13.6%
24.7%
27.5%
37.5%
58.0%
59.3%
Phased retirement
Job sharing
Regular telecommuting
Ad hoc telecommuting
Shift flexibility
Compressed hours/ shorter work weeks
Staggered hours/ shift work
Flexi-time
Part-time schedules
0.0%
0.3%
15.3%
18.5%
17.3%
Resistance from line managers/ supervisors
Resistance from upper management
Other
No expressed interest from employees
Lack of jobs conducive to flexible working
37
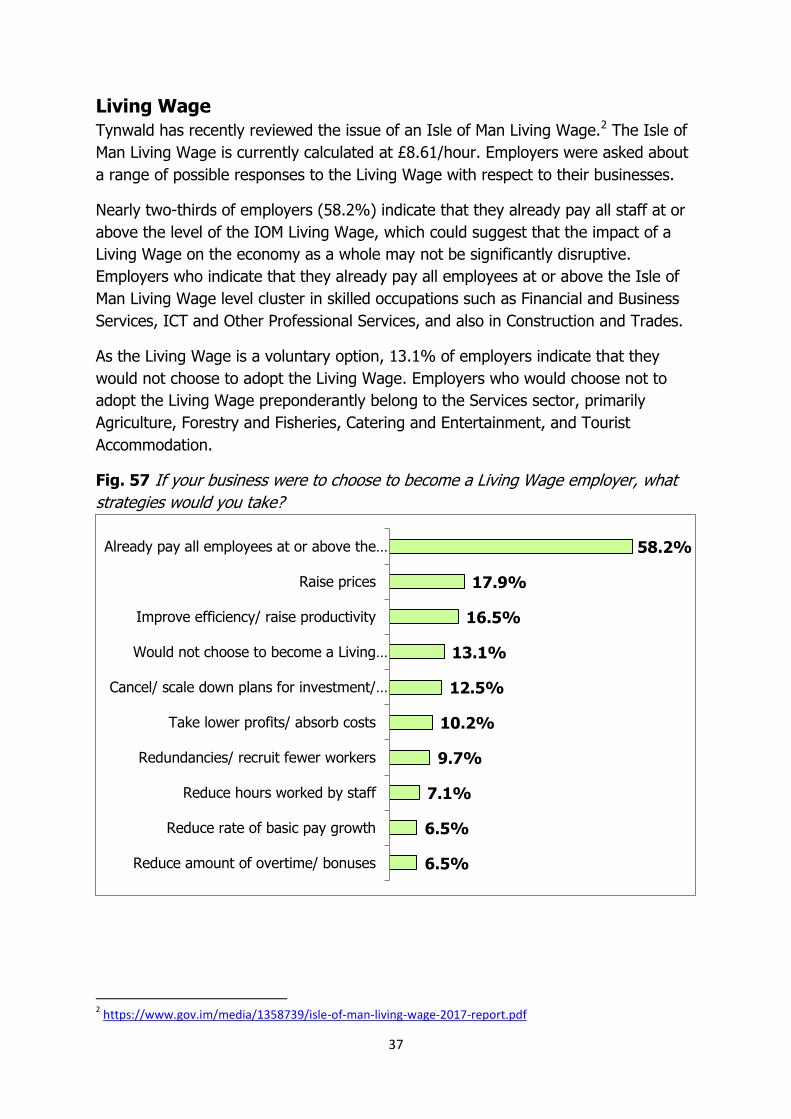
Living Wage
Tynwald has recently reviewed the issue of an Isle of Man Living Wage.2 The Isle of
Man Living Wage is currently calculated at £8.61/hour. Employers were asked about
a range of possible responses to the Living Wage with respect to their businesses.
Nearly two-thirds of employers (58.2%) indicate that they already pay all staff at or
above the level of the IOM Living Wage, which could suggest that the impact of a
Living Wage on the economy as a whole may not be significantly disruptive.
Employers who indicate that they already pay all employees at or above the Isle of
Man Living Wage level cluster in skilled occupations such as Financial and Business
Services, ICT and Other Professional Services, and also in Construction and Trades.
As the Living Wage is a voluntary option, 13.1% of employers indicate that they
would not choose to adopt the Living Wage. Employers who would choose not to
adopt the Living Wage preponderantly belong to the Services sector, primarily
Agriculture, Forestry and Fisheries, Catering and Entertainment, and Tourist
Accommodation.
Fig. 57 If your business were to choose to become a Living Wage employer, what
strategies would you take?
2 https://www.gov.im/media/1358739/isle-of-man-living-wage-2017-report.pdf
6.5%
6.5%
7.1%
9.7%
10.2%
12.5%
13.1%
16.5%
17.9%
58.2%
Reduce amount of overtime/ bonuses
Reduce rate of basic pay growth
Reduce hours worked by staff
Redundancies/ recruit fewer workers
Take lower profits/ absorb costs
Cancel/ scale down plans for investment/…
Would not choose to become a Living…
Improve efficiency/ raise productivity
Raise prices
Already pay all employees at or above the…
38
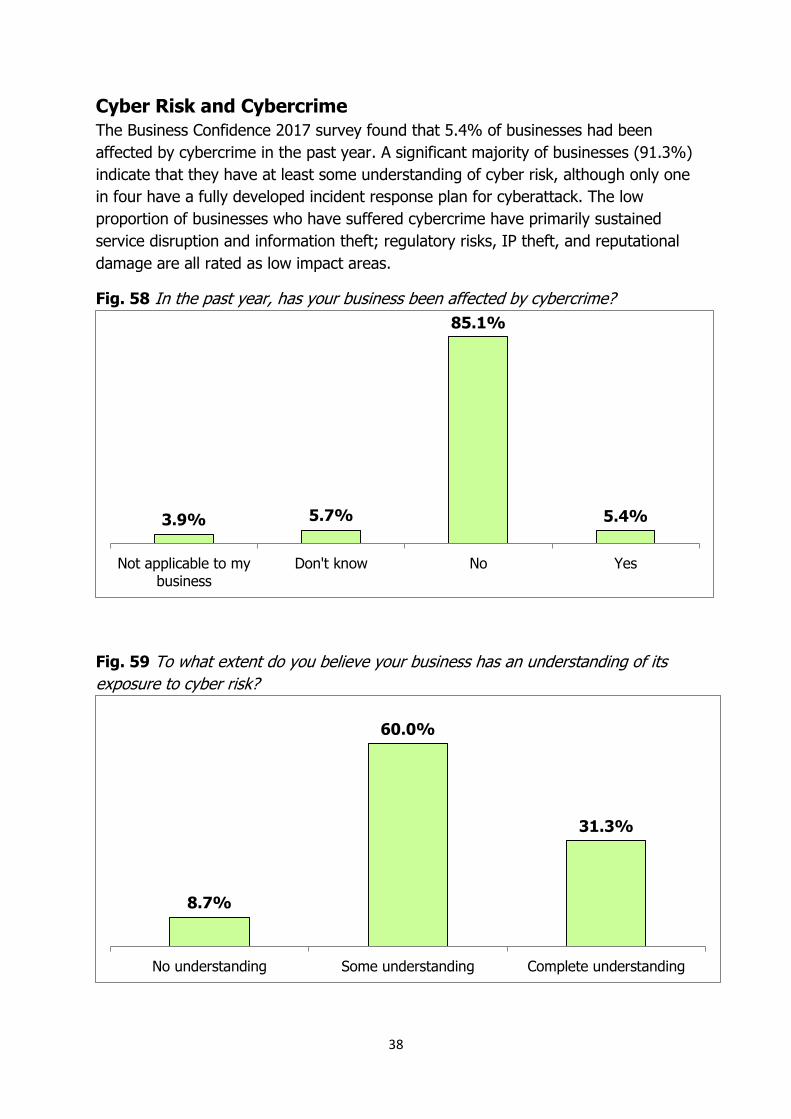
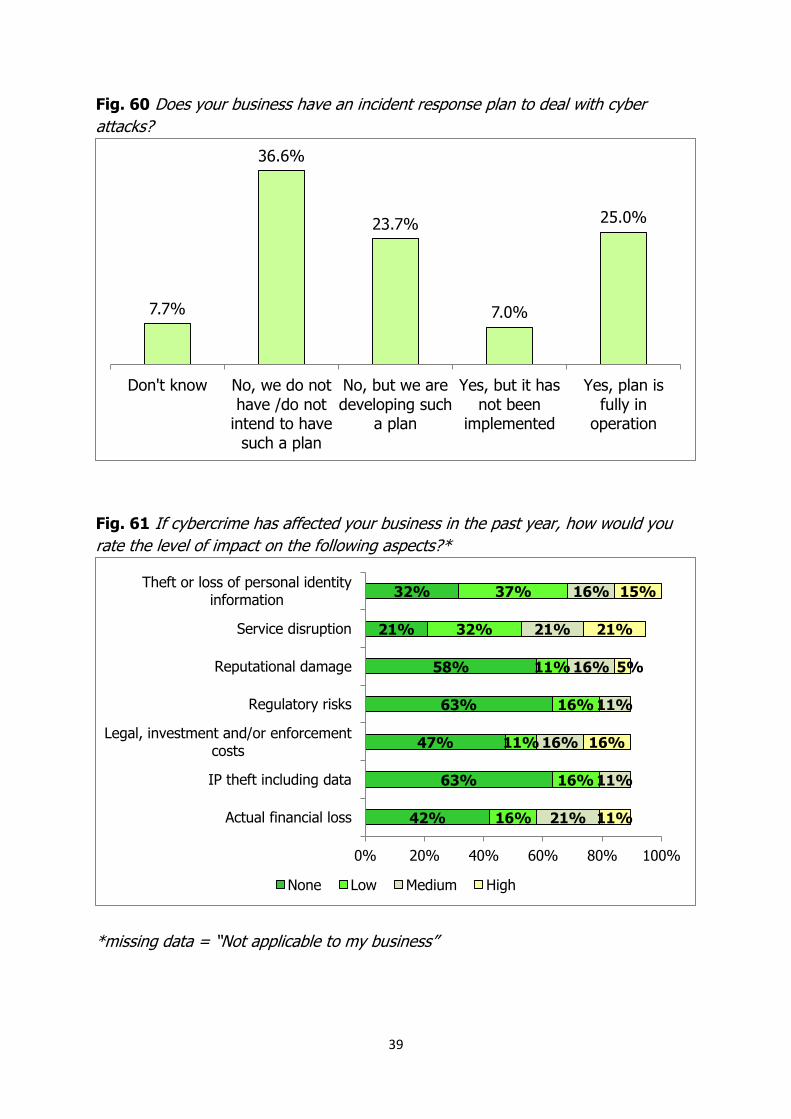
Cyber Risk and Cybercrime
The Business Confidence 2017 survey found that 5.4% of businesses had been
affected by cybercrime in the past year. A significant majority of businesses (91.3%)
indicate that they have at least some understanding of cyber risk, although only one
in four have a fully developed incident response plan for cyberattack. The low
proportion of businesses who have suffered cybercrime have primarily sustained
service disruption and information theft; regulatory risks, IP theft, and reputational
damage are all rated as low impact areas.
Fig. 58 In the past year, has your business been affected by cybercrime?
Fig. 59 To what extent do you believe your business has an understanding of its
exposure to cyber risk?
3.9% 5.7%
85.1%
5.4%
Not applicable to mybusiness
Don't know No Yes
8.7%
60.0%
31.3%
No understanding Some understanding Complete understanding
39
Fig. 60 Does your business have an incident response plan to deal with cyber
attacks?
Fig. 61 If cybercrime has affected your business in the past year, how would you
rate the level of impact on the following aspects?*
*missing data = “Not applicable to my business”
7.7%
36.6%
23.7%
7.0%
25.0%
Don't know No, we do nothave /do not
intend to havesuch a plan
No, but we aredeveloping such
a plan
Yes, but it hasnot been
implemented
Yes, plan isfully in
operation
42%
63%
47%
63%
58%
21%
32%
16%
16%
11%
16%
11%
32%
37%
21%
11%
16%
11%
16%
21%
16%
11%
16%
5%
21%
15%
0% 20% 40% 60% 80% 100%
Actual financial loss
IP theft including data
Legal, investment and/or enforcementcosts
Regulatory risks
Reputational damage
Service disruption
Theft or loss of personal identityinformation
None Low Medium High
40
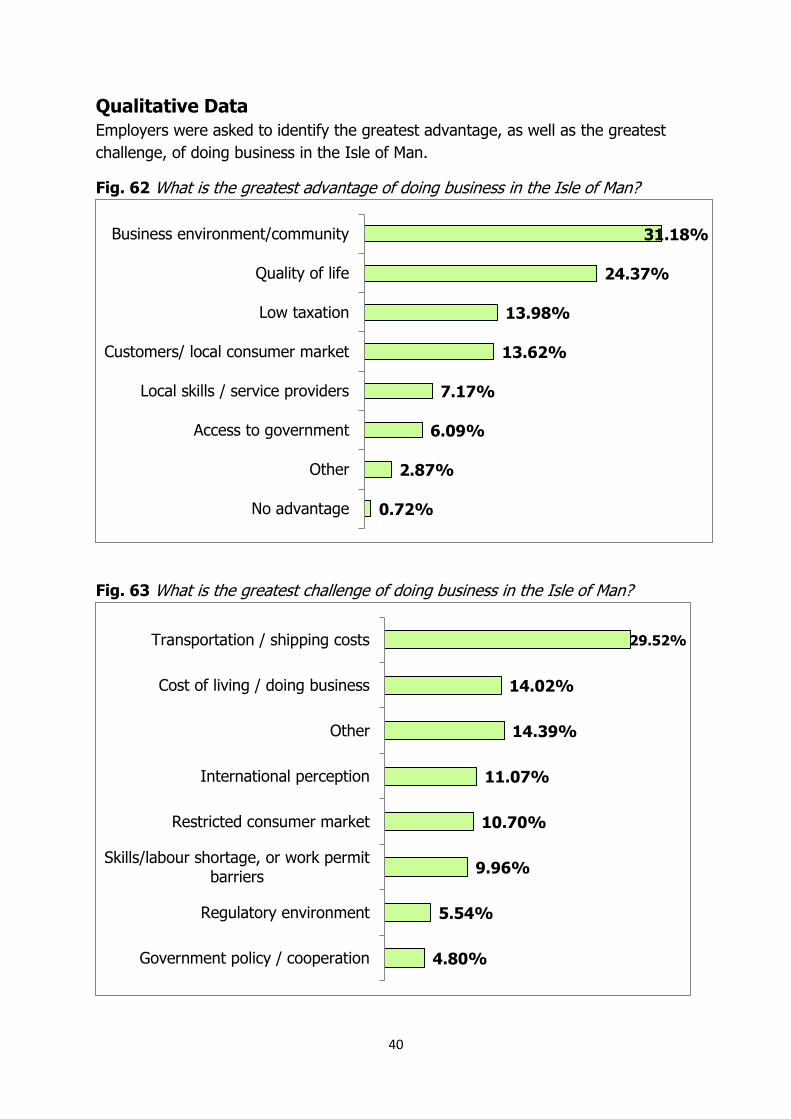
Qualitative Data
Employers were asked to identify the greatest advantage, as well as the greatest
challenge, of doing business in the Isle of Man.
Fig. 62 What is the greatest advantage of doing business in the Isle of Man?
Fig. 63 What is the greatest challenge of doing business in the Isle of Man?
0.72%
2.87%
6.09%
7.17%
13.62%
13.98%
24.37%
31.18%
No advantage
Other
Access to government
Local skills / service providers
Customers/ local consumer market
Low taxation
Quality of life
Business environment/community
4.80%
5.54%
9.96%
10.70%
11.07%
14.39%
14.02%
29.52%
Government policy / cooperation
Regulatory environment
Skills/labour shortage, or work permitbarriers
Restricted consumer market
International perception
Other
Cost of living / doing business
Transportation / shipping costs
41
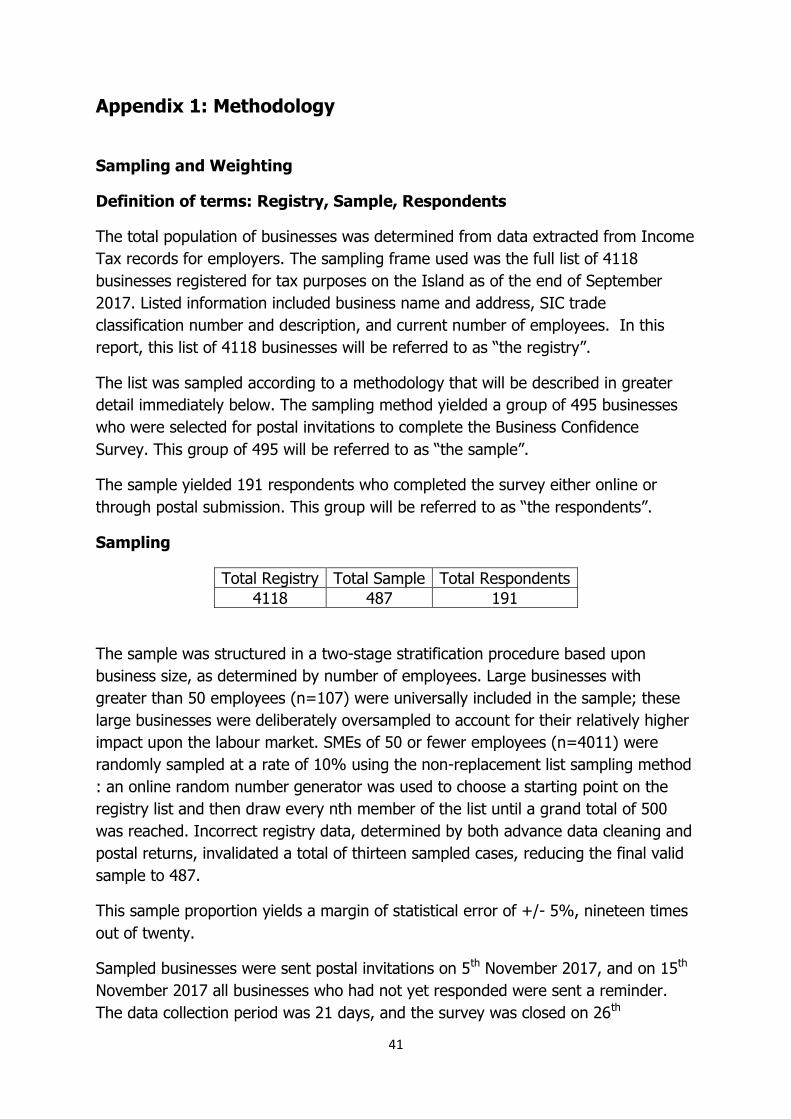
Appendix 1: Methodology
Sampling and Weighting
Definition of terms: Registry, Sample, Respondents
The total population of businesses was determined from data extracted from Income
Tax records for employers. The sampling frame used was the full list of 4118
businesses registered for tax purposes on the Island as of the end of September
2017. Listed information included business name and address, SIC trade
classification number and description, and current number of employees. In this
report, this list of 4118 businesses will be referred to as “the registry”.
The list was sampled according to a methodology that will be described in greater
detail immediately below. The sampling method yielded a group of 495 businesses
who were selected for postal invitations to complete the Business Confidence
Survey. This group of 495 will be referred to as “the sample”.
The sample yielded 191 respondents who completed the survey either online or
through postal submission. This group will be referred to as “the respondents”.
Sampling
Total Registry Total Sample Total Respondents
4118 487 191
The sample was structured in a two-stage stratification procedure based upon
business size, as determined by number of employees. Large businesses with
greater than 50 employees (n=107) were universally included in the sample; these
large businesses were deliberately oversampled to account for their relatively higher
impact upon the labour market. SMEs of 50 or fewer employees (n=4011) were
randomly sampled at a rate of 10% using the non-replacement list sampling method
: an online random number generator was used to choose a starting point on the
registry list and then draw every nth member of the list until a grand total of 500
was reached. Incorrect registry data, determined by both advance data cleaning and
postal returns, invalidated a total of thirteen sampled cases, reducing the final valid
sample to 487.
This sample proportion yields a margin of statistical error of +/- 5%, nineteen times
out of twenty.
Sampled businesses were sent postal invitations on 5th November 2017, and on 15th
November 2017 all businesses who had not yet responded were sent a reminder.
The data collection period was 21 days, and the survey was closed on 26th
42
November. Seven businesses responded through postal submission, and nine
invitations were returned.
Response rates: describe the large and the SMEs with different rates, as well as
including the total rate
The sample response rate for the 2017 Business Confidence Survey was 39.2%, a
very robust rate of return for a sample of this size. Large businesses of greater than
50 employees yielded a sub-sample response rate of 34.9%, while SMEs returned a
sub-sample response rate of 40.1%. The Economic Affairs Division would like to
thank the Isle of Man press and the Isle of Man Chamber of Commerce in their
efforts to increase public awareness of the survey and encourage participation
among sampled respondents.
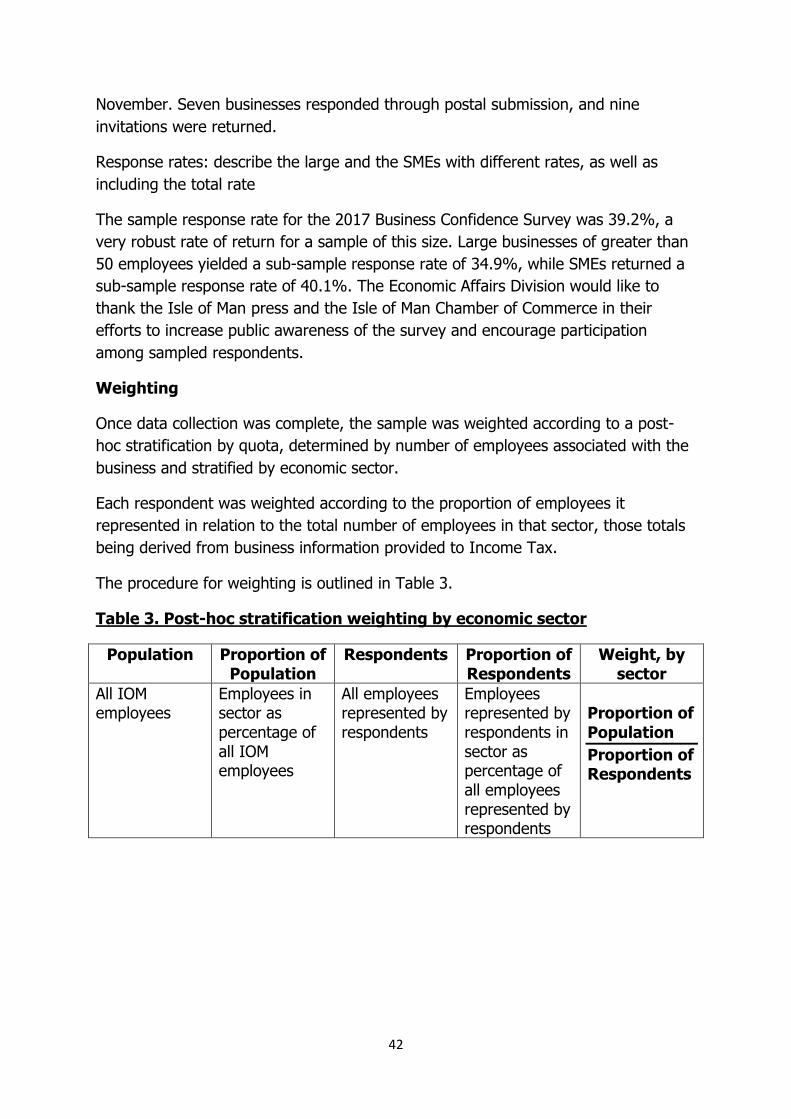
Weighting
Once data collection was complete, the sample was weighted according to a post-
hoc stratification by quota, determined by number of employees associated with the
business and stratified by economic sector.
Each respondent was weighted according to the proportion of employees it
represented in relation to the total number of employees in that sector, those totals
being derived from business information provided to Income Tax.
The procedure for weighting is outlined in Table 3.
Table 3. Post-hoc stratification weighting by economic sector
Population Proportion of Population
Respondents Proportion of Respondents
Weight, by sector
All IOM employees
Employees in sector as percentage of all IOM employees
All employees represented by respondents
Employees represented by respondents in sector as percentage of all employees represented by respondents
Proportion of
Population
Proportion of Respondents
43
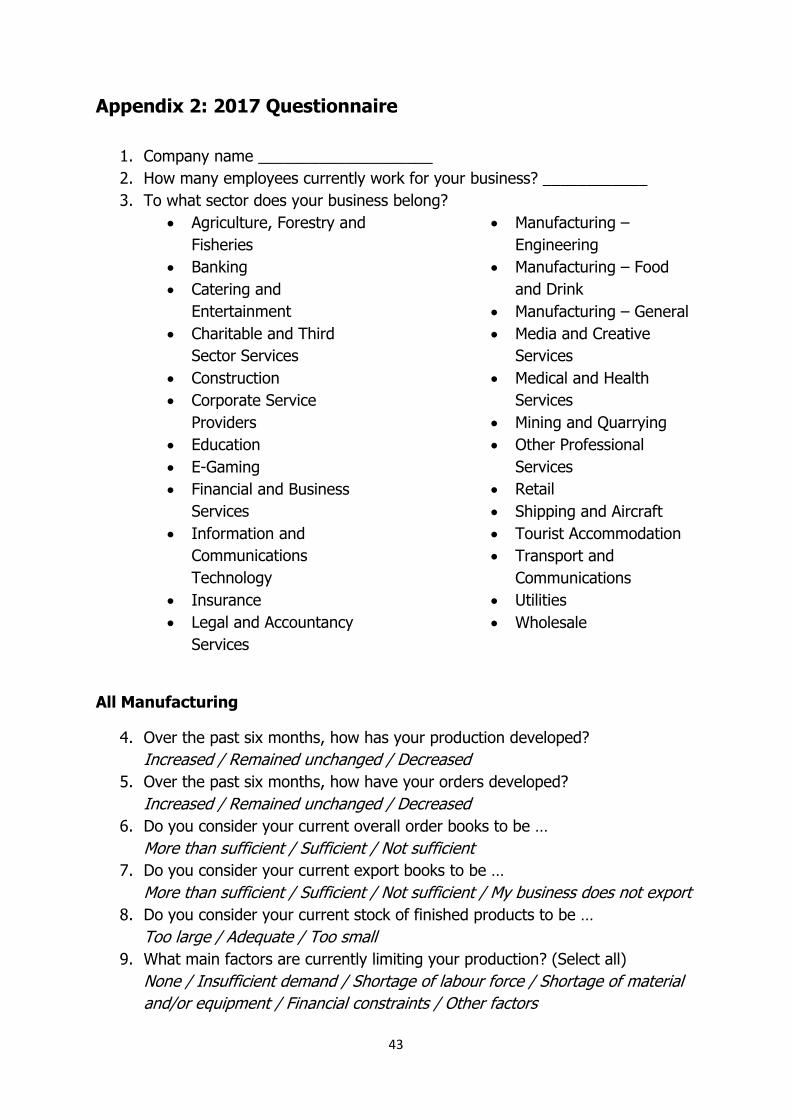
Appendix 2: 2017 Questionnaire
1. Company name ____________________
2. How many employees currently work for your business? ____________
3. To what sector does your business belong?
Agriculture, Forestry and
Fisheries
Banking
Catering and
Entertainment
Charitable and Third
Sector Services
Construction
Corporate Service
Providers
Education
E-Gaming
Financial and Business
Services
Information and
Communications
Technology
Insurance
Legal and Accountancy
Services
Manufacturing –
Engineering
Manufacturing – Food
and Drink
Manufacturing – General
Media and Creative
Services
Medical and Health
Services
Mining and Quarrying
Other Professional
Services
Retail
Shipping and Aircraft
Tourist Accommodation
Transport and
Communications
Utilities
Wholesale
All Manufacturing
4. Over the past six months, how has your production developed?
Increased / Remained unchanged / Decreased
5. Over the past six months, how have your orders developed?
Increased / Remained unchanged / Decreased
6. Do you consider your current overall order books to be …
More than sufficient / Sufficient / Not sufficient
7. Do you consider your current export books to be …
More than sufficient / Sufficient / Not sufficient / My business does not export
8. Do you consider your current stock of finished products to be …
Too large / Adequate / Too small
9. What main factors are currently limiting your production? (Select all)
None / Insufficient demand / Shortage of labour force / Shortage of material
and/or equipment / Financial constraints / Other factors
44
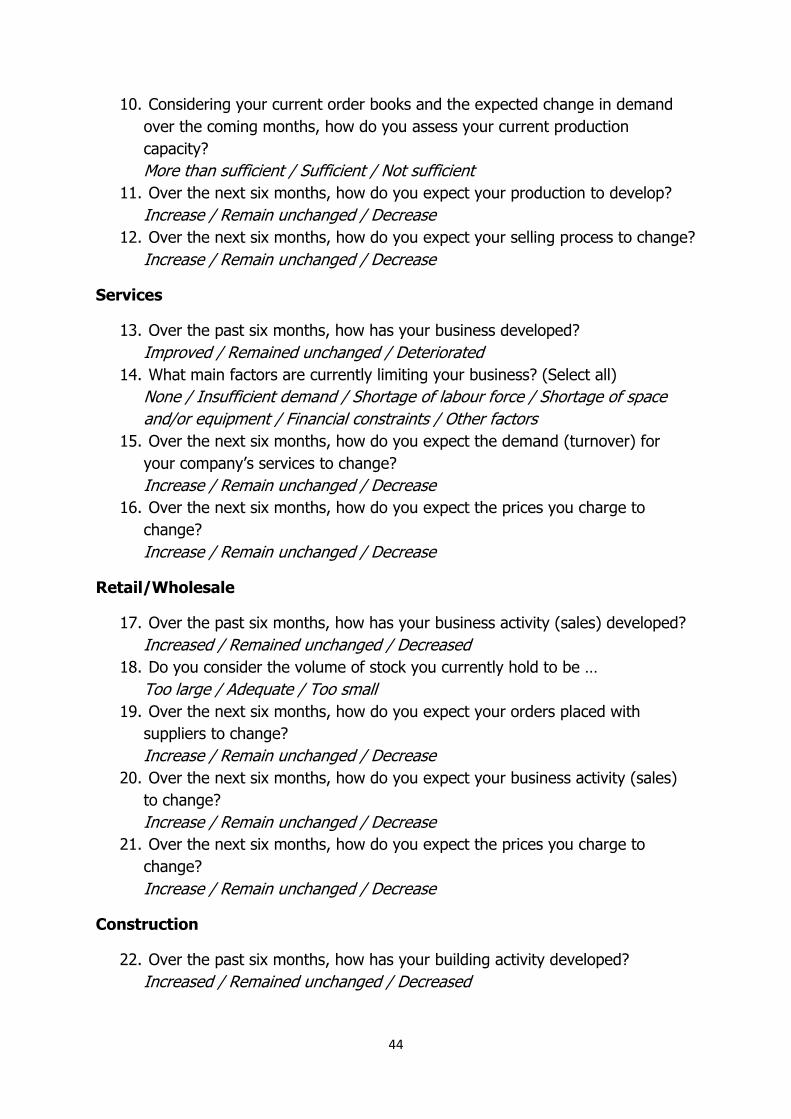
10. Considering your current order books and the expected change in demand
over the coming months, how do you assess your current production
capacity?
More than sufficient / Sufficient / Not sufficient
11. Over the next six months, how do you expect your production to develop?
Increase / Remain unchanged / Decrease
12. Over the next six months, how do you expect your selling process to change?
Increase / Remain unchanged / Decrease
Services
13. Over the past six months, how has your business developed?
Improved / Remained unchanged / Deteriorated
14. What main factors are currently limiting your business? (Select all)
None / Insufficient demand / Shortage of labour force / Shortage of space
and/or equipment / Financial constraints / Other factors
15. Over the next six months, how do you expect the demand (turnover) for
your company’s services to change?
Increase / Remain unchanged / Decrease
16. Over the next six months, how do you expect the prices you charge to
change?
Increase / Remain unchanged / Decrease
Retail/Wholesale
17. Over the past six months, how has your business activity (sales) developed?
Increased / Remained unchanged / Decreased
18. Do you consider the volume of stock you currently hold to be …
Too large / Adequate / Too small
19. Over the next six months, how do you expect your orders placed with
suppliers to change?
Increase / Remain unchanged / Decrease
20. Over the next six months, how do you expect your business activity (sales)
to change?
Increase / Remain unchanged / Decrease
21. Over the next six months, how do you expect the prices you charge to
change?
Increase / Remain unchanged / Decrease
Construction
22. Over the past six months, how has your building activity developed?
Increased / Remained unchanged / Decreased
45
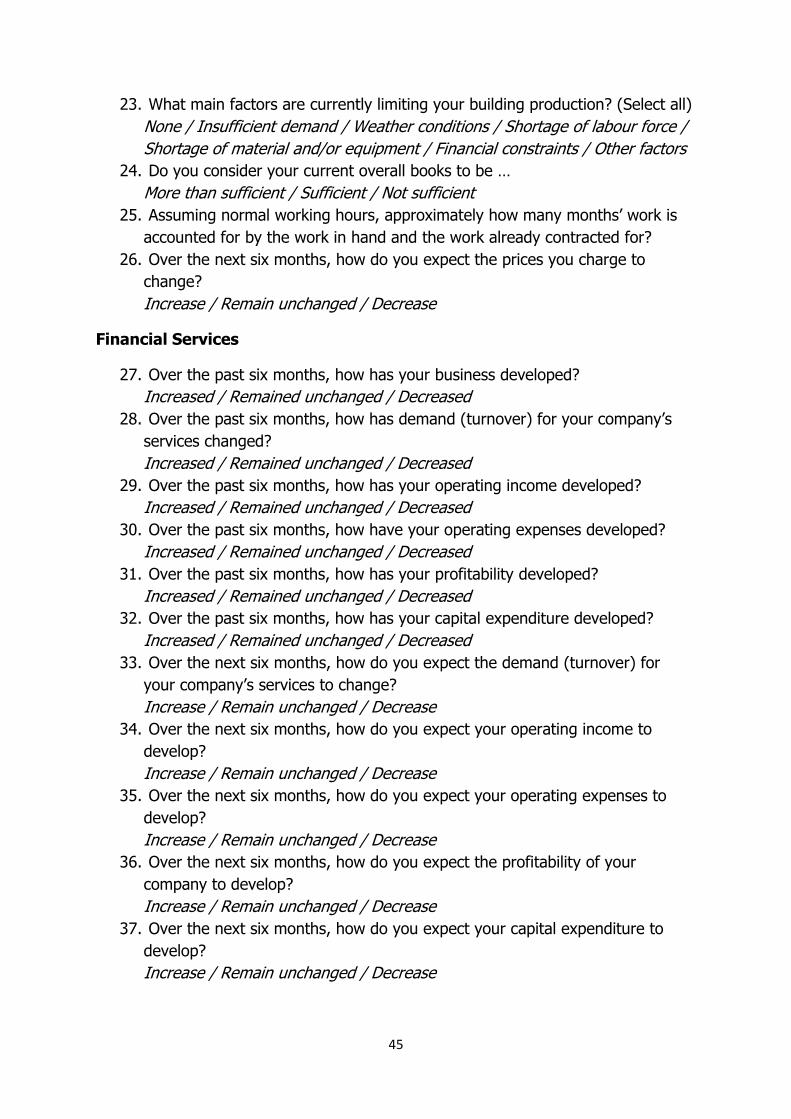
23. What main factors are currently limiting your building production? (Select all)
None / Insufficient demand / Weather conditions / Shortage of labour force /
Shortage of material and/or equipment / Financial constraints / Other factors
24. Do you consider your current overall books to be …
More than sufficient / Sufficient / Not sufficient
25. Assuming normal working hours, approximately how many months’ work is
accounted for by the work in hand and the work already contracted for?
26. Over the next six months, how do you expect the prices you charge to
change?
Increase / Remain unchanged / Decrease
Financial Services
27. Over the past six months, how has your business developed?
Increased / Remained unchanged / Decreased
28. Over the past six months, how has demand (turnover) for your company’s
services changed?
Increased / Remained unchanged / Decreased
29. Over the past six months, how has your operating income developed?
Increased / Remained unchanged / Decreased
30. Over the past six months, how have your operating expenses developed?
Increased / Remained unchanged / Decreased
31. Over the past six months, how has your profitability developed?
Increased / Remained unchanged / Decreased
32. Over the past six months, how has your capital expenditure developed?
Increased / Remained unchanged / Decreased
33. Over the next six months, how do you expect the demand (turnover) for
your company’s services to change?
Increase / Remain unchanged / Decrease
34. Over the next six months, how do you expect your operating income to
develop?
Increase / Remain unchanged / Decrease
35. Over the next six months, how do you expect your operating expenses to
develop?
Increase / Remain unchanged / Decrease
36. Over the next six months, how do you expect the profitability of your
company to develop?
Increase / Remain unchanged / Decrease
37. Over the next six months, how do you expect your capital expenditure to
develop?
Increase / Remain unchanged / Decrease
46
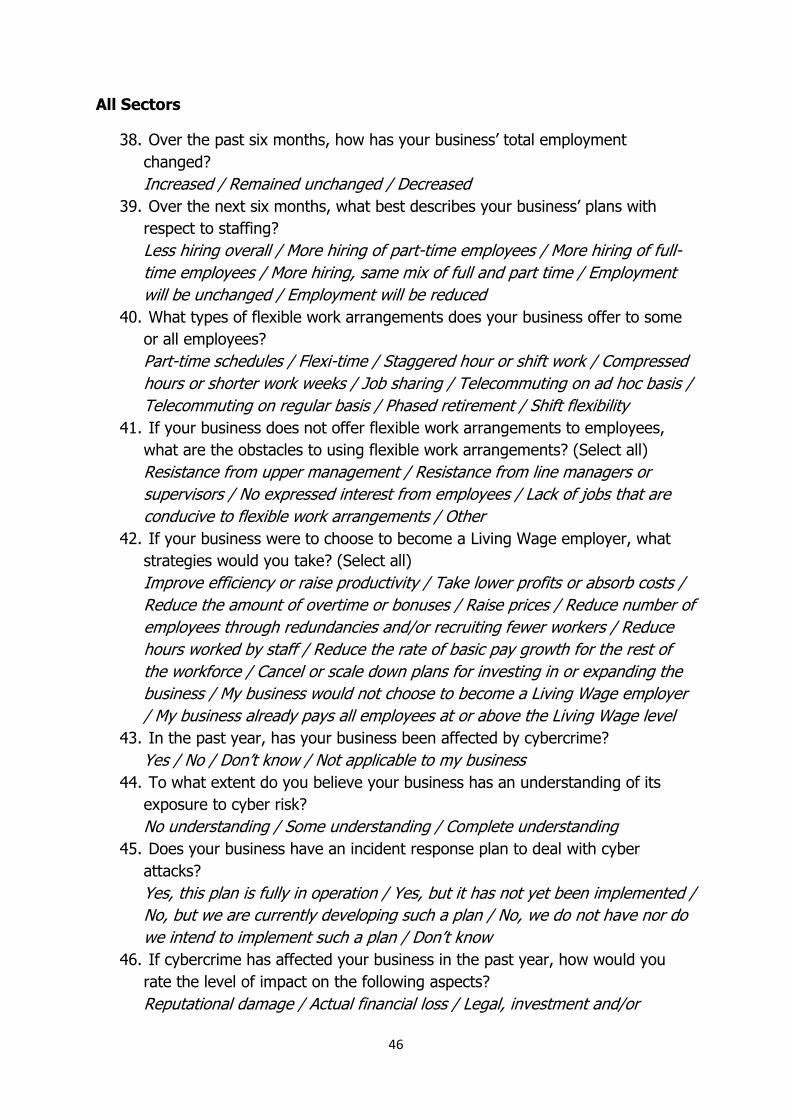
All Sectors
38. Over the past six months, how has your business’ total employment
changed?
Increased / Remained unchanged / Decreased
39. Over the next six months, what best describes your business’ plans with
respect to staffing?
Less hiring overall / More hiring of part-time employees / More hiring of full-
time employees / More hiring, same mix of full and part time / Employment
will be unchanged / Employment will be reduced
40. What types of flexible work arrangements does your business offer to some
or all employees?
Part-time schedules / Flexi-time / Staggered hour or shift work / Compressed
hours or shorter work weeks / Job sharing / Telecommuting on ad hoc basis /
Telecommuting on regular basis / Phased retirement / Shift flexibility
41. If your business does not offer flexible work arrangements to employees,
what are the obstacles to using flexible work arrangements? (Select all)
Resistance from upper management / Resistance from line managers or
supervisors / No expressed interest from employees / Lack of jobs that are
conducive to flexible work arrangements / Other
42. If your business were to choose to become a Living Wage employer, what
strategies would you take? (Select all)
Improve efficiency or raise productivity / Take lower profits or absorb costs /
Reduce the amount of overtime or bonuses / Raise prices / Reduce number of
employees through redundancies and/or recruiting fewer workers / Reduce
hours worked by staff / Reduce the rate of basic pay growth for the rest of
the workforce / Cancel or scale down plans for investing in or expanding the
business / My business would not choose to become a Living Wage employer
/ My business already pays all employees at or above the Living Wage level
43. In the past year, has your business been affected by cybercrime?
Yes / No / Don’t know / Not applicable to my business
44. To what extent do you believe your business has an understanding of its
exposure to cyber risk?
No understanding / Some understanding / Complete understanding
45. Does your business have an incident response plan to deal with cyber
attacks?
Yes, this plan is fully in operation / Yes, but it has not yet been implemented /
No, but we are currently developing such a plan / No, we do not have nor do
we intend to implement such a plan / Don’t know
46. If cybercrime has affected your business in the past year, how would you
rate the level of impact on the following aspects?
Reputational damage / Actual financial loss / Legal, investment and/or
47
enforcement costs / Regulatory risks / Intellectual property theft including
theft of data / Service disruption / Theft or loss of personal identity
information
47. How satisfied would you say you are with the quality of …
Government services / Transport links to and from IOM / Telecommunications
services / Utilities services / Hotels and accommodations
48. How satisfied would you say you are with the cost of …
Government services / Transport links to and from IOM / Telecommunications
services / Utilities services / Hotels and accommodations
49. Do you think that young workers on the Island have the necessary skills to
enter the workplace?
Yes / Somewhat / No / Don’t know
50. Do you think that the education system on the Island is responsive to the
needs of the labour market?
Yes / Somewhat / No / Don’t know
51. Do you have any skills gaps among the employees currently at your
business? (Select all)
No / Technical skills / Interpersonal or customer service skills / Leadership or
management skills / Other skills
52. How satisfied are you with the current IOM work permit system?
Very satisfied / Satisfied / Dissatisfied / Very dissatisfied / Not applicable to
my business
53. How satisfied are you with the current IOM planning system?
Very satisfied / Satisfied / Dissatisfied / Very dissatisfied / Not applicable to
my business
54. How satisfied are you with the level of support for innovation and emerging
technologies?
Very satisfied / Satisfied / Dissatisfied / Very dissatisfied / Not applicable to
my business
55. Please indicate your level of agreement with the following statements:
Regulation is fair and proportionate / The purpose of regulation is clear / It is
easy to comply with regulations
56. It is easy to do business on the Isle of Man.
Strongly agree / Agree / Disagree / Strongly disagree
57. Would you recommend the Isle of Man to others as a good place to do
business?
Yes / Somewhat / No / Don’t know
58. What do you regard as the greatest advantage of doing business on the Isle
of Man?
59. What do you regard as the greatest challenge of doing business on the Isle of
Man?

This document can be provided in large print and audio tape on request
Copyright
Isle of Man Government