Embed Size (px)
Citation preview
i
ISOLATION, PURIFICATION AND CHARACTERIZATION OF
INULIN AND FRUCTOOLIGOSACCHARIDES FROM CHICORIUM
INTYBUS AND INULINASE FROM ASPERGILLUS NIGER.
A thesis submitted in fulfilment of the
requirements for the degree of
MASTER OF SCIENCE
of
RHODES UNIVERSITY
in the
Department of Biochemistry, Microbiology and Biotechnology
Faculty of Science
By
Vuyo Bhongolethu Mavumengwana
June 2004
ii
ABSTRACT
Inulin is a non-digestible carbohydrate fructan polymer consisting mainly of β (1→2)
fructosyl fructose links. Enzymatic hydrolysis of inulin by inulinase results in the
production of low D.P (degree of polymerization) oligosaccharides also called fructo-
oligosaccharides (FOS).
Isolation of inulin from chicory root (Chicorium intybus) was achieved by first,
extraction using deionized water (600C), followed by carbonation (0.1 M Ca(OH)2 and
CO2 gas). This was filtered in order to remove the non sugars, thereafter, treated
successfully with polyamide 6 powder. A cation exchanger and an anion exchanger were
used to further exclude other components such as tannins and pigments. The extracted
inulin was quantified using the Somogyi-Nelson colourimetric assay. Chicory root (207
g, 30 % being water) yielded 30 g of the raw extract. A 100 mg of the raw extract was
assayed and found to contain 11 % yield of inulin which was 80.2 % in purity and 4 %
free fructose. Analysis of the crude and purified inulin extracts on the MALDI TOF
spectrometry showed the samples to have a DP of 2 to 22 and 2 to 27 respectively.
Maximum inulinase production from Aspergillus niger grown on inulin was observed
after 60 hours. The enzyme activity was found to be 1.168 U/ml with a temperature and
pH optimum of 30 °C and 7.7 respectively. The enzyme proved to be unstable as it
progressively lost its total activity during attempts at purification.
Key words: inulin, chicory, fructooligosaccharides, Aspergillus niger, inulinase.
iii
TABLE OF CONTENTS PAGE No
TITLE PAGE……………………………………………………………….i
ABSTRACT………………………………………………………………..ii
TABLE OF CONTENTS………………………………………………..iii
LIST OF FIGURES………………………………………………………ix
LIST OF TABLES……………………………………………………….xii
LIST OF ABBREVIATIONS………………………………………….xiii
ACKNOWLEDGEMENTS…………………………………………….xv
CHAPTER ONE: Literature Review……………………………….……...... 1.1 Introduction….............................................................................................. 1.1.1 Development of the South African chicory industry……………………… 1.1.2 Current state of affairs….……………………………………………….... 1.2 General uses of chicory roots……………………………………………… 1.3 Fructans as alternative storage polymers…………………………………… 1.3.1 Sucrose usage and ultimate fructan accumulation………………………..... 1.3.1.1 Role of fructans in plants………………………………………………… 1.3.2 Types of fructans………………………………………………………….. 1.3.2.1 Fructan biosynthesis……………………………………………………... 1.3.2.2 Fructooligosaccharide (FOS) accumulation…………………………… 1.4 Physico-chemical properties of chicory inulin………………………….….. 1.4.1 Utility in foods…………………………………………………………….. 1.4.2 Enzymes……………………………………………………………………
1 1 2 3 5 7 7 8 9 11 12 12 13 17
iv
1.4.3 Inulin and fructooligosaccharide energy value……………………………. 1.5 Regulation of intestinal microflora…………………………………………… 1.5.1 Systemic effects of inulin on lipid metabolism……………………………. 1.5.1.1 Cholesterol management using inulin…………………………………… 1.5.1.2 Proliferation of bifidobacteria and their effects in the colon…………….. 1.5.1.3 Regulation of the immune system of the colon………………………….. 1.6 Inulin extraction….…………………………………………………………... 1.6.1 FOS production utilizing enzymes….…………………………………….. 1.6.2 Inulin characterization...…………………………………………………… 1.7 Aims and objectives…………………………………………………………… 1.7.1 Aims………………………………………………………………................. 1.7.2 Objectives…………………………………………………………………… CHAPTER 2: Inulin extraction................................................................. 2.1 Introduction………………………………………………………………….. 2.1.1 Cell compartmentalization………………………………………………… 2.1.2 Cell to cell adherence………………………………………………………… 2.1.3 Organelles within the cell…………………………………………………….. 2.1.4 The vacuole, inulin locality………………………………………………… 2.1.5 Cell wall lysis ………………………………………………………………… 2.1.6 Isolation of inulin from Dahlia tubers………………………………………… 2.2 Materials and Methods……………………………………………………….. 2.2.1 Materials…………………………………………………………………...... 2.2.2 Methods………………………………………………………………….......
18 19 21 24 24 27 27 26 27 32 32 32 33. 33 33 34 35 36 38 38 39 39 40
v
2.2.2.1Determination of reducing sugars (Somogyi-Nelson)……………………. 2.2.2.2 Preparation of the chicory extract…………………………………………… 2.2.2.3 HCl concentration for optimum inulin hydrolysis………………….......... 2.2.2.3.1 Optimum temperature for inulin extraction…………………………….. 2.2.2.3.2 Optimum heating period………………………………………………… 2.2.2.3.3 Inulin extraction………………………………………………………… 2.3 Results and Discussion……………………………………………………….. 2.3.1 Optimum HCl concentration………………………………………………… 2.3.2 Optimum temperature and heating period………………………………….. 2.3.3 Extracted inulin….……………………………………………………… 2.3.4 Summary…………………………………………………………………. CHAPTER 3: Inulin purification: Batch and Continuous Column Chromatography…………………………. 3.1 Introduction…………………………………………………………………… 3.1.1 Secondary metabolites……………………………………………………… 3.1.1.1 Sesquiterpene lactones……………………………………………………… 3.1.1.2 Tannins……………………………………………………………………… 3.1.1.3 Removal of tannins……………………………………………………… 3.1.1.4 Cationic and anionic ion exchange resins………………………………. 3.1.2 Materials and Methods……………………………………….……………… 3.1.2.1 Materials………………………………………………………………….. 3.1.2.2 Methods…………………………………………………………………… 3.1.2.2.1 Colour monitoring……………………………………………………….
40 40 40 41 41 41 44 44 45 46 47 50 50 50 51 51 53 54 54 54 55 55
vi
3.1.2.2.2 Tannin monitoring……………………………………………………… 3.1.2.2.3 Carbonation…………………………………………………………….. 3.1.2.2.4 Ion exchange: Batch purification………………………………………. 3.1.2.2.5 Polyamide 6…………………………………………………………….. 3.1.2.3 Tandem (continuous) purification ……………………………………….. 3.1.2.3.1 Batch purification………………………………………………………… 3.1.2.3.2 Column purification………………………………………………………… 3.1.3 Results and Discussion…………………………………………………………. 3.1.3.1 Spectrophotometric scan……………………………………………………… 3.1.3.2 Carbonation…………………………………………………………………… 3.1.3.3 Ion exchange: Batch purification…………………………………………….. 3.1.3.4 Polyamide 6…………………………………………………………………… 3.1.4 Tandem (continuous) process………………………………………………… 3.1.4.1 Batch purification……………………………………………………………. 3.1.4.2 Column chromatography…………………………………………………….. 3.1.5 Summary……………………………………………………………………….. CHAPTER 4: Inulin and fructooligosaccharide characterization…………………………………………….. 4.1 Introduction………………………………………………………………............. 4.1.1 Carbohydrate analysis……………………………………………………… 4.1.2 Analytical techniques…………………………………………………………… 4.1.3 Materials and Methods………………………………………………………
55 55 56 56 56 56 56 57 57 57 59 60 60 61 62 66 68 68 68 69 71
vii
4.1.3.1 Materials………………………………………………………………….. 4.1.3.2 Methods…………………………………………………………………… 4.1.3.2.1 Gel filtration on Sephadex G-50………………………………………… 4.1.3.2.2 Gel electrophoresis of fluorophore labelled inulin……………………… 4.1.3.2.3 SDS PAGE……………………………………………………………… 4.1.3.2.4 Thin layer chromatography…………………………………………….. 4.1.3.2.5 MALDI TOF spectrometry……………………………………………… 4.1.3.3 Results and Discussion…………………………………………………… 4.1.3.3.1 Gel filtration on Sephadex G 50………………………………………… 4.1.3.3.2 Gel electrophoresis of fluorophore labelled inulin……………………… 4.1.3.3.3 Thin layer chromatography…………………………………………….. 4.1.3.3.4 MALDI TOF spectra…………………………………………………… 4.1.3.4 Summary………………………………………………………………….. CHAPTER 5: Inulinases from Aspergillus niger………………….. 5.1 Introduction…………………………………………………………………… 5.1.1 Production of fructose syrups………………………………………………. 5.1.2 Inulinases from Aspergillus niger…………………………………………… 5.1.3 Materials and Methods……………………………………………………… 5.1.3.1 Materials…………………………………………………………………... 5.1.3.2 Methods…………………………………………………………………… 5.1.3.2.1 Aspergillus niger growth…………………………….………………….
71 72 72 72 72 73 73 74 74 75 75 76 78 80 80 80 82 84 84 84 84
viii
5.1.3.2.2 Protein determination…………………………………………………….. 5.1.3.2.3 Inulinase assay……………………………………………………………. 5.1.3.2.4 Partial purification of inulinase (DEAE DE 23 ion exchange column)… 5.1.3.2.5 SDS PAGE………………………………………………………………. 5.1.3.2.6 Silver staining……………………………………………………………… 5.1.3.2.7 Temperature profile of the inulinase………………………………………. 5.1.3.2.8 pH profile of the inulinase…...................................................................... 5.1.4 Results and Discussion………………………………………………………... 5.1.4.1 Inulinase production from Aspergillus niger……………………………….. 5.1.4.2 Partial purification of inulinase (DEAE DE 23 ion exchange column)……. 5.1.4.3 SDS PAGE and silver staining….................................................................. 5.1.4.4 Temperature profile of the inulinase……………………………………….. 5.1.4.5 pH profile of the inulinase…………………………………………………. 5.1.4.6 Summary……………………………………………………………………. CHAPTER 6: General discussion and conclusion……………………. References………………………………………………………………………… Appendices………………………………………………………………………… Appendix 1: Fructose standard curve……………………………………………… 2: Effect of concentrated HCl on the Somogyi-Nelson assay…………. 3: Folin Dennis assay and tannin standard curve…………………………. 4: Degree of polymerization conversion curve…………………………. 5: Bradford assay and protein standard curve…………………………….
85 85 85 86 86 87 87 87 87 89 90 90 91 92 93 99 109 109 110 110 111 112
ix
LIST OF FIGURES
Figure Page No.
Chicory roots after harvest (©J.Dames 2003)………………………….1 Location of Chicory S.A on the Eastern Cape province of South Africa (Safari-SA, 2004)…..................................................................................4 Simplified structure of inulin (Vandamme and Derycke, 1983)……….10 The trisaccharide, 1-kestose (Vijn and Smeekens, 1999)……………...10 A mixed levan bifurcose consists of a (2→1) and a (2→6)-linked β-D-fructosyl unit linked to sucrose (Vijn and Smeekens, 1999)…………..10 A branched levan neokestose consists of β (2→6) glycosidic linkages (Vijn and Smeekens, 1999)…………………………………………….11 Schematic representation of the Pulsincap system. Adapted from (Vandamme et al., 2002)……………………………………………….14 Depiction of inulin stability from hydrolytic enzymes (Gibson and Roberfroid 1995)……………………………………………………….20 Beneficial impacts from bifidobacteria accumulation in the colon. (Gibson and Roberfroid, 1995)………………………………………...21 A summary of sources of fatty acids used for VLDL-TAG synthesis in the liver (Parks 2002)…………………………………………………..23 Putative mechanisms involved in lipid metabolism due to dietary inulin and oligofructose intake (Delzenne et al., 2002)………………………25 Prevalence of pathogenic bacteria before inulin intake. (Gibson and Roberfroid 1995)……………………………………………………….26 Prebiotic effect of inulin (proliferation of bifidobacteria). (Gibson and Roberfroid 1995)……………………………………………………….26 Counter current diffuser (Hullet S.A, 2004)…………………………...28 Dionex chromatogram of commercially available inulin (Sigma) from chicory (Franck, 2002 a)………………………………………………30
Figure: 1.1: Figure: 1.2: Figure: 1.3: Figure: 1.4: Figure: 1.5: Figure: 1.6: Figure: 1.7: Figure: 1.8: Figure: 1.9: Figure: 1.10: Figure: 1.11: Figure: 1.12: Figure: 1.13: Figure: 1.14 Figure: 1.15
x
Figure: 1.16 Figure: 2.1: Figure: 2.2: Figure: 2.3: Figure: 2.4: Figure: 2.5: Figure: 2.6: Figure: 2.7: Figure: 2.8: Figure: 3.1: Figure: 3.2: Figure: 3.3: Figure: 3.4: Figure: 3.5: Figure: 3.6: Figure: 3.7 Figure: 3.8 Figure: 4.1 Figure: 4.2 Figure: 4.3 Figure: 4.4
Dionex chromatogram of native inulin from chicory (Franck, 2002 a).31 Cell wall textures (Emons and Mulder, 2000)………………………...34 Location of the middle lamella (©Shaw, M, 1998)…………………....35 Plant cell with a conspicuous vacuole (Armstrong 1989)……………..36 A schematic outline of fructan accumulation in the vacuole (Vijn and Smeekens 1999)…………………………………………………….....37 A flow chart of the raw inulin extraction process……………………..43 Optimum acid concentration for the hydrolysis of inulin……………..44 Optimum heating temperature for maximum inulin release…..............45 Optimum heating period in the extraction of inulin...………………....46 The effect of carbonation on chicory homogenate over a period of time with respect to pH variations (caused by CO2 bubbling) and colour removal………………………………………………………………...58 Amount of ion exchange resin that is adequate for maximum colour removal..………………………………………………………………59 Polyamide 6 optimization and its effect on tannin concentration and discolouration………………………………………………………….60 Discolouration and tannin removal by tandem continuous purification…………………………………………………………….61 Monitoring inulin and free fructose contents during the purification process…………………………………………………………………62 Continuous purification system for inulin ……………………………63 Raw and purified inulin samples…........................................................64 Purification flow chart………………………………………………...65 Diagrammatic representation of the principle of gel filtration. (Mathews and van Holde, 1990 b)…………………………………………….….70 Structural formula of 8-aminonaphthalene-1.3.6-trisulfonate (ANTS). (Jackson 1994)………………………………………………………...71 Sephadex G-50 chromatogram………………………………………..74 Developed TLC plate…………………………………………………75
xi
Figure 4.5: Figure 4.6: Figure 5.1: Figure 5.2: Figure 5.3: Figure 5.4: Figure 5.5: Figure 5.6:
MALDI TOF spectrum for raw inulin…………………………………..77 MALDI TOF spectrum for purified inulin………….…………………..77 Flow chart describing the conventional production of fructose syrups. Adapted from (Vandamme and Derycke, 1983)….…………………….81 Proposed inulin and fructooligosaccharide production using a continuous system…………………………………………………………………...83 Inulinase activity and biomass yield of Aspergillus niger grown on inulin…………………………………………………………………….88 DEAE column chromatography (1.3 × 23 cm) profile of inulinase from Aspergillus niger………………………………………………………..89 The temperature profile for the inulinase activity………………………91 pH profile of the inulinase………………………………………………92
xii
LIST OF TABLES
Table Page No
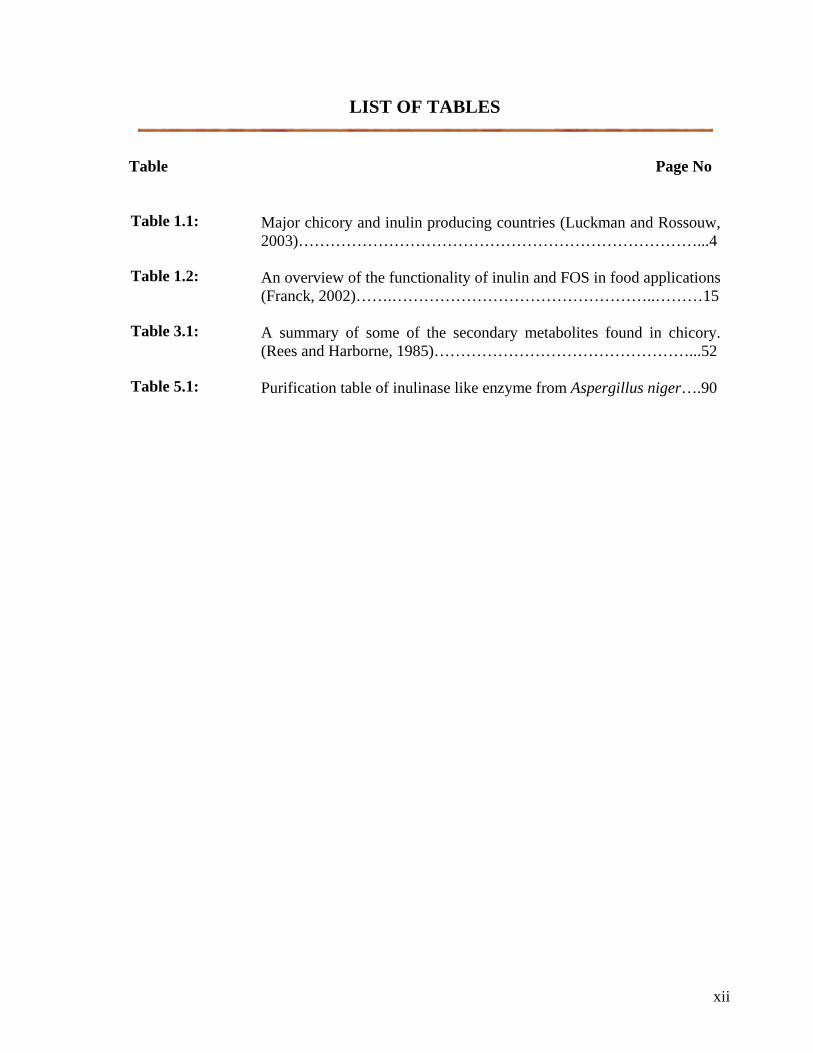
Table 1.1: Table 1.2: Table 3.1: Table 5.1:
Major chicory and inulin producing countries (Luckman and Rossouw, 2003)…………………………………………………………………...4 An overview of the functionality of inulin and FOS in food applications (Franck, 2002)…….…………………………………………..………15 A summary of some of the secondary metabolites found in chicory. (Rees and Harborne, 1985)…………………………………………...52 Purification table of inulinase like enzyme from Aspergillus niger….90
xiii
LIST OF ABBREVIATIONS
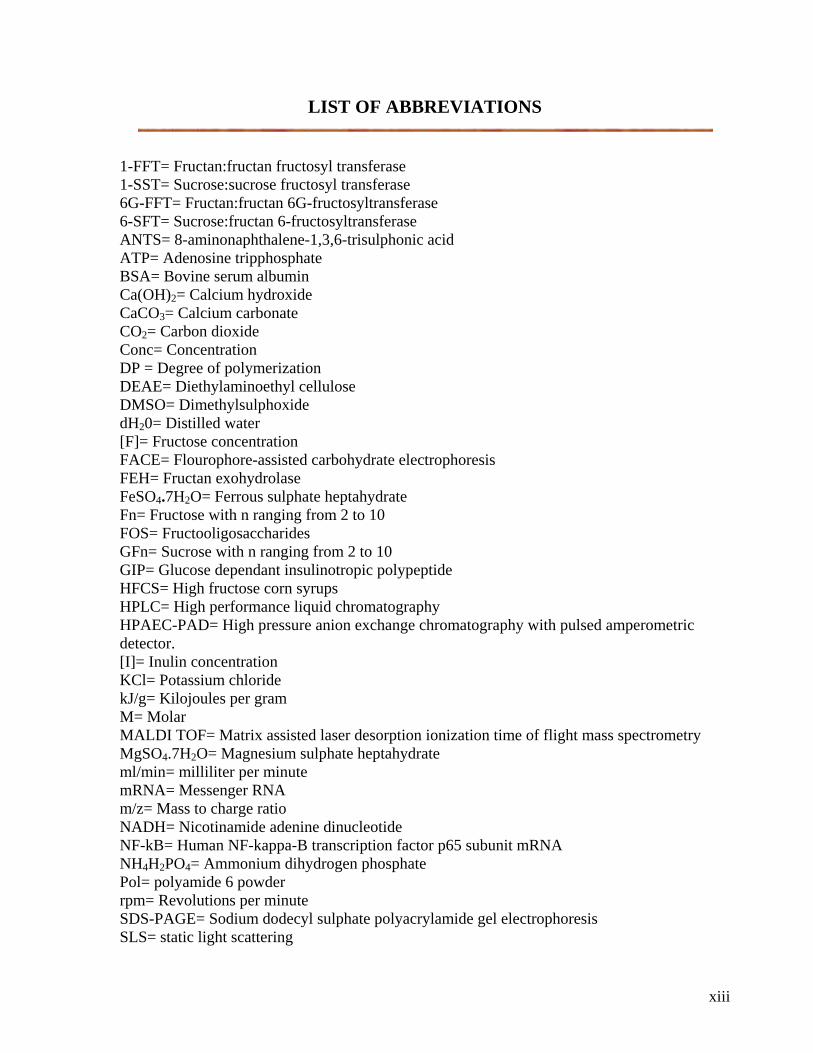
1-FFT= Fructan:fructan fructosyl transferase 1-SST= Sucrose:sucrose fructosyl transferase 6G-FFT= Fructan:fructan 6G-fructosyltransferase 6-SFT= Sucrose:fructan 6-fructosyltransferase ANTS= 8-aminonaphthalene-1,3,6-trisulphonic acid ATP= Adenosine tripphosphate BSA= Bovine serum albumin Ca(OH)2= Calcium hydroxide CaCO3= Calcium carbonate CO2= Carbon dioxide Conc= Concentration DP = Degree of polymerization DEAE= Diethylaminoethyl cellulose DMSO= Dimethylsulphoxide dH20= Distilled water [F]= Fructose concentration FACE= Flourophore-assisted carbohydrate electrophoresis FEH= Fructan exohydrolase FeSO4.7H2O= Ferrous sulphate heptahydrate Fn= Fructose with n ranging from 2 to 10 FOS= Fructooligosaccharides GFn= Sucrose with n ranging from 2 to 10 GIP= Glucose dependant insulinotropic polypeptide HFCS= High fructose corn syrups HPLC= High performance liquid chromatography HPAEC-PAD= High pressure anion exchange chromatography with pulsed amperometric detector. [I]= Inulin concentration KCl= Potassium chloride kJ/g= Kilojoules per gram M= Molar MALDI TOF= Matrix assisted laser desorption ionization time of flight mass spectrometry MgSO4.7H2O= Magnesium sulphate heptahydrate ml/min= milliliter per minute mRNA= Messenger RNA m/z= Mass to charge ratio NADH= Nicotinamide adenine dinucleotide NF-kB= Human NF-kappa-B transcription factor p65 subunit mRNA NH4H2PO4= Ammonium dihydrogen phosphate Pol= polyamide 6 powder rpm= Revolutions per minute SDS-PAGE= Sodium dodecyl sulphate polyacrylamide gel electrophoresis SLS= static light scattering
xiv
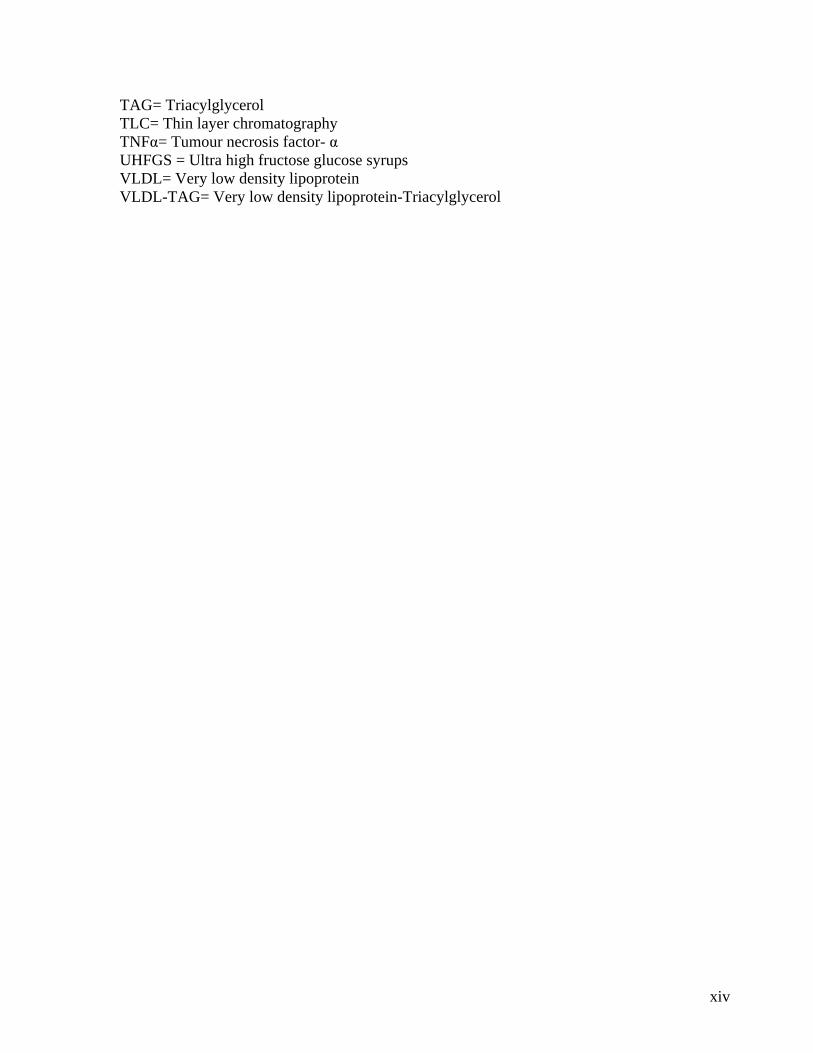
TAG= Triacylglycerol TLC= Thin layer chromatography TNFα= Tumour necrosis factor- α UHFGS = Ultra high fructose glucose syrups VLDL= Very low density lipoprotein VLDL-TAG= Very low density lipoprotein-Triacylglycerol
xv
ACKNOWLEDGEMENTS
Thanks God almighty father for seeing me through. This thesis is dedicated to my grandparents Margarett and Reuben Sibeko. The author wishes to thank the following people for their contributions to this thesis: I would like to gratefully acknowledge Prof Whiteley’s supervision and guidance throughout this study, and above all, for having given me the opportunity to be a part of a vibrant and stimulating department. I will forever be indebted to you. My parents for their constant support and encouragement. Dr Wilhelmi and my father for proofreading this thesis. Your objective and constructive inputs were much appreciated. Dr Burgess for always being there for me during difficult times. Mr Mike Nqweniso for providing the Aspergillus niger inoculum on numerous occasions. Mrs Isabel Rong from the ARC plant protection unit for her unselfish advice on appropriate liquid media for fungal growth. Rob Karreman from the University of Cape Town for analysing my samples on the MALDI TOF. Henry Roman, Mike Ludewig, Oluwaseun Oyekola, Bintou Ahmadou Ahidjo, Mrs Louise Howis, Fritha Hennessy Xolisa Melamane, Bongani Sibanyoni, Vumile Mavumengwana and Nyaniso Masombuka for frequently demonstrating that when days are dark friends are not always few. My colleagues in lab 301.
Chapter 1 Literature review
1
Chapter 1
Literature review
1.1 Introduction
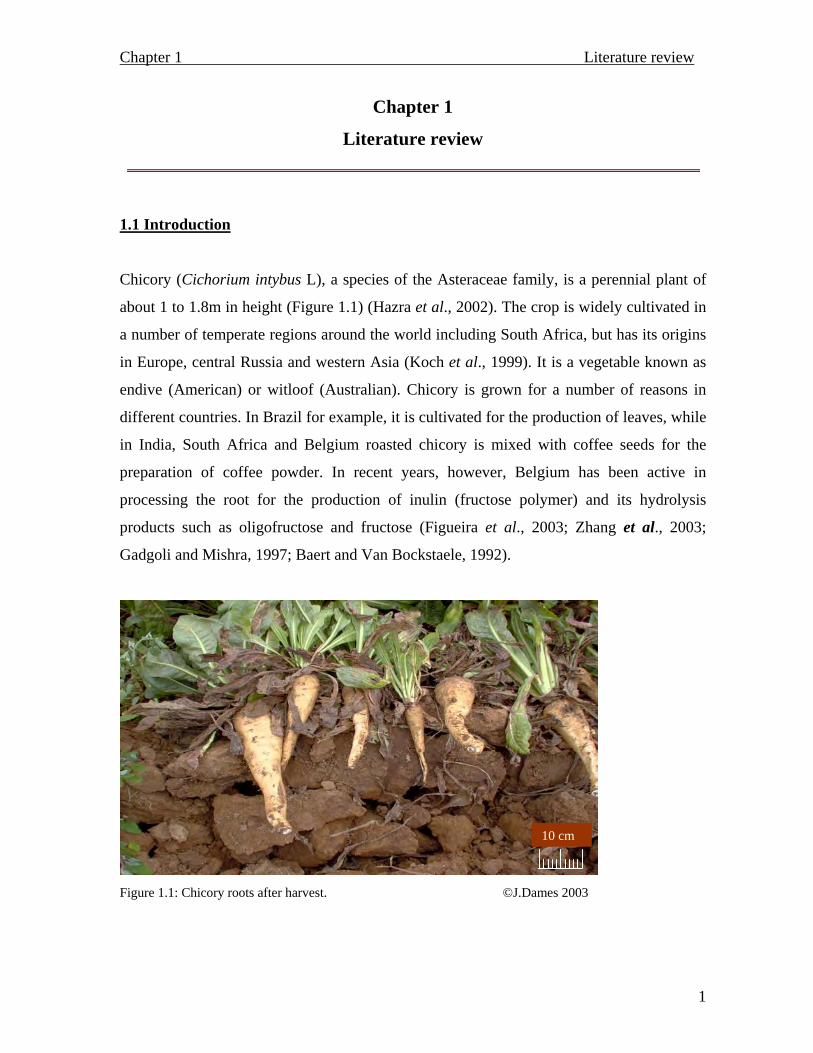
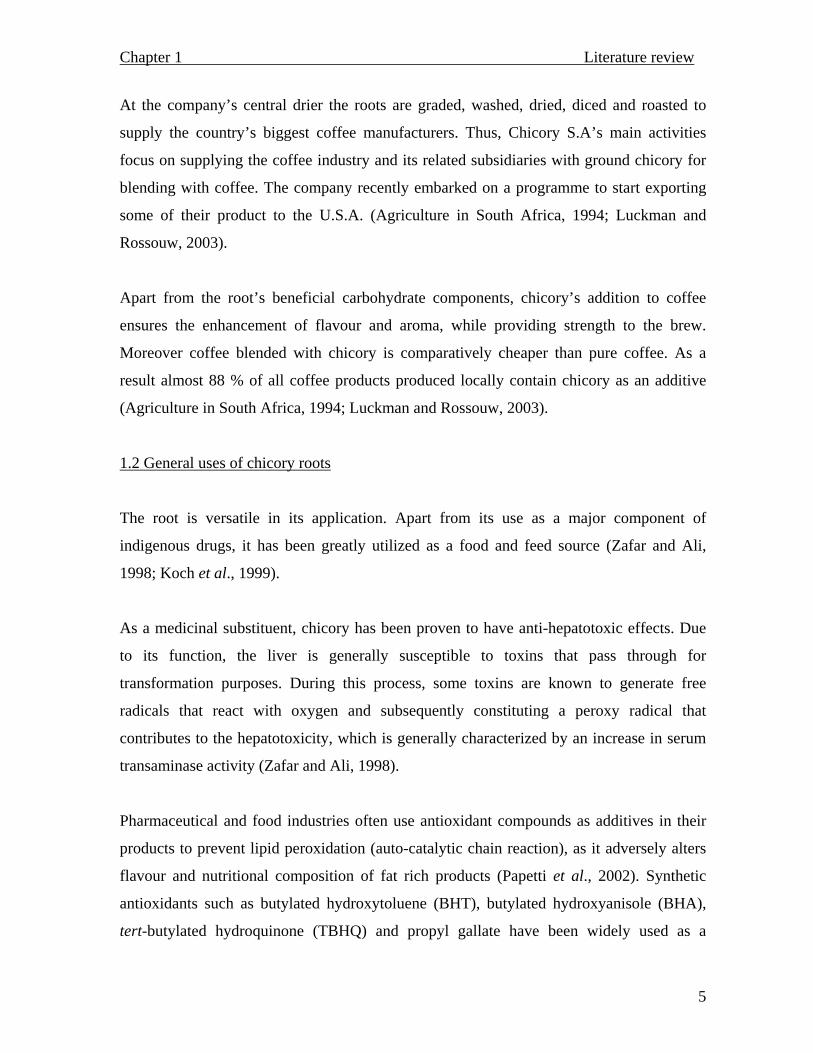
Chicory (Cichorium intybus L), a species of the Asteraceae family, is a perennial plant of
about 1 to 1.8m in height (Figure 1.1) (Hazra et al., 2002). The crop is widely cultivated in
a number of temperate regions around the world including South Africa, but has its origins
in Europe, central Russia and western Asia (Koch et al., 1999). It is a vegetable known as
endive (American) or witloof (Australian). Chicory is grown for a number of reasons in
different countries. In Brazil for example, it is cultivated for the production of leaves, while
in India, South Africa and Belgium roasted chicory is mixed with coffee seeds for the
preparation of coffee powder. In recent years, however, Belgium has been active in
processing the root for the production of inulin (fructose polymer) and its hydrolysis
products such as oligofructose and fructose (Figueira et al., 2003; Zhang et al., 2003;
Gadgoli and Mishra, 1997; Baert and Van Bockstaele, 1992).
Figure 1.1: Chicory roots after harvest. ©J.Dames 2003
10 cm
Chapter 1 Literature review
2
The use of chicory roots for human consumption can be traced as far back as 2000 B.C
from the Ebers Papyrus (ancient Egyptian medical document), where Egyptians on the
banks of the Nile cultivated chicory and used it to aid digestion. The popularity of chicory
as a herbal plant in Europe came after its documentation by Pedanios Dioscoride, a Greek
doctor in the Roman army, who was the first to mention its curative powers. It
subsequently became common to employ chicory root extracts as therapeutic interventions
for liver, kidney and stomach complaints (Luckman and Rossouw, 2003).
The commercialization of roasted chicory roots as coffee additives was first observed in the
18th century in Europe, the same period where the first commercial chicory processing
French factories appeared. This massive production of roasted chicory was largely
prompted by Napoleon’s continental blockade of English shipping, which indirectly
contributed towards the origins and development of the South African chicory industry
(Luckman and Rossouw, 2003).
1.1.1 Development of the South African chicory industry
During the early years of the 18th century, the Napoleonic blockade impacted negatively on
the lines of trade with coffee sources. Such interferences prompted the coffee industry to
look elsewhere for alternatives, which were subsequently realized in chicory. Unknowingly
to many, this was to be the beginning of the development of the South African chicory
board (Young, 1958).
Chicory was locally grown on a commercial scale for the first time during the eighteen
nineties. By the early nineteen hundreds chicory plantations had extended to areas like
Paarl, Alexandria, Queenstown and East London. This growth was however, not without
problems, as steady supplies in sufficient quantities (for factory processing) were not
forthcoming due to increasing demands. The end of the First World War (the very stimulus
of the industry) made it possible for importers (particularly Belgium and Holland) to
compete with local growers (already in fierce competition). Overseas growers sold their
Chapter 1 Literature review
3
crop at comparatively low prices which forced many local growers to revisit a 1906
suggestion concerning co-operative marketing (Young, 1958).
It is due to these market complexities that on the 29th September 1926 the Alexandria co-
operative chicory growers’ society was established and registered as an unlimited
company. The main objective of the society was to minimize competition among local
producers and to stabilize the already volatile market (Young, 1958).
On the 1st October 1993, the chicory board was discontinued and replaced by a public
company, which issued all the company’s shares to registered chicory growers (Agriculture
in South Africa, 1994).
1.1.2 Current state of affairs
Of all the chicory growing countries, South Africa is still one of the few countries where
chicory is solely grown for coffee purposes. Northern and central European countries
(particularly Belgium, the Netherlands and France) exploit the root for inulin and fructose
syrups (D’Egidio et al, 1998; Agriculture in South Africa, 1994).
Despite the fact that most European companies produce more chicory and inulin, maximum
production of these products is hampered by limited space, cost of the raw materials, land
and labour availability and transportation. As the fifth largest chicory producing country
(Table 1.1), South Africa has the means and capacity to compete and benefit from
participating in inulin related markets as land and labour are not limited. Moreover, it has
the capacity, infrastructure and expertise as the chicory industry is well established.
Presently, only 6000 hectares (along the south east coast) are in use due to the current
national trade of 63000 metric tons of chicory. Inulin exports by Chicory S.A could result
in the acquisition of 120000 hectares, and as a result more jobs and revenue would become
available, with the subsequent upliftment of the local communities (Luckman and
Rossouw, 2003).
Chapter 1 Literature review
4
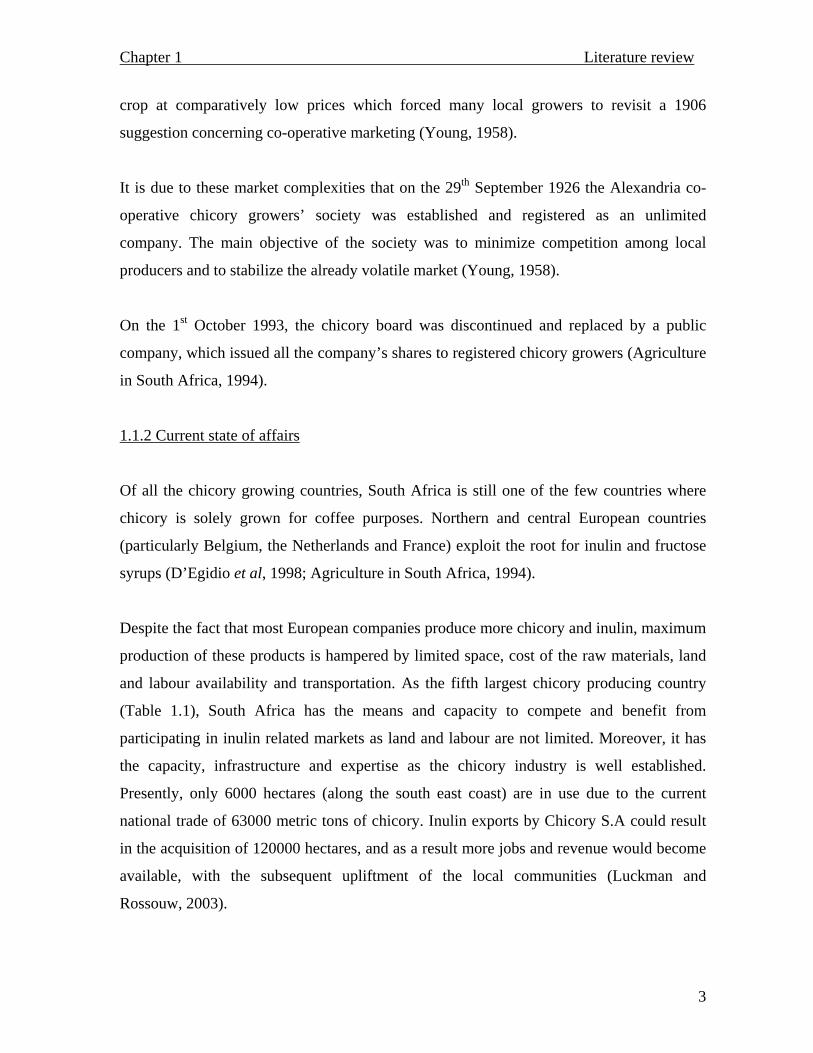
Table 1.1: Major chicory and inulin producing countries ((Luckman and Rossouw, 2003).
World chicory production World inulin production
Country Tonnes % Country Tonnes %
Belgium 650000 53.8 Belgium 600000 75
Netherlands 250000 20.6 Netherlands 200000 25
France 120000 9.9
India 90000 7.4
South Africa 63000 5.2
Poland 28000 2.3
Spain 8000 0.007
Other 4000 0.0035
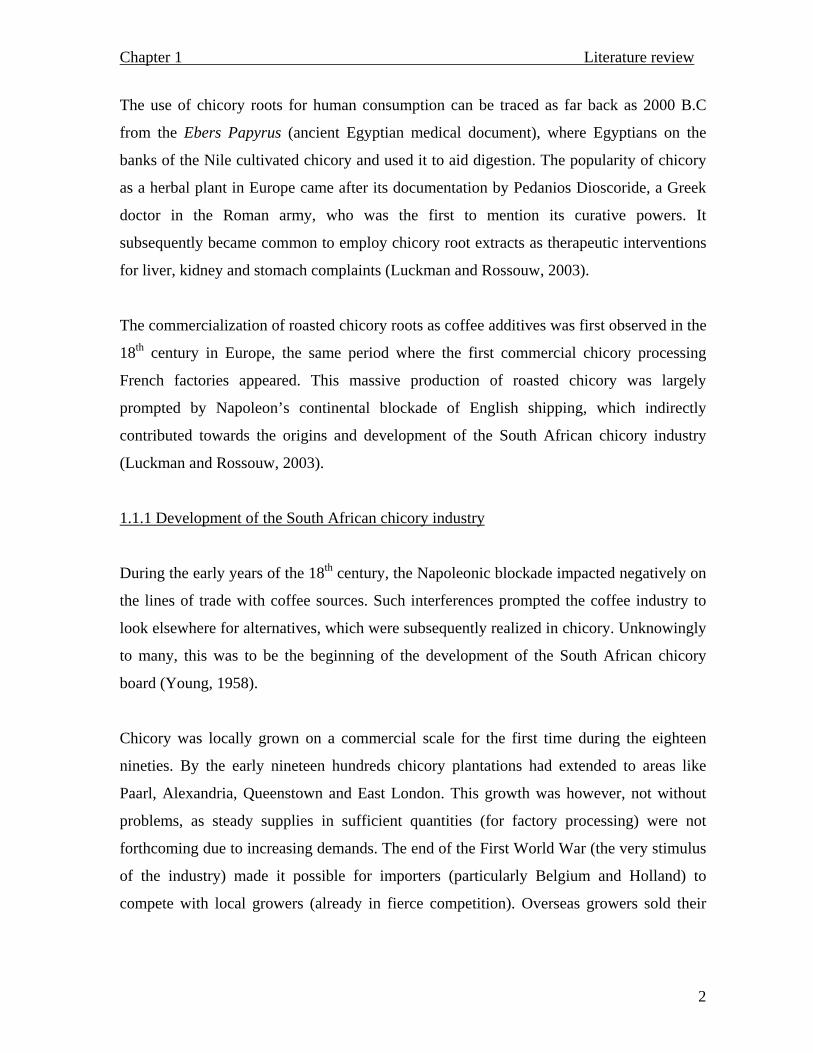
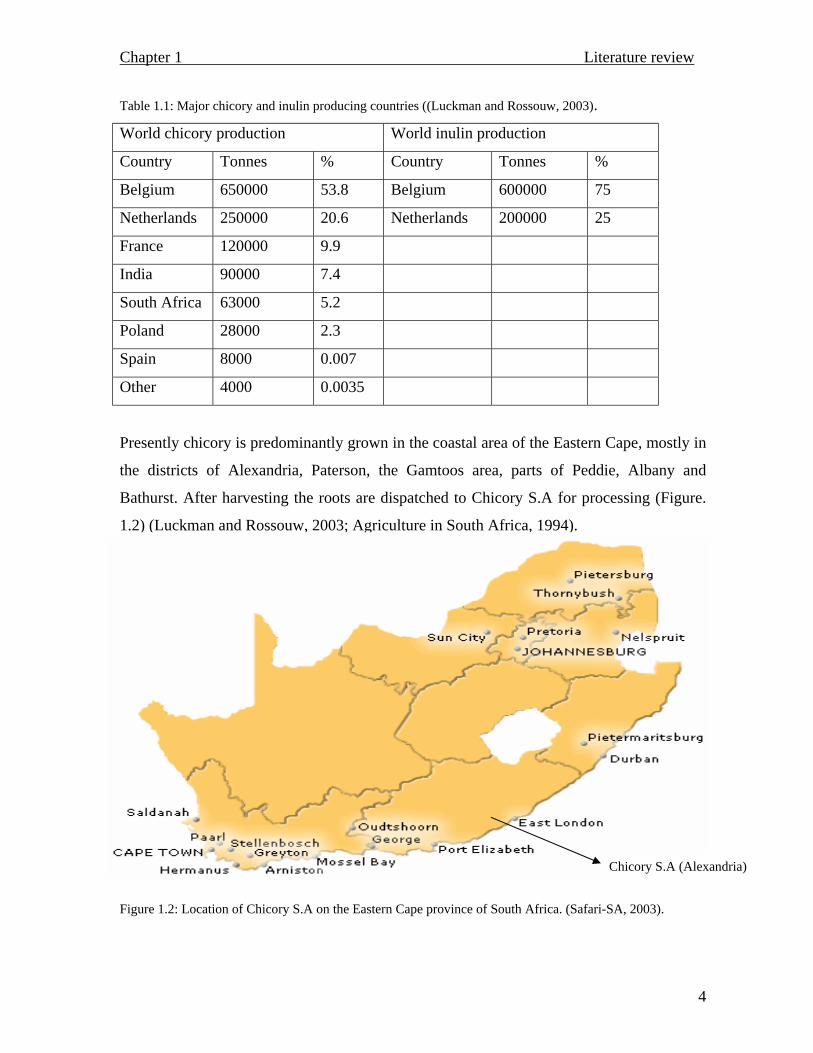
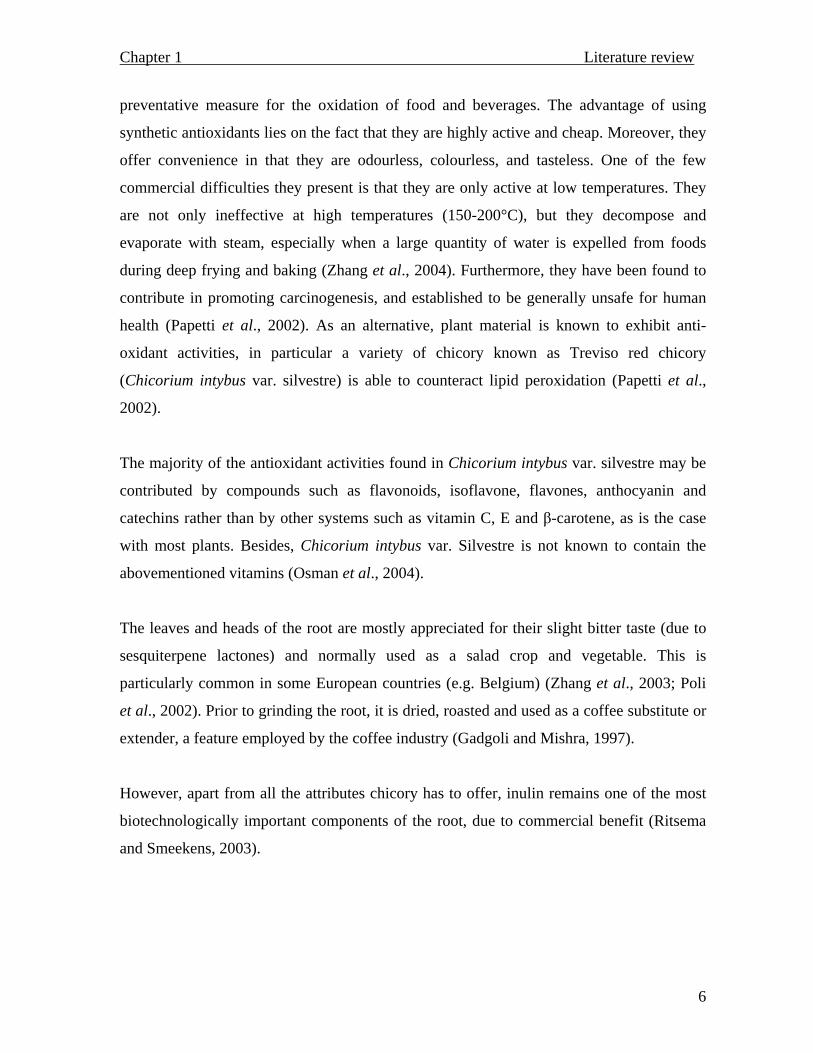
Presently chicory is predominantly grown in the coastal area of the Eastern Cape, mostly in
the districts of Alexandria, Paterson, the Gamtoos area, parts of Peddie, Albany and
Bathurst. After harvesting the roots are dispatched to Chicory S.A for processing (Figure.
1.2) (Luckman and Rossouw, 2003; Agriculture in South Africa, 1994).
Figure 1.2: Location of Chicory S.A on the Eastern Cape province of South Africa. (Safari-SA, 2003).
Chicory S.A (Alexandria)
Chapter 1 Literature review
5
At the company’s central drier the roots are graded, washed, dried, diced and roasted to
supply the country’s biggest coffee manufacturers. Thus, Chicory S.A’s main activities
focus on supplying the coffee industry and its related subsidiaries with ground chicory for
blending with coffee. The company recently embarked on a programme to start exporting
some of their product to the U.S.A. (Agriculture in South Africa, 1994; Luckman and
Rossouw, 2003).
Apart from the root’s beneficial carbohydrate components, chicory’s addition to coffee
ensures the enhancement of flavour and aroma, while providing strength to the brew.
Moreover coffee blended with chicory is comparatively cheaper than pure coffee. As a
result almost 88 % of all coffee products produced locally contain chicory as an additive
(Agriculture in South Africa, 1994; Luckman and Rossouw, 2003).
1.2 General uses of chicory roots
The root is versatile in its application. Apart from its use as a major component of
indigenous drugs, it has been greatly utilized as a food and feed source (Zafar and Ali,
1998; Koch et al., 1999).
As a medicinal substituent, chicory has been proven to have anti-hepatotoxic effects. Due
to its function, the liver is generally susceptible to toxins that pass through for
transformation purposes. During this process, some toxins are known to generate free
radicals that react with oxygen and subsequently constituting a peroxy radical that
contributes to the hepatotoxicity, which is generally characterized by an increase in serum
transaminase activity (Zafar and Ali, 1998).
Pharmaceutical and food industries often use antioxidant compounds as additives in their
products to prevent lipid peroxidation (auto-catalytic chain reaction), as it adversely alters
flavour and nutritional composition of fat rich products (Papetti et al., 2002). Synthetic
antioxidants such as butylated hydroxytoluene (BHT), butylated hydroxyanisole (BHA),
tert-butylated hydroquinone (TBHQ) and propyl gallate have been widely used as a
Chapter 1 Literature review
6
preventative measure for the oxidation of food and beverages. The advantage of using
synthetic antioxidants lies on the fact that they are highly active and cheap. Moreover, they
offer convenience in that they are odourless, colourless, and tasteless. One of the few
commercial difficulties they present is that they are only active at low temperatures. They
are not only ineffective at high temperatures (150-200°C), but they decompose and
evaporate with steam, especially when a large quantity of water is expelled from foods
during deep frying and baking (Zhang et al., 2004). Furthermore, they have been found to
contribute in promoting carcinogenesis, and established to be generally unsafe for human
health (Papetti et al., 2002). As an alternative, plant material is known to exhibit anti-
oxidant activities, in particular a variety of chicory known as Treviso red chicory
(Chicorium intybus var. silvestre) is able to counteract lipid peroxidation (Papetti et al.,
2002).
The majority of the antioxidant activities found in Chicorium intybus var. silvestre may be
contributed by compounds such as flavonoids, isoflavone, flavones, anthocyanin and
catechins rather than by other systems such as vitamin C, E and β-carotene, as is the case
with most plants. Besides, Chicorium intybus var. Silvestre is not known to contain the
abovementioned vitamins (Osman et al., 2004).
The leaves and heads of the root are mostly appreciated for their slight bitter taste (due to
sesquiterpene lactones) and normally used as a salad crop and vegetable. This is
particularly common in some European countries (e.g. Belgium) (Zhang et al., 2003; Poli
et al., 2002). Prior to grinding the root, it is dried, roasted and used as a coffee substitute or
extender, a feature employed by the coffee industry (Gadgoli and Mishra, 1997).
However, apart from all the attributes chicory has to offer, inulin remains one of the most
biotechnologically important components of the root, due to commercial benefit (Ritsema
and Smeekens, 2003).
Chapter 1 Literature review
7
1.3 Fructans as alternative storage polymers
Plants require energy for survival and proper maintenance of cellular processes. They
derive their energy through photosynthesis, a process by which light energy is used to
convert CO2 to highly reduced carbon compounds such as carbohydrates. The resultant
carbohydrates are then stored in the form of storage polysaccharides for later use, should
the need arise. Most plant cells contain starch (a polysaccharide mixture of amylose and
amylopectin) as a major reserve carbohydrate. The exploitation of starch for energy release
is achieved through a cascade of reactions that involve the conversion of glucosyl residues
to glucose 6-phosphate, which can enter the glycolytic pathway thereby producing ATP
through substrate level phosphorylation. Substantial ATP is generated through oxidative
phosphorylation under aerobic conditions. In times where carbohydrates are taken up or
manufactured within the cell, glucose 6-phosphate can be converted to starch and the
carbohydrate stored (Smith and Wood, 1991).
Although starch is the most common reserve polysaccharide in the plant kingdom,
exceptions exist in some species where a different polysaccharide is used for such purposes
(Smith and Wood, 1991). Fructans are among the most widespread alternative storage
materials found in a range of temperate, mainly perennial monocots within the Liliflorae
and Glumiflorae together with dicots of the Asterales (e.g Chicorium intybus), Campanales
and Boraginaceae (Meier and Reid, 1982 Lewis, 1984).
The most striking feature of fructans is that they do not only confer storage properties, but
play a role in assisting plants to adjust to ever changing climatic conditions (De Roover et
al., 2000).
1.3.1 Sucrose usage and ultimate fructan accumulation
A major part of the organic carbon produced by plants during photosynthesis is channelled
into the synthesis of sugars, which are the major carbon compounds exported from
photosynthetic sources to storage organs. In most plants, the transported sugar is sucrose (a
Chapter 1 Literature review
8
non-reducing disaccharide) in which glucose and fructose are α1→ β2 linked (Sturm, 1999;
Druart et al., 2001).
The driving force behind sucrose transport is through a succession of multifaceted reactions
which include, amongst others, turgor pressure gradient promoted by a sucrose
concentration gradient, and by the energy dependent transport of sucrose through
membranes (Ho and Baker, 1982; Patrick, 1990). Depending on the physiological activities
and the biological demands of the non-photosynthetic tissues, different biochemical
pathways in various subcellular compartments are fed with sucrose which may be
channelled into the glycolytic and tricarboxylic acid pathways for the generation of ATP
and NADH (Sturm, 1999). The carbon of the disaccharide may be directed towards the
biosynthesis of primary metabolites destined for tissue growth and development. For long-
term storage purposes, sucrose may become converted into polymeric compounds such as
starch, triacylglycerides, polypeptides or secondary metabolites that provide plants with the
means to cope with pests and predators (Sturm, 1999). The resultant accumulation of
sucrose in storage organs ultimately leads to fructan synthesis and storage, either for long
or short term purposes (De Roover et al., 2000).
1.3.1.1 Role of fructans in plants
The accumulation of fructans may be attributed to adverse climatic conditions (such as
hypoxia, low temperature, drought and high CO2 concentrations). For example, during
hypoxia, a condition characterized by the absence of oxygen supply, the metabolic activity
of roots (as storage organs) for carbohydrate storage is reduced as a result of retarded
carbohydrate oxidation by the lack of electron acceptors [NAD (P+), oxygen], while the
photosynthetic organs are largely unaffected. Sucrose export from the photosynthetic
regions into the roots remains unchanged, thus accumulating large amounts of fructose
residues (Albrecht et al., 1993).
An increase in glucose, fructose and sucrose is observed in the roots of plants found in
areas with sporadic rainfall. During drought stress, a shift from photosynthesis to
Chapter 1 Literature review
9
carbohydrate synthesis is favoured by the activation of sucrose phosphate synthase through
reversible protein phosphorylation. The induction of sucrose synthesis during this time is
generally as a response to maintain osmoregulation (facilitated by water soluble
carbohydrates) under control (De Roover et al., 2000). Plants that have optimum
osmoregulation are capable of maintaining membrane integrity and thereby preventing
protein denaturation. As a result of all the extreme climatic conditions, the sucrose:sucrose
fructosyltransferase (1-SST) gene is induced and 1-SST activities increase, thus resulting in
an increased accumulation of fructans, which make the plant tolerant to unfavourable
weather changes. As a result, subcellular structures are maintained in aqueous
environments (De Roover et al., 2000).
1.3.2 Types of fructans
Fructans are polysaccharides comprised of repeating fructose units and consist of a glucose
molecule normally attached at the beginning of the polymer. Different fructans are found in
plants either separately or mixed and they have two different glycosidic linkages, namely β
(2→1) linkages (a common feature in inulin type), β (2→6) (normally found in levans) and
graminan, comprised of both β (2→1) and β (2→6) (Vereyken et al., 2001; De Roover et
al., 2000).
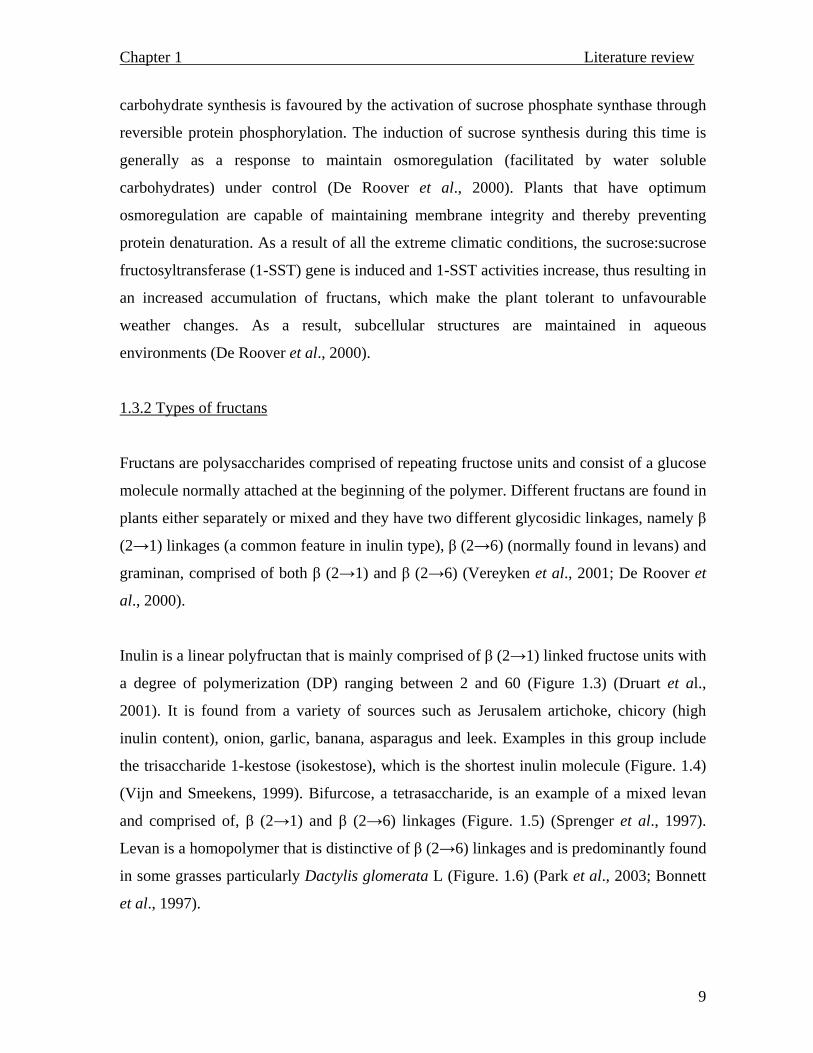
Inulin is a linear polyfructan that is mainly comprised of β (2→1) linked fructose units with
a degree of polymerization (DP) ranging between 2 and 60 (Figure 1.3) (Druart et al.,
2001). It is found from a variety of sources such as Jerusalem artichoke, chicory (high
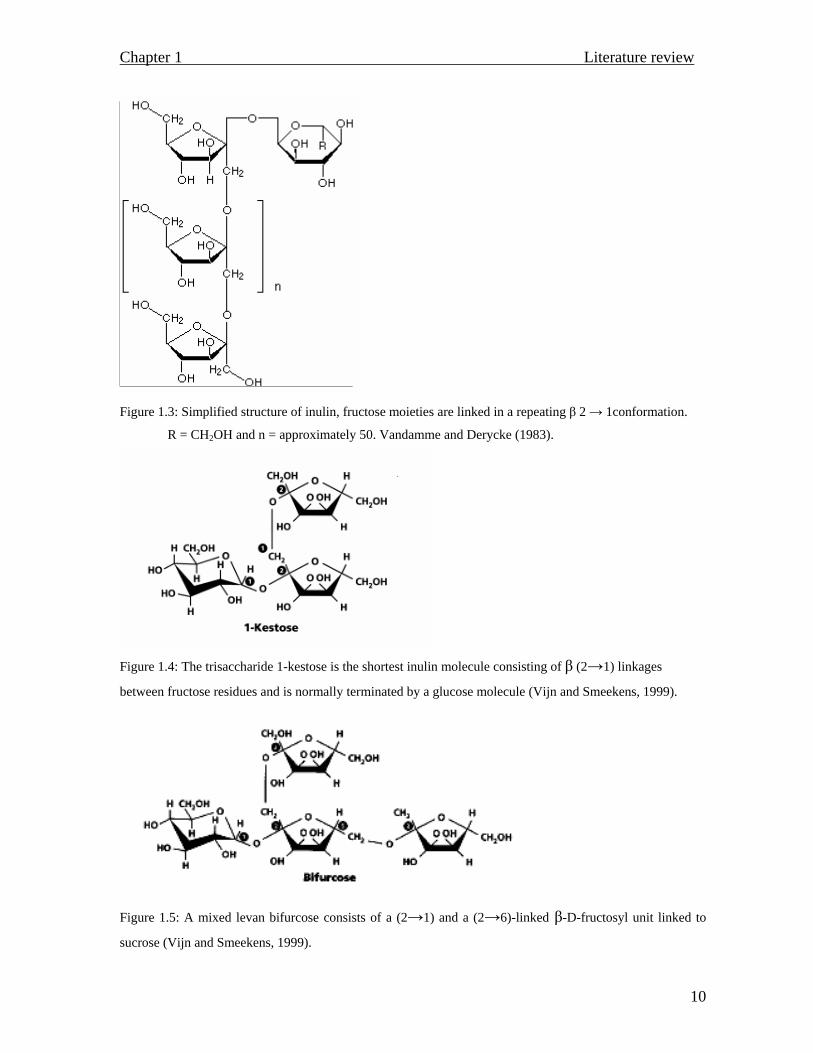
inulin content), onion, garlic, banana, asparagus and leek. Examples in this group include
the trisaccharide 1-kestose (isokestose), which is the shortest inulin molecule (Figure. 1.4)
(Vijn and Smeekens, 1999). Bifurcose, a tetrasaccharide, is an example of a mixed levan
and comprised of, β (2→1) and β (2→6) linkages (Figure. 1.5) (Sprenger et al., 1997).
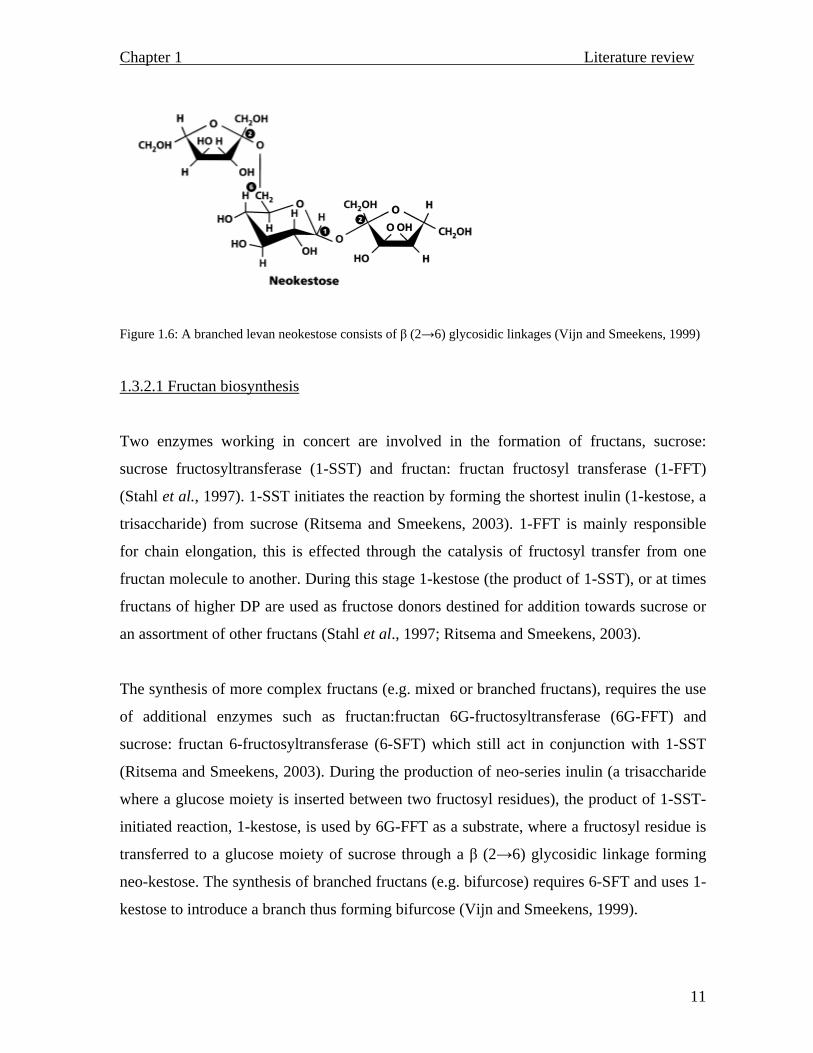
Levan is a homopolymer that is distinctive of β (2→6) linkages and is predominantly found
in some grasses particularly Dactylis glomerata L (Figure. 1.6) (Park et al., 2003; Bonnett
et al., 1997).
Chapter 1 Literature review
10
Figure 1.3: Simplified structure of inulin, fructose moieties are linked in a repeating β 2 → 1conformation.
R = CH2OH and n = approximately 50. Vandamme and Derycke (1983).
Figure 1.4: The trisaccharide 1-kestose is the shortest inulin molecule consisting of β (2→1) linkages
between fructose residues and is normally terminated by a glucose molecule (Vijn and Smeekens, 1999).
Figure 1.5: A mixed levan bifurcose consists of a (2→1) and a (2→6)-linked β-D-fructosyl unit linked to
sucrose (Vijn and Smeekens, 1999).
Chapter 1 Literature review
11
Figure 1.6: A branched levan neokestose consists of β (2→6) glycosidic linkages (Vijn and Smeekens, 1999)
1.3.2.1 Fructan biosynthesis
Two enzymes working in concert are involved in the formation of fructans, sucrose:
sucrose fructosyltransferase (1-SST) and fructan: fructan fructosyl transferase (1-FFT)
(Stahl et al., 1997). 1-SST initiates the reaction by forming the shortest inulin (1-kestose, a
trisaccharide) from sucrose (Ritsema and Smeekens, 2003). 1-FFT is mainly responsible
for chain elongation, this is effected through the catalysis of fructosyl transfer from one
fructan molecule to another. During this stage 1-kestose (the product of 1-SST), or at times
fructans of higher DP are used as fructose donors destined for addition towards sucrose or
an assortment of other fructans (Stahl et al., 1997; Ritsema and Smeekens, 2003).
The synthesis of more complex fructans (e.g. mixed or branched fructans), requires the use
of additional enzymes such as fructan:fructan 6G-fructosyltransferase (6G-FFT) and
sucrose: fructan 6-fructosyltransferase (6-SFT) which still act in conjunction with 1-SST
(Ritsema and Smeekens, 2003). During the production of neo-series inulin (a trisaccharide
where a glucose moiety is inserted between two fructosyl residues), the product of 1-SST-
initiated reaction, 1-kestose, is used by 6G-FFT as a substrate, where a fructosyl residue is
transferred to a glucose moiety of sucrose through a β (2→6) glycosidic linkage forming
neo-kestose. The synthesis of branched fructans (e.g. bifurcose) requires 6-SFT and uses 1-
kestose to introduce a branch thus forming bifurcose (Vijn and Smeekens, 1999).
Chapter 1 Literature review
12
1.3.2.2 Fructooligosaccharide (FOS) accumulation
Reactions preceding high DP fructan synthesis and conglomeration normally result in the
formation of fructooligosaccharides (a combination of short and intermediate inulin
chains), and three sugars collectively form this group, namely: 1-kestose (β-D-fru-(2→1)2-
α-D-glucopyranoside, GF2), nystose (β-D-fruc-(2→1)3-α-D-glucopyranoside, GF3) and
fructofuranosylnystose (β-D-fru-(2→1)4-α-D-glucopyranoside, GF4) (L’homme et al.,
2003). FOS formation is as a result of a successive set of discontinuous reactions (e.g. GFn
+ GFn → GFn-1 + GFn+1, n < 4, and in part from GFn + GF → GFn+1+ G) that generally lead
to inulin constitution (particularly in chicory). The DP is probably determined by substrate
availability (Kim et al., 1998).
1.4 Physico-chemical properties of chicory inulin
Commercial chicory inulin is available in three different compositions that are nonetheless
found in native inulin (that which is extracted from fresh roots and has not been
fractionated to remove sugars with a low DP). In its pure form inulin is a white, odourless
powder that has no taste at all, depending on the fractionated type (Franck, 2002 b).
Standard inulin has fructosyl linkages that range from 2 to 60, with 10 % sweetness due to
fructooligosaccharides that have not been removed, and show inadequate solubility.
Whereas, the fructose residues in high performance inulin vary between 10 and 60 with an
average DP of 25, fructooligosaccharides have been completely removed and therefore the
product is tasteless with poor solubility in water at room temperature. Oligofructose
powders on the other hand are moderately sweet (35% as sweet as sucrose) and soluble in
water. These are very short inulin chains having a polymerization degree that is less than 9.
They have a chemical structure that can be represented as GFn + Fn, which infers that they
are found in the presence of free fructose (Fn) (hence the sweetness) (Franck, 2002 b;
Bekers et al., 2002).
Chapter 1 Literature review
13
1.4.1 Utility in foods
The food industry has found major applications for the manufacture of inulin derived or
associated products, mostly because it combines easily with other food ingredients and
contributes towards improved organoleptic (impression produced by any substance on the
organs of touch, taste or smell) qualities without altering any flavours (Franck, 2002 b).
Production of bread requires the use of fats as they delay the staling process, whilst giving
it volume and a softer texture. Dietary fat intake however, has been linked to increased
blood cholesterol with subsequent onset of heart diseases (O’Brien et al., 2003; Harris et
al., 2003). As an alternative, O’Brien et al (2003) demonstrated that high performance
inulin has excellent fat mimicking characteristics when combined with water (as it forms a
gel), and that bread incorporating inulin as a fat substitute had similar characteristics in
quality when compared with bread containing fat.
As sweetening agents, fructooligosaccharides are not known to cause tooth decay and
moreover, do not have the bitter aftertaste that is characteristic of some artificial sweeteners
(e.g. saccharin). Aspartame on the other hand is claimed to be two hundred fold sweeter
than sucrose with a low caloric value, and is regarded as a non carbohydrate sweetener
(Passador-Gurgel et al., 1996; Vandamme and Derycke, 1983). Furthermore, problems
associated with corpulence and artherosclerosis as a consequence of sucrose usage are not
observed with oligosaccharides. As a complication for diabetic patients, sucrose has its
draw backs in insulin deficient systems, and as a result fructooligosaccharides are emerging
as alternatives, as they are metabolized in low levels without the requirement for insulin
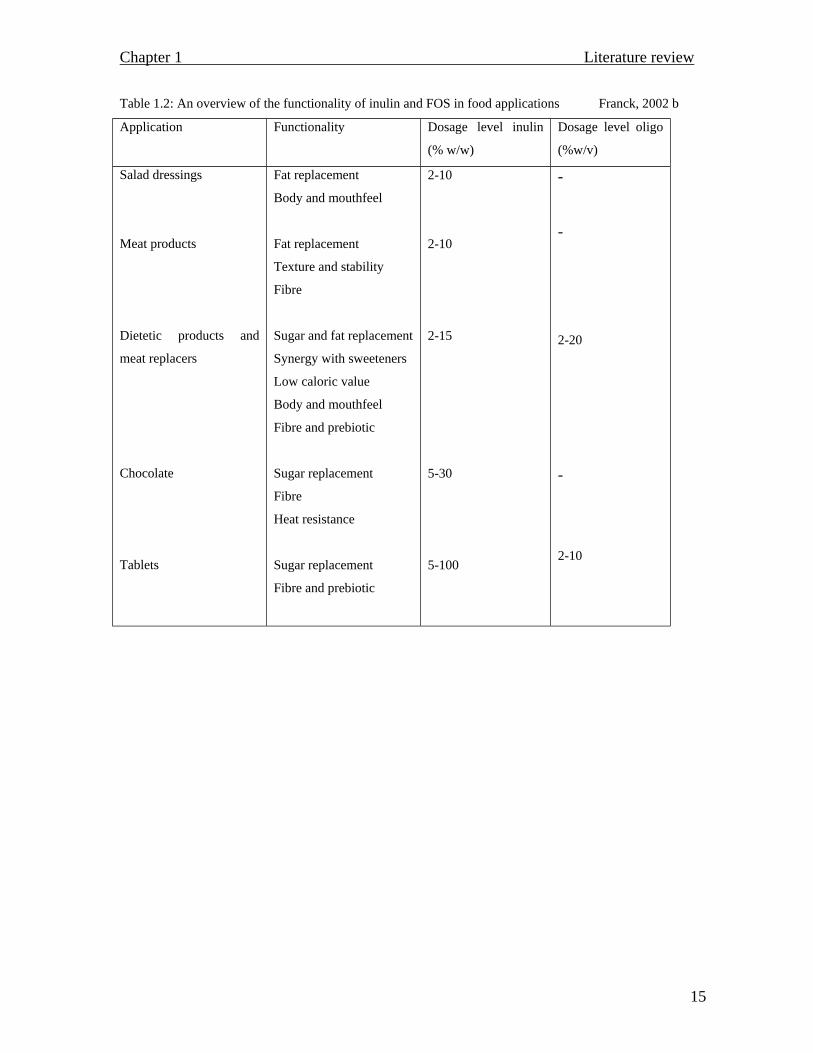
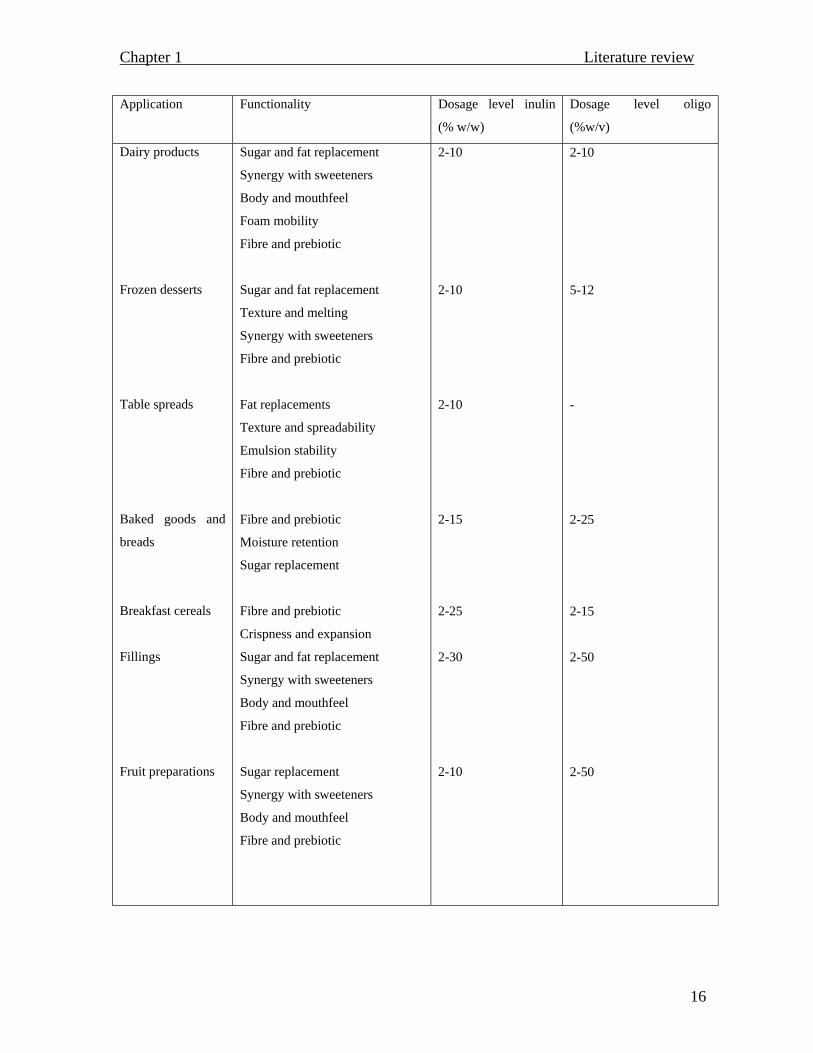
(Passador-Gurgel et al., 1996). An overview of the functionality of inulin and
fructooligosaccharides in food applications is presented in table 1.2.
Recently, it has been shown that modified inulin can be exploited as a chelating agent, a
detergent co-builder and pharmaceutically as a carrier for drug delivery (i.e. for drugs
destined for the large intestine). Drug delivery to the large intestines does not always reach
the targeted sites due to the intestinal hydrolytic enzymes which interfere with the coating
and result in such drugs emptying before reaching the colon. As inulin is not susceptible to
Chapter 1 Literature review
14
hydrolytic enzymes, most pharmaceutical companies have been developing colon drugs
encapsulated with nondigestible polysaccharides known as prodrugs (e.g. PulsincapTM)
(Kim and Wang, 2001; Vandamme et al., 2002).
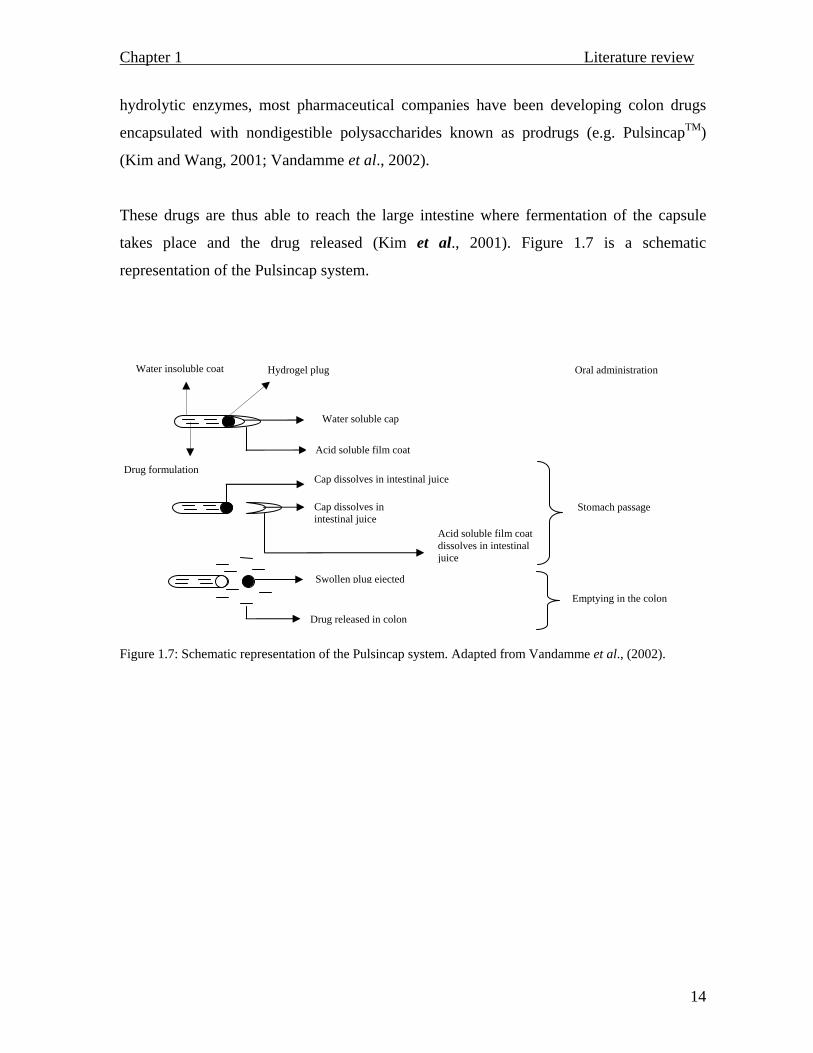
These drugs are thus able to reach the large intestine where fermentation of the capsule
takes place and the drug released (Kim et al., 2001). Figure 1.7 is a schematic
representation of the Pulsincap system.
Figure 1.7: Schematic representation of the Pulsincap system. Adapted from Vandamme et al., (2002).
Swollen plug ejected
Drug released in colon
Water insoluble coat Hydrogel plug
Water soluble cap
Acid soluble film coat
Drug formulation
Cap dissolves in intestinal juice
Acid soluble film coat dissolves in intestinal juice
Oral administration
Stomach passage
Emptying in the colon
Cap dissolves in intestinal juice
Chapter 1 Literature review
15
Table 1.2: An overview of the functionality of inulin and FOS in food applications Franck, 2002 b
Application Functionality Dosage level inulin
(% w/w) Dosage level oligo
(%w/v) Salad dressings
Meat products
Dietetic products and
meat replacers
Chocolate
Tablets
Fat replacement
Body and mouthfeel
Fat replacement
Texture and stability
Fibre
Sugar and fat replacement
Synergy with sweeteners
Low caloric value
Body and mouthfeel
Fibre and prebiotic
Sugar replacement
Fibre
Heat resistance
Sugar replacement
Fibre and prebiotic
2-10
2-10
2-15
5-30
5-100
-
-
2-20
-
2-10
Chapter 1 Literature review
16
Application Functionality Dosage level inulin
(% w/w)
Dosage level oligo
(%w/v)
Dairy products
Frozen desserts
Table spreads
Baked goods and
breads
Breakfast cereals
Fillings
Fruit preparations
Sugar and fat replacement
Synergy with sweeteners
Body and mouthfeel
Foam mobility
Fibre and prebiotic
Sugar and fat replacement
Texture and melting
Synergy with sweeteners
Fibre and prebiotic
Fat replacements
Texture and spreadability
Emulsion stability
Fibre and prebiotic
Fibre and prebiotic
Moisture retention
Sugar replacement
Fibre and prebiotic
Crispness and expansion
Sugar and fat replacement
Synergy with sweeteners
Body and mouthfeel
Fibre and prebiotic
Sugar replacement
Synergy with sweeteners
Body and mouthfeel
Fibre and prebiotic
2-10
2-10
2-10
2-15
2-25
2-30
2-10
2-10
5-12
-
2-25
2-15
2-50
2-50
Chapter 1 Literature review
17
1.4.2 Enzymes
On a comparative basis, fructose is up to twice as sweet as sucrose (normal table sugar),
does not impact negatively on health and occurs abundantly in nature. It is for this reason
that during the 1980’s various industrial processes were employed to isolate fructose for
application throughout the food industry. The standard procedure for high fructose syrup
production involved the hydrolysis of starch into glucose and its ultimate conversion by
D(+)-xylose isomerase (glucose isomerase EC 5.3.1.5) into a mixture containing 50%
glucose, 42% fructose, and 8% of other sugars (Vandamme and Derycke, 1983; Passador-
Gurgel et al., 1996).
The latest approach in the formation of concentrated fructose is the use of enzymes. This is
due to the fact that enzymes are specific and the generation of undesirable by-products, as
obtained with chemical conversion, is avoided. The reactions proceed under mild
conditions (e.g. pH, temperature and pressure) and they are easier to immobilize on solid
supports for continuous industrial hydrolysis of polymers (MacCabe et al., 2002).
The convenience and efficiency at which inulin can be processed by immobilized
inulinases was demonstrated by Nakamura et al., (1995), where they showed that dahlia
inulin 5% (w/v) dahlia inulin solution at pH 5, can be completely hydrolyzed to 97 % D
fructose and 3 % D-glucose, over a period of 45 days utilizing a packed bed column reactor
containing 8 ml of the immobilized inulinase (from Aspergillus niger Mutant 817) at a flow
rate of 1 ml/min.
Inulinases are β-fructosidases (mainly 2,1-β-D-fructan-fructanohydrolases) that liberate
fructose moieties from the non-reducing end of the polyfructan (Vandamme and Derycke,
1983). Plants and microorganisms (mostly fungi, yeasts, and bacteria) are the best known
sources for inulinase production. However, differences in enzyme activities do exist and
are source dependent. Plant inulinases, for example are of a single type (exohydrolases) and
show slight or no invertase activities (hydrolyze sucrose into glucose and fructose)
(Vandamme and Derycke, 1983; Claessens et al., 1990; Henson, 1989).
Chapter 1 Literature review
18
Even though a number of microorganisms synthesize only exo acting enzymes (as in
plants), the fact that enzyme production can be induced and optimized provides numerous
biotechnological possibilities. Recent developments have shifted towards the use of mutant
microbes for the synthesis of both the exo- and endoinulinases (randomly cleave inulin’s
internal linkages to produce inulo-triose, -tetraose and pentaose as major products). These
enzymes act synergistically for high yield production of fructose syrups (Nakamura et al.,
1994; Jing et al., 2002). The characteristic feature of mutant microbes is their potential to
synthesize enzymes with high inulinase activities. However, their invertase activities are
compromised when compared to wild types, but the overall inulin/sucrose ratios (I/S)
remain high (Nakamura et al., 1994; Jing et al., 2002).
Aspergillus species, particularly Aspergillus niger and its mutants (e.g. Aspergillus niger 12
and 817, as used by Nakamura et al., 1994) has been extensively utilized for the production
of inulinases and subsequent hydrolysis of inulin. The fungus offers ease and convenience
in that it secretes its secondary metabolites (product excreted by a microorganism near the
end of its growth phase or during the stationary phase) extracellularly, as opposed to most
bacteria which normally have their enzymes membrane bound, (MacCabe et al., 2002).
1.4.3 Inulin and fructooligosaccharide energy value
As beneficially healthy as these functional food ingredients (food ingredients that promote
the state of health, by targeting certain bodily functions and preventing the risk of disease)
are, their caloric content is very low as compared to that obtained from normal table sugar
(17 kJ/g), a feature which makes inulin and oligofructose even more appealing. The reason
for this observed decrease in caloric content is due to the fact that their energy value
depends on their fermentability and generation of gases. Their overall energy value
ultimately translates to 12 kJ/g, as measured by whole body indirect calorimetry
(Roberfroid, 2002; Figueira et al., 2003; Cherbut, 2002).
Chapter 1 Literature review
19
1.5 Regulation of intestinal microflora
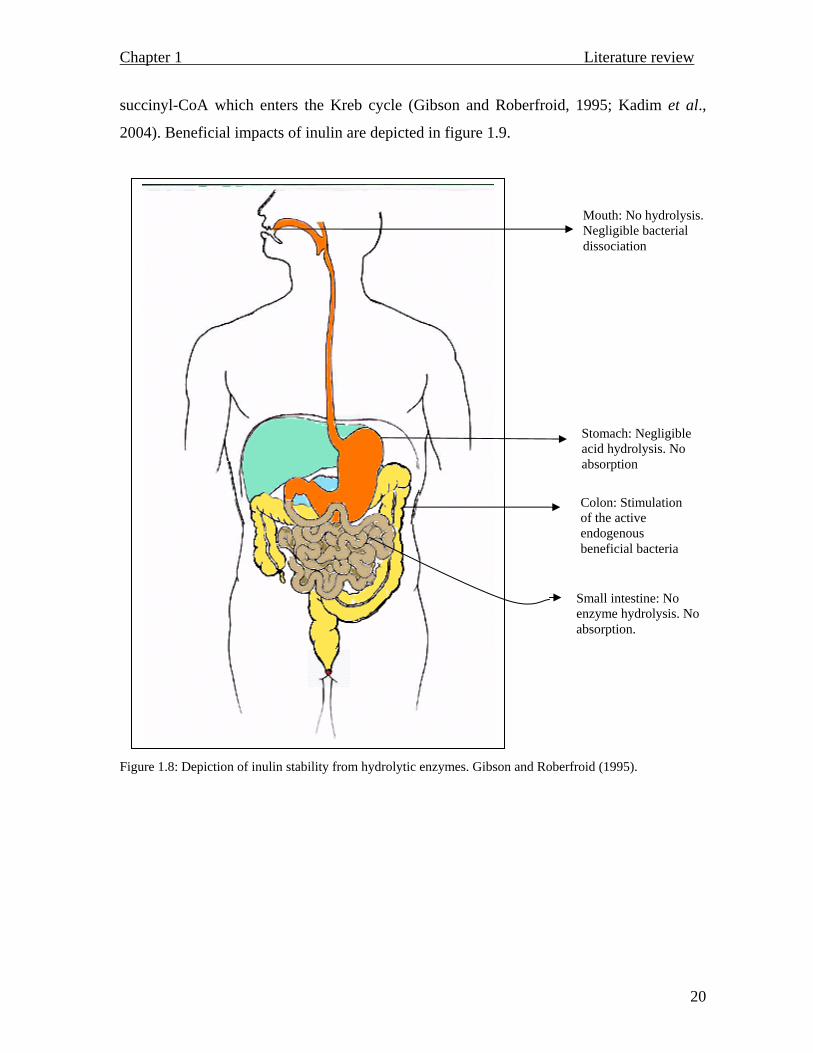
Due to the fact that intestinal hydrolytic enzymes only target α linked glycosides, it is
easier for inulin related products (β (2→1) configuration) to pass through the small
intestine to the large colon without any interference. Figure 1.8 schematically reflects
inulin’s stability and resistance towards different enzyme systems along the alimentary
canal, starting with the salivary amylase in the oral cavity, which has no affinity towards
fructans, apart from the hydrolysis of α-1→4 and β 1→4 glycosidic linkages. Intestinal
enzymes don’t have any pronounced hydrolytic effects, which renders the oligomers
unavailable, as they can not be absorbed. The polymer is thus left available for the colonic
bacteria to utilize as fuel (Roberfroid, 2002; Kandra, 2003).
Apart from the technological properties inulin and oligofructose have to offer, the most
impressive feature is their effect as prebiotics which are foods that beneficially affect the
gut by selectively stimulating the growth and propagation of bifidobacteria and lactobacilli
with a concomitant decrease in pathogenic bacteria. This ultimately leads to a well
conserved integrity of the gut microbiota (Cummings and Macfarlane, 2002; Kolida et al.,
2002). To further support and establish inulin and oligofructose as prebiotics, Rao (1999)
observed that all strains of bifidobacteria particularly Bifidobacterium infantis, B. pseudo-
longum, B. angulatum and B. breve, had consistent and better growth on chicory inulin than
on glucose. Accumulation of bifidobacteria in the large intestine is beneficial to human
health in as far as protection against diseases and efficient gut function is concerned.
Subsequent fermentation of inulin leads to bifidobacteria secreting acids which protonate
potentially toxic ammonia to produce NH4+ which results in the lowering of blood
ammonia levels. Furthermore, metabolites that are inhibitory to a range of Gram-positive
and Gram-negative pathogenic bacteria are excreted. An increase in the number of
bifidobacteria results in the secretion of immunomodulators that promote immunological
attack against malignant cells and vitamins of the B group (e.g. vitamin B12). Vitamin B12
is a cofactor of methylmalonyl-CoA mutase which transforms methylmalonyl-CoA into
Chapter 1 Literature review
20
succinyl-CoA which enters the Kreb cycle (Gibson and Roberfroid, 1995; Kadim et al.,
2004). Beneficial impacts of inulin are depicted in figure 1.9.
Figure 1.8: Depiction of inulin stability from hydrolytic enzymes. Gibson and Roberfroid (1995).
Stomach: Negligible acid hydrolysis. No absorption
Colon: Stimulation of the active endogenous beneficial bacteria
Small intestine: No enzyme hydrolysis. No absorption.
Mouth: No hydrolysis. Negligible bacterial dissociation
Chapter 1 Literature review
21
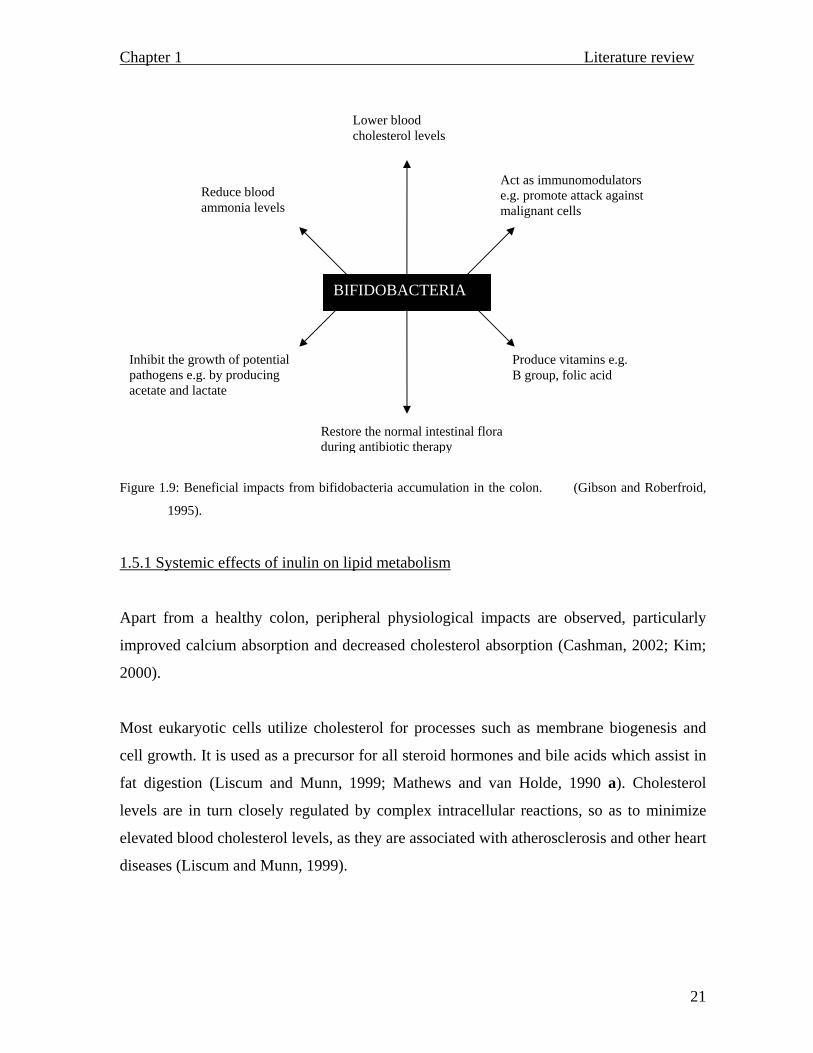
Figure 1.9: Beneficial impacts from bifidobacteria accumulation in the colon. (Gibson and Roberfroid,
1995).
1.5.1 Systemic effects of inulin on lipid metabolism
Apart from a healthy colon, peripheral physiological impacts are observed, particularly
improved calcium absorption and decreased cholesterol absorption (Cashman, 2002; Kim;
2000).
Most eukaryotic cells utilize cholesterol for processes such as membrane biogenesis and
cell growth. It is used as a precursor for all steroid hormones and bile acids which assist in
fat digestion (Liscum and Munn, 1999; Mathews and van Holde, 1990 a). Cholesterol
levels are in turn closely regulated by complex intracellular reactions, so as to minimize
elevated blood cholesterol levels, as they are associated with atherosclerosis and other heart
diseases (Liscum and Munn, 1999).
BIFIDOBACTERIA
Inhibit the growth of potential pathogens e.g. by producing acetate and lactate
Reduce blood ammonia levels
Act as immunomodulators e.g. promote attack against malignant cells
Lower blood cholesterol levels
Restore the normal intestinal flora during antibiotic therapy
Produce vitamins e.g. B group, folic acid
Chapter 1 Literature review
22
A diet rich in fat and saturated fatty acids is known to cause cholesterol related diseases. As
fat replacers, non digestible carbohydrates on the other hand have been observed to result
in a decrease of serum triacylglycerols and phospholipid concentrations (Harris et al.,
2003; Delzenne et al., 2002). The observation in hypotriglyceridemia is mainly due to
diminished plasma very low density lipoproteins concentrations (VLDL), which deliver
endogenously synthesised triacylglycerols from liver to adipose and other tissues. These
occur as a result of a decrease in the hepatic synthesis of triacylglycerols (TAG) as opposed
to the catabolism of triacylglycerol rich lipoproteins. (Delzenne et al., 2002). A co-
ordinated reduction in activity of all the central enzymes responsible for de novo
lipogenesis in the liver is the most significant event in the retardation of hepatic synthesis
of VLDL-TAG secretion (Delzenne et al., 2002).
Even though a lot of carbohydrates are essential for a healthy well being, there are
instances where elevated plasma TAG levels are induced by certain sugars taken in
conjunction with a fatty diet, these levels are normally observed during the fasting state.
Thus following a meal, the clearance of TAG-rich lipoproteins, VLDL and chylomicrons
(active in the transport of dietary triacylglycerols and cholesterol from the intestine to
adipose tissue and the liver) lead to elevated fasting TAG, which subsequently leads to high
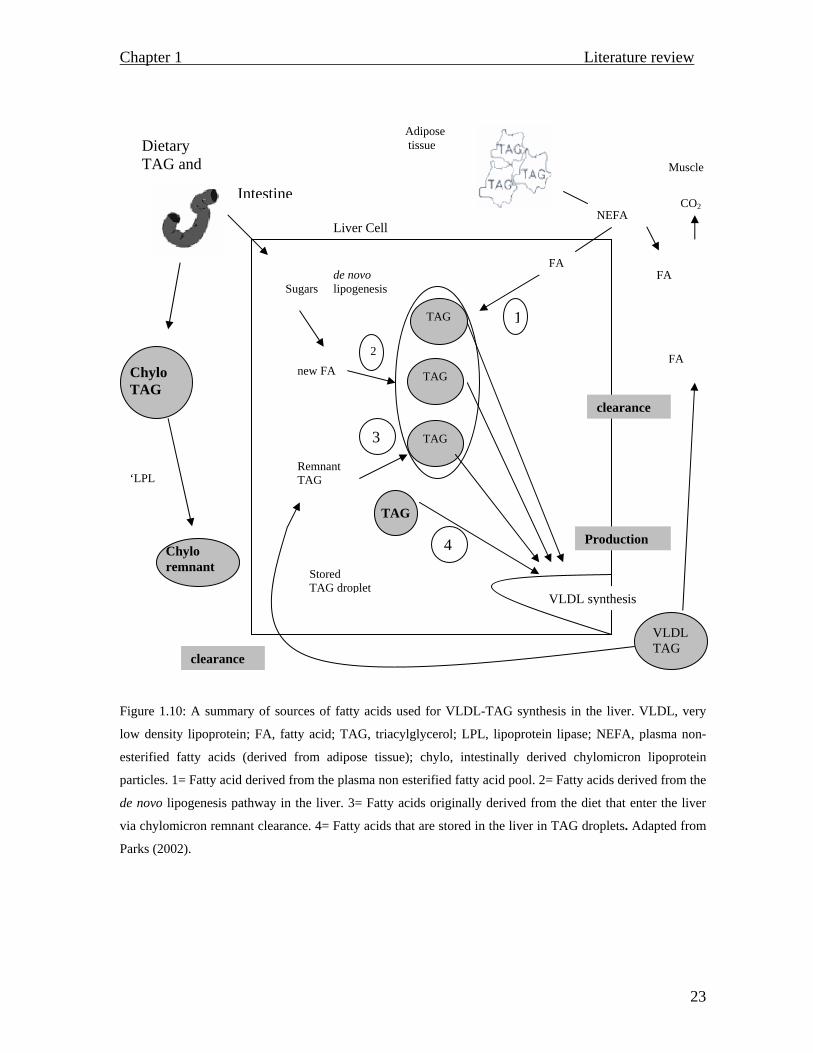
cholesterol complications (Parks, 2002; Mathews and van Holde, 1990 a). Figure 1.10,
summarizes events that ultimately lead to triacylglycerol accumulation.
Chapter 1 Literature review
23
Figure 1.10: A summary of sources of fatty acids used for VLDL-TAG synthesis in the liver. VLDL, very
low density lipoprotein; FA, fatty acid; TAG, triacylglycerol; LPL, lipoprotein lipase; NEFA, plasma non-
esterified fatty acids (derived from adipose tissue); chylo, intestinally derived chylomicron lipoprotein
particles. 1= Fatty acid derived from the plasma non esterified fatty acid pool. 2= Fatty acids derived from the
de novo lipogenesis pathway in the liver. 3= Fatty acids originally derived from the diet that enter the liver
via chylomicron remnant clearance. 4= Fatty acids that are stored in the liver in TAG droplets. Adapted from
Parks (2002).
VLDL synthesis
TAG
TAG
TAG
de novo Sugars lipogenesis
new FA
Remnant TAG
Stored TAG droplet
TAG
VLDLTAG
clearance
Chylo remnant
Chylo TAG
‘LPL
Liver Cell
Production
clearance
4
3
2
1
FA
NEFA
FA
Adipose tissue
FA
CO2
Muscle
Dietary TAG and
Intestine
VLDL synthesis
Chapter 1 Literature review
24
1.5.1.1 Cholesterol management using inulin
Despite the fact that some products of inulin fermentation tend to influence TAG and
cholesterol synthesis, it is still unclear why acetate (one of the fermentation products)
potentially down regulates fatty acid synthesis through acetyl CoA pool modulation (Parks,
2002).
Due to their indigestibility, inulin and oligofructose have the ability to influence the
absorption of other carbohydrates such as glucose. Soluble carbohydrates have a direct
influence on the release of glucose dependant insulinotropic polypeptide (GIP) and glucan-
like peptide-1 amide (GLP-1) from the intestinal mucosa endocrine cells. In turn, these
peptides drive lipid metabolism in the adipose tissue. Stimulation and inhibition of lipolysis
(through lipoprotein lipase) seem to be dependant on the GIP concentration (Delzenne et
al., 2002; Kok et al., 1998).
Nutritional interventions, utilizing oligofructose and inulin have showed a significant
reduction in VLDL-TAG concentrations (Kok et al., 1998). These effects are supported by
studies noting activities of lipogenic enzymes (particularly acetyl-CoA carboxylase, fatty
acid synthase, malic enzyme, ATP citrate lyase and glucose-6-phosphate dehydrogenase)
decreasing with as much as 50 % after inulin intake. This (oligofructose) impact may be
due to a modification of lipogenic enzyme gene expression, which ultimately leads to
hypotriglyceridemia. As a result, the food industry has begun using non- digestible
carbohydrates as a means of enhancing the nutritional value of foods (Delzenne et al.,
2002; Parks, 2002). Figure 1.11 shows putative mechanisms involved in carbohydrate
facilitated lipid metabolism.
1.5.1.2 Proliferation of bifidobacteria and their effects in the colon
As non digestible carbohydrates, inulin and its derivatives are completely fermented in the
colon thus generating lactic acid (metabolized into short chain fatty acids) and gases such
as hydrogen, methane and carbon dioxide, which are utilized by bacteria (Cherbut, 2002).
Chapter 1 Literature review
25
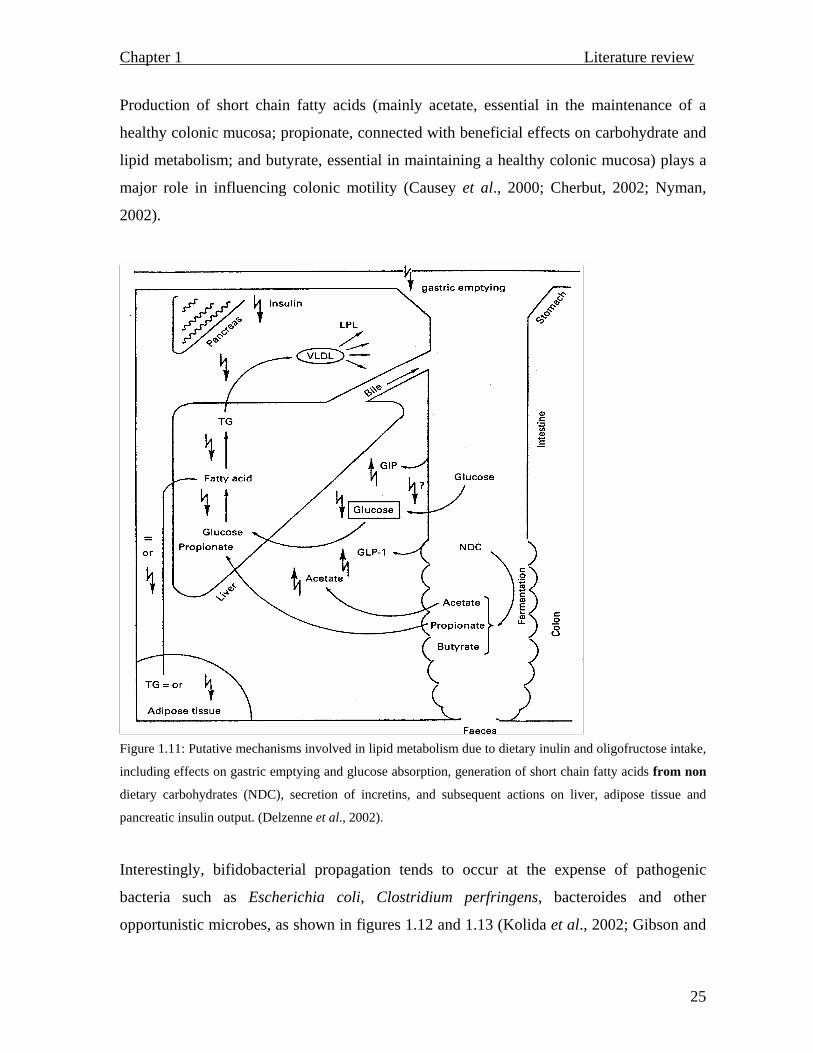
Production of short chain fatty acids (mainly acetate, essential in the maintenance of a
healthy colonic mucosa; propionate, connected with beneficial effects on carbohydrate and
lipid metabolism; and butyrate, essential in maintaining a healthy colonic mucosa) plays a
major role in influencing colonic motility (Causey et al., 2000; Cherbut, 2002; Nyman,
2002).
Figure 1.11: Putative mechanisms involved in lipid metabolism due to dietary inulin and oligofructose intake,
including effects on gastric emptying and glucose absorption, generation of short chain fatty acids from non
dietary carbohydrates (NDC), secretion of incretins, and subsequent actions on liver, adipose tissue and
pancreatic insulin output. (Delzenne et al., 2002).
Interestingly, bifidobacterial propagation tends to occur at the expense of pathogenic
bacteria such as Escherichia coli, Clostridium perfringens, bacteroides and other
opportunistic microbes, as shown in figures 1.12 and 1.13 (Kolida et al., 2002; Gibson and
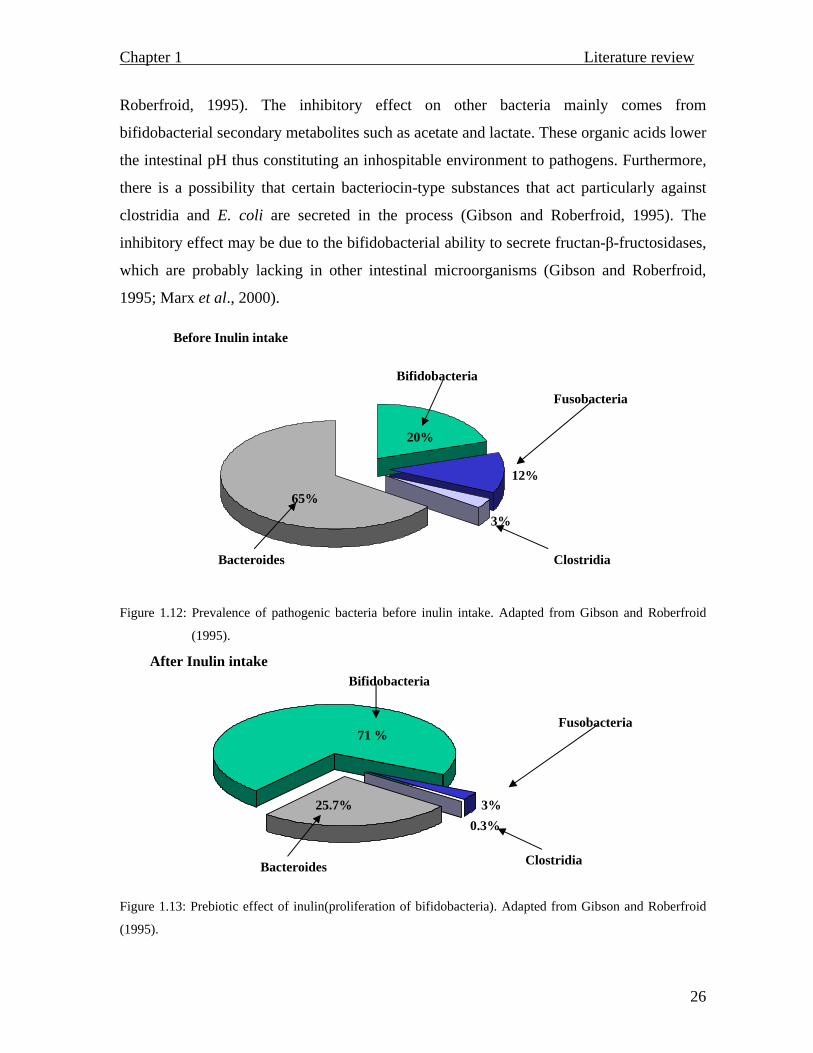
Chapter 1 Literature review
26
Roberfroid, 1995). The inhibitory effect on other bacteria mainly comes from
bifidobacterial secondary metabolites such as acetate and lactate. These organic acids lower
the intestinal pH thus constituting an inhospitable environment to pathogens. Furthermore,
there is a possibility that certain bacteriocin-type substances that act particularly against
clostridia and E. coli are secreted in the process (Gibson and Roberfroid, 1995). The
inhibitory effect may be due to the bifidobacterial ability to secrete fructan-β-fructosidases,
which are probably lacking in other intestinal microorganisms (Gibson and Roberfroid,
1995; Marx et al., 2000).
Figure 1.12: Prevalence of pathogenic bacteria before inulin intake. Adapted from Gibson and Roberfroid
(1995).
Figure 1.13: Prebiotic effect of inulin(proliferation of bifidobacteria). Adapted from Gibson and Roberfroid
(1995).
71 %
Bacteroides
Bifidobacteria
Fusobacteria
Clostridia
0.3% 3% 25.7%
After Inulin intake
65%
20%
Bacteroides
Bifidobacteria
Fusobacteria
Clostridia
3%
12%
Before Inulin intake
Chapter 1 Literature review
27
1.5.1.3 Regulation of the immune system of the colon
There is strong evidence supporting the fact that gut microflora may be involved in
modulating immune cells through products derived from the fermentation of non digestible
carbohydrates (i.e. conversion of inulin to acetate, butyrate and propionate). Rat models
have shown that improved natural cytotoxic T-cell activity results after supplementing total
parenteral nutrition with short chain fatty acids (Schley and Field, 2002).
Butyrate maintains and regulates the large intestinal mucosa as a result of induction of cell
differentiation, it does this by the inhibition of transcriptional factor controlling the
expression of genes involved in cytokine production, cellular adhesion, inflammation and
apoptosis (Ogawa et al., 2003; Aldieri et al., 2003). Furthermore, butyrate reduces the
requirement of epithelial cells for glutamine, thus retaining the requirement the amino acid
for other cells within the immune system (Schley and Field, 2002).
1.6 Inulin extraction
Viable processes for inulin extraction have been previously reported by Hébette et al.,
(1998) and Franck, (2002 a). Hébette et al., (1998), indicated a successful application of
hot water (95°C) on sliced chicory roots for the isolation of inulin. The resultant crude
inulin extract was then concentrated under reduced pressure and subsequently crystallized
as a pasty substance at cold temperatures (4°C) over a period of 30 hours. The recovered
product was ultimately spray dried to yield a white powder. Difficulties were encountered
however in the processing and removal of the final product by filtration after
crystallization.
Chapter 1 Literature review
28
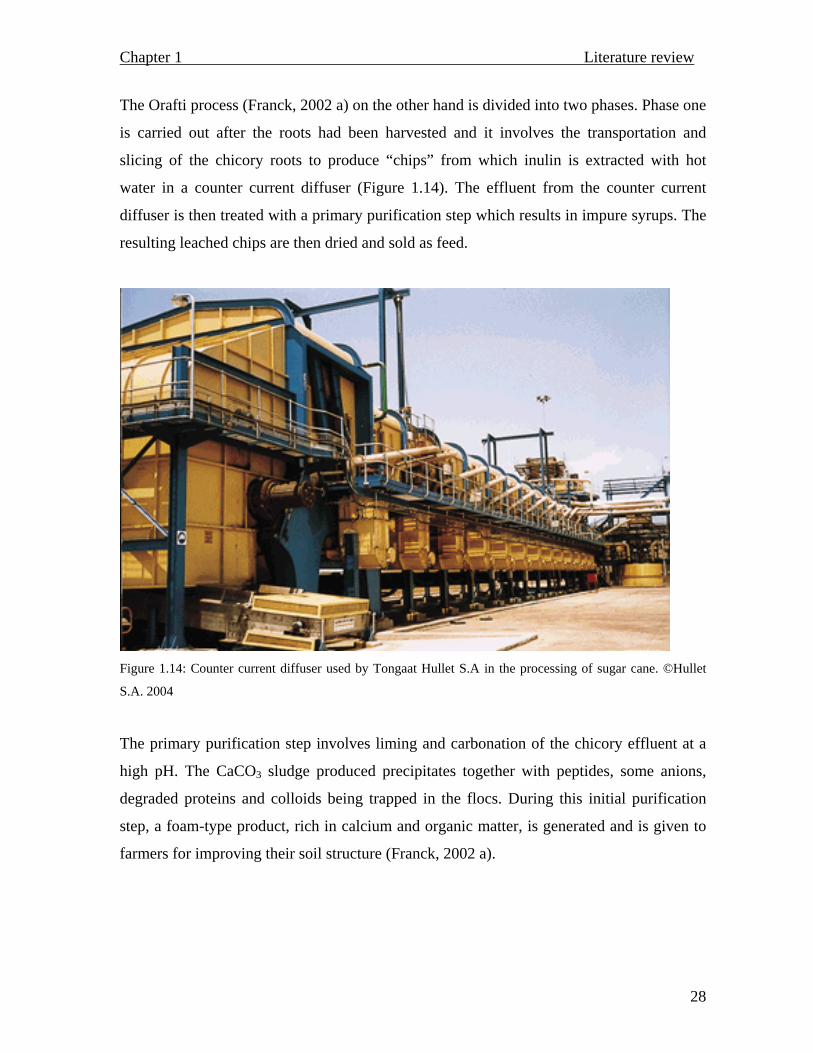
The Orafti process (Franck, 2002 a) on the other hand is divided into two phases. Phase one
is carried out after the roots had been harvested and it involves the transportation and
slicing of the chicory roots to produce “chips” from which inulin is extracted with hot
water in a counter current diffuser (Figure 1.14). The effluent from the counter current
diffuser is then treated with a primary purification step which results in impure syrups. The
resulting leached chips are then dried and sold as feed.
Figure 1.14: Counter current diffuser used by Tongaat Hullet S.A in the processing of sugar cane. ©Hullet
S.A. 2004
The primary purification step involves liming and carbonation of the chicory effluent at a
high pH. The CaCO3 sludge produced precipitates together with peptides, some anions,
degraded proteins and colloids being trapped in the flocs. During this initial purification
step, a foam-type product, rich in calcium and organic matter, is generated and is given to
farmers for improving their soil structure (Franck, 2002 a).
Chapter 1 Literature review
29
Phase two of the Orafti process is concerned with the refinement of the chicory effluent
using anionic and cationic ion exchange resins for demineralization purposes. After
demineralization, the chicory effluent is sterilized by passing it through a 0.2 µm filter.
Sterilization is then followed by evaporation and spray drying, and the final product is
collected as a dry powder (Franck, 2002 a).
The Orafti process is however not without complications, as inulin purification procedures
are considered to be compromised by balancing maximal removal of impurities against
degradation of the inulin chain, colour formation, Maillard reaction (reaction between
reducing sugars and proteins or amino acids which yields brown-coloured products and
occurs naturally when certain foods are stored or heated), contamination and incorrect
removal of taste and odour (Franck, 2002 a).
1.6.1 FOS production utilizing enzymes
In recent years the production of fructooligosaccharides, particularly those that range
between GF2 and GF4, has seen an increase in the utilization of sucrose and
fructosyltranferases (fructose transferring enzymes) derived from microorgannisms such as
Aspergillus sp., Bacillus sp., and Aureobasidium pullulans (Park et al., 2001).
Fructosyltranferases are capable of producing fructooligosaccharides from sucrose through
a consecutive set of disproportionation reactions (e.g. GFn + GFn → GFn-1 + GFn+1, n <4),
while the remaining proportion is from GFn + GF → GFn+1 + G. The only disadvantage
with this approach is the fact that fructooligosaccharides produced in this manner are
subject to optimum reaction conditions such as temperature and pH which can alter the
nature of the final product if slight deviations occur. Interestingly, crude, partially purified
and completely purified enzymes have been observed to produce fructooligosaccharides of
varying degrees, with GF5 and GF6 products mainly produced by crude
fructosyltransferases while the smaller residues mainly GF2 and GF3 coming from the
partially and completely purified enzymes (Park et al., 1999; Park et al., 2001).
Chapter 1 Literature review
30
1.6.2 Inulin characterization
High performance liquid chromatography (HPLC), with two columns in series in the K+
form (Aminex HPX-87 K+) is routinely employed for optimal separation of
fructooligosaccharides to fructose, glucose, difructose-dianhydride (DFA), sucrose (GF),
F2 and F3. However, further separation into DP3, DP4 and DP ≥ 5 is not accurate and as a
result HPLC poses serious limitations in inulin analysis (Franck, 2002 a).
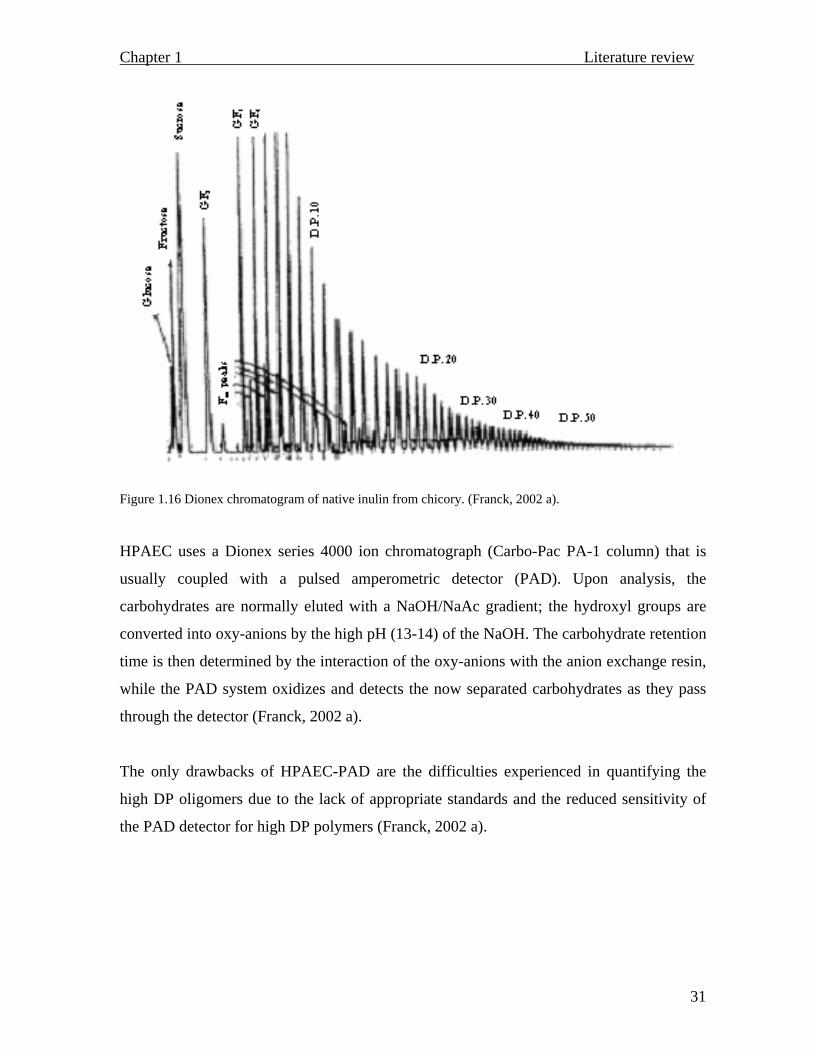
To circumvent the limited resolution observed with HPLC analysis, another technique
known as high-pressure anion exchange chromatography (HPAEC) is successfully utilized
to differentiate between GFn and Fn compounds, moreover, the method provides the
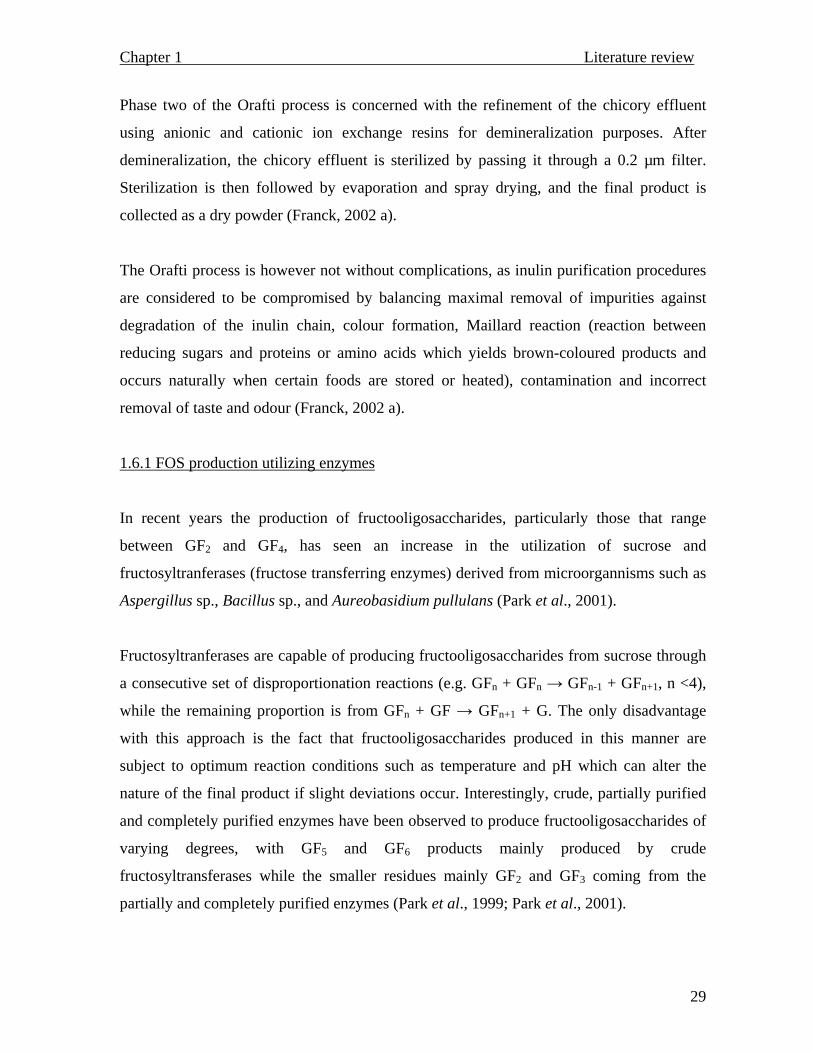
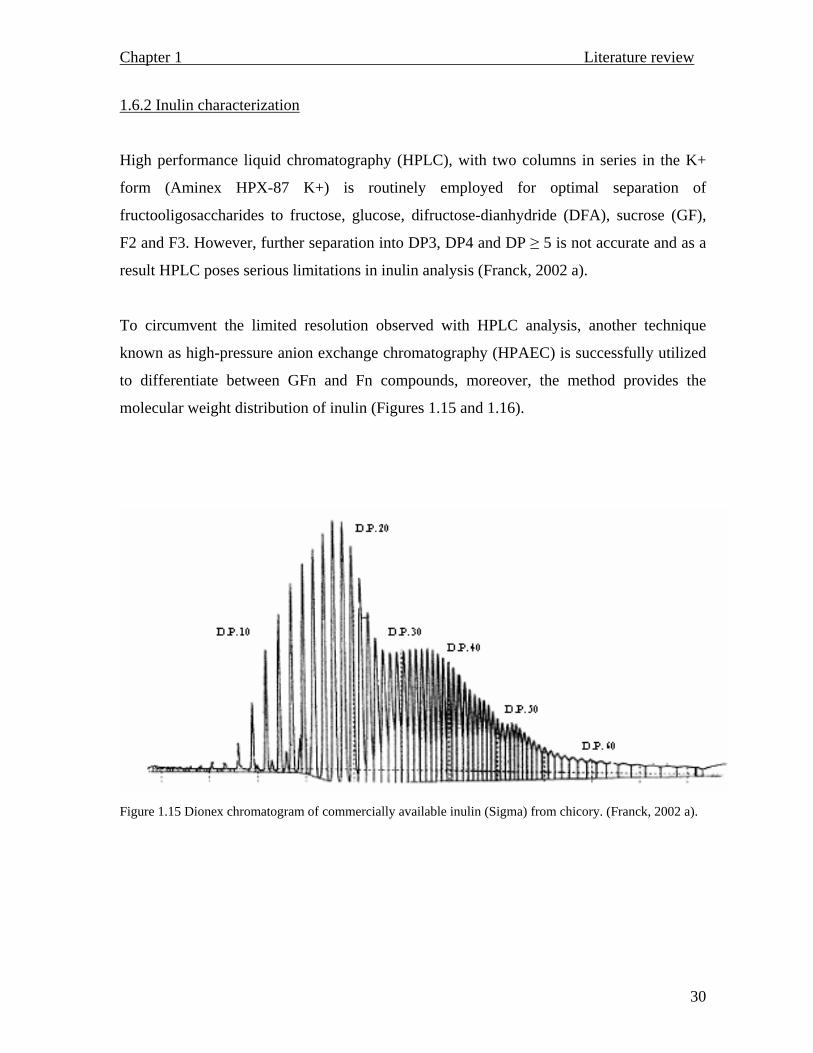
molecular weight distribution of inulin (Figures 1.15 and 1.16).
Figure 1.15 Dionex chromatogram of commercially available inulin (Sigma) from chicory. (Franck, 2002 a).
Chapter 1 Literature review
31
Figure 1.16 Dionex chromatogram of native inulin from chicory. (Franck, 2002 a).
HPAEC uses a Dionex series 4000 ion chromatograph (Carbo-Pac PA-1 column) that is
usually coupled with a pulsed amperometric detector (PAD). Upon analysis, the
carbohydrates are normally eluted with a NaOH/NaAc gradient; the hydroxyl groups are
converted into oxy-anions by the high pH (13-14) of the NaOH. The carbohydrate retention
time is then determined by the interaction of the oxy-anions with the anion exchange resin,
while the PAD system oxidizes and detects the now separated carbohydrates as they pass
through the detector (Franck, 2002 a).
The only drawbacks of HPAEC-PAD are the difficulties experienced in quantifying the
high DP oligomers due to the lack of appropriate standards and the reduced sensitivity of
the PAD detector for high DP polymers (Franck, 2002 a).
Chapter 1 Literature review
32
1.7 Aims and objectives
1.7.1 Aims
The aims of this study are to develop and optimize extraction and purification procedures
for the industrial commercialization of inulin and fructooligosaccharides from chicory and
to investigate the hydrolysis of the polymer using inulinases from the fungus Aspergillus
niger.
1.7.2 Objectives
(i) To develop a simple and cost effective extraction of inulin and fructooligosaccharides
from chicory (Chicorium intybus).
(ii) To develop an efficient purification processes of the inulin and fructooligosaccharides
for the removal of colour, tannins and other contaminants.
(iii) To characterize the extracted inulin and oligofructosaccharides.
(iv) To extract and purify inulinase production from Aspergillus niger for subsequent inulin
hydrolysis.
(v) To use inulinase in the hydrolysis of inulin to fructooligosaccharides.
Chapter 2 Inulin extraction
33
Chapter 2
Inulin extraction
2.1 Introduction 2.1.1 Cell compartmentalization As typical eukaryotes, plant cells are generally well compartmentalized, for efficient
operation of processes like synthesis of organic molecules, energy transformation, growth
and reproduction (Nadakavukaren and McCracken, 1985).
Even though most plants share a lot of characteristics, some differences in morphology
that render the plants functionally different do exist. Vascular (chicory root) and
supportive tissue plants possess secondary cell walls, predominant in cells that eventually
provide support to the plant or conduct fluids, this is especially the case with xylem
tissues, while some plants are only comprised of primary cell walls which consist of
cellulose as the back bone of the cell wall’s structural integrity. The cell wall thus
provides the cell with mechanical stability preventing cell rupture as a result of tugor
pressure and appropriate extensibility that allows cell expansion (Salisbury and Ross,
1992; Rieter, 2002).
Apart from other associated components such as structural proteins, cellulose, is the
major strengthening component that serves as a structural molecule in plant cell walls. It
is a linear polysaccharide that predominantly features 1,4-β-D-glycosidic residues
assembled into paracrystalline microfibrils (each microfibril contains about 36 parallel
polysaccharide chains). As structural entities, these polysaccharides permit the retention
and transfer of information vital for the appropriate functioning of the cell (Rieter, 2002;
Jensen, 1964).
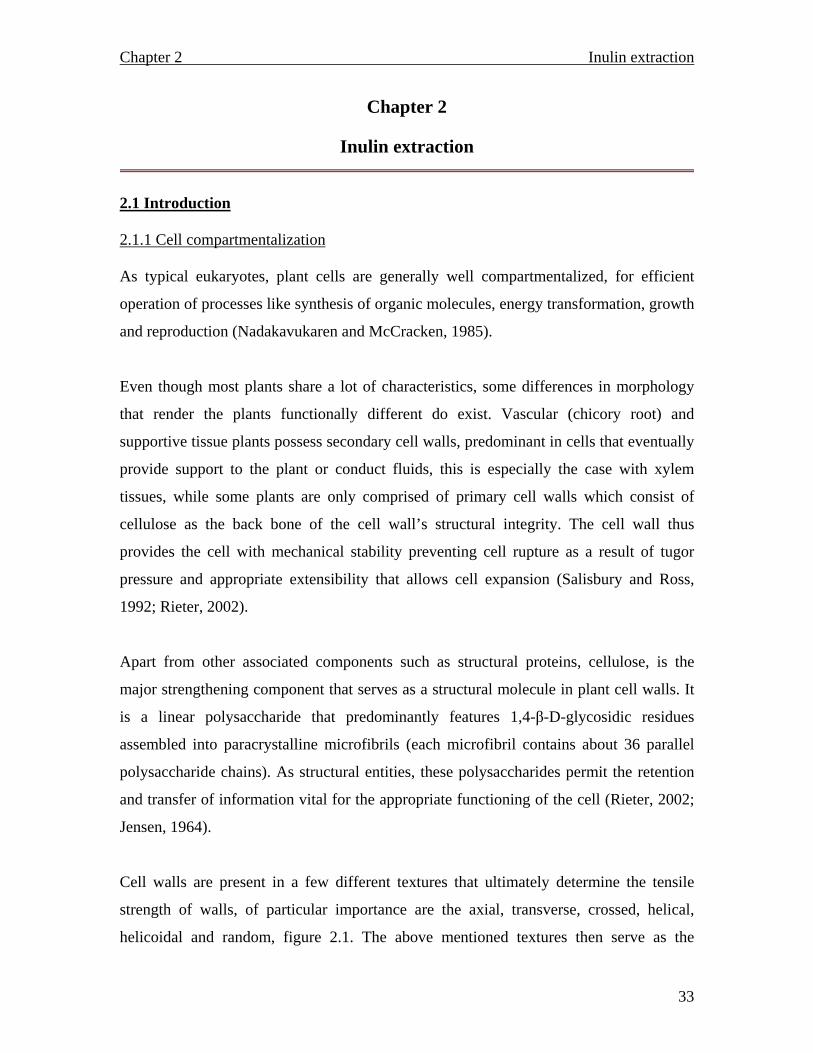
Cell walls are present in a few different textures that ultimately determine the tensile
strength of walls, of particular importance are the axial, transverse, crossed, helical,
helicoidal and random, figure 2.1. The above mentioned textures then serve as the
Chapter 2 Inulin extraction
34
prototype for the derivation of other textures. The manner in which cellulose microfibrils
stiffen the plasma membrane, thus leading to a rigid cell wall, is governed by the
orientation of cortical microtubules that lead to the transverse elongation of the direction
of the cells (Emons and Mulder, 2000).
Figure 2.1: Cell wall textures; providing a closer look of how textures confer rigidity on cells
(Emons and Mulder, 2000)
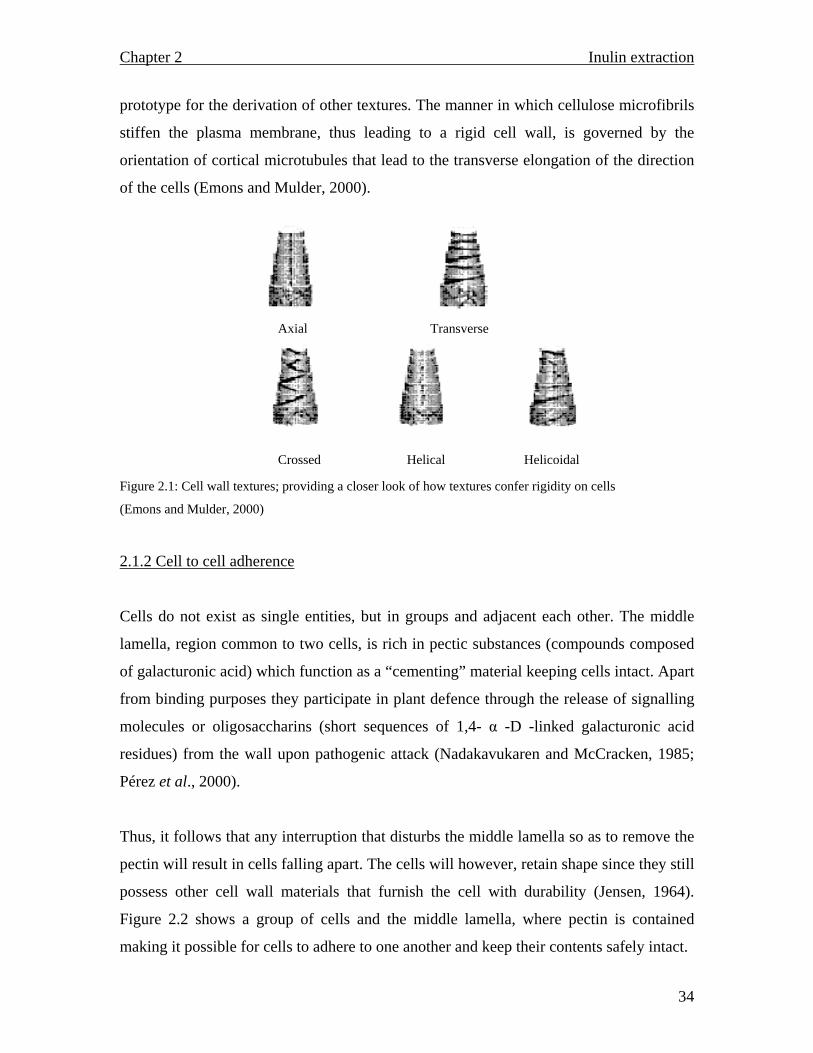
2.1.2 Cell to cell adherence
Cells do not exist as single entities, but in groups and adjacent each other. The middle
lamella, region common to two cells, is rich in pectic substances (compounds composed
of galacturonic acid) which function as a “cementing” material keeping cells intact. Apart
from binding purposes they participate in plant defence through the release of signalling
molecules or oligosaccharins (short sequences of 1,4- α -D -linked galacturonic acid
residues) from the wall upon pathogenic attack (Nadakavukaren and McCracken, 1985;
Pérez et al., 2000).
Thus, it follows that any interruption that disturbs the middle lamella so as to remove the
pectin will result in cells falling apart. The cells will however, retain shape since they still
possess other cell wall materials that furnish the cell with durability (Jensen, 1964).
Figure 2.2 shows a group of cells and the middle lamella, where pectin is contained
making it possible for cells to adhere to one another and keep their contents safely intact.
HelicoidalHelicalCrossed
Transverse Axial
Chapter 2 Inulin extraction
35
Figure 2.2: Location of the middle lamella ©Shaw, M. (1998)
2.1.3 Organelles within the cell
The cell is a multi-functional machinery that is continuously synthesizing metabolites
that function in different processes. Different types of organelles involved in a multitude
of transformations reside within the cell and has been repeatedly shown that these
organelles are not independent in their function and that they supply each other with
intermediate products for processing towards the benefit of the plant (Rieter, 2002).
The nucleus for example, is the control centre of eukaryotes and functions by determining
the different kinds of micro and macromolecules that may be in need by the cell. In turn,
these molecules influence chemical reactions that take place in the cytoplasm and the
ultimate structures and functions of cells (Salisbury and Ross, 1992).
Many organelles function as storage bodies, for a variety of compounds that may be
needed by the cell during stressful periods. For example, starch is particularly well
distributed and is present in large quantities in almost all of the organs of higher plants. It
is predominantly found as water insoluble granules confined to the plastids (Kruger,
1995).
Middle lamella
Chapter 2 Inulin extraction
36
2.1.4 The vacuole, inulin locality
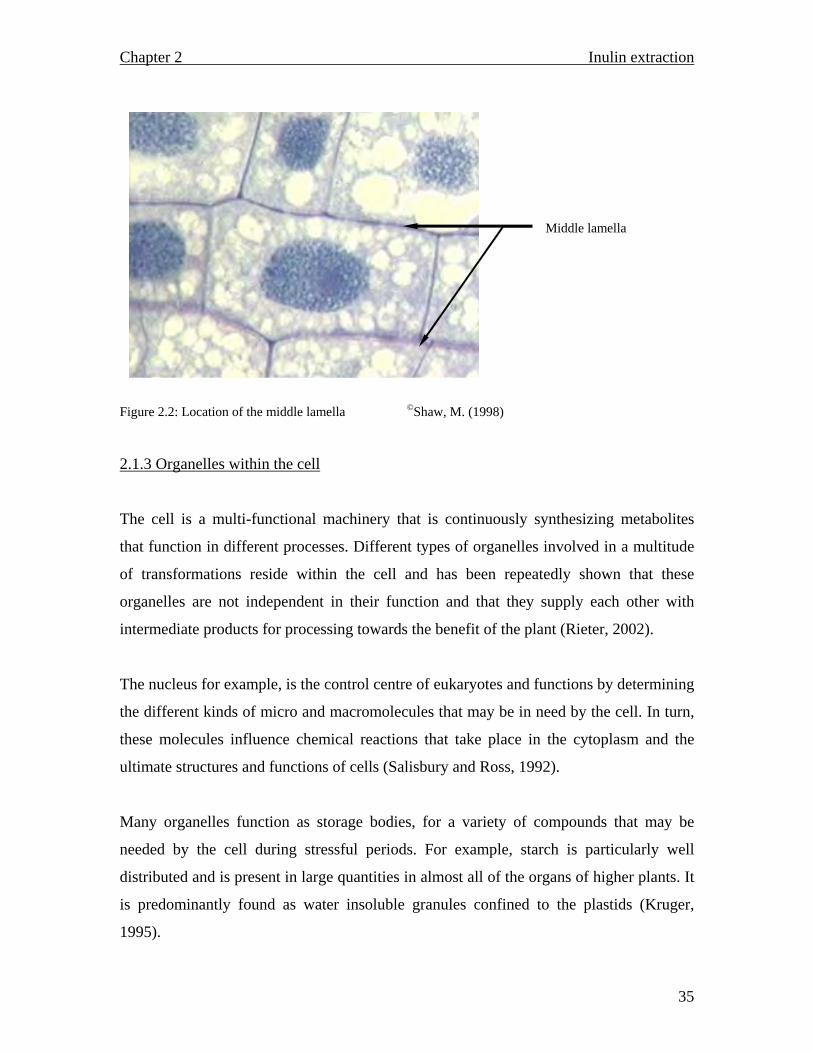
Cells of a growing plant especially in roots and stems are normally occupied by abundant
minute vacuoles. As cells mature the vacuoles constitute with each other while taking up
water. Ultimately, a substantial amount of a fully grown plant’s protoplasm is occupied
by a large vacuole such that most of the cell’s content is pressed against the cell wall by
the large centrally positioned vacuole (Figure 2.3) (Raven, 1987; Jensen, 1964; Salisbury
and Ross, 1992).
Figure 2.3: Plant cell with a conspicuous vacuole. The vacuole occupies much of the cytoplasm such that
all of the plant’s organelles are pushed against the cell wall. Armstrong (1989).
Vacuoles have the capability of storing large quantities of compounds that are vital for
cellular metabolic processes without compromising the cell’s osmotic pressure. Dissolved
substances such as amino acids, proteins, sugars and pigments responsible for the colours
of many flowers can be found within vacuoles. As a result during the plant’s light phase,
a general accumulation of photosynthetic products can be observed, and such metabolites
are normally directed towards the vacuole for utilization during the dark phase (Raven,
1987; Salisbury and Ross, 1992).
Chapter 2 Inulin extraction
37
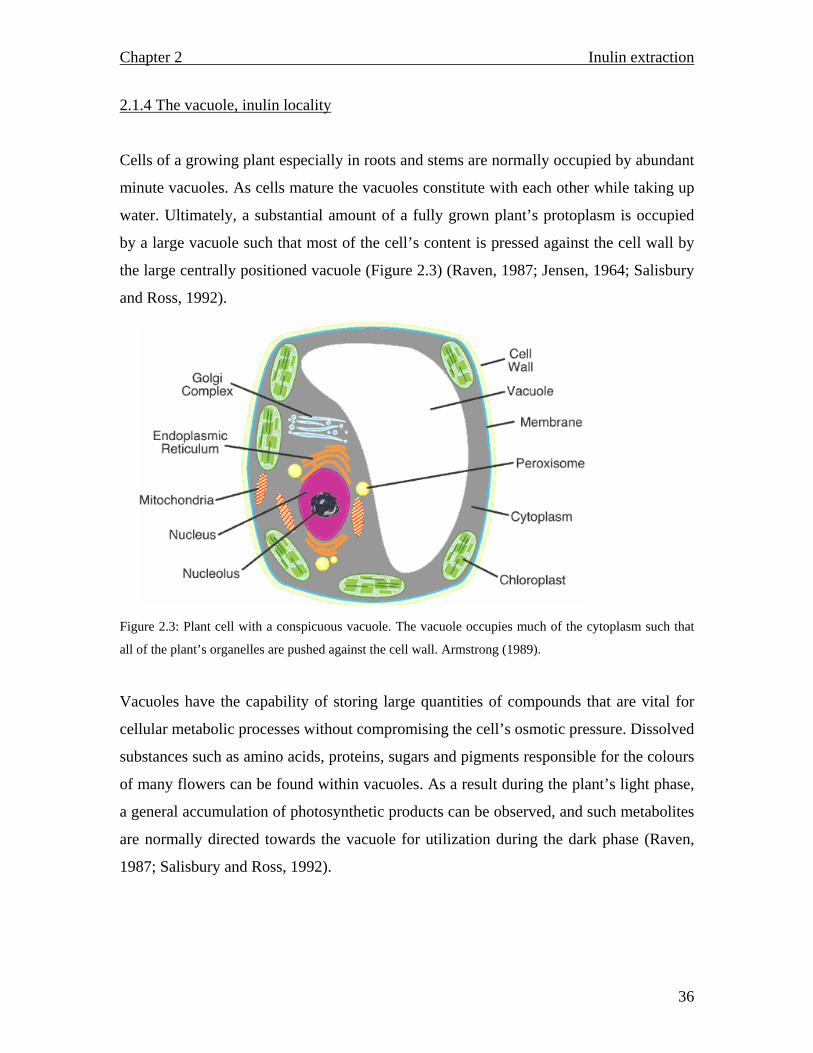
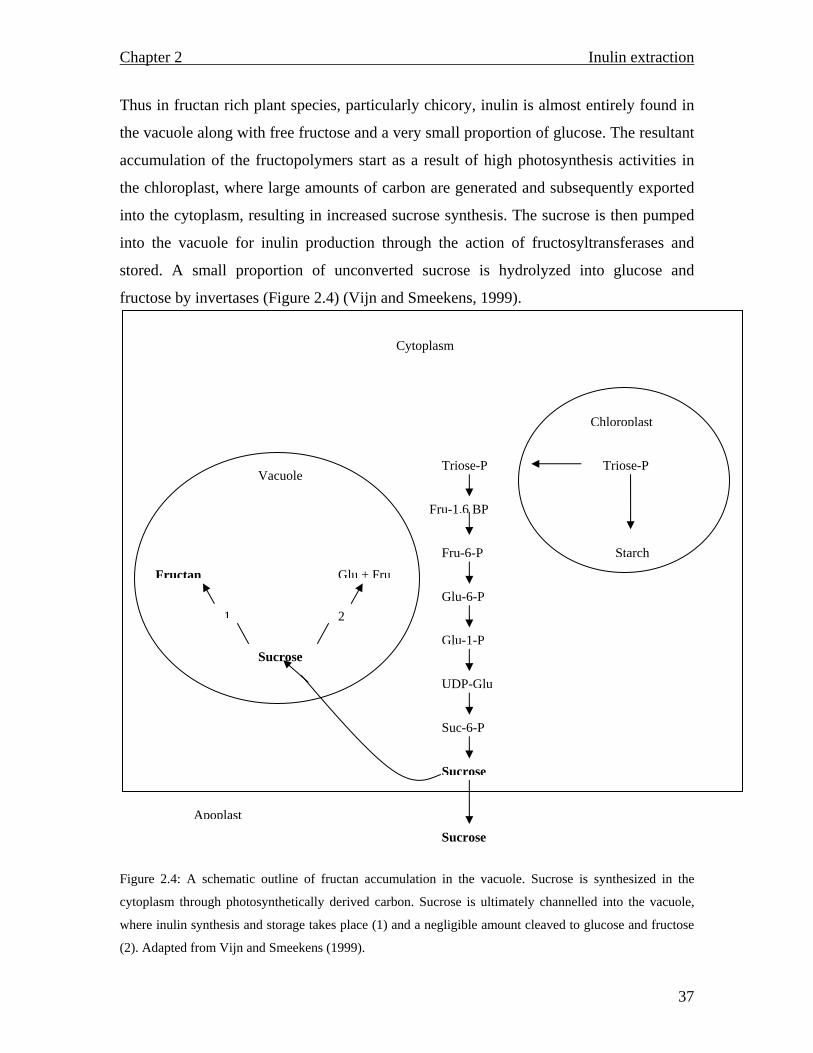
Thus in fructan rich plant species, particularly chicory, inulin is almost entirely found in
the vacuole along with free fructose and a very small proportion of glucose. The resultant
accumulation of the fructopolymers start as a result of high photosynthesis activities in
the chloroplast, where large amounts of carbon are generated and subsequently exported
into the cytoplasm, resulting in increased sucrose synthesis. The sucrose is then pumped
into the vacuole for inulin production through the action of fructosyltransferases and
stored. A small proportion of unconverted sucrose is hydrolyzed into glucose and
fructose by invertases (Figure 2.4) (Vijn and Smeekens, 1999).
Figure 2.4: A schematic outline of fructan accumulation in the vacuole. Sucrose is synthesized in the
cytoplasm through photosynthetically derived carbon. Sucrose is ultimately channelled into the vacuole,
where inulin synthesis and storage takes place (1) and a negligible amount cleaved to glucose and fructose
(2). Adapted from Vijn and Smeekens (1999).
Vacuole
Fructan Glu + Fru
Sucrose
1 2
Chloroplast
Triose-P
Starch
Triose-P
Fru-1.6 BP
Fru-6-P
Glu-6-P
Glu-1-P
UDP-Glu
Suc-6-P
Sucrose
Sucrose
Apoplast
Cytoplasm
Chapter 2 Inulin extraction
38
2.1.5 Cell wall lysis
Figure 2.4 schematically depicts the inulin storage organelle. Unless, the use of enzymes
(cellulases) is employed in cleaving the cell wall’s cellulose responsible for the stiffened
cell wall the cell will remain an enclosed entity that cannot be easily permeated.
Chemical treatment of the cells is not a viable option as the target molecules’ integrity
might be compromised rendering the inulin unsuitable for human consumption. Cell wall
disruption is further complicated by the presence of pectic substances that adhere cells to
each other making the availability of every cell difficult. (Salisbury and Ross, 1992;
Raven, 1987; Jensen, 1964).
Thus physical harsh techniques for cell disruption such as grinding and high temperatures
(70 °C-80 °C) are required to ensure that the inulin is recovered without altering its state.
Grinding disrupts the tough cell wall and the released pectin within the middle lamella is
diluted, which allows the invasion of every cell through continued grinding. High
temperatures enhance the isolation process as extraneous cellular components such as
enzymes, inulinases within the chicory root, are inactivated, and inulin is very soluble
(and not degraded) at such temperatures (Jensen, 1964; De Roover et al., 1999; Henson,
1989).
2.1.6 Isolation of inulin from Dahlia tubers
Very few studies have focused on inulin extraction or alternative procedures thereof.
Insufficient information or the use of expensive equipment is usually presented as seen in
section 1.6 (the Orafti process, Franck, 2002 a). Despite the different extraction
protocols, they all operate on the same principle (hot water extraction) and no radical
deviations can be observed. The extraction process mentioned by Hébette et al., (1998) in
section 1.6 and indeed the one currently used by Orafti (Belgium) has not changed since
Hirst et al., (1950) succeeded in extracting (and methylating) inulin from dahlia tubers
through a succession of steps that involved the mincing of tubers and expressing their
juice through cheesecloth. After partial solidification of the juice hot water was added
Chapter 2 Inulin extraction
39
followed by Ca(OH)2 to elevate the pH to 8. The resulting precipitate was filtered off.
The pH of the solution was lowered to 7 by the addition of oxalic acid, and cooled to 3°C
which resulted in the separation of inulin. The inulin was kept in acetone overnight,
filtered and dried. The supernatant was concentrated at 40°C and a further yield of inulin
recovered. Consequently, the extraction protocol used in the current study was a modified
version of the above.
The objectives of the study outlined in this chapter were to quantify the inulin content in
chicory root and to develop and optimize extraction procedures for inulin and
fructooligosaccharides.
2.2 Materials and Methods
2.2.1 Materials
All reagents used were of analytical grade. Chicory roots were supplied by Chicory S.A
(Alexandria) after harvesting and were stored at –10 °C for later use. Commercial inulin
(from Dahlia tubers), fructose, sodium potassium tartrate and sodium arsenate were
purchased from Sigma (South Africa (Pty) Ltd). Ammoniun molybdate, copper sulphate,
hydrochloric acid and sodium carbonate were supplied by Merck (South Africa (Pty)
Ltd). A thermoreactor TR 420 (Merck South Africa (Pty) Ltd) was utilitized for the
heating of the samples. For heating and stirring purposes, a hotplate magnetic stirrer
supplied by Snijers (South Africa) was used. Roots were dried using a labotec TERM-O-
MAT oven. Centrifugation was performed using a P Selecta ® mixtasel centrifuge.
Solutions were concentrated using a Buchi rotavapor R-114 coupled to a Buchi waterbath
R-480. Measurements of masses were accomplished through the use of a Denver
instrument weighing balance. Absorbances were measured using Power Wave X (Bio-
Tek Instrument Inc, South Africa) and helios Aquamate Thermospectronic (Merck South
Africa (Pty) Ltd).
Chapter 2 Inulin extraction
40
2.2.2 Methods
2.2.2.1 Determination of reducing sugars (Somogyi-Nelson)
The Somogyi-Nelson assay is based on the oxidation of sugars, with free anomeric
carbons, by Cu2+, and in turn the resulting cuprous oxide is reacted with arsenomolybdate
to give a molybdenum blue colour which is then measured spectrophotometrically at 510
nm (Somogyi, 1952). The concentration of reducing sugars was estimated using a
fructose standard curve (Appendix 1). Inulin contents of the raw extracts were measured
as follows: inulin extract (0.1 g) was hydrolyzed by 0.8 M HCl (1 ml) at 90°C for 1 hour,
after which the hydrolysate (150 µl) was tested for reducing sugars using the fructose
standard curve. As inulin is insoluble in cold water an aliquot (150 µl) of the supernatant,
obtained after suspension of inulin extract (0.1 g), was analysed for free fructose.
2.2.2.2 Preparation of the chicory extract
Chicory roots were washed, weighed and dried in an oven (60 °C, 24 hrs). The dried
roots were then ground into a fine powder using a Waring commercial blender (New
Hartford, Conn. USA). Distilled water was subsequently added to the powder (5:1 w/v).
2.2.2.3 HCl concentration for optimum inulin hydrolysis
In order to determine the amount of inulin from the chicory root powder and commercial
inulin or isolated inulin, it was acid hydrolyzed into fructose with 0.8 M, which was then
quantified by the Somogyi-Nelson method. Commercial inulin (100 mg) was added into
each of the test tubes containing HCl (1 ml). The test tubes were heated in a
thermoreactor (100 °C, 1 hour). At the end of this period, 100 µl of each of the
hydrolysates were diluted (1:50) and 150 µl assayed for reducing sugars (Somogyi-
Nelson assay).
Chapter 2 Inulin extraction
41
2.2.2.3.1 Optimum temperature for inulin extraction
The chicory slurry (prepared in 2.2.2.2) was poured into five clean 100 ml beakers (5 ml
in each beaker). The beakers were covered with parafilm to minimize evaporation and
placed on hotplate magnetic stirrers. A temperature course study for maximum inulin
release was then undertaken, where the beakers were heated while stirring at different
temperatures (24-70 °C) for one hour. At the end of this period the chicory slurry was
filtered through cheesecloth and the resultant solution centrifuged (9,000g, 30 minutes).
The pellets were discarded and the supernatants assayed for free fructose and inulin,
measured as released fructose after acid hydrolysis. The hydrolysis reaction was carried
out using 0.8 M HCl (1 ml) in tubes placed in a thermoreactor (90°C, 1hr) in order to
measure the amount of inulin released at different temperatures. By subtracting the
amount of initial free fructose from that produced by hydrolysis, the amount of inulin
could be quantified (equation 1).
[I] = 162 × [F]/180……………………………………. (1)
Where [I] is the inulin concentration and [F] the fructose concentration
2.2.2.3.2 Optimum heating period
To further optimize the extraction process, the same procedure as in section 2.2.2.3.1 was
carried out at the optimum temperature and at varying periods (20 minutes to 3 hrs).
2.2.2.3.3 Inulin extraction
After cutting the root (207 g) into small pieces, distilled water (150 ml, 70 °C) was added
and the root homogenized by blending for 1 minute. An additional 900 ml distilled water
(70 °C) was added and heated (with continuous stirring) for 1 hour at 70 °C (the reaction
vessel covered with parafilm to prevent excessive evaporation). The solution was filtered
through cheesecloth and 0.1 M Ca(OH)2 (70 ml) added to raise the pH to 8, and
Chapter 2 Inulin extraction
42
subsequently lowered to pH 7 using 0.8 M HCl.. The pulp was re-suspended in 500 ml
distilled water and the process repeated. This cycle required only 3.8 ml 0.1 M Ca(OH)2
to raise the pH to 8 and returned to 7 utilizing 0.8 M HCl. Precipitates formed were
filtered off and the solutions stored at -10 °C for 7 hours.
Upon thawing (section 2.2.2.3.3) two distinct layers could be observed, a pasty off white
suspension and a dark brown top layer. These were separately concentrated using a
rotavapor (40 °C), under reduced pressure, and collected as a dry powder after freeze
drying. A total amount of 1050 ml distilled water was used for the extraction process. A
comprehensive extraction process is shown in figure 2.5.
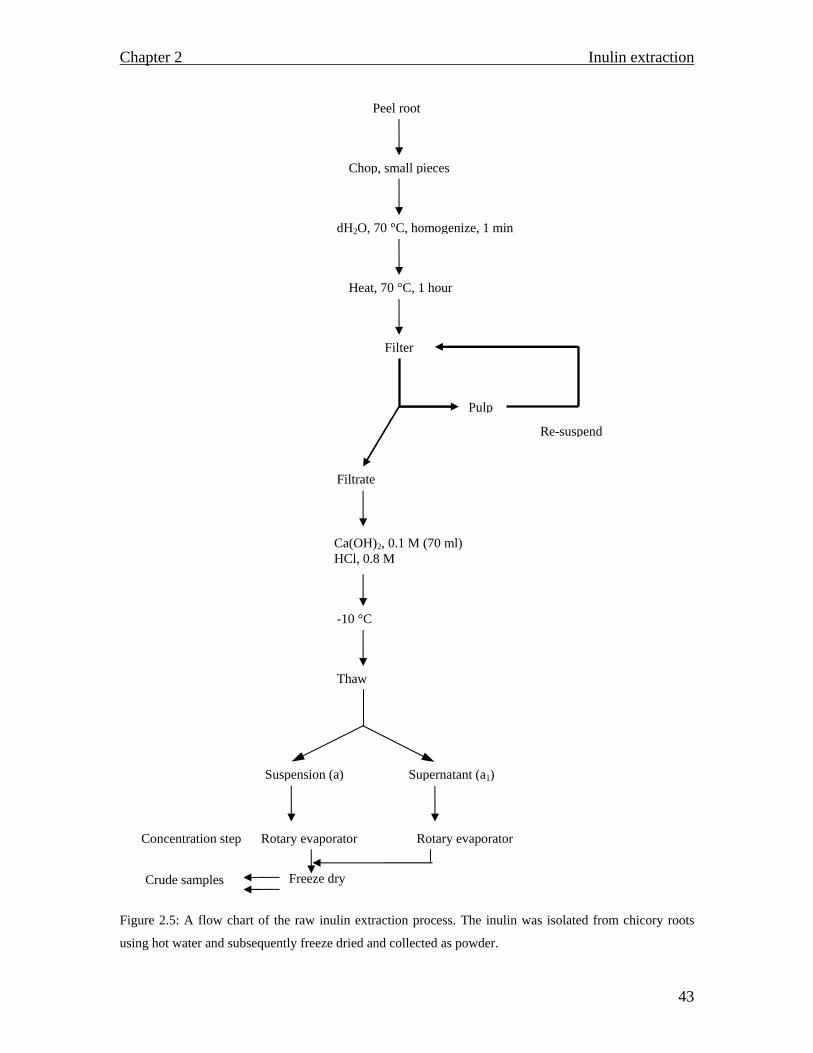
Chapter 2 Inulin extraction
43
Figure 2.5: A flow chart of the raw inulin extraction process. The inulin was isolated from chicory roots
using hot water and subsequently freeze dried and collected as powder.
Peel root
Chop, small pieces
dH2O, 70 °C, homogenize, 1 min
Heat, 70 °C, 1 hour
Filter
Pulp
Re-suspend
Filtrate
Ca(OH)2, 0.1 M (70 ml) HCl, 0.8 M
-10 °C
Thaw
Suspension (a) Supernatant (a1)
Freeze dry Crude samples
Concentration step Rotary evaporator Rotary evaporator
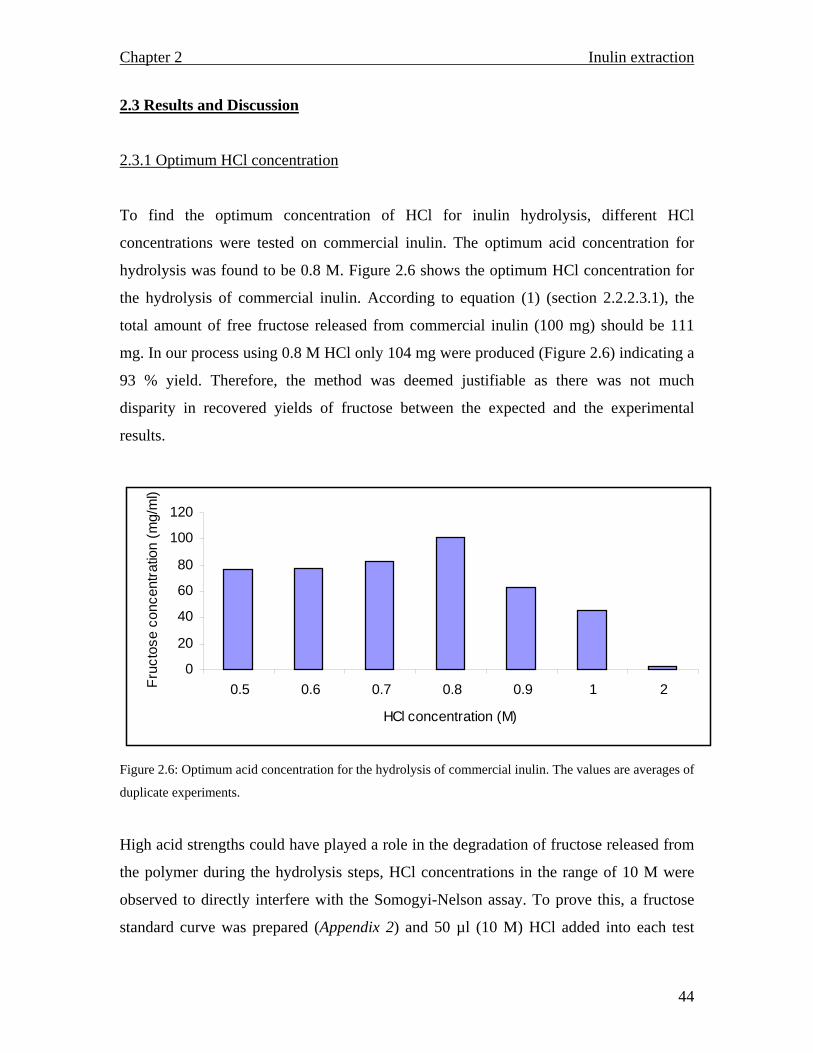
Chapter 2 Inulin extraction
44
2.3 Results and Discussion
2.3.1 Optimum HCl concentration
To find the optimum concentration of HCl for inulin hydrolysis, different HCl
concentrations were tested on commercial inulin. The optimum acid concentration for
hydrolysis was found to be 0.8 M. Figure 2.6 shows the optimum HCl concentration for
the hydrolysis of commercial inulin. According to equation (1) (section 2.2.2.3.1), the
total amount of free fructose released from commercial inulin (100 mg) should be 111
mg. In our process using 0.8 M HCl only 104 mg were produced (Figure 2.6) indicating a
93 % yield. Therefore, the method was deemed justifiable as there was not much
disparity in recovered yields of fructose between the expected and the experimental
results.
0
20
40
60
80
100
120
0.5 0.6 0.7 0.8 0.9 1 2
HCl concentration (M)
Fruc
tose
con
cent
ratio
n (m
g/m
l)
Figure 2.6: Optimum acid concentration for the hydrolysis of commercial inulin. The values are averages of
duplicate experiments.
High acid strengths could have played a role in the degradation of fructose released from
the polymer during the hydrolysis steps, HCl concentrations in the range of 10 M were
observed to directly interfere with the Somogyi-Nelson assay. To prove this, a fructose
standard curve was prepared (Appendix 2) and 50 µl (10 M) HCl added into each test
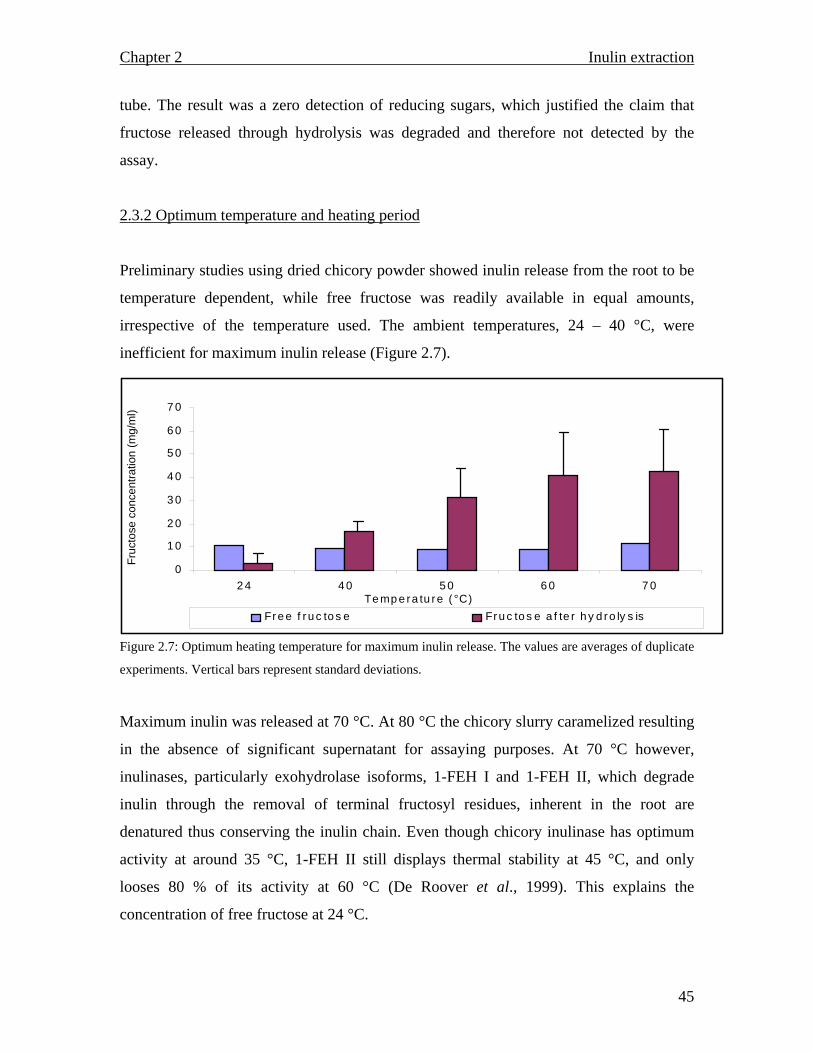
Chapter 2 Inulin extraction
45
tube. The result was a zero detection of reducing sugars, which justified the claim that
fructose released through hydrolysis was degraded and therefore not detected by the
assay.
2.3.2 Optimum temperature and heating period
Preliminary studies using dried chicory powder showed inulin release from the root to be
temperature dependent, while free fructose was readily available in equal amounts,
irrespective of the temperature used. The ambient temperatures, 24 – 40 °C, were
inefficient for maximum inulin release (Figure 2.7).
Figure 2.7: Optimum heating temperature for maximum inulin release. The values are averages of duplicate
experiments. Vertical bars represent standard deviations.
Maximum inulin was released at 70 °C. At 80 °C the chicory slurry caramelized resulting
in the absence of significant supernatant for assaying purposes. At 70 °C however,
inulinases, particularly exohydrolase isoforms, 1-FEH I and 1-FEH II, which degrade
inulin through the removal of terminal fructosyl residues, inherent in the root are
denatured thus conserving the inulin chain. Even though chicory inulinase has optimum
activity at around 35 °C, 1-FEH II still displays thermal stability at 45 °C, and only
looses 80 % of its activity at 60 °C (De Roover et al., 1999). This explains the
concentration of free fructose at 24 °C.
0
1 0
2 0
3 0
4 0
5 0
6 0
7 0
2 4 4 0 5 0 6 0 7 0Te mp e ra tu re ( °C)
Fruc
tose
con
cent
ratio
n (m
g/m
l)
Fr e e f r u c to s e Fru c to s e a f te r h y d ro ly s is
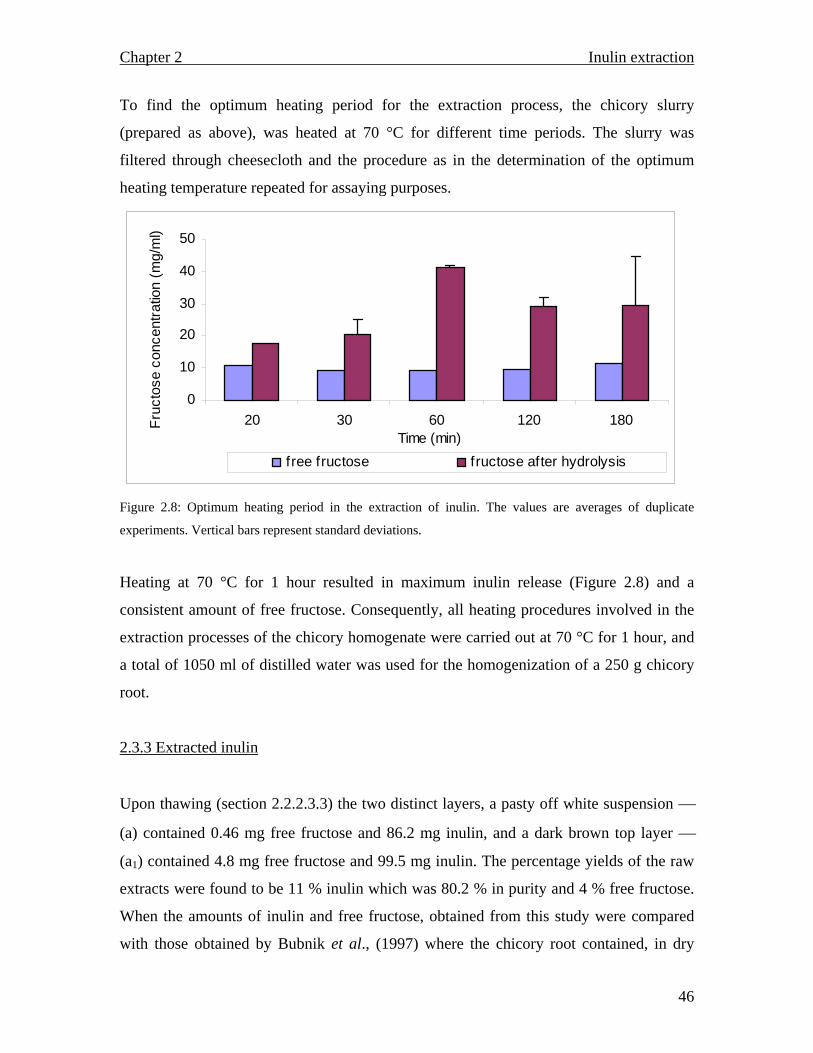
Chapter 2 Inulin extraction
46
To find the optimum heating period for the extraction process, the chicory slurry
(prepared as above), was heated at 70 °C for different time periods. The slurry was
filtered through cheesecloth and the procedure as in the determination of the optimum
heating temperature repeated for assaying purposes.
0
10
20
30
40
50
20 30 60 120 180Time (min)
Fruc
tose
con
cent
ratio
n (m
g/m
l)
f ree fructose fructose after hydrolysis
Figure 2.8: Optimum heating period in the extraction of inulin. The values are averages of duplicate
experiments. Vertical bars represent standard deviations.
Heating at 70 °C for 1 hour resulted in maximum inulin release (Figure 2.8) and a
consistent amount of free fructose. Consequently, all heating procedures involved in the
extraction processes of the chicory homogenate were carried out at 70 °C for 1 hour, and
a total of 1050 ml of distilled water was used for the homogenization of a 250 g chicory
root.
2.3.3 Extracted inulin
Upon thawing (section 2.2.2.3.3) the two distinct layers, a pasty off white suspension
(a) contained 0.46 mg free fructose and 86.2 mg inulin, and a dark brown top layer
(a1) contained 4.8 mg free fructose and 99.5 mg inulin. The percentage yields of the raw
extracts were found to be 11 % inulin which was 80.2 % in purity and 4 % free fructose.
When the amounts of inulin and free fructose, obtained from this study were compared
with those obtained by Bubnik et al., (1997) where the chicory root contained, in dry
Chapter 2 Inulin extraction
47
substances, 1.5 % free fructose and 16 % inulin. The extraction process was considered to
be within an acceptable range in spite of the 5% inulin content difference, as the isolation
method was cost effective and not as expensive and energy consuming as compared to
the one used by Bubnik et al., (1997), which involved a four column countercurrent
extractor where three columns ran concurrently while the change of cossettes (“chicory
chips”) ran simultaneously in the fourth one. During extraction, the columns were
sequenced in series, and the countercurrent of the juice and cossettes was formed by the
sequential automated switching of water inlet. An automatic refractometer equipped with
through flow cell, continuously monitored the course of extraction.
Judging from the method used by Bubnik et al., (1997), it is apparent that the extraction
method used in this study was convenient, less expensive and not as cumbersome, hence
the acceptance of the 11 % yield.
2.3.4 Summary
Results obtained from this chapter suggest that for maximum inulin isolation, chicory
roots must be processed as soon as possible after harvesting to prevent any inulin
degradation (section 2.2.2.3.3). The observed amount of free fructose was more than that
of inulin at 24 °C. The surplus of free fructose is probably due to the action of
exohydrolases (mainly 1-FEH) which are generally induced by a drop in temperature (De
Roover et al., 1999). Before inulin extraction, the roots had been stored in the freezer at -
10 °C to prevent spoilage and subsequently thawed in preparation for extraction. It is
probably during this period that the enzyme started cleaving the polymer thus resulting in
a slightly pronounced free fructose concentration as compared to inulin.
Blending the root at 70 °C and subsequently heating the homogenate at the same
temperature for 1 hour while stirring proved to be the most important step in the isolation
of inulin. Moreover, 70 °C renders chicory exohydrolases inactive thus conserving the
polymer from further degradation into fructose (De Roover et al., 1999). Freezing the
heat treated homogenate was found to be crucial in the final recovery of inulin, as it is not
Chapter 2 Inulin extraction
48
soluble in cold water and precipitates at low temperatures (Bemiller, 1972; Kim et al.,
2001). Temperatures ranging between 5 °C and 24 °C did not give considerable amounts
of inulin suspensions, hence, the use of -10 °C (which resulted in substantial yields).
Optimization of the HCl concentration for hydrolysis purposes was vital for the
quantification of inulin, as the unmodified acid (32 % HCl) affected the fructose standard
curve resulting in undetectable amounts of fructose after hydrolysis.
The percentage yields of the isolate were found to contain 11 % inulin which was 80.2 %
in purity and 4 % free fructose. These yields do not deviate much with those stated by
Bubnik et al., (1997) where the chicory root contained, in dry substances, 1.5 % free
fructose and 16 % inulin (amongst other components, such as water 74 %, proteins
0.3 %, lipids 0.3 %, inorganic non-sugars and insoluble fibre 1.3 %). Koch et al.,
(1999) on the other hand, found the chicory root to contain about 200g/kg of inulin,
which is a much higher yield compared to yields obtained in this chapter. Moreover, the
inulin extraction protocol used by Koch et al., (1999) is not mentioned making it difficult
to exploit their extraction process in order to effect comparable inulin yields. As a result,
the inulin yields obtained from this chapter can not be compared to those reported by
Koch et al., (1999) for the assessment of an optimized inulin extraction process.
Furthermore, given the fact that the extraction process undertaken in this chapter was
meant to be a cheap and an economically viable process, compromises in low inulin
yields could be accommodated, and the process was thus believed to be optimum.
Free fructose and inulin percentages given by Bubnik et al., (1997) and Koch et al.,
(1999) are not the norm with all chicory roots, since factors such as shelf storage and
inherent inulinases can greatly affect the inulin and fructose distribution within roots
(Bonnett et al., 1994). In light of the comparisons with Bubnik et al., (1997), the free
fructose and inulin contents obtained from these studies suggest that the extraction
procedure followed in section 2.2.2.3.3 was efficient in isolating maximum amounts of
inulin. Moreover, the bulk of the free fructose was established to be in the top layer of the
raw inulin extract. This identification was important in that a specific portion of the
Chapter 2 Inulin extraction
49
extract can be exploited for the removal of these simple sugars, in the production of high
inulin samples.
In its purified form inulin is recovered as an odourless white powder and oligofructose as
a colourless syrup or white powder (Franck, 2002 b). The inulin samples obtained in
section 2.2.2.3.3 were not free of impurities that contributed towards bitter principles and
colour.
The respective phases of the raw inulin, the off white suspension and the brown
supernatant, were found to contain significant amounts of tannins. The supernatant
contained 30 mg/ml of tannins as opposed to the suspension which had 20 mg/ml. On
concentrating the supernatant, in the process of inulin recovery, the tannins were
simultaneously concentrated, thus contaminating the inulin and fructooligosaccharides,
hence the brown colour and bitterness. The lowered concentration on the suspension
probably explains the off white colour; nonetheless, it remained contaminated.
As a result Chapter 3 addresses the removal of contaminants such as tannins and the
impacts of the purification process on the integrity of the final product.
Chapter 3 Purification
50
Chapter 3
Inulin purification:
Batch and Continuous column chromatography
3.1 Introduction
3.1.1 Secondary metabolites
Plants are generally susceptible to attack by insects and foraging animals and as a result
the need for defensive agents (secondary metabolites) arises. In many instances the
production of secondary metabolites, which are toxic compounds that have no nutritional
value to plants but benefit them by acting as deterrents to herbivores and insects, is not
autotoxic to plants (Mckey, 1979). The defence systems extend to cover even
microorganisms that manage to spread their infections from the locus of infection to
peripheral regions of the plant. In such cases, the pathogenic products induce genes that
are responsible for the plant’s immunity resulting in systemic acquired resistance. For
instance, in cases of fungal attack certain plant species release saponins which act by
lysing fungal membranes thus sustaining the plants existence (Meneze and Jared, 2002;
Woods, 2000).
Plant secondary metabolites are not only limited to defence and immunity but contribute
in plant reproduction by attracting pollinators through the use of compounds that enhance
the plant’s ability to display attractive colours. Flavonoids, a diverse group of secondary
metabolites, which include amongst others, flavonols, the most important of in the group,
are particularly remarkable in this regard; they are ubiquitously synthesized by all plants,
and apart from colour influences, they have been shown to play a role in protecting leaf
cells against photo-oxidative damage (Menezes and Jared, 2002; Winkel-Shirley, 2002).
The reason why humans continue consuming certain plants is largely determined by a
range of secondary metabolites that affect taste, colour and smell and they are probably
Chapter 3 Purification
51
concentration dependant (i.e. occur in mild unharmful concentrations) (Verpoorte and
Memelink, 2002).
3.1.1.1 Sesquiterpene lactones
The chicory plant has lavish green leaves which under normal circumstances should
attract herbivores, and yet the root is always free from herbivore and insect attack. This
observation is due to secondary metabolism. One of the major products of secondary
metabolism in chicory are the terpenoids, predominantly the sesquiterpene lactones
(lactucin, its p-hydroxyphenylacetic acid ester, lactupicrin, and 8-deoxylactucin) located
in the leaf and latex of the root. As a result, fresh chicory has a bitter taste to humans
(Rees and Harborne, 1985; Kisiel and Zelińska, 2001).
3.1.1.2 Tannins
Simple phenolics which are products of secondary metabolism play a major role in the
production of tannins (polyphenols) through condensation reactions. Tannins have a
variety of chemical structures, and are thus divided into hydrolysable (galloyl and
hexahydroxydiphenoyl esters and their derivatives) and proanthocyanidins (PA), known
as condensed tannins. The most detrimental effects that tannins have, is their ability to
form insoluble complexes with digestive enzymes and dietary proteins (Chavan et al.,
2001; Aerts et al., 1999). Chicory stores large amounts of condensed tannins in the
vacuole. Precursors synthesized in the cytoplasm through a series of enzymatic reactions
are channelled into the vacuole for conversion into tannins and storage (Aerts et al.,
1999; Martin and Martin, 1982).
The presence of pectic polysaccharides and inorganic non-sugars is noted as vital targets
in purification as their presence directly affects the purity of the final product (Pérez et
al., 2000; Bubnik et al., 1997). Table 3.1 illustrates some of the secondary constituents
found in the chicory plant.
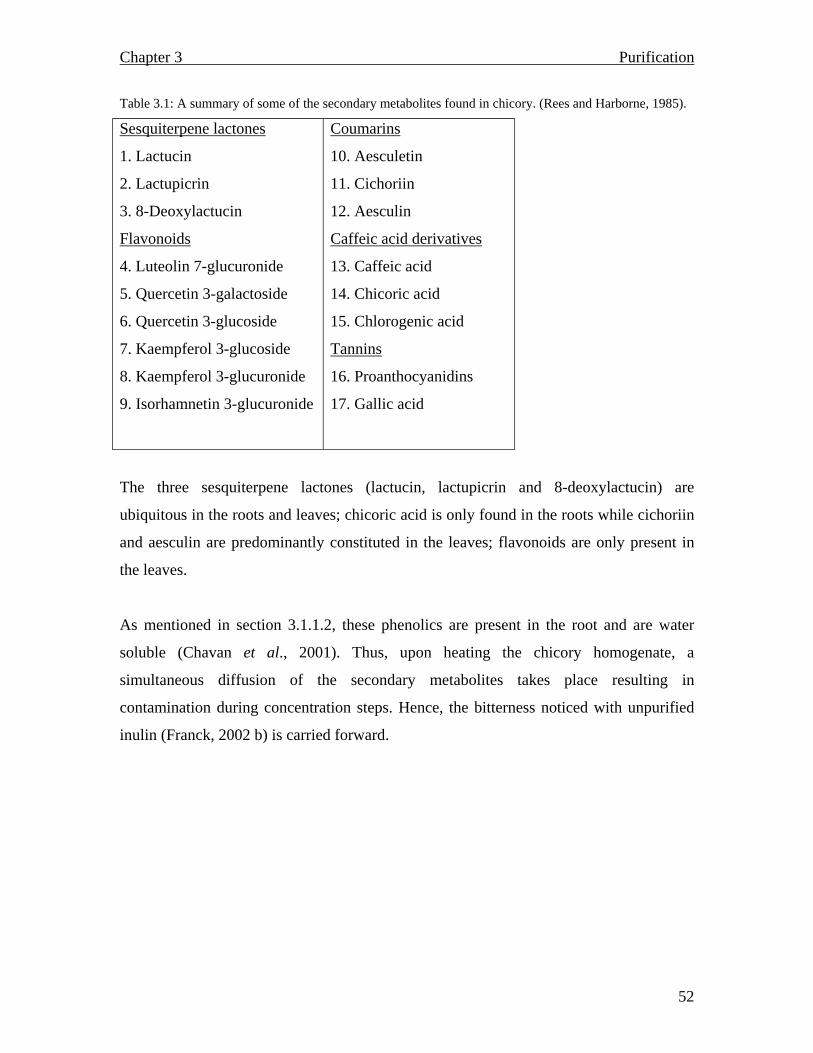
Chapter 3 Purification
52
Table 3.1: A summary of some of the secondary metabolites found in chicory. (Rees and Harborne, 1985). Sesquiterpene lactones
1. Lactucin
2. Lactupicrin
3. 8-Deoxylactucin
Flavonoids
4. Luteolin 7-glucuronide
5. Quercetin 3-galactoside
6. Quercetin 3-glucoside
7. Kaempferol 3-glucoside
8. Kaempferol 3-glucuronide
9. Isorhamnetin 3-glucuronide
Coumarins
10. Aesculetin
11. Cichoriin
12. Aesculin
Caffeic acid derivatives
13. Caffeic acid
14. Chicoric acid
15. Chlorogenic acid
Tannins
16. Proanthocyanidins
17. Gallic acid
The three sesquiterpene lactones (lactucin, lactupicrin and 8-deoxylactucin) are
ubiquitous in the roots and leaves; chicoric acid is only found in the roots while cichoriin
and aesculin are predominantly constituted in the leaves; flavonoids are only present in
the leaves.
As mentioned in section 3.1.1.2, these phenolics are present in the root and are water
soluble (Chavan et al., 2001). Thus, upon heating the chicory homogenate, a
simultaneous diffusion of the secondary metabolites takes place resulting in
contamination during concentration steps. Hence, the bitterness noticed with unpurified
inulin (Franck, 2002 b) is carried forward.
Chapter 3 Purification
53
3.1.1.3 Removal of tannins
Very few studies have focused on the removal of polyphenols from other plant
constituents destined for human consumption. Nevertheless, polyphenols have been
successfully extracted from plant material through the use of a combination of water and
solvents. For instance, Jackson et al., (1996) managed to remove condensed tannins from
the fresh leaves of Lotus pedunculatus by extracting with acetone/H2O (70:30; v/v)
containing ascorbic acid. The isolated extracts were then freeze dried and re-dissolved in
a 1:1 solution of methanol/H2O.
This method used by Jackson et al., (1996) is a standard procedure for the removal of
tannins. Removing tannins in this way, especially when the compounds of interest are not
polyphenols, tends to compromise the isolation and purification processes of inulin, in
that solvents, such as methanol and acetone have a tendency to precipitate inulin and
fructooligosaccharides. The precipitation of inulin is highly dependant on the ratio of
solvent to water. For instance, at a ratio of 2:1 (v/v), only high molecular weight
molecules are precipitated while the other molecules remain in solution. Whereas, a
solvent ratio of 3:1 (v/v) simultaneously precipitates both high and low molecular weight
fractions, while molecules made up of oligofructosaccharides remain in solution (Ku et
al., 2003). Though this may appear to be a desired approach subsequent analysis of the
product afforded inextractable compounds that failed to hydrolyse with HCl. Any follow
up study on these precipitates were inconclusive and consequently new ideas for the
removal of tannins (polyphenols) were sought.
Despite the challenges encountered in the exclusion of polyphenols from other plant
components, Wall et al., (1969) succeeded in eliminating tannins by using, caffeine, lead
acetate and polyamide (tested independently of one another). Consequently in the current
study polyamide 6 powder was used as an effective agent in the removal of tannins.
Chapter 3 Purification
54
3.1.1.4 Cationic and anionic ion exchange resins
Cationic and anionic ion exchange resins are currently being employed by the sugar cane
industry for the demineralisation and “softening” of the sugar cane syrup (Hanine et al.,
1992), which is usually followed by active carbon for decolourization. The disadvantage
of using active carbon is the fact that the desorption of sugars especially, the
monosaccharides and the dissacharides from the column requires the use of ethanol (5%)
(Putman, 1950; Franck, 2002 a). To overcome such complications appropriate ion
exchange resins such as Amberlite or Dowex have been identified by the sugar industry
for successful preliminary purification processes. The advantage of using such resins is
that, they are economical and can be used on their own for gross decolourization of
highly coloured sugar solutions (Rohm and Haas, 2002).
Thus, the objectives of this chapter were to develop and optimize purification steps, using
polyamide 6 powder (Wall et al., 1969), and ion exchange resins to demineralise and
decolourize inulin solutions, thus removing the secondary metabolites. To achieve this,
the feasibility of batch as opposed to column chromatography in the purification of inulin
was assessed.
3.1.2 Materials and Methods
3.1.2.1 Materials
Polyamide 6 powder and Dowex® 4 were supplied by Fluka. Dowex® 50 WX 8
purchased from Serva. Amberlite IR-120 (Na) was purchased from British Drug House
(BDH) and Amberlite type II ion exchange resin supplied by Rohm and Haas. Ca(OH)2;
HCl; NaOH; and Na2CO3 were of analytical grade. Magnetic stirrer by Snijders (South
Africa). Absorbances were measured using either a Shimadzu visible 160A
spectrophotometer or a helios aquamate thermospectronic (Merck South Africa (Pty)
Ltd). CO2 gas was supplied by Afrox. A peristaltic pump P-3 was supplied by Pharmacia
Fine Chemicals.
Chapter 3 Purification
55
3.1.2.2 Methods
3.1.2.2.1 Colour monitoring
In order to monitor the disappearance of colour during the purification of inulin, the λmax
of the brown colour was first determined by means of a spectrophotometric scan (200 nm
to 800 nm) on the initial filtrate obtained from the filtered chicory slurry (section 2.2.2.2).
3.1.2.2.2 Tannin monitoring
The Folin-Dennis assay (Martin and Martin, 1982) was used to quantify the tannins and
their concentration was monitored by a standard curve (Appendix 3).
3.1.2.2.3 Carbonation
All the purification steps were carried out before inulin crystallization. The bulk of the
non sugars were removed through carbonation reactions (Vandamme and Derycke,
1983), where 0.1 M Ca(OH)2 (70 ml) was added to the chicory homogenate (section
2.2.2.3.3), immediately after heating for 1 hour at 70 °C and CO2 gas bubbled through the
solution at different time intervals, from 0 to 50 minutes. The resulting precipitate was
filtered off and the absorbance at 484 nm and pH of the supernatant taken at 10 minute
intervals. This supernatant was monitored for tannins. As a control, the absorbance and
pH of untreated chicory homogenate was measured.
Chapter 3 Purification
56
3.1.2.2.4 Ion exchange: Batch purification
The chicory homogenate (section 2.2.2.2) was divided into 6 portions (50 ml each), and
Dowex 50 WX 8 cation exchanger (previously regenerated and equilibrated in a
minimum amount of distilled water) between 10 g and 60 g added to each beaker. The
beakers were then stirred for 1 hour and the absorbances measured at 484 nm. The
absorbance of the untreated homogenate was used as a control. The above procedure was
repeated using Dowex 4 anion exchanger.
3.1.2.2.5 Polyamide 6
Polyamide 6 powder, (10g to 60g) was added into six different 100 ml beakers and
immersed in distilled water. The distilled water was decanted (removing the fine
particles) and chicory homogenate (30 ml) (section 2.2.2.2) added to each beaker and
after stirring (1 hour) the colour and tannin concentration was measured. The chicory
homogenate which had not been treated with polyamide 6 powder was assayed for
tannins, and colour monitored to assess the efficiency of polyamide 6 powder.
3.1.2.3 Tandem (continuous) purification
3.1.2.3.1 Batch purification
Chicory homogenate (100 ml) was treated successively with carbonation (Ca(OH)2 and
CO2 gas) according to section 3.1.2.2.3, filtered, then with polyamide 6 (60 g), filtered
and ultimately treated with cation and anion exchangers (50 g) respectively.
3.1.2.3.2 Column purification
The cation exchange resin was regenerated by suspending in NaOH (100 ml; 0.5 M) and
stirred for 30 minutes. The resin was allowed to settle, the NaOH decanted and washed
with dH2O (7 x). The resin was then re-suspended in HCl (100 ml; 0.5 M) and stirred for
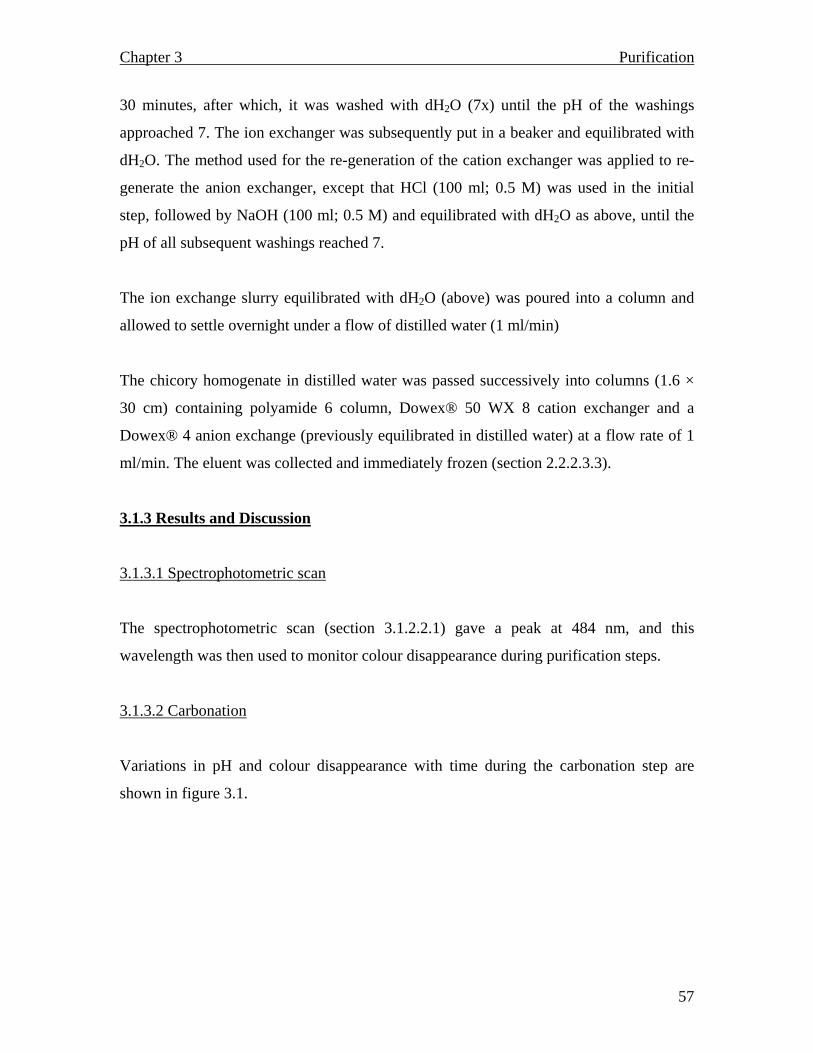
Chapter 3 Purification
57
30 minutes, after which, it was washed with dH2O (7x) until the pH of the washings
approached 7. The ion exchanger was subsequently put in a beaker and equilibrated with
dH2O. The method used for the re-generation of the cation exchanger was applied to re-
generate the anion exchanger, except that HCl (100 ml; 0.5 M) was used in the initial
step, followed by NaOH (100 ml; 0.5 M) and equilibrated with dH2O as above, until the
pH of all subsequent washings reached 7.
The ion exchange slurry equilibrated with dH2O (above) was poured into a column and
allowed to settle overnight under a flow of distilled water (1 ml/min)
The chicory homogenate in distilled water was passed successively into columns (1.6 ×
30 cm) containing polyamide 6 column, Dowex® 50 WX 8 cation exchanger and a
Dowex® 4 anion exchange (previously equilibrated in distilled water) at a flow rate of 1
ml/min. The eluent was collected and immediately frozen (section 2.2.2.3.3).
3.1.3 Results and Discussion
3.1.3.1 Spectrophotometric scan
The spectrophotometric scan (section 3.1.2.2.1) gave a peak at 484 nm, and this
wavelength was then used to monitor colour disappearance during purification steps.
3.1.3.2 Carbonation
Variations in pH and colour disappearance with time during the carbonation step are
shown in figure 3.1.
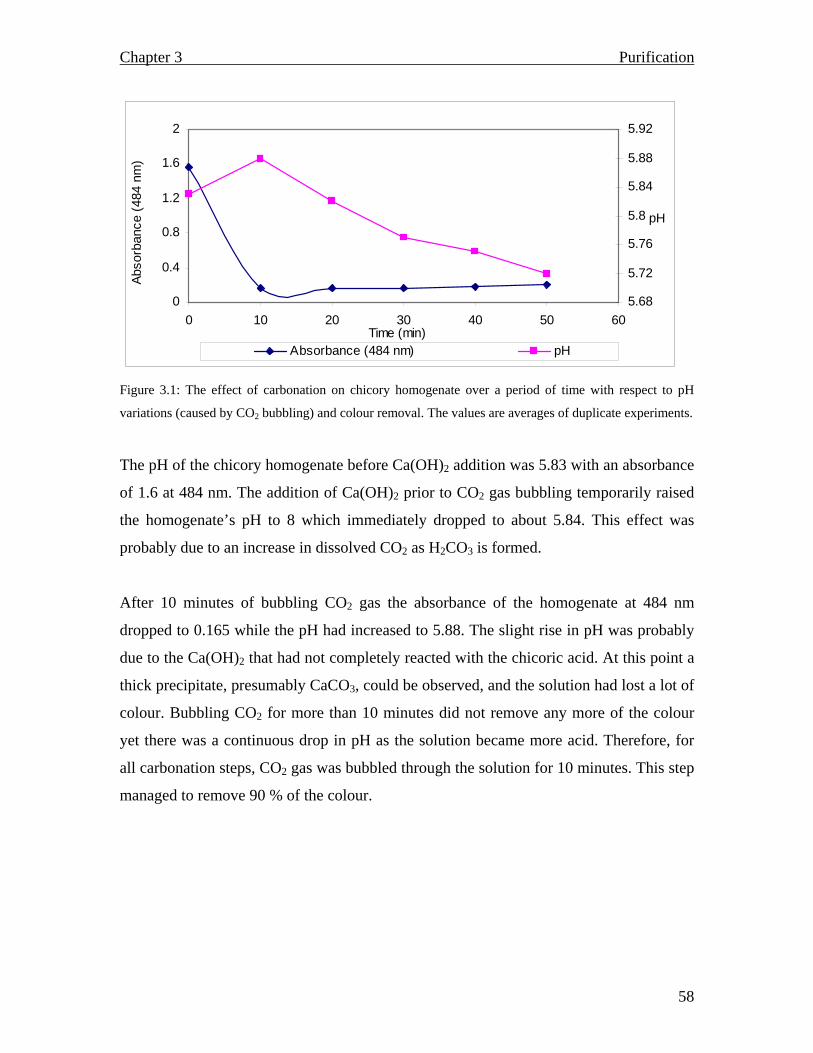
Chapter 3 Purification
58
0
0.4
0.8
1.2
1.6
2
0 10 20 30 40 50 60Time (min)
Abso
rban
ce (4
84 n
m)
5.68
5.72
5.76
5.8
5.84
5.88
5.92
pH
Absorbance (484 nm) pH
Figure 3.1: The effect of carbonation on chicory homogenate over a period of time with respect to pH
variations (caused by CO2 bubbling) and colour removal. The values are averages of duplicate experiments.
The pH of the chicory homogenate before Ca(OH)2 addition was 5.83 with an absorbance
of 1.6 at 484 nm. The addition of Ca(OH)2 prior to CO2 gas bubbling temporarily raised
the homogenate’s pH to 8 which immediately dropped to about 5.84. This effect was
probably due to an increase in dissolved CO2 as H2CO3 is formed.
After 10 minutes of bubbling CO2 gas the absorbance of the homogenate at 484 nm
dropped to 0.165 while the pH had increased to 5.88. The slight rise in pH was probably
due to the Ca(OH)2 that had not completely reacted with the chicoric acid. At this point a
thick precipitate, presumably CaCO3, could be observed, and the solution had lost a lot of
colour. Bubbling CO2 for more than 10 minutes did not remove any more of the colour
yet there was a continuous drop in pH as the solution became more acid. Therefore, for
all carbonation steps, CO2 gas was bubbled through the solution for 10 minutes. This step
managed to remove 90 % of the colour.
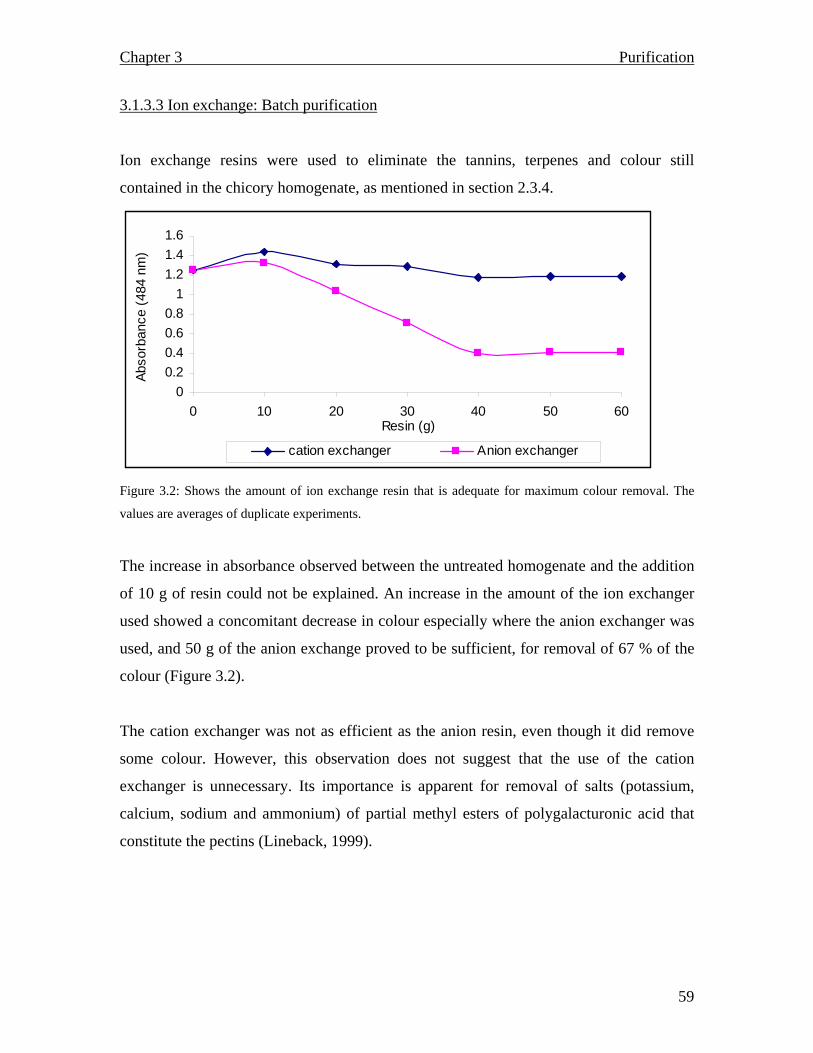
Chapter 3 Purification
59
3.1.3.3 Ion exchange: Batch purification
Ion exchange resins were used to eliminate the tannins, terpenes and colour still
contained in the chicory homogenate, as mentioned in section 2.3.4.
00.20.40.60.8
11.21.41.6
0 10 20 30 40 50 60Resin (g)
Abso
rban
ce (4
84 n
m)
cation exchanger Anion exchanger
Figure 3.2: Shows the amount of ion exchange resin that is adequate for maximum colour removal. The
values are averages of duplicate experiments.
The increase in absorbance observed between the untreated homogenate and the addition
of 10 g of resin could not be explained. An increase in the amount of the ion exchanger
used showed a concomitant decrease in colour especially where the anion exchanger was
used, and 50 g of the anion exchange proved to be sufficient, for removal of 67 % of the
colour (Figure 3.2).
The cation exchanger was not as efficient as the anion resin, even though it did remove
some colour. However, this observation does not suggest that the use of the cation
exchanger is unnecessary. Its importance is apparent for removal of salts (potassium,
calcium, sodium and ammonium) of partial methyl esters of polygalacturonic acid that
constitute the pectins (Lineback, 1999).
Chapter 3 Purification
60
3.1.3.4 Polyamide 6
Polyamide 6 is a selective adsorbent that binds tannins irreversibly (Wall et al., 1969).
Tannin removal by polyamide 6 proved to be weight dependant, 60 g polyamide 6
powder removed 92 % tannins as compared to 10 g which removed 53 % (Figure 3.3).
0
15
30
45
60
75
0 10 20 30 40 50 60 70Polyamide (g)
Tann
in c
onc.
(mg/
ml)
0
0.5
1
1.5
2
2.5
3
3.5
Abso
rban
ce (4
84 n
m)
Tannin conc. (mg/ml) Abs. (484 nm)
Figure 3.3: Polyamide 6 optimization and its effect on tannin concentration and discolouration. The values
are averages of duplicate experiments.
Apart from tannin removal, polyamide 6 exhibited a tendency to remove colour as well,
60 g polyamide managed to remove 63.6 % of the colour as compared to 21.2 %
observed with 10 g polyamide 6.
3.1.4 Tandem (continuous) process
The previous section (3.1.3) discussed discontinuous individual processes for
purification. In order to explore commercial industrial extraction and purification
attempts were now focussed on a continuous process.
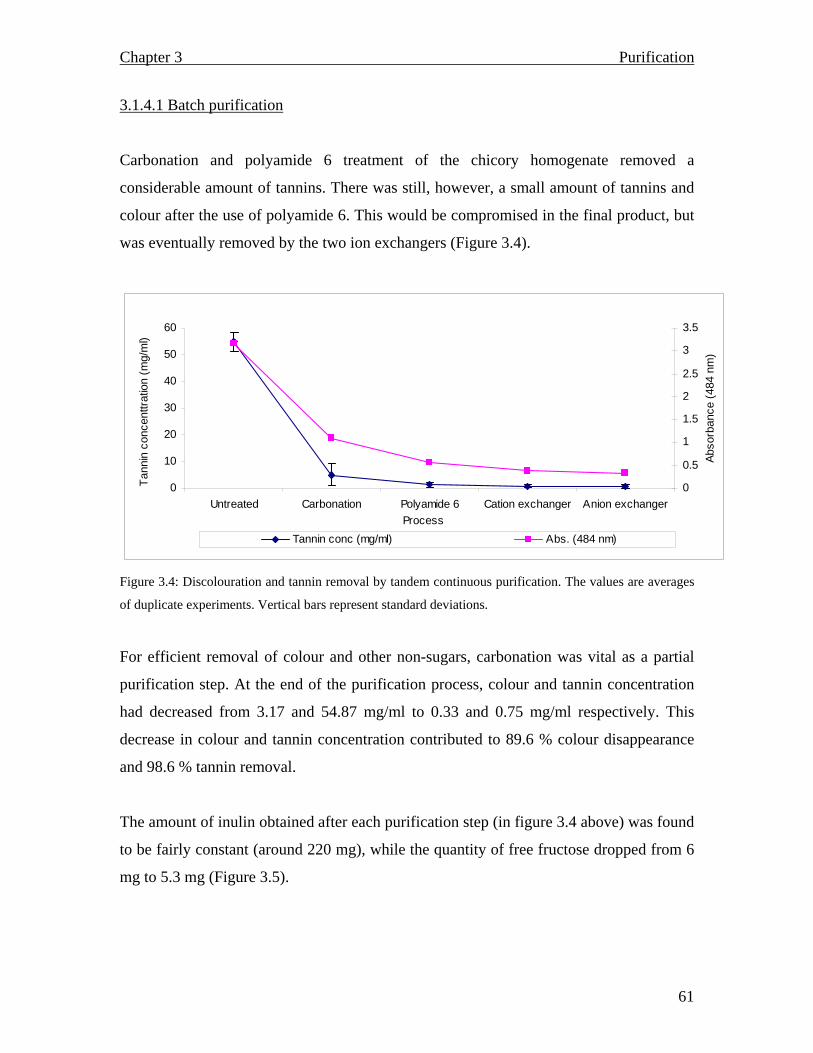
Chapter 3 Purification
61
3.1.4.1 Batch purification
Carbonation and polyamide 6 treatment of the chicory homogenate removed a
considerable amount of tannins. There was still, however, a small amount of tannins and
colour after the use of polyamide 6. This would be compromised in the final product, but
was eventually removed by the two ion exchangers (Figure 3.4).
0
10
20
30
40
50
60
Untreated Carbonation Polyamide 6 Cation exchanger Anion exchangerProcess
Tann
in c
once
nttra
tion
(mg/
ml)
0
0.5
1
1.5
2
2.5
3
3.5
Abso
rban
ce (4
84 n
m)
Tannin conc (mg/ml) Abs. (484 nm)
Figure 3.4: Discolouration and tannin removal by tandem continuous purification. The values are averages
of duplicate experiments. Vertical bars represent standard deviations.
For efficient removal of colour and other non-sugars, carbonation was vital as a partial
purification step. At the end of the purification process, colour and tannin concentration
had decreased from 3.17 and 54.87 mg/ml to 0.33 and 0.75 mg/ml respectively. This
decrease in colour and tannin concentration contributed to 89.6 % colour disappearance
and 98.6 % tannin removal.
The amount of inulin obtained after each purification step (in figure 3.4 above) was found
to be fairly constant (around 220 mg), while the quantity of free fructose dropped from 6
mg to 5.3 mg (Figure 3.5).
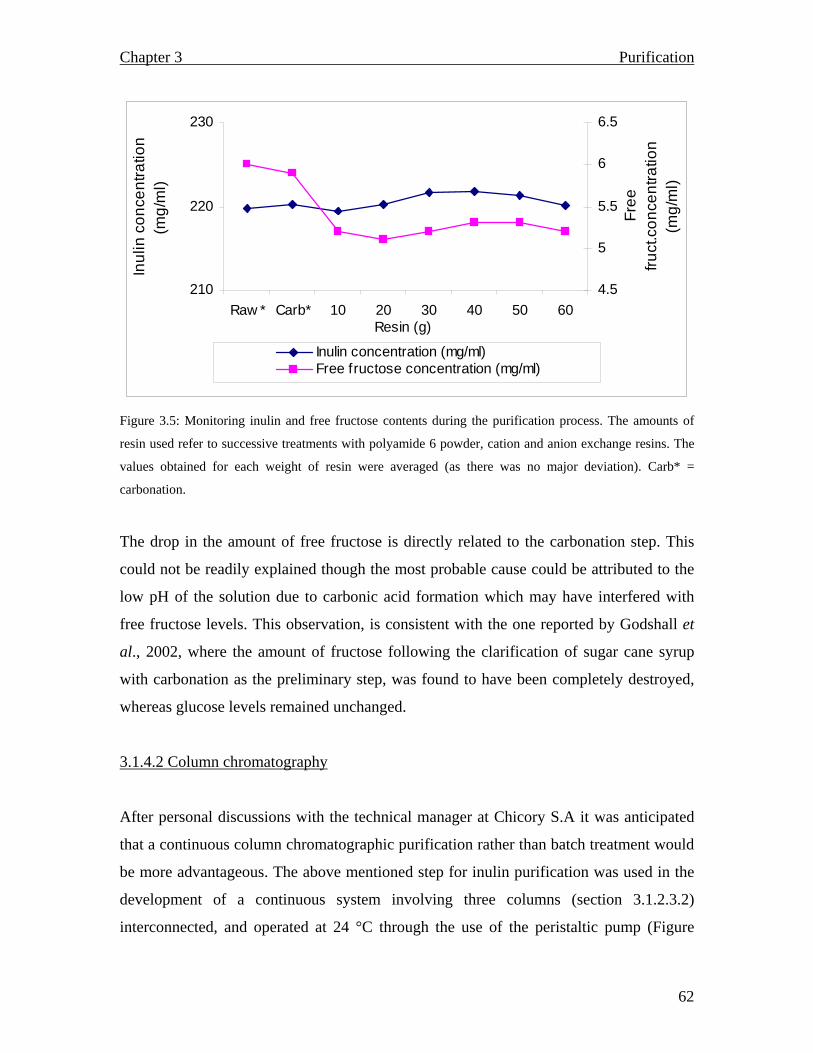
Chapter 3 Purification
62
210
220
230
Raw * Carb* 10 20 30 40 50 60Resin (g)
Inul
in c
once
ntra
tion
(mg/
ml)
4.5
5
5.5
6
6.5
Free
fru
ct.c
once
ntra
tion
(mg/
ml)
Inulin concentration (mg/ml)Free fructose concentration (mg/ml)
Figure 3.5: Monitoring inulin and free fructose contents during the purification process. The amounts of
resin used refer to successive treatments with polyamide 6 powder, cation and anion exchange resins. The
values obtained for each weight of resin were averaged (as there was no major deviation). Carb* =
carbonation.
The drop in the amount of free fructose is directly related to the carbonation step. This
could not be readily explained though the most probable cause could be attributed to the
low pH of the solution due to carbonic acid formation which may have interfered with
free fructose levels. This observation, is consistent with the one reported by Godshall et
al., 2002, where the amount of fructose following the clarification of sugar cane syrup
with carbonation as the preliminary step, was found to have been completely destroyed,
whereas glucose levels remained unchanged.
3.1.4.2 Column chromatography
After personal discussions with the technical manager at Chicory S.A it was anticipated
that a continuous column chromatographic purification rather than batch treatment would
be more advantageous. The above mentioned step for inulin purification was used in the
development of a continuous system involving three columns (section 3.1.2.3.2)
interconnected, and operated at 24 °C through the use of the peristaltic pump (Figure
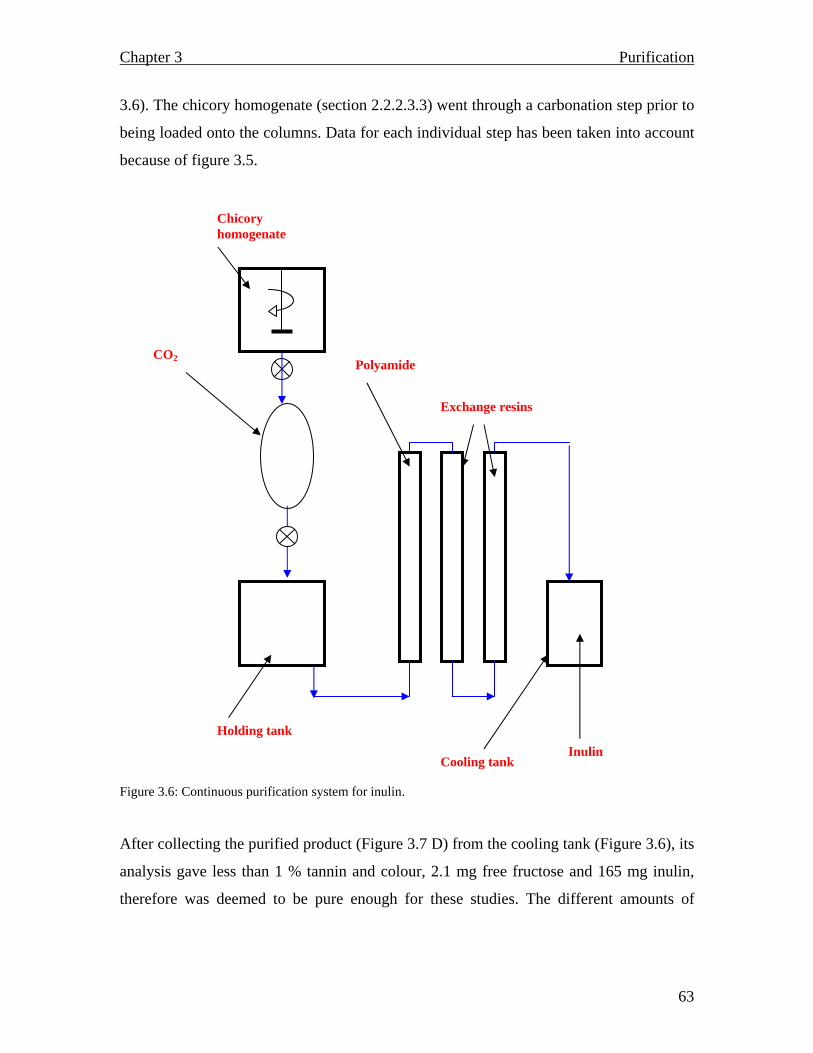
Chapter 3 Purification
63
3.6). The chicory homogenate (section 2.2.2.3.3) went through a carbonation step prior to
being loaded onto the columns. Data for each individual step has been taken into account
because of figure 3.5.
Figure 3.6: Continuous purification system for inulin.
After collecting the purified product (Figure 3.7 D) from the cooling tank (Figure 3.6), its
analysis gave less than 1 % tannin and colour, 2.1 mg free fructose and 165 mg inulin,
therefore was deemed to be pure enough for these studies. The different amounts of
Cooling tank
Chicory homogenate
Exchange resins
Inulin
Polyamide
Holding tank
CO2
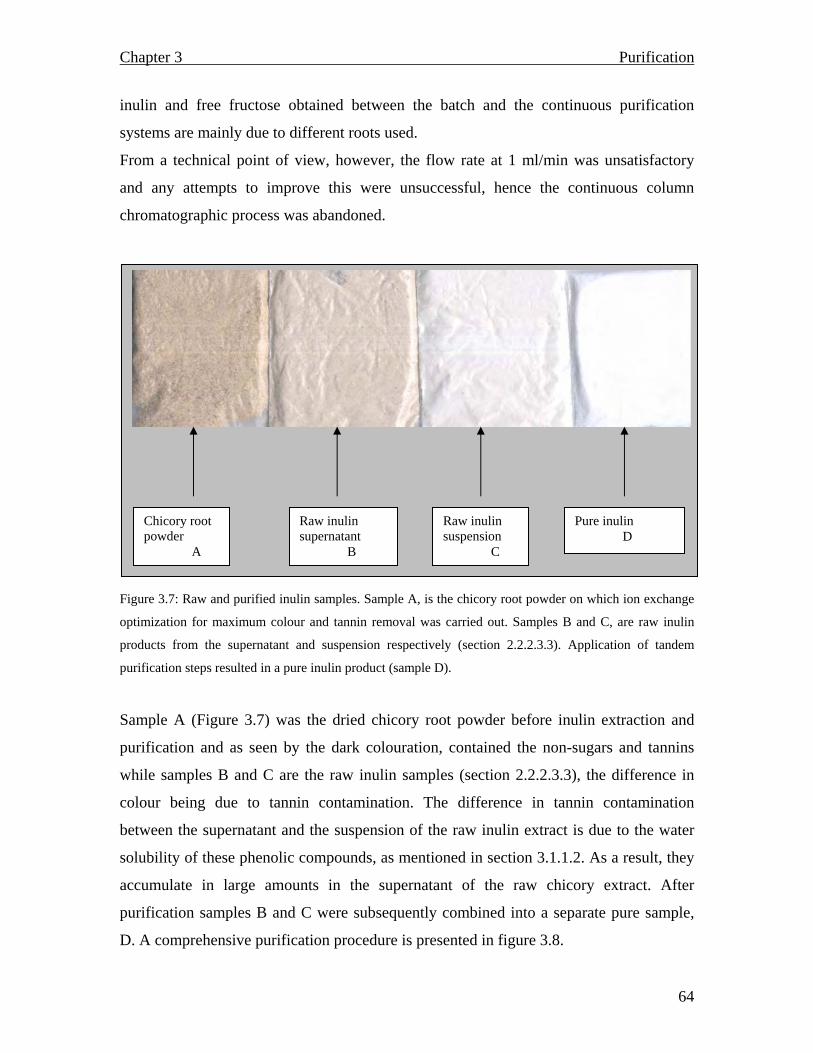
Chapter 3 Purification
64
inulin and free fructose obtained between the batch and the continuous purification
systems are mainly due to different roots used.
From a technical point of view, however, the flow rate at 1 ml/min was unsatisfactory
and any attempts to improve this were unsuccessful, hence the continuous column
chromatographic process was abandoned.
Figure 3.7: Raw and purified inulin samples. Sample A, is the chicory root powder on which ion exchange
optimization for maximum colour and tannin removal was carried out. Samples B and C, are raw inulin
products from the supernatant and suspension respectively (section 2.2.2.3.3). Application of tandem
purification steps resulted in a pure inulin product (sample D).
Sample A (Figure 3.7) was the dried chicory root powder before inulin extraction and
purification and as seen by the dark colouration, contained the non-sugars and tannins
while samples B and C are the raw inulin samples (section 2.2.2.3.3), the difference in
colour being due to tannin contamination. The difference in tannin contamination
between the supernatant and the suspension of the raw inulin extract is due to the water
solubility of these phenolic compounds, as mentioned in section 3.1.1.2. As a result, they
accumulate in large amounts in the supernatant of the raw chicory extract. After
purification samples B and C were subsequently combined into a separate pure sample,
D. A comprehensive purification procedure is presented in figure 3.8.
Chicory root powder A
Raw inulin supernatant B
Raw inulin suspension C
Pure inulin D
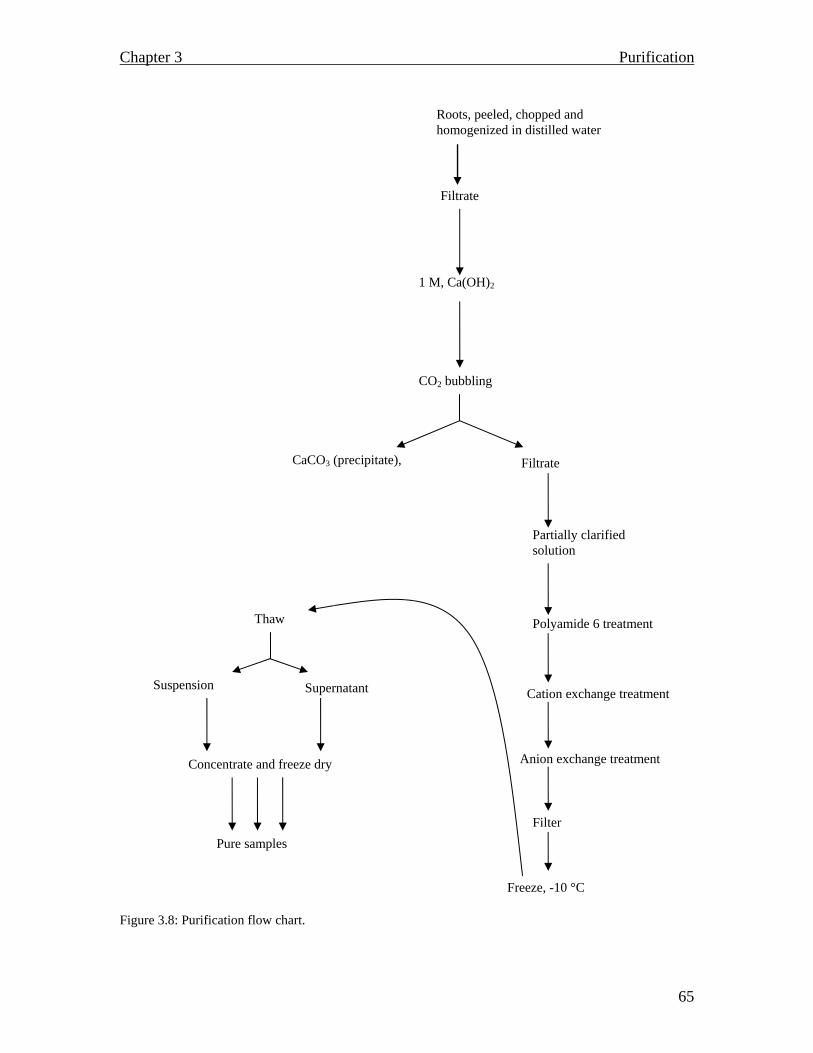
Chapter 3 Purification
65
Figure 3.8: Purification flow chart.
1 M, Ca(OH)2
Filtrate
CO2 bubbling
CaCO3 (precipitate), Filtrate
Partially clarified solution
Polyamide 6 treatment
Cation exchange treatment
Anion exchange treatment
Filter
Freeze, -10 °C
Thaw
Suspension Supernatant
Concentrate and freeze dry
Pure samples
Roots, peeled, chopped and homogenized in distilled water
Chapter 3 Purification
66
3.1.5 Summary
For an efficient purification process, the chicory homogenate had to be processed
immediately after preparation as there seemed to be fermentation and fungal growth
when it was left unattended for more than 12 hours. Storing in cold temperatures as a
preventative measure for fermentation, proved to be a counterproductive alternative, as
the inulin from the chicory homogenate precipitated in its raw form.
For efficient purification of the chicory homogenate carbonation was an important step in
that it removed most of the non sugars and colour which would not have been effectively
removed by the other purification steps. As a preliminary decontaminating process,
carbonation resulted in 90 % colour removal and 90.7 % tannin elimination. The ion
exchange resins, particularly the anion exchanger, managed to remove 67 % of the colour
from the chicory homogenate with slight tannin removal, whilst polyamide 6 powder
removed 63.6 % of the colour and 92 % tannins. Subsequent linkage of the procedures
for a continuous purification process resulted in 89 % colour and 98.6 % tannin removal.
As these studies were carried out towards the establishment of a commercial industrial
process for inulin purification, factors such as high sugar recovery, product consistency
and time management had to be considered. These factors would in turn determine the
purification procedure to be adopted. In as far as sugar recovery and product consistency
were concerned, batch and continuous column purification of the chicory homogenate
were comparable and no major differences in inulin contents were noted, except where
different roots were used. Tannins and colour were effectively removed by both
processes.
The continuous column purification process operated efficiently at 1 ml/min and efforts
to improve the flow rate were unsuccessful, and since one of the factors mentioned above
(time management) was not fulfilled, the process was thus abandoned.
Chapter 3 Purification
67
Polyamide 6 powder was effective in removing tannins and most of all, colour. It was not
always possible, however, to regenerate it. In most instances it turned yellow and had a
foul smell. Regeneration involved treating the powder consecutively with water, 50 %
methanol, absolute methanol and 5 % acetic acid. (Wall et al., 1969).
At this stage the polymeric distribution of the pure inulin isolate was unknown, and
therefore characterization procedures had to be undertaken. These differentiations are
dealt with in the next chapter.
Chapter 4 Characterization
68
Chapter 4
Inulin and Fructooligosaccharide characterization
4.1 Introduction
4.1.1 Carbohydrate analysis
Carbohydrates are both the most abundant and structurally complex biopolymers found in
nature. Proteins and nucleic acids are naturally available, however, they lack structural
diversity, such as branched configurations, found in oligo and polymeric carbohydrates.
For instance, simple hexasaccharides can exist in 1.05 × 10¹² possible isomeric structures.
This structural diversity creates difficulties in carbohydrate analysis, thus requiring more
than one analytical technique for complete polymeric resolution (Harvey, 1999).
Various methods for the analysis of carbohydrates exist. These include high performance
liquid chromatography (HPLC), high pressure anion exchange chromatography with
pulsed amperometric detector (HPAEC-PAD), thin layer chromatography (TLC), gel
electrophoresis (especially fluorophore-assisted carbohydrate electrophoresis, FACE),
chromatographic techniques (gel filtration), mass spectrometry and static light scattering.
Although powerful, these techniques have inherent draw backs that may compromise
polymeric structural integrity, and can only be utilized in the analysis of a limited range
of compounds. Moreover, some techniques have stringent requirements in that the
analyte needs to be in its pure state before it can be analysed (Schiller and Arnold, 2000;
O’Shea et al., 1998; Wolff et al., 2000).
Complex carbohydrate analysis has recently been simplified by adopting analytical
techniques such as the matrix assisted laser desorption ionization time of flight mass
spectrometry (MALDI TOF) which was primarily developed for molecules with large
molecular weights, particularly proteins (Harvey, 1999).
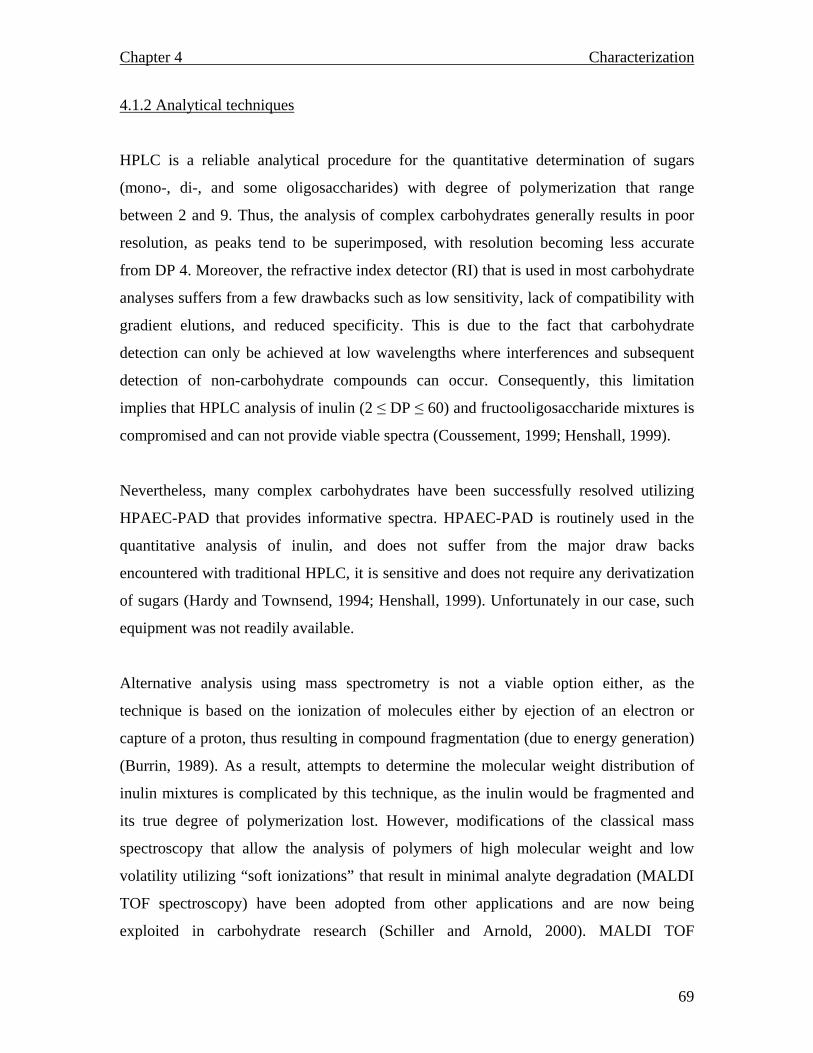
Chapter 4 Characterization
69
4.1.2 Analytical techniques
HPLC is a reliable analytical procedure for the quantitative determination of sugars
(mono-, di-, and some oligosaccharides) with degree of polymerization that range
between 2 and 9. Thus, the analysis of complex carbohydrates generally results in poor
resolution, as peaks tend to be superimposed, with resolution becoming less accurate
from DP 4. Moreover, the refractive index detector (RI) that is used in most carbohydrate
analyses suffers from a few drawbacks such as low sensitivity, lack of compatibility with
gradient elutions, and reduced specificity. This is due to the fact that carbohydrate
detection can only be achieved at low wavelengths where interferences and subsequent
detection of non-carbohydrate compounds can occur. Consequently, this limitation
implies that HPLC analysis of inulin (2 ≤ DP ≤ 60) and fructooligosaccharide mixtures is
compromised and can not provide viable spectra (Coussement, 1999; Henshall, 1999).
Nevertheless, many complex carbohydrates have been successfully resolved utilizing
HPAEC-PAD that provides informative spectra. HPAEC-PAD is routinely used in the
quantitative analysis of inulin, and does not suffer from the major draw backs
encountered with traditional HPLC, it is sensitive and does not require any derivatization
of sugars (Hardy and Townsend, 1994; Henshall, 1999). Unfortunately in our case, such
equipment was not readily available.
Alternative analysis using mass spectrometry is not a viable option either, as the
technique is based on the ionization of molecules either by ejection of an electron or
capture of a proton, thus resulting in compound fragmentation (due to energy generation)
(Burrin, 1989). As a result, attempts to determine the molecular weight distribution of
inulin mixtures is complicated by this technique, as the inulin would be fragmented and
its true degree of polymerization lost. However, modifications of the classical mass
spectroscopy that allow the analysis of polymers of high molecular weight and low
volatility utilizing “soft ionizations” that result in minimal analyte degradation (MALDI
TOF spectroscopy) have been adopted from other applications and are now being
exploited in carbohydrate research (Schiller and Arnold, 2000). MALDI TOF
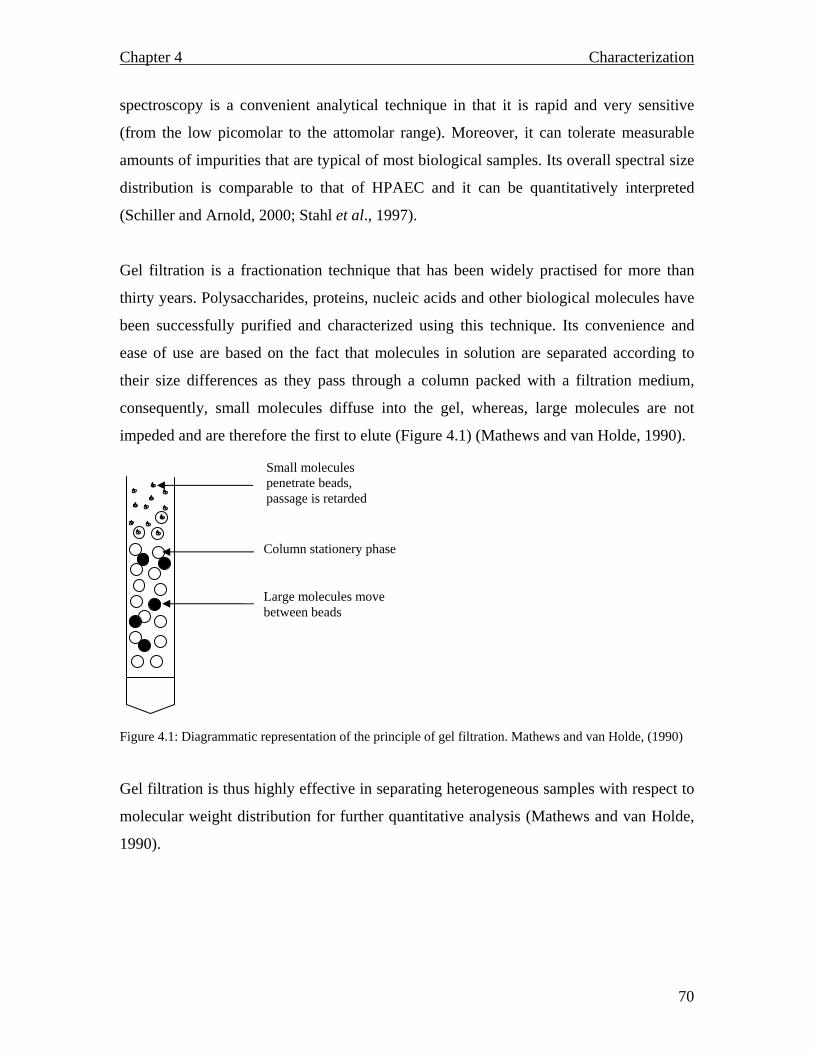
Chapter 4 Characterization
70
spectroscopy is a convenient analytical technique in that it is rapid and very sensitive
(from the low picomolar to the attomolar range). Moreover, it can tolerate measurable
amounts of impurities that are typical of most biological samples. Its overall spectral size
distribution is comparable to that of HPAEC and it can be quantitatively interpreted
(Schiller and Arnold, 2000; Stahl et al., 1997).
Gel filtration is a fractionation technique that has been widely practised for more than
thirty years. Polysaccharides, proteins, nucleic acids and other biological molecules have
been successfully purified and characterized using this technique. Its convenience and
ease of use are based on the fact that molecules in solution are separated according to
their size differences as they pass through a column packed with a filtration medium,
consequently, small molecules diffuse into the gel, whereas, large molecules are not
impeded and are therefore the first to elute (Figure 4.1) (Mathews and van Holde, 1990).
Figure 4.1: Diagrammatic representation of the principle of gel filtration. Mathews and van Holde, (1990)
Gel filtration is thus highly effective in separating heterogeneous samples with respect to
molecular weight distribution for further quantitative analysis (Mathews and van Holde,
1990).
Small molecules penetrate beads, passage is retarded
Column stationery phase
Large molecules move between beads
Chapter 4 Characterization
71
Polyacrylamide gel electrophoresis (PAGE) is the standard and ubiquitous method for the
separation of large molecules such as proteins and for DNA sequencing. Recently,
glycobiologists have been modifying and using the technique (FACE) for the separation
of carbohydrates. However, complete and efficient separation of sugars requires that
saccharides containing a reducing end be derivatized prior to electrophoresis (Jackson,
1994).
The principle behind this technique involves the reaction of a reducing terminus of a
saccharide with a flourophore, 8-aminonaphthalene-1.3.6-trisulfonic acid (ANTS) (Figure
4.2) that contains a primary amino group. The carbonyl carbon then forms a Schiff base
with the primary amino group and the bond formed is stabilized to a secondary amine
using cyanoborohydride. Apart from conferring fluorescence, for detection, ANTS
imparts a net negative charge, through its three sulfonic acid groups, that allows both
acidic and neutral saccharides to be electrophoresed and consequently characterized using
appropriate markers (O’Shea et al., 1998; Jackson, 1994).
Figure 4.2: Structural formula of 8-aminonaphthalene-1.3.6-trisulfonate (ANTS). Jackson (1994)
4.1.3 Materials and Methods
4.1.3.1 Materials
TLC aluminium sheets (silica gel 60) were purchased from Merck (South Africa (Pty)
Ltd). Cyanoborohydride, Dimethylsulphoxide (DMSO), anisaldehyde spray reagent,
Sephadex G-50, α-cyclodextrin hydrate, γ-cyclodextrin hydrate, maltoheptaose hydrate,
maltopentaose hydrate, maltotriose hydrate and stachyose tetrahydrate were purchased
SO3 - - O3S
SO3 - NH2
Chapter 4 Characterization
72
from Sigma-Aldrich (South Africa (Pty) Ltd). ANTS was purchased from Merck (South
Africa (Pty) Ltd)
4.1.3.2 Methods
4.1.3.2.1 Gel filtration on Sephadex G-50
Inulin purified in section 3.1.2.3 was a mixture of fructooligosaccharides and highly
polymerized sugars. The sample was run on a Sephadex G-50 column for further
application and development on the TLC plate. Purified inulin (0.5 g) was dissolved in
dimethylsulphoxide (5 ml) and the sample applied onto a Sephadex G-50 column (1.4 ×
63 cm). The column was eluted with distilled water and fractions collected (4 ml) at a
flow rate of 0.17 ml/min. The fractions were assayed for free fructose and then
hydrolyzed (section 2.2.2.3) for inulin quantification. Fructose was determined by the
Somogyi-Nelson method (section 2.2.2.1) using a standard curve (Appendix 1). Fractions
constituting respective peaks were pooled.
4.1.3.2.2 Gel electrophoresis of fluorophore labelled inulin
The inulin samples (1.5 ml) to be derivatized were dried in a microcentrifuge. ANTS (5
µl), prepared in 0.15 M acetic acid-water solution (3:17, v/v) and cyanoborohydride (5
µl, 1 M), prepared in DMSO, were added and the solution mixed. The mixtures were
incubated for 16 hours (37 °C) and then dried in a centrifugal vacuum evaporator (CVE)
for 1 hour and heated (35 °C) to vaporize the DMSO.
4.1.3.2.3 SDS PAGE
The molecular weights of the fluorophore labelled inulin were determined by SDS PAGE
according to the method of Laemmli (1970). The inulin samples (10 µl), together with α-
cyclodextrin hydrate, γ-cyclodextrin hydrate, maltoheptaose hydrate, maltopentaose
hydrate, maltotriose hydrate, as molecular weight markers (10 µl) were electrophoresed
Chapter 4 Characterization
73
on 10 % SDS PAGE at a current of 15 mA (constant) for 1 hour, and increased to 30 mA
(constant) for 2 hours. At the end of the electrophoresis the gels were viewed under UV
light at 254 nm.
4.1.3.2.4 Thin layer chromatography
Sephadex G-50 fractions and reference mixtures (10 µl) of fructose, α-cyclodextrin
hydrate, γ-cyclodextrin hydrate, maltoheptaose hydrate, maltopentaose hydrate and
maltotriose hydrate were micropipetted onto TLC aluminium sheets (silica gel 60), and
gently blown with a hair drier until the spots could not be seen. The plates were
developed in two different consecutive glass tanks, the first containing n-butanol, acetic
acid, H2O, 2: 1: 1 and n-butanol, acetic acid, diethyl ether, H2O, 9: 6: 4: 1, respectively
for 1 hour in each tank. The plates were dried in a fume hood and incubated in an oven at
100 °C for 10 minutes. Migrated spots were detected by spraying the plates with
anisaldehyde reagent.
4.1.3.2.5 MALDI TOF spectrometry
Inulin sample (10 µl) (from 1 mg/ml stock solution) was mixed with a saturated 10 µl
MALDI TOF matrix (2.5-dihydroxybenzoic acid (DBH)) in 60 % acetonitrile/30 % water
and 3 % triflouroacetic acid. The inulin-DBH mixture (2 µl) was then applied to a
MALDI P100 gold sample plate and allowed to crystalize under a gentle stream of air.
The plate was inserted (after confirming crystal formation by light microscopy) into a
Perseptive Biosystems Voyager DE-PRO Biospectrometry Workstation that possessed
Delayed Extraction Technology. Sample analysis was then carried out utilizing the preset
method HCD1002 in the positive ion mode, which had an accelerating voltage of 20 kV,
grid voltage of 94 %, Guide Wire Voltage of 0.05 %, delayed extraction at 400 ns and
laser intensity of approximately 200 2500. Spectra were captured using Perseptive
Grams/32 (R) v.4.14 level II.
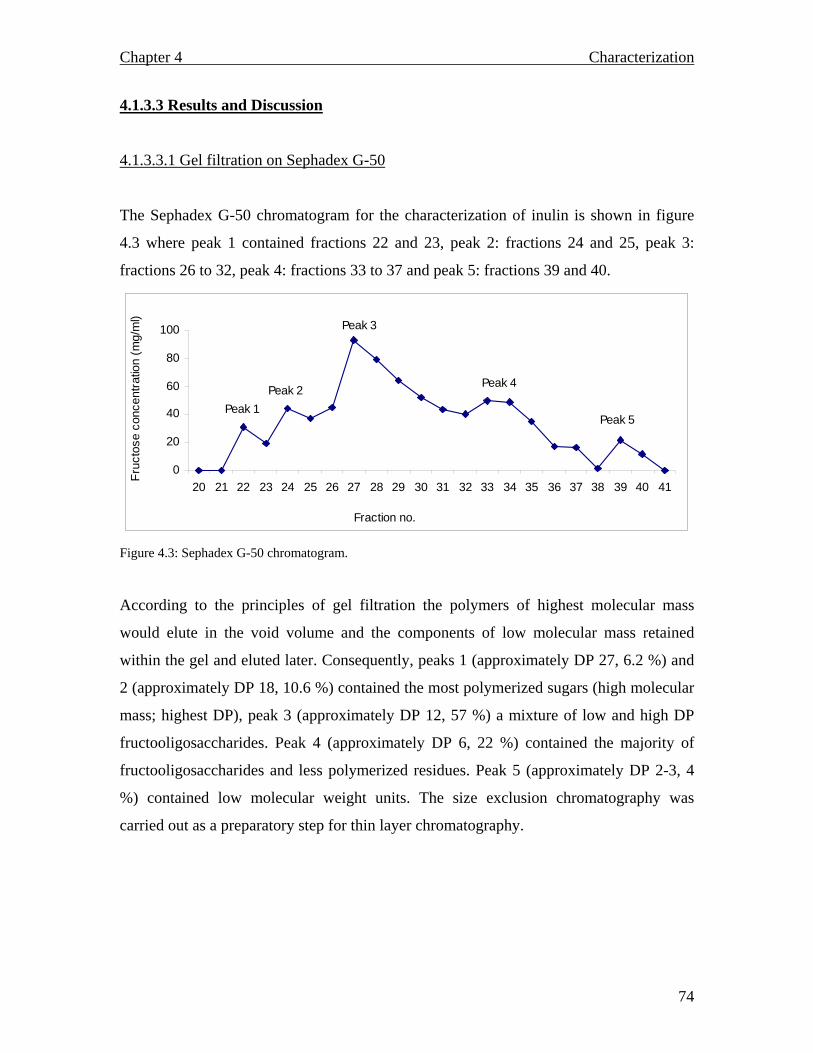
Chapter 4 Characterization
74
4.1.3.3 Results and Discussion
4.1.3.3.1 Gel filtration on Sephadex G-50
The Sephadex G-50 chromatogram for the characterization of inulin is shown in figure
4.3 where peak 1 contained fractions 22 and 23, peak 2: fractions 24 and 25, peak 3:
fractions 26 to 32, peak 4: fractions 33 to 37 and peak 5: fractions 39 and 40.
0
20
40
60
80
100
20 21 22 23 24 25 26 27 28 29 30 31 32 33 34 35 36 37 38 39 40 41
Fraction no.
Fruc
tose
con
cent
ratio
n (m
g/m
l)
Peak 1Peak 5
Peak 4
Peak 3
Peak 2
Figure 4.3: Sephadex G-50 chromatogram.
According to the principles of gel filtration the polymers of highest molecular mass
would elute in the void volume and the components of low molecular mass retained
within the gel and eluted later. Consequently, peaks 1 (approximately DP 27, 6.2 %) and
2 (approximately DP 18, 10.6 %) contained the most polymerized sugars (high molecular
mass; highest DP), peak 3 (approximately DP 12, 57 %) a mixture of low and high DP
fructooligosaccharides. Peak 4 (approximately DP 6, 22 %) contained the majority of
fructooligosaccharides and less polymerized residues. Peak 5 (approximately DP 2-3, 4
%) contained low molecular weight units. The size exclusion chromatography was
carried out as a preparatory step for thin layer chromatography.
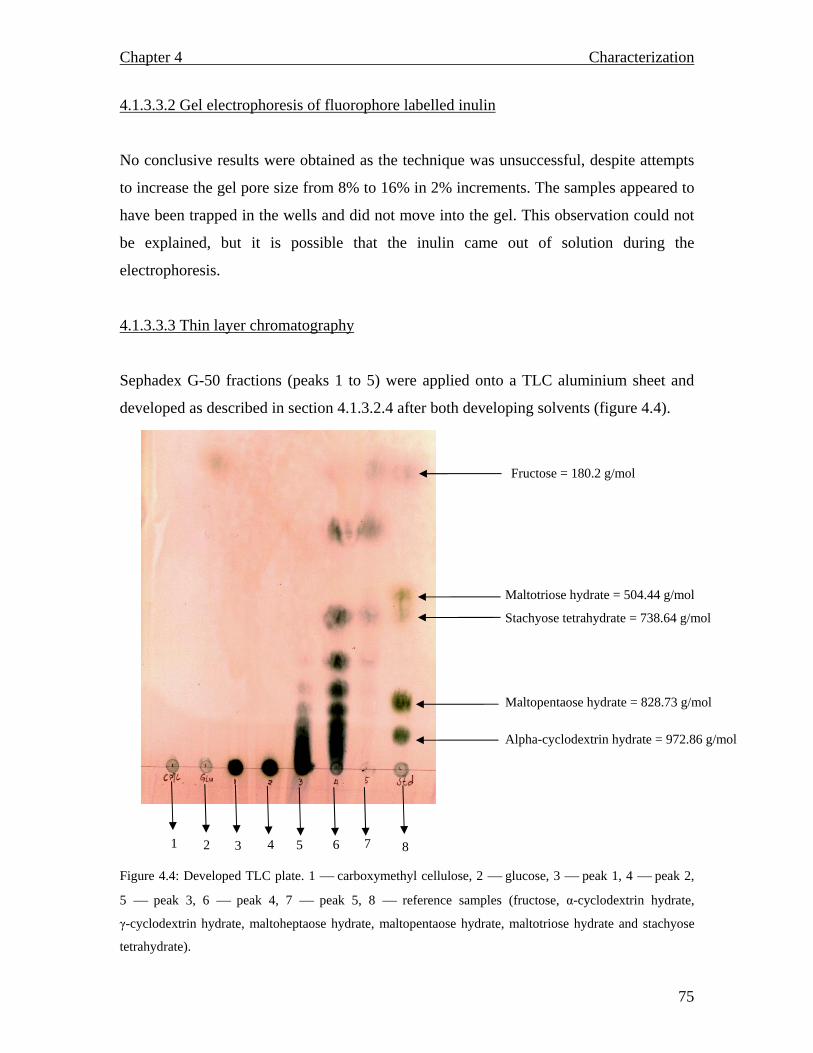
Chapter 4 Characterization
75
4.1.3.3.2 Gel electrophoresis of fluorophore labelled inulin
No conclusive results were obtained as the technique was unsuccessful, despite attempts
to increase the gel pore size from 8% to 16% in 2% increments. The samples appeared to
have been trapped in the wells and did not move into the gel. This observation could not
be explained, but it is possible that the inulin came out of solution during the
electrophoresis.
4.1.3.3.3 Thin layer chromatography
Sephadex G-50 fractions (peaks 1 to 5) were applied onto a TLC aluminium sheet and
developed as described in section 4.1.3.2.4 after both developing solvents (figure 4.4).
Figure 4.4: Developed TLC plate. 1 carboxymethyl cellulose, 2 glucose, 3 peak 1, 4 peak 2,
5 peak 3, 6 peak 4, 7 peak 5, 8 reference samples (fructose, α-cyclodextrin hydrate,
γ-cyclodextrin hydrate, maltoheptaose hydrate, maltopentaose hydrate, maltotriose hydrate and stachyose
tetrahydrate).
Fructose = 180.2 g/mol
Maltotriose hydrate = 504.44 g/mol
Stachyose tetrahydrate = 738.64 g/mol
Alpha-cyclodextrin hydrate = 972.86 g/mol
Maltopentaose hydrate = 828.73 g/mol
7 6 5 4 3 2 1 8
Chapter 4 Characterization
76
The reference samples used were as a result of a lack of appropriate inulin standards. The
increasing molecular weights in lane 8 were used to approximate (given that the reference
samples are substitutes) the degree of polymerization of the sugars separated on the
Sephadex G-50 column.
Peaks 1 and 2 from Sephadex column (lanes 3 and 4 respectively) did not seem to move
at all signifying that they were highly polymerized inulin components, while peaks 3 and
4 (lanes 5 and 6 respectively) were not adequately resolved. Lane 6 (peak 4), however,
indicates that this fraction was probably made up of a mixture of fructooligosaccharides,
as migrated spots translated into products of mass 180.2 g/mol and 972 g/mol. This
suggests that peak 4 was largely composed of sugars that varied between single fructose
residues, disaccharides (DP 2), trisaccharides (DP 3), tetrasaccharides (DP 4) and (DP 5)
units. Lane 7 (peak 5) is indicative of low molecular weight sugars (fructose and
disaccharides) with some tetrasaccharides (DP 4). The TLC analysis was not very
conclusive with regards to the polymeric constitution of the purified inulin, and did not
give a quantitative result, consequently a MALDI TOF analysis was embarked on.
4.1.3.3.4 MALDI TOF spectra
Figures 4.3 and 4.4 (MALDI TOF spectra) show molecular weight distributions of raw
and purified inulin (DP conversion curve shown in Appendix 4).
The mass to charge ratio (m/z) obtained from MALDI TOF analysis of the raw extract,
(figure 4.5) was found to range from 232.564 to 3607.96, thus representing a degree of
polymerization that varied from 2 to 22 (DP conversion curve shown in Appendix 4).
However, it was noted that this DP range was uncharacteristic of chicory inulin, as an
anticipated maximum DP of around 60 was expected (Roberfroid, 2002). The 38
unaccounted fructose units could only be explained by the fact that the raw inulin sample
was extracted from a root that had been defoliated and stored at -10 °C for a period of not
less than one month. These treatments (cold and defoliation) probably induced chicory
enzymes (chicory 1-FEH I and 1-FEH II) resulting in inulin breakdown (Ritsema and
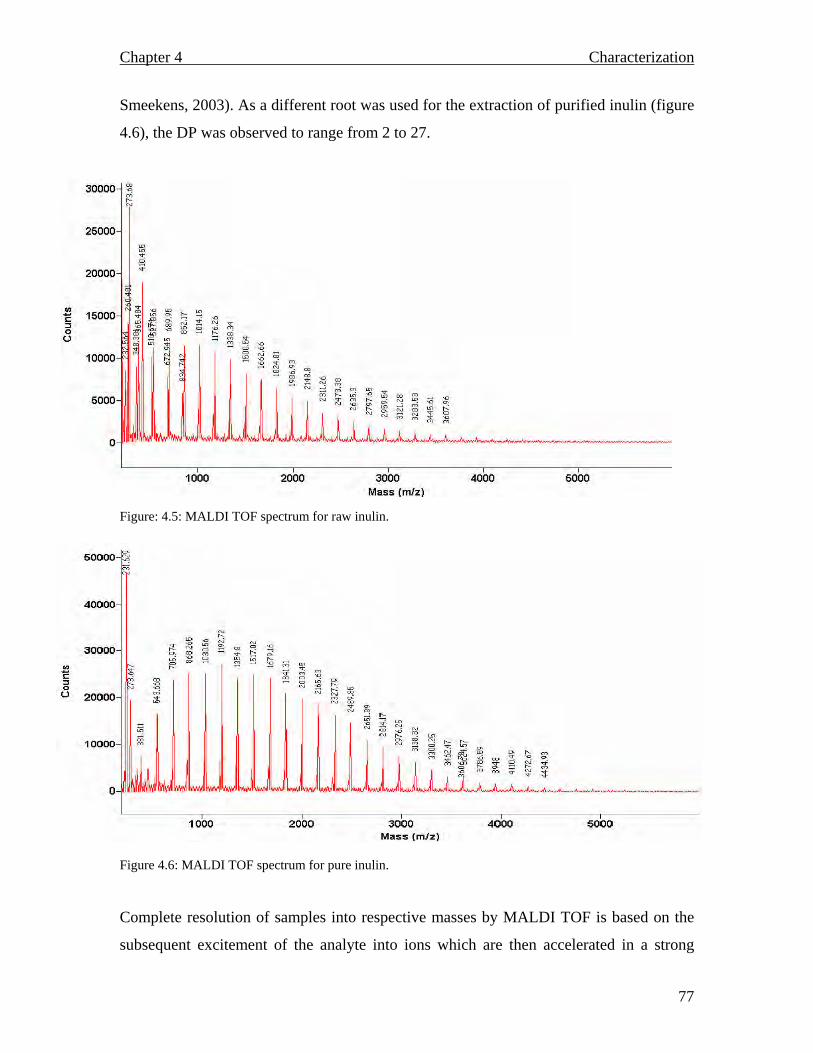
Chapter 4 Characterization
77
Smeekens, 2003). As a different root was used for the extraction of purified inulin (figure
4.6), the DP was observed to range from 2 to 27.
Figure: 4.5: MALDI TOF spectrum for raw inulin.
Figure 4.6: MALDI TOF spectrum for pure inulin.
Complete resolution of samples into respective masses by MALDI TOF is based on the
subsequent excitement of the analyte into ions which are then accelerated in a strong
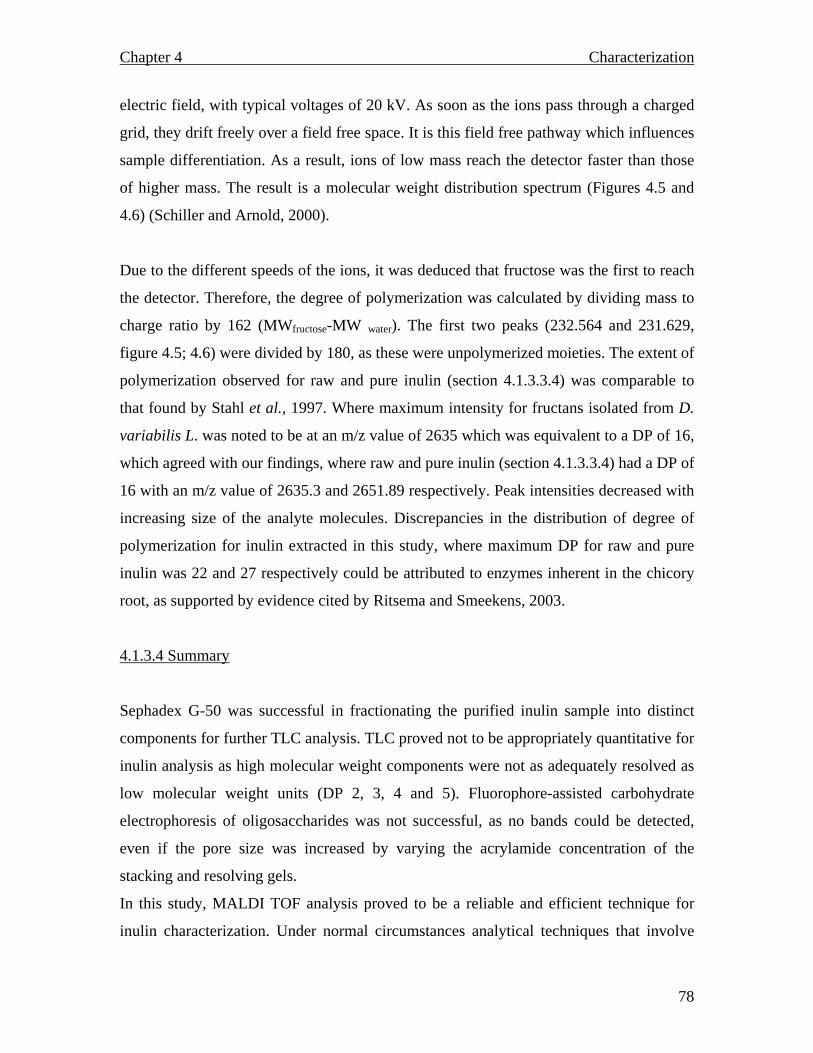
Chapter 4 Characterization
78
electric field, with typical voltages of 20 kV. As soon as the ions pass through a charged
grid, they drift freely over a field free space. It is this field free pathway which influences
sample differentiation. As a result, ions of low mass reach the detector faster than those
of higher mass. The result is a molecular weight distribution spectrum (Figures 4.5 and
4.6) (Schiller and Arnold, 2000).
Due to the different speeds of the ions, it was deduced that fructose was the first to reach
the detector. Therefore, the degree of polymerization was calculated by dividing mass to
charge ratio by 162 (MWfructose-MW water). The first two peaks (232.564 and 231.629,
figure 4.5; 4.6) were divided by 180, as these were unpolymerized moieties. The extent of
polymerization observed for raw and pure inulin (section 4.1.3.3.4) was comparable to
that found by Stahl et al., 1997. Where maximum intensity for fructans isolated from D.
variabilis L. was noted to be at an m/z value of 2635 which was equivalent to a DP of 16,
which agreed with our findings, where raw and pure inulin (section 4.1.3.3.4) had a DP of
16 with an m/z value of 2635.3 and 2651.89 respectively. Peak intensities decreased with
increasing size of the analyte molecules. Discrepancies in the distribution of degree of
polymerization for inulin extracted in this study, where maximum DP for raw and pure
inulin was 22 and 27 respectively could be attributed to enzymes inherent in the chicory
root, as supported by evidence cited by Ritsema and Smeekens, 2003.
4.1.3.4 Summary
Sephadex G-50 was successful in fractionating the purified inulin sample into distinct
components for further TLC analysis. TLC proved not to be appropriately quantitative for
inulin analysis as high molecular weight components were not as adequately resolved as
low molecular weight units (DP 2, 3, 4 and 5). Fluorophore-assisted carbohydrate
electrophoresis of oligosaccharides was not successful, as no bands could be detected,
even if the pore size was increased by varying the acrylamide concentration of the
stacking and resolving gels.
In this study, MALDI TOF analysis proved to be a reliable and efficient technique for
inulin characterization. Under normal circumstances analytical techniques that involve
Chapter 4 Characterization
79
ionization have stringent requirements for the removal of contaminating agents such as
salts and buffers for reproducible analytical results. MALDI analysis, however, appeared
to be less affected by the presence of contaminants, as observed with raw inulin.
The recovered inulin chain length was shorter than expected (DP 2 to 27) as opposed to
DP 2 to 60, as cited by Franck (2002 b). Apart from the inherent chicory enzymes and
cold storage, which ultimately lead to a shortened inulin chain, the date of harvest (35
weeks) could have influenced the observed depolymerization. At 35 weeks there is still
active inulin synthesis from fructose (Luckman and Rossouw, 2003). Moreover, during
the harvest period there is pronounced inulin depolymerization, which further shortens
the polymer (Baert, 1997).
Chapter 5 Enzymatic hydrolysis of inulin
80
Chapter 5
Inulinases from Aspergillus niger
5.1 Introduction
5.1.1 Production of fructose syrups
As a sweetener, sucrose has been shown to have some negative health benefits such as
carcinogenicity, contributes towards atherosclerosis and is contraindicatory to diabetics.
As a result the sweetening industry has largely been focusing on the development of
alternative substitutes (Vandamme and Derycke, 1983; Passador-Gurgel et al., 1996).
Over the years fructose has emerged as a safe substitute that is void of sucrose related
side effects, with inulin being the major source. Unfortunately, fructose recovery from
inulin has always been hampered by inefficient production processes. It is a well known
fact that oligofructoses can be produced by the acid hydrolysis of inulin, but this
approach has several drawbacks, such as an undesirably yellow coloured hydrolysate
(complicating purification procedures) and fructose anhydride formation which has no
nutritional or sweetening value (Kim and Lim, 2002, Passador-Gurgel et al., 1996).
Conventional production of high fructose syrups involves the hydrolysis of starch (potato
or corn) into glucose followed by D (+)-xylose isomerase treatment to produce a mixture
containing 42 % fructose, 50 % glucose and 8 % other sugars. The resultant mixtures are
called high fructose corn syrups (HFCS) (figure 5.1) (Vandamme and Derycke, 1983;
Passador-Gurgel et al., 1996). HFCS preparations were subsequently followed by ultra
high fructose glucose syrup (HFGS) production, using HFCS as a starting material. This
process was efficient in delivering syrups containing more than 60 % fructose with
glucose syrup collecting as a residue. To increase the fructose content the glucose syrups
were subjected to an isomerase reactor (Vandamme and Derycke, 1983).
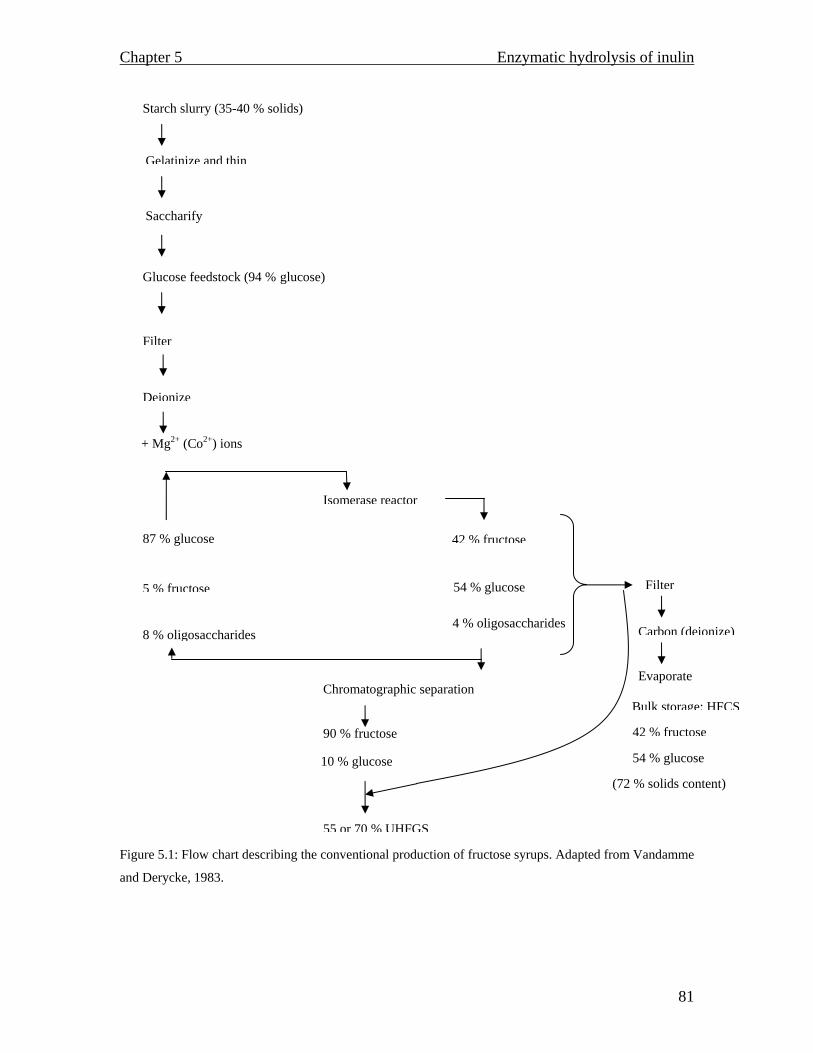
Chapter 5 Enzymatic hydrolysis of inulin
81
Figure 5.1: Flow chart describing the conventional production of fructose syrups. Adapted from Vandamme
and Derycke, 1983.
Starch slurry (35-40 % solids)
Gelatinize and thin
Saccharify
42 % fructose
Isomerase reactor
87 % glucose
+ Mg2+ (Co2+) ions
Deionize
Filter
Glucose feedstock (94 % glucose)
Chromatographic separation
90 % fructose
10 % glucose
55 or 70 % UHFGS
42 % fructose
4 % oligosaccharides
54 % glucose
8 % oligosaccharides
5 % fructose
Bulk storage: HFCS
Evaporate
Carbon (deionize)
Filter
(72 % solids content)
54 % glucose
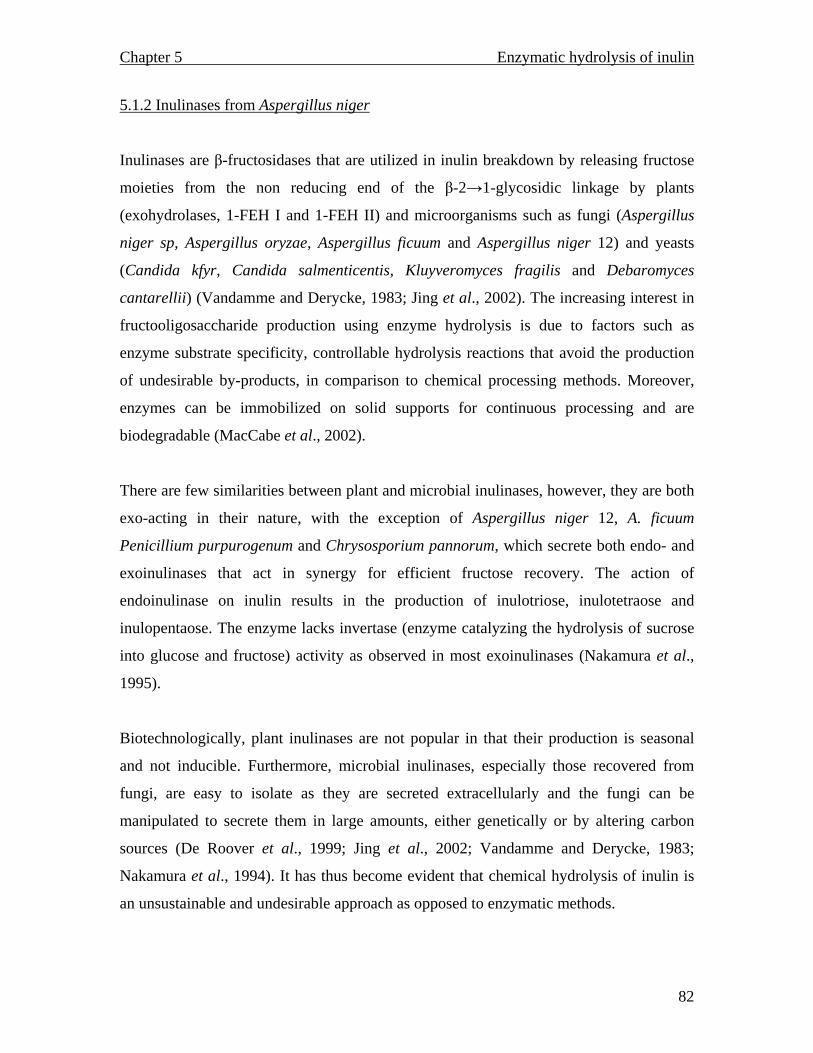
Chapter 5 Enzymatic hydrolysis of inulin
82
5.1.2 Inulinases from Aspergillus niger
Inulinases are β-fructosidases that are utilized in inulin breakdown by releasing fructose
moieties from the non reducing end of the β-2→1-glycosidic linkage by plants
(exohydrolases, 1-FEH I and 1-FEH II) and microorganisms such as fungi (Aspergillus
niger sp, Aspergillus oryzae, Aspergillus ficuum and Aspergillus niger 12) and yeasts
(Candida kfyr, Candida salmenticentis, Kluyveromyces fragilis and Debaromyces
cantarellii) (Vandamme and Derycke, 1983; Jing et al., 2002). The increasing interest in
fructooligosaccharide production using enzyme hydrolysis is due to factors such as
enzyme substrate specificity, controllable hydrolysis reactions that avoid the production
of undesirable by-products, in comparison to chemical processing methods. Moreover,
enzymes can be immobilized on solid supports for continuous processing and are
biodegradable (MacCabe et al., 2002).
There are few similarities between plant and microbial inulinases, however, they are both
exo-acting in their nature, with the exception of Aspergillus niger 12, A. ficuum
Penicillium purpurogenum and Chrysosporium pannorum, which secrete both endo- and
exoinulinases that act in synergy for efficient fructose recovery. The action of
endoinulinase on inulin results in the production of inulotriose, inulotetraose and
inulopentaose. The enzyme lacks invertase (enzyme catalyzing the hydrolysis of sucrose
into glucose and fructose) activity as observed in most exoinulinases (Nakamura et al.,
1995).
Biotechnologically, plant inulinases are not popular in that their production is seasonal
and not inducible. Furthermore, microbial inulinases, especially those recovered from
fungi, are easy to isolate as they are secreted extracellularly and the fungi can be
manipulated to secrete them in large amounts, either genetically or by altering carbon
sources (De Roover et al., 1999; Jing et al., 2002; Vandamme and Derycke, 1983;
Nakamura et al., 1994). It has thus become evident that chemical hydrolysis of inulin is
an unsustainable and undesirable approach as opposed to enzymatic methods.
Chapter 5 Enzymatic hydrolysis of inulin
83
Results from this section will be linked to the findings of previous chapters, for the
development of a continuous inulin and enhanced FOS production process (figure 5.2).
Figure 5.2: Proposed inulin and fructooligosaccharide production using a continuous system.
Cooling tank
Chicory homogenate
Exchange resins Aspergillus
Inulin FOS
Polyamide 6
Holding tank
CO2
Chapter 5 Enzymatic hydrolysis of inulin
84
5.1.3 Materials and Methods
5.1.3.1 Materials
Acetic acid, sodium acetate, sodium chloride, magnesium sulphate heptahydrate,
polyethyleneglycol (PEG) 20000, sucrose, K2CrO2, Na2CO3.10H2O and sodium
thiosulphate were purchased from Merck (South Africa (Pty) Ltd). Bradford reagent,
Coomasie Brilliant Blue R staining solution, commercial inulin, dialysis tubing, ferrous
sulphate heptahydrate and yeast extract were purchased from Sigma (South Africa (Pty)
Ltd). Incubating and shaking procedures were performed using an Orbital incubator
shaker supplied by labcon (South Africa). Liquid media were sterilized using a Rexall
vertical autoclave (Rexall industries CO. Ltd, Taiwan). Diethylaminoethyl cellulose
(DEAE) DE 23 was purchased from Whatman (England). The Aspergillus niger
inoculum was supplied by the Department of Biochemistry, Microbiology and
Biotechnology (Rhodes University. Grahamstown. South Africa).
5.1.3.2 Methods
5.1.3.2.1 Aspergillus niger growth
Aspergillus niger, cultivated on potato dextrose agar (PDA) (Merck) at 30°C for 5 days,
was obtained from a stock culture at the Department of Biochemistry, Microbiology and
Biotechnology, Rhodes University. To determine its ability for high inulinase production,
Aspergillus niger was grown in a culture incubated in an Orbital incubator shaker at 30
°C and 140 rpm for 4.5 days, using media at pH 4.5 (3.6 % NH4H2PO4, 0.21 % KCl, 0.15
% MgSO4.7H2O, 0.03 % FeSO4.7H2O, 0.3 % yeast extract) (Ohta et al., 1993) containing
6 % inulin. The liquid media were autoclaved at 121 °C for 20 minutes before inoculation
with A. niger spores.
The biomass was measured according to the method of Langvad, (1999), where
Aspergillus niger colony was cut out from the inoculum plate and transferred to a 50 ml
Chapter 5 Enzymatic hydrolysis of inulin
85
Schott bottle containing 50 ml distilled water. An ultraturex was then used to homogenize
the fungus for 30 seconds. Wells A1 to A10 and B2 to B10 of the microtiter plate were
filled with 180 µl of the growth medium, followed by 20 µl of sterile distilled water.
Wells A2 to A10 and B2 to B10 were then inoculated with 20 µl of the homogenate from
the ultraturex. Well A1 was treated as a blank. The plate was read on the Power wave at
630 nm for the duration of 2.5 days at 12 hour intervals until the cells reached
confluence.
5.1.3.2.2 Protein determination
The protein was quantified by the Bradford method (Bradford, 1976). Bradford reagent
(250 µl) was added into a microtiter plate followed by the growing A. niger culture (5 µl).
The absorbances were read at 595 nm and the protein concentration determined from the
standard curve (Appendix 5).
5.1.3.2.3 Inulinase assay
Sampling of the Aspergillus niger cultures was performed under sterile conditions. The
culture filtrates were assayed for inulinase activities at 12 hour intervals by incubating the
centrifuged growing A. niger cultures (1 ml) and 2 % (w/v) inulin (4 ml) in 0.1 M acetate
buffer, pH 5 (as described by Jing et al., 2002). The blank contained boiled crude enzyme
and substrate. The amount of released reducing sugar was estimated by the Somogyi-
Nelson method (section 2.2.2.1). One inulinase unit is the amount of enzyme that forms 1
µmol fructose per minute.
5.1.3.2.4 Partial purification of inulinase (DEAE DE 23 ion exchange column)
All experiments were carried out at 4 °C. The Aspergillus niger culture filtrate was
centrifuged (13, 000 × g, 20 min) and the pH adjusted to 5 as described by Nakamura et
al. (1994). The crude enzyme was concentrated to one-ninth of its original volume in a
dialysis bag surrounded by a thick layer of polyethylene glycol (20000). The
Chapter 5 Enzymatic hydrolysis of inulin
86
concentrated enzyme (2 ml) was loaded onto a DEAE DE 23 column (1.3 × 23 cm)
previously equilibrated with 0.02 M acetate buffer pH 6. The DEAE DE 23 resin was
prepared as follows: It was regenerated by suspending in HCl (100 ml; 0.5 M) and stirred
for 30 minutes. The resin was allowed to settle, the HCl decanted and washed with dH2O.
The resin was then re-suspended in NaOH (100 ml; 0.5 M) and stirred for 30 minutes,
after which, it was washed with dH2O until the pH of the washings approached 7. The ion
exchanger was subsequently put in a beaker and equilibrated with 0.02 M acetate buffer
pH 6. The ion exchange slurry was then poured into a column and allowed to settle
overnight under a flow of 0.02 M acetate buffer pH 6 (0.8 ml/min).
The column was eluted at a flow rate of 0.8 ml/min stepwisely with 0.1 M NaCl (in 0.02
M acetate buffer pH 6) until the absorbance at 280 nm reached a baseline, followed by
0.2 M and 0.3 M NaCl (in 0.02 M acetate buffer pH 6) consecutively. Fractions (4
ml/tube) were collected and monitored for protein and inulinase activity.
5.1.3.2.5 SDS-PAGE
The molecular weights of the enzyme were determined by SDS-PAGE according to the
method of Laemmli (1970). The sample (10 µl) from the DEAE ion exchange column,
together with SDS-PAGE standard molecular weight (26.6 – 116 KDa) markers (10 µl)
were electrophoresed on 12 % SDS-PAGE at 250 V. The gels were stained with
Coomasie Brilliant Blue R staining solution, and then destained in methanol-acetic acid-
water (1:1:8 v/v/v).
5.1.3.2.6 Silver staining
For enhanced detection silver staining was used, according to the method of Switzer
(1979). The gels were fixed in 10 % ethanol and 5 % acetic acid (30 min) and then
transferred to an oxidiser solution made up of K2CrO2 (0.0032 M; 250 ml) and 55 %
nitric acid (57 µl) for 10 minutes. They were washed with water (20 min) until the yellow
colour disappeared and treated with silver nitrate (0.2 g in 100 ml) for 10 minutes. The
Chapter 5 Enzymatic hydrolysis of inulin
87
gels were developed in a solution made up of Na2CO3.10H2O (20g in 250 ml),
formaldehyde (375 µl) and sodium thiosulphate (0.1 g).
5.1.3.2.7 Temperature profile of the inulinase
Temperature optimum for inulinase was carried out over a temperature range of 24 to 80
°C. The reaction mixture was prepared as previously described in section 5.1.3.2.3. The
reaction was initiated by the addition of inulin and the inulinase activity monitored
according to the assay in section 5.1.3.2.3.
5.1.3.2.8 pH profile of the inulinase
The effect of pH was determined over the pH range 3.5 to 6.5 (0.1 M acetate buffer), 6.8
to 7.7 (0.1 M phosphate buffer) and 8 to 8.9 (0.1 M Tris-HCl buffer). Inulinase assays
were carried out in reaction mixtures containing 0.5 ml buffer of the desired pH, 0.25 ml
1 % inulin solution (in water) and 0.25 ml enzyme solution.
5.1.4 Results and Discussion
5.1.4.1 Inulinase production from Aspergillus niger
Aspergillus niger used in this study demonstrated appreciable growth on inulin, and
enzyme production was observed after the onset of the stationary phase, between 60 and
96 hours (Figure 5.3). The delay between the completion of cell growth and appearance
of the first sample containing enzyme activity is not uncommon for inulin hydrolysing
enzymes. Cruz et al., (1998) managed to show that maximum enzyme liberation from A.
niger 245 occurs between 48 and 60 hours, and noted that in other organisms the
maximum enzyme activity is reached after72 hours. These workers offer no explanation
for their delayed enzyme secretion. Nevertheless, the biomass and enzyme secretion trend
observed in this study is indicative of trends cited by Siebel, (1992) who noted that cell
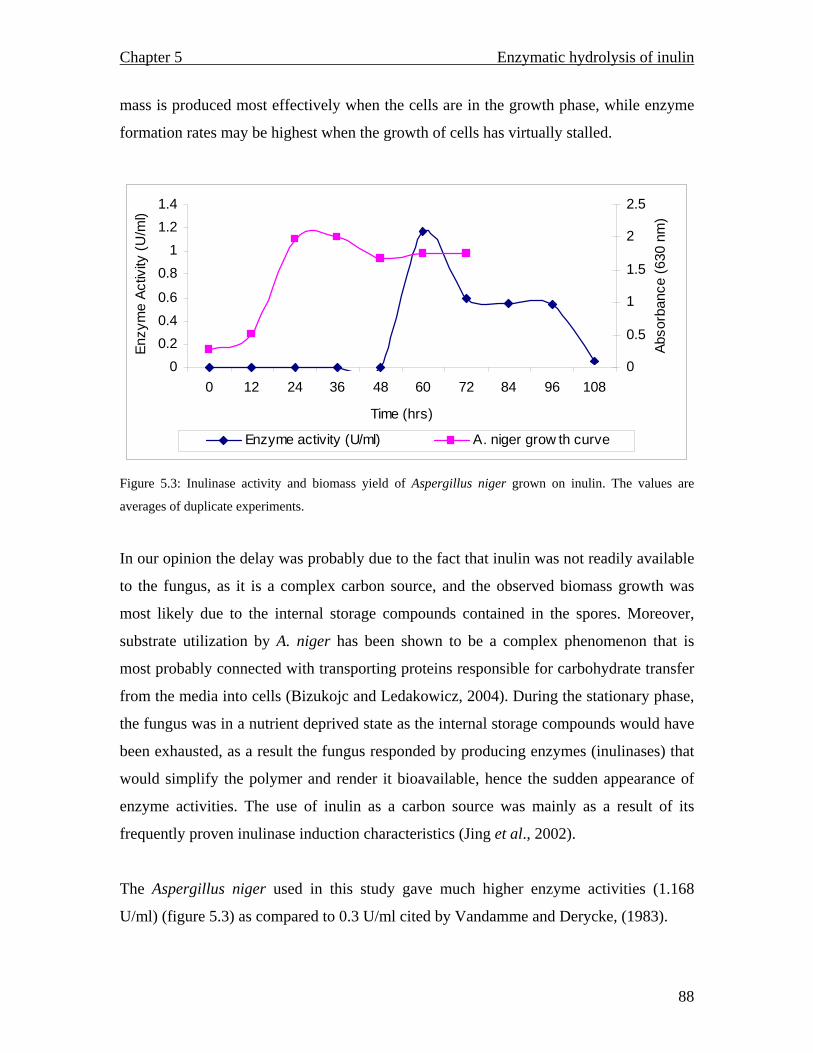
Chapter 5 Enzymatic hydrolysis of inulin
88
mass is produced most effectively when the cells are in the growth phase, while enzyme
formation rates may be highest when the growth of cells has virtually stalled.
00.20.40.6
0.81
1.21.4
0 12 24 36 48 60 72 84 96 108
Time (hrs)
Enzy
me
Activ
ity (U
/ml)
0
0.5
1
1.5
2
2.5
Abso
rban
ce (6
30 n
m)
Enzyme activity (U/ml) A. niger grow th curve
Figure 5.3: Inulinase activity and biomass yield of Aspergillus niger grown on inulin. The values are
averages of duplicate experiments.
In our opinion the delay was probably due to the fact that inulin was not readily available
to the fungus, as it is a complex carbon source, and the observed biomass growth was
most likely due to the internal storage compounds contained in the spores. Moreover,
substrate utilization by A. niger has been shown to be a complex phenomenon that is
most probably connected with transporting proteins responsible for carbohydrate transfer
from the media into cells (Bizukojc and Ledakowicz, 2004). During the stationary phase,
the fungus was in a nutrient deprived state as the internal storage compounds would have
been exhausted, as a result the fungus responded by producing enzymes (inulinases) that
would simplify the polymer and render it bioavailable, hence the sudden appearance of
enzyme activities. The use of inulin as a carbon source was mainly as a result of its
frequently proven inulinase induction characteristics (Jing et al., 2002).
The Aspergillus niger used in this study gave much higher enzyme activities (1.168
U/ml) (figure 5.3) as compared to 0.3 U/ml cited by Vandamme and Derycke, (1983).
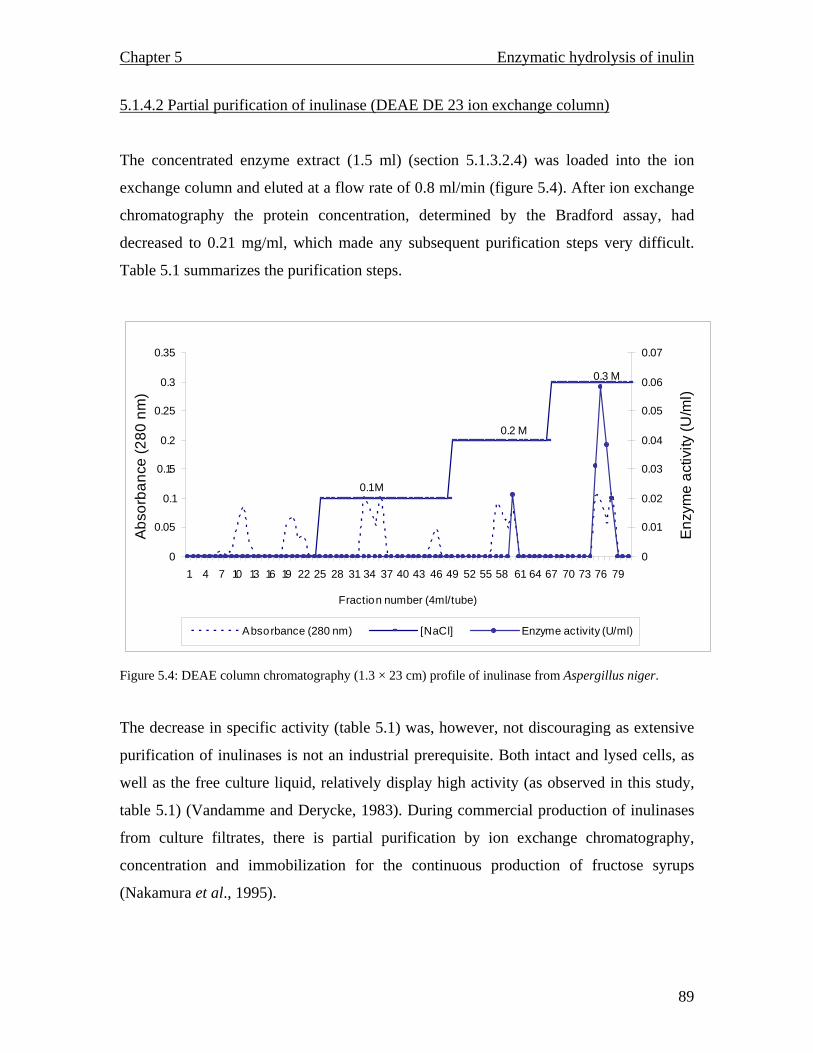
Chapter 5 Enzymatic hydrolysis of inulin
89
5.1.4.2 Partial purification of inulinase (DEAE DE 23 ion exchange column)
The concentrated enzyme extract (1.5 ml) (section 5.1.3.2.4) was loaded into the ion
exchange column and eluted at a flow rate of 0.8 ml/min (figure 5.4). After ion exchange
chromatography the protein concentration, determined by the Bradford assay, had
decreased to 0.21 mg/ml, which made any subsequent purification steps very difficult.
Table 5.1 summarizes the purification steps.
0
0.05
0.1
0.15
0.2
0.25
0.3
0.35
1 4 7 10 13 16 19 22 25 28 31 34 37 40 43 46 49 52 55 58 61 64 67 70 73 76 79
F raction number (4ml/tube)
Abso
rban
ce (2
80 n
m)
0
0.01
0.02
0.03
0.04
0.05
0.06
0.07
Enzy
me
activ
ity (U
/ml)
A bsorbance (280 nm) [NaC l] Enzyme activity (U/ml)
0.1 M
0.2 M
0.3 M
Figure 5.4: DEAE column chromatography (1.3 × 23 cm) profile of inulinase from Aspergillus niger.
The decrease in specific activity (table 5.1) was, however, not discouraging as extensive
purification of inulinases is not an industrial prerequisite. Both intact and lysed cells, as
well as the free culture liquid, relatively display high activity (as observed in this study,
table 5.1) (Vandamme and Derycke, 1983). During commercial production of inulinases
from culture filtrates, there is partial purification by ion exchange chromatography,
concentration and immobilization for the continuous production of fructose syrups
(Nakamura et al., 1995).
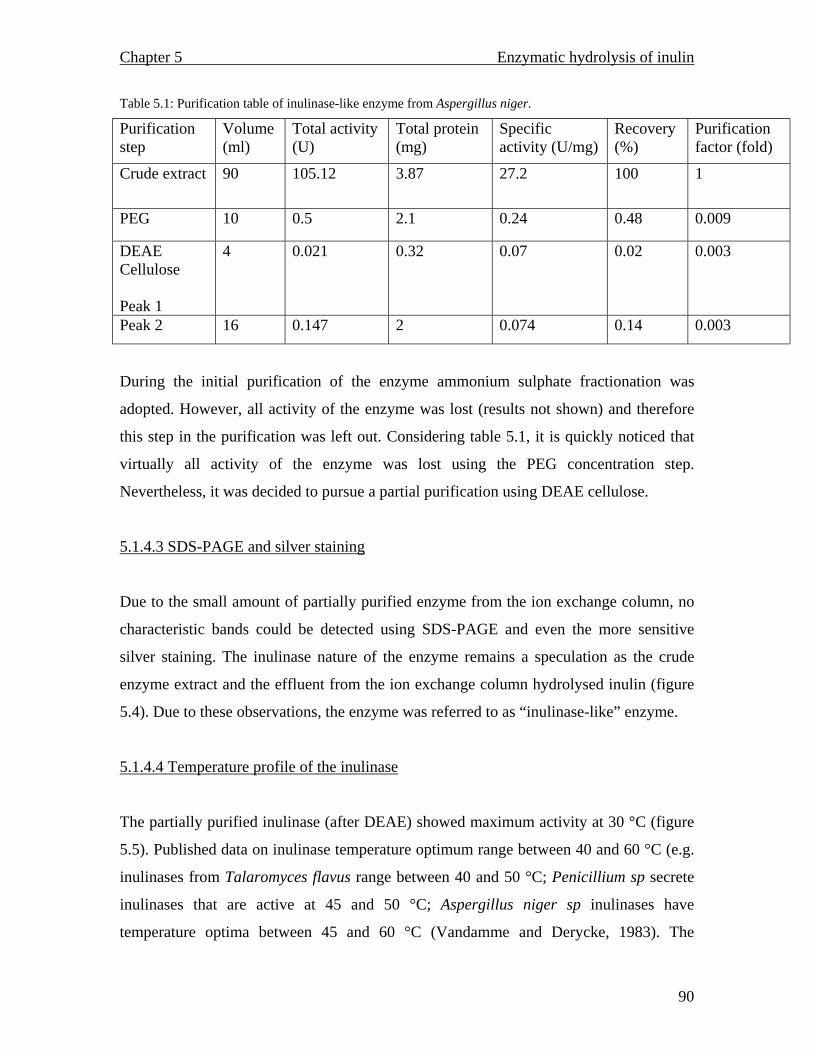
Chapter 5 Enzymatic hydrolysis of inulin
90
Table 5.1: Purification table of inulinase-like enzyme from Aspergillus niger. Purification step
Volume (ml)
Total activity (U)
Total protein (mg)
Specific activity (U/mg)
Recovery (%)
Purification factor (fold)
Crude extract 90 105.12 3.87 27.2 100 1
PEG 10 0.5 2.1 0.24 0.48 0.009
DEAE Cellulose Peak 1
4 0.021 0.32 0.07 0.02 0.003
Peak 2 16 0.147 2 0.074 0.14 0.003
During the initial purification of the enzyme ammonium sulphate fractionation was
adopted. However, all activity of the enzyme was lost (results not shown) and therefore
this step in the purification was left out. Considering table 5.1, it is quickly noticed that
virtually all activity of the enzyme was lost using the PEG concentration step.
Nevertheless, it was decided to pursue a partial purification using DEAE cellulose.
5.1.4.3 SDS-PAGE and silver staining
Due to the small amount of partially purified enzyme from the ion exchange column, no
characteristic bands could be detected using SDS-PAGE and even the more sensitive
silver staining. The inulinase nature of the enzyme remains a speculation as the crude
enzyme extract and the effluent from the ion exchange column hydrolysed inulin (figure
5.4). Due to these observations, the enzyme was referred to as “inulinase-like” enzyme.
5.1.4.4 Temperature profile of the inulinase
The partially purified inulinase (after DEAE) showed maximum activity at 30 °C (figure
5.5). Published data on inulinase temperature optimum range between 40 and 60 °C (e.g.
inulinases from Talaromyces flavus range between 40 and 50 °C; Penicillium sp secrete
inulinases that are active at 45 and 50 °C; Aspergillus niger sp inulinases have
temperature optima between 45 and 60 °C (Vandamme and Derycke, 1983). The
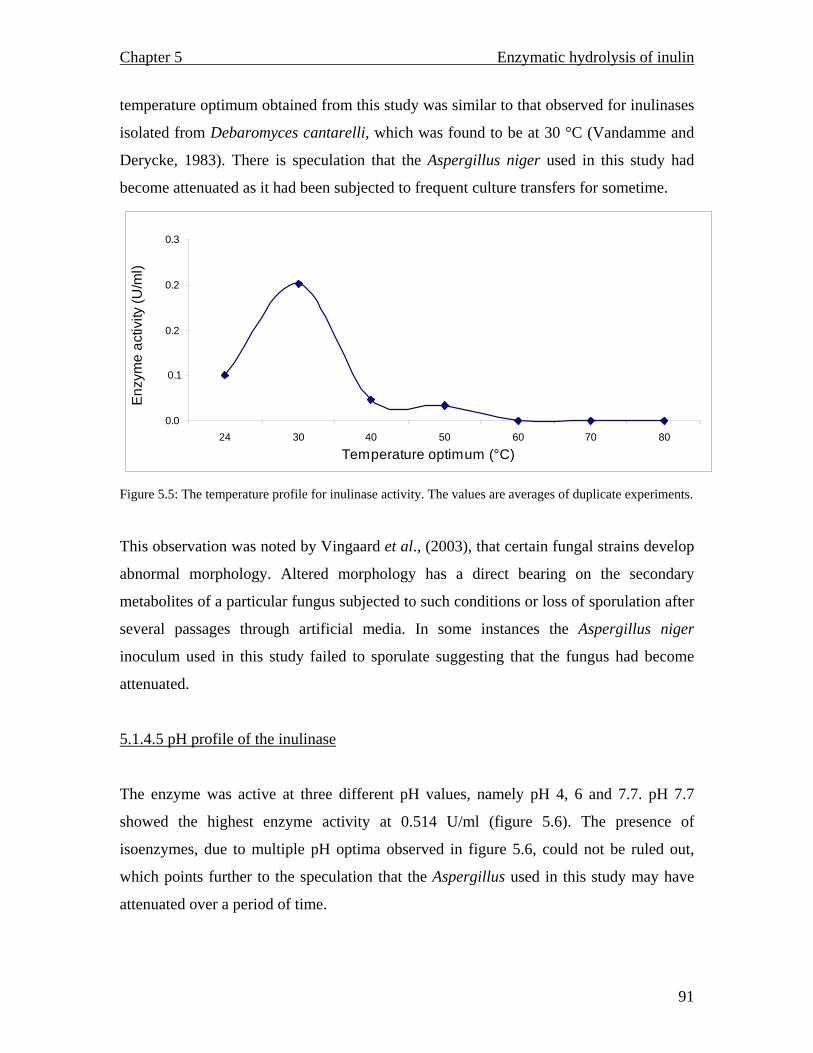
Chapter 5 Enzymatic hydrolysis of inulin
91
temperature optimum obtained from this study was similar to that observed for inulinases
isolated from Debaromyces cantarelli, which was found to be at 30 °C (Vandamme and
Derycke, 1983). There is speculation that the Aspergillus niger used in this study had
become attenuated as it had been subjected to frequent culture transfers for sometime.
0.0
0.1
0.2
0.2
0.3
24 30 40 50 60 70 80
Temperature optimum (°C)
Enzy
me
activ
ity (U
/ml)
Figure 5.5: The temperature profile for inulinase activity. The values are averages of duplicate experiments.
This observation was noted by Vingaard et al., (2003), that certain fungal strains develop
abnormal morphology. Altered morphology has a direct bearing on the secondary
metabolites of a particular fungus subjected to such conditions or loss of sporulation after
several passages through artificial media. In some instances the Aspergillus niger
inoculum used in this study failed to sporulate suggesting that the fungus had become
attenuated.
5.1.4.5 pH profile of the inulinase
The enzyme was active at three different pH values, namely pH 4, 6 and 7.7. pH 7.7
showed the highest enzyme activity at 0.514 U/ml (figure 5.6). The presence of
isoenzymes, due to multiple pH optima observed in figure 5.6, could not be ruled out,
which points further to the speculation that the Aspergillus used in this study may have
attenuated over a period of time.
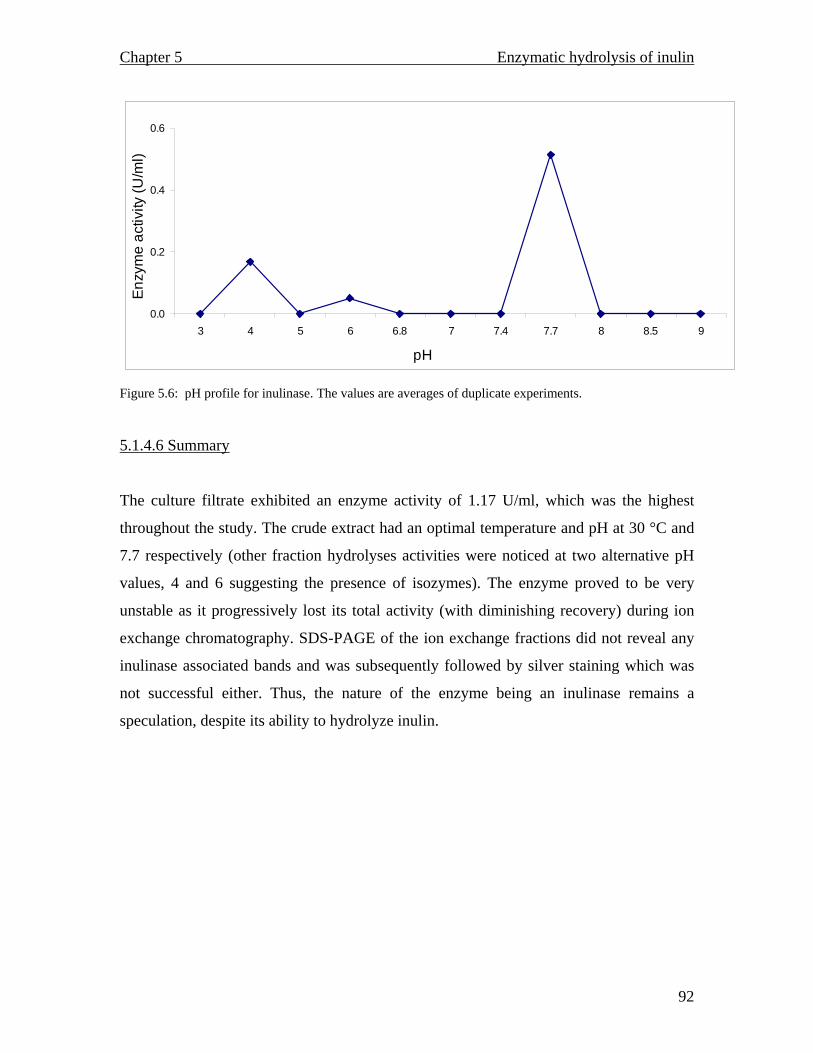
Chapter 5 Enzymatic hydrolysis of inulin
92
0.0
0.2
0.4
0.6
3 4 5 6 6.8 7 7.4 7.7 8 8.5 9
pH
Enzy
me
activ
ity (U
/ml)
Figure 5.6: pH profile for inulinase. The values are averages of duplicate experiments.
5.1.4.6 Summary
The culture filtrate exhibited an enzyme activity of 1.17 U/ml, which was the highest
throughout the study. The crude extract had an optimal temperature and pH at 30 °C and
7.7 respectively (other fraction hydrolyses activities were noticed at two alternative pH
values, 4 and 6 suggesting the presence of isozymes). The enzyme proved to be very
unstable as it progressively lost its total activity (with diminishing recovery) during ion
exchange chromatography. SDS-PAGE of the ion exchange fractions did not reveal any
inulinase associated bands and was subsequently followed by silver staining which was
not successful either. Thus, the nature of the enzyme being an inulinase remains a
speculation, despite its ability to hydrolyze inulin.
Chapter 6 General discussion and conclusion
93
Chapter 6
General discussion and conclusion
Since their discovery as functional food ingredients, inulin and oligofructose have
continued to attract interest from the food industry and their exploitation has resulted in a
number of health products. Inulin and fructooligosaccharides have been discovered to be
beneficial food ingredients in as far as the human intestinal integrity is concerned. Their
ability to resist degradation in the small intestine is largely due to their β 2→1 glycosidic
linkage which renders them unsusceptible to hydrolytic cleavage (as intestinal enzymes
target α-configured compounds). Upon reaching the large intestine (unhydrolyzed) they
selectively stimulate the growth of beneficial bacteria (bifidobacteria) resident in the
colon while preventing pathogenic microbial (clostridia, bacteroides and fusobacteria)
growth. Bifidobacterial proliferation is accomplished through inulin fermentation which
results in the production of gases (H2, CO2 and CH4), lactic acid and short chain fatty
acids (particularly butyrate and propionic acid). The colonic mucosal integrity is
consequently maintained by butyrate while propionic acid modulates carbohydrate and
lipid metabolism (ultimately regulating serum cholesterol levels) (Roberfroid, 2002;
Cherbut, 2002).
As functional food ingredients, inulin and oligofructose have been easily combined with
other food materials without compromising their overall flavours and textures. In fact,
inulin has been shown to improve mouthfeel, taste and texture of food. Moreover, it has
the ability to act as a fat replacer, a feature that can be exploited for the benefit of
cholesterol patients (Franck, 2002 b).
As fructose is approximately 2 times sweeter and less cariogenic than normal table sugar
(sucrose), fructooligosaccharides with low degree of polymerization (average DP 4) have
been used for sweetening purposes. Furthermore, the fact that fructose is less viscous and
has higher solubility properties means that it can be metabolized in low levels and
Chapter 6 General discussion and conclusion
94
without the need for insulin, a feature that is most beneficial to diabetics (Passador-
Gurgel, 1996).
Chicory S.A, one of the largest chicory (primary source of inulin, amongst others)
producing companies, focuses mainly on coffee related products and as a result is looking
at diversifying its portfolio by participating in markets associated with inulin. The
purpose of this study was therefore to develop processes which could be industrially
adapted for an economically viable inulin extraction and purification procedure with
subsequent fructose production as an alternative sweetener.
The development of inulin and extraction procedures without due compromise to the
polymer had to be considered. In as far as inulin extraction was concerned, its
physicochemical properties were maximally exploited. As inulin is soluble at high
temperatures (precipitating in ambient temperatures), hot water extraction (70 °C) was
utilized to isolate most of the inulin in its raw form. However, before inulin extraction
could be undertaken, a quantitative assay had to be developed. Hydrochloric acid (0.8 M)
was adequate to hydrolyze the inulin into monomeric fructose units which could then be
assayed by the standard Somogyi-Nelson procedure. Heating the homogenized chicory
root in distilled water (1:5 w/v) at 70 °C for 1 hour, whilst stirring resulted in high
recoveries of raw inulin. Heating the homogenate at 80 °C and above resulted in inulin
yields that were comparable to those obtained at 70 °C. The optimized extraction process
resulted in 80.2 % inulin recovery and 11 % yield.
Different roots are bound to yield varying quantities of inulin due to factors such as time
of harvest, shelf storage and temperature. Cold temperatures induce endogenous
inulinases which compromise the degree of polymerization of inulin, with subsequent
production of fructooligosaccharides and free fructose. Under such conditions the root
remobilizes accumulated fructans, through exohydrolases, to produce simple sugars as
they act as cryoprotectants (Ritsema and Smeekens, 2003).
Chapter 6 General discussion and conclusion
95
Pure inulin is odourless, colourless and tasteless except for fructooligosaccharides which
might have slight degree of sweetness (Franck, 2002 b). The raw inulin initially extracted
had a deep brown colour, a caramel smell and severe astringency. All these components
were most probably as a result of secondary metabolites, especially tannins and
sesquiterpene lactones. The presence of pectins were suspected due to gelling properties
of the liquid squeezed from an unhomogenized chicory root.
An optimized carbonation process was used to exclude the majority of colour and bitter
principles. After adding 0.1 M Ca(OH)2 to the chicory homogenate, CO2 gas was bubbled
through the solution for 10 minutes, and this was enough to remove 90 % of the
homogenate’s colour and 97 % of the tannins. Bubbling CO2 for more than 10 minutes
did not result in any further colour removal.
Carbonation was followed Polyamide 6 powder (60 g) which managed to remove 63.6 %
of the colour and 92 % tannins. Ion exchange (batch wise) purification of the raw chicory
extract, using Dowex 50 WX 8 (cation exchanger) and Dowex® 4 (anion exchanger)
resulted in 67 % colour removal. Cation exchange resins resulted in negligible colour
removal. This observation does not mean that cation exchangers are not necessary, as
they still participate in the removal of inorganic salts.
Purification procedures were subsequently linked to effect a continuous tandem
purification process so as to assess the viability of a commercial industrial purification
system. Three columns were interconnected and operated at 24 °C at a flow rate of 1
ml/min. Prior to passing the chicory homogenate into the columns, carbonation was used
to remove the non sugars and colour as mentioned above. Technically, 1 ml/min was an
unsatisfactory flow rate as it was time consuming and efforts to increase it were
unsuccessful. The procedure was therefore abandoned in favour of a tandem continuous
batch wise process. Tandem continuous purification processes resulted in inulin samples
that contained less than 1 % tannin and colour.
Chapter 6 General discussion and conclusion
96
Mixtures of simple sugars comprised of mono, di and oligosaccharides of DP < 9, are
sufficiently resolved by HPLC, however, limitations arise as soon as complex mixtures
are analysed. As a result, for complete resolution of all carbohydrates, more than one
HPLC column is needed (Doughty, 1995).
The extracted inulin was initially fractionated on Sephadex G-50, to separate it into
different DP’s. The fractions collected were assayed for free fructose and inulin and a
chromatogram generated. Fractions constituting individual peaks were pooled for further
analysis.
Analysis of the inulin fractions from Sephadex G-50 was carried out using flourophore
assisted carbohydrate electrophoresis of oligosaccharides (FACE). Characterization of
fractions using FACE was not successful as no bands could be detected on the
polyacrylamide gel even when the pore size was slightly increased. Thin layer
chromatography was subsequently used to try and identify the inulin’s polymeric
distribution. Monosaccharides (fructose) and oligosaccharides that range between DP 2
and 5 were sufficiently resolved, however, spots with highly polymerized
oligosaccharides did not migrate. TLC was thus not quantitative in the characterization of
inulin.
Matrix assisted laser desorption ionization time of flight mass spectrometry (MALDI
TOF) was ultimately used. MALDI TOF spectrometry has a few advantages such as
tolerance for impure samples and moderate fragmentation on the analyte (Harvey, 1999).
Spectra resulting from the raw sample showed a mass to charge ratio (m/z) that ranged
from less than 1000 to 3607.96 translating to a degree of polymerization that varied from
2 to 20. The pure sample on the other hand showed DP values that ranged from 2 to 27.
However, native inulin has a maximum DP of 60 (Roberfroid, 2002), which means that
the inulin extracted in this study had been compromised. Due to the chicory roots being
stored at -10 °C, it is possible that the polymer was degraded. As the chicory roots are
normally harvested at 35 weeks (Luckman and Rossouw, 2003), the period when inulin
Chapter 6 General discussion and conclusion
97
biosynthesis is still active, it possible that the observed DP, from the MALDI TOF
spectra is due to the action of induced exohydraolases (through defoliation and cold
temperatures, during storage) which cleave the partial inulin polymer. Results from this
study suggest that for the isolation of inulin with maximum DP, chicory roots will have to
be processed soon after harvest. Ritsema and Smeekens, 2003, observed that defoliation,
dormacy and prolonged cold storage induced exohydrolases that cleave inulin.
The industrial production of high fructose syrups from inulin is generally effected
through the use of microbial inulinases (Vandamme and Derycke, 1983). Aspergillus
niger is the frequently used microorganism as it offers ease and convenience of inulinase
recovery (Nakamura et al., 1994).
A.niger grown on inulin produced inulin hydrolyzing enzymes with enzyme activities of
1.17 U/ml. Optimum enzyme production was observed after 60 hours. The crude
inulinase like enzyme showed maximum temperature and pH activities at 30 °C and 7.7
respectively.
Chromatography of the crude extract on Diethylaminoethyl cellulose (DEAE) DE23,
after concentrating with polyethylenglycol (PEG) 20000) revealed two peaks with
inulinase activities of 0.005 U/ml and 0.009 U/ml respectively. Fractions with inulinase
activities were not fractionated further due to low protein contents and enzyme activities.
Sodium dodecyl sulphate polyacrylamide gel electrophoresis (SDS-PAGE) and silver
staining of the DEAE fractions which showed enzyme activity did not reveal any bands.
As a result, the inulinase nature of the isolated enzyme remains a speculation, despite the
fact that it could hydrolyze inulin.
Vandamme and Derycke, (1983) have noted that extensive purification of inulinases is
unnecessary since the cell free culture and both lysed and intact cells show sufficiently
high enzyme activities. Based on the observations of these authors and the results
obtained from this study, it is recommended that enzymes obtained from optimized
Chapter 6 General discussion and conclusion
98
culture filtrates be used for immobilization processes for the production of high fructose
syrups.
This project was successful in that, inulin extraction procedures from chicory roots were
efficiently optimized. Apart from extracting inulin, FOS were simultaneously isolated,
FOS recovery observed in this study is most probably due to the inulin depolymerization
as a consequence of exohydrolases induction. It was observed that early harvest and
prolonged cold storage result in a cleaved polymer, and thus, logical recommendations
towards the recovery of high DP inulin could be made. The study has clearly established
that for high inulinase yields with high enzyme activities, in the hydrolysis of inulin,
mutant microorganisms may have to be utilized.
Future work involves:
Scaling up of inulin production processes
Over expression of the inulinase
Immobilization studies of the partially purified enzyme extract for continuous fructose
syrup production.
Synthesis of high inulin polymers from sucrose using transfructosylating enzymes
References
99
References
Aerts, R.J., Barry, T.N., and McNabb, W.C. (1999). Polyphenols and agriculture: beneficial effects of proanthocyanidins in forages. Agriculture, Ecosystem and Environment. 75: 1-12. Agriculture in South Africa. (1994). Agricultural production. pp 96. Chris van Rensburg Publications. Johannesburg. Albrecht, G., Kammerer, S., Praznik, W., and Wiedenroth, E.M. (1993). Fructan content of wheat seedlings (Triticum aestivum L.) under hypoxia and following re-aeration. New Phytol. 123: 471-476. Aldieri, E., Atragene, D., Bergandi, L., Riaganti, C., Costamagna, C., Bosia, A., and Ghigo, D. (2003). Arteminisinin inhibits inducible nitric oxide synthase and nuclear factor NF-KB activation. FEBS Letters. 552: 141-144. Amstrong, F.B. (1989). Biological units of molecular organization. In: Biochemistry. Amstrong, F.B. (ed). pp 52-53. Oxford University press. Baert, J.R.A. (1997). The effect of sowing and harvest date and cultivar on inulin yield and composition of chicory (Chicorium intybus L.) roots. Industrial crops and products. 6: 195-199. Baert, J.R.A., and Van Bockstaele, E.J. (1992). Cultivation and breeding of root chicory for inulin production. Industrial crops and products. 1: 229-234. Bekers, M., Laukevics, J., Upite, D., Kamininska, E., Vigants, A., Viesturs, U., Pankova, L., and Danilevics, A. (2002). Fructooligosaccharide and levan producing activity of Zymomonas mobilis extracellular levansucrase. Process Biochemistry. 38: 701-706. Bemiller, J.N. (1972). Isolation and hydrolysis of alkali stable inulin. Carbohydrate research. 21: 154-155. Bizukojc, M., and Ledakowicz, S. (2004). The kinetics of simultaneous glucose and fructose uptake and product formation by Aspergillus niger in citric acid fermentation. Process Biochemistry. In press, Bonnett, G.D., Sims, I.M., Simpson, R.J., and Cairns, A.J. (1997). Structural diversity of fructan in relation to the taxonomy of the Poaceae. New Phytol. 136: 11-17. Bonnett, G.D., Sims, I.M., St John, J.A., and Simpson, R.J. (1994). Purification and characterization of fructans with β-2.1- and β-2.6-glycosidic linkages suitable for enzyme studies. New Phytol: 127: 261-269.
References
100
Bradford, M.M. (1976). A rapid sensitive method for the quantification of microgram quantities of protein utilizing the principle of protein-dye binding. Analytical Biochemistry. 72: 248-251. Bubnik, Z., Korčáková, I., Kadlec, P., Štarhová, H., Pour, V., and Uherek, M. (1997). Isolation of inulin from chicory root. Potrav. Vědy. 15: 49-67. Burrin, D.H. (1989). Spectrscopic techniques. In: A biologist’s guide toprinciples and techniques of practical biochemistry. Wilson, K., and Goulding, K.H. (eds), pp270-312. Edward Arnold. New York. Cashman, K.D. (2002). Calcium intake, calcium bioavailability and bone health. British Journal of Nutrition. 87: S169-S177. Causey, J.L., Feirtag, J.M., Gallaher, D.D., Tungland, B.C., and Slavin, J.L. (2000). Effects of dietary inulin on serum lipids, blood glucose and the gastrointestinal environment in hypercholesterolemic men. Nutrition Research. 20: 191-201. Chavan, U.D., Shahidi, F., and Naczk, M. (2001). Extraction of condensed tannins from beach pea (Lathyrus maritimus L.) as affected by different solvents. Food Chemistry. 75: 509-512. Cherbut, C. (2002). Inulin and oligofructose in the dietary fiber concept. British Journal of Nutrition. 87: S159-S162. Claessens, G., Van Laere, A., and De Proft, M. (1990). Purification and properties of an inulinase from chicory roots (Chicorium intybus). J. Plant Physiol. 136: 35-39. Coussement, P. (1999). Inulin and oligofructose as dietary fiber: Analytical, nutritional and legal aspects. In: Complex carbohydrates in foods. Cho, S.S., Prosky, L., and Dreher, M. (eds), pp 203-227. Marcel Dekker. New York. Cruz, Vinícius D’Arcadia, Belote, Juliana Gisele, Belline, Márcia Zilioli et al. Production and action pattern of inulinase from Aspergillus Niger-245: Hydrolysis of inulin from several sources. Rev. Microbiol., Oct./Dec. 1998, vol.29, no.4, p.301-306. ISSN 0001-3714. Cummings, J.H., and Macfarlane, G.T. (2002). Gastrointestinal effects of prebiotics. British Journal of Nutrition. 87: S145-S151. D’Egidio, M.G., Cecchini, C., Cervigni, T., Donini, B., and Pignatelli, V. (1998). Production of fructose from cereal stems and polyannual cultures of Jerusalem artichoke. Industrial Crops and Products. 7: 113-119. Dames, J. (2003). Department of biochemistry, microbiology and biotechnology. Rhodes University. Grahamstown, South Afriaca. Personal communication.
References
101
De Roover, J., Van Laere, A., De Winter, M., Timmermans, J.W., and Van den Ende, W. (1999). Purification and properties of a second fructan exohydrolases from the roots of Cichorium intybus. Physiologia planturum. 106: 28-34. De Roover, J., Vandenbranden, K., Van Laere, A., and Van den Ende, W. (2000). Drought induces fructan synthesis and 1-SST (sucrose:sucrose fructosyltransferase) in roots and leaves of chicory seedlings (Chicorium intybus L.). Planta. 210: 808-814. Delzenne, N.M., Duabioul, C., Neyrinck, A., Lasa, M., and Taper, H.S. (2002). Inulin and oligofructose modulate lipid metabolism in animals: review of biochemical events and future prospects. British Journal of Nutrition. 87: S255-S259. Doughty, E.I. (1995). Choosing an HPLC column for carbohydrate analysis. Supelco. 14(1) 9-10. Druart, N., De Roover, J., Van den Ende, W., Goupil, P., Van Laere, A., and Rambour, S. (2001). Sucrose assimilation during early developmental stages of chicory (Chicorium intybus L.) plants. Planta. 212: 436-443. Emmons, A.M.C., and Mulder, B.M. (2000). How the deposition of cellulose microfobrils builds cell wall architecture. Trends in plant science. 5: 35-40. Figueira, G.M., Park, K.J., Brod, F.P.R., and Honorio, S.L. (2003). Evaluation of desorption isotherms, drying rates and inulin concentration of chicory roots (Chicorium intybus L.) with and without enzymatic activation. Journal of food Engineering. In press. Franck, A. (2002 a). Personal communication. ORAFTI, Belgium. Franck, A. (2002 b). Technological functionality of inulin and oligofructose. British Journal of Nutrition. 87: S287-S291. Gadgoli, C., and Mishra, S.H. (1997). Antihepatotoxic activity of Chicorium intybus. Journal of Ethnopharmacology. 58: 131-134. Gibson, G.R., and Roberfroid, M.B. (1995). Dietary modulation of the human colonic microbiota: Introducing the concept of prebiotics. Journal of Nutrition. 125: 1401-1412. Godshall, M.A., Vercellotti, J.R., and Triche, R.D. (2002). Effect of macromolecules on sugar processing: Comparison of cane and beet macromolecules. Int. Sugar Jnl. 104 (1241). Hanine, H., Mourgues, J., Conte, T., Malmary, G., and Molinier, J. (1992). Recovery of calcium aconitate from effluents from cane sugar production with ion exchange resins. 39(3): 221-227.
References
102
Hardy, M.R., and Townsend, R.R. (1994). High-pH anion-exchange chromatography of glycoprotein-derived carbohydrates. Methods in Enzymology. 230: 208-225. Harris, K.B., Pond, W.G., Mersmann, H.J., Smith, E.O., Cross, H.R., and Savell, J.W. (2003). Evaluation of fat sources on cholesterol and lipoproteins using pigs selected for high or low serum cholesterol. Meat Science. 66: 55-61. Harvey, D.J. (1999). Matrix-assisted laser desorption/ionization mass spectrometry of carbohydrates. Mass Spectrometry Reviews. 18: 349-451. Hazra, B., Sakar, R., Bhattacharyya, S., and Roy, P. (2002). Tumor inhibitory activity of chicory root extract against Ehrlich ascites carcinoma in mice. Fitoterapia. 73: 730-733. Henshall, A. (1999). High performance anion exchange chromatography with pulsed amperometric detection (HPAE-PAD): A powerful tool for the analysis of dietary fiber and complex carbohydrates. In: Complex carbohydrates in foods. Cho, S.S., Prosky, L., and Dreher, M. (eds), pp 267-289. Marcel Dekker. New York Henson, C. (1989). Purification and properties of barley stem fructan exohydrolase. J. Plant Physiol. 134: 186-191. Hirst, E.L., McGilvray, D.I., and Percival, E.G.V. (1950). Studies on fructosans. Part I. Inulin from Dahlia tubers. J. Chem. Soc., 263: 1297-1302. Ho, L.C., and Baker, D.A. (1982). Regulation of loading and unloading in long distance transport systems. Physiol Plant. 56: 225-230. Jackson, F.S., McNabb, W.C., Barry, T.N., Foo, Y.L., and Peters, J.S. (1996). The condensed tannin content of a range of subtropical and temperate forages and the reactivity of condensed tannin with ribulose-1.5-bisphosphate carboxylase (Rubisco) protein. J. Sci. Food Agric. 72: 483-492. Jackson, P. (1994). High resolution Polyacrylamide gel electrophoresis of fluorophore labeled reducing saccharides. Methods in enzymology. 230: 250-265. Jensen, W.A. (1964). The world of the cell. In: The plant cell. First edition. pp 9-23. Wordsworth Publishing Company. Jing, W., Zhengyu, J., Bo, J., and Augustine, A. (2002). Production and separation of exo- and endoinulinase from Aspergillus ficuum. Process Biochemistry. 00: 1-7. Kadim, I.T., Mahgoub, O., Srikandakumar, A., Al-Ajim, R.S., Al-Saqri, N.M., and Johnson, E.H. (2004). Comparative effect of low levels of dietary cobalt and parenteral injection of vitamin B12 on carcass and meat quality characteristics in Omani goats. Meat Science. 66: 837-844.
References
103
Kandra, L. (2003). A-Amylases of medical and industrial importance. Journal of Molecular structure (Theochem). In press. Kim, B.W., Choi, J.W., and Yun, J.W. (1998). Selective production of GF4-fructooligosaccharide from sucrose by a new transfrucosylating enzyme. Biotechnology Letters. 20: 1031-1034. Kim, J.H., and Lim, J. (2002). Enhanced production of endoinulinase by a cold temperature culture and sugar supplementation of recombinant Saccharomyces cerevisiae. Agric. Chem. Biotechnol. 45(3): 114-116. Kim, M. (2000). The water soluble extract of chicory reduces cholesterol uptake in gut perfused rats. Nutrition Research. 20: 1017-1026. Kim, Y., Faqih, M.N., and Wang, S.S. (2001). Factors affecting gel formation of inulin. Carbohydrate Polymers. 46: 135-145. Kisiel, W., and Zoelińska, K. (2001). Guaianolides from Chichorium intybus and structure revision of Chicorium sesquiterpene lactones. Phytochemistry. 57: 523-527. Koch, K., Anderson, R., Rydberg, I., and Åman, P. (1999). Influence of harvest date on inulin chain length distribution and sugar profile for six chicory (Chicorium intybus L) cultivars. J. Sci Food Agric. 79: 1503-1506. Kok, N.N., Morgan, L.M., Williams, C.M., Roberfroid, M.C., Thissen, J., and Delzenne, N.M. (1998). Insulin, glucagon-like peptide 1, glucose–dependent insulinotropic polypeptide and insulin-like growth factor I as putative mediators of the hypolipidemic effect of oligofructose in rats. Journal of Nutrition. 128: 1099-1103. Kolida, S., Tuohy, K., and Gibson, G.R. ((2002). Prebiotic effects of inulin and oligofructose. British Journal of Nutrition. 87: S193-S197. Kruger, N.J. (1995). Carbohydrate synthesis and degradation. In: Plant physiology, biochemistry and molecular biology. Dennis, D.T., and Turpin, D.H. (eds). pp 65-67. Longman Singapore publishers. Ku, Y., Jansen, O., Oles, C.J., Lazar, E.Z., and Rader, J.I. (2003). Precipitation of inulins and oligoglucoses by ethanol and other solvents. Food chemistry. 81: 125-132. L’homme, C.L., Puigserver, A., and Biagini, A. (2003). Effect of food processing on the degradation of fructooligosaccharides in fruit. Food Chemistry. 82: 533-537. Laemmli, UK. (1970). Cleavage of structural proteins during the assembly of the head of a bacteriophage. Nature. 227: 680-685.
References
104
Langvad, F. (1999). A rapid and efficient method for growth measurement of filamentous fungi. Journal of Microbiological Methods. 37: 97-100. Lewis, D.H. (1984). Occurrence and distribution of storage carbohydrates in vascular plants.In: Storage carbohydrates in vascular plants. D.H. Lewis (ed). pp 1-52. Cambridge University press, Cambridge. Lineback, D.R. (1999). The chemistry of complex carbohydrates. In: Complex carbohydrates in foods. . Cho, S.S., Prosky, L., and Dreher, M. (eds), pp 115-129. Marcel Dekker. New York. Liscum, L., and Munn, N.J. (1999). Intracellular cholesterol transport. Biochemica et Biophysica Acta (BBA). 1438: 19-37. Luckman, B., and Rossouw, G. (2003). Chicory S.A. story. South Africa. (unpublished). MacCabe, A.P., Orejas, M., Tamayo, E.N., Villaneuva, A., and Ramon, D. (2002). Improving extracellular production of food-use enzymes from Aspergillus nidulans. Journal of Biotechnology. 96: 43-54. Martin, J.S., and Martin, M. (1982). Tannin assays in ecological studies: lack of correlation between phenolics, proanthocyanidins and protein precipitating constituents in mature foliage of six oak species. Oecologia (Berl). 54: 205-211. Marx, S.F., Winkler, S., and Hartmeier, W. (2000). Metabolization of b-(2,6)-linked fructose-oligosaccharides by different bifidobacteria. FEMS Microbiology Letters. 182: 163-169. Mathews, C.K., and van Holde, K.E. (1990) a. Lipids, membranes and cellular transport. In: Biochemistry. pp 298-330. Benjamin/Cummings Publishing Company. California. Mathews, C.K., and van Holde, K.E. (1990) b. Tools of biochemistry. In: Biochemistry. pp 159-160. Benjamin/Cummings Publishing Company. California. Mckey, D. (1979). The distribution of secondary compounds within plants. In: Herbivores. Their interaction with secondary plant metabolites. Janzen, R. (ed), pp 56-122. Academic Press. New York. Meier, H., and Reid, J.S.G. (1982). Reserve polysaccharides other than starch in higher plants. In: Encyclopedia of Plant Physiology, New series, volume 13A. Loewus, F.A., and Tanner, W. (eds), pp 418-471. Springer-Verlag, Berlin. Menezes, H., and Jared, C. (2002). Immunity in plants and animals: common ends through different means using similar tools. Comparative Biochemistry and Physiology Part C. 123: 1-7.
References
105
Nadakavikaren, M., and McCraken D. (1985). Origins and development of plant science. In: Botany, an introduction to plant biology. pp 4-5. West publishing Company. Nakamura, T., Nagatomo, Y., Hamada, S., Nishino, Y and Ohta, K. (1994). Occurence of two forms of extracellular endoinulinase from Aspergillus niger mutant 817. J. Ferment. Bioeng. 78: 134-139. Nakamura, T., Ogata, Y., Shitara, A., Nakamura, A., and Ohta, K. (1995). Continous production of fructose syrups from inulin by immobilized inulinase from Aspergillus niger mutant 817. J. Ferment. Bioeng. 80: 164-169. Nyman, M. (2002). Fermentation and bulking capacity of indigestible carbohydrates: the case of inulin and oligofructose. British Journal of Nutrition. 87: S163-S168. O’Brien, C.M., Mueller, A., Scannell, A.G.M., and Arendt, E.K. (2003). Evaluation of the effects of fat replacers on the quality of wheat bread. Journal of food engineering. 56: 265-267. O’Shea, M.G., Samuel, M.S., Konik, C.M., and Morell, M.K. (1998). Fluorophore-assisted carbohydrate electrophoresis (FACE) of oligosaccharides: efficiency of labeling and high resolution separation. Carbohydrate Research. 307: 1-12. Ogawa, H., Rafiee, P., Fischer, P.J., Johnson, N.A., Otterson, M.F., and Binion D.G. (2003). Butyrare modulates gene and protein expression in human intestinal endothelial cells. BBRC. 309: 512-519. Osman, H., Nasarudin, R., and Lee, S.L. (2004). Extracts of cocoa (Theobroma cacao L.) leaves and their antioxidation potential. Food chemistry. 86: 41-46. Ohta, K., Hamada, S., and Nakamura, T. (1993). Production of high concentrations of ethanol from inulin by simultaneous saccharification and fermentation using Aspergillus niger and Saccharomyces cerevisiae. Applied and environmental microbiology. 59(3): 729-733. Papetti, A., Daglia, M., and Gazzani, G. (2002). Anti- and pro-oxidant activity of water soluble compounds in Chicorium intybus var. Silvestre (Trevisco red chicory). J. Pharm. Biomed. Anal. 30: 939-945. Park, H., Park, N.H., Kim, M., Lee, T., Lee, H., Yang, J., and Cha. J. (2003). Enzymatic synthesis of fructosyl oligosaccharides by levansucrase from Microbacterium laevaniformans ATCC15953. Enzyme and Microbial Technology. 32: 820-827. Parks, E.J. (2002). Dietary carbohydrate’s effects on lipogenesis and the relationship of lipogenesis to blood insulin and glucose concentrations. British Journal of Nutrition. 87: S247-S253.
References
106
Park, J.P., Oh, T.K., and Yun, J.W. (2001). Purification and characterization of a novel transfructolsylating enzyme from Bacillus macerans E.G-6. Process Biochemistry. 37: 471-476. Park, J.P., Bae, J.T., and Yun, J.W. (1999). Critical effect of ammonium ions on the enzymatic reaction of a novel transfructosylating enzyme for fructooligosaccharide production from sucrose. Biotechnology letters. 21: 987-990. Passador-Gurgel, G.C., Furlan, S.A., Meller, J.K., and Jonas, R. (1996). Application of a microtiter reader system to the screening of inulinase nulinase-producing yeast. Appl. Microbiol. Biotechnol. 45: 158-161. Patrick, J.W. (1990). Sieve element unloading: cellular pathway, mechanisms and control. Physiol Plant. 37: 223-228. Perez, Serge., Mzeau, K., and du Penhoat, C.H. (2000). The three dimensional structures of the pectic polysaccharides. Plant Physiol. Biochem. 38: 37-55. Poli, F., Sacchetti, G., Tosi, B., Fogagnolo, M., Chillemi, G., Lazzarin, R., and Bruni, A. (2002). Variation in the content of the main guaianolides and sugars in Chicorium intybus var. “ Rosso di Chioggia’’ selections during cultivation. Food Chemistry. 76: 139-147. Putman, E.W. (1950). Column chromatography of sugars. J. Am. Chem. Soc. 72: 677. Rao, A.V. (1999). Dose-response effects of inulin and oligofructose on intestinal bifidogenesis effects. Journal of Nutrition. 129: 1442S-1445S). Raven, J.A. (1987). The role of vacuoles.New Phytol. 106: 357-422. Rees, S.B., and Harborne, J.B. (1985). The role of sesquiterpene lactones and phenolics in the chemical defence of the chicory plant. Phytochemistry. 24(10): 2225-2231. Reiter, W.D. (2002). Biosynthesis and properties of the plant cell wall. Current Opinion in Plant Biology. 5: 336-542. Ritsema, T., and Smeekens, S. (2003). Fructans: beneficial for plants and humans. Current Opinion in Plant Biology. 6: 223-230. Roberfroid, M.B. (2002). Functional foods: concepts and application to inulin and oligofructose. British Journal of Nutrition. 87: S139-S143. Salisbury, F.B., and Ross, C.W. (1992). Plant physiology and plant cells. In: Plant physiology. Pp 8-24. Wadsworth Publishing Company.
References
107
Schiller, J., and Arnold, K. (2000). Mass spectrometry in structural biology. In: Encyclopedia of analytical chemistry. Meyers, R.A. (ed), pp 559-585. John Wiley and Sons. Chichester. Schley, P.D., and Field, C.J. (2002). The immune enhancing effects of dietary fibers and prebiotics. British Journal of Nutrition. 87: S221-S230. Shaw, M. (1998). Cell membrane physiology. University of Manitoba. Siebel, M.A. (1992). Batch reactors. In Bioreactor design and product yield. Van Dam-Mieras, M.C.E., de Jeu, W.H., de Vries, J., Currell, B.R., James, W., Leach, C.K., and Patmore, R.A. (eds), pp 104-111. Butterworth-Heinemann (Ltd) Smith C.A. and Wood E.J. (1991). Basic principles; polysaccharides in: Molecular and Cell Biochemistry (biological molecules). Firman S. and Ockenden J. (eds), Chapman and Hall, New York, USA. pp 14, 130, 138 Somogyi, M. (1952). Notes on sugar determination. J.Biol. Chem. 195: 19-23. Sprenger, N., Schellenbaum, L., Van Dun, K., Boller, T., and Wiemken, A. (1997). Fructan synthesis in transgenic tobacco and chicory plants expressing barley sucrose:Fructan 6-fructosyltransferase. FEBS Letters. 400: 355-358. Stahl, B., Linos, A., Karas, M., Hillenkamp, F., and Steup, M. (1997). Analysis of fructans from higher plants by matrix laser desorption /ionization mass spectrometry. Analytical Biochemistry. 246: 194-204. Sturm, A. (1999). Invertases. Primary structures, functions and roles in plant development and sucrose partitioning. Plant Physiol. 121: 1-8. Switzer, R.C. (1979). A highly sensitive silver stain for detecting proteins and peptides in polyacrylamide gels. Anal. Biochem. 98: 231-237 Vandamme, E.J., and Derycke, D.G. (1983). Fermentation process, properties and applications. Advances in applied microbiology. 29: 139-176. Vandamme, T.F., Lenourry, A., Charrueau, C., and Chaumeil, J.C. (2002). The use of polysaccharides to target drugs to the colon. Carbohydrate polymers. 48: 219-231. Vereyken, I.J., Chupin, V., Demel, R.A., Smeekens, S.C.M., and De Kruijff, B. (2001). Fructans insert between the headgroups of phospholipids. BBA. 1510: 307-320. Verpoorte, R., and Memelink, J. (2002). Engineering secondary metabolite production in plants. Current Opinion in Biochemistry. 13: 181-187.
References
108
Vijn, I., and Smeekens, S. (1999). Fructan: More than a reserve carbohydrate? Plant Physiol. 120: 351-360. Vingaard, M.G., Steinkraus, D.C., Boys, G.O., and Eilenberg, J. (2003). Effects of long term storage at -14 °C on the survival of Neozygites fresenii (Entomophthorales: Neozygitaceae) in cotton aphids (Homoptera: Aphididae). Journal of Invertebrate Pathology. 82: 97-102. Wall, M.E., Taylor, H., Ambrosio, L., and Davis, K. (1969). Plant antitumor agents III: A convenient separation of tannins from other plant constituents. Journal of Pharmaceutical Sciences. 58(7): 839-841. Winkel-Shirley, B. (2002). Biosynthesis of flavonoids and effects of sress. Current Opinion in Plant Biology. 5: 218-223. Wolff, D., Czapla, S., Heyer, A.G., Radosta, S., Miscnick, P., and Springer, J. (2000). Globular shape of high molar mass inulin revealed by static light scattering and viscmetry. Polymer. 41: 8009-8016. Woods, C. (2000). Pathogen perception. Trends in Plant Science. 5: 185-186. Young, B.S. (1958). The economic geography of the union. Rhodes University, M.A thesis. Grahamstown, South Africa pp 1-38. Zafar, R., and Ali, S.M. (1998). Anti-hepatotoxic effects of root and root callus extracts of Chicorium intybus L. Journal of Ethnopharmacology. 63: 227-231. Zhang, M., De Baerdemaeker, J., and Schrevens, E. (2003). Effects of different varieties and shelf storage conditions of chicory on deteriotative colour changes using digital image processing and analysis. Food Research International. 36: 669-676. Zhang, C.X., Wu, H., Weng, X.C. (2004). Two novel synthetic antioxidants for deep frying oils. Food chemistry. 84: 219-222. Internet reference Hullet S.A. (2004). Cane and Bagasse diffusers. http://www.huletts.co.za/diffuser.html (accessed 5th May 2004) Safari-SA. (2004).South Africa-map and climate. http://www.safari-sa.com/sitemap (accessed 4th January 2004). Rohm and Haas company. (2002). Amberlite® FPA 98 Cl, food grade strong base anion exchanger for the decolourization of sucrose solutions. http://www.rohmhaas.com/ionexchange (accessed 17th May 2004).
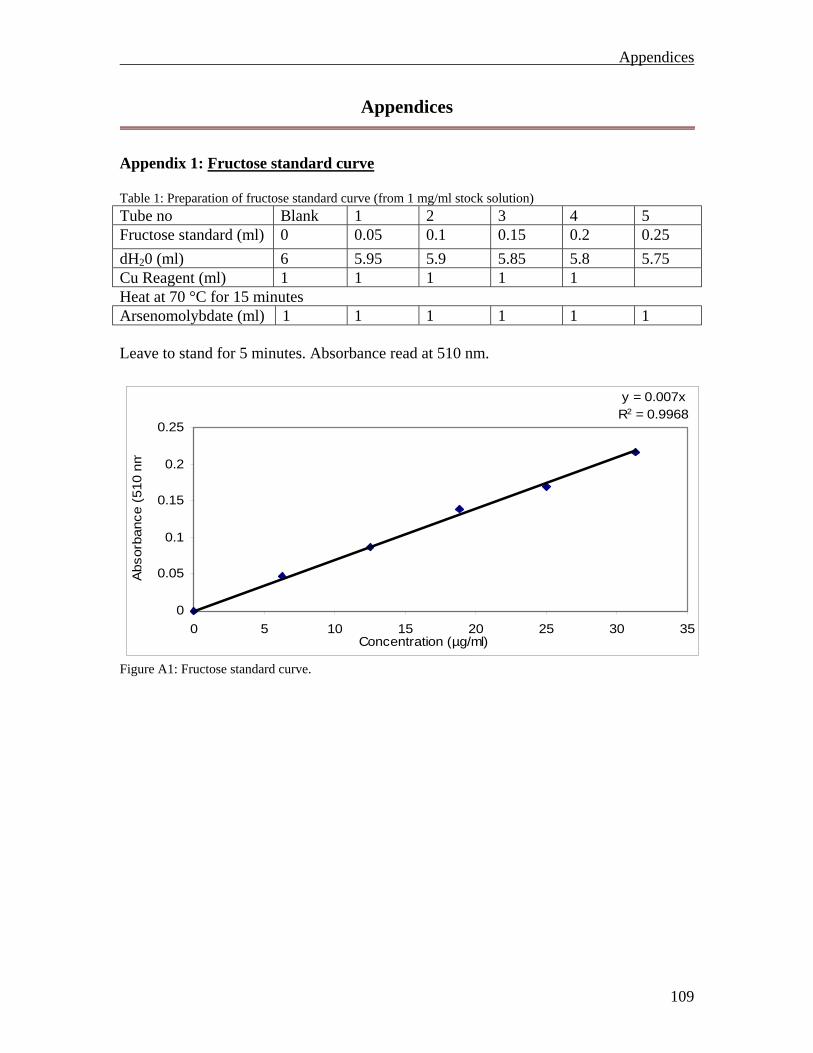
Appendices
109
Appendices
Appendix 1: Fructose standard curve Table 1: Preparation of fructose standard curve (from 1 mg/ml stock solution) Tube no Blank 1 2 3 4 5 Fructose standard (ml) 0 0.05 0.1 0.15 0.2 0.25 dH20 (ml) 6 5.95 5.9 5.85 5.8 5.75 Cu Reagent (ml) 1 1 1 1 1 Heat at 70 °C for 15 minutes Arsenomolybdate (ml) 1 1 1 1 1 1 Leave to stand for 5 minutes. Absorbance read at 510 nm.
y = 0.007xR2 = 0.9968
0
0.05
0.1
0.15
0.2
0.25
0 5 10 15 20 25 30 35Concentration (µg/ml)
Abs
orba
nce
(510
nm
Figure A1: Fructose standard curve.
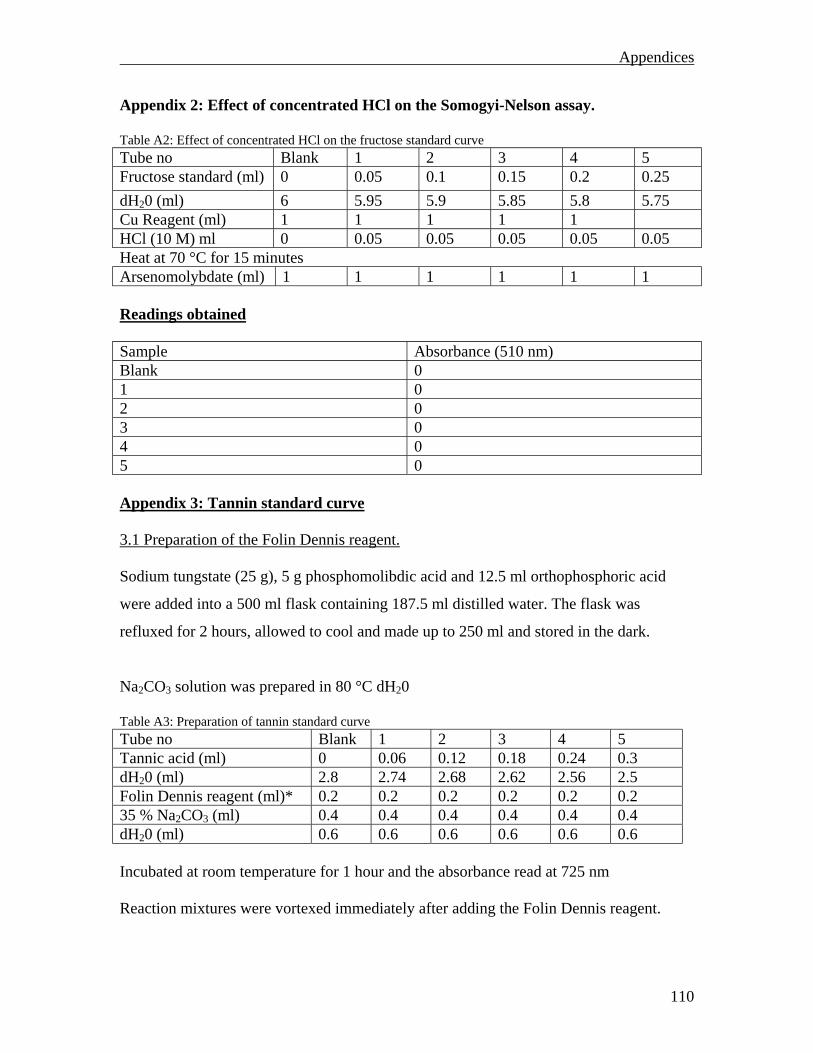
Appendices
110
Appendix 2: Effect of concentrated HCl on the Somogyi-Nelson assay. Table A2: Effect of concentrated HCl on the fructose standard curve Tube no Blank 1 2 3 4 5 Fructose standard (ml) 0 0.05 0.1 0.15 0.2 0.25 dH20 (ml) 6 5.95 5.9 5.85 5.8 5.75 Cu Reagent (ml) 1 1 1 1 1 HCl (10 M) ml 0 0.05 0.05 0.05 0.05 0.05 Heat at 70 °C for 15 minutes Arsenomolybdate (ml) 1 1 1 1 1 1 Readings obtained Sample Absorbance (510 nm) Blank 0 1 0 2 0 3 0 4 0 5 0 Appendix 3: Tannin standard curve 3.1 Preparation of the Folin Dennis reagent. Sodium tungstate (25 g), 5 g phosphomolibdic acid and 12.5 ml orthophosphoric acid
were added into a 500 ml flask containing 187.5 ml distilled water. The flask was
refluxed for 2 hours, allowed to cool and made up to 250 ml and stored in the dark.
Na2CO3 solution was prepared in 80 °C dH20 Table A3: Preparation of tannin standard curve Tube no Blank 1 2 3 4 5 Tannic acid (ml) 0 0.06 0.12 0.18 0.24 0.3 dH20 (ml) 2.8 2.74 2.68 2.62 2.56 2.5 Folin Dennis reagent (ml)* 0.2 0.2 0.2 0.2 0.2 0.2 35 % Na2CO3 (ml) 0.4 0.4 0.4 0.4 0.4 0.4 dH20 (ml) 0.6 0.6 0.6 0.6 0.6 0.6 Incubated at room temperature for 1 hour and the absorbance read at 725 nm Reaction mixtures were vortexed immediately after adding the Folin Dennis reagent.
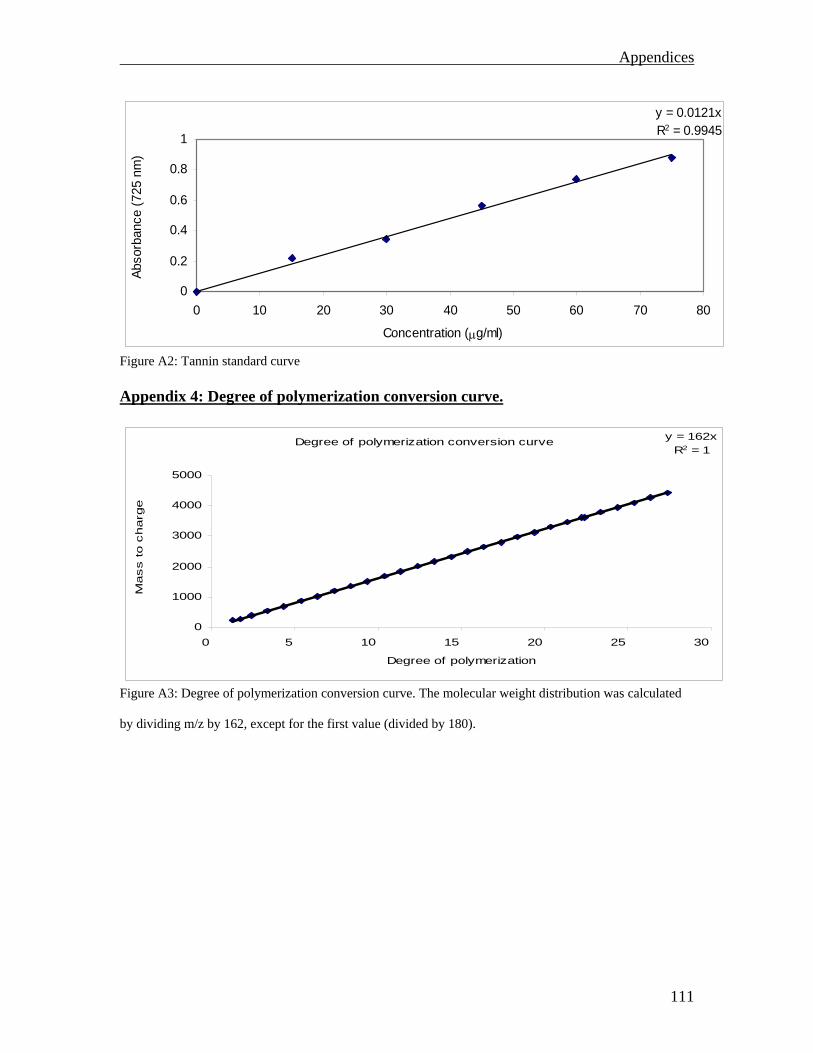
Appendices
111
y = 0.0121xR2 = 0.9945
0
0.2
0.4
0.6
0.8
1
0 10 20 30 40 50 60 70 80
Concentration (µg/ml)
Abso
rban
ce (7
25 n
m)
Figure A2: Tannin standard curve Appendix 4: Degree of polymerization conversion curve.
Degree of polymerization conversion curve y = 162xR2 = 1
0
1000
2000
3000
4000
5000
0 5 10 15 20 25 30
Degree of polymerization
Mass to c
harg
e
Figure A3: Degree of polymerization conversion curve. The molecular weight distribution was calculated
by dividing m/z by 162, except for the first value (divided by 180).
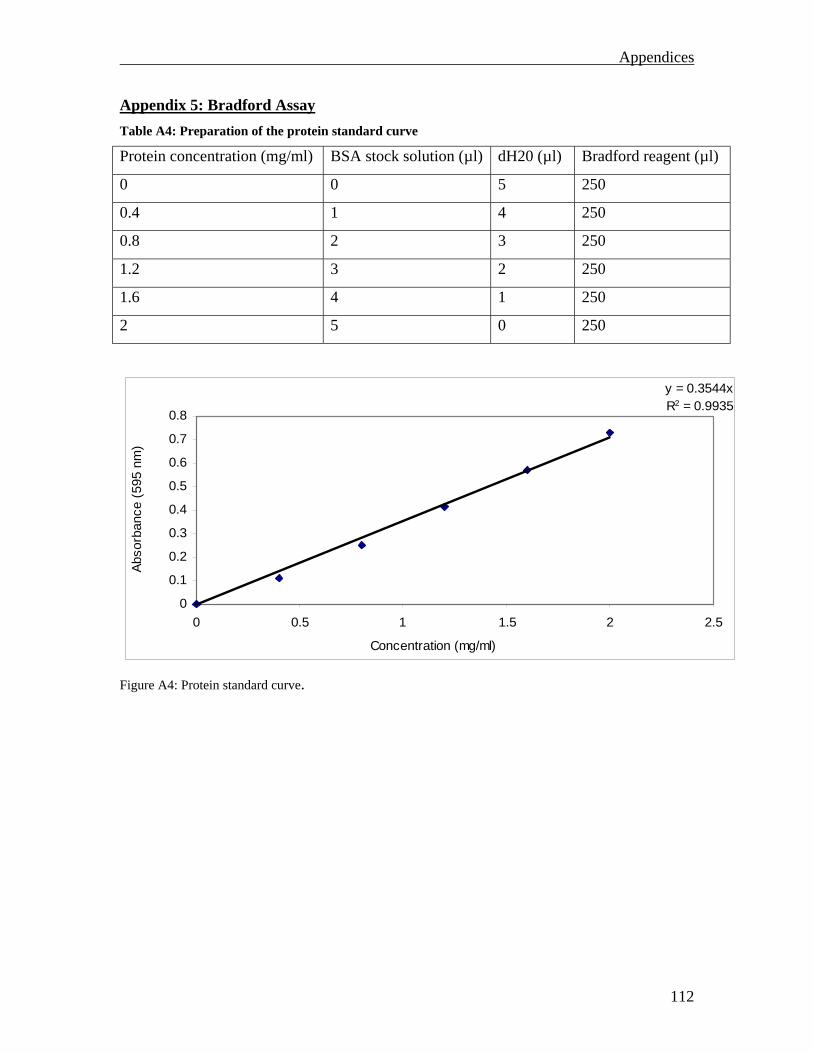
Appendices
112
Appendix 5: Bradford Assay Table A4: Preparation of the protein standard curve
Protein concentration (mg/ml) BSA stock solution (µl) dH20 (µl) Bradford reagent (µl)
0 0 5 250
0.4 1 4 250
0.8 2 3 250
1.2 3 2 250
1.6 4 1 250
2 5 0 250
y = 0.3544xR2 = 0.9935
0
0.1
0.2
0.3
0.4
0.5
0.6
0.7
0.8
0 0.5 1 1.5 2 2.5
Concentration (mg/ml)
Abso
rban
ce (5
95 n
m)
Figure A4: Protein standard curve.


![[a Fuchs] Inulin and Inulin-containing Crops(BookZZ.org)](https://img.pdfslide.net/doc/110x75/5695d16f1a28ab9b02968236/a-fuchs-inulin-and-inulin-containing-cropsbookzzorg.jpg)