Embed Size (px)
Citation preview
5/7/2012
1
James E. MorrisDepartment of Electrical & Computer Engineering
Portland State University
P.O.Box 751, Portland OR 97207-0751, USA
IsotropicElectrically Conductive Adhesives
5/7/2012
ICA: Isotropic Conductive Adhesives
Current pathPowder
Flakes (Ag)Polymer
ICA: Flip Chip Interconnect
ICA: SMT Interconnect
Contents•Introduction
•Applications•Processing
•Resistance & measurement•Nanotechnology•Layering effect•Adhesion•Drop test•Galvanic corrosion•Cure models• Miscellaneous
James E. Morris OSU Seminar2
5/7/2012
2
5/7/2012
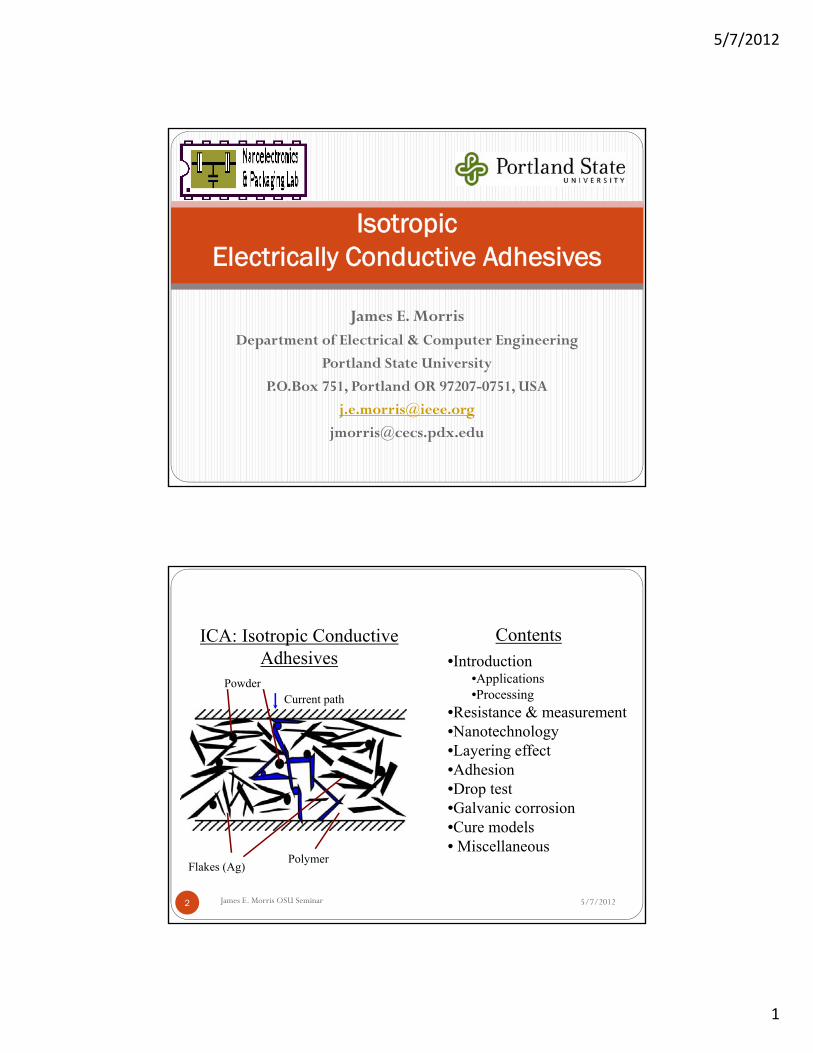
SMT joint showing Ag flakes
Flip-chip joint showing Ag flakes: Top: Si chip bump Bottom: PWB pad
James E. Morris OSU Seminar3
ICA applications:Solder replacement in SMT &
flip chip
Bosch Diesel Fuel Injection Pump
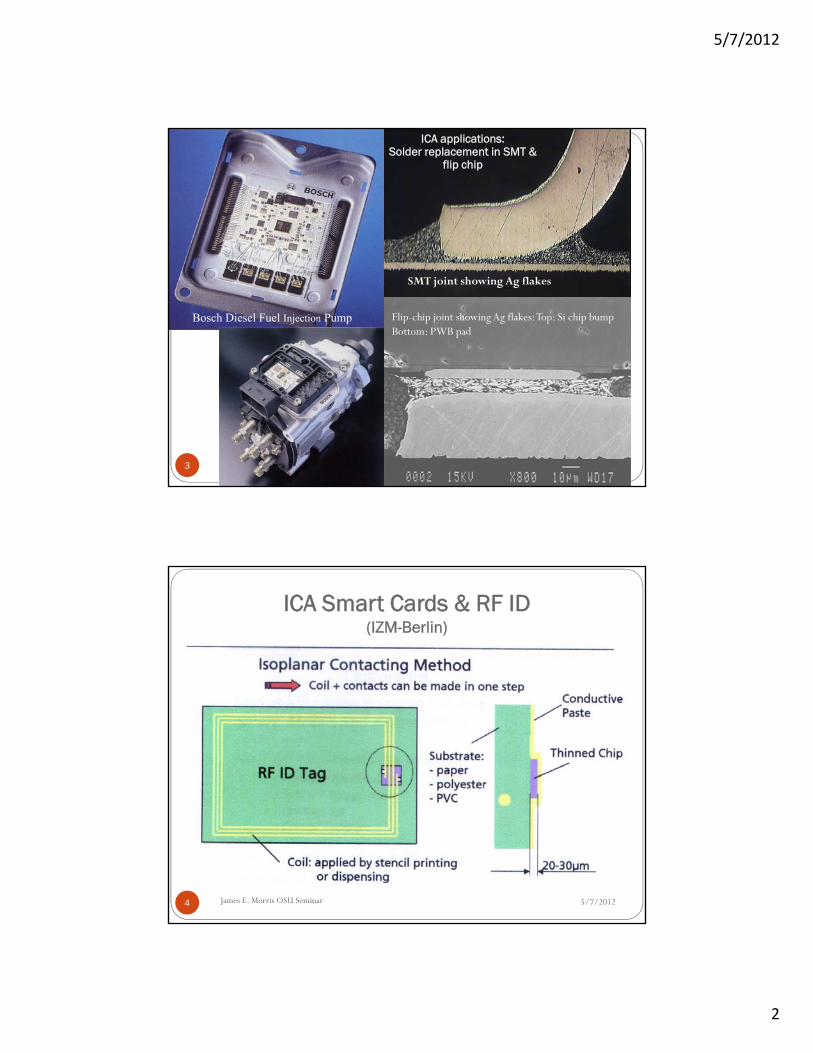
ICA Smart Cards & RF ID (IZM-Berlin)
5/7/2012James E. Morris OSU Seminar4
5/7/2012
3
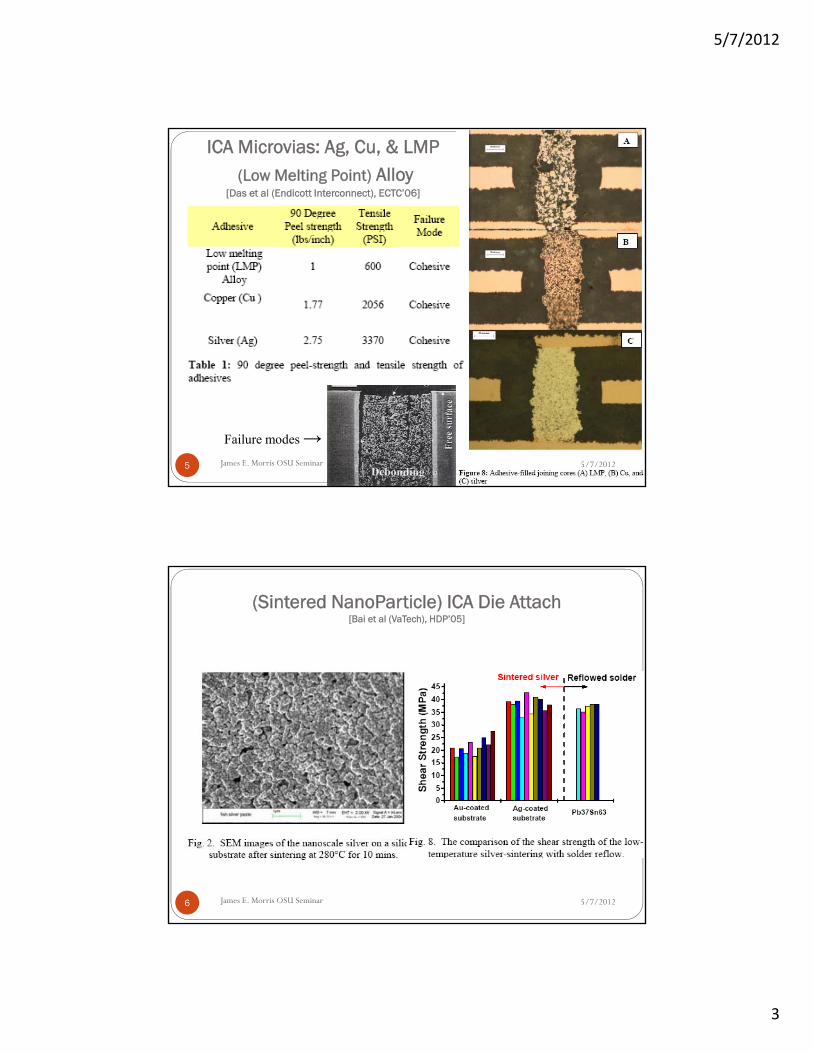
ICA Microvias: Ag, Cu, & LMP(Low Melting Point) Alloy
[Das et al (Endicott Interconnect), ECTC’06]
5/7/2012
Failure modes →James E. Morris OSU Seminar5
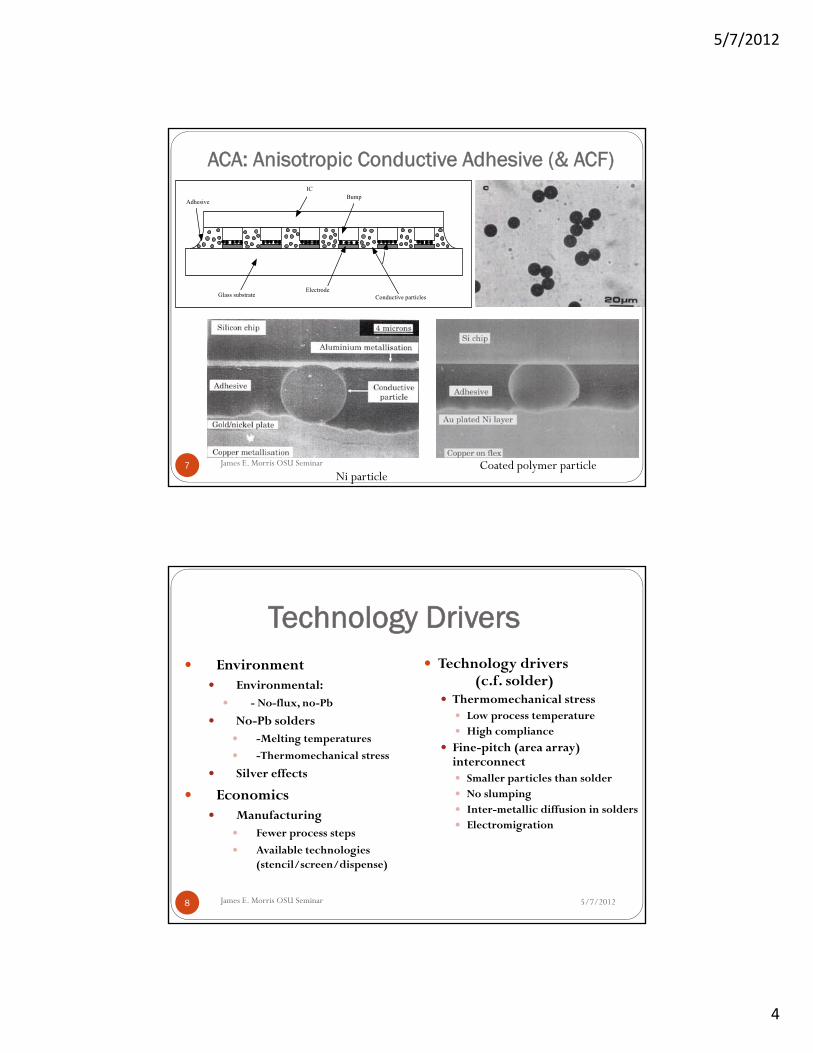
(Sintered NanoParticle) ICA Die Attach [Bai et al (VaTech), HDP’05]
5/7/2012James E. Morris OSU Seminar6
5/7/2012
4
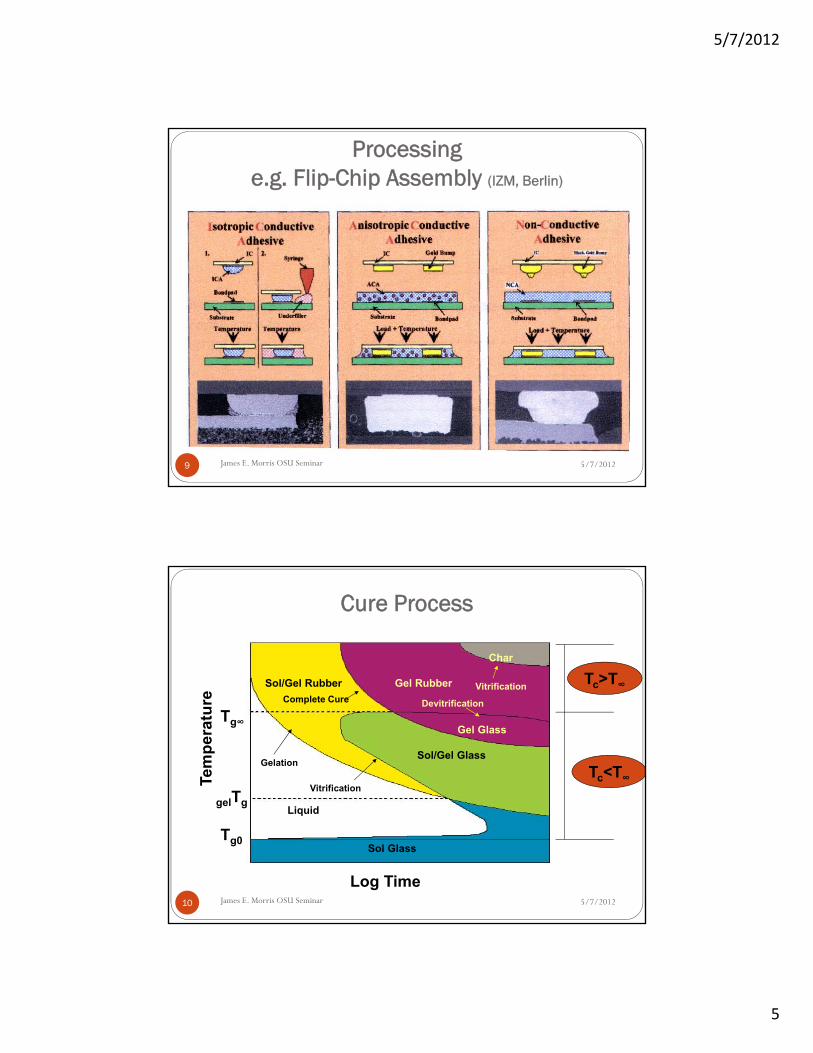
ACA: Anisotropic Conductive Adhesive (& ACF)IC
BumpAdhesive
Glass substrateElectrode
Conductive particles
Ni particleCoated polymer particleJames E. Morris OSU Seminar7
Technology Drivers
5/7/2012
Environment Environmental:
- No-flux, no-Pb
No-Pb solders -Melting temperatures
-Thermomechanical stress
Silver effects
Economics Manufacturing
Fewer process steps
Available technologies (stencil/screen/dispense)
Technology drivers(c.f. solder)
Thermomechanical stress Low process temperature High compliance
Fine-pitch (area array) interconnect Smaller particles than solder No slumping Inter-metallic diffusion in solders Electromigration
James E. Morris OSU Seminar8
5/7/2012
5
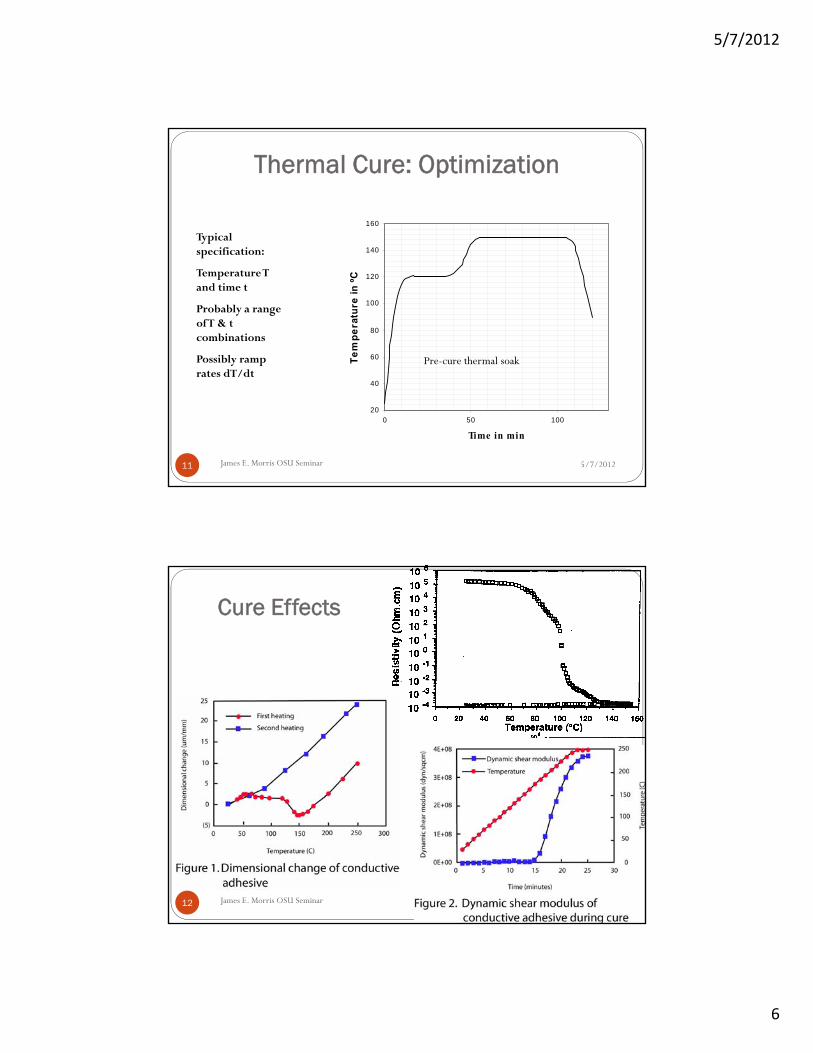
Processinge.g. Flip-Chip Assembly (IZM, Berlin)
5/7/2012James E. Morris OSU Seminar9
Cure Process
5/7/2012
Log Time
Tem
per
atu
re
Tg0
gelTg
Tg∞
Liquid
Sol/Gel Rubber Gel Rubber
Gel Glass
Char
Sol/Gel GlassGelation
Vitrification
Complete CureVitrification
Devitrification
Tc>T∞
Tc<T∞
Sol Glass
James E. Morris OSU Seminar10
5/7/2012
6
Thermal Cure: Optimization
5/7/2012
20
40
60
80
100
120
140
160
0 50 100
Time in min
Te
mp
era
ture
in º
C
Typical specification:
Temperature T and time t
Probably a range of T & t combinations
Possibly ramp rates dT/dt
Pre-cure thermal soak
James E. Morris OSU Seminar11
Cure Effects
5/7/2012James E. Morris OSU Seminar12
5/7/2012
7
5/7/2012
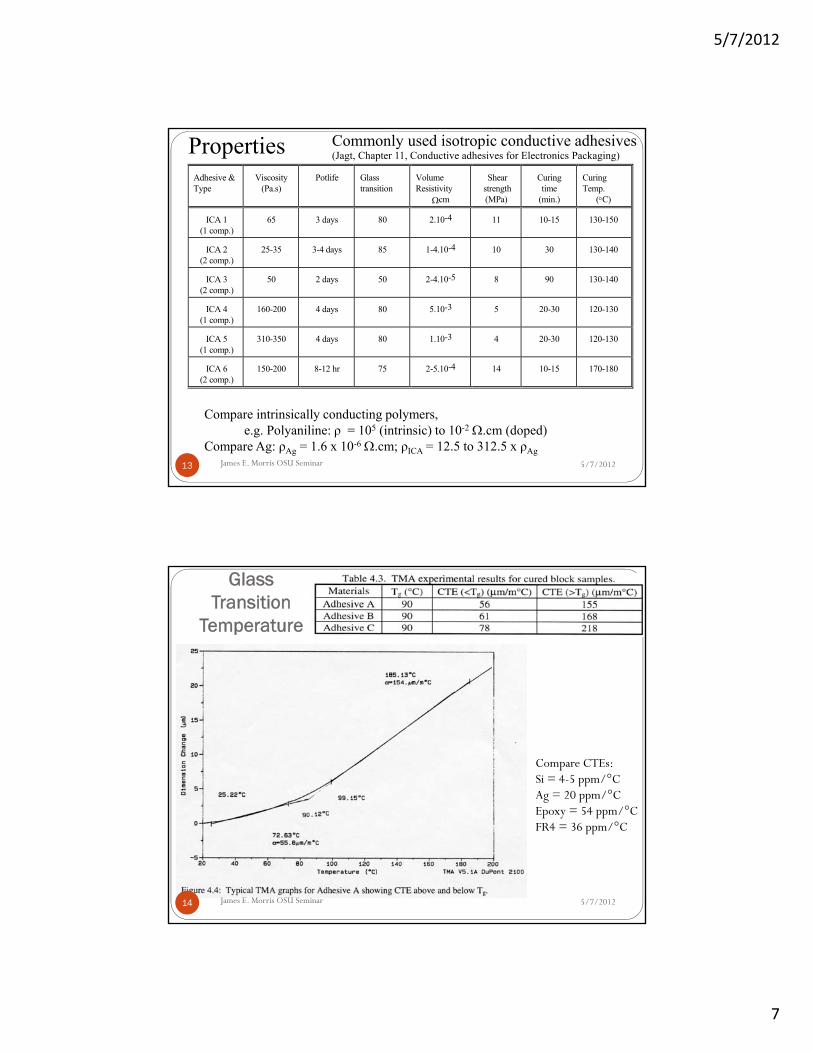
Adhesive &Type
Viscosity(Pa.s)
Potlife Glasstransition
VolumeResistivity
cm
Shear strength(MPa)
Curingtime
(min.)
CuringTemp.
(C)
ICA 1(1 comp.)
65 3 days 80 2.10-4 11 10-15 130-150
ICA 2(2 comp.)
25-35 3-4 days 85 1-4.10-4 10 30 130-140
ICA 3(2 comp.)
50 2 days 50 2-4.10-5 8 90 130-140
ICA 4(1 comp.)
160-200 4 days 80 5.10-3 5 20-30 120-130
ICA 5(1 comp.)
310-350 4 days 80 1.10-3 4 20-30 120-130
ICA 6(2 comp.)
150-200 8-12 hr 75 2-5.10-4 14 10-15 170-180
Compare intrinsically conducting polymers, e.g. Polyaniline: ρ = 105 (intrinsic) to 10-2 .cm (doped)
Compare Ag: ρAg = 1.6 x 10⁻⁶ .cm; ρICA = 12.5 to 312.5 x ρAg
Properties Commonly used isotropic conductive adhesives(Jagt, Chapter 11, Conductive adhesives for Electronics Packaging)
James E. Morris OSU Seminar13
Glass Transition
Temperature
5/7/2012
Compare CTEs:Si = 4-5 ppm/°CAg = 20 ppm/°CEpoxy = 54 ppm/°CFR4 = 36 ppm/°C
James E. Morris OSU Seminar14
5/7/2012
8
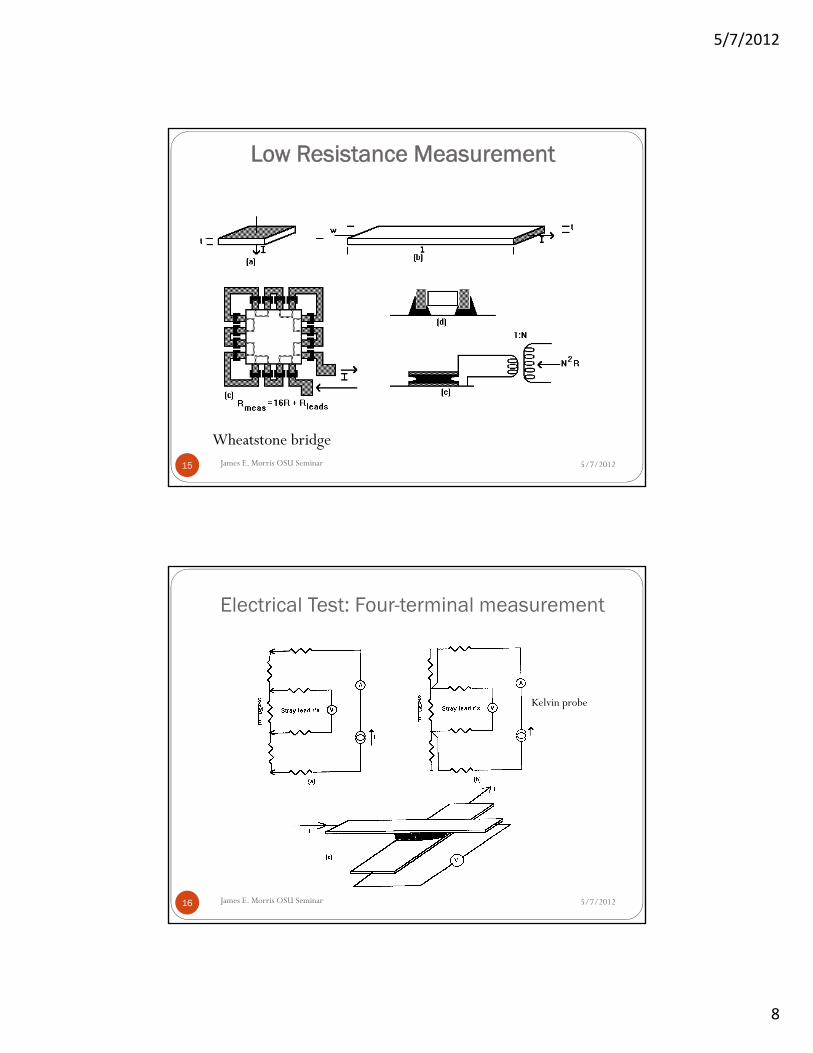
Low Resistance Measurement
5/7/2012
Wheatstone bridgeJames E. Morris OSU Seminar15
Electrical Test: Four-terminal measurement
5/7/2012James E. Morris OSU Seminar16
Kelvin probe
5/7/2012
9
5/7/2012
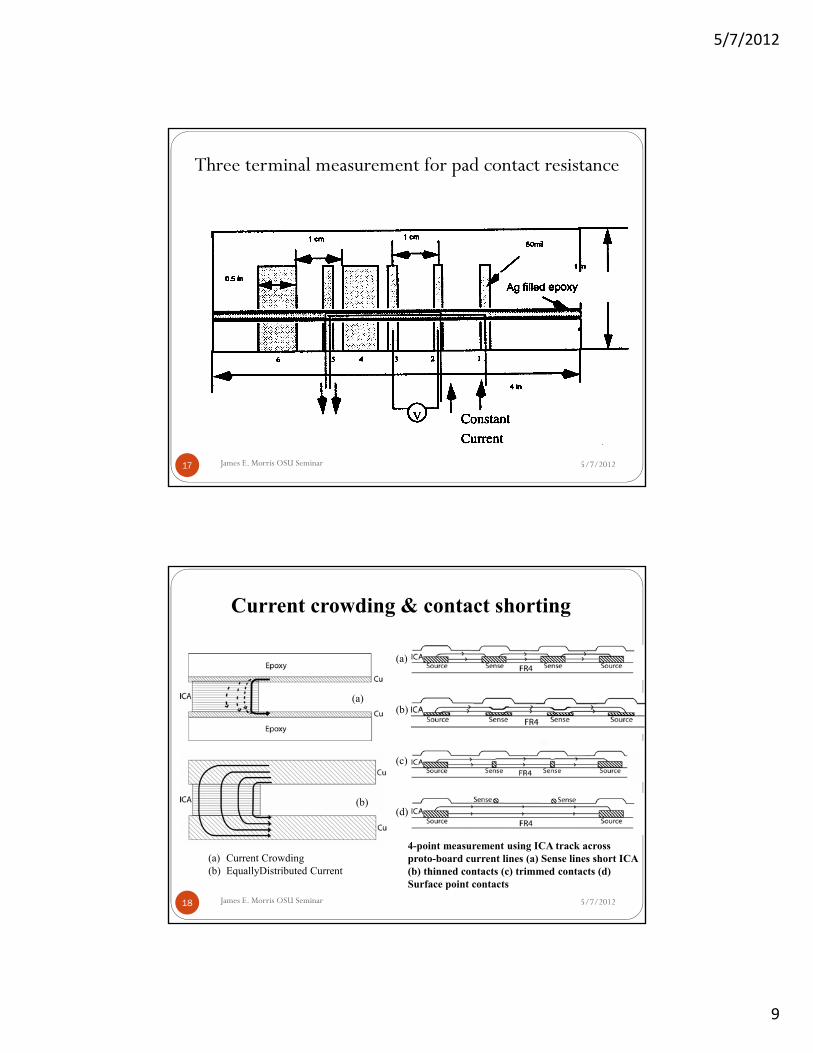
Three terminal measurement for pad contact resistance
James E. Morris OSU Seminar17
5/7/2012
(a) Current Crowding(b) EquallyDistributed Current
Current crowding & contact shorting
(a)
(b)
(c)
(d)
4-point measurement using ICA track across proto-board current lines (a) Sense lines short ICA (b) thinned contacts (c) trimmed contacts (d) Surface point contacts
(a)
(b)
James E. Morris OSU Seminar18
5/7/2012
10
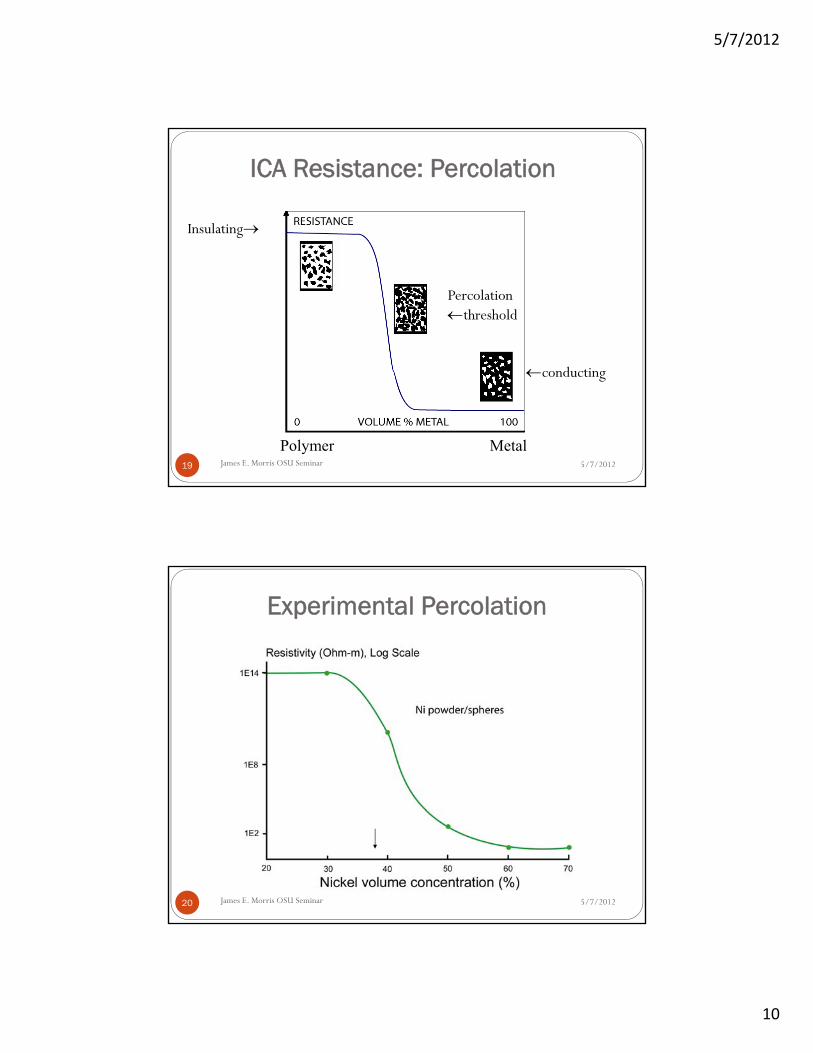
ICA Resistance: Percolation
5/7/2012
Polymer Metal
Percolation threshold
Insulating
conducting
James E. Morris OSU Seminar19
Experimental Percolation
5/7/2012James E. Morris OSU Seminar20
5/7/2012
11
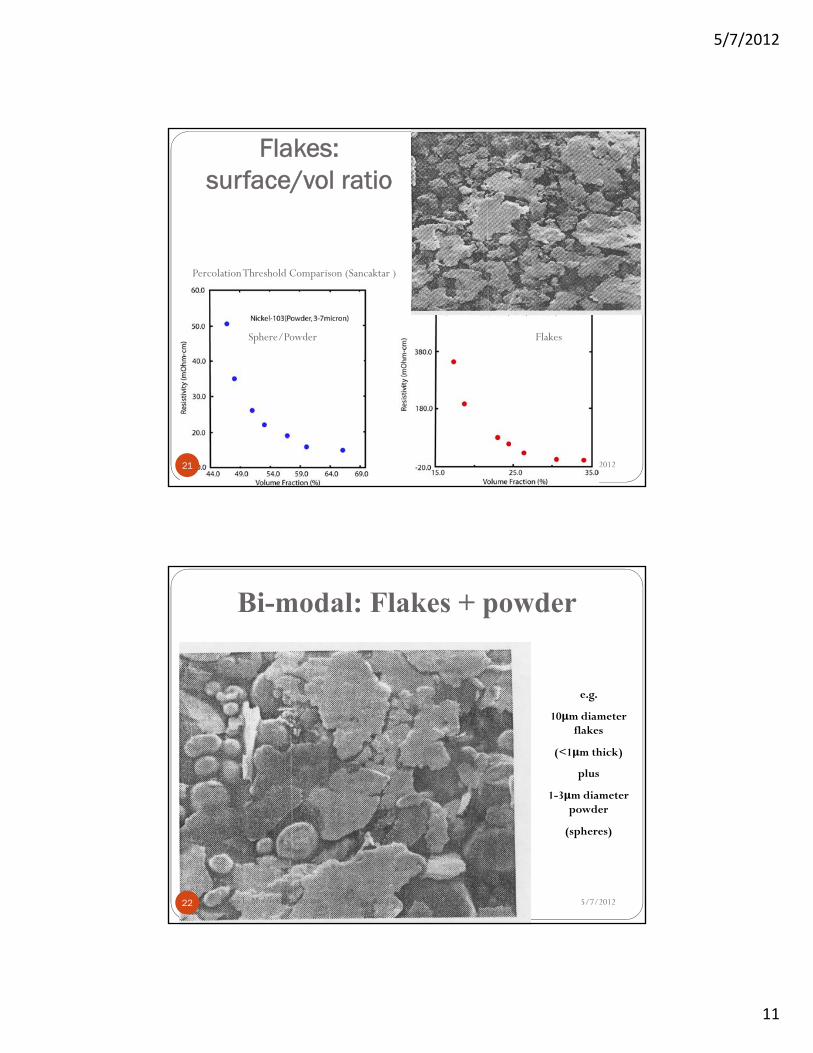
Flakes: surface/vol ratio
5/7/2012
Percolation Threshold Comparison (Sancaktar )
Sphere/Powder Flakes
21
5/7/2012
Bi-modal: Flakes + powder
e.g.
10μm diameter flakes
(<1μm thick)
plus
1-3μm diameterpowder
(spheres)
James E. Morris OSU Seminar22
5/7/2012
12
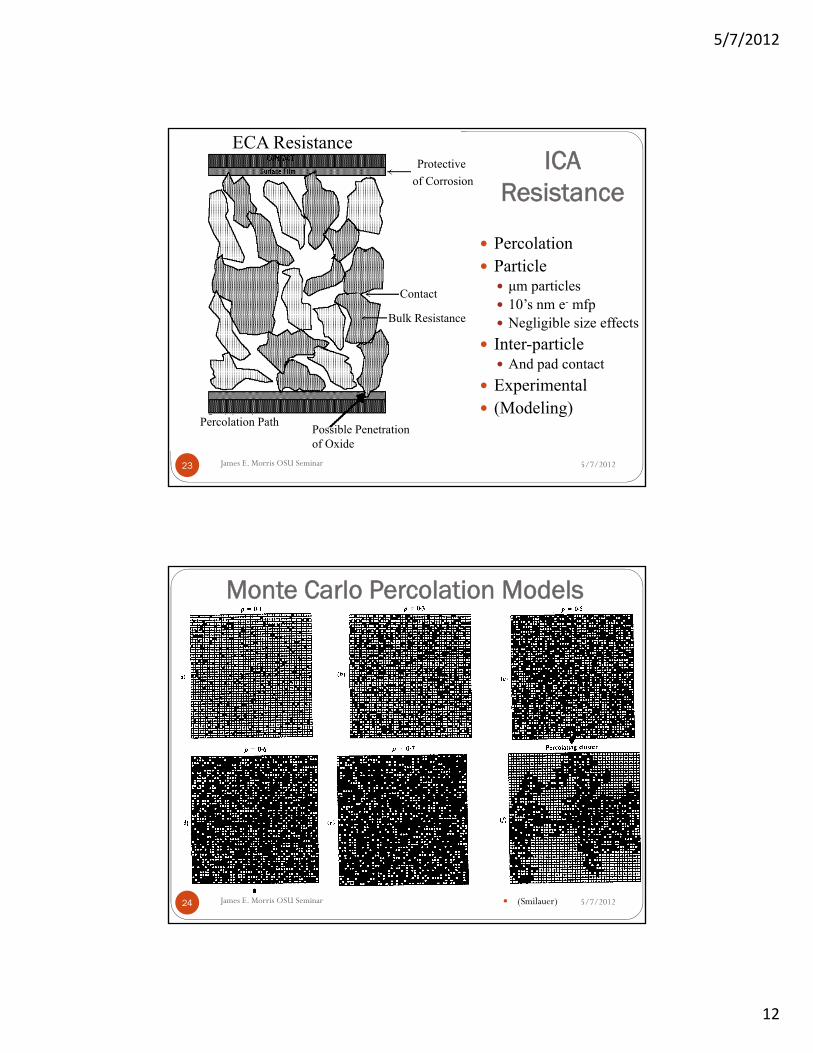
ICA Resistance
5/7/2012
Percolation Particle μm particles 10’s nm e- mfp Negligible size effects
Inter-particle And pad contact
Experimental (Modeling)
ECA ResistanceProtective
of Corrosion
Bulk Resistance
Contact
Percolation PathPossible Penetration of Oxide
James E. Morris OSU Seminar23
Monte Carlo Percolation Models
5/7/2012 (Smilauer)James E. Morris OSU Seminar24
5/7/2012
13
5/7/2012
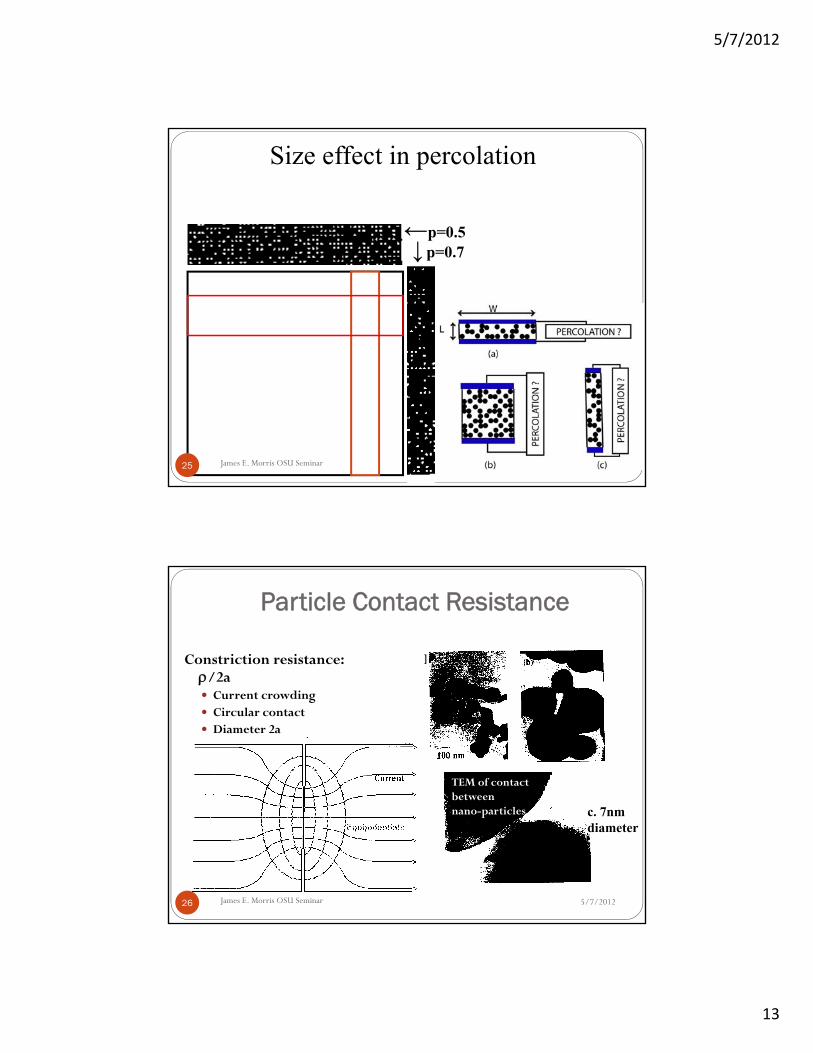
Size effect in percolation
←p=0.5↓p=0.7
James E. Morris OSU Seminar25
Particle Contact Resistance
Constriction resistance: R = /2a Current crowding Circular contact Diameter 2a
5/7/2012
TEM of contact between nano-particles c. 7nm
diameter
James E. Morris OSU Seminar26
5/7/2012
14
Polymer/Insulating Oxide
5/7/2012
Thermionic emission (with Schottky effect)
Electron tunneling (with image effect)
Poole-Frenkel emission
Fowler-Nordheim tunneling
TCR 0 & field effects for various mechanisms None of these observed
James E. Morris OSU Seminar27
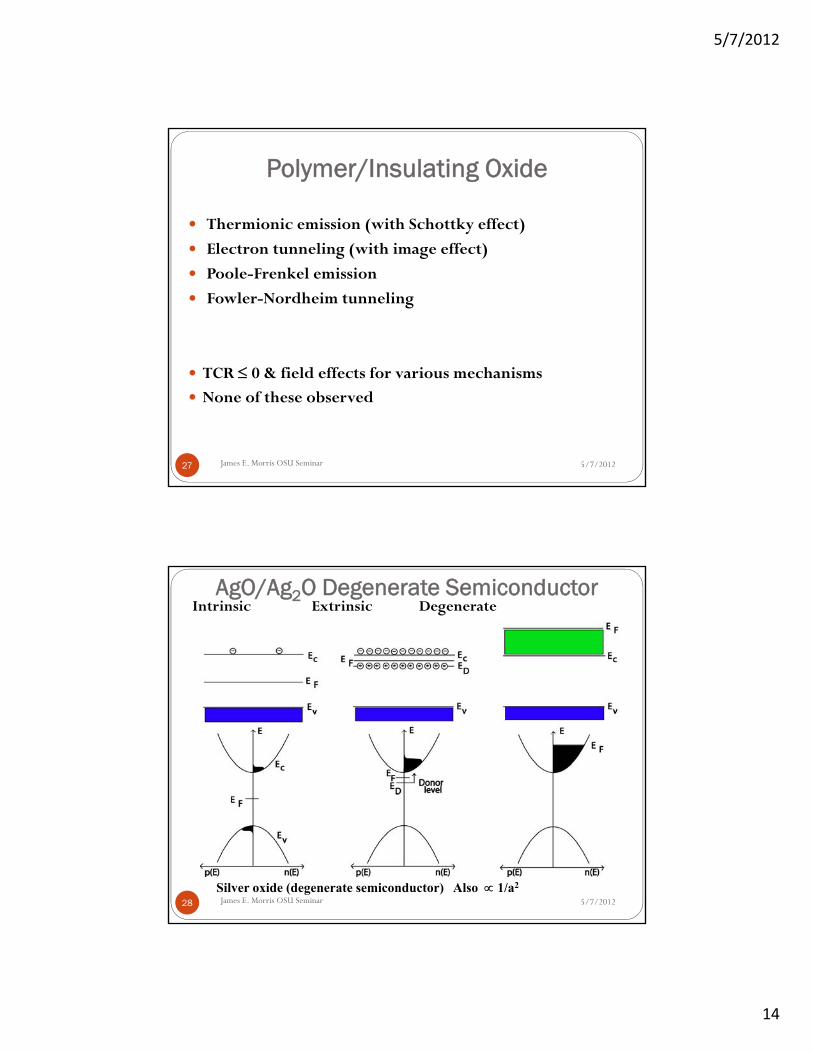
AgO/Ag2O Degenerate Semiconductor
5/7/2012
Intrinsic Extrinsic Degenerate
Silver oxide (degenerate semiconductor) Also 1/a2
James E. Morris OSU Seminar28
5/7/2012
15
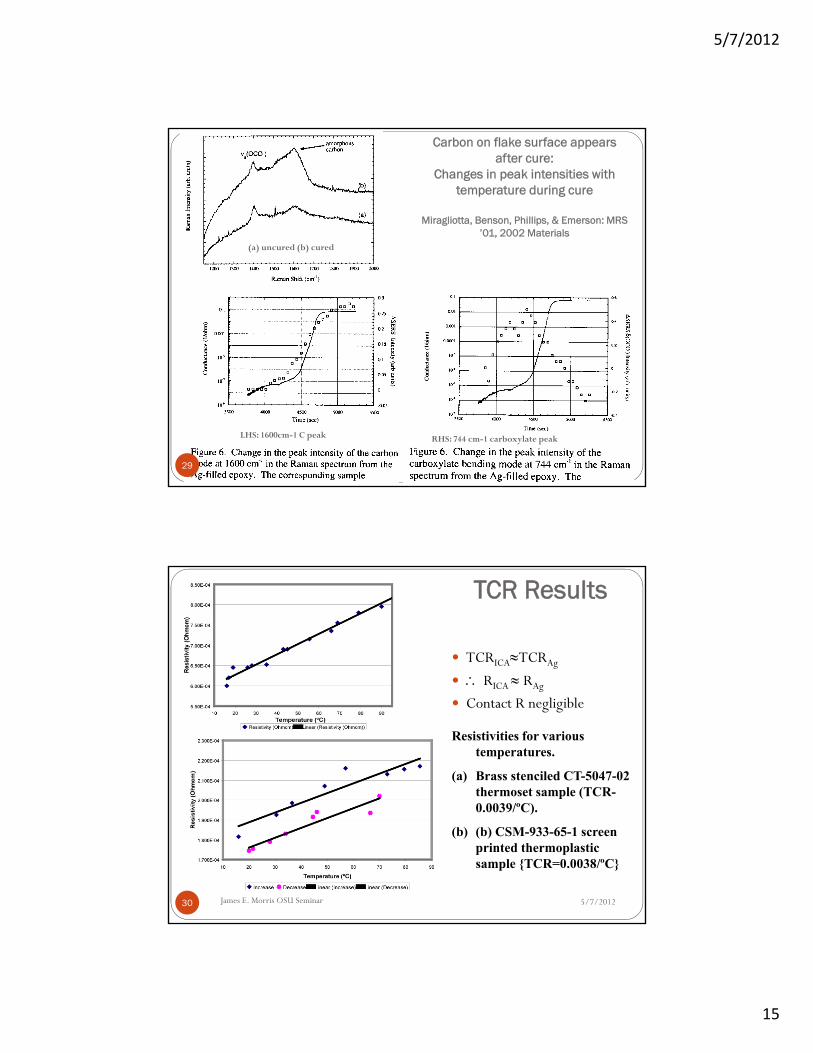
Carbon on flake surface appears after cure:
Changes in peak intensities with temperature during cure
Miragliotta, Benson, Phillips, & Emerson: MRS ’01, 2002 Materials
5/7/2012
RHS: 744 cm-1 carboxylate peakLHS: 1600cm-1 C peak
(a) uncured (b) cured
29
TCR Results
5/7/2012
TCRICATCRAg
RICA RAg
Contact R negligible
Resistivities for various temperatures.
(a) Brass stenciled CT-5047-02 thermoset sample (TCR-0.0039/ºC).
(b) (b) CSM-933-65-1 screen printed thermoplastic sample {TCR=0.0038/ºC}
James E. Morris OSU Seminar30
5/7/2012
16
5/7/2012
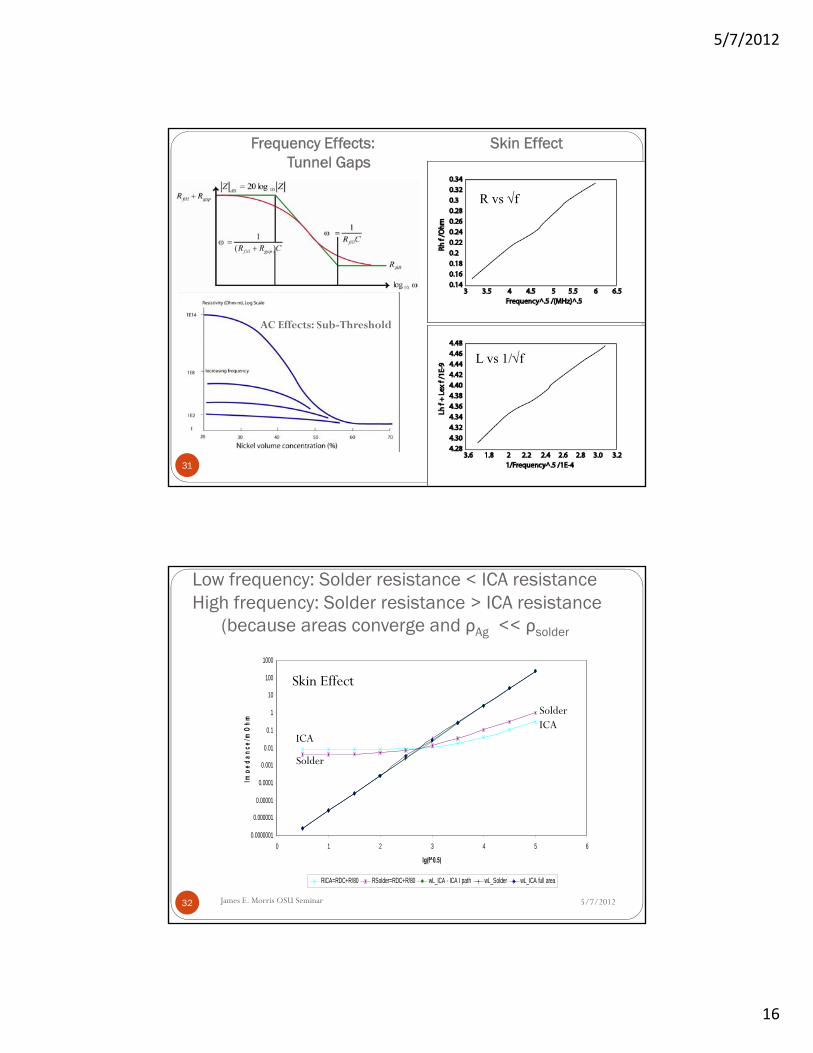
AC Effects: Sub-Threshold
31
R vs f
L vs 1/f
Frequency Effects: Skin Effect Tunnel Gaps
Low frequency: Solder resistance < ICA resistanceHigh frequency: Solder resistance > ICA resistance
(because areas converge and ρAg << ρsolder
5/7/2012
0.0000001
0.000001
0.00001
0.0001
0.001
0.01
0.1
1
10
100
1000
0 1 2 3 4 5 6
lg(f^0.5)
Imp
ed
an
ce/m
Oh
m
RICA=RDC+R/80 RSolder=RDC+R/80 wL_ICA - ICA I path wL_Solder wL_ICA full area
James E. Morris OSU Seminar32
Skin Effect
SolderICA
ICA
Solder
5/7/2012
17
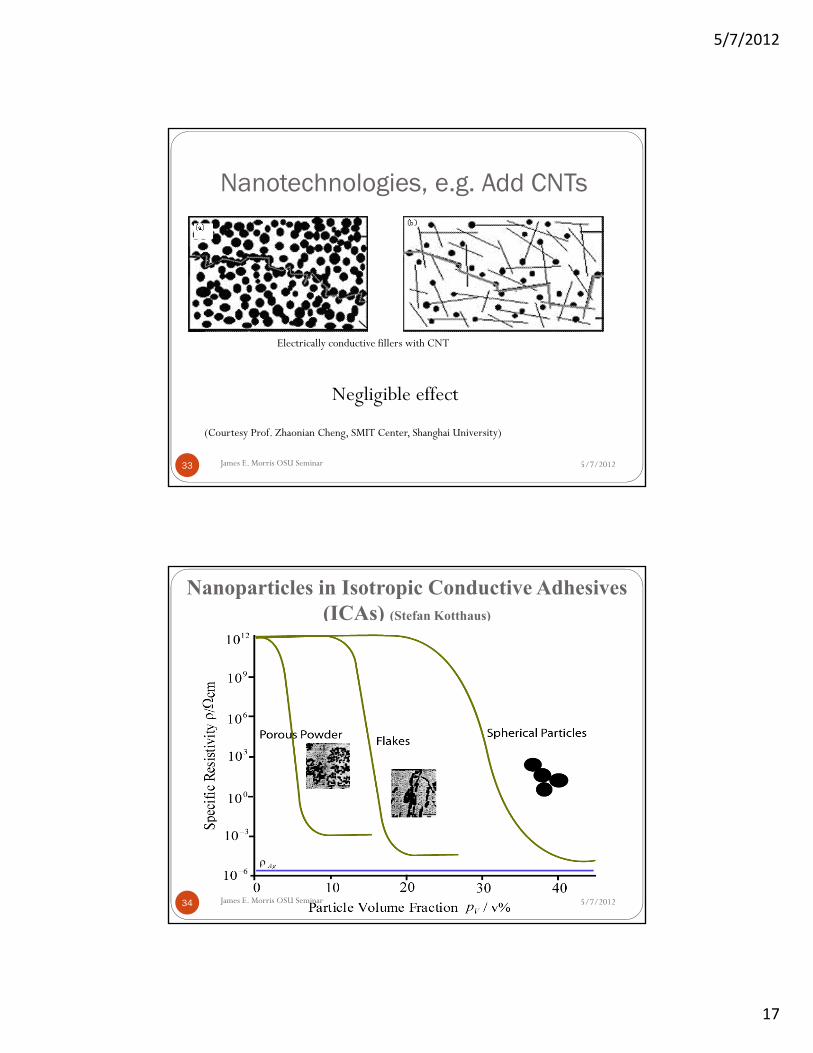
Nanotechnologies, e.g. Add CNTs
Electrically conductive fillers with CNT
(Courtesy Prof. Zhaonian Cheng, SMIT Center, Shanghai University)
5/7/2012James E. Morris OSU Seminar33
Negligible effect
Nanoparticles in Isotropic Conductive Adhesives (ICAs) (Stefan Kotthaus)
Percolation limits of different ICA filler particles5/7/2012James E. Morris OSU Seminar34
5/7/2012
18
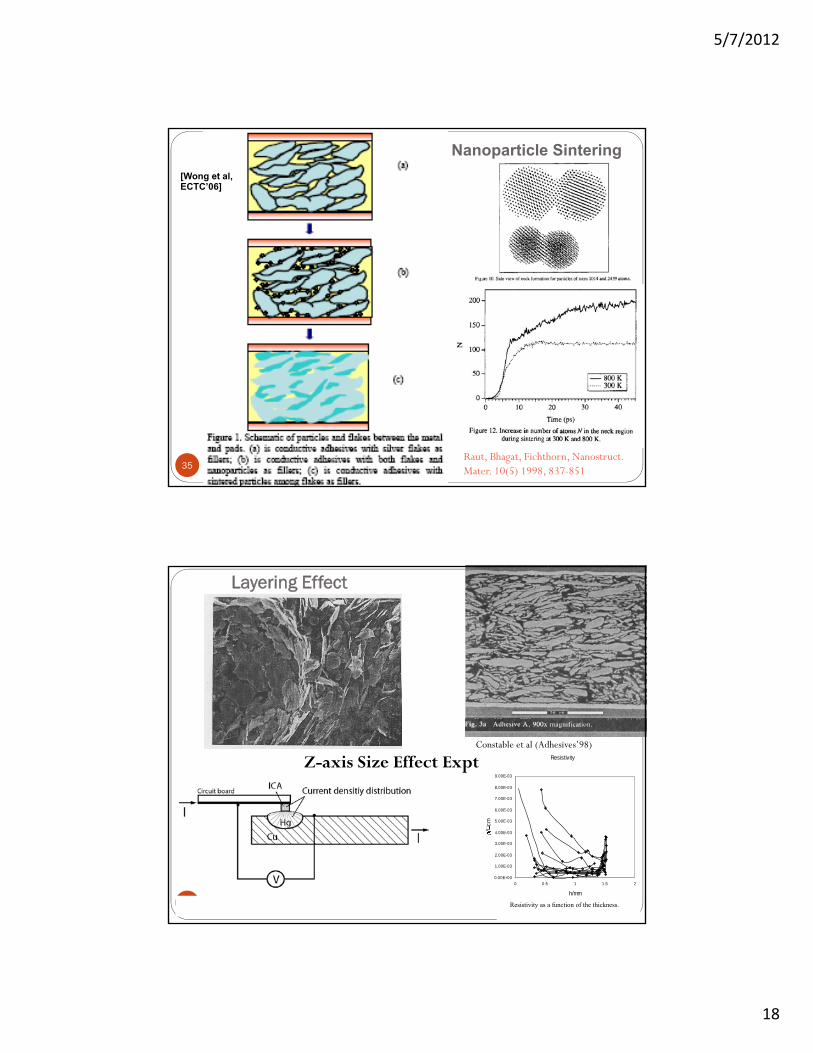
Nanoparticle Sintering
35
[Wong et al, ECTC’06]
Raut, Bhagat, Fichthorn, Nanostruct. Mater. 10(5) 1998, 837-851
Layering Effect
Constable et al (Adhesives’98)
36
Z-axis Size Effect Expt
Resistivity as a function of the thickness.
Resistivity
0.00E+00
1.00E-03
2.00E-03
3.00E-03
4.00E-03
5.00E-03
6.00E-03
7.00E-03
8.00E-03
9.00E-03
0 0.5 1 1.5 2
h/mm
cm
5/7/2012
19
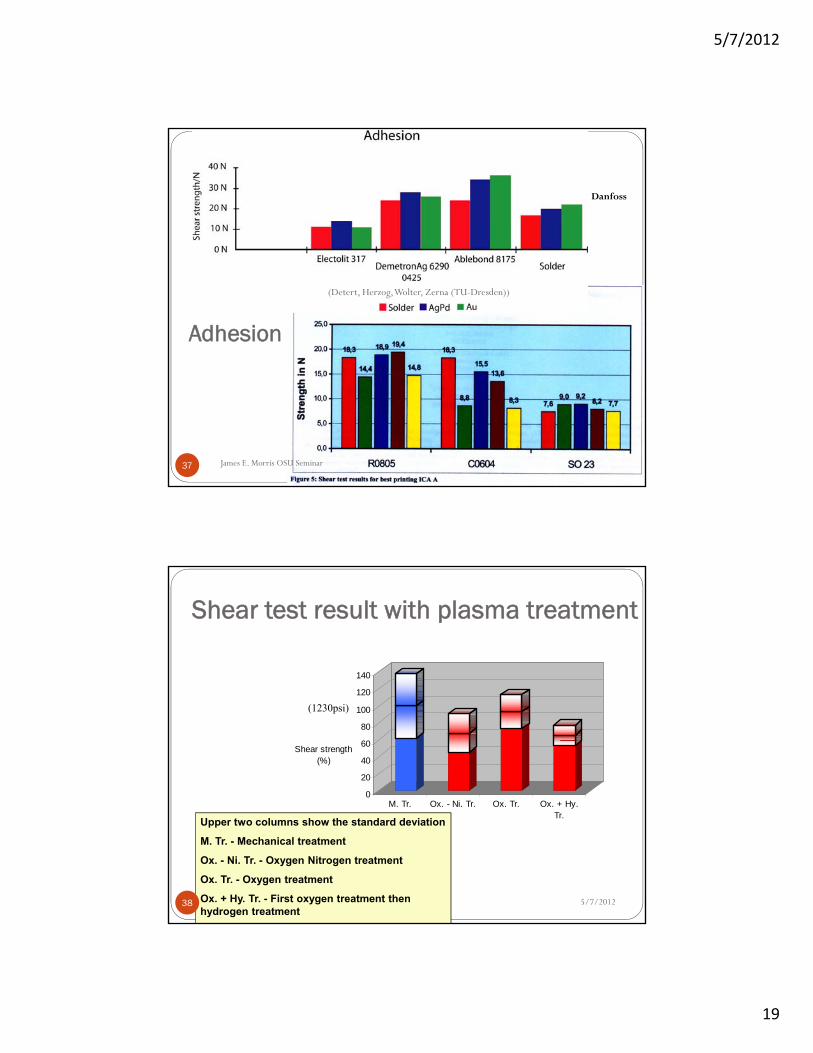
Adhesion
5/7/2012
(Detert, Herzog, Wolter, Zerna (TU-Dresden))
Danfoss
James E. Morris OSU Seminar37
Shear test result with plasma treatment
0
20
40
60
80
100
120
140
Shear strength (%)
M. Tr. Ox. - Ni. Tr. Ox. Tr. Ox. + Hy.Tr.
5/7/2012
Upper two columns show the standard deviation
M. Tr. - Mechanical treatment
Ox. - Ni. Tr. - Oxygen Nitrogen treatment
Ox. Tr. - Oxygen treatment
Ox. + Hy. Tr. - First oxygen treatment then hydrogen treatment
(1230psi)
38
5/7/2012
20
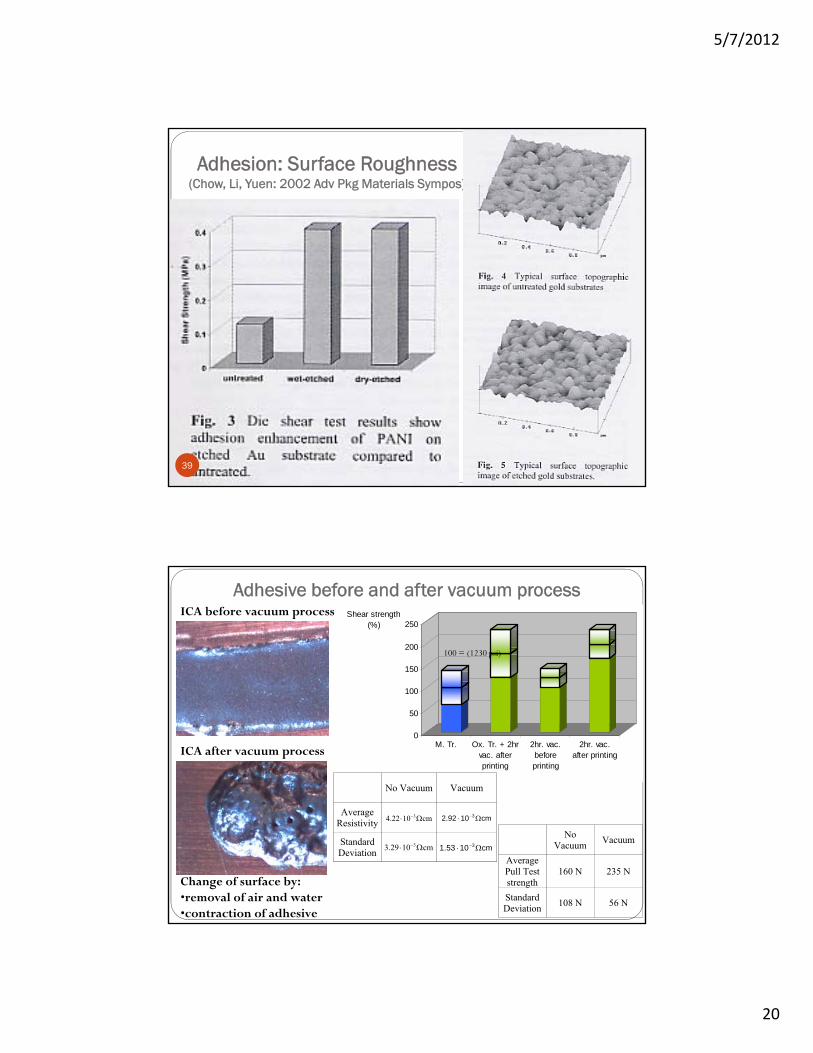
Adhesion: Surface Roughness(Chow, Li, Yuen: 2002 Adv Pkg Materials Sympos)
5/7/201239
Adhesive before and after vacuum process
0
50
100
150
200
250Shear strength
(%)
M. Tr. Ox. Tr. + 2hrvac. afterprinting
2hr. vac.beforeprinting
2hr. vac.after printing
ICA before vacuum process
ICA after vacuum process
Change of surface by:•removal of air and water•contraction of adhesive
100 = (1230 psi)
No Vacuum Vacuum
Average Resistivity cm1022.4 3 cm1092.2 3
Standard Deviation
cm1029.3 3 cm1053.1 3
No
Vacuum Vacuum
Average Pull Test strength
160 N 235 N
Standard Deviation
108 N 56 N
5/7/2012
21
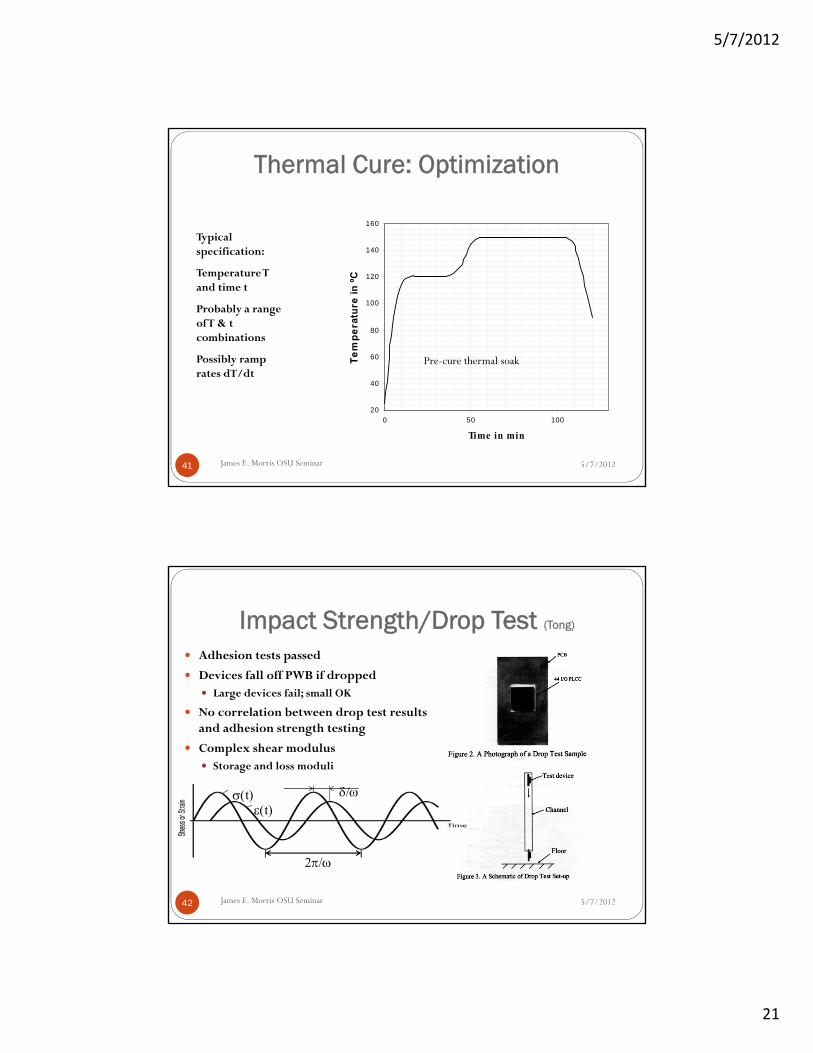
Thermal Cure: Optimization
5/7/2012
20
40
60
80
100
120
140
160
0 50 100
Time in min
Te
mp
era
ture
in º
C
Typical specification:
Temperature T and time t
Probably a range of T & t combinations
Possibly ramp rates dT/dt
Pre-cure thermal soak
James E. Morris OSU Seminar41
Impact Strength/Drop Test (Tong)
Adhesion tests passed
Devices fall off PWB if dropped Large devices fail; small OK
No correlation between drop test results and adhesion strength testing
Complex shear modulus Storage and loss moduli
5/7/2012James E. Morris OSU Seminar42
2
tt
5/7/2012
22
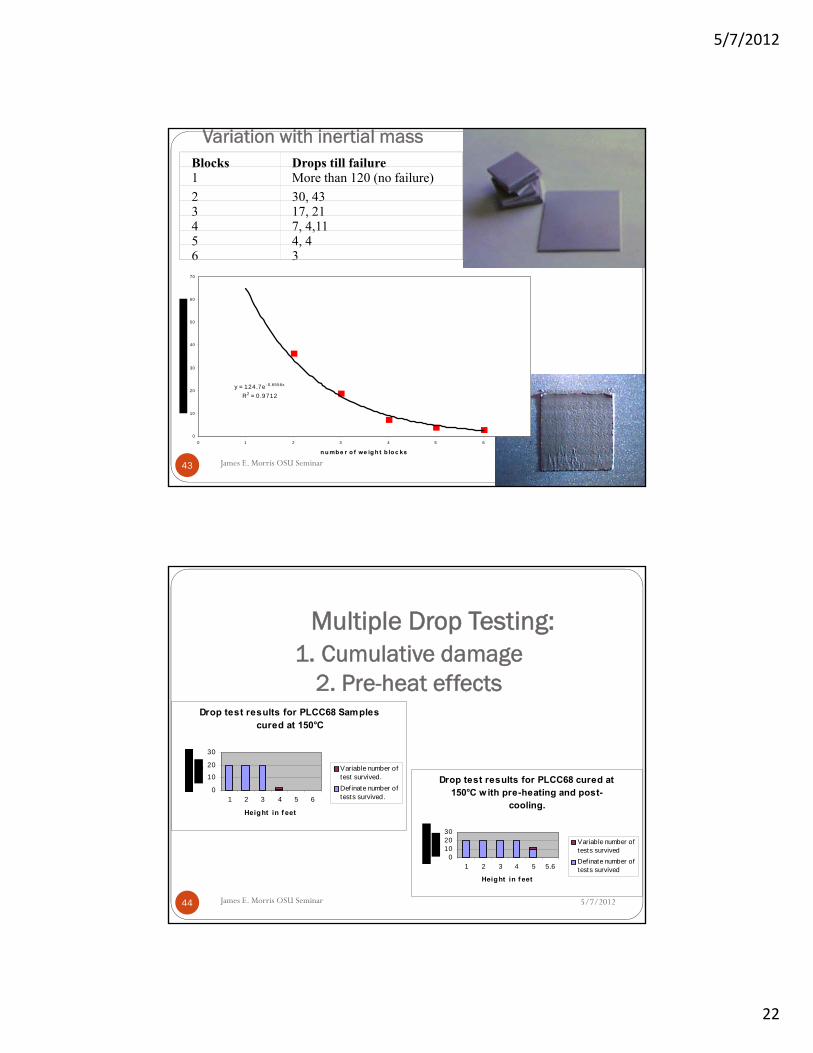
Variation with inertial mass
5/7/2012
Blocks Drops till failure1 More than 120 (no failure)
2 30, 433 17, 214 7, 4,115 4, 46 3
y = 124.7e-0.6556x
R2 = 0 .9712
0
10
20
30
40
50
60
70
0 1 2 3 4 5 6 7
n u mb e r o f we ig h t b lo c ks
James E. Morris OSU Seminar43
Multiple Drop Testing:1. Cumulative damage
2. Pre-heat effects
5/7/2012
Drop test results for PLCC68 Samples cured at 150°C
0
10
20
30
1 2 3 4 5 6
Heig ht in f eet
Variable number oftest survived.
Def inate number oftests survived.
Drop test results for PLCC68 cured at 150°C w ith pre-heating and post-
cooling.
0102030
1 2 3 4 5 5.6
Heig ht in f eet
Variable number oftests survived
Definate number oftests survived
James E. Morris OSU Seminar44
5/7/2012
23
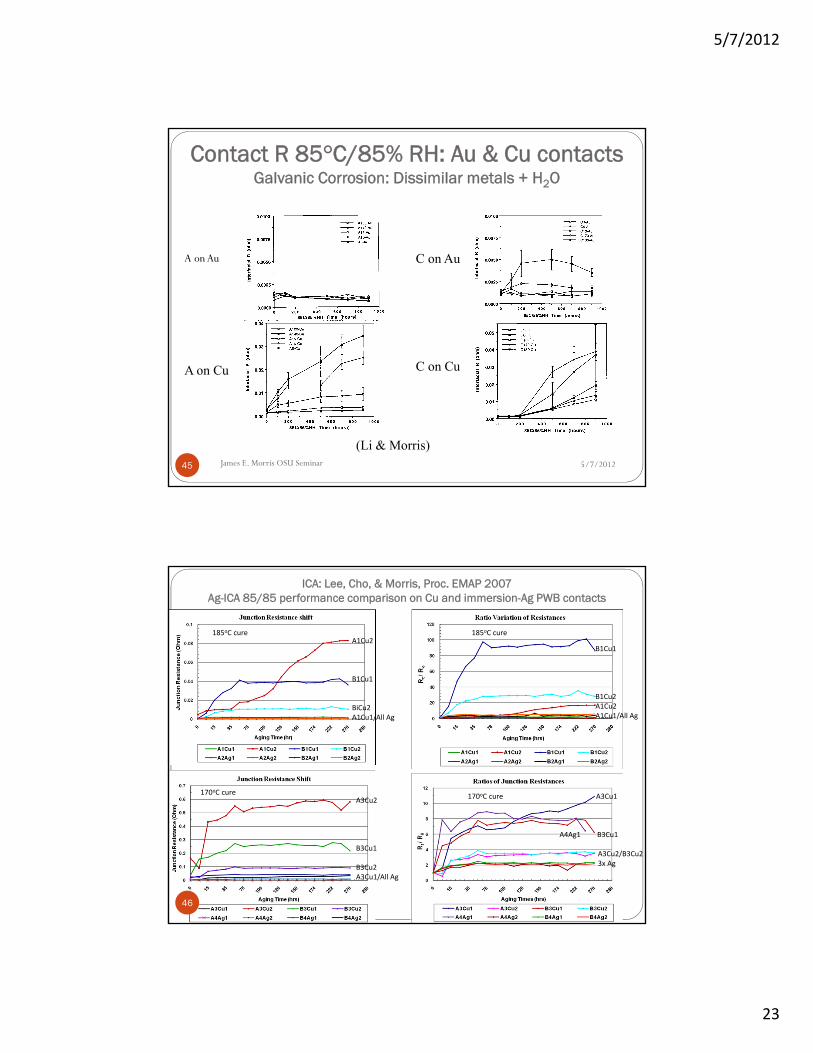
Contact R 85°C/85% RH: Au & Cu contactsGalvanic Corrosion: Dissimilar metals + H2O
5/7/2012
A on Au
A on Cu
C on Au
C on Cu
(Li & Morris)James E. Morris OSU Seminar45
ICA: Lee, Cho, & Morris, Proc. EMAP 2007Ag-ICA 85/85 performance comparison on Cu and immersion-Ag PWB contacts
5/7/2012
A1Cu2
B1Cu1
BiCu2A1Cu1/All Ag
A3Cu2
B3Cu1
B3Cu2A3Cu1/All Ag
185oC cure 185oC cure
170oC cure 170oC cure
B1Cu1
B1Cu2A1Cu2A1Cu1/All Ag
A3Cu1
A4Ag1 B3Cu1
A3Cu2/B3Cu23x Ag
46
5/7/2012
24
5/7/2012
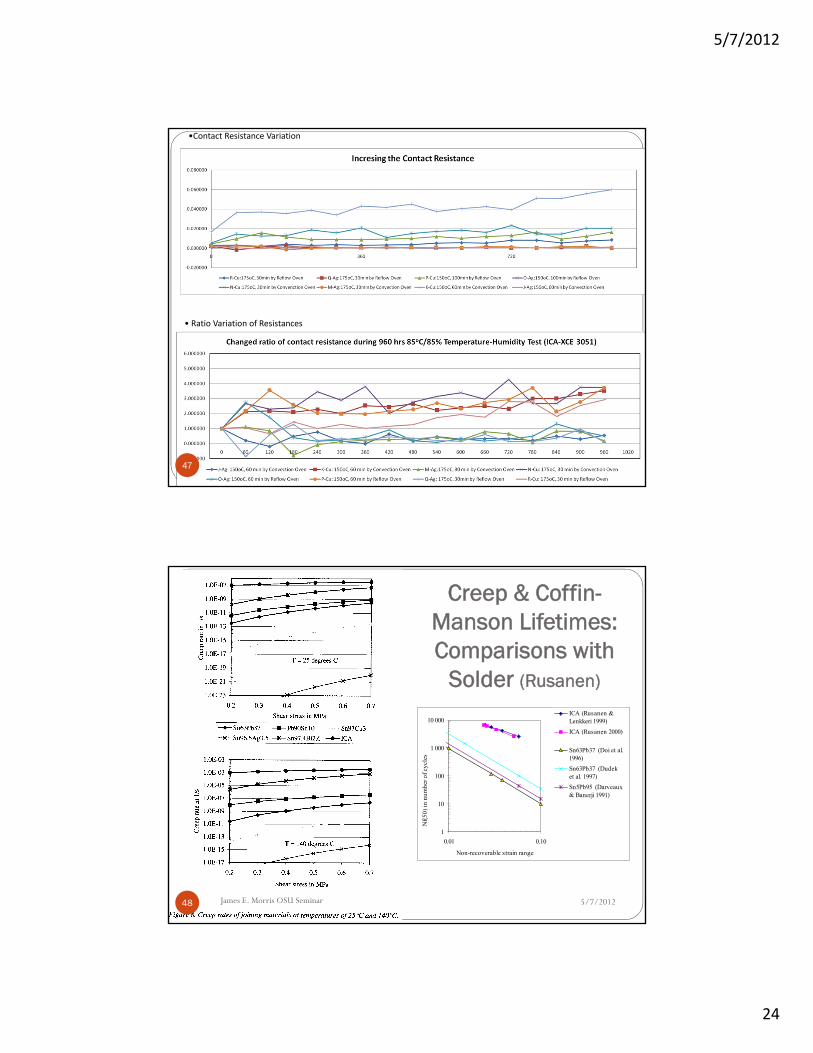
•Contact Resistance Variation
• Ratio Variation of Resistances
47
Creep & Coffin-Manson Lifetimes: Comparisons with
Solder (Rusanen)
5/7/2012
1
10
100
1 000
10 000
0.01 0.10
Non-recoverable strain range
Nf(
50) i
n nu
mbe
r of c
ycle
s
ICA (Rusanen &Lenkkeri 1999)
ICA (Rusanen 2000)
Sn63Pb37 (Doi et al.1996)
Sn63Pb37 (Dudeket al. 1997)
Sn5Pb95 (Darveaux& Banerji 1991)
James E. Morris OSU Seminar48
5/7/2012
25
5/7/201249
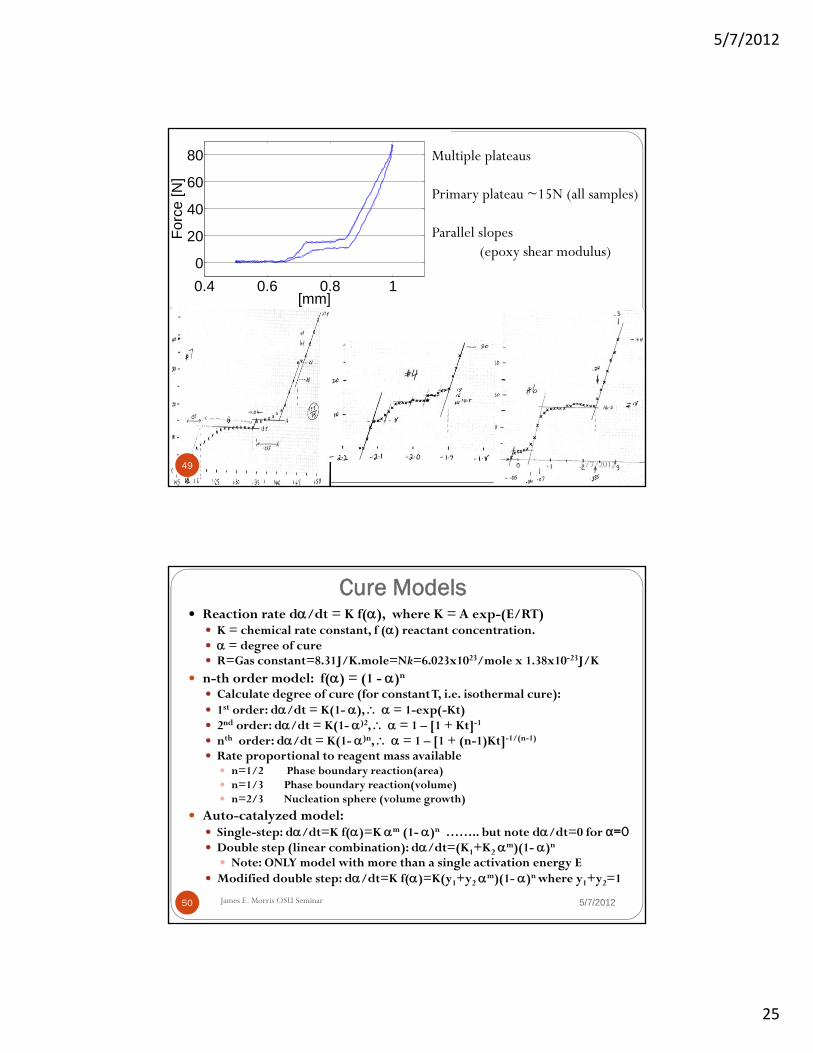
0.4 0.6 0.8 1
0
20
40
60
80
[mm]
For
ce [N
]
Multiple plateaus
Primary plateau ~15N (all samples)
Parallel slopes (epoxy shear modulus)
Cure Models
5/7/2012
Reaction rate d/dt = K f(), where K = A exp-(E/RT) K = chemical rate constant, f () reactant concentration. = degree of cure R=Gas constant=8.31J/K.mole=Nk=6.023x1023/mole x 1.38x10⁻²³J/K
n-th order model: f() = (1 - )n
Calculate degree of cure (for constant T, i.e. isothermal cure): 1st order: d/dt = K(1- ), = 1-exp(-Kt) 2nd order: d/dt = K(1- )2, = 1 – [1 + Kt]-1
nth order: d/dt = K(1- )n, = 1 – [1 + (n-1)Kt]-1/(n-1)
Rate proportional to reagent mass available n=1/2 Phase boundary reaction(area) n=1/3 Phase boundary reaction(volume) n=2/3 Nucleation sphere (volume growth)
Auto-catalyzed model: Single-step: d/dt=K f()=K m (1- )n …….. but note d/dt=0 for α=0 Double step (linear combination): d/dt=(K1+K2 m)(1- )n
Note: ONLY model with more than a single activation energy E Modified double step: d/dt=K f()=K(y1+y2 m)(1- )n where y1+y2=1
James E. Morris OSU Seminar50
5/7/2012
26
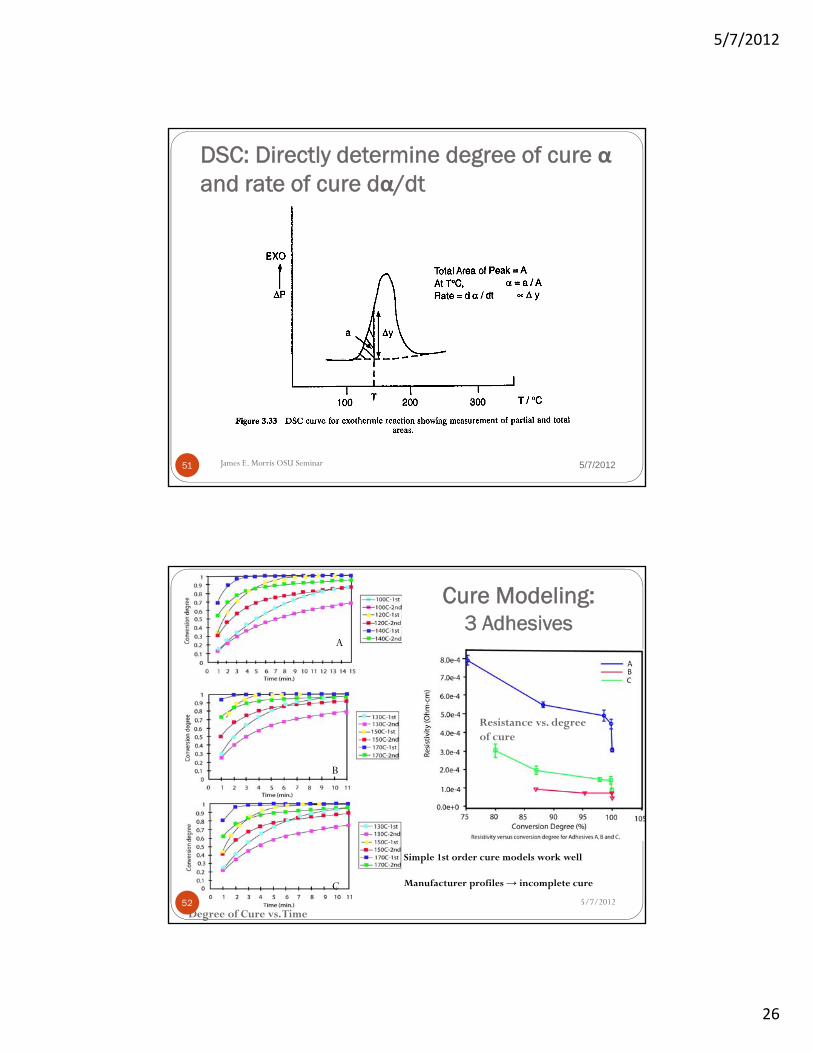
DSC: Directly determine degree of cure αand rate of cure dα/dt
5/7/2012James E. Morris OSU Seminar51
Cure Modeling:3 Adhesives
5/7/2012
A
B
C
Simple 1st order cure models work well
Manufacturer profiles → incomplete cure
Degree of Cure vs. Time
Resistance vs. degree of cure
52
5/7/2012
27
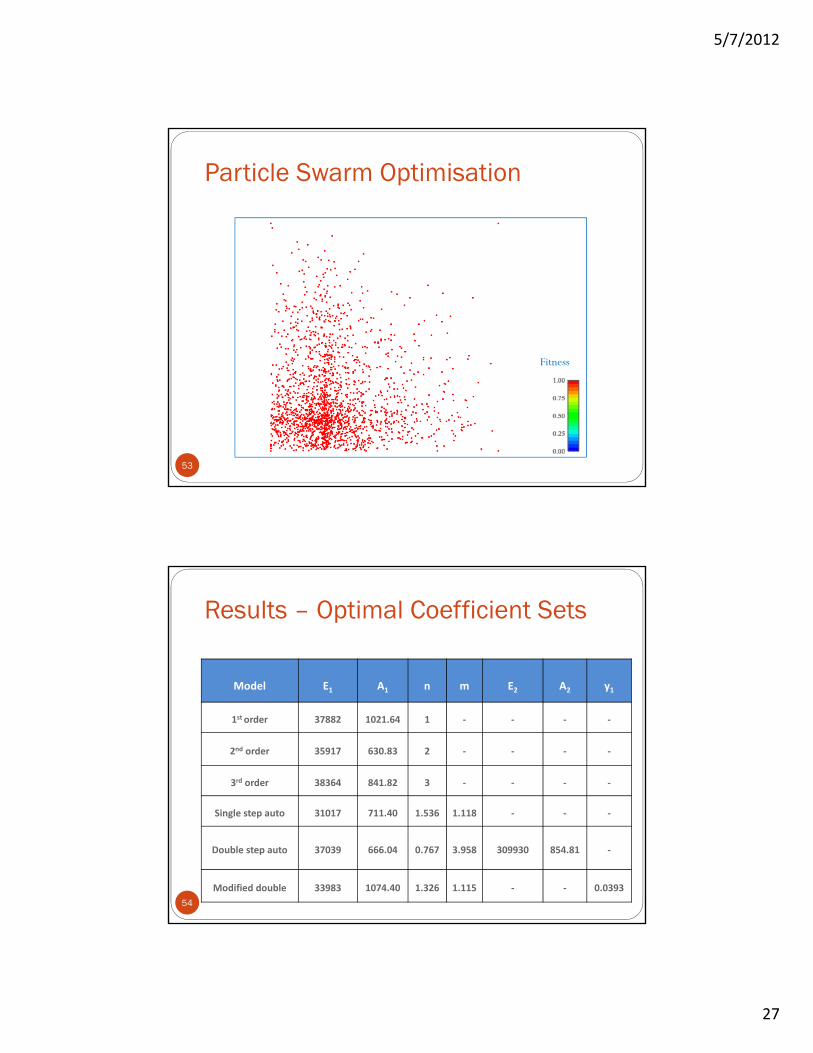
Particle Swarm Optimisation
53
Fitness
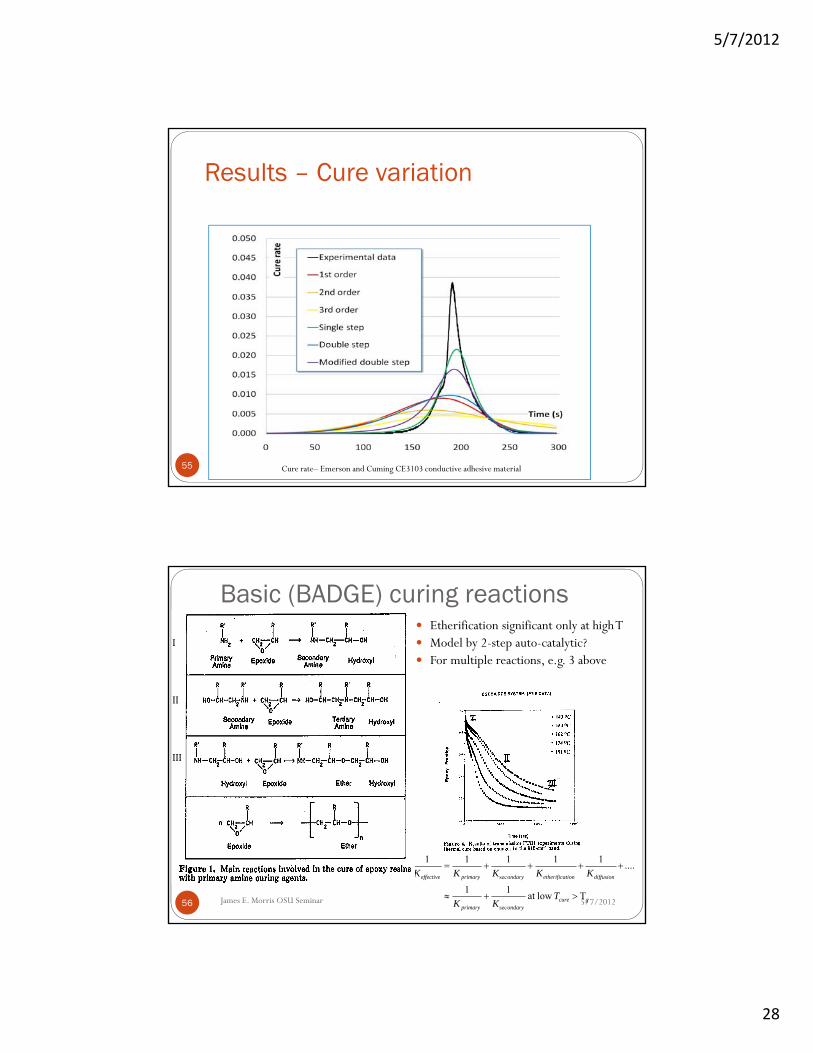
Results – Optimal Coefficient Sets
54
Model E1 A1 n m E2 A2 y1
1st order 37882 1021.64 1 ‐ ‐ ‐ ‐
2nd order 35917 630.83 2 ‐ ‐ ‐ ‐
3rd order 38364 841.82 3 ‐ ‐ ‐ ‐
Single step auto 31017 711.40 1.536 1.118 ‐ ‐ ‐
Double step auto 37039 666.04 0.767 3.958 309930 854.81 ‐
Modified double 33983 1074.40 1.326 1.115 ‐ ‐ 0.0393
5/7/2012
28
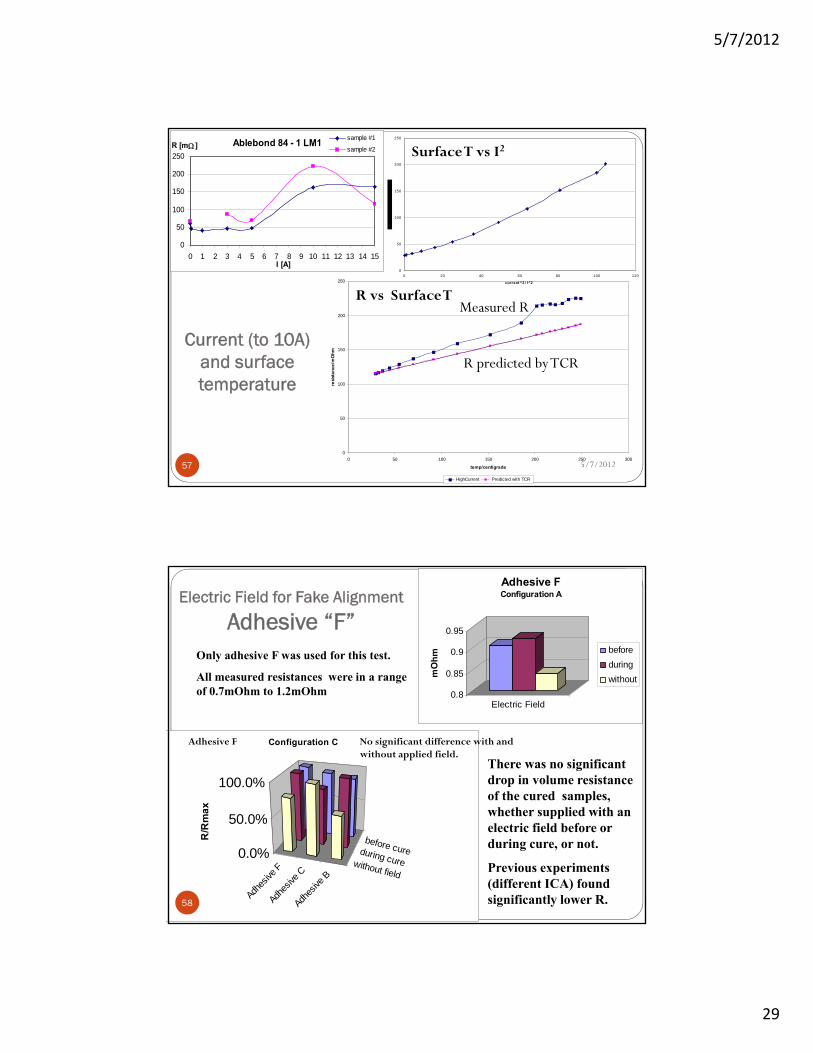
Results – Cure variation
55 Cure rate– Emerson and Cuming CE3103 conductive adhesive material
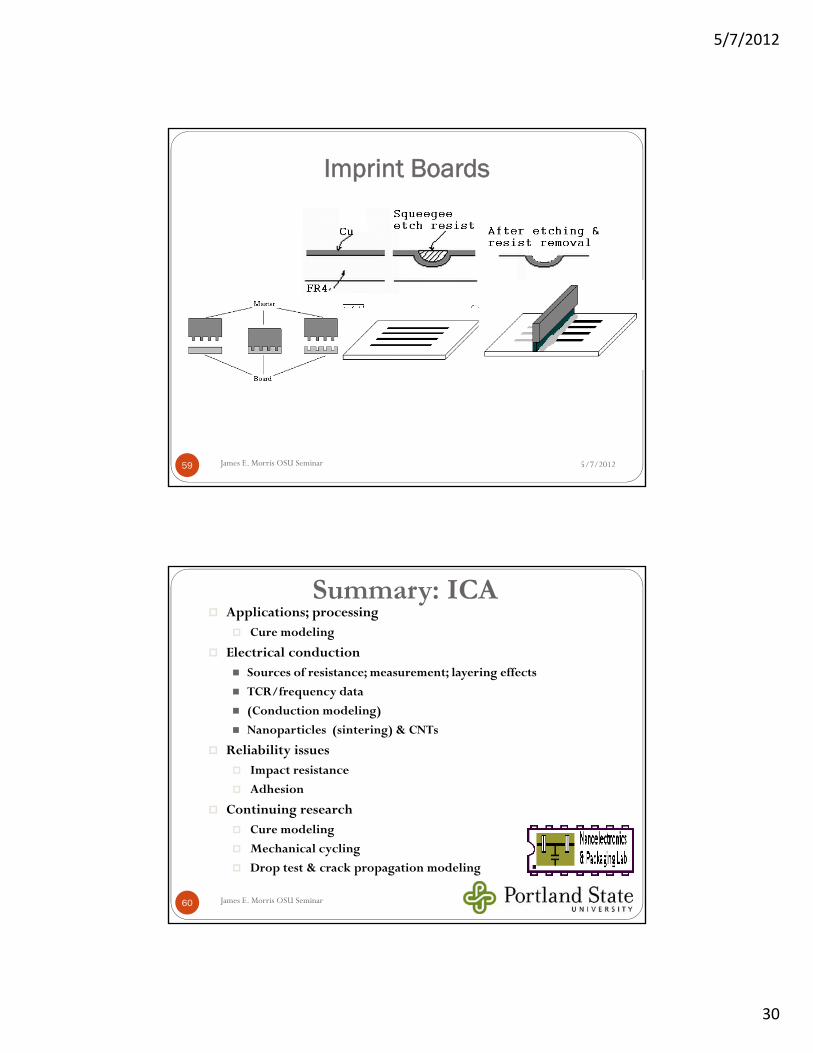
Basic (BADGE) curing reactions
5/7/2012
Etherification significant only at high T Model by 2-step auto-catalytic? For multiple reactions, e.g. 3 above
gcureondaryprimary
diffusiontionetherificaondaryprimaryeffective
TKK
KKKKK
T lowat 11
....11111
sec
sec
I
II
III
James E. Morris OSU Seminar56
5/7/2012
29
Current (to 10A) and surface temperature
5/7/20120
50
100
150
200
250
0 50 100 150 200 250 300
temp/centigrade
resi
sta
nce
/mO
hm
HighCurrent Predicted with TCR
0
50
100
150
200
250
0 20 40 60 80 100 120
current ^2 / I^2
Surface T vs I2
R predicted by TCR
Measured RR vs Surface T
57
Ablebond 84 - 1 LM1
0
50
100
150
200
250
0 1 2 3 4 5 6 7 8 9 10 11 12 13 14 15I [A]
R [m ]sample #1
sample #2
Electric Field for Fake Alignment
Adhesive “F”
Adhes
ive F
Adhes
ive C
Adh
esive
Bwithout field
during cure
before cure0.0%
50.0%
100.0%
R/R
ma
x
Configuration C
0.8
0.85
0.9
0.95
mO
hm
Electric Field
Adhesive FConfiguration A
before
during
without
Only adhesive F was used for this test.
All measured resistances were in a range of 0.7mOhm to 1.2mOhm
There was no significant drop in volume resistance of the cured samples, whether supplied with an electric field before or during cure, or not.
Previous experiments (different ICA) found significantly lower R.
Adhesive F No significant difference with and without applied field.
58
5/7/2012
30
Imprint Boards
5/7/2012James E. Morris OSU Seminar59
5/7/2012
Summary: ICA Applications; processing
Cure modeling
Electrical conduction Sources of resistance; measurement; layering effects
TCR/frequency data
(Conduction modeling)
Nanoparticles (sintering) & CNTs
Reliability issues Impact resistance
Adhesion
Continuing research Cure modeling
Mechanical cycling
Drop test & crack propagation modeling
James E. Morris OSU Seminar60


![Chapter 14 [Read-Only] - Computer Action Teamweb.cecs.pdx.edu/~jmorris/ECE299/ECE299 lectures/Chapter 14 [Read-Only].pdfELECTRICAL ENGINEERING: PRINCIPLES AND APPLICATIONS, Third Edition,](https://img.pdfslide.net/doc/110x75/6120af89128bb53e883da096/chapter-14-read-only-computer-action-jmorrisece299ece299-lectureschapter.jpg)


![BIOGRAPHICAL DATA James Eliot Morrisweb.cecs.pdx.edu/~jmorris/MORRISBIO.pdf(2013)] Second edition (2016) in preparation. “Graphene, Carbon Nanotubes, and Nanostructures,” (CRC](https://img.pdfslide.net/doc/110x75/5f2d872509b1d0069e0d4be5/biographical-data-james-eliot-jmorrismorrisbiopdf-2013-second-edition-2016.jpg)