Embed Size (px)
Citation preview
Issue 5.0 Public Consultation
2
Contents Foreword ................................................................................................................... 4 Introduction .............................................................................................................. 6 1.1 Road network management responsibilities in London ................................................................... 6
1.2 Structure of this document ............................................................................................................... 7
Managing the road network and the MTS .............................................................. 8 2.1 Managing the road network outcomes .......................................................................................... 10
Measuring the performance of the road network ................................................ 14 3.1 Journey time reliability ................................................................................................................... 14
3.2 Journey time/traffic speed .............................................................................................................. 16
3.3 Volume of demand ......................................................................................................................... 16
3.4 Delay and disruption due to planned and unplanned events......................................................... 18
3.5 Volume of road works and other incidents on the Network .......................................................... 20
3.6 Customer satisfaction ..................................................................................................................... 22
3.7 Performance reporting ................................................................................................................... 24
Maximising the efficient and reliable operation of the network ......................... 25 4.1 Corridor management approach .................................................................................................... 25
4.2 Signal timing reviews ...................................................................................................................... 25
4.3 Split Cycle Offset Optimisation Technique ..................................................................................... 27
4.4 System Activated Strategy Selection (SASS) ................................................................................... 28
Figure 4.3 .............................................................................................................................................. 29
4.5 Pedestrian Countdown ................................................................................................................... 29
4.6 Traffic signal removal ...................................................................................................................... 30
4.7 Managing the impact of new development .................................................................................... 33
4.8 Minor improvements/simplifying the road network ...................................................................... 36
4.9 Motorcycles in bus lanes ................................................................................................................. 37
4.10 Minimising parking contraventions and other moving vehicle offences ...................................... 37
Minimising the impact of planned interventions ................................................. 38 5.1 The Mayor’s Code of Conduct for Road works ............................................................................... 38
5.2 The London Permit Scheme (LoPS) ................................................................................................. 40
5.3 Ensuring best practice road works .................................................................................................. 42
5.4 Lane rental ...................................................................................................................................... 45
Minimising disruption from unplanned events .................................................... 47 6.1 Minimising the occurrence of unplanned events ........................................................................... 48
6.2 Minimising Response and Clear Up Times ...................................................................................... 53
6.3 Managing traffic around road incidents ......................................................................................... 57

3
Managing demand and achieving modal shift ..................................................... 63 7.1 Managing demand corridors ........................................................................................................... 63
7.2 Managing demand at key pinch points, valves and hot spots ........................................................ 65
7.3 The role of buses and bus priority measures .................................................................................. 67
Appendix 1: TLRN London-wide corridors .......................................................... 69 Appendix 2: Sub-regional corridors ..................................................................... 71 Appendix 3: Table of road network management responsibilities .................... 85 Appendix 4: Definitions ......................................................................................... 87 Appendix 5: Abbreviations and Acronyms .......................................................... 90 Appendix 6: Travel demand and levels of transport networks .......................... 92
4
Foreword The Capital’s 13,000km of roads are a key strategic transport asset. Of the 28 million journey stages undertaken by Londoners every day in 2009 more than 80% were made on the road network, including:
• 10 million by car and motorcycle • 6 million by bus • 6 million walking trips • 0.5 million by cycle • 0.4 million by taxi
In addition, almost all freight movement into and out of the city is by road. London’s roads comprise some of the Capital’s most important public spaces and provide a key part of the backdrop to the social, economic and cultural life of the city. More than half of the city’s traffic is on either the Transport for London Road Network (TLRN) or the Borough Principal Road Network (BPRN). As a result, London’s strategic roads are extremely busy with traffic – around 40 per cent more dense than roads in other major UK conurbations. London has around 20 per cent of the UK’s traffic congestion, which is estimated to cost its economy at least £2bn a year. Three quarters of this congestion is on either the TLRN or the BPRN. No less than 15 per cent of the UK’s traffic congestion is therefore concentrated on less than 0.5 per cent of the country’s 400,000km of roads. The efficient management, operation and maintenance of London’s strategic road network is therefore of significant economic importance not only to the Capital, but also to the wider UK economy. At the same time, TfL needs to make sure that London’s roads can play their part as social, economic and cultural spaces, whether as locations for shopping and leisure in the city’s many town centres, or simply as places for informal social activity. This means creating streets and public spaces that are safe, attractive and accessible as well as providing the corridors along which traffic flows. Consequently, it is imperative that the road network functions effectively both as a set of corridors for traffic movement and as a collection of places in which people live, work and play. In order to demonstrate how these objectives will successfully be achieved, Surface Transport has prepared a suite of three documents: the Network Operating Strategy (NOS), the TLRN Implementation Plan (TIP) and the Highways Asset Management Plan (HAMP). The NOS sets out how London Streets, as part of TfL, will successfully manage and operate the Capital’s road networks within the context of the Mayor’s Transport Strategy (MTS), published in May 2010. The TIP records TfL’s aspirations for future investment projects on the TLRN that will create safe, accessible, attractive routes and places, through which traffic can flow smoothly. It also outlines their costs and benefits and how they contribute towards the MTS.

5
The HAMP sets out how TfL maintains its highway assets to meet user expectations, maximises operational effectiveness and minimises asset-related risks cost effectively. How will we know we are being successful in our approach? When Londoners get in their cars, on the bus, cycle or walk to their destinations, they will reliably know how long their journey will take them, they will be assured that they can get there safely and they will travel through some of the world’s best-designed and maintained streets and public spaces. Garrett Emmerson Chief Operating Officer London Streets
Ben Plowden Director Better Routes and Places
6
Chapter 1
Introduction
This document provides a strategic framework for the operational management of London’s road network. It includes specific advice and guidance for those involved in day-to-day decision-making at TfL, London’s boroughs and other organisations involved with road management-related aspects of the MTS. It should be read in conjunction with two partner documents. The first TfL’s HAMP, which sets out how TfL will maintain its highway assets in a good state of repair to maximise their operational effectiveness and meet user expectations cost-effectively. The second, the TIP, which explains how TfL will develop its road network to support the Capital’s sustainable development and regeneration, improve accessibility, safety, the urban realm and public transport programme. 1.1 Road network management responsibilities in London Responsibility for managing London’s road network is shared between the Highways Agency, TfL and London boroughs. The Highways Agency manages the national motorway network, including the M25 orbital motorway and the M1, M4 and M11. Within TfL, London Streets is responsible for the TLRN and, through the Traffic Management Act, has a strategic responsibility and specific powers, to coordinate works and ensure free flow of traffic on the wider Strategic Road Network (SRN). It is also responsible for the real-time operational control of the road network through the London Streets Traffic Control Centre (LSTCC) and the London Streets Tunnels Operations Centre (LSTOC), whose role is to reduce the likelihood of disruption and minimise delays by initiating the earliest possible response to any incident or event on the network. It is also responsible for the maintenance, management and operation of the Capital’s 6,164 sets of traffic signals. The London boroughs are responsible for all other Highways and Traffic Management Act functions on the wider BPRN and local borough roads. The successful operation of London’s road network therefore requires effective cooperation and coordination at all these levels. This document sets out London Streets’ overall approach to the management and operation of the road network in London, building on the principles, policies and proposals set out in the ‘Managing the Road Network’ section of the MTS. It includes both those things for which it has direct operational responsibility and how it proposes to engage with London boroughs, public utility companies and other organisations with an involvement in road network management. It is also intended to assist in the implementation of the developing sub-regional strategies and borough Local Implementation Plans (LIPs), as well as providing a framework through which to prioritise capital investment and ‘business as usual’ operational expenditure decision-making across the road network.

7
1.2 Structure of this document Chapter 2 relates the spatial and thematic principles in the MTS to the management of the road network at London-wide and sub-regional level, and defines operational outcomes required to deliver the MTS’s high-level strategic goals and objectives. Chapter 3 sets out and discusses the metrics necessary to define performance of the network relative to these operational outcomes, and Chapters 4 to 7 outline the key actions and initiatives London Streets is taking forward (either on its own or in partnership with others), to deliver these operational outcomes.

8
Chapter 2
Managing the road network and the MTS The MTS sets out the wider transport planning context and spatial framework for the management of roads in the Capital. At London-wide level, it describes a network of strategic (multi-modal) transport corridors which include the major radial and orbital routes into, out of, and around central London. The road-related elements of these corridors largely (but not completely) correspond to the TLRN (see Figure 2.1 below):
Figure 2.1 The TLRN consists of the busiest five per cent (approximately 580km) of roads in London, carrying more than 30 per cent of all traffic. Because of the greater proportion of commercial freight and business-related traffic (eg commuting), the TLRN is estimated to account for up to 40 per cent of the gross economic value of traffic-related movement across the city. The MTS also identifies a further network of sub-regionally significant transport corridors. The road-related elements of these are largely composed of the BPRN and some parts of the TLRN. These roads represent the primary focus of this document. Management of the remainder of the network (eg local borough roads), while still subject to policies and proposals in the MTS, is defined in detail in individual borough LIPs.

9
London-wide corridors: TfL has identified 23 individual road corridors on the TLRN that relate to the London-wide strategic traffic movement. Fifteen of these relate to the radial corridors set out in the MTS, and a further two (the north and south Circular Roads) to the inner London orbital corridor (see map above). The remaining six relate to strategic movement within central London (including the inner ring road). These corridors are set out in Figure 2.2 below.
TLRN London-wide corridors
Figure 2.2 (a larger version of this map can be found at Appendix 1)
Sub-regional corridors: Through the development of the sub-regional strategies TfL, working in partnership with the London boroughs, has identified a similar set of sub-regionally significant multi-modal corridors in each of the five London sub-regions. In the same way as the London-wide corridors in the MTS are primarily related to the key radial and orbital corridors into, out of and around central London, the sub-regional corridors are primarily focused around radial corridors into and out of the 12 inner and outer London metropolitan town centres. As part of this work, London Streets has also identified the key road management corridors that relate to these sub-regional corridors. These are set out in map-based and table form for each of the five sub-regions in Appendix 1.
10
Bringing and maintaining all assets into a good state of repair
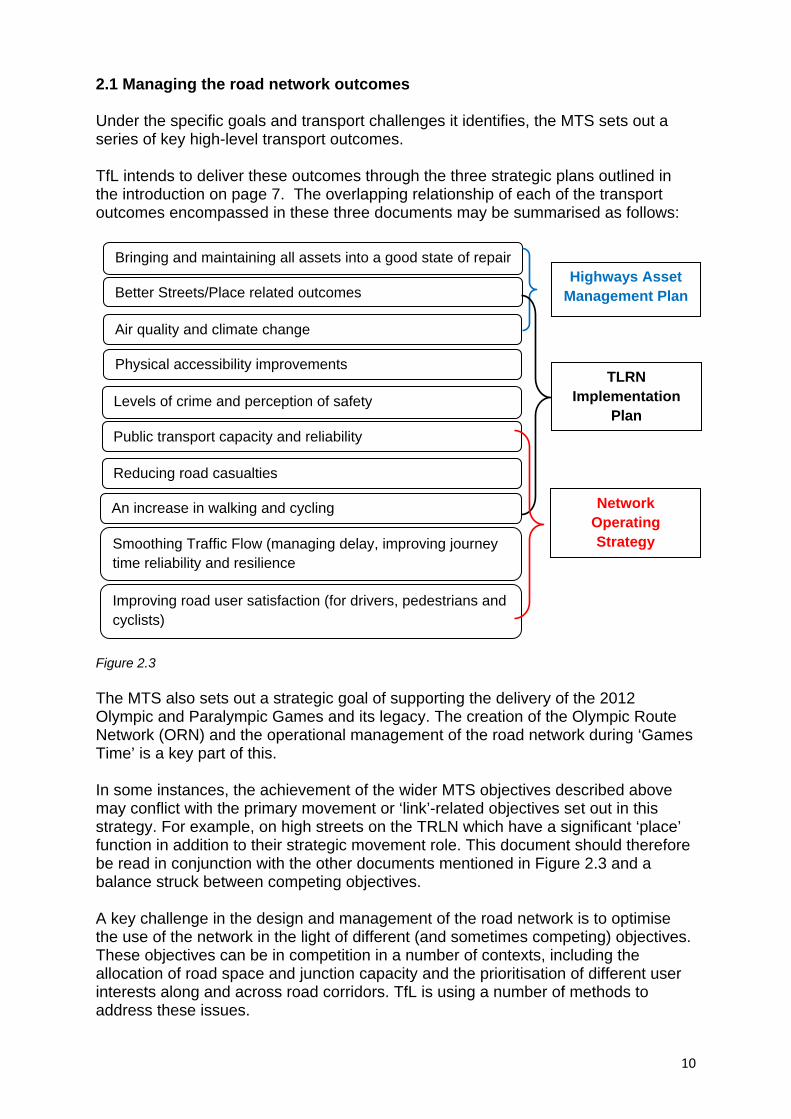
2.1 Managing the road network outcomes Under the specific goals and transport challenges it identifies, the MTS sets out a series of key high-level transport outcomes. TfL intends to deliver these outcomes through the three strategic plans outlined in the introduction on page 7. The overlapping relationship of each of the transport outcomes encompassed in these three documents may be summarised as follows:
Figure 2.3 The MTS also sets out a strategic goal of supporting the delivery of the 2012 Olympic and Paralympic Games and its legacy. The creation of the Olympic Route Network (ORN) and the operational management of the road network during ‘Games Time’ is a key part of this. In some instances, the achievement of the wider MTS objectives described above may conflict with the primary movement or ‘link’-related objectives set out in this strategy. For example, on high streets on the TRLN which have a significant ‘place’ function in addition to their strategic movement role. This document should therefore be read in conjunction with the other documents mentioned in Figure 2.3 and a balance struck between competing objectives. A key challenge in the design and management of the road network is to optimise the use of the network in the light of different (and sometimes competing) objectives. These objectives can be in competition in a number of contexts, including the allocation of road space and junction capacity and the prioritisation of different user interests along and across road corridors. TfL is using a number of methods to address these issues.
Air quality and climate change
Levels of crime and perception of safety
Better Streets/Place related outcomes
Physical accessibility improvements
Public transport capacity and reliability
Reducing road casualties
An increase in walking and cycling
Smoothing Traffic Flow (managing delay, improving journey time reliability and resilience
Improving road user satisfaction (for drivers, pedestrians and cyclists)
Highways Asset Management Plan
TLRN Implementation
Plan
Network Operating Strategy
11
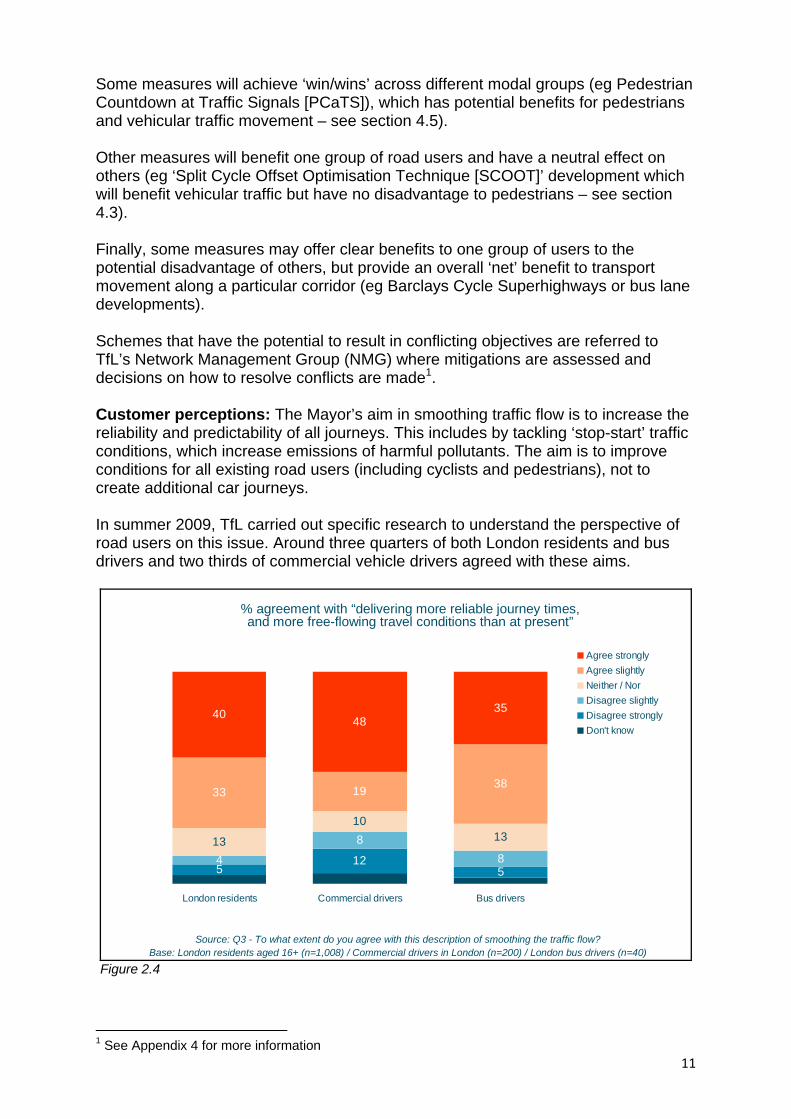
Some measures will achieve ‘win/wins’ across different modal groups (eg Pedestrian Countdown at Traffic Signals [PCaTS]), which has potential benefits for pedestrians and vehicular traffic movement – see section 4.5). Other measures will benefit one group of road users and have a neutral effect on others (eg ‘Split Cycle Offset Optimisation Technique [SCOOT]’ development which will benefit vehicular traffic but have no disadvantage to pedestrians – see section 4.3). Finally, some measures may offer clear benefits to one group of users to the potential disadvantage of others, but provide an overall ‘net’ benefit to transport movement along a particular corridor (eg Barclays Cycle Superhighways or bus lane developments). Schemes that have the potential to result in conflicting objectives are referred to TfL’s Network Management Group (NMG) where mitigations are assessed and decisions on how to resolve conflicts are made1. Customer perceptions: The Mayor’s aim in smoothing traffic flow is to increase the reliability and predictability of all journeys. This includes by tackling ‘stop-start’ traffic conditions, which increase emissions of harmful pollutants. The aim is to improve conditions for all existing road users (including cyclists and pedestrians), not to create additional car journeys. In summer 2009, TfL carried out specific research to understand the perspective of road users on this issue. Around three quarters of both London residents and bus drivers and two thirds of commercial vehicle drivers agreed with these aims.
512
54 8
13
1013
33 19 38
4835
8
40
London residents Commercial drivers Bus drivers
Agree stronglyAgree slightlyNeither / NorDisagree slightlyDisagree stronglyDon't know
Source: Q3 - To what extent do you agree with this description of smoothing the traffic flow?Base: London residents aged 16+ (n=1,008) / Commercial drivers in London (n=200) / London bus drivers (n=40)
% agreement with “delivering more reliable journey times,and more free-flowing travel conditions than at present”
Figure 2.4 1 See Appendix 4 for more information
12
Recent (unpublished) national research, conducted by MVA Consultancy on behalf of the former Commission for Integrated Transport and Motorists’ Forum, suggests that Key Performance Indicators (KPIs) that matter most to motorists include:
• Journey times and speeds • Journey time reliability • Traffic delays • Road works • Potholes • Safety
The research concluded that better KPI information on journey times, reliability, road works and traffic delays would lead to motorists being more informed on the aspects of road network performance that matter most to them and crucially, better placed to make decisions that will improve their journey experience and reduce congestion levels. Road network operational outcomes: Managing congestion, smoothing traffic flow and improving peoples’ perceptions is therefore a complex issue, made up of a number of related factors including:
• Journey time and/or traffic speeds • Journey time reliability • Volume of demand • Network capacity and availability including the amount of disruption to
road capacity through planned or unplanned events or interventions on the network (eg highway or public utility road works, collisions, breakdowns and special events)
• Network resilience – the ability to withstand the impacts of the planned or unplanned events outlined above (through traffic diversion to alternative routes) or other types of disruption including weather-related events (eg ice, snow or flooding)
MTS themes: Under the general heading of managing the road network and smoothing traffic flow, the MTS sets out a series of policy proposals under six key themes:
• Maximising the efficient and reliable operation of the road network • Minimising the impact of planned interventions on the road network with the
potential to disrupt traffic flows • Minimising disruption from unplanned events (collisions and emergencies etc)
in ‘real-time’, as they occur, and return the network quickly and efficiently to its planned, steady state operation as soon as possible
• Managing demand and achieving modal shift away from car-based traffic movements towards more sustainable modes to reduce traffic growth pressures on the network
• Where feasible, and where there is an overall congestion reduction and local economic benefit, developing the road network
• Maintaining road network assets in a good state of repair

13
As an operating strategy this document largely focuses on the first four of these themes. The future development of the road network is considered in more detail in the TIP and, for more local roads, in each borough’s LIP document. The ongoing maintenance and management of TfL’s road network assets is set out in the TLRN HAMP.
14
Chapter 3
Measuring the performance of the road network Responding to the development of the new MTS, TfL has identified a set of key performance measures that collectively quantify the performance of the road network:
• Journey time reliability (the strategic MTS outcome measure) • Journey time/traffic speed • Volume of demand • Volume of delay and disruption due to planned and unplanned events • Numbers of road works and other events or recorded incidents (eg ones
that impact on the availability of the network) • Satisfaction with road network performance
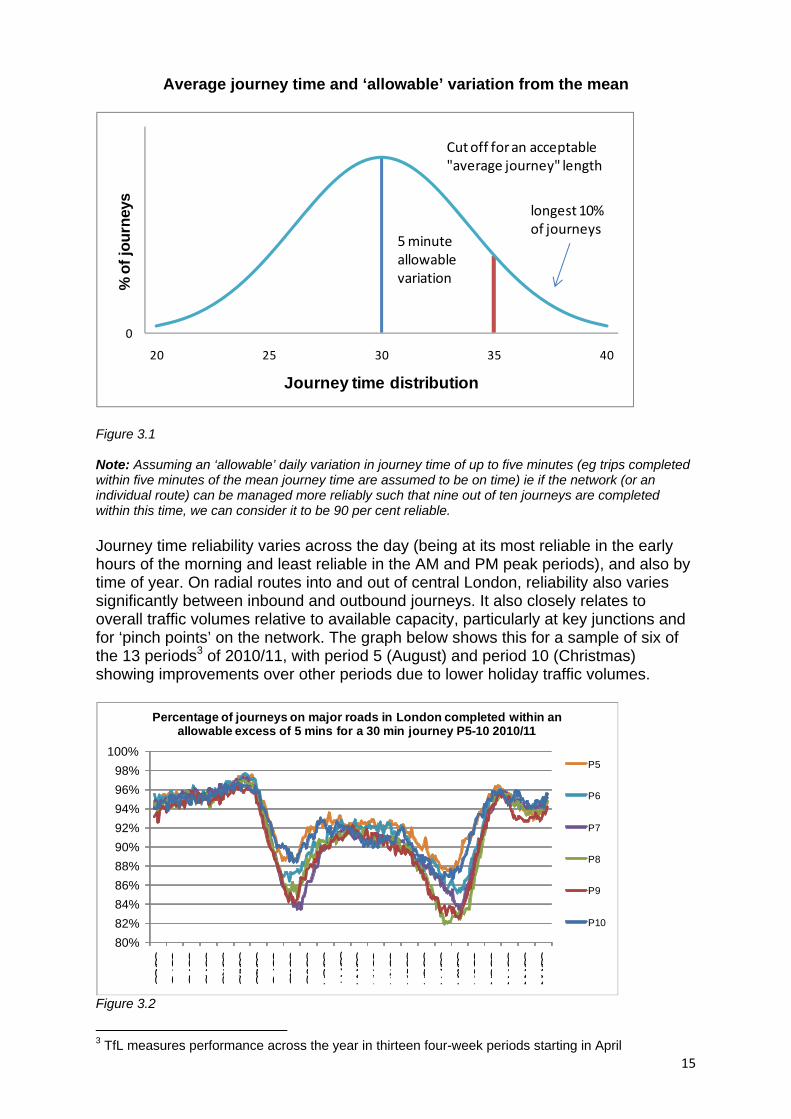
While data relating to reliability, capacity, demand, customer satisfaction etc has been routinely available for a long time on the major public transport modes (bus, rail, Underground), historically this has not been the case for the road network. To enable the effective operational management and monitoring of the network, TfL therefore intends to develop, collate and publish performance data in each of these areas. This will be done in collaboration with boroughs on an area-wide and/or (where appropriate) corridor-related basis for both the TLRN and the wider SRN identified in the sub-regional corridor maps. The remainder of this chapter sets out the performance metrics that will be used. 3.1 Journey time reliability The key measure for smoothing traffic flow set out in the MTS is journey time reliability2. This is defined as ‘the percentage of journeys completed within five minutes of a specified typical 30 minute journey time’. The measure introduces the concept of an ‘allowable’ variation around a standard mean journey time for either the network as a whole, or any individual corridor, allowing a numerical measure of the percentage of journeys completed ‘on time’ (reliably) across the network to be calculated. This is illustrated in Figure 3.1 on the following page.
2 Journey time reliability scope includes all classes of light good vehicles, Heavy Goods Vehicles (HGV’s) and cars.
15
Average journey time and ‘allowable’ variation from the mean
0
20 25 30 35 40
% o
f jou
rney
s
Journey time distribution
5 minuteallowable variation
Cut off for an acceptable "average journey" length
longest 10%of journeys
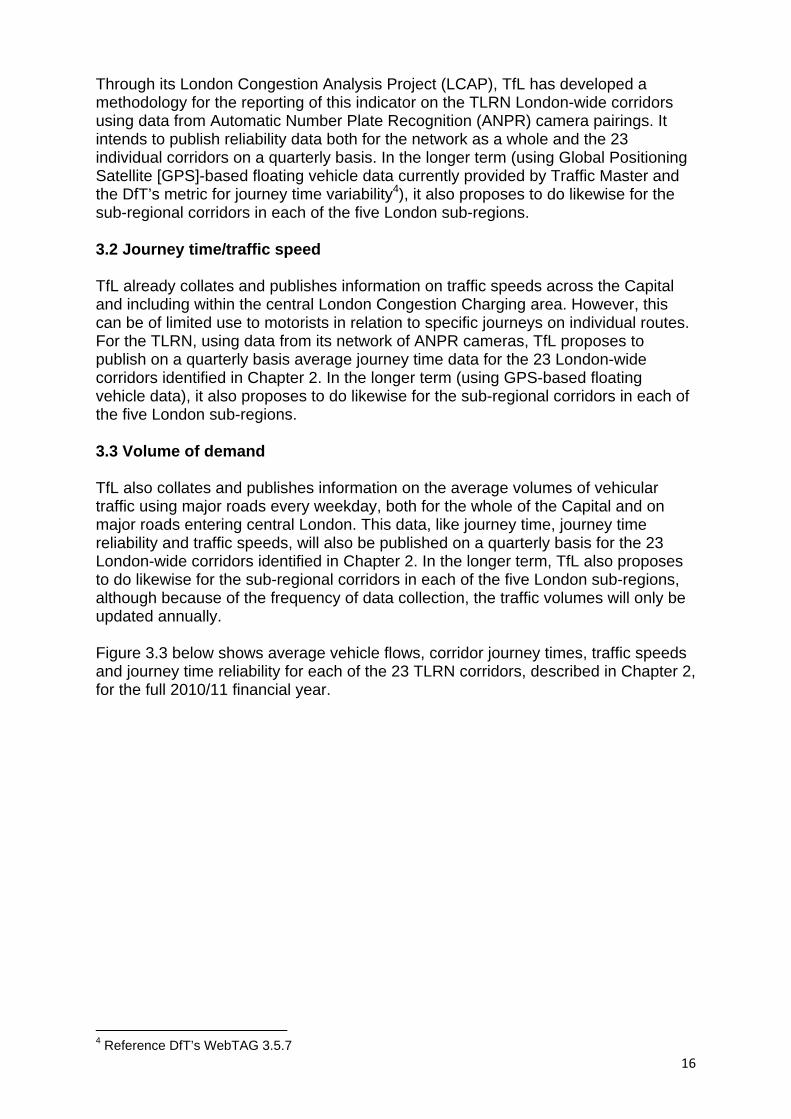
Figure 3.1 Note: Assuming an ‘allowable’ daily variation in journey time of up to five minutes (eg trips completed within five minutes of the mean journey time are assumed to be on time) ie if the network (or an individual route) can be managed more reliably such that nine out of ten journeys are completed within this time, we can consider it to be 90 per cent reliable. Journey time reliability varies across the day (being at its most reliable in the early hours of the morning and least reliable in the AM and PM peak periods), and also by time of year. On radial routes into and out of central London, reliability also varies significantly between inbound and outbound journeys. It also closely relates to overall traffic volumes relative to available capacity, particularly at key junctions and for ‘pinch points’ on the network. The graph below shows this for a sample of six of the 13 periods3 of 2010/11, with period 5 (August) and period 10 (Christmas) showing improvements over other periods due to lower holiday traffic volumes.
80%82%84%86%88%90%92%94%96%98%
100%
00:00
01:00
02:00
03:00
04:00
05:00
06:00
07:00
08:00
09:00
10:00
11:00
12:00
13:00
14:00
15:00
16:00
17:00
18:00
19:00
20:00
21:00
22:00
23:00
Percentage of journeys on major roads in London completed within an allowable excess of 5 mins for a 30 min journey P5-10 2010/11
P5
P6
P7
P8
P9
P10
Figure 3.2
3 TfL measures performance across the year in thirteen four-week periods starting in April
16
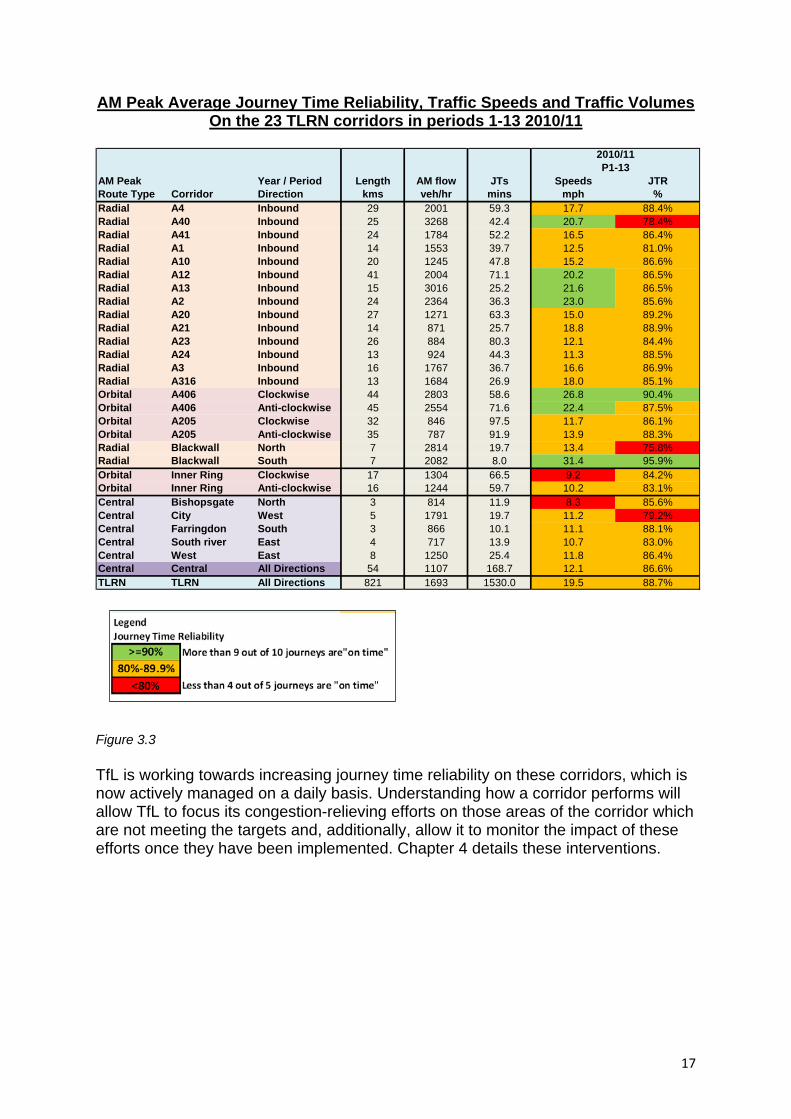
Through its London Congestion Analysis Project (LCAP), TfL has developed a methodology for the reporting of this indicator on the TLRN London-wide corridors using data from Automatic Number Plate Recognition (ANPR) camera pairings. It intends to publish reliability data both for the network as a whole and the 23 individual corridors on a quarterly basis. In the longer term (using Global Positioning Satellite [GPS]-based floating vehicle data currently provided by Traffic Master and the DfT’s metric for journey time variability4), it also proposes to do likewise for the sub-regional corridors in each of the five London sub-regions. 3.2 Journey time/traffic speed TfL already collates and publishes information on traffic speeds across the Capital and including within the central London Congestion Charging area. However, this can be of limited use to motorists in relation to specific journeys on individual routes. For the TLRN, using data from its network of ANPR cameras, TfL proposes to publish on a quarterly basis average journey time data for the 23 London-wide corridors identified in Chapter 2. In the longer term (using GPS-based floating vehicle data), it also proposes to do likewise for the sub-regional corridors in each of the five London sub-regions. 3.3 Volume of demand TfL also collates and publishes information on the average volumes of vehicular traffic using major roads every weekday, both for the whole of the Capital and on major roads entering central London. This data, like journey time, journey time reliability and traffic speeds, will also be published on a quarterly basis for the 23 London-wide corridors identified in Chapter 2. In the longer term, TfL also proposes to do likewise for the sub-regional corridors in each of the five London sub-regions, although because of the frequency of data collection, the traffic volumes will only be updated annually. Figure 3.3 below shows average vehicle flows, corridor journey times, traffic speeds and journey time reliability for each of the 23 TLRN corridors, described in Chapter 2, for the full 2010/11 financial year.
4 Reference DfT’s WebTAG 3.5.7
17
AM Peak Average Journey Time Reliability, Traffic Speeds and Traffic Volumes
On the 23 TLRN corridors in periods 1-13 2010/11
AM Peak Year / Period Length AM flow JTs Speeds JTRRoute Type Corridor Direction kms veh/hr mins mph %Radial A4 Inbound 29 2001 59.3 17.7 88.4%Radial A40 Inbound 25 3268 42.4 20.7 78.4%Radial A41 Inbound 24 1784 52.2 16.5 86.4%Radial A1 Inbound 14 1553 39.7 12.5 81.0%Radial A10 Inbound 20 1245 47.8 15.2 86.6%Radial A12 Inbound 41 2004 71.1 20.2 86.5%Radial A13 Inbound 15 3016 25.2 21.6 86.5%Radial A2 Inbound 24 2364 36.3 23.0 85.6%Radial A20 Inbound 27 1271 63.3 15.0 89.2%Radial A21 Inbound 14 871 25.7 18.8 88.9%Radial A23 Inbound 26 884 80.3 12.1 84.4%Radial A24 Inbound 13 924 44.3 11.3 88.5%Radial A3 Inbound 16 1767 36.7 16.6 86.9%Radial A316 Inbound 13 1684 26.9 18.0 85.1%Orbital A406 Clockwise 44 2803 58.6 26.8 90.4%Orbital A406 Anti-clockwise 45 2554 71.6 22.4 87.5%Orbital A205 Clockwise 32 846 97.5 11.7 86.1%Orbital A205 Anti-clockwise 35 787 91.9 13.9 88.3%Radial Blackwall North 7 2814 19.7 13.4 75.8%Radial Blackwall South 7 2082 8.0 31.4 95.9%Orbital Inner Ring Clockwise 17 1304 66.5 9.2 84.2%Orbital Inner Ring Anti-clockwise 16 1244 59.7 10.2 83.1%Central Bishopsgate North 3 814 11.9 8.3 85.6%Central City West 5 1791 19.7 11.2 79.2%Central Farringdon South 3 866 10.1 11.1 88.1%Central South river East 4 717 13.9 10.7 83.0%Central West East 8 1250 25.4 11.8 86.4%Central Central All Directions 54 1107 168.7 12.1 86.6%TLRN TLRN All Directions 821 1693 1530.0 19.5 88.7%
2010/11P1-13
Figure 3.3 TfL is working towards increasing journey time reliability on these corridors, which is now actively managed on a daily basis. Understanding how a corridor performs will allow TfL to focus its congestion-relieving efforts on those areas of the corridor which are not meeting the targets and, additionally, allow it to monitor the impact of these efforts once they have been implemented. Chapter 4 details these interventions.
18
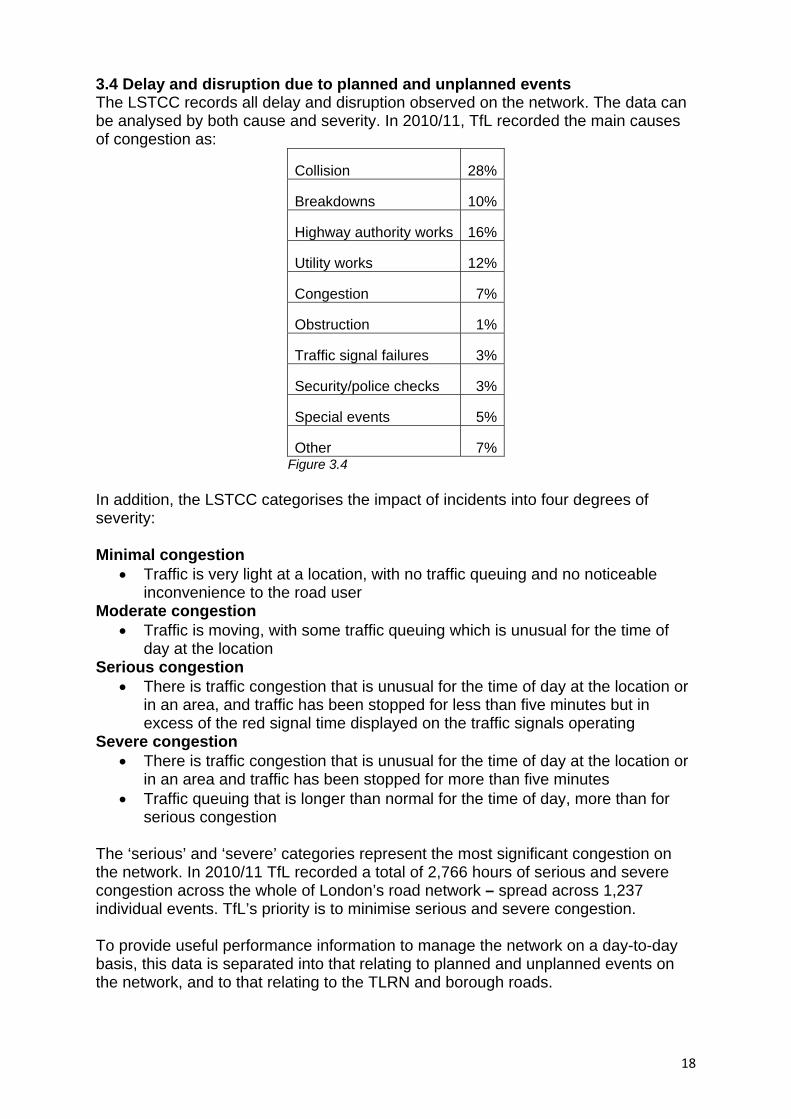
3.4 Delay and disruption due to planned and unplanned events The LSTCC records all delay and disruption observed on the network. The data can be analysed by both cause and severity. In 2010/11, TfL recorded the main causes of congestion as:
Collision 28%
Breakdowns 10%
Highway authority works 16%
Utility works 12%
Congestion 7%
Obstruction 1%
Traffic signal failures 3%
Security/police checks 3%
Special events 5%
Other 7% Figure 3.4
In addition, the LSTCC categorises the impact of incidents into four degrees of severity: Minimal congestion
• Traffic is very light at a location, with no traffic queuing and no noticeable inconvenience to the road user
Moderate congestion • Traffic is moving, with some traffic queuing which is unusual for the time of
day at the location Serious congestion
• There is traffic congestion that is unusual for the time of day at the location or in an area, and traffic has been stopped for less than five minutes but in excess of the red signal time displayed on the traffic signals operating
Severe congestion • There is traffic congestion that is unusual for the time of day at the location or
in an area and traffic has been stopped for more than five minutes • Traffic queuing that is longer than normal for the time of day, more than for
serious congestion The ‘serious’ and ‘severe’ categories represent the most significant congestion on the network. In 2010/11 TfL recorded a total of 2,766 hours of serious and severe congestion across the whole of London’s road network – spread across 1,237 individual events. TfL’s priority is to minimise serious and severe congestion. To provide useful performance information to manage the network on a day-to-day basis, this data is separated into that relating to planned and unplanned events on the network, and to that relating to the TLRN and borough roads.
19
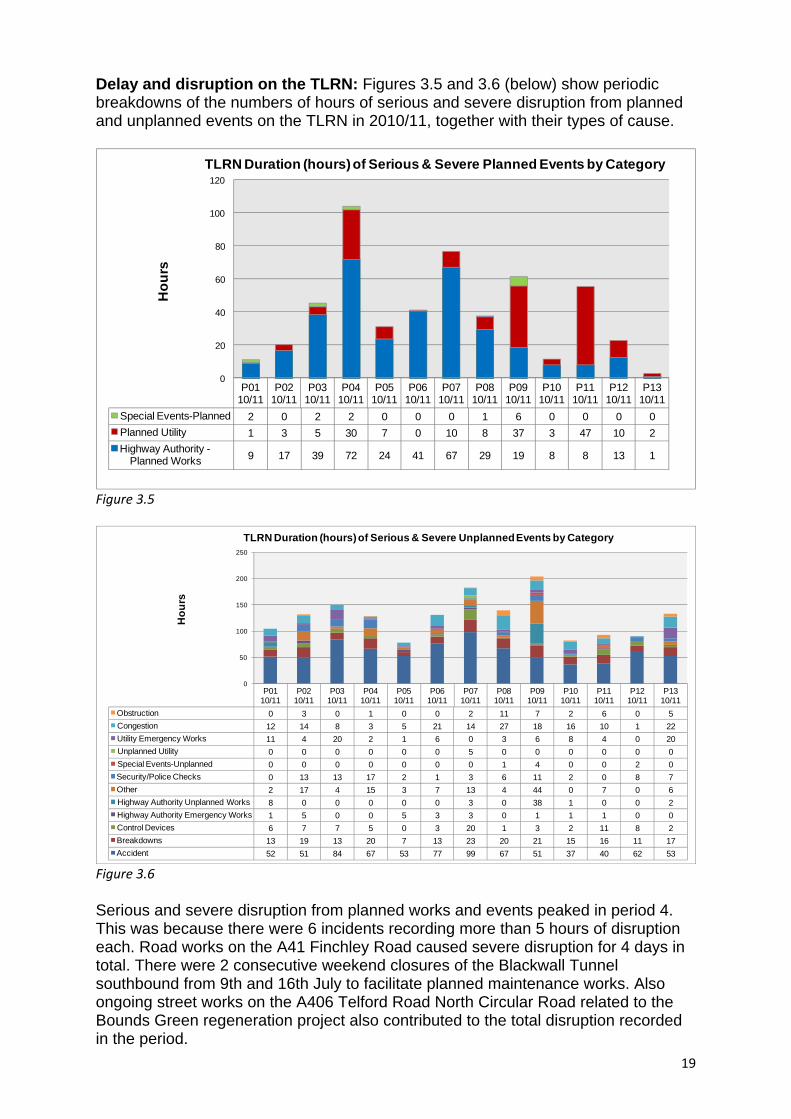
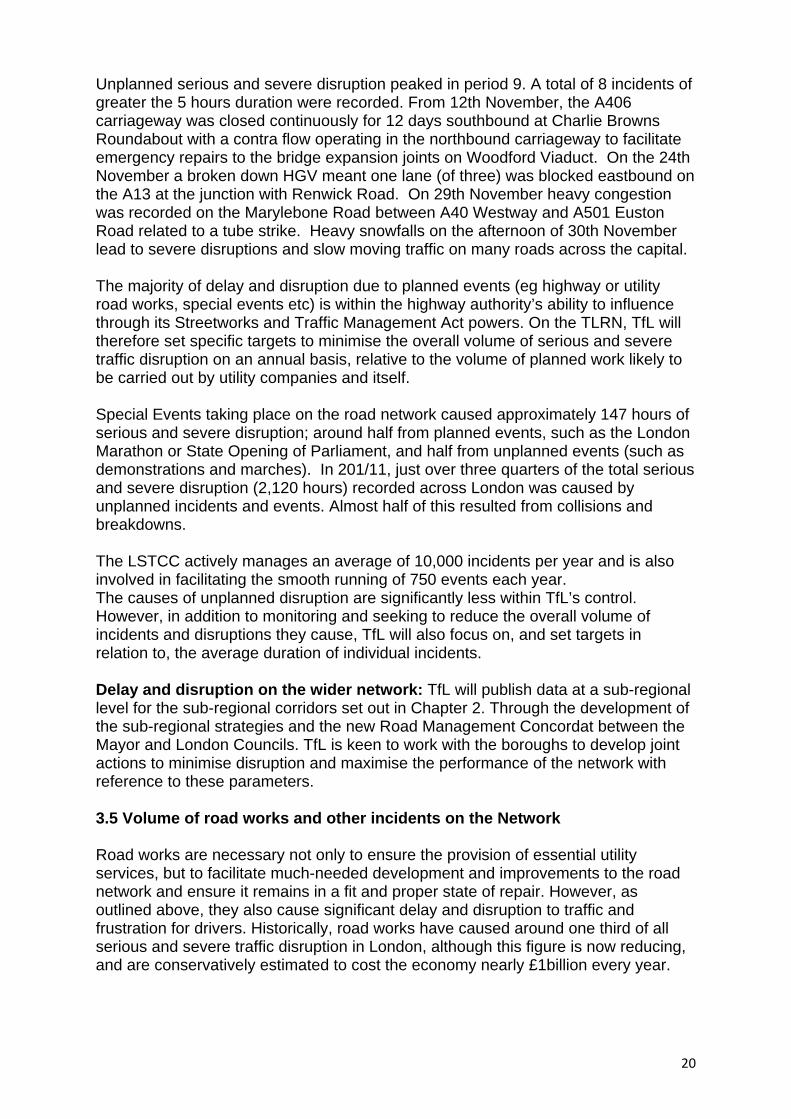
Delay and disruption on the TLRN: Figures 3.5 and 3.6 (below) show periodic breakdowns of the numbers of hours of serious and severe disruption from planned and unplanned events on the TLRN in 2010/11, together with their types of cause.
P0110/11
P0210/11
P0310/11
P0410/11
P0510/11
P0610/11
P0710/11
P0810/11
P0910/11
P1010/11
P1110/11
P1210/11
P1310/11
Special Events-Planned 2 0 2 2 0 0 0 1 6 0 0 0 0Planned Utility 1 3 5 30 7 0 10 8 37 3 47 10 2Highway Authority -
Planned Works 9 17 39 72 24 41 67 29 19 8 8 13 1
0
20
40
60
80
100
120
Hou
rsTLRN Duration (hours) of Serious & Severe Planned Events by Category
Figure 3.5
P0110/11
P0210/11
P0310/11
P0410/11
P0510/11
P0610/11
P0710/11
P0810/11
P0910/11
P1010/11
P1110/11
P1210/11
P1310/11
Obstruction 0 3 0 1 0 0 2 11 7 2 6 0 5Congestion 12 14 8 3 5 21 14 27 18 16 10 1 22Utility Emergency Works 11 4 20 2 1 6 0 3 6 8 4 0 20Unplanned Utility 0 0 0 0 0 0 5 0 0 0 0 0 0Special Events-Unplanned 0 0 0 0 0 0 0 1 4 0 0 2 0Security/Police Checks 0 13 13 17 2 1 3 6 11 2 0 8 7Other 2 17 4 15 3 7 13 4 44 0 7 0 6Highway Authority Unplanned Works 8 0 0 0 0 0 3 0 38 1 0 0 2Highway Authority Emergency Works 1 5 0 0 5 3 3 0 1 1 1 0 0Control Devices 6 7 7 5 0 3 20 1 3 2 11 8 2Breakdowns 13 19 13 20 7 13 23 20 21 15 16 11 17Accident 52 51 84 67 53 77 99 67 51 37 40 62 53
0
50
100
150
200
250
Hou
rs
TLRN Duration (hours) of Serious & Severe Unplanned Events by Category
Figure 3.6 Serious and severe disruption from planned works and events peaked in period 4. This was because there were 6 incidents recording more than 5 hours of disruption each. Road works on the A41 Finchley Road caused severe disruption for 4 days in total. There were 2 consecutive weekend closures of the Blackwall Tunnel southbound from 9th and 16th July to facilitate planned maintenance works. Also ongoing street works on the A406 Telford Road North Circular Road related to the Bounds Green regeneration project also contributed to the total disruption recorded in the period.
20
Unplanned serious and severe disruption peaked in period 9. A total of 8 incidents of greater the 5 hours duration were recorded. From 12th November, the A406 carriageway was closed continuously for 12 days southbound at Charlie Browns Roundabout with a contra flow operating in the northbound carriageway to facilitate emergency repairs to the bridge expansion joints on Woodford Viaduct. On the 24th November a broken down HGV meant one lane (of three) was blocked eastbound on the A13 at the junction with Renwick Road. On 29th November heavy congestion was recorded on the Marylebone Road between A40 Westway and A501 Euston Road related to a tube strike. Heavy snowfalls on the afternoon of 30th November lead to severe disruptions and slow moving traffic on many roads across the capital. The majority of delay and disruption due to planned events (eg highway or utility road works, special events etc) is within the highway authority’s ability to influence through its Streetworks and Traffic Management Act powers. On the TLRN, TfL will therefore set specific targets to minimise the overall volume of serious and severe traffic disruption on an annual basis, relative to the volume of planned work likely to be carried out by utility companies and itself. Special Events taking place on the road network caused approximately 147 hours of serious and severe disruption; around half from planned events, such as the London Marathon or State Opening of Parliament, and half from unplanned events (such as demonstrations and marches). In 201/11, just over three quarters of the total serious and severe disruption (2,120 hours) recorded across London was caused by unplanned incidents and events. Almost half of this resulted from collisions and breakdowns. The LSTCC actively manages an average of 10,000 incidents per year and is also involved in facilitating the smooth running of 750 events each year. The causes of unplanned disruption are significantly less within TfL’s control. However, in addition to monitoring and seeking to reduce the overall volume of incidents and disruptions they cause, TfL will also focus on, and set targets in relation to, the average duration of individual incidents. Delay and disruption on the wider network: TfL will publish data at a sub-regional level for the sub-regional corridors set out in Chapter 2. Through the development of the sub-regional strategies and the new Road Management Concordat between the Mayor and London Councils. TfL is keen to work with the boroughs to develop joint actions to minimise disruption and maximise the performance of the network with reference to these parameters. 3.5 Volume of road works and other incidents on the Network Road works are necessary not only to ensure the provision of essential utility services, but to facilitate much-needed development and improvements to the road network and ensure it remains in a fit and proper state of repair. However, as outlined above, they also cause significant delay and disruption to traffic and frustration for drivers. Historically, road works have caused around one third of all serious and severe traffic disruption in London, although this figure is now reducing, and are conservatively estimated to cost the economy nearly £1billion every year.
21
Numbers of road works on London’s roads: It is difficult to give an exact figure for the number of road works that take place across the Capital each year, or the amount by which they have increased or decreased. This is because prior to the introduction of a road works permit scheme, under the New Roads and Street Works Act 1991 (NRSWA), only utility companies were required to notify the relevant highway authority of their intention to carry out works. Highway authorities did not accurately record their own works. A complete record is not therefore available on the central road works register, LondonWorks, maintained by TfL. In 2009/2010, TfL recorded around 370,000 works across the Capital carried out by both highway authorities and public utilities. While this is a 20 per cent increase in the number of works recorded on the previous year, this does not mean there were 20 per cent more road works, only that reporting of highway authorities’ works had improved. There is no indication that the overall number of road works has increased. In fact, utilities works have decreased by 0.4 per cent since last year. It would only be possible to give a completely accurate picture of all the works taking place in the Capital if all boroughs implemented the common permit scheme and recorded all the highway works (as well as utility works) on the LondonWorks system. Given that not all highway authority works are being captured, it is likely that the 370,000 works recorded is still a significant underestimate and that there are significantly more than 500,000 holes dug on London’s road network every year, split evenly between highway authorities and utilities. Road works on the TLRN: Accurate records are, however, available for all works carried out on the TLRN in 2010/11. In 2010/11, there were 42,038 works undertaken. Around 55 per cent of these were planned works, with about 65% of these being TfL (including developer-related activity) and 35% utility works. These planned works accounted for 23% per cent of the duration of serious and severe disruption recorded on the TLRN over the same period. Of these works:
• Only two per cent were major schemes which, while often thought of as the most disruptive, can be well-planned and coordinated through advance notification and engagement. In addition, opportunities to combine works can be explored to minimise disruption as far as possible
• The majority (52 per cent) were minor schemes. These require a permit application to be made only three days ahead of works commencing. While minor schemes are short in duration, the limited advance notice provides authorities with little opportunity to coordinate works and facilitate the sharing of works sites and traffic management
Around 45 per cent of works carried out on the TLRN were unplanned (emergency or urgent), with a split of 72% by TfL and 28% by the utilities. These accounted for 8% per cent of the duration of serious and severe disruption recorded on the TLRN. Unplanned highway works tend to consist of relatively quick pothole or trip repairs, many of which are on pavements rather than carriageways. Utility companies, on the other hand, tend to have to dig down into carriageways to undertake more time-consuming repairs to fix burst water mains and gas leaks and, therefore, cause significantly more disruption. Defects and failures to the gas and water main networks, as well as carriageway and footway potholes, have also been exacerbated in recent years by prolonged spells of cold weather.
22
More than 90 per cent of works on the TLRN (unplanned and minor works) require three days advance notice or less. This clearly demonstrates the difficulties permit authorities have in coordinating activity effectively. However, to ensure the free flow and expeditious movement of traffic on the TLRN, using its road works permitting and Traffic Management Act powers, TfL will monitor and set targets to manage the overall numbers of road works taking place on its road network at any one time, and is keen to work jointly with London boroughs to achieve similar outcomes on the SRN. 3.6 Customer satisfaction Since 2005, TfL has conducted an annual customer satisfaction survey among Londoners to assess satisfaction levels with a range of aspects of the road network such as the maintenance and management of road and pavement surfaces; the disruption caused by road works; and the level of traffic congestion. During 2010, a larger TLRN-specific online survey of customer satisfaction was carried out for the first time and this more targeted study will be used for monitoring performance over time. The new TLRN-specific survey only interviews people who have used the TLRN in the last month, including non-Londoners. It is a multimodal survey and, therefore, takes into account the views of car drivers, taxi/commercial vehicle drivers, bus passengers, cyclists, Powered Two Wheelers (P2W) users and pedestrians. It will take place annually every autumn (known as the “TLRN User CSS”). The key measure of customer satisfaction will be overall satisfaction on last TLRN trip, recorded depending on which modes the person has used in the last month, and using the question, “Thinking about this particular journey you have made, and taking everything into account, how satisfied were you with the stretch of the red route that you used on that trip?” Key results from Autumn 2010 are:
• Customer satisfaction with the TLRN scored 72 out of 100. As a comparison, public transport generally scores 80 or above for customer satisfaction, while Barclays Cycle Hire scored 70 in its first months of operation
• Pedestrians and bus passengers scored slightly above the TLRN average, while car drivers scored the same as the average
• Taxi/commercial drivers and P2W riders scored slightly below average (70) • Cyclists were significantly less satisfied with the TLRN, scoring 67 on average
Journey speed and predictability, traffic congestion, response to (and information about) incidents and disruptions and road works are the key factors that drive overall satisfaction across all modes:
• Traffic congestion saw the lowest satisfaction scores (63 out of 100) • Pedestrians (score 75) were most satisfied with the speed of their journey on
the TLRN network compared to the average score of 69 • Road works management is also important, again with a relatively low
satisfaction rating (67 out of 100)
23
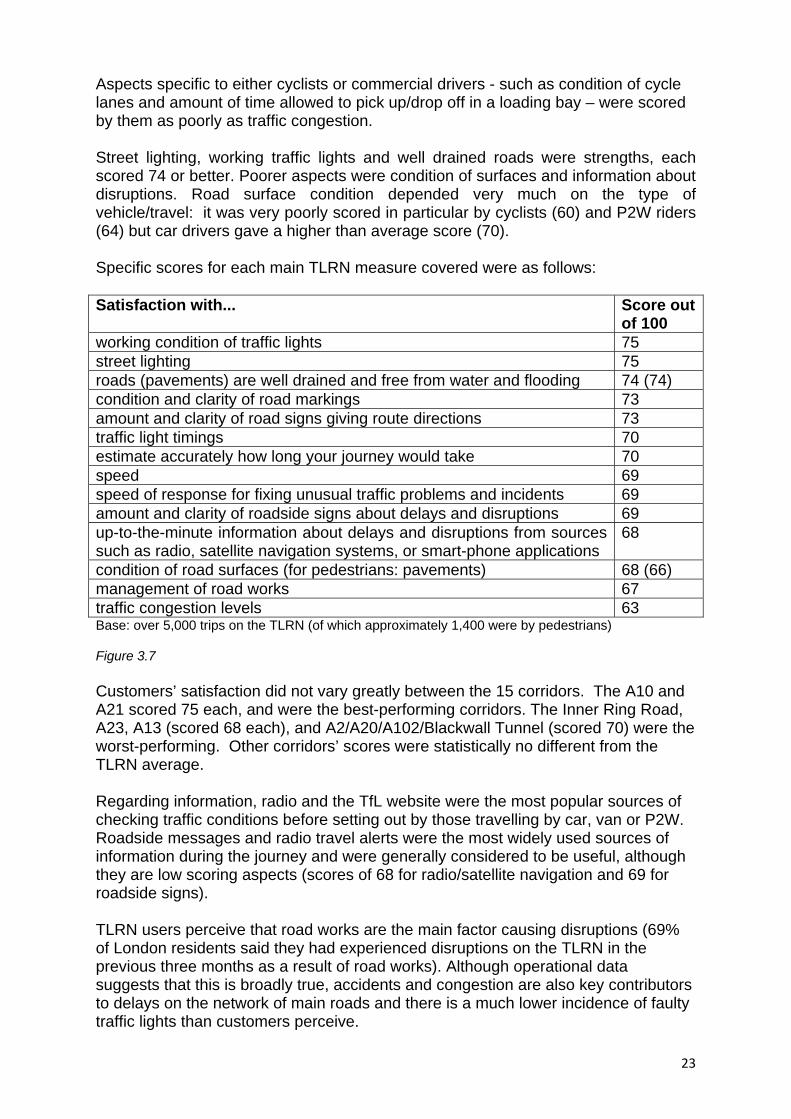
Aspects specific to either cyclists or commercial drivers - such as condition of cycle lanes and amount of time allowed to pick up/drop off in a loading bay – were scored by them as poorly as traffic congestion. Street lighting, working traffic lights and well drained roads were strengths, each scored 74 or better. Poorer aspects were condition of surfaces and information about disruptions. Road surface condition depended very much on the type of vehicle/travel: it was very poorly scored in particular by cyclists (60) and P2W riders (64) but car drivers gave a higher than average score (70). Specific scores for each main TLRN measure covered were as follows: Satisfaction with... Score out
of 100 working condition of traffic lights 75 street lighting 75 roads (pavements) are well drained and free from water and flooding 74 (74) condition and clarity of road markings 73 amount and clarity of road signs giving route directions 73 traffic light timings 70 estimate accurately how long your journey would take 70 speed 69 speed of response for fixing unusual traffic problems and incidents 69 amount and clarity of roadside signs about delays and disruptions 69 up-to-the-minute information about delays and disruptions from sources such as radio, satellite navigation systems, or smart-phone applications
68
condition of road surfaces (for pedestrians: pavements) 68 (66) management of road works 67 traffic congestion levels 63 Base: over 5,000 trips on the TLRN (of which approximately 1,400 were by pedestrians) Figure 3.7 Customers’ satisfaction did not vary greatly between the 15 corridors. The A10 and A21 scored 75 each, and were the best-performing corridors. The Inner Ring Road, A23, A13 (scored 68 each), and A2/A20/A102/Blackwall Tunnel (scored 70) were the worst-performing. Other corridors’ scores were statistically no different from the TLRN average. Regarding information, radio and the TfL website were the most popular sources of checking traffic conditions before setting out by those travelling by car, van or P2W. Roadside messages and radio travel alerts were the most widely used sources of information during the journey and were generally considered to be useful, although they are low scoring aspects (scores of 68 for radio/satellite navigation and 69 for roadside signs). TLRN users perceive that road works are the main factor causing disruptions (69% of London residents said they had experienced disruptions on the TLRN in the previous three months as a result of road works). Although operational data suggests that this is broadly true, accidents and congestion are also key contributors to delays on the network of main roads and there is a much lower incidence of faulty traffic lights than customers perceive.

24
3.7 Performance reporting To assist with the development and prioritisation of targeted interventions to improve network performance, and to help people better understand their impact, TfL will develop, collate and publish the performance data outlined above. This will be done on an area-wide and/or (where appropriate) corridor-related basis for the TLRN and, in future, on the key sub-regional corridors that will be agreed through the development of sub-regional strategies. TfL intends to publish this data on a quarterly basis and will share it with London Travel Watch for inclusion in their quarterly reports on TfL’s performance. Through the Road Management Concordat, TfL is working with London Councils. Furthermore, it will host the annual Managing London’s Road Network Summit attended by highway authorities, utilities and other stakeholders in the Capital. At the summit, network performance will be reviewed, key achievements will be presented, and innovative approaches can be shared to encourage best practice.
25
Chapter 4
Maximising the efficient and reliable operation of the network 4.1 Corridor management approach For the 23 London-wide TLRN corridors set out in Chapter 2, TfL is working to develop a better understanding of the reasons for varying performance, particularly in terms of journey time reliability. This includes looking at each corridor on a link-by-link and/or junction-by-junction basis, identifying pinch points, valves and hot spots, and understanding how each corridor operates in relation to the surrounding road networks. It also includes developing detailed corridor simulation models which will allow testing of potential measures to improve journey time reliability, prioritise their application and facilitate a corridor-based optimisation of traffic signal timings which, in itself, will have a significant impact on stop-start traffic. London Streets’ Network Performance Department has appointed Corridor Managers charged with managing the overall performance of each of these corridors on a day-to-day basis, and identifying and prioritising improvements to maximise journey time reliability. Through the development and implementation of the sub-regional plans, TfL is also keen to work with the boroughs to achieve the same outcomes on sub-regional corridors. This chapter sets out some of the key actions TfL will implement, either on its own or in partnership with London boroughs. 4.2 Signal timing reviews Reviewing the timings of 1,000 sets of traffic signals each year is a key Mayoral commitment, first outlined in the Way To Go! Policy statement published in November 2008. Road junctions are a key constraining factor on the effective operation of the road network. Maximising their performance is therefore an important part of efficient network management. The efficient operation of signalised junctions is particularly important in this regard. Because of limited road space, London has a very high number of signalised road junctions. TfL therefore regularly reviews and collates data on the performance of its 6,164 sets of traffic signals. Data recorded measures stop/start delays at traffic signals for both pedestrians and vehicular traffic in terms of:
• The number of occasions traffic queuing at a red traffic signal clears the junction in the first green phase of the traffic signal
• The number of occasions pedestrians waiting at a ‘red man’ signal clear the kerb during the invitation to cross ‘green man’ phase of the lights
TfL currently reviews and records performance data at 1,000 sets of traffic signals each year. Data is recorded across six time periods: the AM peak, PM peak, the off-peak period, late evenings, over night and at weekends.

26
In 2010/11, TfL completed 1,008 signal timing reviews (519 on the TLRN, 216 on the wider SRN and 273 on local borough roads), achieving an average 7.93 per cent reduction in stop/start delays at traffic signals. This was achieved with no dis-benefit to pedestrians and with improvements to both traffic and pedestrian flows across nearly all times of the day and night.
Number of occasions when queued traffic will have cleared through the first green phase:
Before review
(per cent)
After review
(per cent)
Change
(per cent)
Overall 72.13 80.06 7.93
AM Period 53.28 64.68 11.40
PM Peak 51.66 61.41 9.75
OP Peak 69.52 81.75 12.23
Weekend 69.70 79.39 9.69
Late Evening 90.63 94.43 3.80
Overnight 97.97 98.70 0.73
Figure 4.1
Number of occasions when pedestrians waiting to cross the road easily clear the kerb during the first green man/blackout period:
Before review
(per cent)
After review
(per cent)
Change
(per cent)
Overall 94.10 94.77 0.67
AM Period 90.84 91.44 0.60
PM Peak 89.99 90.40 0.41
OP Peak 93.26 94.42 1.16
Weekend 93.60 94.35 0.75
Late Evening 97.64 98.63 0.99
Overnight 99.25 99.38 0.13
Figure 4.2
27
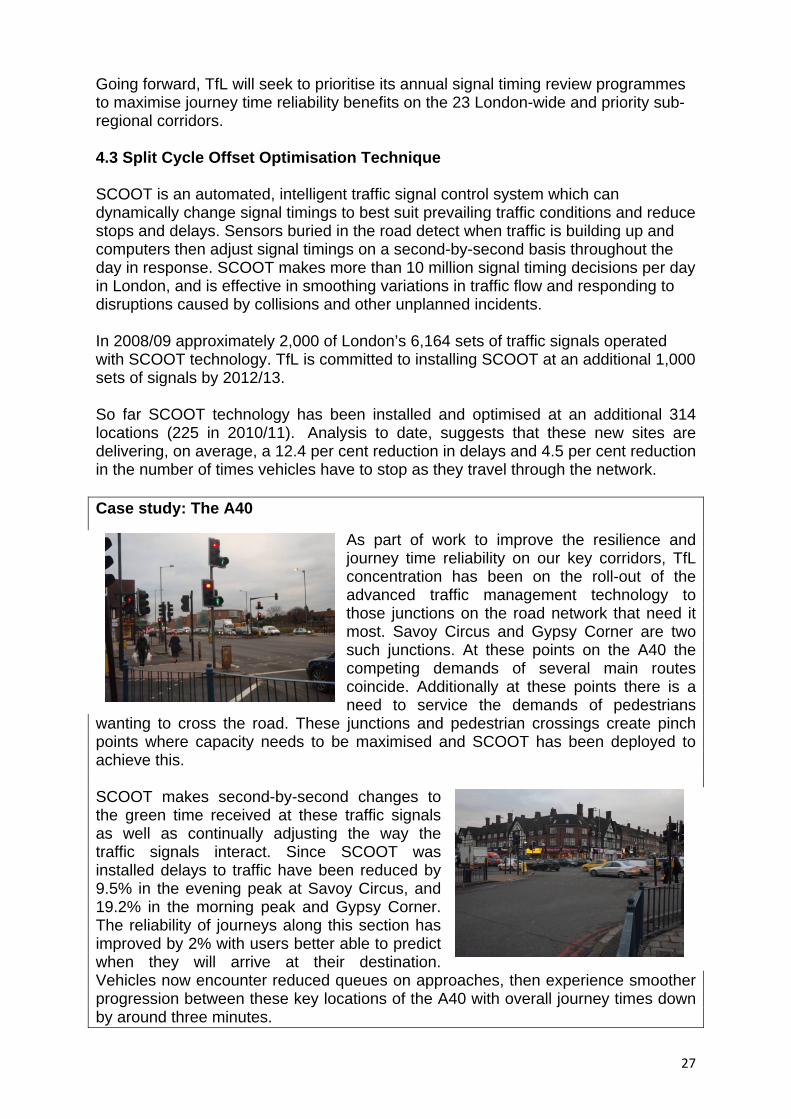
Going forward, TfL will seek to prioritise its annual signal timing review programmes to maximise journey time reliability benefits on the 23 London-wide and priority sub-regional corridors. 4.3 Split Cycle Offset Optimisation Technique SCOOT is an automated, intelligent traffic signal control system which can dynamically change signal timings to best suit prevailing traffic conditions and reduce stops and delays. Sensors buried in the road detect when traffic is building up and computers then adjust signal timings on a second-by-second basis throughout the day in response. SCOOT makes more than 10 million signal timing decisions per day in London, and is effective in smoothing variations in traffic flow and responding to disruptions caused by collisions and other unplanned incidents. In 2008/09 approximately 2,000 of London’s 6,164 sets of traffic signals operated with SCOOT technology. TfL is committed to installing SCOOT at an additional 1,000 sets of signals by 2012/13. So far SCOOT technology has been installed and optimised at an additional 314 locations (225 in 2010/11). Analysis to date, suggests that these new sites are delivering, on average, a 12.4 per cent reduction in delays and 4.5 per cent reduction in the number of times vehicles have to stop as they travel through the network. Case study: The A40
As part of work to improve the resilience and journey time reliability on our key corridors, TfL concentration has been on the roll-out of the advanced traffic management technology to those junctions on the road network that need it most. Savoy Circus and Gypsy Corner are two such junctions. At these points on the A40 the competing demands of several main routes coincide. Additionally at these points there is a need to service the demands of pedestrians
wanting to cross the road. These junctions and pedestrian crossings create pinch points where capacity needs to be maximised and SCOOT has been deployed to achieve this. SCOOT makes second-by-second changes to the green time received at these traffic signals as well as continually adjusting the way the traffic signals interact. Since SCOOT was installed delays to traffic have been reduced by 9.5% in the evening peak at Savoy Circus, and 19.2% in the morning peak and Gypsy Corner. The reliability of journeys along this section has improved by 2% with users better able to predict when they will arrive at their destination. Vehicles now encounter reduced queues on approaches, then experience smoother progression between these key locations of the A40 with overall journey times down by around three minutes.
28
Further examples of high profile locations where SCOOT has recently been activated and achieved improvements include:
• A23 Brixton Hill/Streatham Hill –18.8 per cent reduction in delay in the morning peak
• A23 Brixton Road/Loughborough Road – 13.9 per cent reduction in delay in the morning peak
• A207 Shooters Hill Road by Old Dover Road – 29.1 per cent reduction in delay in the morning peak and a 27.1 per cent reduction in the evening peak
TfL plans to prioritise its SCOOT development programme to maximise journey time and reliability benefits on the 23 London-wide and priority sub-regional corridors. iBus and Selective Vehicle Detection (SVD): SVD is a real-time system which can be linked with SCOOT. It prioritises buses at traffic signals, either by extending the ‘green’ time for a bus if it was about to go red, or by changing to green time earlier than was expected if the bus arrives at a red. Previous studies have indicated that up to five seconds per bus can be saved using iBus SVD linked with SCOOT. The aggregated benefits of small time savings to the bus network are significant in terms of improving reliability for bus services and encouraging modal shift. Since May 2008, iBus SVD has been enabled, reducing operating costs at more than 1,578 sites. 4.4 System Activated Strategy Selection (SASS) SASS works with SCOOT, iBus or any other computer-controlled traffic signal system. It uses network intelligence to automatically activate a different pre-programmed signal timing operation at one or more sets of traffic signals to respond to or pre-empt a particular traffic problem (for example a bridge lift at Tower Bridge) to help prevent traffic congestion. SASS is currently used at around 50 critical locations across London including many important gyratory systems (such as Hanger Lane) to improve traffic flow. Annually SASS intervenes approximately 100,000 times at critical traffic signals on the network.

29
Case study: SASS at The O2 SASS was introduced at The O2 in February 2009. A number of detection points were positioned around the venue to detect the build-up of congestion, following an event. Once a certain level of congestion had been detected, a number of automatic changes were made to the timings at traffic signals in the local area, providing more green time for vehicles travelling away from the arena. The majority of traffic exiting the arena after events travels along Millennium Way, turning right onto the A102. There is heavy demand for the right turn at Blackwall Lane to travel north through the Blackwall Tunnel. Vehicles waiting to make this right turn block back to the roundabout which in turn locks up and results in heavy queuing along both Millennium Way and John Harrision Way (see Figure 4.3 below). Prior to the implementation of SASS, clearance times for vehicles exiting The O2 were timed at more than 90 minutes. With the SASS strategy now in place, the car parking management team has reported an average clearance time of 22 minutes.
Figure 4.3 4.5 Pedestrian Countdown Research has show that pedestrians do not fully understand the green man, blackout, red man sequence at traffic signal junctions, many believing that the green man time is the time they have to cross the road, where in fact it is an invitation to cross. As a consequence of this lack of understanding in London, over time pedestrian green man times have been set in excess of that required to fulfil its intended function.
30
PCaTS is an initiative which provides significant information benefits to pedestrians (particularly mobility-impaired people), by letting them know how long they have to cross the road once the green man invitation to cross period has ended and the safety clearance period has begun. The safety clearance period is counted down. As a consequence of the enhanced information, where the green man invitation to cross period is not aligned to Department for Transport (DfT) guidance, there is the potential to improve the overall efficiency of the junction and reallocate a few seconds green time back to other modes. In May 2010, TfL gained approval from the DfT to run an ‘on-street’ trial of the PCaTS system, which it had been developing for the previous 18 months. Eight on-street trial sites have now been installed at the following locations:
Site number Trial site location
1 08/028 A201 Blackfriars Road – B300 The Cut – B300 Union Street TLRN
2 10/008 A24 Balham High Road – Chestnut Grove – Balham Station Road (diagonal pedestrian crossing)
TLRN
3 03/029 Finsbury Square – Finsbury Pavement – Chiswell Street SRN
4 08/003 A100 Tower Bridge Road – A200 Tooley Street TLRN
5 10/160 A306 Roehampton Lane – Queen Mary’s Hospital main access TLRN
6 08/211 Old Kent Road – Surrey Square – Penry Street TLRN
7 02/045 A4200 Kingsway – A40 High Holborn – A4200 Southampton Row SRN
8 01/212 Oxford Street – Regent Street – Oxford Circus SRN
Figure 4.4
All eight sites will be carefully monitored during the 18-month trial to determine whether the technology could be rolled out to other junctions across London. The first findings from TfL’s comprehensive behavioural and perception-research at each trial site will be available late 2011. However, initial reaction from TfL’s website survey shows that 76 per cent of respondents felt that PCaTS would be of some or significant benefit to them. Wider roll-out would require DfT approval and may be subject to secondary legislation. TfL will be working with the DfT during the trial and will submit findings of the technical, perception and behavioural research carried out at the eight trial sites. Should the trials prove successful, TfL may roll out the technology at traffic signal junctions operating a full pedestrian stage (where all traffic is stopped to allow pedestrians to cross all arms of the junction). 4.6 Traffic signal removal In recent years, there has been increasing interest from the traffic management industry and the wider political world in the removal of traffic signals at certain locations, and how alternative measures could improve traffic flow and pedestrian movement. Examples of these include mini-roundabouts, give way markings and zebra crossings.
31
Traffic lights have a vital role to play in managing day-to-day operations on the road network; regulating traffic flow, providing safe, convenient crossings for pedestrians and improving safety. A recent Greater London Authority (GLA)-commissioned study by consultants Colin Buchanan, exploring the economic impact of traffic signals, concluded that in many locations traffic signals provided real and tangible benefits of as much as £800,000 a year (in terms of time and disruption savings). However, the report also suggested that in some locations traffic signals could be less beneficial. As part of the Mayor’s smoothing traffic flow initiative, TfL is exploring the benefits of removing traffic signals at certain locations. A number of pilot initiatives have been taking place across London including:
• Ealing (Gunnersbury Lane/Bollo Lane and Western Road – Montague Way – Featherstone Road), where two signalised junctions have been replaced by mini-roundabouts and a zebra crossing
• Westminster (Ebury Street/Elizabeth Street), where a four-way junction with an ‘all red’-phase pedestrian crossing has been replaced by conventional give way markings and a raised crossing table
• Camden and Westminster border (Drury Lane/Great Queen Street),) where traffic signals, guard rails and street clutter have all been removed as part of public realm improvements in the area
Case Study: Traffic Signals Removal in Ealing The London Borough of Ealing implemented experimental schemes in December 2009, involving the removal of traffic signals at two junctions in the borough (Gunnersbury Lane/Bollo Lane and Western Road/Montague Way/Featherstone Road). Both junctions originally operated traffic signal control with ‘green man’ pedestrian crossing facilities on all arms. However, this arrangement was deemed unfavourable to traffic, often resulting in high levels of congestion and delays, and it was not clear that the signalised junctions were especially convenient for pedestrians. Both junctions were replaced by temporary mini roundabouts. Before and after monitoring was undertaken, including:
• Traffic Speed and Volume Counts • Classified Turning Counts • Queue Length Surveys • Pedestrian Volume Counts • Pedestrian Wait Times
Photographs of Western Road/Montague Way/Featherstone Road
BEFORE AFTER
32
Observations indicate that the volume of traffic through the two junctions has increased by between six – twelve per cent, average queue lengths have reduced by two-thirds, and typical pedestrian wait times have been reduced by half. The majority of those who responded to Ealing’s on-line consultation supported the introduction of the trials and a report on the experimental layouts concludes that the new arrangements have relieved congestion and are not detrimental to pedestrians. The permanent removal of the lights has since been endorsed by Councillors. In addition, the London Borough of Ealing has since approved plans for switch-off trials at five further junctions where the signals are believed to exacerbate traffic congestion. Feedback from these projects has been very encouraging. The Camden scheme has also been widely accepted as a success (a ‘before and after’ report is currently awaited from the borough). The costs of undertaking signal removals vary considerably depending on the nature of the alternative measures that need to be put in place. The basic cost of the physical removal of a set of signals is in the region of £6,000 per site. If replaced by simple give way markings or, in the case of a signalised pedestrian crossing, a zebra crossing, the additional costs are not substantial. If, however, signal removals are carried out as part of a wider package of measures or more substantive alternative measures, such as raised junction tables and/or mini-roundabouts, which are deemed necessary for road safety or other purposes, costs can be significantly more. Cost is therefore a significant consideration in the progression of traffic signal removal. However, to give greater impetus to this work, TfL has identified 145 traffic signal locations across London (23 on the TLRN and 122 on borough roads, where the traffic signals were deemed no longer useful in traffic, pedestrian or safety terms and could potentially be removed and replaced with alternative traffic calming measures. Since then, traffic signals have been physically removed from 14 locations (5 on TLRN and 9 on Borough roads). Following discussions with the London Boroughs, there are now 129 locations on the list where traffic signals could potentially be removed. TfL expects to discover more signals that do not meet the current criteria as it continues to review traffic signal timings. The removal of traffic signals also impacts on the overarching TfL objective to ensure that there is a zero net growth in the number of traffic signal locations on the TLRN, as approved by the Mayor. In order to achieve this objective one of the key levers is a much greater degree of scrutiny of schemes that promote new signal locations, to ensure that they are fit for purpose and deliver the benefits expected. The criteria used to determine the justification of traffic signals includes consideration of traffic flows, collision statistics/analysis, and, in the case of pedestrian facilities, the level of pedestrian demand. In determining whether signals are required, TfL will also consider wider benefits that could be delivered to road users, including bus passengers, cyclists and the local community.
33
Signals removal on the TLRN: In relation to the 23 traffic signal locations identified on the TLRN, a few of these are likely to require little in the way of alternative measures other than footway reinstatements and road markings. These could potentially be funded from within existing traffic signal maintenance/modernisation budgets and implemented relatively quickly (subject to public consultation). TfL has therefore progressed these and undertaken stakeholder engagement on each specific location. The stakeholder response to consultation has been mixed with some support for removals along with some resistance. Three traffic light locations are being removed and two trial removals initiated in March 2011. The remaining locations and any new locations identified may require more substantive alternative measures which would take longer to design and develop. Signals removal on borough roads: For the 122 traffic signal locations on borough roads originally identified, proposal 30 of the MTS makes it incumbent on local authorities to upgrade, rationalise or remove unnecessary traffic management equipment wherever appropriate, and to optimise timings at signal controlled junctions to keep traffic moving. TfL has written to all London boroughs with details of the results of the review in their area and asked them to consider whether, with the benefit of their local community and stakeholder knowledge, they would also consider the sites identified as viable for removal. Through the development of their new LIPs local authorities are being encouraged to demonstrate their commitment to this Mayoral objective by putting forward appropriate proposals as part of the development of their LIP-funded programmes. Where signals are approaching the end of their life and the equipment requires modernisation, TfL may also offer local authorities funds to assist with the removal of the signals rather than modernise them. TfL is now in the process of discussing individual locations in greater detail with the relevant boroughs, who in the majority of cases, have reacted very positively to these proposals. By removing traffic signals a number of benefits could be realised including a reduction in maintenance costs paid by local authorities to TfL, potential savings in journey times and urban realm enhancements. Any location where signals are removed will be monitored to determine the impact of the removal, including the effect on safety and operation for all road users. All final decisions on the removal, or otherwise, on borough roads are matters for the local borough. 4.7 Managing the impact of new development London’s population is forecast to increase by 1.25 million by 2031 while its economy will create a further 750,000 jobs. Increasing population and economic activity will increase demand for road space on the Capital’s already largely saturated road network. Road capacity management: As traffic volumes increase, speeds reduce and congestion generally increases, leading to potentially longer and less reliable journeys. However, in addition to increasing vehicular traffic demand, London’s limited road space must increasingly be managed to meet conflicting demands for pedestrian, cycling, public transport, freight and utility services access.
34
As a result, road traffic capacity in London has been, and continues to be, eroded by both short-term and long-term/permanent interventions on the network. These range from temporary but essential road works, to large-scale junction modifications and flagship schemes such as the ‘pedestrianisation’ of Trafalgar Square. In addition, the increase in demand for travel on some parts of the network will impact on performance in future years, even without any reductions in network capacity. Traditionally, mitigation of individual schemes adversely affecting network capacity has been through the tactical manipulation of signal timings, which can lead either to queue relocation or area-wide implementation of increased traffic signal cycle times and potentially increased pedestrian delay. A new and more robust approach to managing network capacity is required. The success of any capacity management system depends on a good knowledge of the capability and performance of the network. Complex urban networks such as London depend on an ability to function with an acceptable reserve capacity to deal with the inevitable disruption which takes place. Ideally, traffic signals should operate at no greater than 80 per cent saturation, which gives 10 per cent practical reserve capacity. TfL is capturing and analysing performance data with a view to developing a capacity management framework that will assist scheme development. This will be predicated on an outcome-led approach, where performance and capacity outcomes are agreed at the outset of a project so designers focus on achieving the full range of objectives and not only individual modal benefits. TfL is therefore looking to:
• Categorise the capacity of the network on a section/corridor basis to understand where the challenges currently are
• Produce location-specific future traffic growth figures so that designers can use existing and future flow levels to develop/design schemes
• Provide early advice to scheme promoters on the potential impact of schemes on network capacity
• Develop an outcome criteria that would indicate what level of modal or other benefit would warrant a loss in capacity of various levels (eg regeneration)
Traffic signal development: TfL is responsible for the design, approval, maintenance and operation of all traffic signals in London. However, aside from those on the TLRN, responsibility for generating, sponsoring and funding schemes involving new traffic signals rests with the boroughs – directly or through their control of development activity. TfL does, however, have legal powers to refuse a proposed traffic signal under the GLA Act 1999, but only where it considers there are reasonable grounds for doing so.
35
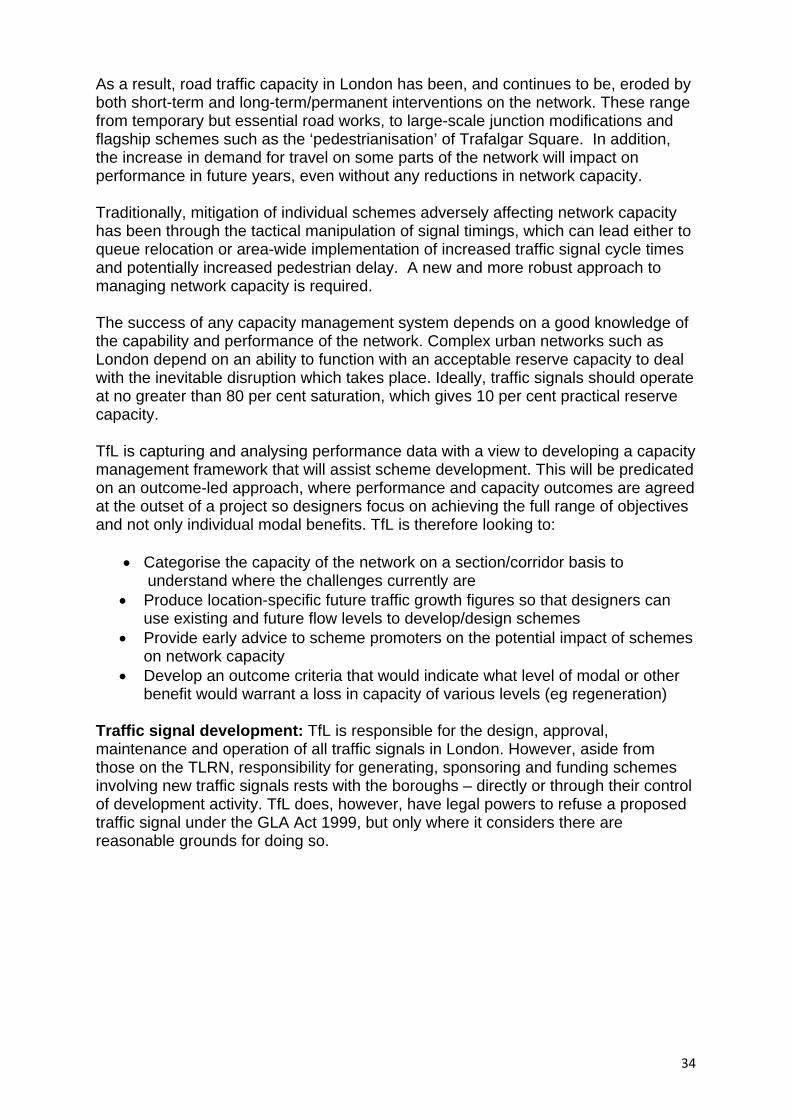
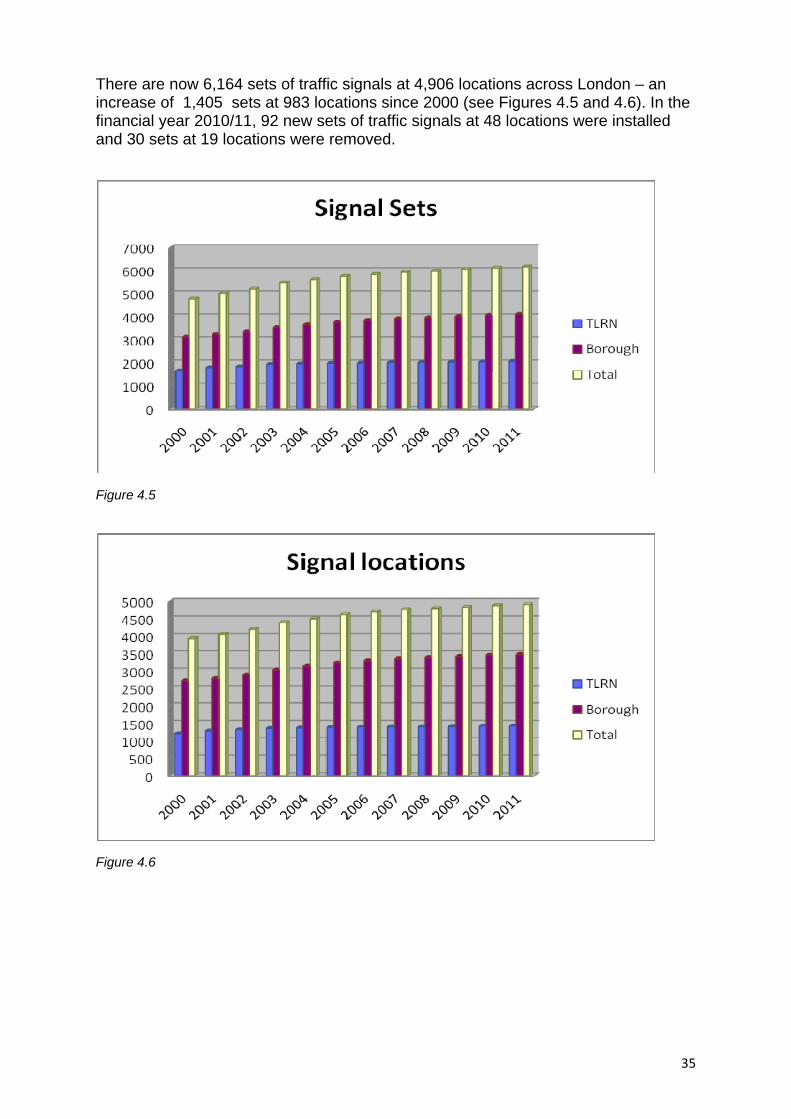
There are now 6,164 sets of traffic signals at 4,906 locations across London – an increase of 1,405 sets at 983 locations since 2000 (see Figures 4.5 and 4.6). In the financial year 2010/11, 92 new sets of traffic signals at 48 locations were installed and 30 sets at 19 locations were removed.
Figure 4.5
Figure 4.6
36
Case study: Reviewing future traffic signal scheme proposals To help minimise the future growth in signals on the network, TfL has recently carried out a review of all existing proposals for new traffic signals. At the start, there were proposals for 111 new sets of traffic signals (27 on the TLRN and 84 on borough roads). To date, by working with scheme promoters and testing whether new signals are really necessary or whether there are alternative traffic control measures available, the review has reduced this to 81 potential new sets (12 on the TLRN and 69 on borough roads). Examples of schemes removed from the programme to date include:
• Borough roads – Syon Lane by Grant Way. A proposal for a new pedestrian crossing was dropped as the borough was persuaded by TfL that the nearby junction more than met existing pedestrian demand
• Developer-funded – Clapham Road by Albert Square. A proposal for a new pedestrian crossing was dropped by the developer after being persuaded by TfL that pedestrian demand was more than adequately met at two nearby junctions
It is hoped further schemes can be removed from this list. However, for some schemes, even if alternative solutions might be available, existing legal agreements (eg with developers) may mean TfL is effectively already committed to them, unless it can reach specific agreement with the works promoters concerned. In these cases, TfL works with the scheme promoters to minimise the impact on traffic operations as far as possible.
TfL proposes to increase the level of scrutiny of future new schemes to insist that local authorities and TfL’s own internal scheme sponsors consider all alternatives before proposing a new set of traffic signals. Proposals will be scrutinised to ensure they are creating significant wider benefits that outweigh any potential smoothing traffic flow disadvantage (eg in relation to pedestrian movement, Barclays Cycle Superhighways, Better Streets initiatives, bus priority and supporting London’s growth through facilitating access to new developments etc).
In future, TfL’s Traffic Directorate will refuse proposals for new signal installations in cases where it is evident that alternative methods of traffic control have not been considered, or where installation will cause unacceptable levels of disruption to traffic and will not produce significant safety, pedestrian, cycle, public transport or other benefits. 4.8 Minor improvements/simplifying the road network Through the application of simple minor traffic management/engineering techniques, there are many opportunities to review and simplify the way road network regulations operate in London to ensure the TLRN and key roads on the borough network operate efficiently and more seamlessly. The requirements of different user groups (motorists, bus passengers, freight operators, businesses, cyclists and pedestrians) need to be balanced and traffic management, parking/loading and bus lane restrictions need to be adapted to best meet them, without introducing widely varying regulations that will inevitably lead to confusion.
37
TfL’s Corridor Managers will be looking at developing a suite of measures which could simplify the road network and help to promote the smooth flow of traffic along these key routes. This simplification may come in the form of reviewing the length and operating times of a bus lane, looking at the enforcement and operating times of parking bays, or looking into the way road markings have been applied on the approach to key junctions. 4.9 Motorcycles in bus lanes In response to the Mayor’s manifesto commitment, on 5 January 2008 TfL launched a trial to allow motorcycles, mopeds, scooters and tricycles to travel in most red route bus lanes. The trial, which ended on 5 July 2010, covered 418 bus lanes on the TLRN and looked in detail at 28 trial sites, comparing them with 28 control sites on parallel routes where motorcyclists did not have access to bus lanes. It found that:
• Fears of an increase in cyclist collisions with motorcyclists were unfounded • There was a fall in the cyclist collision rate across trial bus lanes and the
control lanes, with a smaller decrease in the trial lanes, and there were no fatal collisions over the period of the trial
• More than half (51 per cent) of motorcyclists switched from riding on the outside of the road to the bus lanes
A separate study by TfL, using police traffic officers to study journey times in bus lanes, indicated that journeys made by motorcycles using bus lanes were, on average, more than 10 per cent quicker than those not using bus lanes and 36 per cent quicker than cars. In addition, road user surveys of more than 2,000 Londoners also found that:
• Ninety-three per cent of motorcyclists, and 51 per cent of cyclists and car and van drivers, who were aware of the trial supported it
• Fifty-four per cent of motorcyclists said they now use TfL’s road network more often following the start of the trial
However, the independent report found that some questions remained about the way in which motorcycle riders use bus lanes. It identified an increase in the rate of motorcycle collisions, predominantly with cars turning into or out of side roads on routes where motorcyclists had access to bus lanes. At the trial sites there was an increase from 30 to 41 collisions, while there was a reduction from 16 to eight collisions on the control sites. In light of those findings, the decision was made to introduce a new 18-month trial of motorcycles in bus lanes, which started on Saturday 24 July 2010. The trial will include a new road safety awareness campaign aimed at improving drivers’ awareness of motorbikes and cyclists in bus lanes. 4.10 Minimising parking contraventions and other moving vehicle offences Illegal parking and moving vehicle offences (such as blocking yellow box junctions) can have a serious impact on traffic flows in London. TfL has successfully used both camera technology and TfL funded officers from the Metropolitan Police Service to reduce the number of contraventions on red routes in London. The number of recorded contraventions per mile of red route in London have reduced from one every 1.3 miles in April 2006 to one every 2.4 miles in December 2010.
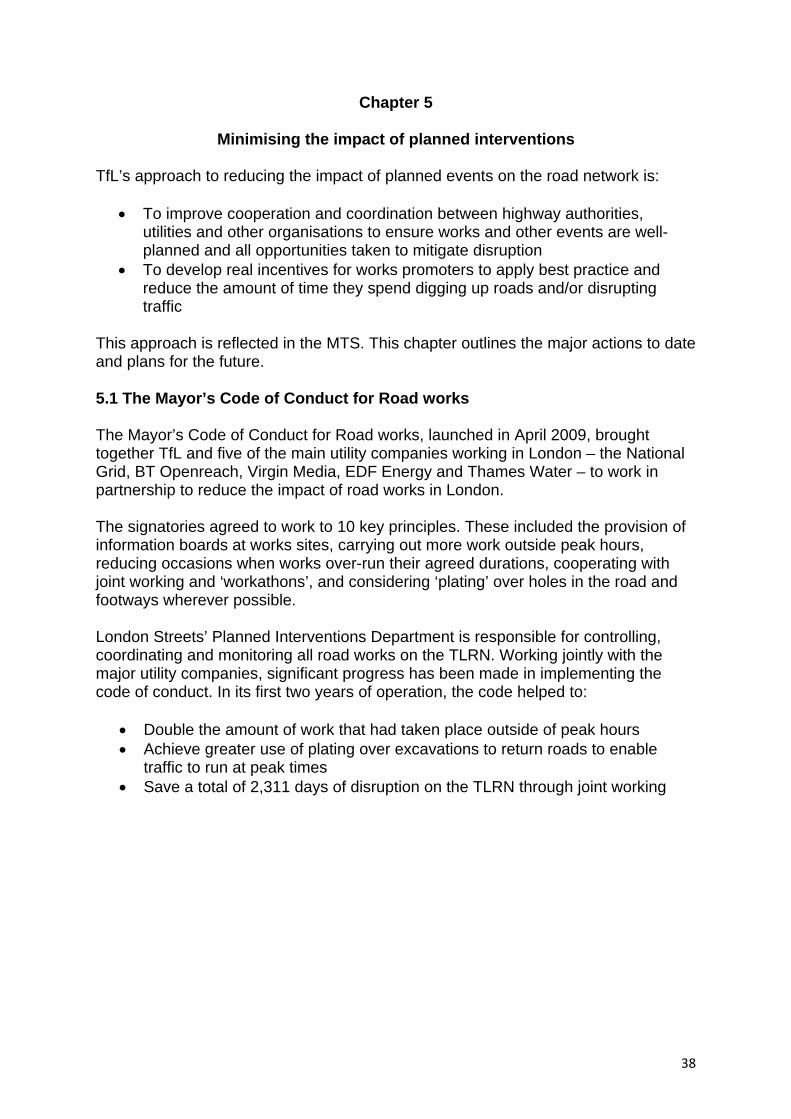
38
Chapter 5
Minimising the impact of planned interventions
TfL’s approach to reducing the impact of planned events on the road network is:
• To improve cooperation and coordination between highway authorities, utilities and other organisations to ensure works and other events are well-planned and all opportunities taken to mitigate disruption
• To develop real incentives for works promoters to apply best practice and reduce the amount of time they spend digging up roads and/or disrupting traffic
This approach is reflected in the MTS. This chapter outlines the major actions to date and plans for the future. 5.1 The Mayor’s Code of Conduct for Road works The Mayor’s Code of Conduct for Road works, launched in April 2009, brought together TfL and five of the main utility companies working in London – the National Grid, BT Openreach, Virgin Media, EDF Energy and Thames Water – to work in partnership to reduce the impact of road works in London. The signatories agreed to work to 10 key principles. These included the provision of information boards at works sites, carrying out more work outside peak hours, reducing occasions when works over-run their agreed durations, cooperating with joint working and ‘workathons’, and considering ‘plating’ over holes in the road and footways wherever possible. London Streets’ Planned Interventions Department is responsible for controlling, coordinating and monitoring all road works on the TLRN. Working jointly with the major utility companies, significant progress has been made in implementing the code of conduct. In its first two years of operation, the code helped to:
• Double the amount of work that had taken place outside of peak hours • Achieve greater use of plating over excavations to return roads to enable
traffic to run at peak times • Save a total of 2,311 days of disruption on the TLRN through joint working
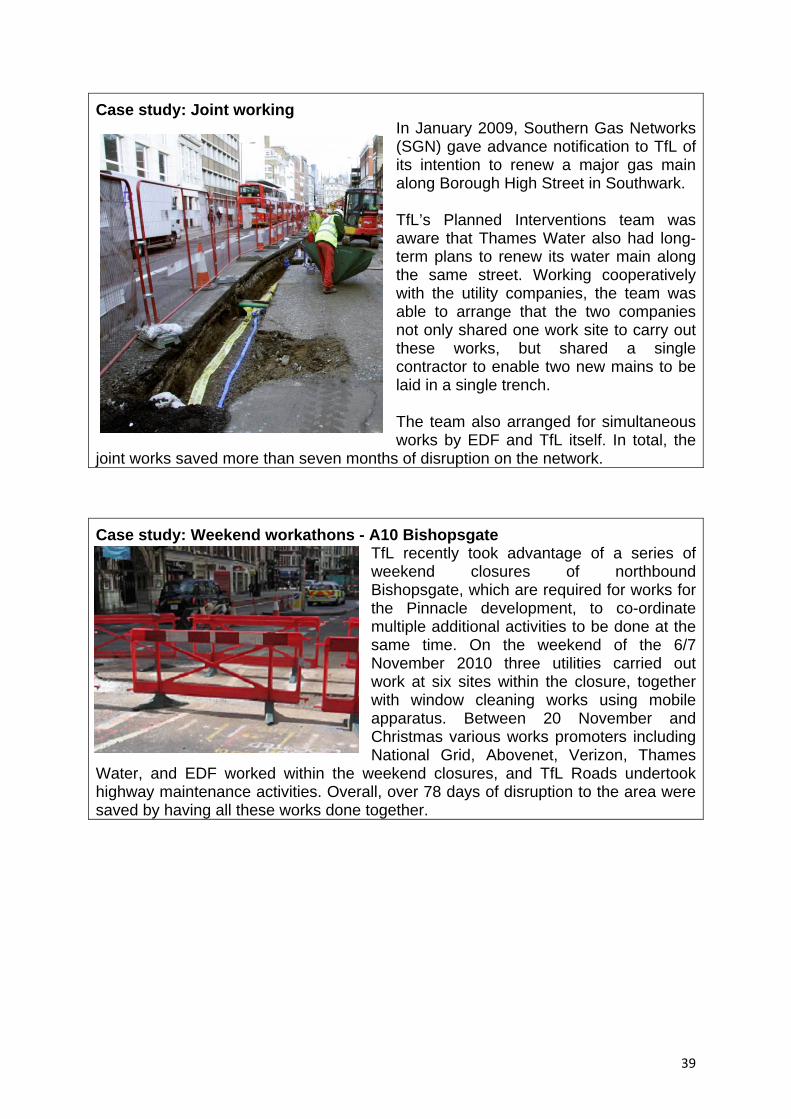
39
Case study: Joint working
In January 2009, Southern Gas Networks (SGN) gave advance notification to TfL of its intention to renew a major gas main along Borough High Street in Southwark. TfL’s Planned Interventions team was aware that Thames Water also had long-term plans to renew its water main along the same street. Working cooperatively with the utility companies, the team was able to arrange that the two companies not only shared one work site to carry out these works, but shared a single contractor to enable two new mains to be laid in a single trench. The team also arranged for simultaneous works by EDF and TfL itself. In total, the
joint works saved more than seven months of disruption on the network. Case study: Weekend workathons - A10 Bishopsgate
TfL recently took advantage of a series of weekend closures of northbound Bishopsgate, which are required for works for the Pinnacle development, to co-ordinate multiple additional activities to be done at the same time. On the weekend of the 6/7 November 2010 three utilities carried out work at six sites within the closure, together with window cleaning works using mobile apparatus. Between 20 November and Christmas various works promoters including National Grid, Abovenet, Verizon, Thames
Water, and EDF worked within the weekend closures, and TfL Roads undertook highway maintenance activities. Overall, over 78 days of disruption to the area were saved by having all these works done together.
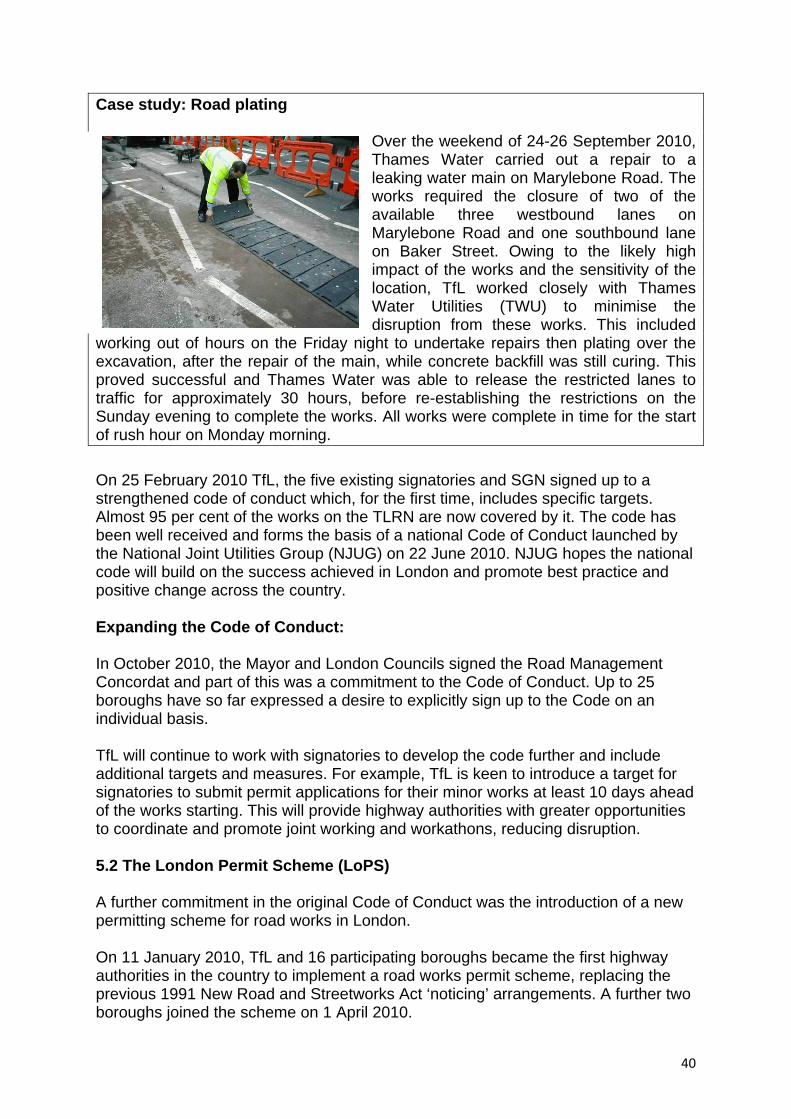
40
Case study: Road plating
Over the weekend of 24-26 September 2010, Thames Water carried out a repair to a leaking water main on Marylebone Road. The works required the closure of two of the available three westbound lanes on Marylebone Road and one southbound lane on Baker Street. Owing to the likely high impact of the works and the sensitivity of the location, TfL worked closely with Thames Water Utilities (TWU) to minimise the disruption from these works. This included
working out of hours on the Friday night to undertake repairs then plating over the excavation, after the repair of the main, while concrete backfill was still curing. This proved successful and Thames Water was able to release the restricted lanes to traffic for approximately 30 hours, before re-establishing the restrictions on the Sunday evening to complete the works. All works were complete in time for the start of rush hour on Monday morning.
On 25 February 2010 TfL, the five existing signatories and SGN signed up to a strengthened code of conduct which, for the first time, includes specific targets. Almost 95 per cent of the works on the TLRN are now covered by it. The code has been well received and forms the basis of a national Code of Conduct launched by the National Joint Utilities Group (NJUG) on 22 June 2010. NJUG hopes the national code will build on the success achieved in London and promote best practice and positive change across the country. Expanding the Code of Conduct: In October 2010, the Mayor and London Councils signed the Road Management Concordat and part of this was a commitment to the Code of Conduct. Up to 25 boroughs have so far expressed a desire to explicitly sign up to the Code on an individual basis. TfL will continue to work with signatories to develop the code further and include additional targets and measures. For example, TfL is keen to introduce a target for signatories to submit permit applications for their minor works at least 10 days ahead of the works starting. This will provide highway authorities with greater opportunities to coordinate and promote joint working and workathons, reducing disruption. 5.2 The London Permit Scheme (LoPS) A further commitment in the original Code of Conduct was the introduction of a new permitting scheme for road works in London. On 11 January 2010, TfL and 16 participating boroughs became the first highway authorities in the country to implement a road works permit scheme, replacing the previous 1991 New Road and Streetworks Act ‘noticing’ arrangements. A further two boroughs joined the scheme on 1 April 2010.
41
This means any organisation, including highway authorities themselves, wishing to dig up the road must have a formal permit and the specific permission of the Traffic Manager to do so. The previous noticing arrangements merely required works promoters to inform the highway authority of their intention to carry out road works. A further seven boroughs have made applications to the DfT to allow them to implement the London Permitting Scheme (LoPS) in spring 2011 and two more boroughs will join later in 2011. This will take the total number operating road works permit schemes to 27, covering 82 per cent of all roads in the Capital. The aspiration of the Road Management Concordat is ultimately for all London boroughs to introduce permitting. The permit scheme enables improved coordination of road works by giving highway authorities better information about the works that promoters wish to do earlier, enabling more joint working. It also gives authorities specific powers to refuse or re-time works to minimise disruption. During the period April 2010 to 31 March 2011, TfL has granted around 48,000 permits and refused just over 10,000 for varying reasons. This alone has helped reduce disruption from poorly planned and coordinated works. The Planned Interventions team take the opportunity that the scheme offers to consult with a range of stakeholders including Buses, LSTCC and Network Performance to minimise the effect of road works and keeps this process under review. As well as providing a better opportunity for works to be coordinated, the scheme is also providing a wealth of information on the sort of works being undertaken on the network and how long these should take. This intelligence will be invaluable in future. Reducing the number of road works: TfL’s Traffic Manager is now able to proactively use the powers provided by the permit scheme to control the number of permits issued and, through this, the volume of activity taking place on the TLRN at any one time. In April 2010, TfL set itself a target to achieve a five per cent reduction in the overall numbers of road works, although much higher reductions (up to 20 per cent) were targeted in levels of peak activity such as that which occurred in February/March 2010. Conversely, during holiday periods when traffic volumes are lower and network resilience higher, more work will be aimed for. To achieve this, TfL implemented a ‘cap’ on the number of road works it allowed to take place on the network at any one time of 4,170 sets of works in any four week period. TfL achieved both targets with the number of works starting on the TLRN for the year 2010/11 recorded as 42,038, which represented an overall reduction of 13 per cent from the previous year. In addition the maximum number of works which started in any one period was 3,890, a 25 per cent reduction from the previous peak period of 5,212.
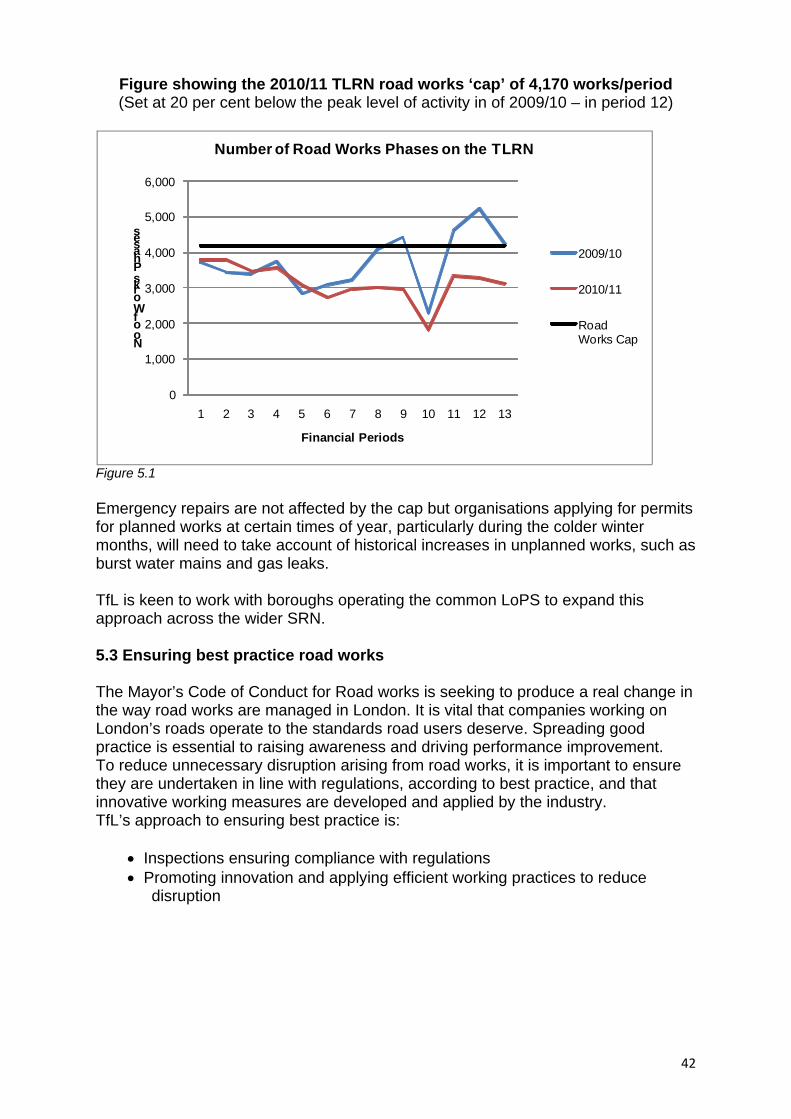
42
Figure showing the 2010/11 TLRN road works ‘cap’ of 4,170 works/period (Set at 20 per cent below the peak level of activity in of 2009/10 – in period 12)
0
1,000
2,000
3,000
4,000
5,000
6,000
1 2 3 4 5 6 7 8 9 10 11 12 13
No of Works Phases
Financial Periods
Number of Road Works Phases on the TLRN
2009/10
2010/11
Road Works Cap
Figure 5.1 Emergency repairs are not affected by the cap but organisations applying for permits for planned works at certain times of year, particularly during the colder winter months, will need to take account of historical increases in unplanned works, such as burst water mains and gas leaks. TfL is keen to work with boroughs operating the common LoPS to expand this approach across the wider SRN. 5.3 Ensuring best practice road works The Mayor’s Code of Conduct for Road works is seeking to produce a real change in the way road works are managed in London. It is vital that companies working on London’s roads operate to the standards road users deserve. Spreading good practice is essential to raising awareness and driving performance improvement. To reduce unnecessary disruption arising from road works, it is important to ensure they are undertaken in line with regulations, according to best practice, and that innovative working measures are developed and applied by the industry. TfL’s approach to ensuring best practice is:
• Inspections ensuring compliance with regulations • Promoting innovation and applying efficient working practices to reduce
disruption
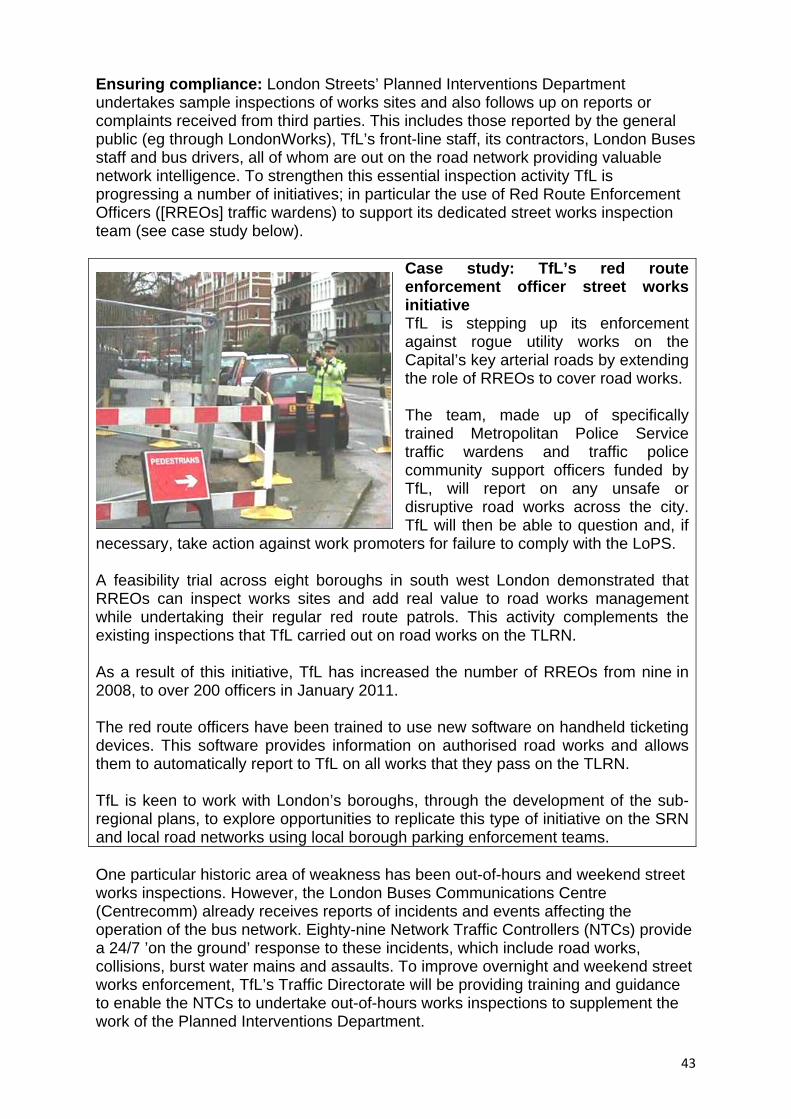
43
Ensuring compliance: London Streets’ Planned Interventions Department undertakes sample inspections of works sites and also follows up on reports or complaints received from third parties. This includes those reported by the general public (eg through LondonWorks), TfL’s front-line staff, its contractors, London Buses staff and bus drivers, all of whom are out on the road network providing valuable network intelligence. To strengthen this essential inspection activity TfL is progressing a number of initiatives; in particular the use of Red Route Enforcement Officers ([RREOs] traffic wardens) to support its dedicated street works inspection team (see case study below).
Case study: TfL’s red route enforcement officer street works initiative TfL is stepping up its enforcement against rogue utility works on the Capital’s key arterial roads by extending the role of RREOs to cover road works. The team, made up of specifically trained Metropolitan Police Service traffic wardens and traffic police community support officers funded by TfL, will report on any unsafe or disruptive road works across the city. TfL will then be able to question and, if
necessary, take action against work promoters for failure to comply with the LoPS. A feasibility trial across eight boroughs in south west London demonstrated that RREOs can inspect works sites and add real value to road works management while undertaking their regular red route patrols. This activity complements the existing inspections that TfL carried out on road works on the TLRN. As a result of this initiative, TfL has increased the number of RREOs from nine in 2008, to over 200 officers in January 2011. The red route officers have been trained to use new software on handheld ticketing devices. This software provides information on authorised road works and allows them to automatically report to TfL on all works that they pass on the TLRN. TfL is keen to work with London’s boroughs, through the development of the sub-regional plans, to explore opportunities to replicate this type of initiative on the SRN and local road networks using local borough parking enforcement teams. One particular historic area of weakness has been out-of-hours and weekend street works inspections. However, the London Buses Communications Centre (Centrecomm) already receives reports of incidents and events affecting the operation of the bus network. Eighty-nine Network Traffic Controllers (NTCs) provide a 24/7 ’on the ground’ response to these incidents, which include road works, collisions, burst water mains and assaults. To improve overnight and weekend street works enforcement, TfL’s Traffic Directorate will be providing training and guidance to enable the NTCs to undertake out-of-hours works inspections to supplement the work of the Planned Interventions Department.

44
While currently focused on the TLRN, given that NTCs operate across the whole of London’s road network in connection with their bus related activities, there is potential scope in the future to widen this initiative and offer a similar service to borough street works enforcement teams on the wider SRN. This will help increase compliance with regulations and encourage best practice by works promoters to minimise the unnecessary disruption caused by poor practice. Enforcement action: The NRSWA, the Traffic Management Act 2004 and the LoPS all create criminal offences where utilities fail to comply with their responsibilities. In May 2008 the Fixed Penalty Notice (FPN) scheme was introduced. This allows TfL to issue fines to utility companies where they fail to provide accurate or timely information in relation to their works or, for authorities such as TfL where permit schemes are in operation, where they fail to request a permit for their works or breach permit conditions. The level of FPN charge depends on the nature of the offence and is also subject to a discount if paid within 29 days. The charge for working without a permit is £500 but is reduced to £300 if paid within 29 days. Similarly the charge for a breach of permit condition is £120, £80 if paid within 29 days. Because of the increase in enforcement resources, the number of FPNs TfL gave utilities has increased from 247 in 2008/09, to 307 in 2009/10. In 2010/11, 454 FPNs have been issued. Where the nature of the offence is more serious, TfL is able to prosecute works promoters. TfL prosecuted two utility companies in 2009. In 2010 this increased to 23 (including 20 where utilities had failed to discharge their liability through payment of FPN). Section 74 overstay charges: The application of works overstay charges is another measure that helps to incentivise efficient working and shorter works durations. Section 74 of the NRSWA allows local authorities to charge utilities for over-running agreed works durations. There were 719 days of ‘overruns’ recorded on the TLRN in 2008/09, 665 days in 2009/10, and 858 in 2010/11. TfL has been working closely with the DfT to assist with its proposal to increase significantly the maximum charges that local authorities can impose on works promoters whose works over-run their agreed durations. On 1 March 2010, the DfT announced its consultation on proposals to increase the current maximum works over-run charges from £2,500 a day to £25,000 a day. TfL responded to this consultation and the DfT have announced that new charge levels will come into effect on 1st October 2011. The charge for traffic sensitive streets (which covers all of the TLRN) for the first 3 days will increase to £5,000 per day and subsequent days will attract a charge of £10,000.
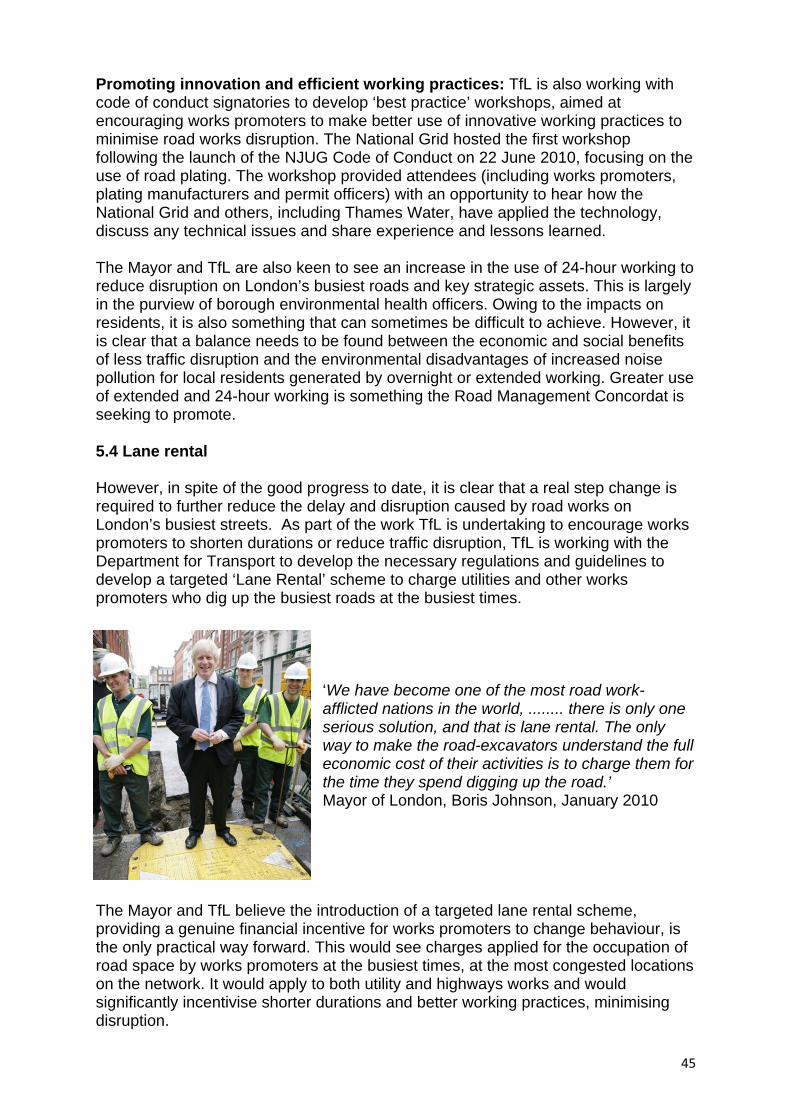
45
Promoting innovation and efficient working practices: TfL is also working with code of conduct signatories to develop ‘best practice’ workshops, aimed at encouraging works promoters to make better use of innovative working practices to minimise road works disruption. The National Grid hosted the first workshop following the launch of the NJUG Code of Conduct on 22 June 2010, focusing on the use of road plating. The workshop provided attendees (including works promoters, plating manufacturers and permit officers) with an opportunity to hear how the National Grid and others, including Thames Water, have applied the technology, discuss any technical issues and share experience and lessons learned. The Mayor and TfL are also keen to see an increase in the use of 24-hour working to reduce disruption on London’s busiest roads and key strategic assets. This is largely in the purview of borough environmental health officers. Owing to the impacts on residents, it is also something that can sometimes be difficult to achieve. However, it is clear that a balance needs to be found between the economic and social benefits of less traffic disruption and the environmental disadvantages of increased noise pollution for local residents generated by overnight or extended working. Greater use of extended and 24-hour working is something the Road Management Concordat is seeking to promote. 5.4 Lane rental However, in spite of the good progress to date, it is clear that a real step change is required to further reduce the delay and disruption caused by road works on London’s busiest streets. As part of the work TfL is undertaking to encourage works promoters to shorten durations or reduce traffic disruption, TfL is working with the Department for Transport to develop the necessary regulations and guidelines to develop a targeted ‘Lane Rental’ scheme to charge utilities and other works promoters who dig up the busiest roads at the busiest times.
‘We have become one of the most road work-afflicted nations in the world, ........ there is only one serious solution, and that is lane rental. The only way to make the road-excavators understand the full economic cost of their activities is to charge them for the time they spend digging up the road.’ Mayor of London, Boris Johnson, January 2010
The Mayor and TfL believe the introduction of a targeted lane rental scheme, providing a genuine financial incentive for works promoters to change behaviour, is the only practical way forward. This would see charges applied for the occupation of road space by works promoters at the busiest times, at the most congested locations on the network. It would apply to both utility and highways works and would significantly incentivise shorter durations and better working practices, minimising disruption.
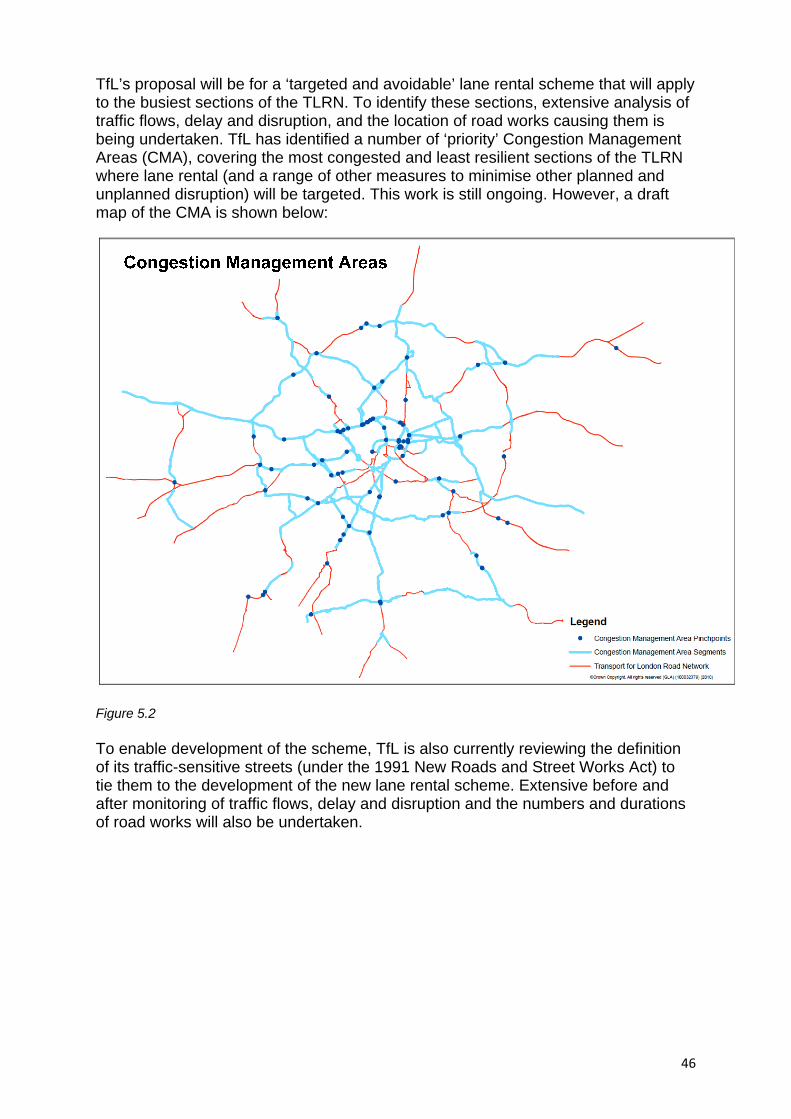
46
TfL’s proposal will be for a ‘targeted and avoidable’ lane rental scheme that will apply to the busiest sections of the TLRN. To identify these sections, extensive analysis of traffic flows, delay and disruption, and the location of road works causing them is being undertaken. TfL has identified a number of ‘priority’ Congestion Management Areas (CMA), covering the most congested and least resilient sections of the TLRN where lane rental (and a range of other measures to minimise other planned and unplanned disruption) will be targeted. This work is still ongoing. However, a draft map of the CMA is shown below:
Figure 5.2 To enable development of the scheme, TfL is also currently reviewing the definition of its traffic-sensitive streets (under the 1991 New Roads and Street Works Act) to tie them to the development of the new lane rental scheme. Extensive before and after monitoring of traffic flows, delay and disruption and the numbers and durations of road works will also be undertaken.
47
Chapter 6
Minimising disruption from unplanned events There will always be unplanned events and incidents on the road network – emergencies, road traffic collisions, breakdowns, road defects and burst water mains – which cannot be planned for in advance. As outlined in Chapter 3, such events and incidents are responsible for around 74 per cent of serious and severe traffic disruption on the road network as a whole. The effects of unplanned disruption can have a direct impact on the reliability of the network and in particular on the performance of the bus network. The figure below shows bus kilometres lost due to traffic delays and hours of serious and severe disruption on the road network. It demonstrates very clearly the potential traffic benefits of lower levels of unplanned disruption. This was highlighted in period 5 2010/11 when, for a variety of reasons, unplanned disruption was down 37 per cent on the same period last year. This coincided with the lowest lost mileage figures ever recorded on the bus network, clearly demonstrating the potential traffic benefits of lower levels of unplanned disruption. Further analysis of performance over the last two years has identified a strong correlation between these two metrics (see Figure 6.1 below).
0.0
50.0
100.0
150.0
200.0
250.0
300.0
350.0
0.00
0.50
1.00
1.50
2.00
2.50
3.00
3.50
01_09/10
02_09/10
03_09/10
04_09/10
05_09/10
06_09/10
07_09/10
08_09/10
09_09/10
10_09/10
11_09/10
12_09/10
13_09/10
01_10/11
02_10/11
03_10/11
04_10/11
05_10/11
06_10/11
07_10/11
08_10/11
09_10/11
10_10/11
11_10/11
12_10/11
13_10/11
Hours
%
Hours of serious and severe unplanned disruption (Londonwide) correlated with Percentage of bus
kilometeres lost due to traffic delays
Hours of serious and severe disruption caused by unplanned events (Londonwide)Bus kilometres lost due to traf f ic delays (as a percentage of scheduled)
Figure 6.1 Minimising the amount of this disruption can have a direct effect on the overall performance of the network. TfL’s approach identifies three specific strands of activity to achieve this:
• Identifying and eliminating potential causes of unplanned disruption to minimise their occurrence in the first place
• Minimising response and clear-up times when incidents do occur • Effectively managing traffic around such incidents to minimise the disruption
they cause
This chapter sets out the main actions and initiatives that London Streets will pursue in each of these areas.

48
6.1 Minimising the occurrence of unplanned events There are more than 10,000 unplanned events recorded and managed by the LSTCC every year in London – 28 events every day causing disruption to the travelling public. In improving response times and ensuring effective management of incidents when they occur, TfL has set a target to reduce the level of disruption caused by such events by five per cent. Through the LCAP, TfL is now able to analyse traffic journey time data (from ANPR camera monitoring) and relate it directly to information on incidents recorded in the LSTCC on a daily basis. This has enabled it to develop a detailed understanding of those parts of the network where unplanned incidents and events are likely to cause the greatest levels of disruption. A great deal of this disruption is concentrated on a relatively small number of key road links. As illustration, in 2009/10, 34 per cent of serious and severe disruption from unplanned events and incidents occurred on just four routes:
• A40 • A501/Marylebone Road/Euston Road section of the Inner Ring Road • A102 Blackwall Tunnel corridor • A406 North Circular
The outputs from this analysis have also fed into the development of the Congestion Management Areas being developed for the Lane Rental initiative described in Chapter 5. A range of initiatives and actions are being implemented aimed at minimising unplanned events at these locations. This involves developing a targeted approach to prioritising maintenance work and operational activity to, so far as possible, adopt a zero-tolerance approach to equipment/asset failures likely to result in traffic disruption. Examples include: Eliminating collapsed manhole covers (and other carriageway ironwork failures) through frequent inspection and regular preventative maintenance: While the volume of assets makes it impractical for highway authorities and utilities to adopt such an approach on a network-wide basis in the CMAs, and especially given the cost of the disruption caused, this is a realistic and reasonable aspiration. London Streets’ Roads Directorate and the major utilities signed up to the Mayor’s Code of Conduct are therefore already working towards this aspiration and TfL encourages London’s boroughs and other utility/service providers to do likewise for their own assets on the SRN.
49
Case study: Delay and disruption from manhole cover failure on the TLRN Over the last two years, almost 300 manhole covers on the TLRN have collapsed, each on average causing around 12 minutes of serious and severe and five hours of moderate disruption.
One incident on Monday, 11th October 2010, resulted in a westbound lane closure of the A40 Western Avenue between Greenford and Northolt for four hours disrupting around 9,000 motorists. Estimated average delays to motorists were around 32 minutes and the cost to London’s economy was valued at around £100,000 – £410 per minute for the four hours the incident was open. On a
working day the delay would have been considerably greater. Initiatives: Surface-level highway inspections will generally identify problems only in their latter stages when manholes are close to failure, leading to urgent or emergency repair works. As a result TfL’s contractors have carried out additional inspections and proactive repairs, including the use of high-performing materials in areas of high stress or the areas of the network prone to traffic disruption such as the A406, A40, A501 and A102. Thames Water and TfL also commenced a pilot in February 2011 to identify and remedy manhole defects along the entire length of the A40 Western Avenue. The initial survey involved establishing ownership of apparatus and ensuring covers were branded correctly. Immediate repairs were completed where necessary, and less urgent works programmed for the next programmed cyclic night time closure. It is proposed to implement this preventative and proactive collaborative approach in reducing disruption to other key strategic routes.
Reducing disruption from flooding: On the CMAs, TfL is also targeting drainage asset inventory work to enable it to prioritise work to reduce or eliminate flooding incidents likely to cause traffic disruption. Investigations are taking place at key locations identified in the flooding register as part of a proactive programme of investigations and remedial works. This includes drainage survey work undertaken prior to large-scale resurfacing projects.
50
A three-year programme of repairs to TfL drainage assets, such as pipe re-lining or renewal, has been developed to ensure pinch points on the network which are most prone to disruption through network incidents, such as flooding, are prioritised. In addition, inspections and maintenance of pump rooms has been programmed both to renew old assets which have reached the end of their useful life, and to provide improvements such as additional telemetry. A three-year programme for pump room inspection and renewal has been compiled and prioritised according to risk of asset failure and impact on network operation. As well as maintenance work, TfL’s contractors are also mobilised to respond proactively to any severe weather warnings with additional gully suckers and tankers strategically placed on the network when heavy rainfall is expected. TfL is also working with Thames Water to tackle capacity issues on their infrastructure which can compromise network operation, for example on the A41 Hendon Way where, during incidences of heavy rainfall, flooding occurs because of the insufficient capacity of the Thames Water storm and foul water sewers in the area. Reducing disruption from traffic signals failures at junctions on the CMAs: Although overall traffic signal availability (more than 98 per cent) is already very high in London, serious and severe disruption due to traffic signal control failures is significant. In 2010/11, this disruption is down by 27% from the previous year from 129 to 94 hours London wide and down by 9% from 82 to 75 hours on the TLRN. Case study: Consequences of a traffic signal failure at Hanger Lane (A40/A406)
On Saturday 6 March 2010, a power failure caused by works being undertaken by a third party on behalf of EDF Energy caused the loss of all signals at the Hanger Lane gyratory. The gyratory could not cope with the resulting unregulated flow of traffic which caused six hours of serious disruption. The economic cost of this delay has been estimated at £100,000.
Targeting maintenance and operational activity to achieve higher levels of availability on these key sections of the network has the potential to reduce this further. London Streets Traffic Directorate will therefore focus as near to 100 per cent operational availability of traffic signals in the CMAs as possible. Reducing disruption from vehicle breakdowns and over-height vehicle stoppages on the Blackwall Tunnel corridor: The A102 Blackwall Tunnel corridor provides a key strategic East London river crossing carrying in excess of 100,000 vehicles a day. The smooth operation of this corridor is of particular importance to the wider road network due to the lack of alternative river crossings in this part of London, and the consequent lack of resilience this causes. Two of the principal causes of disruption are temporary closures due to breakdowns and over-height vehicles trying to use the northbound tunnel in defiance of the numerous advance warning signs and height-detection equipment on the approach. In 2009/10, these accounted for more than 2,000 traffic stoppages at Blackwall Tunnel and 166 hours of tunnel closures.

51
It is estimated that the associated congestion cost London’s economy £7.64m. Furthermore, it is estimated that incidents on the Blackwall Tunnel corridor caused a cumulative loss of around 1,700 vehicles a day through the tunnels. Reducing the volume of this disruption is therefore a priority for London Streets.
52
Case study: Reducing over-height and vehicle breakdown delays at the Blackwall Tunnel Actions TfL is taking to reduce the number of incidents occurring in and around the tunnel include:
• Improving driver awareness of the incidents causing closures, both through media and roadside signage
• Improving over-height vehicle detection • Working with Vehicle and Operator
Services Agency (VOSA) and the Metropolitan Police to enhance enforcement measures
• Reviewing existing legislation and regulations to determine what existing powers TfL has to enforce road offences at Blackwall Tunnel and, where practical, seeking potential legislative change
• Additionally, a trial of dedicating Metropolitan Police Service (MPS) road response team resource to providing enhanced enforcement and traffic management at Blackwall tunnel is underway. The three month trial ran from February 2011 to 6 May 2011 to prevent overheight, overweight, breakdowns, increase enforcement and improve traffic flow.
Reducing Disruption from Road Traffic Collisions: TfL analyses collision and traffic disruption data to identify key points on the network where the occurrence of collisions causes significant traffic disruption, with a view to prioritising collision-prevention measures where appropriate. This is particularly the case in relation to fatal and serious injury collisions, where police incident investigations inevitably result in prolonged closures and considerable traffic disruption. Analysis of collisions on the TLRN shows that over the past two years (2008/09 and 2009/10), the A1 and A23 are prominent corridors consistently prone to disruption from collisions when considering disruption per event or per kilometre. Figure 6.2 below shows the average hours of disruption per collision for each corridor:
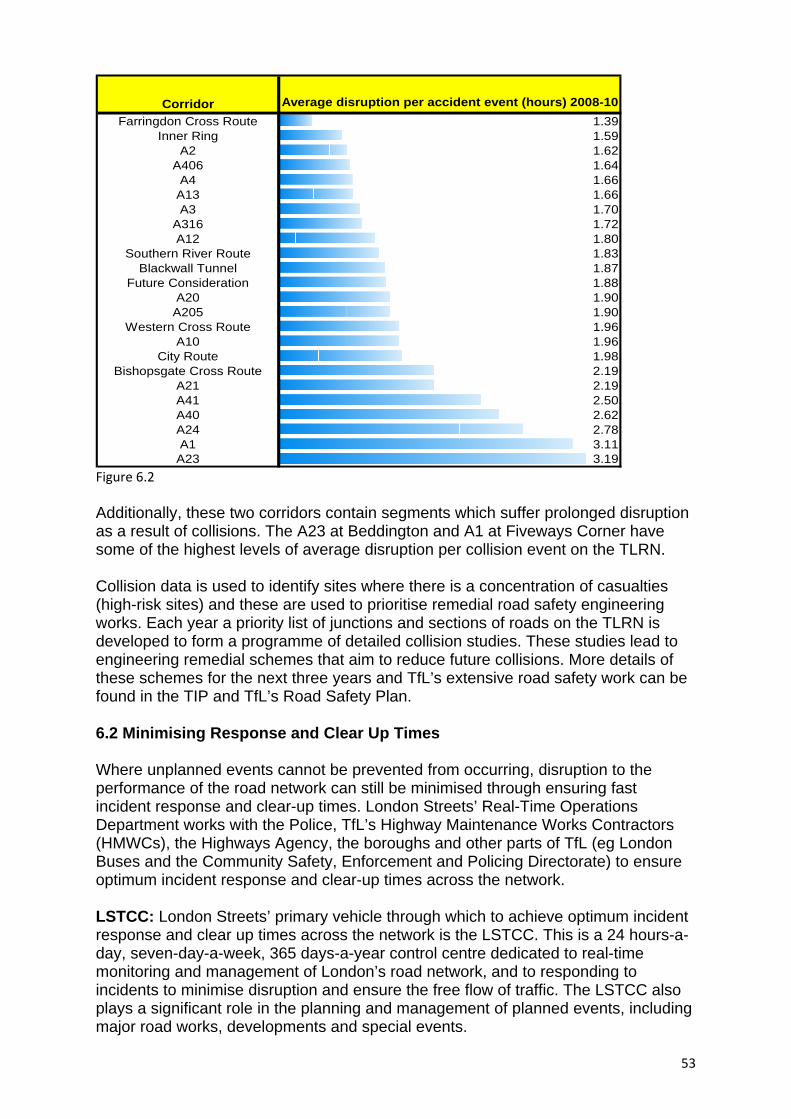
53
Corridor Average disruption per accident event (hours) 2008-10Farringdon Cross Route 1.39
Inner Ring 1.59A2 1.62
A406 1.64A4 1.66
A13 1.66A3 1.70
A316 1.72A12 1.80
Southern River Route 1.83Blackwall Tunnel 1.87
Future Consideration 1.88A20 1.90
A205 1.90Western Cross Route 1.96
A10 1.96City Route 1.98
Bishopsgate Cross Route 2.19A21 2.19A41 2.50A40 2.62A24 2.78A1 3.11
A23 3.19 Figure 6.2 Additionally, these two corridors contain segments which suffer prolonged disruption as a result of collisions. The A23 at Beddington and A1 at Fiveways Corner have some of the highest levels of average disruption per collision event on the TLRN. Collision data is used to identify sites where there is a concentration of casualties (high-risk sites) and these are used to prioritise remedial road safety engineering works. Each year a priority list of junctions and sections of roads on the TLRN is developed to form a programme of detailed collision studies. These studies lead to engineering remedial schemes that aim to reduce future collisions. More details of these schemes for the next three years and TfL’s extensive road safety work can be found in the TIP and TfL’s Road Safety Plan. 6.2 Minimising Response and Clear Up Times Where unplanned events cannot be prevented from occurring, disruption to the performance of the road network can still be minimised through ensuring fast incident response and clear-up times. London Streets’ Real-Time Operations Department works with the Police, TfL’s Highway Maintenance Works Contractors (HMWCs), the Highways Agency, the boroughs and other parts of TfL (eg London Buses and the Community Safety, Enforcement and Policing Directorate) to ensure optimum incident response and clear-up times across the network. LSTCC: London Streets’ primary vehicle through which to achieve optimum incident response and clear up times across the network is the LSTCC. This is a 24 hours-a-day, seven-day-a-week, 365 days-a-year control centre dedicated to real-time monitoring and management of London’s road network, and to responding to incidents to minimise disruption and ensure the free flow of traffic. The LSTCC also plays a significant role in the planning and management of planned events, including major road works, developments and special events.
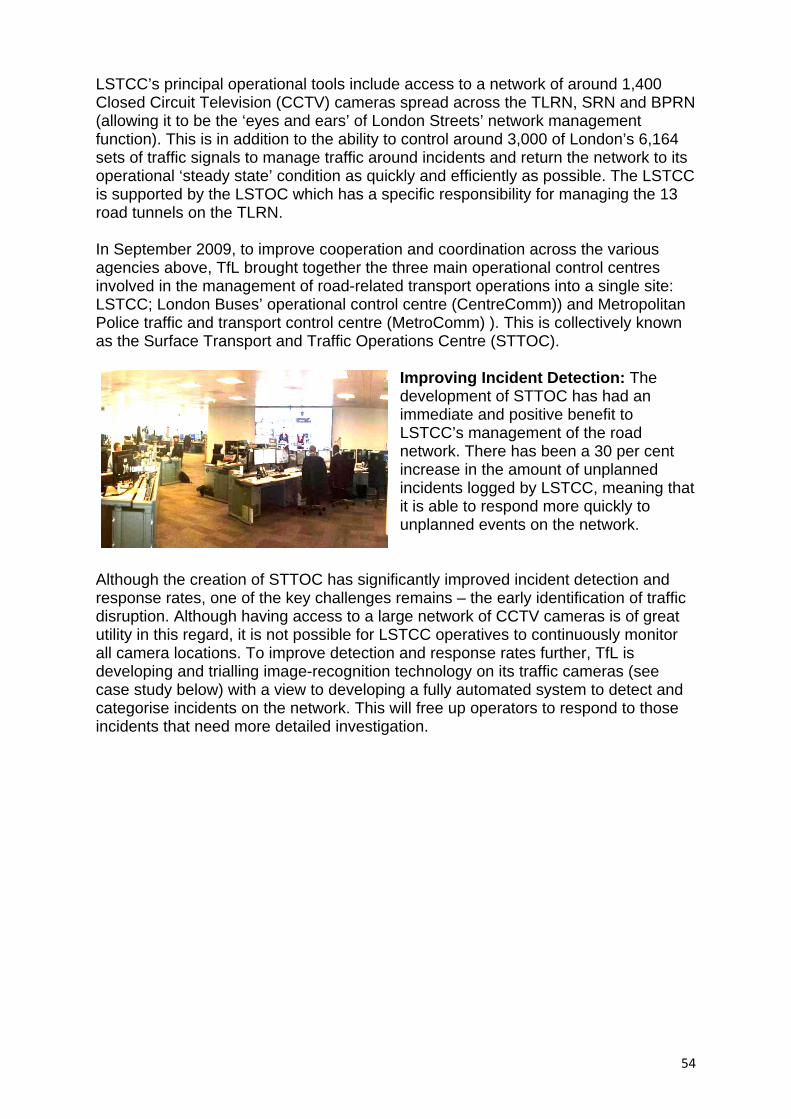
54
LSTCC’s principal operational tools include access to a network of around 1,400 Closed Circuit Television (CCTV) cameras spread across the TLRN, SRN and BPRN (allowing it to be the ‘eyes and ears’ of London Streets’ network management function). This is in addition to the ability to control around 3,000 of London’s 6,164 sets of traffic signals to manage traffic around incidents and return the network to its operational ‘steady state’ condition as quickly and efficiently as possible. The LSTCC is supported by the LSTOC which has a specific responsibility for managing the 13 road tunnels on the TLRN. In September 2009, to improve cooperation and coordination across the various agencies above, TfL brought together the three main operational control centres involved in the management of road-related transport operations into a single site: LSTCC; London Buses’ operational control centre (CentreComm)) and Metropolitan Police traffic and transport control centre (MetroComm) ). This is collectively known as the Surface Transport and Traffic Operations Centre (STTOC).
Improving Incident Detection: The development of STTOC has had an immediate and positive benefit to LSTCC’s management of the road network. There has been a 30 per cent increase in the amount of unplanned incidents logged by LSTCC, meaning that it is able to respond more quickly to unplanned events on the network.
Although the creation of STTOC has significantly improved incident detection and response rates, one of the key challenges remains – the early identification of traffic disruption. Although having access to a large network of CCTV cameras is of great utility in this regard, it is not possible for LSTCC operatives to continuously monitor all camera locations. To improve detection and response rates further, TfL is developing and trialling image-recognition technology on its traffic cameras (see case study below) with a view to developing a fully automated system to detect and categorise incidents on the network. This will free up operators to respond to those incidents that need more detailed investigation.
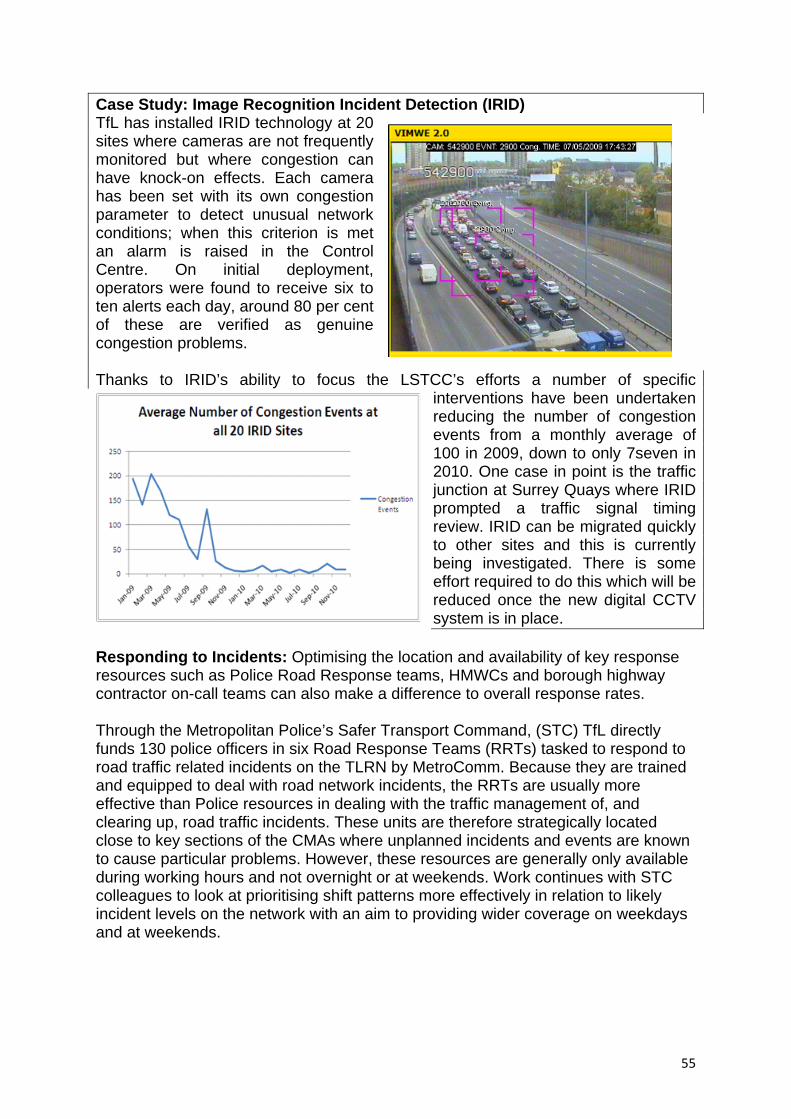
55
Case Study: Image Recognition Incident Detection (IRID) TfL has installed IRID technology at 20 sites where cameras are not frequently monitored but where congestion can have knock-on effects. Each camera has been set with its own congestion parameter to detect unusual network conditions; when this criterion is met an alarm is raised in the Control Centre. On initial deployment, operators were found to receive six to ten alerts each day, around 80 per cent of these are verified as genuine congestion problems. Thanks to IRID’s ability to focus the LSTCC’s efforts a number of specific
interventions have been undertaken reducing the number of congestion events from a monthly average of 100 in 2009, down to only 7seven in 2010. One case in point is the traffic junction at Surrey Quays where IRID prompted a traffic signal timing review. IRID can be migrated quickly to other sites and this is currently being investigated. There is some effort required to do this which will be reduced once the new digital CCTV system is in place.
Responding to Incidents: Optimising the location and availability of key response resources such as Police Road Response teams, HMWCs and borough highway contractor on-call teams can also make a difference to overall response rates. Through the Metropolitan Police’s Safer Transport Command, (STC) TfL directly funds 130 police officers in six Road Response Teams (RRTs) tasked to respond to road traffic related incidents on the TLRN by MetroComm. Because they are trained and equipped to deal with road network incidents, the RRTs are usually more effective than Police resources in dealing with the traffic management of, and clearing up, road traffic incidents. These units are therefore strategically located close to key sections of the CMAs where unplanned incidents and events are known to cause particular problems. However, these resources are generally only available during working hours and not overnight or at weekends. Work continues with STC colleagues to look at prioritising shift patterns more effectively in relation to likely incident levels on the network with an aim to providing wider coverage on weekdays and at weekends.
56
Each of TfL’s three HMWCs also operates local operational control rooms and maintain 24/7 incident response capabilities to ensure rapid availability and deployment of traffic management and road repair resources for incidents on the TLRN. London Boroughs’ do likewise for the SRN and local roads in their areas, as do major utility companies in relation to emergencies such as gas leaks and burst water mains. The major motoring organisations and others also maintain considerable response capability to deal with vehicle breakdowns. Improving Incident Clear-up Times: Once deployed to respond to a traffic incident, effective joint working between the various resources on site is also key to minimising disruption for motorists and other traffic. In any situation the nature of the response required is dictated by the nature of the incident and the location. TfL is working with private breakdown response services, to understand how response units can be expedited to arrive at the scene quicker to remove broken-down vehicles causing congestion. Analysis is being undertaken on ways to rapidly identify vehicles attending breakdowns causing delays in ‘congestion management areas’ and the best way to expedite their movements to ensure that disruption is minimised. As outlined in Chapter 3, road traffic collisions make up around 30 per cent of all delay and disruption recorded on London’s roads. The swift and effective management of such incidents can therefore make a significant difference to the efficient operation of the network. Although LSTCC and TfL’s HMWCs often provide physical on-site and remote traffic management support, this is the prime responsibility of the Police. The management of such incidents, particularly where injuries or fatalities are involved, requires both considerable sensitivity and the careful balancing of road traffic demands with other considerations, such as emergency medical response and police collision investigations to satisfy Coroner officer-requirements. In meeting these requirements, the Police have been receptive to the need to re-open roads quickly following collision investigations, and work continues to seek opportunities for collective process and operational improvements. TfL has recently signed a protocol with the MPS committing the expeditious re-opening of the roads after a collision. Community Safety, Enforcement and Policing (CSEP) have agreed with the MPS the procurement of laser scanning cameras to reduce the time taken to survey the scene at fatal/life-changing accidents. In acknowledgement of this, the MPS have agreed to a KPI of 10per cent annual reduction in serious/severe disruption caused by relevant collision accident investigations. TfL is also working with the Police to improve the responsiveness to breakdowns at critical locations. Benefits have already been realised due to the flexible approach from STC in removing vehicles from the road whilst they await formal recovery, good use is also made of London Buses’ breakdown recovery service where this can be used without impacting on bus operations. Work in this area will progress along the lines of enhancing vehicle removal services provided by the Police and investigating the feasibility of a priority service on identified corridor routes.
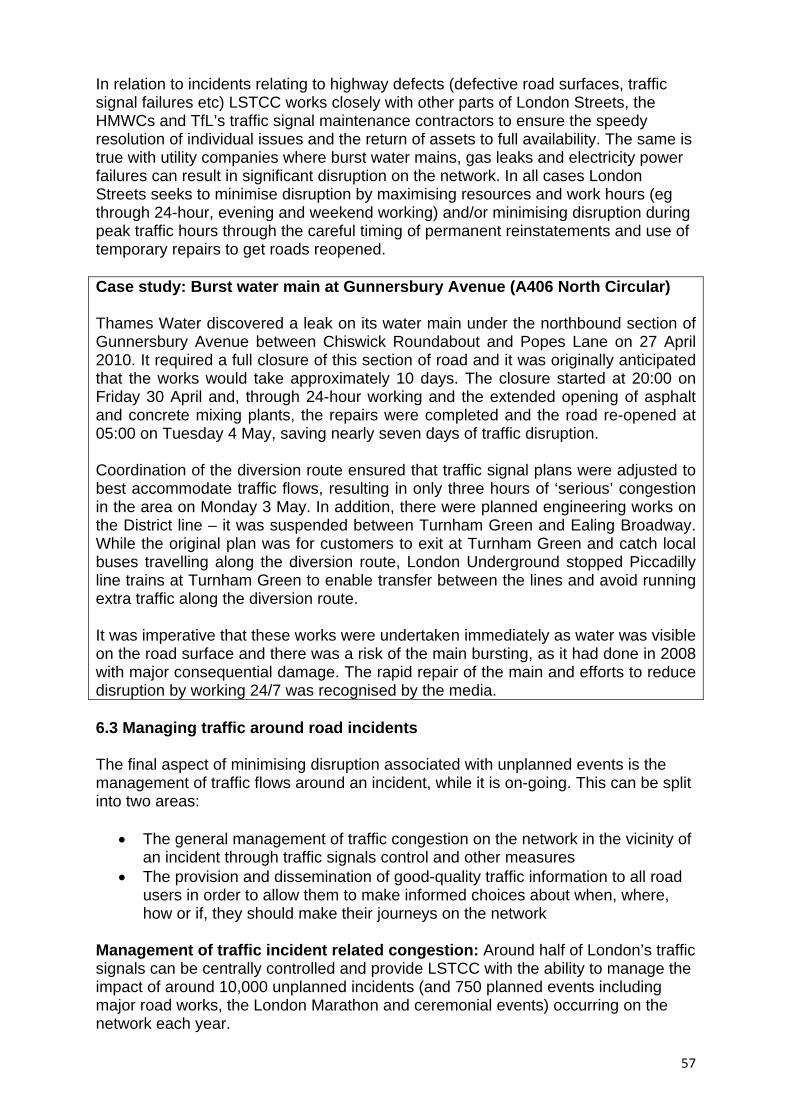
57
In relation to incidents relating to highway defects (defective road surfaces, traffic signal failures etc) LSTCC works closely with other parts of London Streets, the HMWCs and TfL’s traffic signal maintenance contractors to ensure the speedy resolution of individual issues and the return of assets to full availability. The same is true with utility companies where burst water mains, gas leaks and electricity power failures can result in significant disruption on the network. In all cases London Streets seeks to minimise disruption by maximising resources and work hours (eg through 24-hour, evening and weekend working) and/or minimising disruption during peak traffic hours through the careful timing of permanent reinstatements and use of temporary repairs to get roads reopened. Case study: Burst water main at Gunnersbury Avenue (A406 North Circular) Thames Water discovered a leak on its water main under the northbound section of Gunnersbury Avenue between Chiswick Roundabout and Popes Lane on 27 April 2010. It required a full closure of this section of road and it was originally anticipated that the works would take approximately 10 days. The closure started at 20:00 on Friday 30 April and, through 24-hour working and the extended opening of asphalt and concrete mixing plants, the repairs were completed and the road re-opened at 05:00 on Tuesday 4 May, saving nearly seven days of traffic disruption. Coordination of the diversion route ensured that traffic signal plans were adjusted to best accommodate traffic flows, resulting in only three hours of ‘serious’ congestion in the area on Monday 3 May. In addition, there were planned engineering works on the District line – it was suspended between Turnham Green and Ealing Broadway. While the original plan was for customers to exit at Turnham Green and catch local buses travelling along the diversion route, London Underground stopped Piccadilly line trains at Turnham Green to enable transfer between the lines and avoid running extra traffic along the diversion route. It was imperative that these works were undertaken immediately as water was visible on the road surface and there was a risk of the main bursting, as it had done in 2008 with major consequential damage. The rapid repair of the main and efforts to reduce disruption by working 24/7 was recognised by the media. 6.3 Managing traffic around road incidents The final aspect of minimising disruption associated with unplanned events is the management of traffic flows around an incident, while it is on-going. This can be split into two areas:
• The general management of traffic congestion on the network in the vicinity of an incident through traffic signals control and other measures
• The provision and dissemination of good-quality traffic information to all road users in order to allow them to make informed choices about when, where, how or if, they should make their journeys on the network
Management of traffic incident related congestion: Around half of London’s traffic signals can be centrally controlled and provide LSTCC with the ability to manage the impact of around 10,000 unplanned incidents (and 750 planned events including major road works, the London Marathon and ceremonial events) occurring on the network each year.
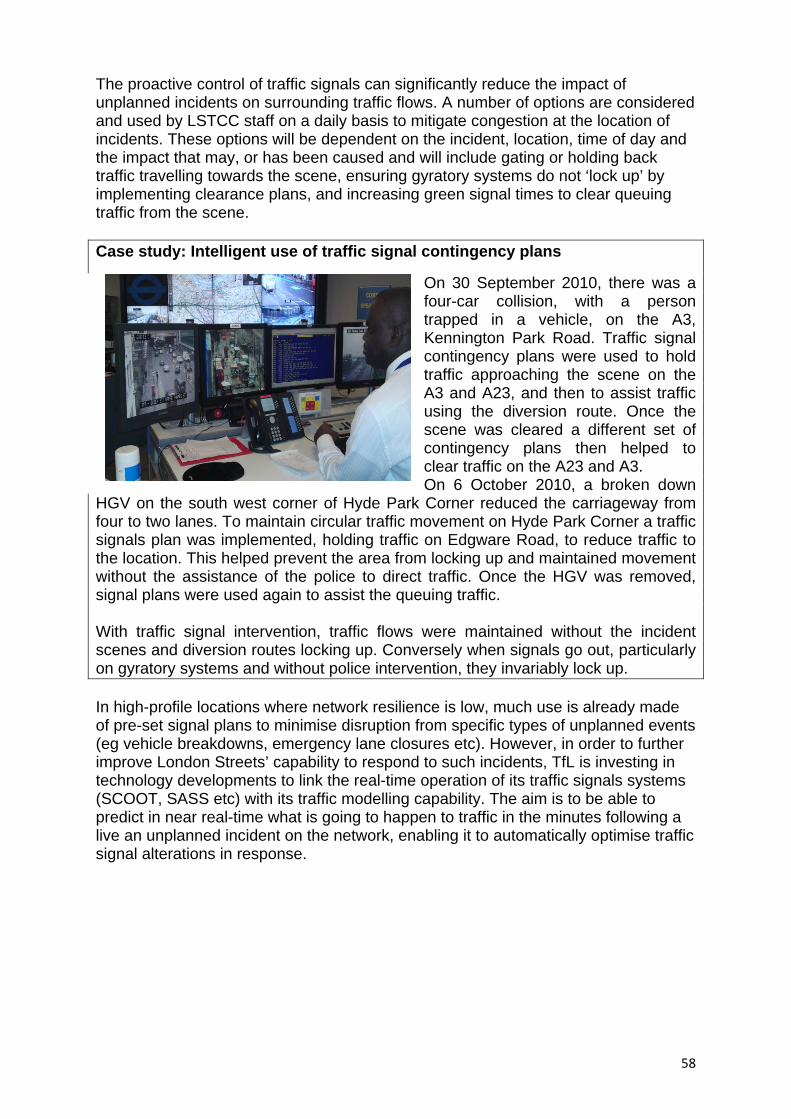
58
The proactive control of traffic signals can significantly reduce the impact of unplanned incidents on surrounding traffic flows. A number of options are considered and used by LSTCC staff on a daily basis to mitigate congestion at the location of incidents. These options will be dependent on the incident, location, time of day and the impact that may, or has been caused and will include gating or holding back traffic travelling towards the scene, ensuring gyratory systems do not ‘lock up’ by implementing clearance plans, and increasing green signal times to clear queuing traffic from the scene. Case study: Intelligent use of traffic signal contingency plans
On 30 September 2010, there was a four-car collision, with a person trapped in a vehicle, on the A3, Kennington Park Road. Traffic signal contingency plans were used to hold traffic approaching the scene on the A3 and A23, and then to assist traffic using the diversion route. Once the scene was cleared a different set of contingency plans then helped to clear traffic on the A23 and A3. On 6 October 2010, a broken down
HGV on the south west corner of Hyde Park Corner reduced the carriageway from four to two lanes. To maintain circular traffic movement on Hyde Park Corner a traffic signals plan was implemented, holding traffic on Edgware Road, to reduce traffic to the location. This helped prevent the area from locking up and maintained movement without the assistance of the police to direct traffic. Once the HGV was removed, signal plans were used again to assist the queuing traffic. With traffic signal intervention, traffic flows were maintained without the incident scenes and diversion routes locking up. Conversely when signals go out, particularly on gyratory systems and without police intervention, they invariably lock up. In high-profile locations where network resilience is low, much use is already made of pre-set signal plans to minimise disruption from specific types of unplanned events (eg vehicle breakdowns, emergency lane closures etc). However, in order to further improve London Streets’ capability to respond to such incidents, TfL is investing in technology developments to link the real-time operation of its traffic signals systems (SCOOT, SASS etc) with its traffic modelling capability. The aim is to be able to predict in near real-time what is going to happen to traffic in the minutes following a live an unplanned incident on the network, enabling it to automatically optimise traffic signal alterations in response.
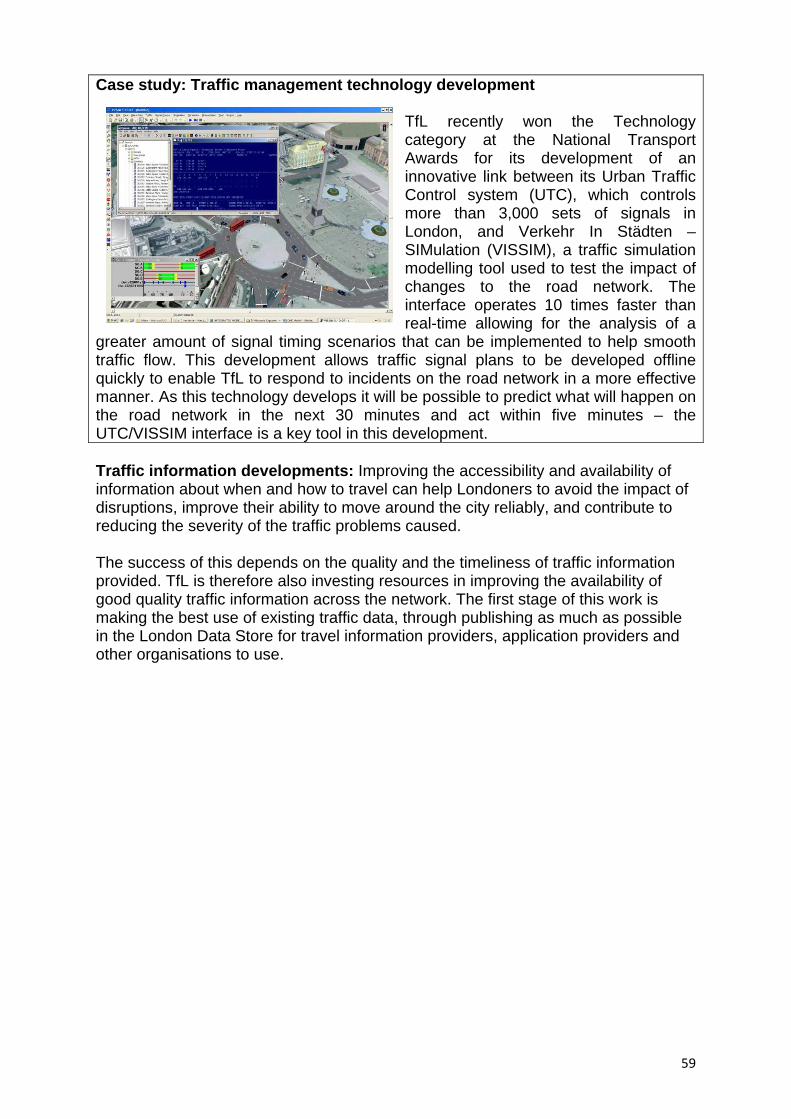
59
Case study: Traffic management technology development TfL recently won the Technology category at the National Transport Awards for its development of an innovative link between its Urban Traffic Control system (UTC), which controls more than 3,000 sets of signals in London, and Verkehr In Städten – SIMulation (VISSIM), a traffic simulation modelling tool used to test the impact of changes to the road network. The interface operates 10 times faster than real-time allowing for the analysis of a
greater amount of signal timing scenarios that can be implemented to help smooth traffic flow. This development allows traffic signal plans to be developed offline quickly to enable TfL to respond to incidents on the road network in a more effective manner. As this technology develops it will be possible to predict what will happen on the road network in the next 30 minutes and act within five minutes – the UTC/VISSIM interface is a key tool in this development. Traffic information developments: Improving the accessibility and availability of information about when and how to travel can help Londoners to avoid the impact of disruptions, improve their ability to move around the city reliably, and contribute to reducing the severity of the traffic problems caused. The success of this depends on the quality and the timeliness of traffic information provided. TfL is therefore also investing resources in improving the availability of good quality traffic information across the network. The first stage of this work is making the best use of existing traffic data, through publishing as much as possible in the London Data Store for travel information providers, application providers and other organisations to use.
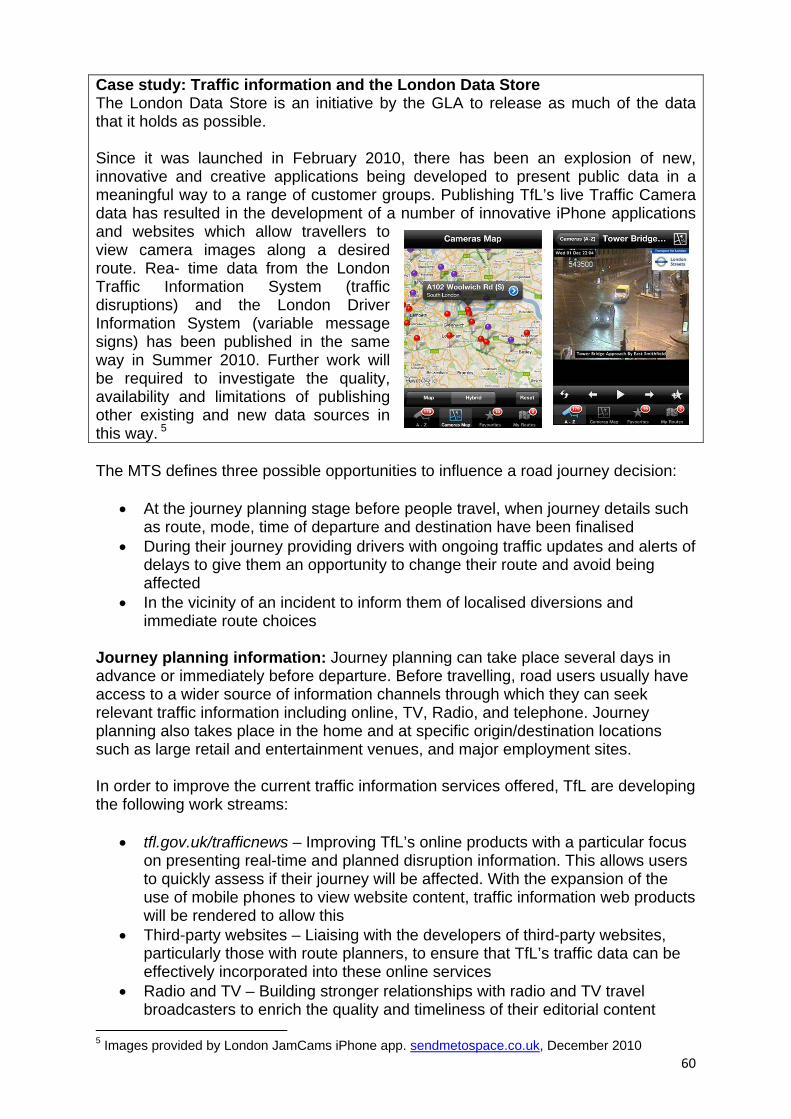
60
Case study: Traffic information and the London Data Store The London Data Store is an initiative by the GLA to release as much of the data that it holds as possible. Since it was launched in February 2010, there has been an explosion of new, innovative and creative applications being developed to present public data in a meaningful way to a range of customer groups. Publishing TfL’s live Traffic Camera data has resulted in the development of a number of innovative iPhone applications and websites which allow travellers to view camera images along a desired route. Rea- time data from the London Traffic Information System (traffic disruptions) and the London Driver Information System (variable message signs) has been published in the same way in Summer 2010. Further work will be required to investigate the quality, availability and limitations of publishing other existing and new data sources in this way. 5 The MTS defines three possible opportunities to influence a road journey decision:
• At the journey planning stage before people travel, when journey details such as route, mode, time of departure and destination have been finalised
• During their journey providing drivers with ongoing traffic updates and alerts of delays to give them an opportunity to change their route and avoid being affected
• In the vicinity of an incident to inform them of localised diversions and immediate route choices
Journey planning information: Journey planning can take place several days in advance or immediately before departure. Before travelling, road users usually have access to a wider source of information channels through which they can seek relevant traffic information including online, TV, Radio, and telephone. Journey planning also takes place in the home and at specific origin/destination locations such as large retail and entertainment venues, and major employment sites. In order to improve the current traffic information services offered, TfL are developing the following work streams:
• tfl.gov.uk/trafficnews – Improving TfL’s online products with a particular focus on presenting real-time and planned disruption information. This allows users to quickly assess if their journey will be affected. With the expansion of the use of mobile phones to view website content, traffic information web products will be rendered to allow this
• Third-party websites – Liaising with the developers of third-party websites, particularly those with route planners, to ensure that TfL’s traffic data can be effectively incorporated into these online services
• Radio and TV – Building stronger relationships with radio and TV travel broadcasters to enrich the quality and timeliness of their editorial content
5 Images provided by London JamCams iPhone app. sendmetospace.co.uk, December 2010
61
• Traffic Radio – Specifically in relation to Traffic Radio (TfL and the Highways Agency’s joint digital traffic information station) maximising the benefit of TfL’s current partnership with the Highways Agency, including placing a broadcaster in the LSTCC
• Short Message Service (SMS) text alert– Investigating the feasibility of an SMS text alert service, mirroring the service provided for tube commuters, which would provide timed updates on disruption along pre-selected road corridors, aimed at providing an alert before a journey starts
• Key London locations – Working collaboratively with management teams of large London retail sites, entertainment and sporting venues, major employers and car park providers to improve the on-site provision of traffic information to visitors
In-journey information: Road users have a more limited range of traffic information channels. Once the journey is under way, these include in-car radio, satellite navigation systems and mobile devices. Traffic information is provided by a range of third parties through these channels. In order to improve the current traffic information services offered by TfL for in-journey information, the following are being proposed:
• Radio – Building stronger relationships with radio broadcasters improving the quality and timeliness of traffic information content, directly benefitting road users who rely on radio traffic news in-journey
• Satellite Navigation real time data – Releasing TfL’s traffic data as real-time feeds offers the opportunity for providers of Satellite Navigation systems and real-time data feeds to incorporate the London data automatically into their systems. This reduces latency (currently created by manual re-entering of data) and increases the number of London disruptions included in real-time services. Collaboration with commercial suppliers of satellite navigation services and information is required to ensure that TfL data meets the necessary standards and quality to be effectively used.
• Mobile applications – The release of real-time traffic data feeds for use by commercial organisations has the potential to stimulate the market for the development of mobile applications through which London traffic information can be accessed (TfL does not support the use of mobile phones whilst driving, however it is acknowledged that mobile devices are becoming more relied upon to seek real-time information, particularly by non-driving companions or when stopped).
Providing Information in the Vicinity of an Incident: TfL has 143 Electronic Variable Message Signs (VMS) which are its main tool to alert drivers to disruption ahead in the immediate vicinity of an incident. A further 236 VMS signs are used through the East London Traffic Control System (ELTRACS) the majority of which are to manage closures of the TLRN tunnels and some areas of the open network. However, there are other facilities which could potentially also offer a source of location-specific traffic information. In order to improve these services, the following will be considered:
• Road-side service stations -– Feasibility work is proposed to investigate how geographically relevant traffic information can be shared with road users through the digital equipment that exists in many road-side service stations, including petrol stations and cafes

62
• Road-side to vehicle communications – as part of the research and development work being done on next-generation intelligent transport systems, consideration will be given to the feasibility of transmitting location-specific information from TfL’s road-side equipment into vehicle systems
63
Chapter 7
Managing demand and achieving modal shift The MTS highlights a range of activities being undertaken by TfL to manage travel demand for people and goods by a combination of promoting better transport user information, modal shift towards more sustainable modes and/or reducing the need to travel. These include:
• A range of proposals to support walking including public realm initiatives and information improvements such as Legible London
• A number of major projects to promote cycling, including Barclays Cycle Superhighways and Barclays Cycle Hire, in central London
• Maintaining and improving bus reliability and providing better public transport information
• Promoting smarter travel with businesses, educational establishments and other generators of movement, including through reducing the need to travel, better information to highlight the best mode for the trip and health benefits
• Freight-related modal shift initiatives While growth in the overall average London-wide traffic levels is expected to be low, there will be variations between sub-regions and corridors reflecting for example the higher levels of population and employment growth in inner and east London than in other areas. However, these more strategic measures are not the focus of this document, which concentrates on the range of more locally targeted measures that can be applied at specific locations on the road network (eg the CMAs) to provide localised traffic demand relief to improve reliability and/or network resilience. TfL’s approach to these more tactical elements of travel demand management work is focused on:
• Key corridors of high demand (eg the CMAs) • Key traffic pinch points, valves and hotspots on the TLRN and SRN
7.1 Managing demand corridors This aspect of the strategy is concerned with the management of demand for ‘longitudinal’ traffic flows along key corridors and, in particular, on the CMAs identified in Chapter 5. Understanding the relationship between corridor demand and network capacity is not straightforward on a complex urban road network. However, through knowledge of traffic saturation levels at individual (signalised) junctions along the length of a corridor, an appreciation can be developed of overall levels of saturation relative to capacity. Defining corridor-related Travel Demand Management (TDM) priorities: Through its programme of signal timing reviews and SCOOT development, TfL is attempting to maintain traffic saturation at all arms of major junctions at or below 80 per cent – above this level, experience demonstrates that, the efficient performance of the junction (and therefore the network more generally) begins to fall away rapidly.
64
By analysing the traffic saturation performance of all junctions on a particular corridor, the 23 routes that make up the TLRN London-wide corridors can be ranked in order of journey time reliability. In addition to identifying the most traffic-saturated elements of the network, defining corridor-related priorities for TDM activity also requires some consideration of where the best opportunities are to promote alternative modes of travel. These will vary across the network with different modal shift opportunities being available on different corridors. For example on the A24 corridor, parallel Barclays Cycle Superhighway and tube promotional opportunities exist. The A23 corridor does not have these opportunities but does have a parallel national rail route from Croydon into central London. However, the development of an effective, targeted TDM strategy also needs to take account of the nature and purpose of trip-making on the corridor. The MTS highlights significant differences between London-wide, sub-regional and local trip making across London, in terms of modal splits and journey purpose (see Appendix 6 for figure 4 of the MTS document). It should also be recognised that on many parts of the London-wide TLRN corridors much of the trips are relatively short so opportunities may also exist for modal shift to more local forms of sustainable transport (walking, cycling and bus use etc). This is particularly true where the SRN also acts as a local high street. In the above example, there would be little point in looking to the South Central national rail service into London if the majority of trip making is relatively local. Defining suitable TDM opportunities therefore also need to take account of actual trip making patterns and journey purposes on different corridors. Goods movements, with vehicles stopping to make deliveries on the kerbside, are vital for local businesses and residents, and compliance of the regulations by freight operators is vital. Managing Kerbside demand is being met through the use of Delivery and Servicing Plans (DSPs) rolled out on cycle superhighways and TfL Barclays Cycle Superhighway’s work with operators through the Freight Operator Recognition Scheme (FORS) to promote compliance and reduce disruption, particularly in peak periods. Future network developments may also dictate priorities, for example road-related improvements like those at Bounds Green on the A406 North Circular or the development of new sustainable transport alternatives such as the development of further Superhighway routes. Sub-regional corridor-based TDM: TfL is keen to work jointly with the boroughs to develop a similar approach to TDM development and prioritisation on the SRN sub-regional corridors.
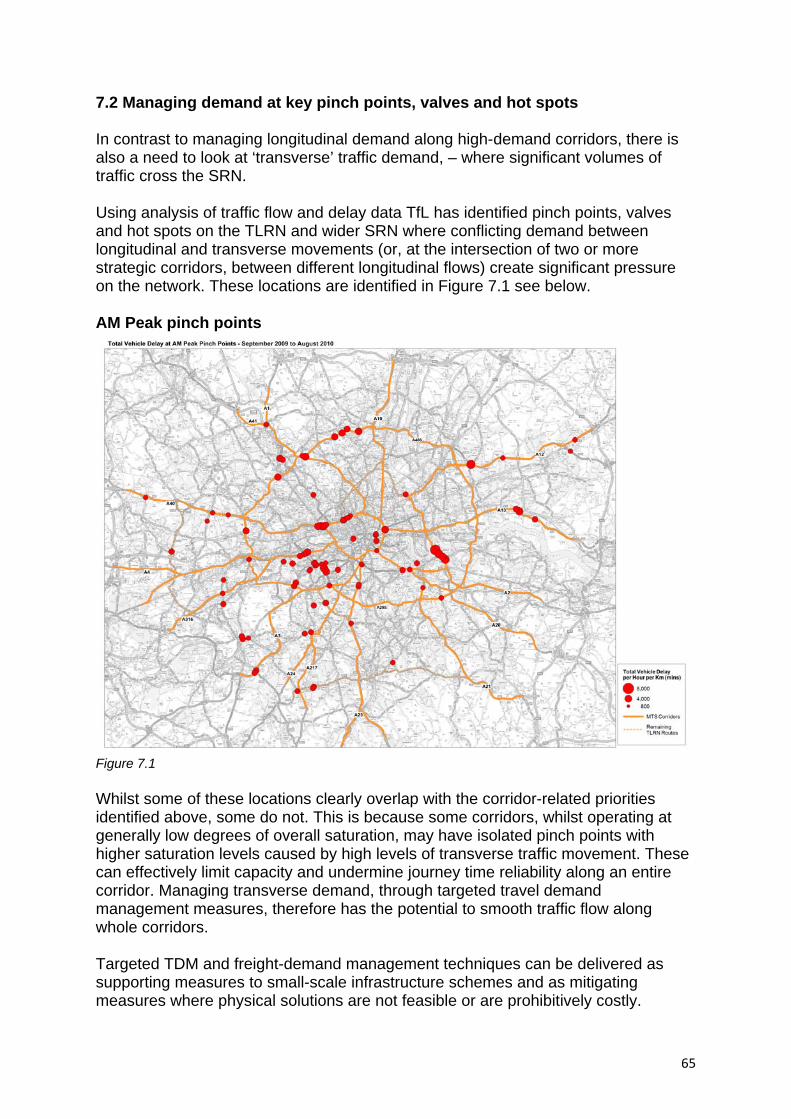
65
7.2 Managing demand at key pinch points, valves and hot spots In contrast to managing longitudinal demand along high-demand corridors, there is also a need to look at ‘transverse’ traffic demand, – where significant volumes of traffic cross the SRN. Using analysis of traffic flow and delay data TfL has identified pinch points, valves and hot spots on the TLRN and wider SRN where conflicting demand between longitudinal and transverse movements (or, at the intersection of two or more strategic corridors, between different longitudinal flows) create significant pressure on the network. These locations are identified in Figure 7.1 see below. AM Peak pinch points
Figure 7.1 Whilst some of these locations clearly overlap with the corridor-related priorities identified above, some do not. This is because some corridors, whilst operating at generally low degrees of overall saturation, may have isolated pinch points with higher saturation levels caused by high levels of transverse traffic movement. These can effectively limit capacity and undermine journey time reliability along an entire corridor. Managing transverse demand, through targeted travel demand management measures, therefore has the potential to smooth traffic flow along whole corridors. Targeted TDM and freight-demand management techniques can be delivered as supporting measures to small-scale infrastructure schemes and as mitigating measures where physical solutions are not feasible or are prohibitively costly.
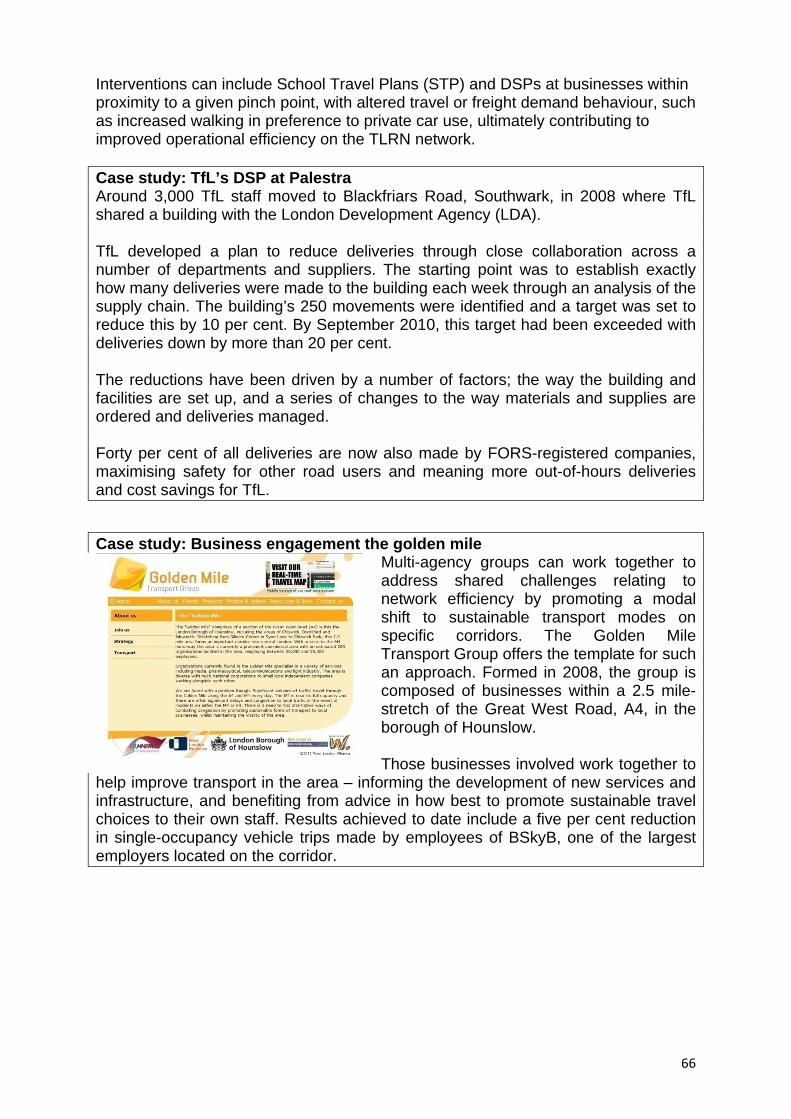
66
Interventions can include School Travel Plans (STP) and DSPs at businesses within proximity to a given pinch point, with altered travel or freight demand behaviour, such as increased walking in preference to private car use, ultimately contributing to improved operational efficiency on the TLRN network.
Case study: TfL’s DSP at Palestra Around 3,000 TfL staff moved to Blackfriars Road, Southwark, in 2008 where TfL shared a building with the London Development Agency (LDA). TfL developed a plan to reduce deliveries through close collaboration across a number of departments and suppliers. The starting point was to establish exactly how many deliveries were made to the building each week through an analysis of the supply chain. The building’s 250 movements were identified and a target was set to reduce this by 10 per cent. By September 2010, this target had been exceeded with deliveries down by more than 20 per cent. The reductions have been driven by a number of factors; the way the building and facilities are set up, and a series of changes to the way materials and supplies are ordered and deliveries managed. Forty per cent of all deliveries are now also made by FORS-registered companies, maximising safety for other road users and meaning more out-of-hours deliveries and cost savings for TfL.
Case study: Business engagement the golden mile Multi-agency groups can work together to address shared challenges relating to network efficiency by promoting a modal shift to sustainable transport modes on specific corridors. The Golden Mile Transport Group offers the template for such an approach. Formed in 2008, the group is composed of businesses within a 2.5 mile-stretch of the Great West Road, A4, in the borough of Hounslow. Those businesses involved work together to
help improve transport in the area – informing the development of new services and infrastructure, and benefiting from advice in how best to promote sustainable travel choices to their own staff. Results achieved to date include a five per cent reduction in single-occupancy vehicle trips made by employees of BSkyB, one of the largest employers located on the corridor.

67
Case study: Encouraging school travel mode shift Over the past five years, all schools in London have been encouraged to deliver a STP to target pupil and staff trips to and from schools. The aims of the programme are to: • Significantly reduce the number of cars travelling to and from schools • Remove the barriers, both perceived and actual, to walking, cycling and taking
public transport to school • Increase the number of young people and adults choosing active travel over travel
by car • Increase understanding among school
communities of the travel options available to them
• Provide information to help school communities understand the benefits of active, sustainable transport and positively influence their travel choices
The TfL schools team has delivered this programme in conjunction with the boroughs and School Travel Advisors (STAs). The programme includes support materials, advice and schemes to encourage modal shift. More than 90 per cent of London schools now have a travel plan and results from monitoring show an average 6.5 per cent reduction in the number of car journeys to schools. 7.3 The role of buses and bus priority measures London’s buses have undergone significant growth over the past decade as a result of a wide range of measures aimed at: improving journey times and reliability; upgrading vehicles, infrastructure and information systems; improving safety, security and accessibility; and consequently improving customer satisfaction. As a result the Capital’s buses now carry 2.2 billion passengers a year, the highest level since 1967. This represents 20 per cent of the daily modal share of journeys in London – double the share of the Underground. Buses are not only an important part of the Capital’s transport system but also a very efficient means of moving people around the road network thereby addressing areas of high travel demand, especially in areas where alternative forms of public transport are scarce. The performance of buses is closely linked with, and reliant upon, the operational performance of the road network on which they run. This tends to coincide with the main strategic roads and corridors. Buses are a key consideration in the operation of the network and their people-carrying ability has led to the development and implementation of ‘bus priority’ measures. These measures help to reduce bus journey times, improve reliability and increase the efficiency of the bus network, especially when considered as part of a ‘whole route’ approach. Bus priority measures are systematically identified, appraised and delivered at key locations including town centres and their approaches, at new development sites, and links where bus passengers represent a significant proportion of all road users.

68
Typical bus priority measures include bus-only roads, bus lanes and selective vehicle detection at traffic signals. These are some of the essential tools needed to ensure the limited people-carrying capacity of the road network is being used most effectively. On London’s SRN (including the TLRN) a significant amount of bus-priority infrastructure is already in place and delivering daily benefits. The challenge going forward will be to maintain, and in targeted locations improve, bus reliability whilst recognising the need to balance other considerations and objectives on the network such as safety, walking, cycling, freight servicing and smoothing general traffic flow. Case Study – A23 Brighton Road SCOOT Bus Priority Scheme
TfL have progressed several bus priority schemes on the TLRN that as well as assisting the movement of buses and their passengers, have also benefited other traffic. A recent example is the conversion of three signalised junctions on the A23 Brighton Road corridor in LB Croydon from Vehicle Actuated (VA) to SCOOT UTC, completed in the summer of 2010. iBus data for Route 60 has indicated a reduction in average bus journey times on weekdays between bus stops of 72 seconds northbound
and 30 seconds southbound during the AM peak, with associated journey time benefits to general traffic. (Photo of one of the sites, 20/002 Brighton Road/Old Lodge Lane)
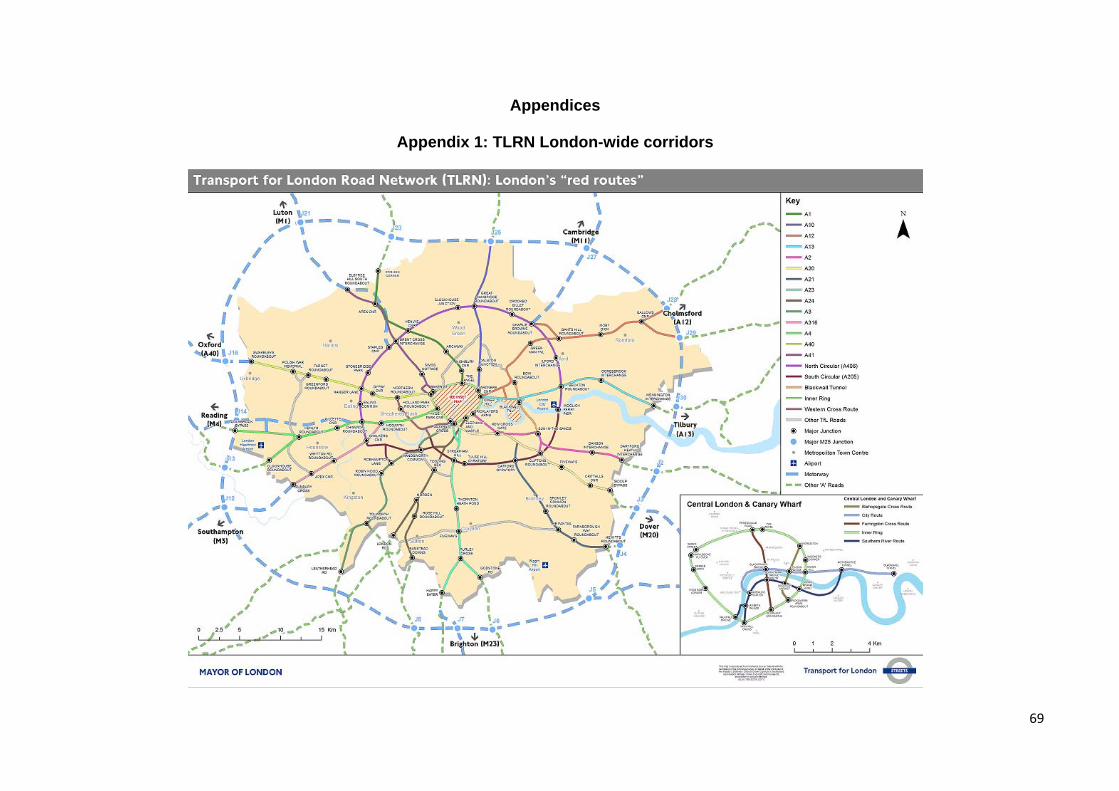
69
Appendices
Appendix 1: TLRN London-wide corridors
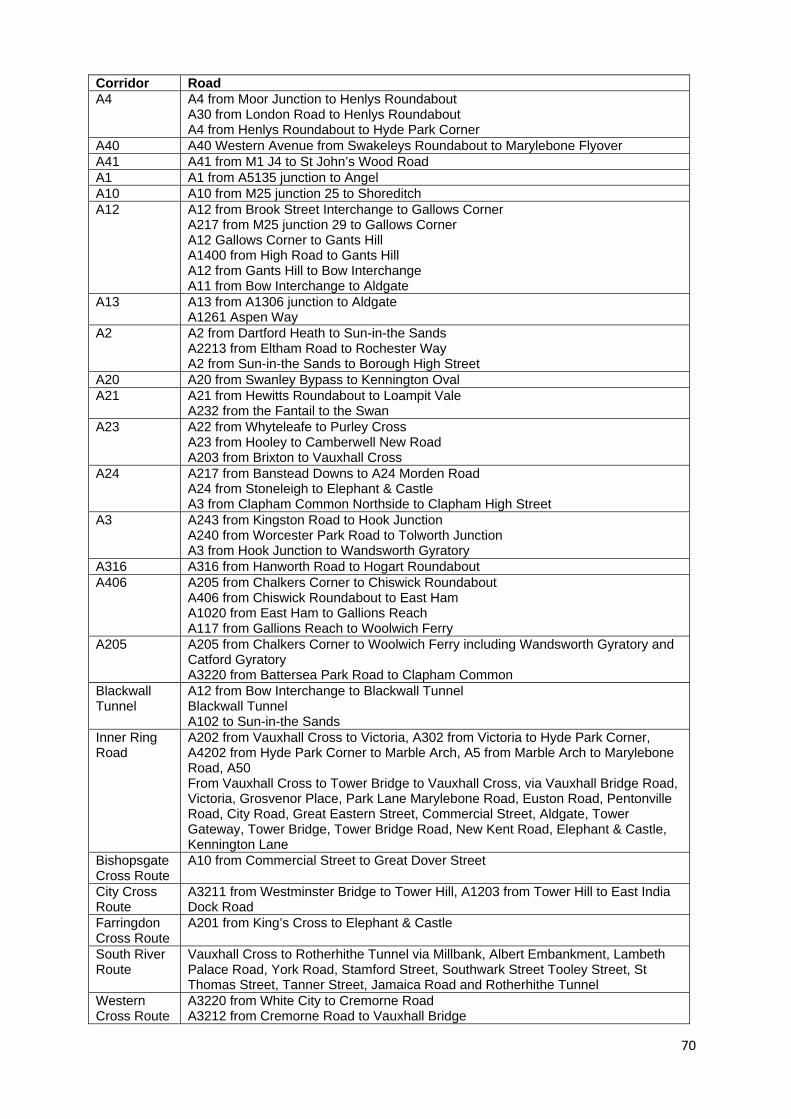
70
Corridor Road A4 A4 from Moor Junction to Henlys Roundabout
A30 from London Road to Henlys Roundabout A4 from Henlys Roundabout to Hyde Park Corner
A40 A40 Western Avenue from Swakeleys Roundabout to Marylebone Flyover A41 A41 from M1 J4 to St John’s Wood Road A1 A1 from A5135 junction to Angel A10 A10 from M25 junction 25 to Shoreditch A12 A12 from Brook Street Interchange to Gallows Corner
A217 from M25 junction 29 to Gallows Corner A12 Gallows Corner to Gants Hill A1400 from High Road to Gants Hill A12 from Gants Hill to Bow Interchange A11 from Bow Interchange to Aldgate
A13 A13 from A1306 junction to Aldgate A1261 Aspen Way
A2 A2 from Dartford Heath to Sun-in-the Sands A2213 from Eltham Road to Rochester Way A2 from Sun-in-the Sands to Borough High Street
A20 A20 from Swanley Bypass to Kennington Oval A21 A21 from Hewitts Roundabout to Loampit Vale
A232 from the Fantail to the Swan A23 A22 from Whyteleafe to Purley Cross
A23 from Hooley to Camberwell New Road A203 from Brixton to Vauxhall Cross
A24 A217 from Banstead Downs to A24 Morden Road A24 from Stoneleigh to Elephant & Castle A3 from Clapham Common Northside to Clapham High Street
A3 A243 from Kingston Road to Hook Junction A240 from Worcester Park Road to Tolworth Junction A3 from Hook Junction to Wandsworth Gyratory
A316 A316 from Hanworth Road to Hogart Roundabout A406 A205 from Chalkers Corner to Chiswick Roundabout
A406 from Chiswick Roundabout to East Ham A1020 from East Ham to Gallions Reach A117 from Gallions Reach to Woolwich Ferry
A205 A205 from Chalkers Corner to Woolwich Ferry including Wandsworth Gyratory and Catford Gyratory A3220 from Battersea Park Road to Clapham Common
Blackwall Tunnel
A12 from Bow Interchange to Blackwall Tunnel Blackwall Tunnel A102 to Sun-in-the Sands
Inner Ring Road
A202 from Vauxhall Cross to Victoria, A302 from Victoria to Hyde Park Corner, A4202 from Hyde Park Corner to Marble Arch, A5 from Marble Arch to Marylebone Road, A50 From Vauxhall Cross to Tower Bridge to Vauxhall Cross, via Vauxhall Bridge Road, Victoria, Grosvenor Place, Park Lane Marylebone Road, Euston Road, Pentonville Road, City Road, Great Eastern Street, Commercial Street, Aldgate, Tower Gateway, Tower Bridge, Tower Bridge Road, New Kent Road, Elephant & Castle, Kennington Lane
Bishopsgate Cross Route
A10 from Commercial Street to Great Dover Street
City Cross Route
A3211 from Westminster Bridge to Tower Hill, A1203 from Tower Hill to East India Dock Road
Farringdon Cross Route
A201 from King’s Cross to Elephant & Castle
South River Route
Vauxhall Cross to Rotherhithe Tunnel via Millbank, Albert Embankment, Lambeth Palace Road, York Road, Stamford Street, Southwark Street Tooley Street, St Thomas Street, Tanner Street, Jamaica Road and Rotherhithe Tunnel
Western Cross Route
A3220 from White City to Cremorne Road A3212 from Cremorne Road to Vauxhall Bridge
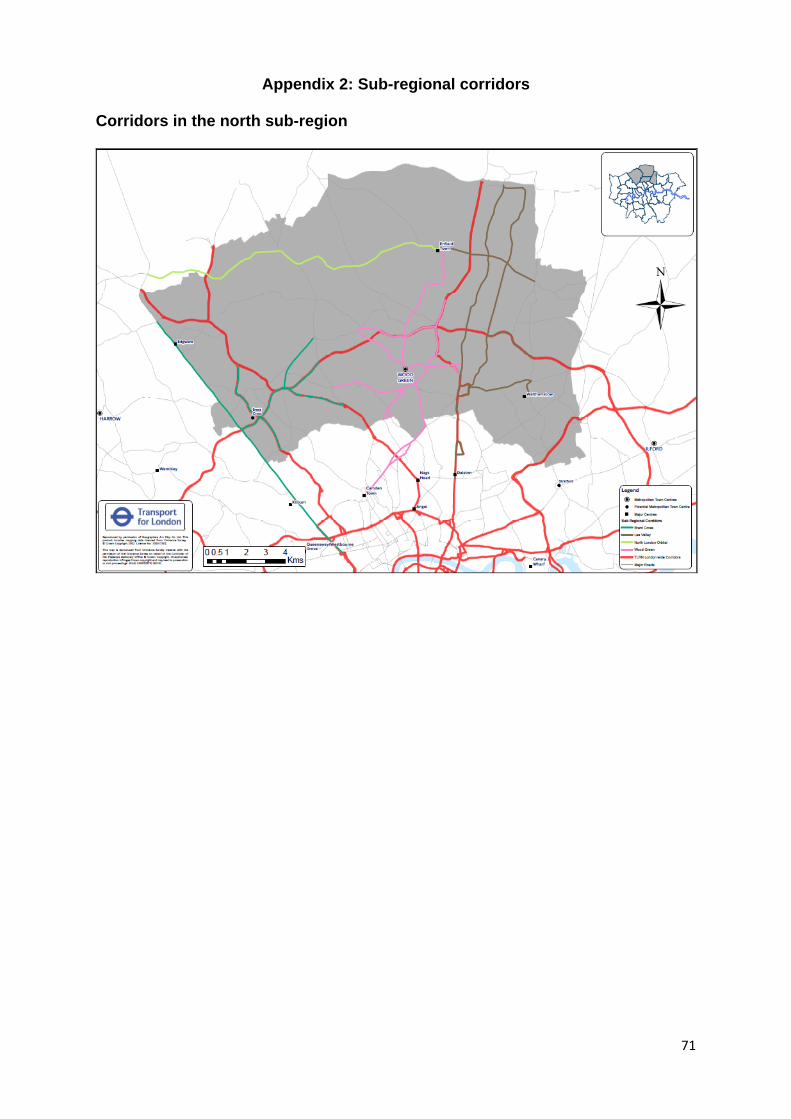
71
Appendix 2: Sub-regional corridors
Corridors in the north sub-region
72
List of corridors in the north sub-region
Corridor Description Road
TLR
N
SRN
BPR
N
Oth
er
A1 A5135 junction to Angel. A1 A10 A10 A41 M1 J4 to St John’s Wood
Road A41
A406 Chiswick Roundabout to East Ham. A406
N1 Enfield Town - Wood Green A105 N10 Finchley - Brent Cross A598 N11 West Hampstead - Brent
Cross A41
N12 Mill Hill - Brent Cross A42 N13
Elstree - Enfield Town A411, A110
N14 Waltham Cross - Dalston
A10 A1010
N15 Waltham Cross - Tottenham Hale A1055
N16 Enfield - Chingford A110 N17 Edmonton - Walthamstow A406 N18 Walthamstow - Tottenham A503 N19 Walthamstow - Dalston A104 N2 Edmonton - New Southgate
A406 Bowes Road
N3
New Southgate - Wood Green
A109, Station Road
N4 Muswell Hill - Wood Green A504 N5 Camden Town - Wood Green A105
A503 N6
Crouch End - Wood Green
Crouch End Hill, A1202, A103
N7 Marble Arch - Brent Cross A5 N8 Edgware - Brent Cross A5 N9 Finchley/Highgate - Brent
Cross A1 A406
73
Corridors in the east sub-region
74
Corridors in the east sub-region Corridor Description Road
TLR
N
SRN
BPR
N
Oth
er
A12 Brook Street Interchange to Gallows Corner. A12
M25 J29 to Gallows Corner. A217 Gallows Corner to Gants Hill. A12
High Road to Gants Hill. A1400 Gants Hill to Bow Interchange. A12
Bow Interchange to Aldgate. A11
A13 A1306 junction to Aldgate. A13 Aspen Way. A1261
A2 Dartford Heath to Sun-in-the Sands. A2
Eltham Road to Rochester Way. A2213
Sun-in-the Sands to Borough High Street. A2
A20 Swanley Bypass to
Kennington Oval. A20
A21 Hewitts Roundabout to Loampit Vale. A21
A406 Chiswick Roundabout to
East Ham. A406
East Ham to Gallions Reach. A1020 Gallions Reach to Woolwich Ferry A117
A205 Chalkers Corner to
Woolwich Ferry including Wandsworth Gyratory and Catford Gyratory.
A205
City Cross Route
A3211 from Westminster Bridge to Tower Hill, A1203 from Tower Hill to East India Dock Road
Blackwall Tunnel
A12 from Bow Interchange to Blackwall Tunnel, Blackwall Tunnel, A102 to Sun-in-the Sands.
A12, A102
E1 Central - Canary Whalf
A1203 A1261
E10 Canning Town - Stratford A1011 E11 Custom House - Stratford A112 E12 Stratford - Ilford A118 E13 Docklands - Ilford A117 E14 East Ham - Ilford A406
75
E15 Barking - Ilford A123 E16 Woodford - Ilford A406 E17 Barkingside - Ilford A123 E17 Barkingside - Ilford A123 E18 Brentwood - Romford
A118
A12 E19 Collier Row - Romford A125 E2 Central - Canary Whalf A13 E20 Barking/Dagenham -
Romford
A124
A1240
E21 Ilford - Romford A118 E22 East Ham- Woolwich
A1020 A117
E23 Dartsford - Woolwich
A2016
A206 E24 Catford - Woolwich A205 E25 Greenwich - Woolwich A206 E3 Mile End -- Canary Whalf A1205 E4 Greenwich - Canary Whalf A102 E5 Bow- Canary Whalf A12 E6 East Ham - Canary Whalf A124 E7 Docklands - Canary Whalf A112,
A1020, A112, Connaught Bridge
E8 Walthamstow - Stratford A112 E9 Central - Stratford
A11 A118
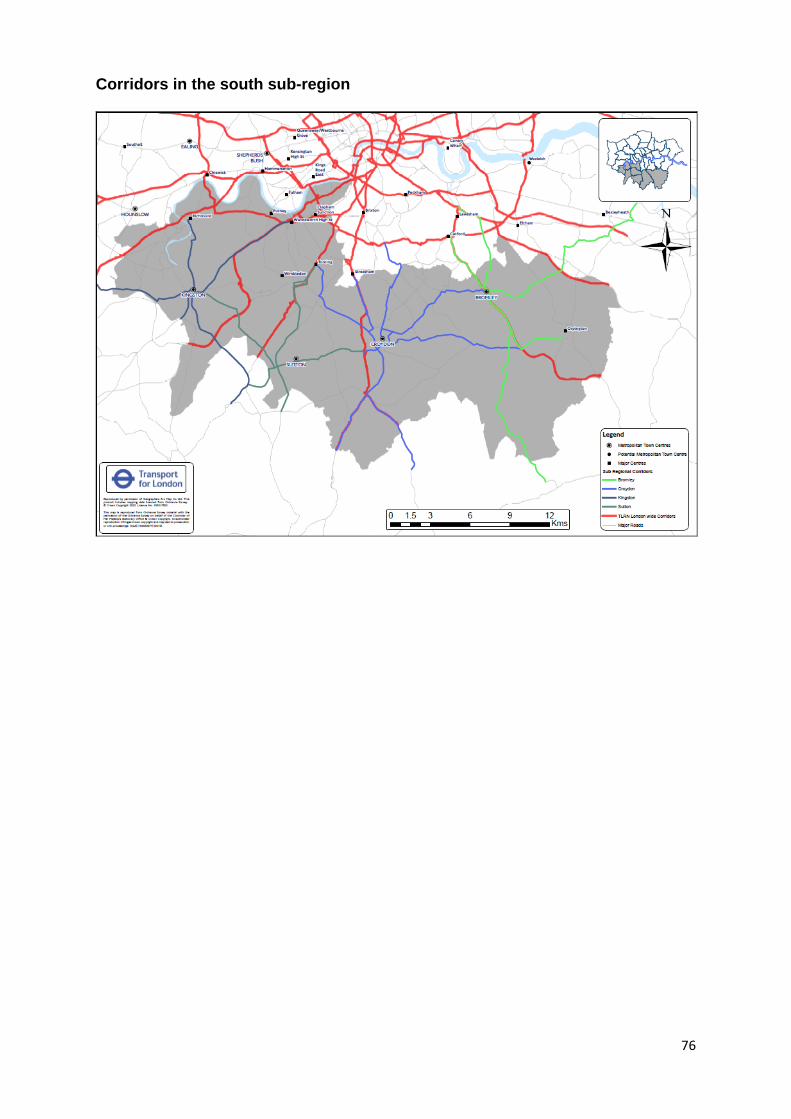
76
Corridors in the south sub-region

77
List of corridors in the south sub-region
Corridor Description Road
TLR
N
SRN
BPR
N
Oth
er
A20 Swanley Bypass to Kennington Oval. A20 A21 Hewitts Roundabout to Loampit Vale. A21
The Fantail to the Swan. A232 A23 Whyteleafe to Purley Cross. A22
Hooley to Camberwell New Road. A23 A24 Banstead Downs to A24 Morden
Road. A217
Stoneleigh to to Elephant and Castle. A24
A3 Kingston Road to Hook Junction. A243 Worcester Park Road to Tolworth Junction. A240
Hook Junction to Wandsworth Gyratory. A3
A316 Hanworth Road to Hogart
Roundabout. A316
A205 Chalkers Corner to Woolwich Ferry including Wandsworth Gyratory and Catford Gyratory.
A205
Battersea Park Road to Clapham Common A3220
S1 Catford - Bromley A21 S10/S13 Sutton/A23 - Croydon A232 S11 Tooting - Croydon
A217 A236
S12 Streatham - Croydon
A23 A235 A236
S13/S10 Croydon/A23 - Croydon A232 S14 Banstead - Sutton A217 S15 Epsom - Sutton A232 S16 Kingston - Sutton A2043
Sutton - Kingston A2043 S17 Tooting - Sutton
A217 A24 A297
S18 Epson/Leatherhead - Kingston
A240 A243
S19 Surbiton - Kingston A307 S2 Lewisham - Bromley
A20 A2212
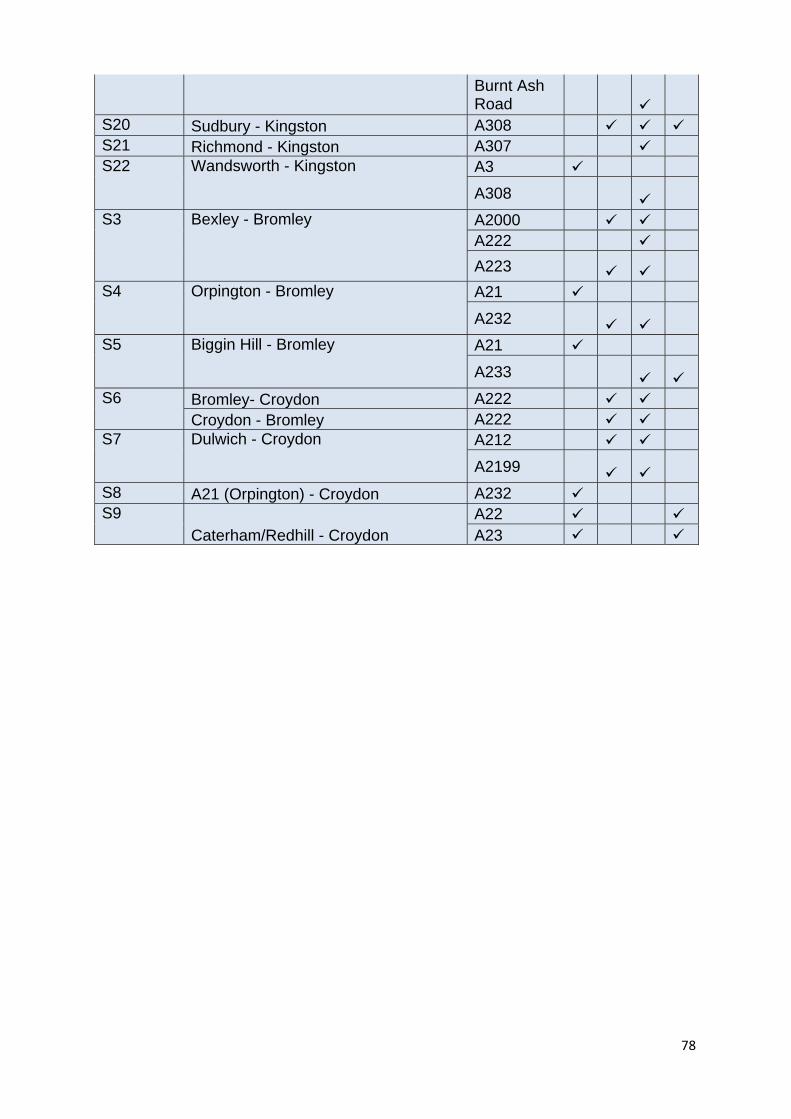
78
Burnt Ash Road
S20 Sudbury - Kingston A308 S21 Richmond - Kingston A307 S22 Wandsworth - Kingston
A3 A308
S3 Bexley - Bromley
A2000 A222 A223
S4 Orpington - Bromley
A21 A232
S5 Biggin Hill - Bromley
A21 A233
S6 Bromley- Croydon A222 Croydon - Bromley A222
S7 Dulwich - Croydon
A212 A2199
S8 A21 (Orpington) - Croydon A232 S9
Caterham/Redhill - Croydon A22 A23
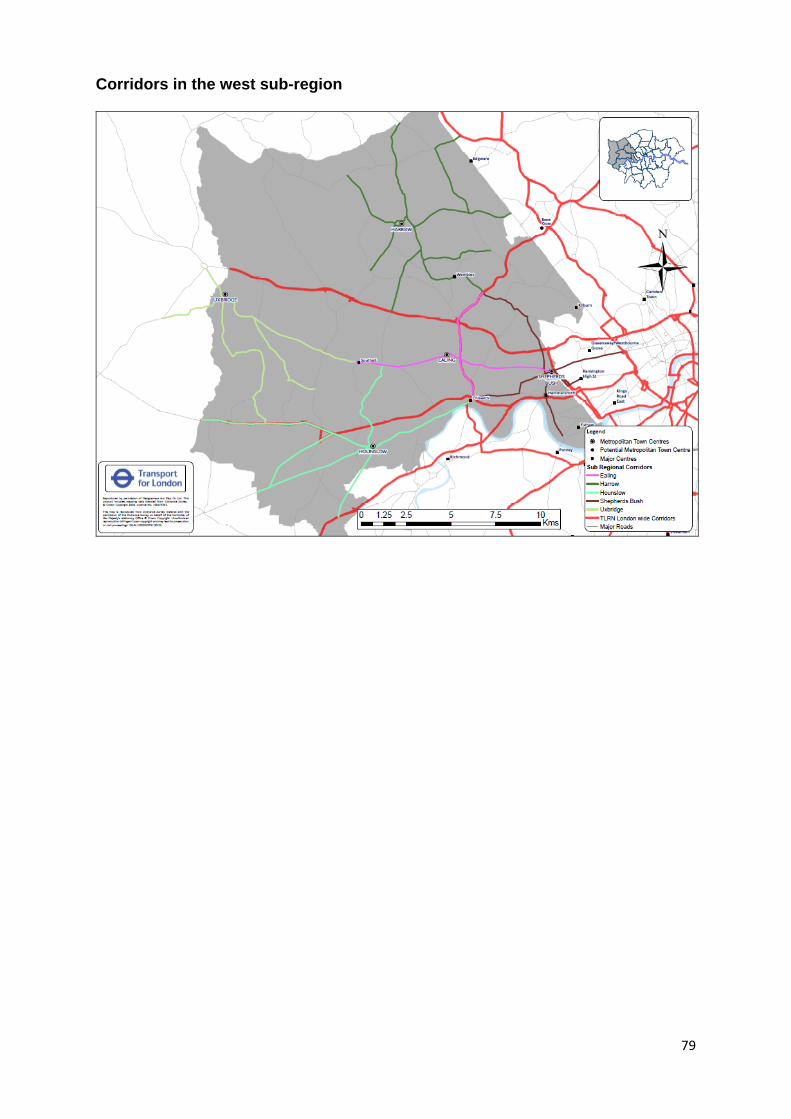
79
Corridors in the west sub-region
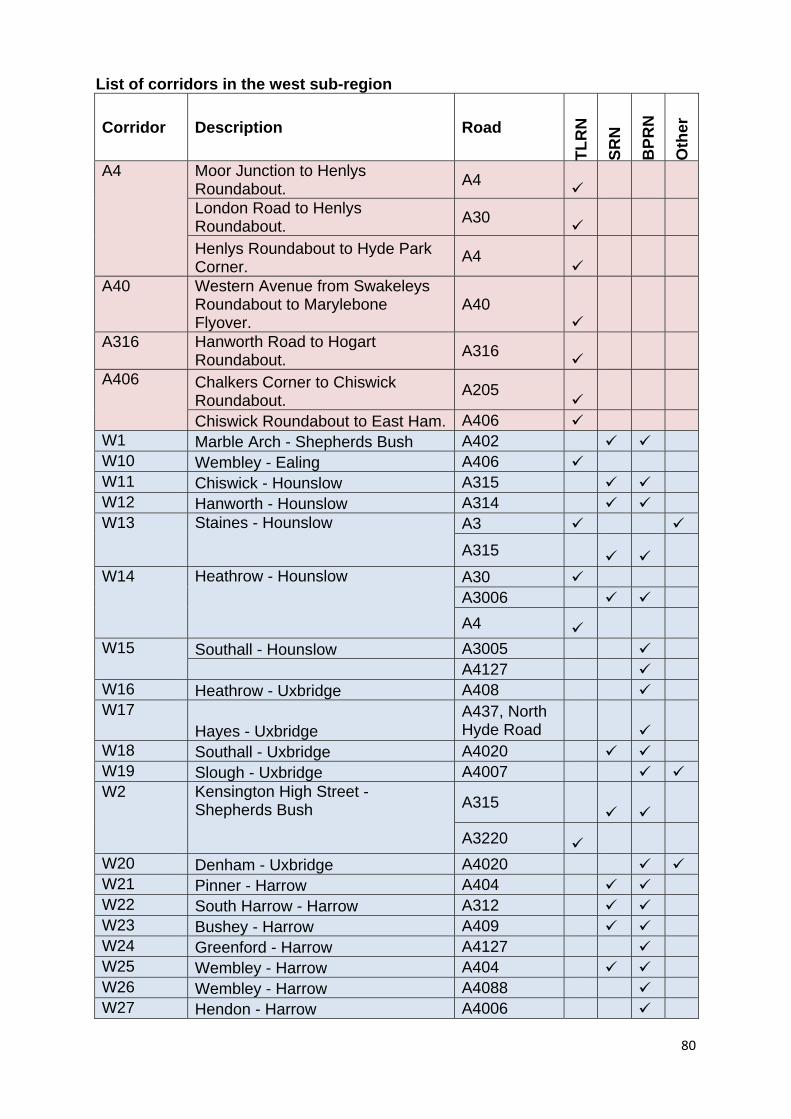
80
List of corridors in the west sub-region
Corridor Description Road
TLR
N
SRN
BPR
N
Oth
er
A4 Moor Junction to Henlys Roundabout. A4
London Road to Henlys Roundabout. A30
Henlys Roundabout to Hyde Park Corner.
A4
A40 Western Avenue from Swakeleys Roundabout to Marylebone Flyover.
A40
A316 Hanworth Road to Hogart Roundabout. A316
A406 Chalkers Corner to Chiswick
Roundabout. A205
Chiswick Roundabout to East Ham. A406
W1 Marble Arch - Shepherds Bush A402 W10 Wembley - Ealing A406 W11 Chiswick - Hounslow A315 W12 Hanworth - Hounslow A314 W13 Staines - Hounslow
A3
A315 W14 Heathrow - Hounslow
A30 A3006 A4
W15 Southall - Hounslow A3005 A4127
W16 Heathrow - Uxbridge A408 W17
Hayes - Uxbridge A437, North Hyde Road
W18 Southall - Uxbridge A4020 W19 Slough - Uxbridge A4007 W2 Kensington High Street -
Shepherds Bush
A315
A3220 W20 Denham - Uxbridge A4020 W21 Pinner - Harrow A404 W22 South Harrow - Harrow A312 W23 Bushey - Harrow A409 W24 Greenford - Harrow A4127 W25 Wembley - Harrow A404 W26 Wembley - Harrow A4088 W27 Hendon - Harrow A4006
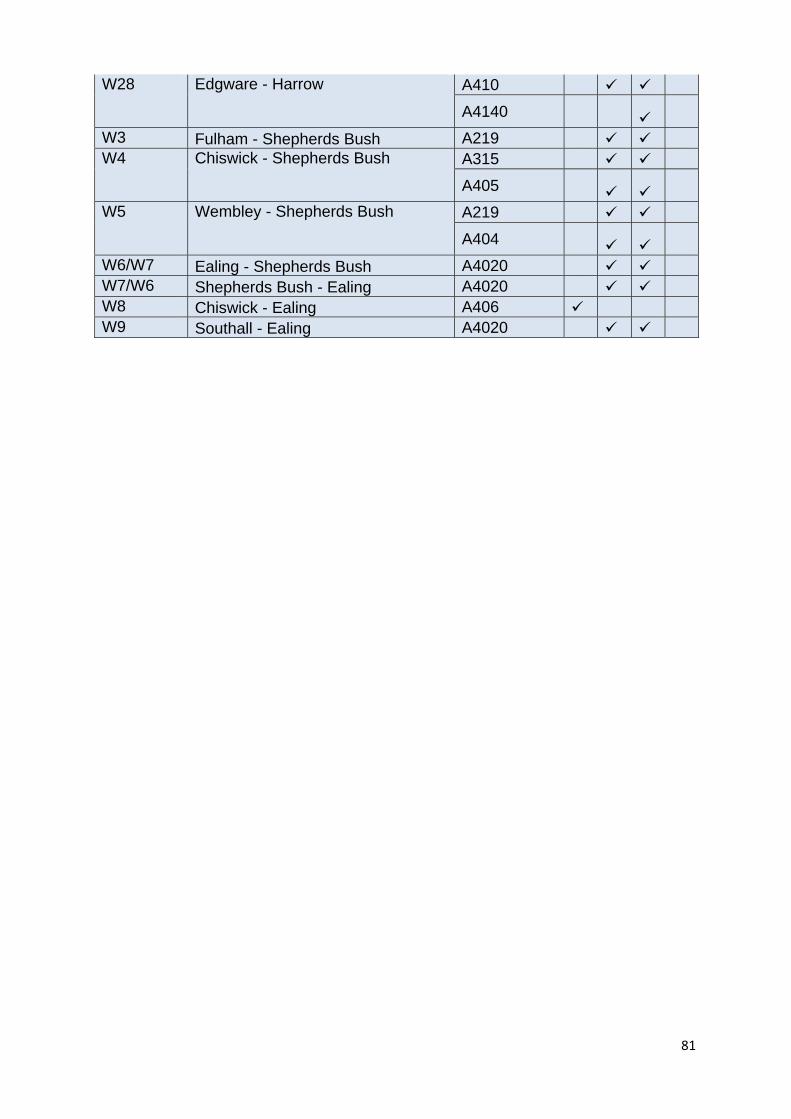
81
W28 Edgware - Harrow
A410 A4140
W3 Fulham - Shepherds Bush A219 W4 Chiswick - Shepherds Bush
A315 A405
W5 Wembley - Shepherds Bush
A219 A404
W6/W7 Ealing - Shepherds Bush A4020 W7/W6 Shepherds Bush - Ealing A4020 W8 Chiswick - Ealing A406 W9 Southall - Ealing A4020

82
Corridors in the central sub-region
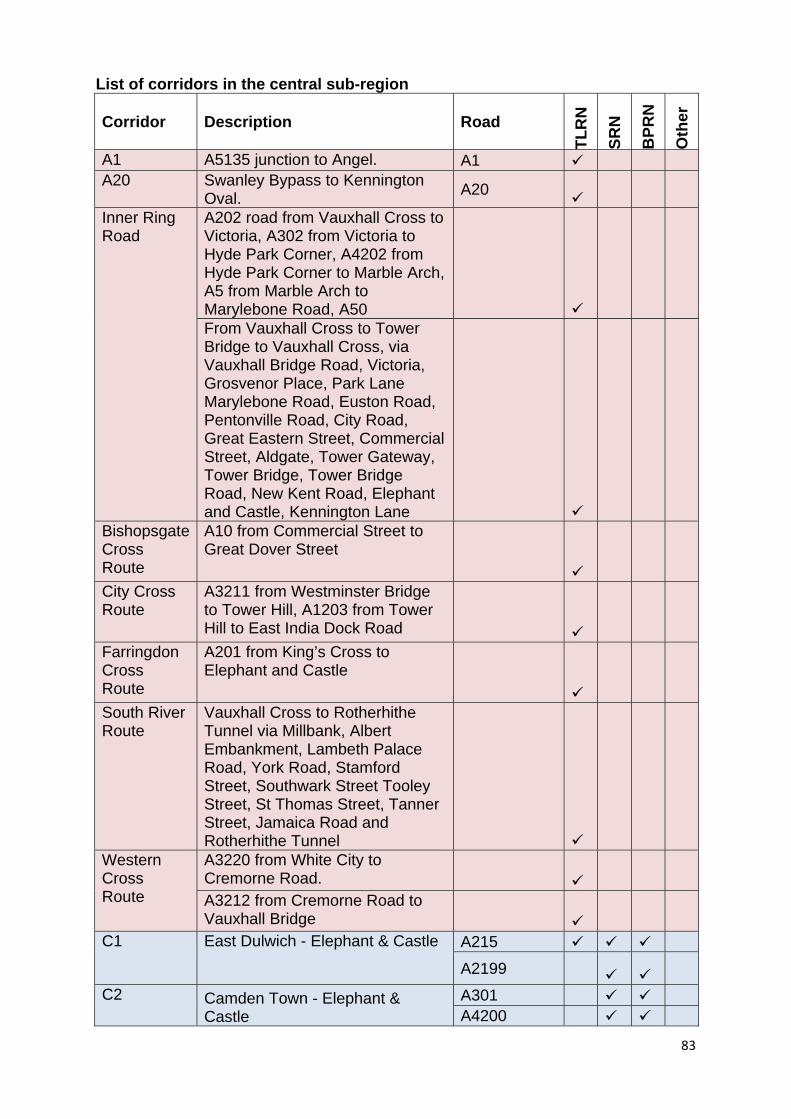
83
List of corridors in the central sub-region
Corridor Description Road
TLR
N
SRN
BPR
N
Oth
er
A1 A5135 junction to Angel. A1 A20 Swanley Bypass to Kennington
Oval. A20
Inner Ring Road
A202 road from Vauxhall Cross to Victoria, A302 from Victoria to Hyde Park Corner, A4202 from Hyde Park Corner to Marble Arch, A5 from Marble Arch to Marylebone Road, A50
From Vauxhall Cross to Tower Bridge to Vauxhall Cross, via Vauxhall Bridge Road, Victoria, Grosvenor Place, Park Lane Marylebone Road, Euston Road, Pentonville Road, City Road, Great Eastern Street, Commercial Street, Aldgate, Tower Gateway, Tower Bridge, Tower Bridge Road, New Kent Road, Elephant and Castle, Kennington Lane
Bishopsgate Cross Route
A10 from Commercial Street to Great Dover Street
City Cross Route
A3211 from Westminster Bridge to Tower Hill, A1203 from Tower Hill to East India Dock Road
Farringdon Cross Route
A201 from King’s Cross to Elephant and Castle
South River Route
Vauxhall Cross to Rotherhithe Tunnel via Millbank, Albert Embankment, Lambeth Palace Road, York Road, Stamford Street, Southwark Street Tooley Street, St Thomas Street, Tanner Street, Jamaica Road and Rotherhithe Tunnel
Western Cross Route
A3220 from White City to Cremorne Road.
A3212 from Cremorne Road to Vauxhall Bridge
C1 East Dulwich - Elephant & Castle
A215
A2199 C2 Camden Town - Elephant &
Castle A301 A4200
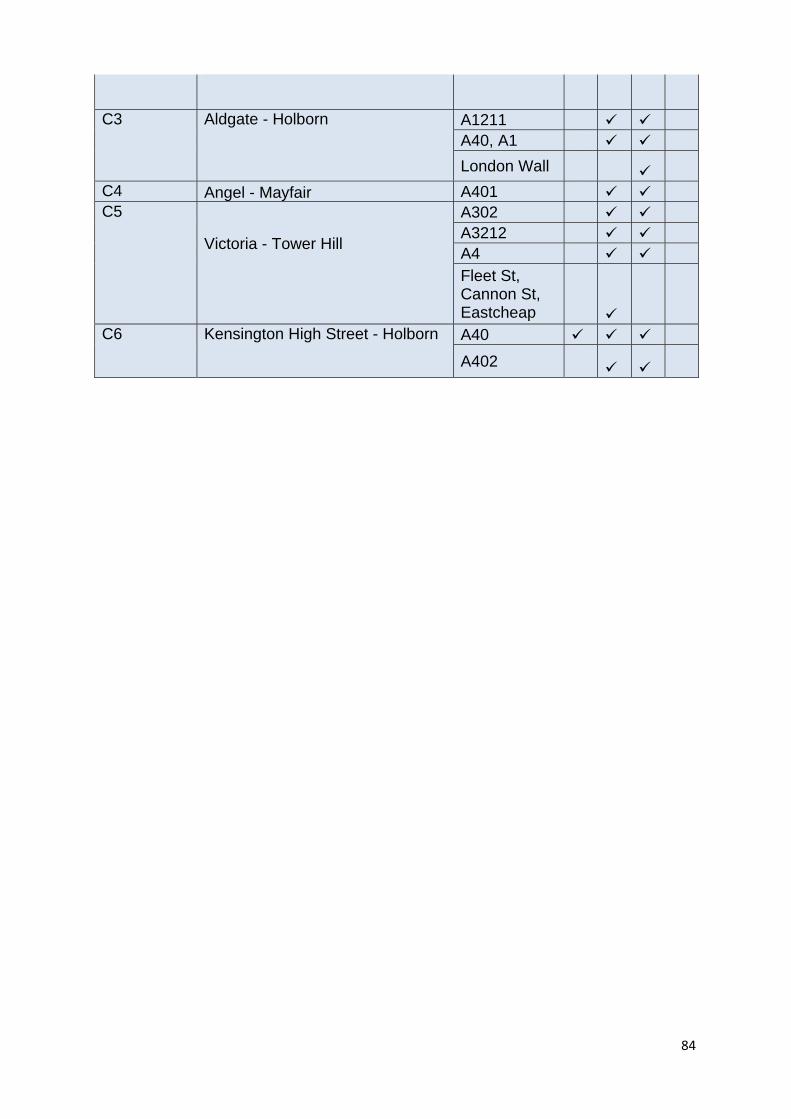
84
C3 Aldgate - Holborn
A1211 A40, A1
London Wall C4 Angel - Mayfair A401 C5
Victoria - Tower Hill
A302 A3212 A4 Fleet St, Cannon St, Eastcheap
C6 Kensington High Street - Holborn
A40
A402
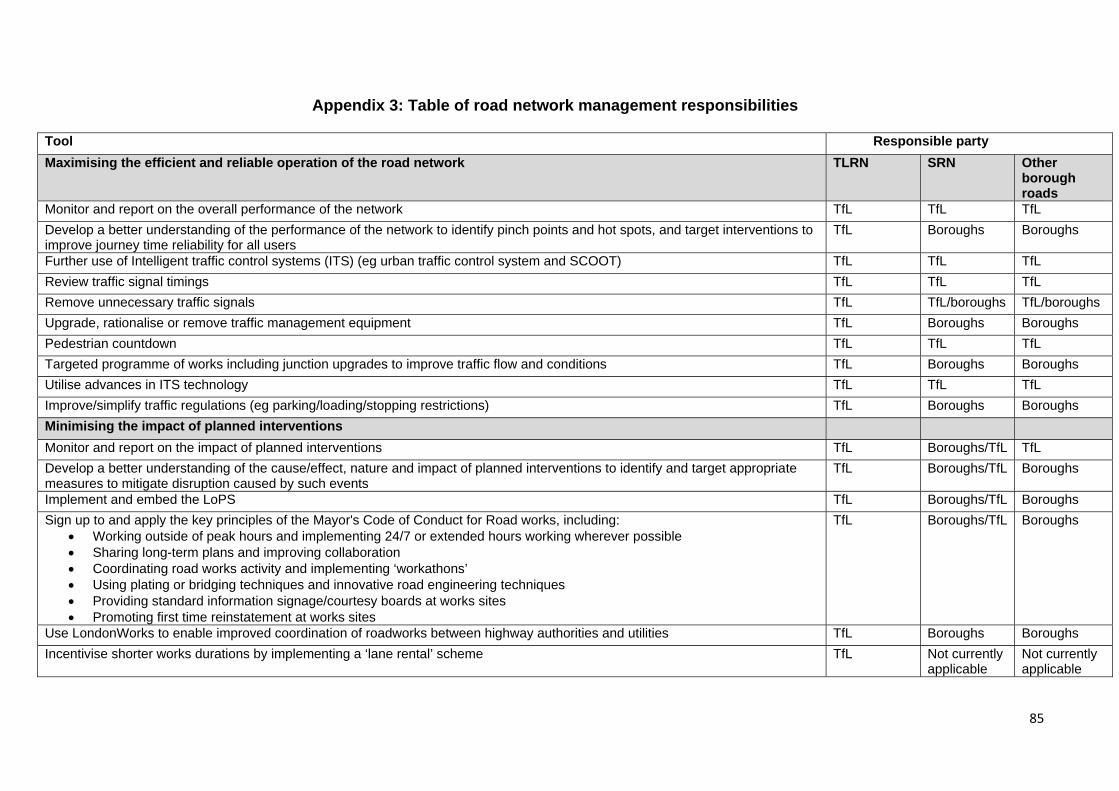
85
Appendix 3: Table of road network management responsibilities
Tool Responsible party Maximising the efficient and reliable operation of the road network TLRN SRN Other
borough roads
Monitor and report on the overall performance of the network TfL TfL TfL Develop a better understanding of the performance of the network to identify pinch points and hot spots, and target interventions to improve journey time reliability for all users
TfL Boroughs Boroughs
Further use of Intelligent traffic control systems (ITS) (eg urban traffic control system and SCOOT) TfL TfL TfL Review traffic signal timings TfL TfL TfL Remove unnecessary traffic signals TfL TfL/boroughs TfL/boroughs Upgrade, rationalise or remove traffic management equipment TfL Boroughs Boroughs Pedestrian countdown TfL TfL TfL Targeted programme of works including junction upgrades to improve traffic flow and conditions TfL Boroughs Boroughs Utilise advances in ITS technology TfL TfL TfL Improve/simplify traffic regulations (eg parking/loading/stopping restrictions) TfL Boroughs Boroughs Minimising the impact of planned interventions Monitor and report on the impact of planned interventions TfL Boroughs/TfL TfL Develop a better understanding of the cause/effect, nature and impact of planned interventions to identify and target appropriate measures to mitigate disruption caused by such events
TfL Boroughs/TfL Boroughs
Implement and embed the LoPS TfL Boroughs/TfL Boroughs Sign up to and apply the key principles of the Mayor's Code of Conduct for Road works, including:
• Working outside of peak hours and implementing 24/7 or extended hours working wherever possible • Sharing long-term plans and improving collaboration • Coordinating road works activity and implementing ‘workathons’ • Using plating or bridging techniques and innovative road engineering techniques • Providing standard information signage/courtesy boards at works sites • Promoting first time reinstatement at works sites
TfL Boroughs/TfL Boroughs
Use LondonWorks to enable improved coordination of roadworks between highway authorities and utilities TfL Boroughs Boroughs Incentivise shorter works durations by implementing a ‘lane rental’ scheme TfL Not currently
applicable Not currently applicable
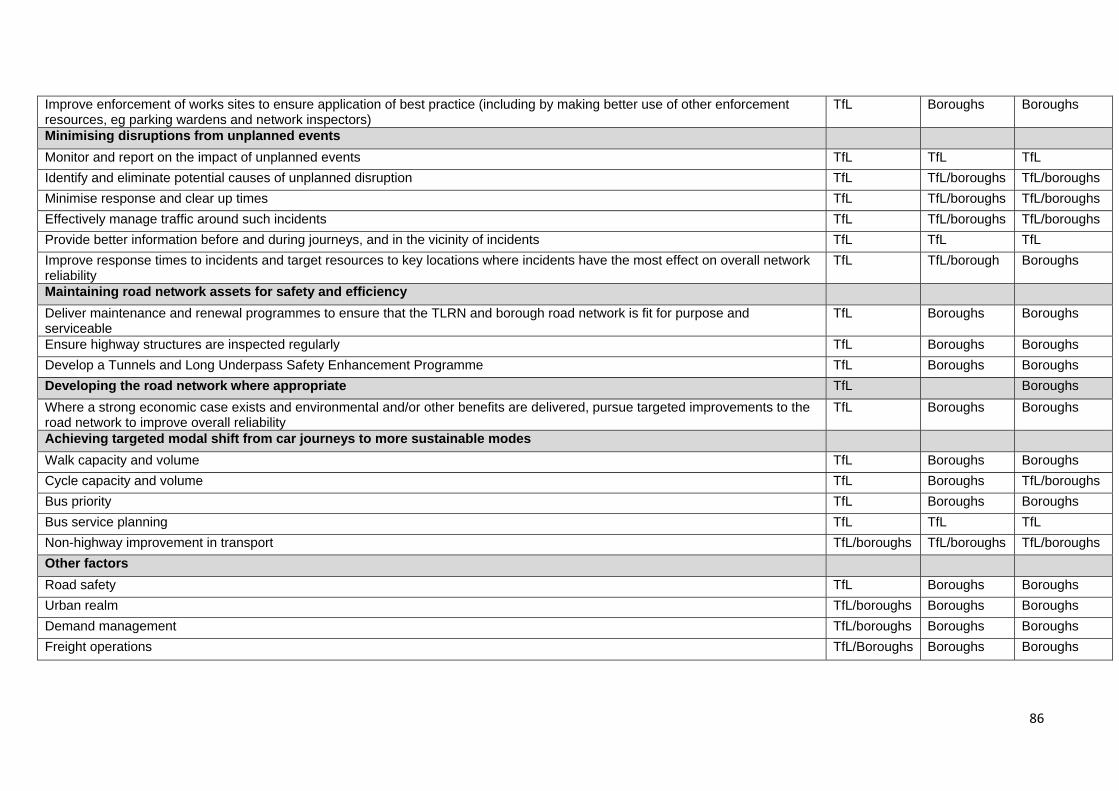
86
Improve enforcement of works sites to ensure application of best practice (including by making better use of other enforcement resources, eg parking wardens and network inspectors)
TfL Boroughs Boroughs
Minimising disruptions from unplanned events Monitor and report on the impact of unplanned events TfL TfL TfL Identify and eliminate potential causes of unplanned disruption TfL TfL/boroughs TfL/boroughs Minimise response and clear up times TfL TfL/boroughs TfL/boroughs Effectively manage traffic around such incidents TfL TfL/boroughs TfL/boroughs Provide better information before and during journeys, and in the vicinity of incidents TfL TfL TfL Improve response times to incidents and target resources to key locations where incidents have the most effect on overall network reliability
TfL TfL/borough Boroughs
Maintaining road network assets for safety and efficiency Deliver maintenance and renewal programmes to ensure that the TLRN and borough road network is fit for purpose and serviceable
TfL Boroughs Boroughs
Ensure highway structures are inspected regularly TfL Boroughs Boroughs Develop a Tunnels and Long Underpass Safety Enhancement Programme TfL Boroughs Boroughs Developing the road network where appropriate TfL Boroughs Where a strong economic case exists and environmental and/or other benefits are delivered, pursue targeted improvements to the road network to improve overall reliability
TfL Boroughs Boroughs
Achieving targeted modal shift from car journeys to more sustainable modes Walk capacity and volume TfL Boroughs Boroughs Cycle capacity and volume TfL Boroughs TfL/boroughs Bus priority TfL Boroughs Boroughs Bus service planning TfL TfL TfL Non-highway improvement in transport TfL/boroughs TfL/boroughs TfL/boroughs Other factors Road safety TfL Boroughs Boroughs Urban realm TfL/boroughs Boroughs Boroughs Demand management TfL/boroughs Boroughs Boroughs Freight operations TfL/Boroughs Boroughs Boroughs
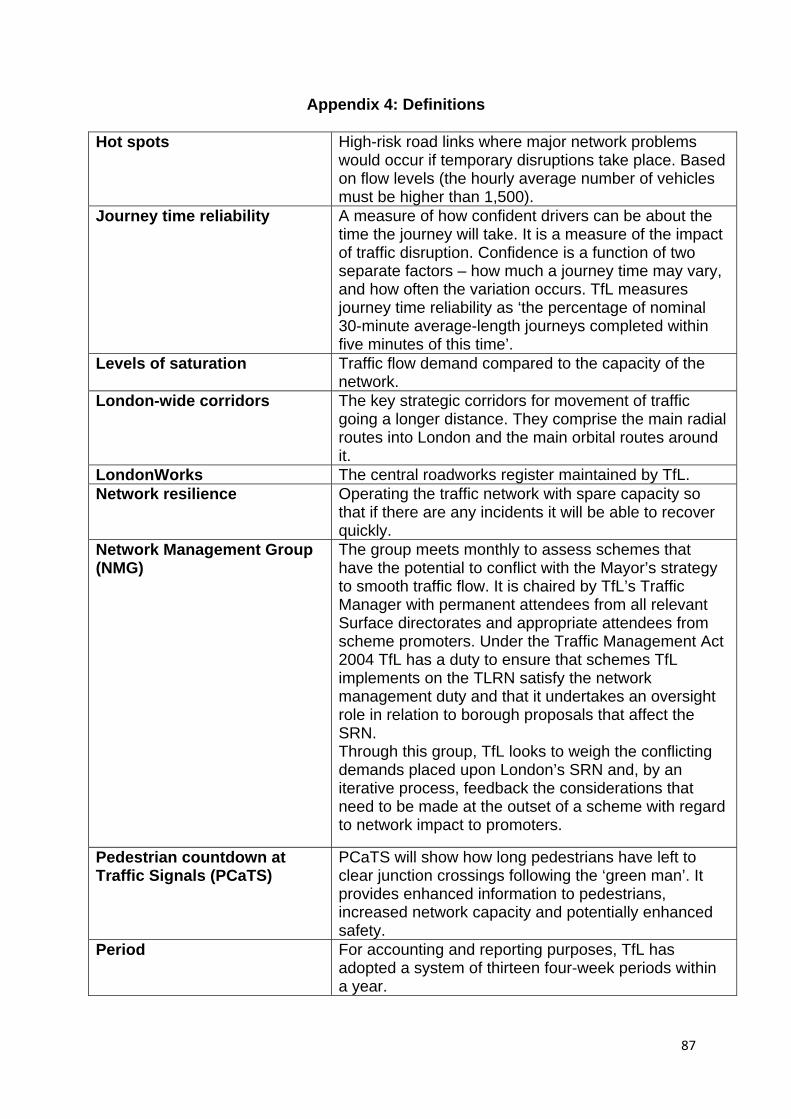
87
Appendix 4: Definitions
Hot spots High-risk road links where major network problems would occur if temporary disruptions take place. Based on flow levels (the hourly average number of vehicles must be higher than 1,500).
Journey time reliability A measure of how confident drivers can be about the time the journey will take. It is a measure of the impact of traffic disruption. Confidence is a function of two separate factors – how much a journey time may vary, and how often the variation occurs. TfL measures journey time reliability as ‘the percentage of nominal 30-minute average-length journeys completed within five minutes of this time’.
Levels of saturation Traffic flow demand compared to the capacity of the network.
London-wide corridors The key strategic corridors for movement of traffic going a longer distance. They comprise the main radial routes into London and the main orbital routes around it.
LondonWorks The central roadworks register maintained by TfL. Network resilience Operating the traffic network with spare capacity so
that if there are any incidents it will be able to recover quickly.
Network Management Group (NMG)
The group meets monthly to assess schemes that have the potential to conflict with the Mayor’s strategy to smooth traffic flow. It is chaired by TfL’s Traffic Manager with permanent attendees from all relevant Surface directorates and appropriate attendees from scheme promoters. Under the Traffic Management Act 2004 TfL has a duty to ensure that schemes TfL implements on the TLRN satisfy the network management duty and that it undertakes an oversight role in relation to borough proposals that affect the SRN. Through this group, TfL looks to weigh the conflicting demands placed upon London’s SRN and, by an iterative process, feedback the considerations that need to be made at the outset of a scheme with regard to network impact to promoters.
Pedestrian countdown at Traffic Signals (PCaTS)
PCaTS will show how long pedestrians have left to clear junction crossings following the ‘green man’. It provides enhanced information to pedestrians, increased network capacity and potentially enhanced safety.
Period For accounting and reporting purposes, TfL has adopted a system of thirteen four-week periods within a year.
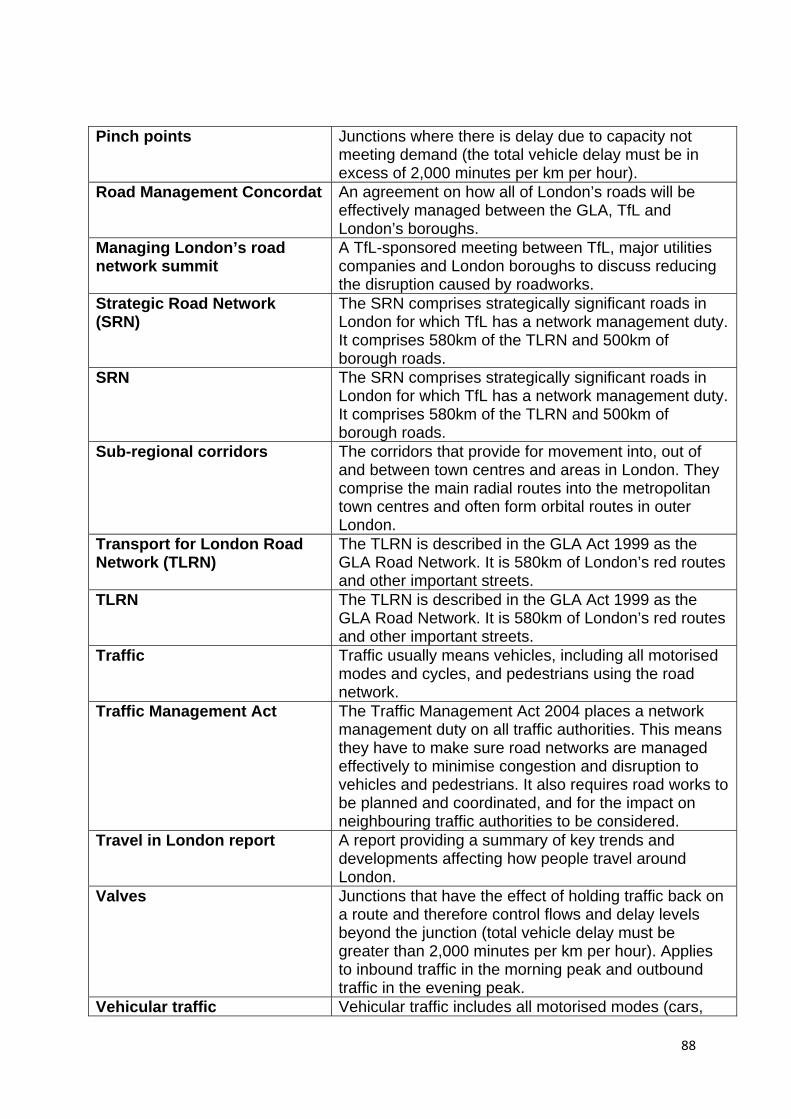
88
Pinch points Junctions where there is delay due to capacity not meeting demand (the total vehicle delay must be in excess of 2,000 minutes per km per hour).
Road Management Concordat An agreement on how all of London’s roads will be effectively managed between the GLA, TfL and London’s boroughs.
Managing London’s road network summit
A TfL-sponsored meeting between TfL, major utilities companies and London boroughs to discuss reducing the disruption caused by roadworks.
Strategic Road Network (SRN)
The SRN comprises strategically significant roads in London for which TfL has a network management duty. It comprises 580km of the TLRN and 500km of borough roads.
SRN The SRN comprises strategically significant roads in London for which TfL has a network management duty. It comprises 580km of the TLRN and 500km of borough roads.
Sub-regional corridors The corridors that provide for movement into, out of and between town centres and areas in London. They comprise the main radial routes into the metropolitan town centres and often form orbital routes in outer London.
Transport for London Road Network (TLRN)
The TLRN is described in the GLA Act 1999 as the GLA Road Network. It is 580km of London’s red routes and other important streets.
TLRN The TLRN is described in the GLA Act 1999 as the GLA Road Network. It is 580km of London’s red routes and other important streets.
Traffic Traffic usually means vehicles, including all motorised modes and cycles, and pedestrians using the road network.
Traffic Management Act The Traffic Management Act 2004 places a network management duty on all traffic authorities. This means they have to make sure road networks are managed effectively to minimise congestion and disruption to vehicles and pedestrians. It also requires road works to be planned and coordinated, and for the impact on neighbouring traffic authorities to be considered.
Travel in London report A report providing a summary of key trends and developments affecting how people travel around London.
Valves Junctions that have the effect of holding traffic back on a route and therefore control flows and delay levels beyond the junction (total vehicle delay must be greater than 2,000 minutes per km per hour). Applies to inbound traffic in the morning peak and outbound traffic in the evening peak.
Vehicular traffic Vehicular traffic includes all motorised modes (cars,

89
taxies, vans, goods vehicles, buses, coaches and powered two-wheeled vehicles) and pedal cycles using the road network.
VISSIM Verkehr In Städten – SIMulation. A German acronym for ‘traffic in towns – simulation’, is a random microscopic simulation model.
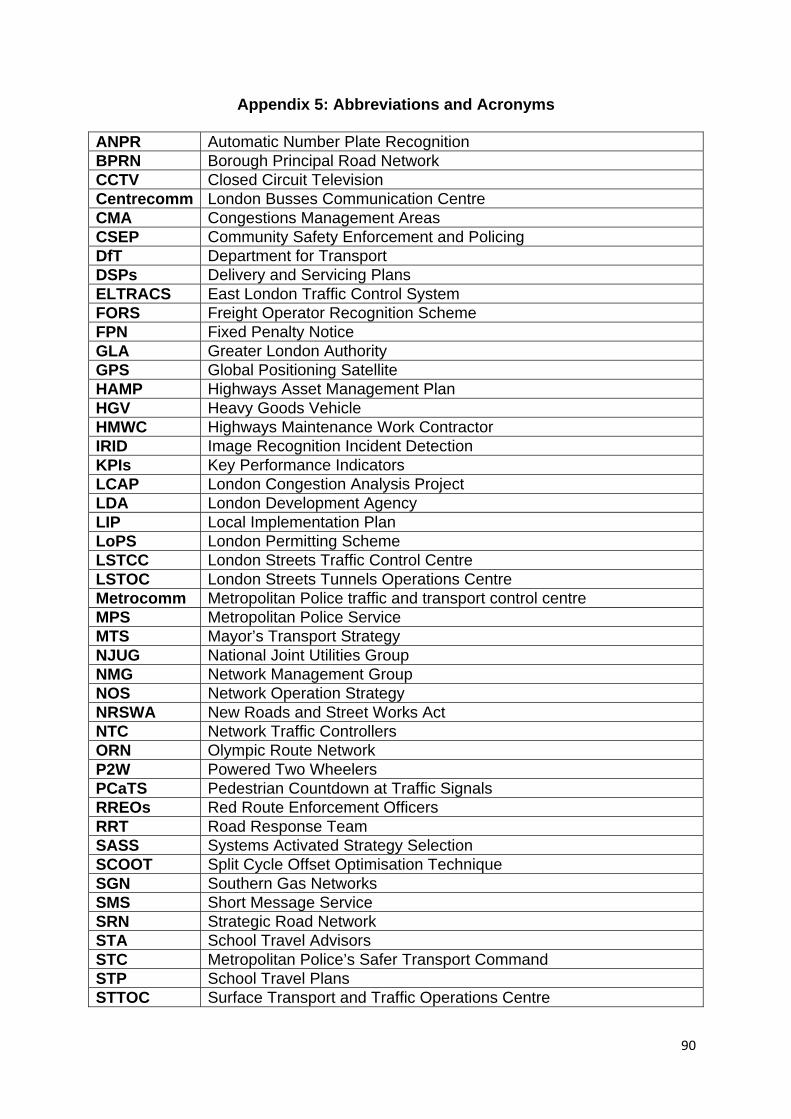
90
Appendix 5: Abbreviations and Acronyms
ANPR Automatic Number Plate Recognition BPRN Borough Principal Road Network CCTV Closed Circuit Television Centrecomm London Busses Communication Centre CMA Congestions Management Areas CSEP Community Safety Enforcement and Policing DfT Department for Transport DSPs Delivery and Servicing Plans ELTRACS East London Traffic Control System FORS Freight Operator Recognition Scheme FPN Fixed Penalty Notice GLA Greater London Authority GPS Global Positioning Satellite HAMP Highways Asset Management Plan HGV Heavy Goods Vehicle HMWC Highways Maintenance Work Contractor IRID Image Recognition Incident Detection KPIs Key Performance Indicators LCAP London Congestion Analysis Project LDA London Development Agency LIP Local Implementation Plan LoPS London Permitting Scheme LSTCC London Streets Traffic Control Centre LSTOC London Streets Tunnels Operations Centre Metrocomm Metropolitan Police traffic and transport control centre MPS Metropolitan Police Service MTS Mayor’s Transport Strategy NJUG National Joint Utilities Group NMG Network Management Group NOS Network Operation Strategy NRSWA New Roads and Street Works Act NTC Network Traffic Controllers ORN Olympic Route Network P2W Powered Two Wheelers PCaTS Pedestrian Countdown at Traffic Signals RREOs Red Route Enforcement Officers RRT Road Response Team SASS Systems Activated Strategy Selection SCOOT Split Cycle Offset Optimisation Technique SGN Southern Gas Networks SMS Short Message Service SRN Strategic Road Network STA School Travel Advisors STC Metropolitan Police’s Safer Transport Command STP School Travel Plans STTOC Surface Transport and Traffic Operations Centre

91
SVD Selective Vehicle Detection TDM Travel Demand Management TfL Transport for London TIP TLRN Implementation Plan TLRN Transport for London Road Network TWU Thames Water Utilities UTC Urban Traffic Control VA Vehicle Actuated VISSIM Verkehr In Städten – SIMulation. A German acronym for ‘traffic in
towns – simulation’ VMS Variable Message Signs VOSA Vehicle and Operator Services Agency
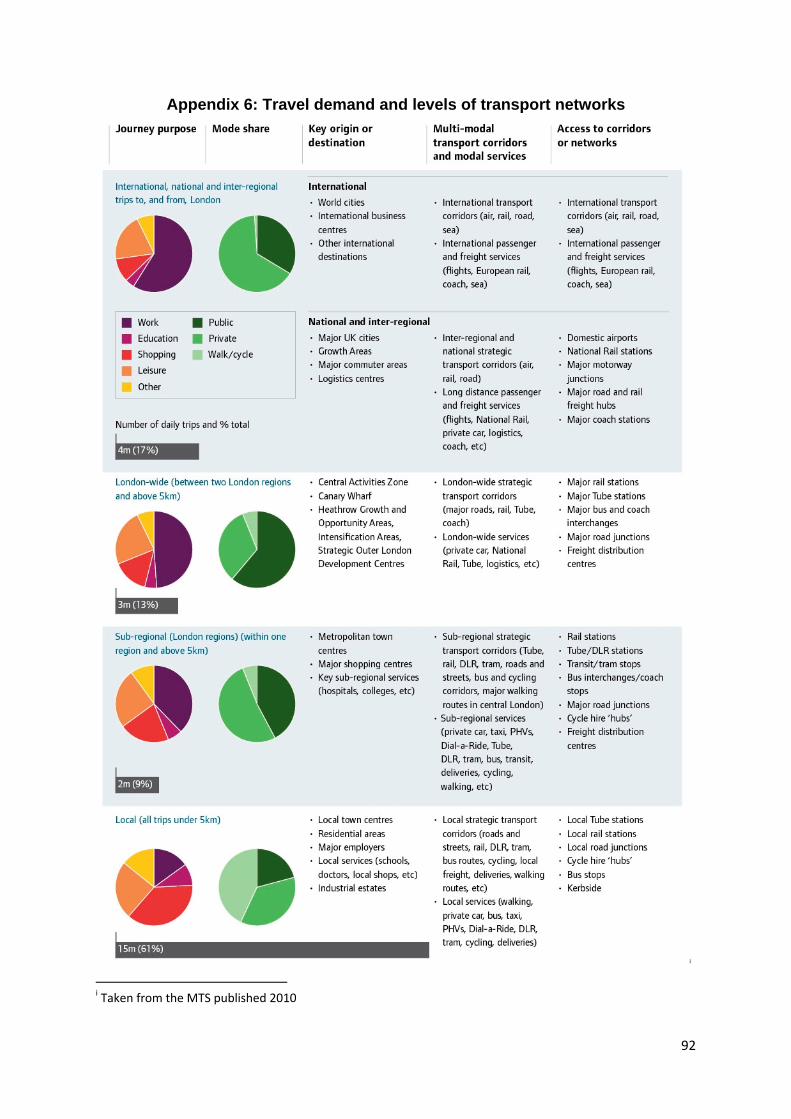
92
Appendix 6: Travel demand and levels of transport networks
i i Taken from the MTS published 2010