Embed Size (px)
Citation preview
IT Hardware cluster: Cambridge, United Kingdom
Final Paper
Microeconomics of Competitiveness, Harvard Business School
Professor Michael E. Porter & Professor Hirotaka Takeuchi
Project advisor: Dr. Christian Ketels
May 4 2012
Christian Andersen, Jonathan Bailey, Adam Heal, Oliver Munn, & Bryan O’Connell*
* Required disclosures: Three of the five team members are British citizens, no non-public information has been
used in preparing this report, no member of the team has travelled to Cambridge during the project period.
Harvard Business School Microeconomics of Competiveness Cambridge IT Hardware Cluster
2
Executive summary:
This paper examines the competitive positioning of the IT hardware cluster in
Cambridge, United Kingdom. We find that despite the continued presence of a number of global
firms, such as the processor designer ARM, the cluster is struggling to reach the scale or
sophistication to be competitive. We identify that the cluster’s niche focus on R&D because of a
lack of cost competitiveness for basic assembly and manufacturing has prevented it from
achieving substantial employment growth. We also identify financing constraints which have
made it difficult for successful start-ups to grow.
While the UK provides a relatively strong place to do business more generally, we find
that recent macro-imbalances have undermined growth prospects for small and medium sized
firms both because of a shortage of capital due to deleveraging and because of concerns about
inflation. This has exacerbated underlying low productivity growth over the last decade which
we find was linked to a weak innovation infrastructure and low business investment rates.
We make a number of recommendations to upgrade the competitiveness of the cluster,
including that the UK government reconsider its abolition of the Regional Development
Authorities which has deprived the UK of the tier of government best placed to foster cluster
competitiveness. We further recommend that Cambridgeshire County Council take on a more
active role in improving local infrastructure and relaxing planning regulations to allow the
cluster to grow. We also recommend that the leading IFC in the cluster, Cambridge Enterprise,
establish contracts for collaboration with relevant parties to increase R&D expenditure and to
build stronger linkages with London VC funds so as to increase access to growth capital.
Harvard Business School Microeconomics of Competiveness Cambridge IT Hardware Cluster
3
Table of Contents:
Section 1: United Kingdom economy and competitiveness Page 4 Section 2: East of England and Cambridge competitiveness Page 11 Section 3: Competitiveness of the Cambridge IT hardware cluster Page 13 Section 4: Global competition and risks Page 29 Section 5: Recommendations for upgrading cluster competitiveness Page 32 Section 6: Bibliography and endnotes Page 34
List of figures:
Figure 1: UK exports value share and share change 2000-10 Page 4 Figure 2: UK economic performance 2000-2010 Page 5 Figure 3: UK growth pre and post crisis Page 5 Figure 4: World Bank Doing Business Rankings 2012 Page 7 Figure 5: Debt as a % GDP across sectors Page 7 Figure 6: UK National Diamond Analysis Page 9 Figure 7: GDP per worker 2010 Page 10 Figure 8: Decomposition of annual output growth for UK economy 2000-9 Page 10 Figure 9: East of England population density by local authority Page 11 Figure 10: Gross Value Added per hour worked –top English sub-regions Page 11 Figure 11: Value of total export goods as % workplace Gross Value Added Page 12 Figure 12: Product categories of IT hardware Page 13 Figure 13: UK export performance of IT related sectors 1998-2011 Page 13 Figure 14: Density of Cambridgeshire VC backed companies by postcode Page 14 Figure 15: IT hardware value chain Page 14 Figure 16: Cambridge IT hardware cluster map Page 15 Figure 17: Cambridge IT hardware cluster timeline Page 16 Figure 18: ARM timeline Page 17 Figure 19: Total ARM, Autonomy, CSR and Domino job impact on Cambridge Page 17 Figure 20: Total ARM and Domino jobs worldwide Page 17 Figure 21: Cambridge Cluster Diamond Analysis Page 18 Figure 22: Employment in IT hardware sector Page 21 Figure 23: Acquired firms Page 21 Figure 24: IPOs Page 21 Figure 25: World IT export shares Page 29 Figure 26: Comparing Cambridge to its competitors Page 29
Harvard Business School Microeconomics of Competiveness Cambridge IT Hardware Cluster
4
1. United Kingdom economy and competitiveness:
1.1. Overview of United Kingdom economy:
A EU member state, the UK has a flexible economy with strong and stable political and
legal institutions as well as world-leading universities. The UK is open to FDI and has seen
significant inflows of investment in recent years. It has also seen substantial immigration,
particularly from the new Eastern European EU members. However long-standing problems
with productivity remain; business investment in R&D lags competitor nations and
infrastructure bottlenecks inhibit development. The economy suffered during the financial crisis
and is still deleveraging.
Figure 1 – UK exports value share and share change 2000-10 for exports >$5b in 20101
The UK economy is heavily services dominated; services have increased from 74% to 78%
of GDP between 2002 and 2010.2 Unsurprisingly, given London’s reputation as a leading
financial center, financial services and business services are particularly important contributors.
Harvard Business School Microeconomics of Competiveness Cambridge IT Hardware Cluster
5
This is also reflected in the UK’s export portfolio (see Figure 1): financial services are the sector
(apart from aerospace engines) in which the UK has the biggest share of global exports at
around 18%.3 Pharmaceuticals and business services are also important sectors. Export
performance has been disappointing in recent years and the UK’s total share of world exports
declined by 1.5% between 2000 and 2010. Despite a surplus in services trade, the overall
balance of trade has been over 2% of GDP for most of the past decade.4 A strong currency may
have partially contributed to this contraction, however despite sterling weakening by around
25% since 2008, export growth has not improved suggesting wider competitiveness problems.
1.2. UK macroeconomic performance:
Figure 2 – UK economic performance 2000-20115
Figure 3 – UK growth pre and post crisis6
Between 2000 and 2010 the UK grew by an average of 3.2% per year.7 This was around
the average for advanced economies: above US rates but below Germany. Until 2008 UK
unemployment was consistently lower than in the Eurozone, at around 6% on average (see
figure 2).8 But the UK was hard hit by the financial crisis. Growth fell by over 2% in 2008. Apart
from the peripheral European economies suffering from the sovereign debt crisis, the UK has
-6%
-4%
-2%
%
2%
4%
6%
8%
10%
20
00
20
01
20
02
20
03
20
04
20
05
20
06
20
07
20
08
20
09
20
10
20
11
GDP Unemployment
-4%
-2%
0%
2%
4%
6%
8%
Ital
y
Ire
lan
d
Fin
lan
d
Spai
n
Un
ite
d K
ingd
om
Net
her
lan
ds
Swed
en
Fran
ce
Jap
an
Can
ada
Un
ite
d S
tate
s
Ger
man
y
Swit
zerl
and
Ho
ng
Ko
ng
Sin
gap
ore
CA
GR
GD
P p
er
cap
ita
gro
wth
at
PP
P
CAGR 2000-8 CAGR 2008-10
Harvard Business School Microeconomics of Competiveness Cambridge IT Hardware Cluster
6
had one of the weakest growth performances in Europe since the onset of the crisis (see figure
3). High debt levels leading to deleveraging across the public, private and financial sectors
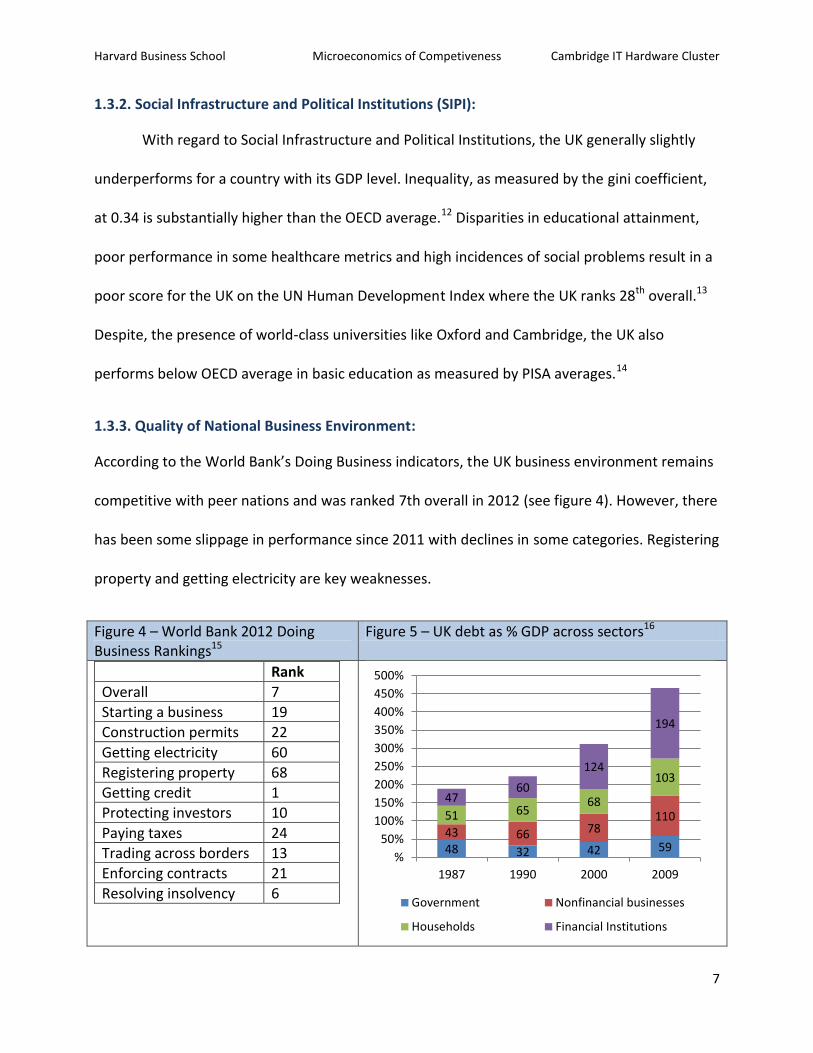
continue to restrain growth. Total combined debt now exceeds 450% of GDP – the highest ratio
among the major economies (see figure 5).9 Public sector austerity programs combined with
private sector deleveraging and a weak external export environment are depressing growth
prospects, and recovery has been slower with the UK reentering recession in Q12012.
Unemployment has risen to over 8%, and is especially high amongst the young and unskilled.10
Social unrest has been visible, most notably during the riots of summer 2011.
1.3. Competitive analysis:
1.3.1. National endowment:
The UK is geographically well positioned near the core of European economic activity,
and benefits from a time zone between the US and Asian markets. The English language is also a
major strength. The EU provides important market access to major trading partners and the UK
also benefits from historic global ties including to South Asia, Africa and Australasia. London is a
leading global city and a magnet for talented migrants, tourists and students.
The UK’s major natural resource endowments are now being exhausted. The major finds
of North Sea oil and gas discovered in the 1980s are now past their peak in terms of
production.11 In contrast with the 1990s, The UK is now a net importer of energy. However, the
long coastline and windy weather conditions means that the UK is relatively well positioned for
investment in renewable energy sources like wind.
Harvard Business School Microeconomics of Competiveness Cambridge IT Hardware Cluster
7
1.3.2. Social Infrastructure and Political Institutions (SIPI):
With regard to Social Infrastructure and Political Institutions, the UK generally slightly
underperforms for a country with its GDP level. Inequality, as measured by the gini coefficient,
at 0.34 is substantially higher than the OECD average.12 Disparities in educational attainment,
poor performance in some healthcare metrics and high incidences of social problems result in a
poor score for the UK on the UN Human Development Index where the UK ranks 28th overall.13
Despite, the presence of world-class universities like Oxford and Cambridge, the UK also
performs below OECD average in basic education as measured by PISA averages.14
1.3.3. Quality of National Business Environment:
According to the World Bank’s Doing Business indicators, the UK business environment remains
competitive with peer nations and was ranked 7th overall in 2012 (see figure 4). However, there
has been some slippage in performance since 2011 with declines in some categories. Registering
property and getting electricity are key weaknesses.
Figure 4 – World Bank 2012 Doing Business Rankings15
Figure 5 – UK debt as % GDP across sectors16
Rank
Overall 7
Starting a business 19
Construction permits 22
Getting electricity 60
Registering property 68
Getting credit 1
Protecting investors 10
Paying taxes 24
Trading across borders 13
Enforcing contracts 21
Resolving insolvency 6
48 32 42 59 43 66 78
110 51 65 68
103
47 60
124
194
%
50%
100%
150%
200%
250%
300%
350%
400%
450%
500%
1987 1990 2000 2009
Government Nonfinancial businesses
Households Financial Institutions
Harvard Business School Microeconomics of Competiveness Cambridge IT Hardware Cluster
8
Until the financial crisis, UK macroeconomic policy was widely admired on account of
low and stable interest rates, and a low debt to GDP ratio in comparison with major European
economies. However, since the crisis the outlook for UK macroeconomic policy has deteriorated
faster than any other single indicator: the UK has slipped 28 places since 2001. Large structural
deficits revealed by the crisis mean that a prolonged period of public austerity will be required
to return the budget to a sustainable position. Low interest rates indicate that investors retain
confidence in UK public finances for now, but this cannot be assumed.
1.3.4. State of Cluster Development:
Clusters help drive competitiveness across three dimensions. They help spur increases in
the level of productivity with which firms operate; they raise the capacity for innovation; and
they foster new business formation. The UK has strong clusters in financial services and business
services which collectively comprise just under 20% of total exports by value.17 Other notable
clusters include bio-pharmaceuticals, transport and logistics and aerospace engines (see Figure
1). The national government presently lacks a cluster oriented development strategy although
some specific efforts are being made to spur a renewal of hi-tech manufacturing. Strong regions
and regional institutions are often associated with competitiveness.18 The recent abolition of
Regional Development Authorities, which previously spent £1.3bn per year on skills and
business development strategy, risks removing the level of government best placed to support
cluster development.
1.3.5. Sophistication of Company Operations and Strategy:
Success depends on high quality, innovative management. UK companies have access to
sophisticated international management but business investment and uptake of managerial
Harvard Business School Microeconomics of Competiveness Cambridge IT Hardware Cluster
9
practices lag competitors. Particularly relevant for the IT industry is the innovation system. This
has some considerable strengths when compared to European competitors. For instance,
human capital as measured by new doctorates scored 147 to an EU average of 100, likewise
access venture capital scored at 243. However, there are weaknesses in the introduction of
innovations in SMEs and in intellectual assets such as patent applications.19
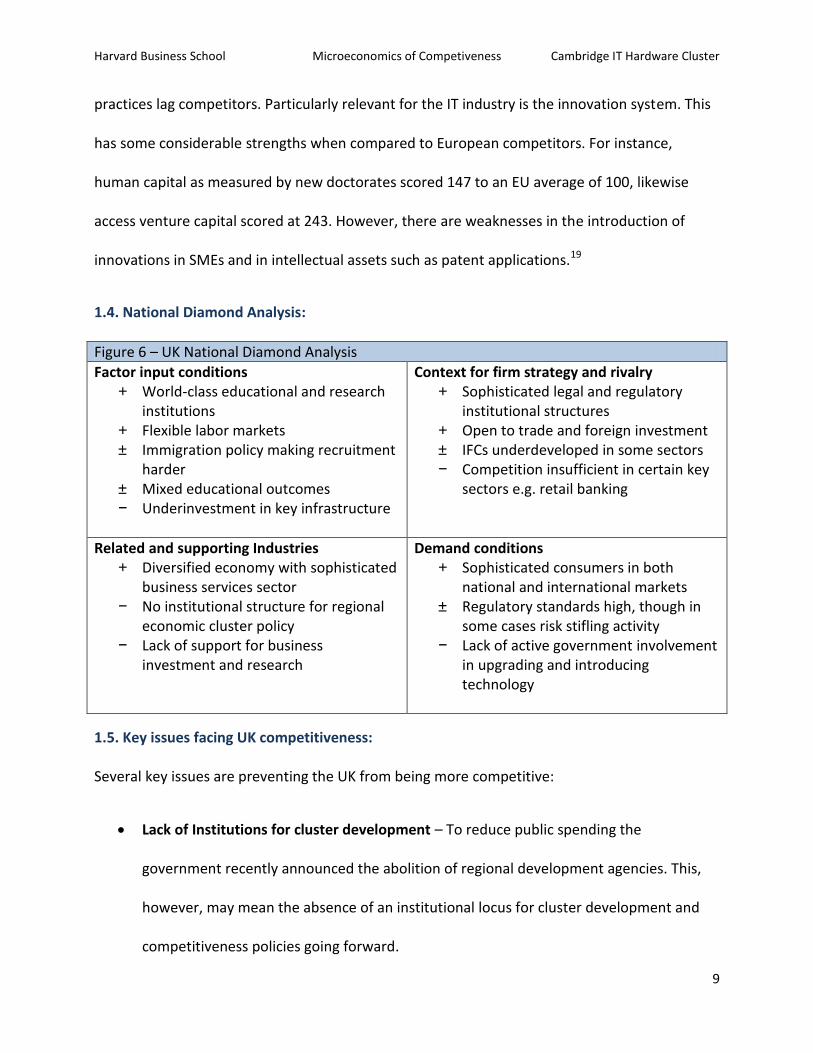
1.4. National Diamond Analysis:
Figure 6 – UK National Diamond Analysis
Factor input conditions + World-class educational and research
institutions + Flexible labor markets ± Immigration policy making recruitment
harder ± Mixed educational outcomes − Underinvestment in key infrastructure
Context for firm strategy and rivalry + Sophisticated legal and regulatory
institutional structures + Open to trade and foreign investment ± IFCs underdeveloped in some sectors − Competition insufficient in certain key
sectors e.g. retail banking
Related and supporting Industries + Diversified economy with sophisticated
business services sector − No institutional structure for regional
economic cluster policy − Lack of support for business
investment and research
Demand conditions + Sophisticated consumers in both
national and international markets ± Regulatory standards high, though in
some cases risk stifling activity − Lack of active government involvement
in upgrading and introducing technology
1.5. Key issues facing UK competitiveness:
Several key issues are preventing the UK from being more competitive:
Lack of Institutions for cluster development – To reduce public spending the
government recently announced the abolition of regional development agencies. This,
however, may mean the absence of an institutional locus for cluster development and
competitiveness policies going forward.
Harvard Business School Microeconomics of Competiveness Cambridge IT Hardware Cluster
10
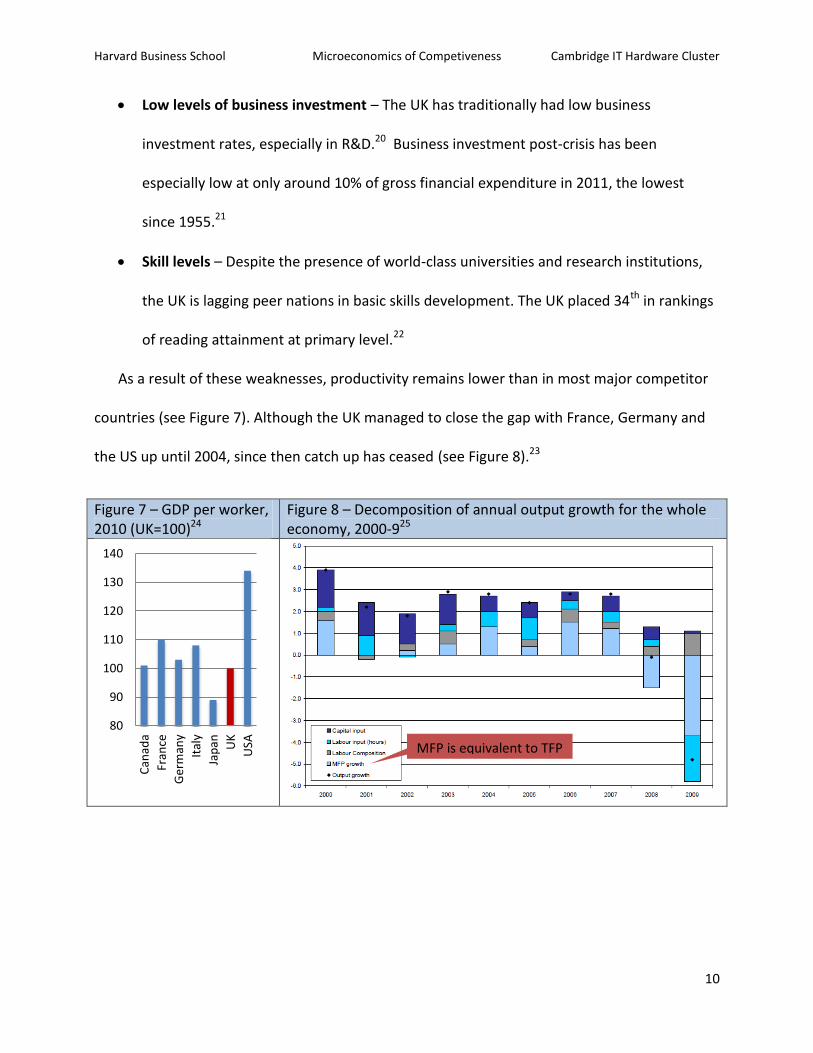
Low levels of business investment – The UK has traditionally had low business
investment rates, especially in R&D.20 Business investment post-crisis has been
especially low at only around 10% of gross financial expenditure in 2011, the lowest
since 1955.21
Skill levels – Despite the presence of world-class universities and research institutions,
the UK is lagging peer nations in basic skills development. The UK placed 34th in rankings
of reading attainment at primary level.22
As a result of these weaknesses, productivity remains lower than in most major competitor
countries (see Figure 7). Although the UK managed to close the gap with France, Germany and
the US up until 2004, since then catch up has ceased (see Figure 8).23
Figure 7 – GDP per worker, 2010 (UK=100)24
Figure 8 – Decomposition of annual output growth for the whole economy, 2000-925
80
90
100
110
120
130
140
Can
ada
Fran
ce
Ger
man
y
Ital
y
Jap
an UK
USA MFP is equivalent to TFP

Harvard Business School Microeconomics of Competiveness Cambridge IT Hardware Cluster
11
2. Overview of East of England and Cambridge:
The East of England contains around 5.8m people (11% UK population) and is the third
wealthiest part of the United Kingdom after London and the South East.2627 The region has
historic roots in agriculture but has also attracted significant light manufacturing since the
Second World War despite the overall decline in UK manufacturing.
Figure 9 – East of England population density by local authority, 200528
Figure 10 – Gross Value Added per hour worked –top English sub-regions, 2008 (UK = 100)29
Cambridge is a major town in the East of England (see Figure 9) and is approximately 75
minutes by train from London and has a population of around 125,000.30 The Cambridge sub-
region is one of the most productive sub-regions in the UK (see Figure 10). The University of
Cambridge is the heart of the sub-region, and as the fifth best university in the world provides
access to world in high R&D spending; businesses in the East of England have historically spent
around 3.2% of GDP on R&D compared to a UK average of only 1.7%.31 While the East of
England number is high compared to national averages in the US of 2.3% and Germany of 2.6%,
it is low compared to states with strong university-industry links like Massachusetts (5.5%) and
California (4.2%).32
Harvard Business School Microeconomics of Competiveness Cambridge IT Hardware Cluster
12
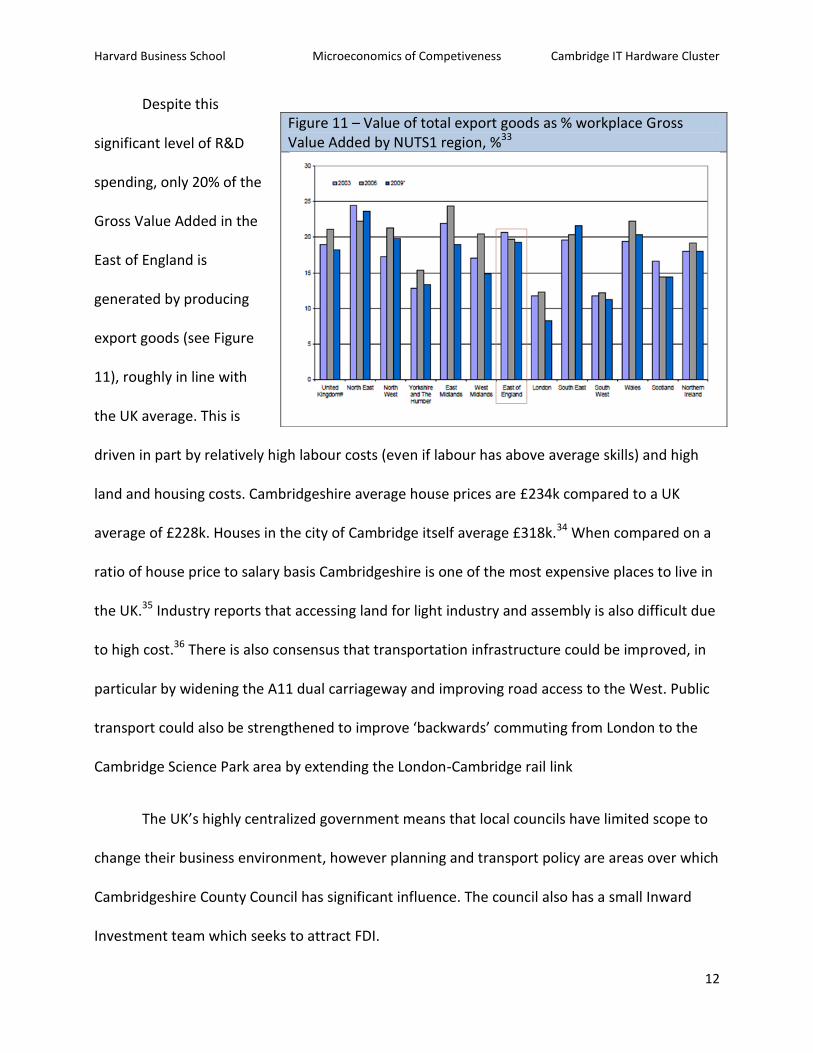
Despite this
significant level of R&D
spending, only 20% of the
Gross Value Added in the
East of England is
generated by producing
export goods (see Figure
11), roughly in line with
the UK average. This is
driven in part by relatively high labour costs (even if labour has above average skills) and high
land and housing costs. Cambridgeshire average house prices are £234k compared to a UK
average of £228k. Houses in the city of Cambridge itself average £318k.34 When compared on a
ratio of house price to salary basis Cambridgeshire is one of the most expensive places to live in
the UK.35 Industry reports that accessing land for light industry and assembly is also difficult due
to high cost.36 There is also consensus that transportation infrastructure could be improved, in
particular by widening the A11 dual carriageway and improving road access to the West. Public
transport could also be strengthened to improve ‘backwards’ commuting from London to the
Cambridge Science Park area by extending the London-Cambridge rail link
The UK’s highly centralized government means that local councils have limited scope to
change their business environment, however planning and transport policy are areas over which
Cambridgeshire County Council has significant influence. The council also has a small Inward
Investment team which seeks to attract FDI.
Figure 11 – Value of total export goods as % workplace Gross Value Added by NUTS1 region, %33
Harvard Business School Microeconomics of Competiveness Cambridge IT Hardware Cluster
13
3. Competitiveness of the Cambridge IT Hardware Cluster
3.1. Overview of IT hardware sector:
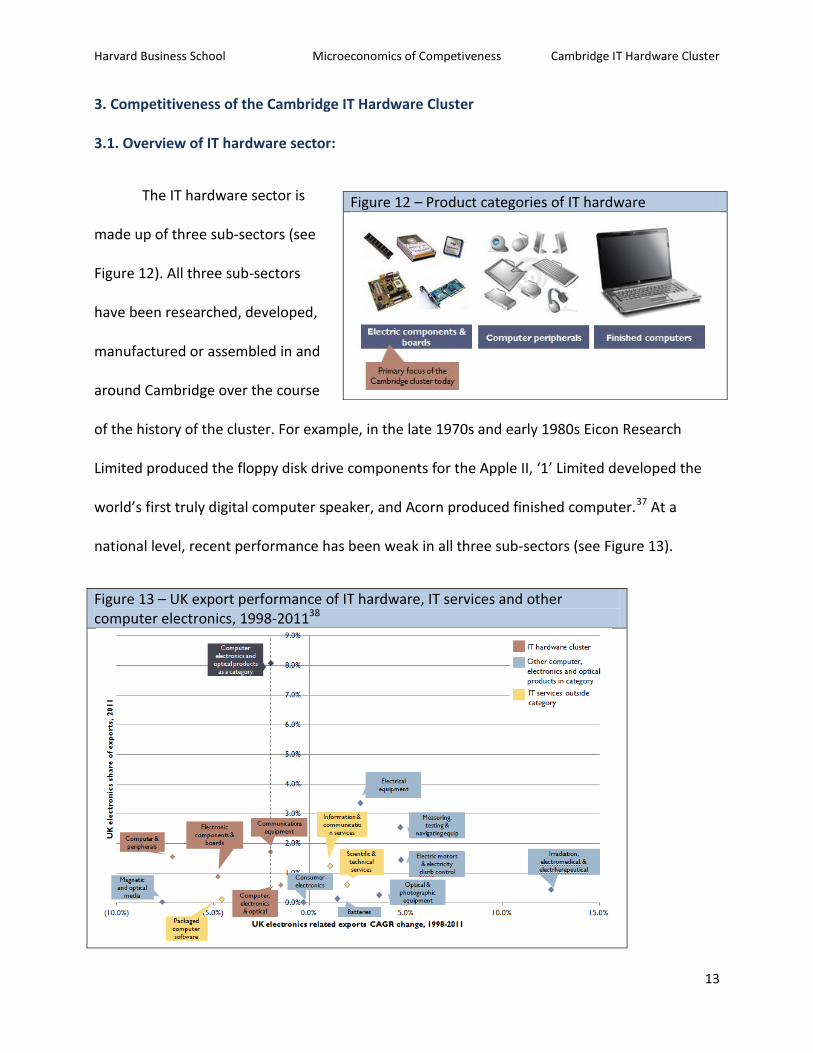
The IT hardware sector is
made up of three sub-sectors (see
Figure 12). All three sub-sectors
have been researched, developed,
manufactured or assembled in and
around Cambridge over the course
of the history of the cluster. For example, in the late 1970s and early 1980s Eicon Research
Limited produced the floppy disk drive components for the Apple II, ‘1’ Limited developed the
world’s first truly digital computer speaker, and Acorn produced finished computer.37 At a
national level, recent performance has been weak in all three sub-sectors (see Figure 13).
Figure 13 – UK export performance of IT hardware, IT services and other computer electronics, 1998-201138
Figure 12 – Product categories of IT hardware

Harvard Business School Microeconomics of Competiveness Cambridge IT Hardware Cluster
14
3.2. Overview of Cambridge IT hardware cluster:
3.2.1. Introduction to cluster:
The IT hardware cluster in Cambridge emerged in the 1970s around the Cambridge
Science Park (see Figure 14) and continued to grow, in fits and spurts, until the dot-com bubble
of the early 2000s, from which it eventually
recovered. Since its inception, it has depended
on the University of Cambridge as a source of
ideas, talent, and even premises since the
Cambridge colleges built science and industrial
parks on their own land holdings.
In the last decade assembly operations
have increasingly been outsourced while design
and research has remained in Cambridge (see
Figure 15). Leading sub-component manufacturers include ARM and CSR. Related industries like
software have gained prominence, resulting in increased competition for the key inputs of
talent and capital.
Figure 14 – Density of Cambridgeshire VC backed companies by postcode39
Figure 15 – IT hardware value chain
Research & Development
Production of sub-
components
Inventory management
Production / Manufacturing
Product delivery
Marketing & advertising
Technocal support
Cambridge Science Park
Central Cambridge ARM
Harvard Business School Microeconomics of Competiveness Cambridge IT Hardware Cluster
15
3.2.2. Cluster map:
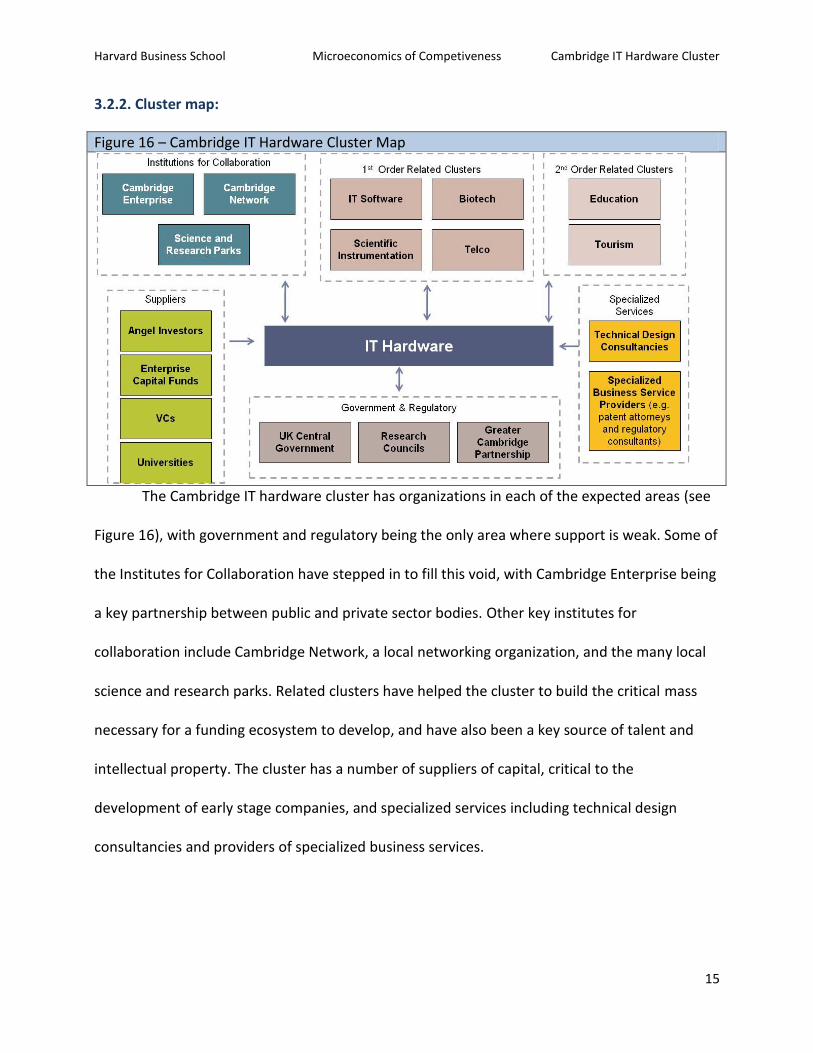
The Cambridge IT hardware cluster has organizations in each of the expected areas (see
Figure 16), with government and regulatory being the only area where support is weak. Some of
the Institutes for Collaboration have stepped in to fill this void, with Cambridge Enterprise being
a key partnership between public and private sector bodies. Other key institutes for
collaboration include Cambridge Network, a local networking organization, and the many local
science and research parks. Related clusters have helped the cluster to build the critical mass
necessary for a funding ecosystem to develop, and have also been a key source of talent and
intellectual property. The cluster has a number of suppliers of capital, critical to the
development of early stage companies, and specialized services including technical design
consultancies and providers of specialized business services.
Figure 16 – Cambridge IT Hardware Cluster Map
Harvard Business School Microeconomics of Competiveness Cambridge IT Hardware Cluster
16
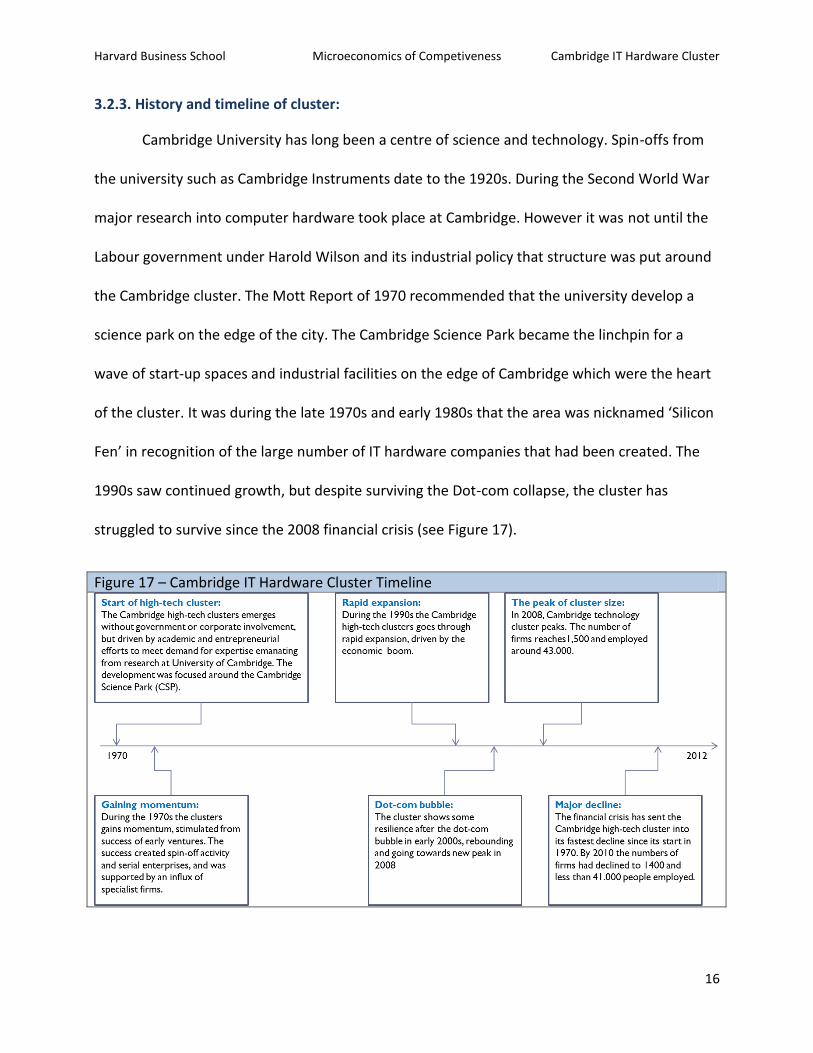
3.2.3. History and timeline of cluster:
Cambridge University has long been a centre of science and technology. Spin-offs from
the university such as Cambridge Instruments date to the 1920s. During the Second World War
major research into computer hardware took place at Cambridge. However it was not until the
Labour government under Harold Wilson and its industrial policy that structure was put around
the Cambridge cluster. The Mott Report of 1970 recommended that the university develop a
science park on the edge of the city. The Cambridge Science Park became the linchpin for a
wave of start-up spaces and industrial facilities on the edge of Cambridge which were the heart
of the cluster. It was during the late 1970s and early 1980s that the area was nicknamed ‘Silicon
Fen’ in recognition of the large number of IT hardware companies that had been created. The
1990s saw continued growth, but despite surviving the Dot-com collapse, the cluster has
struggled to survive since the 2008 financial crisis (see Figure 17).
Figure 17 – Cambridge IT Hardware Cluster Timeline
Harvard Business School Microeconomics of Competiveness Cambridge IT Hardware Cluster
17
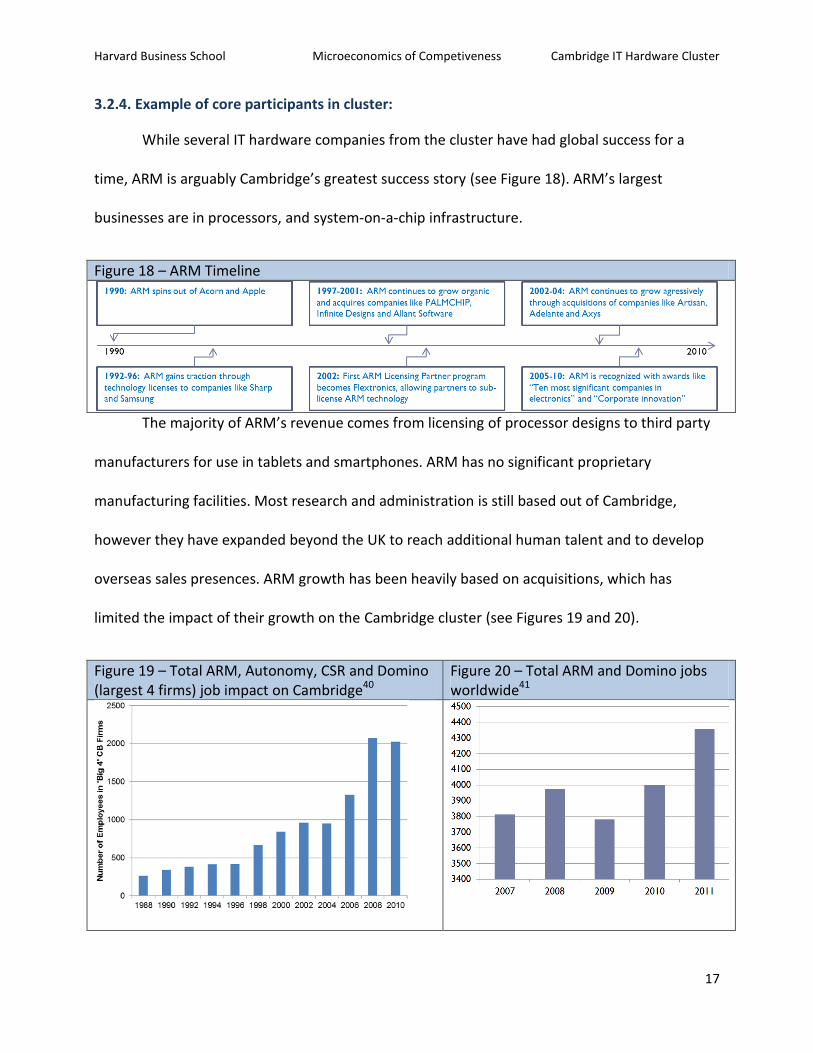
3.2.4. Example of core participants in cluster:
While several IT hardware companies from the cluster have had global success for a
time, ARM is arguably Cambridge’s greatest success story (see Figure 18). ARM’s largest
businesses are in processors, and system-on-a-chip infrastructure.
Figure 18 – ARM Timeline
The majority of ARM’s revenue comes from licensing of processor designs to third party
manufacturers for use in tablets and smartphones. ARM has no significant proprietary
manufacturing facilities. Most research and administration is still based out of Cambridge,
however they have expanded beyond the UK to reach additional human talent and to develop
overseas sales presences. ARM growth has been heavily based on acquisitions, which has
limited the impact of their growth on the Cambridge cluster (see Figures 19 and 20).
Figure 19 – Total ARM, Autonomy, CSR and Domino (largest 4 firms) job impact on Cambridge40
Figure 20 – Total ARM and Domino jobs worldwide41
Harvard Business School Microeconomics of Competiveness Cambridge IT Hardware Cluster
18
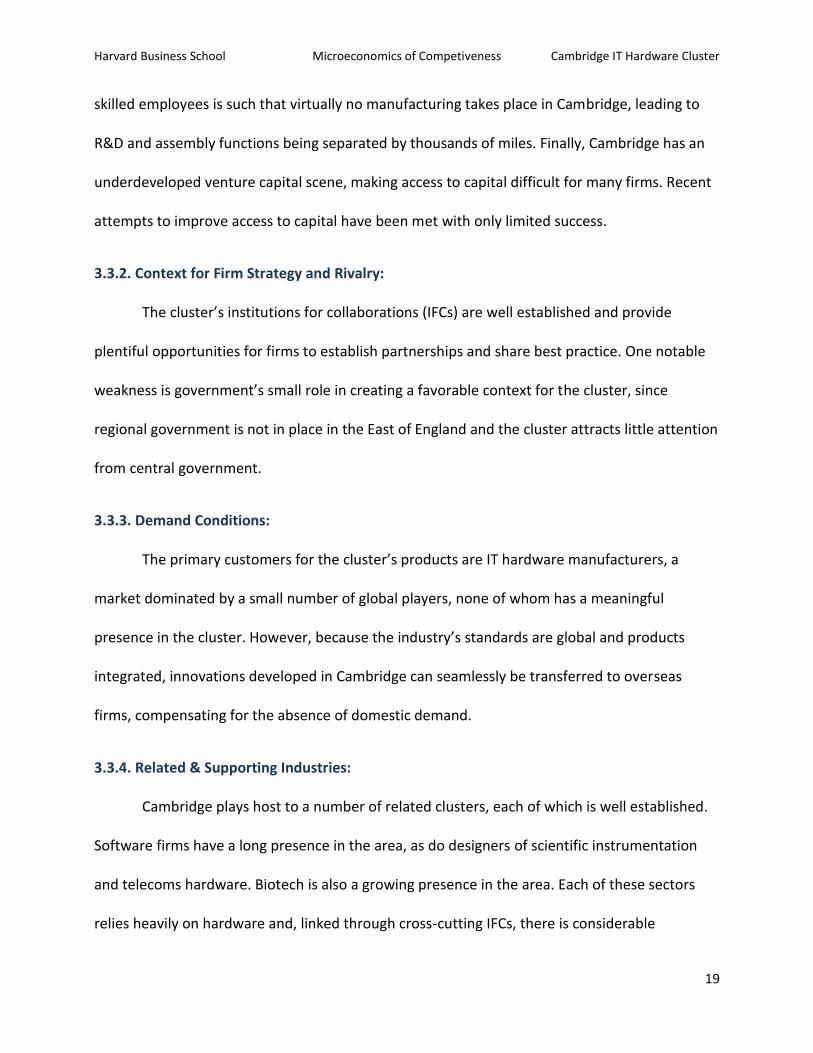
3.3. Cluster diamond analysis:
Figure 21: Cambridge Cluster Diamond Analysis
Factor input conditions + University of Cambridge provides
world-class talent pool + University also ensures pipeline of
ideas that can be commercialized ± High quality of life attracts talented
workers but cost of living is a problem ± Underdeveloped venture capital
presence but three active angel investors and two Enterprise Capital Funds
− High labor costs lead to outsourced manufacturing
Context for firm strategy and rivalry + Developed and established IFCs − Lack of regional government or other
sub-national actor limits policy responsiveness to cluster’s concerns
Related and supporting Industries + Established software cluster + Presence of scientific instrumentation
cluster + Telco cluster in Cambridge + Emerging biotech cluster + Advanced specialized business service
providers ± Presence of limited number of
technical design consultancies
Demand conditions + Internationally-adopted standards
mean Cambridge-developed innovations are valuable to buyers worldwide
− Few major IT MNCs have operations nearby, making it harder for small firms with innovations to access the major players (Apple, Dell, Hewlett-Packard, etc.)
3.3.1. Factor conditions:
The University of Cambridge, as well as being the genesis of the cluster, has an
important continuing role as a provider of highly trained human capital and market-ready
innovations. Indeed, many of the cluster’s most successful firms stem directly from work
undertaken at the university. Retaining talent in the Cambridge area, however, remains a
challenge, in part because of London’s strong pull due to its outsized role in Britain’s economic
and cultural life. Although the quality of life in Cambridge is high, costs are comparable to the
capital, reducing the area’s attractiveness. Also on the labor side, the cost of employing low-
Harvard Business School Microeconomics of Competiveness Cambridge IT Hardware Cluster
19
skilled employees is such that virtually no manufacturing takes place in Cambridge, leading to
R&D and assembly functions being separated by thousands of miles. Finally, Cambridge has an
underdeveloped venture capital scene, making access to capital difficult for many firms. Recent
attempts to improve access to capital have been met with only limited success.
3.3.2. Context for Firm Strategy and Rivalry:
The cluster’s institutions for collaborations (IFCs) are well established and provide
plentiful opportunities for firms to establish partnerships and share best practice. One notable
weakness is government’s small role in creating a favorable context for the cluster, since
regional government is not in place in the East of England and the cluster attracts little attention
from central government.
3.3.3. Demand Conditions:
The primary customers for the cluster’s products are IT hardware manufacturers, a
market dominated by a small number of global players, none of whom has a meaningful
presence in the cluster. However, because the industry’s standards are global and products
integrated, innovations developed in Cambridge can seamlessly be transferred to overseas
firms, compensating for the absence of domestic demand.
3.3.4. Related & Supporting Industries:
Cambridge plays host to a number of related clusters, each of which is well established.
Software firms have a long presence in the area, as do designers of scientific instrumentation
and telecoms hardware. Biotech is also a growing presence in the area. Each of these sectors
relies heavily on hardware and, linked through cross-cutting IFCs, there is considerable

Harvard Business School Microeconomics of Competiveness Cambridge IT Hardware Cluster
20
integration between the sectors. They also share similar policy concerns, allowing them to band
together and speak with a louder voice in front of central government. Supporting industries
have a well developed presence, most particularly in the professional services sector, which is
highly developed in the London region; key industries include law (including patent law) and
finance. Another important set of players is the reasonably extensive network of Technical
Design Consultancies (TDCs), although their numbers are well below competing clusters like
Silicon Valley or Greater Boston.
3.4. Cluster performance analysis:
Over the last 20 years, the Cambridge IT Hardware cluster has been very successful.
However, the last few years of financial crisis have sent the overall cluster into decline.
Strengths: Weaknesses:
Major university at its center, constantly generating new ideas and skilled workers
Established brand name and reputation
Location: part of southeast England super-region; 60 miles from London
High quality of life and attractiveness to high-skilled labor
Access to finance: less VC activity than strongest competitors
Relocation: firms have been moving to Silicon Valley/ Boston once they reach a certain size
High cost of living
Lack of transportation capacity; high congestion
Absence of regional government limits coordination and policy flexibility
3.4.1. Cluster performance data:
The IT Hardware cluster has diminished, which in recent years can be seen especially in
the number of firms. This fell from ~900 in 1996 to less than 500 in 2010 (see Figure 22). While
employment remained strong, driven by growth of successful companies like ARM, CSR and
Domino, few new companies have been introduced in IT hardware since 2003 (see Figure 23).

Harvard Business School Microeconomics of Competiveness Cambridge IT Hardware Cluster
21
More growth has been seen in adjacent clusters like biotechnology and pure R&D, with limited
spillover benefits to the IT hardware cluster.
Figure 22 – Employment in IT hardware sector42
Figure 23 – Company start / entries in Cambridge43
Another indicator of vitality in the cluster has been the number of firms reaching
sufficient scale to need outside financing either through an IPO or through being acquired (see
Figures 23 and 24). Of particular note is that CSR and ARM have made acquisitions of other
Cambridge IT hardware cluster firms which suggest strong ties within the cluster.
Figure 23 – Acquired firms44 Figure 24 – IPOs45
Year of acquisition
Target company
Acquirer Acquisition value (£m)
2008 nCipher plc Thales plc 51
2007 Cambridge Display Technology plc
Sumitomo Chemical
142
2005 I2 Ltd ChoicePoint Inc
53
2005 UbiNetics CSR plc 27
2005 Apama Ltd Progress Software Corporation
14
Year of IPO
Company IPO value (£m)
2007 Sepura plc 99.54
2004 Cambridge Display Technology
142
2004 Cambridge Silicon Radio (CSR) plc
434.45
2004 Arnino Technologies plc 31.8
1998 ARM Holdings plc 1,424.60
1985 Domino Printing Services plc
325.25
Harvard Business School Microeconomics of Competiveness Cambridge IT Hardware Cluster
22
3.5. Role of policy, Finance and IFCs:
3.5.1. Policy conditions:
Government involvement in the Cambridge cluster has been weak, as the UK has no
regional government. While the Wilson government may have given impetus to the
formalization of the cluster in 1970, UK central government largely took a laissez-faire policy
once the cluster was in place. The greatest contribution made by the central government was
the relaxation of certain rules on the acquisition of British companies by foreign firms.
Historically, new small-size enterprises received limited support from large British enterprises.
Access to foreign capital was therefore key to the development of these enterprises, and this
was enabled by the more relaxed regime.
Another important contribution from central government came in the form of research
councils. These are bodies are responsible in the UK for investing public money to “advance
knowledge and generate new ideas which lead to a productive economy, healthy society and
contribute to a sustainable world”. In 1986, UK universities were granted the rights to the
intellectual property arising from work funded by the research councils. The University of
Cambridge was unusual in vesting this entitlement to inventors on its staff and did not prevent
faculty members from developing commercial applications or starting new businesses as long as
they carried out their teaching and research duties. This decision was critical to the
development of many new startups in Cambridge, and indeed to the development of the cluster
itself. 50
Finally, although there is no strong regional government in the UK, in Cambridge, the
Greater Cambridge Partnership emerged to fill the void. The partnership was formed with the
Harvard Business School Microeconomics of Competiveness Cambridge IT Hardware Cluster
23
aim of bringing together local firms and community groups to help develop business in the area.
Among its key activities was sourcing funding for infrastructure critical to the development of
the cluster.51
3.5.2. Universities conditions:
The two Cambridge based universities, the University of Cambridge and Anglia Ruskin
University, play an important role in the cluster, between them educating over 49,000 students.
While both universities provide a significant undergraduate resource, the University of
Cambridge is especially valuable in providing postgraduates, with almost 11,000 postgraduate
students, 6,635 of which are undertaking research only degrees. This provides a highly skilled
labour pool that can feed into the companies in the Cambridge cluster, as well as providing a
source of entrepreneurs who may end up forming companies of their own.47
The income from universities can also be used towards academic research which helps
to increase the knowledge-base of the cluster, and new technologies which can be
commercialized through licensing or the creation of new companies. The formation of many
companies active in the Cambridge IT hardware cluster can be traced back to the Computer
Laboratory or Department of Physics at the University of Cambridge – companies like Acorn,
ARM and ANT draw heavily on an understanding of microelectronics developed at these
facilities.47
3.5.3. Finance conditions:
Cambridge has a reasonably well developed financing system, however sources of
capital become more difficult to come by as investment size increases. At the early stage level,
Harvard Business School Microeconomics of Competiveness Cambridge IT Hardware Cluster
24
Cambridge is in the advantageous position of having three main angel groups to provide
financing.
NW Brown manages the GEIF Ventures Early Growth Fund, a £5m co-investment fund
that invests in promising early growth businesses. Since it was founded in 2003, GEIF Ventures
has invested in 22 companies, mostly within the healthcare, life sciences and information
technology sectors. They invest an average of £70,000 per funding round (thereby meeting a
critical need for companies requiring smaller chunks of capital). Their key investments in IT
Hardware include Inkski, a novel printing technology that has the potential to overcome the
limitations facing both inkjet and offset printing and create a new revolution in digital printing,
and Artimi, a developer of ultra wideband chips. 47
Cambridge Capital Group has made 25 investments, mostly in technology and
lifesciences, many of which have been University of Cambridge spin-outs. Their key investments
in IT Hardware include Gen Drive, a company that has developed groundbreaking, real-world
technology that is able to capture energy from any renewable power source and then feed that
energy into the grid. 47
Cambridge Angels, which was established in 2001, have invested over £11.5m in 33
start-up companies, primarily in the hi-tech and biotech sectors. Their recent investment s
include Neul, developers of the world’s first, and as of now only, fully FCC compliant white space
wireless system. 47
Cambridge is also a great location for companies seeking “in between” amounts of
capital (i.e. more than angel investors can provide, but amounts that are too small to pique the
Harvard Business School Microeconomics of Competiveness Cambridge IT Hardware Cluster
25
interest of VCs). Enterprise Capital Funds (ECFs), two of which are in Cambridge, were set up by
the government to address the market weakness in providing funding to SMEs. These vehicles
use government money alongside private sector funds, to target investments of ~£2m. Only five
funds were set up initially, so it is a significant coup for Cambridge to have two of them (the “IQ
Capital Fund” and the “Amadeus and Angels Seed Fund”) 47
There are only 2 VCs located within Cambridge itself, Amadeus Capital and DJF Espirit,
however the cities close proximity to London means that local firms can also avail of the larger
financing ecosystem there. 47
Amadeus Capital invests across the technology spectrum in industries that include
communications and networking, media, e-commerce, computer hardware and software,
medtech, and cleantech. The firm was started in 1997 and manages £460m in a portfolio of
around 40 companies. They are an investor in Cambridge Silicon Radio, one of Cambridge
cluster’s biggest success stories. DJF Espirit manages a portfolio of 35 companies. It has $500m
of capital under management and invests in technology, media, telecoms and cleantech. 47
3.5.4. IFC conditions:
Cambridge has a long history of Institutions for Collaboration, and these were critical to
the development of the cluster.
Science and research parks provide space for new start-ups side by side with more
established firms, helping the development of the new firms and allowing them to take full
advantage of the clustering effect. Two of the most important of these are Cambridge Science
Park and St. John’s Innovation Center. Cambridge Science Park was founded by Trinity College in
Harvard Business School Microeconomics of Competiveness Cambridge IT Hardware Cluster
26
1970 as an incubator for spin off companies. It was the first of its kind in the UK and was home
to over 100 companies. St. John’s Innovation Center was founded in 1987 by St. John’s College
and is home to over 60 companies. The incubator provides management support in addition to
premises and also offers conference facilities and a rented address to 265 other companies
without permanent space onsite.47
Another important institute for collaboration is Cambridge Network, a networking
organization for business people and academics working in technology fields in the area. It
boasts 1300 member organizations, as well as a number of individuals, and is entirely funded by
membership subscriptions and sponsorship. Its key activities and benefits of membership
include: access to discounts on products and services; more than 40 networking events per
year; a Linkedin group for referrals and discussions; the region’s most visited website for jobs,
news and events; a comprehensive directory of company profiles; the Cambridge Corporate
Gateway - an information website dedicated to matching external organization's technological
requirement to companies in the Cambridge area; and a learning ecosystem where local
companies can pool training resources. 47, 49
The final key institute for collaboration is Cambridge Enterprise, a wholly owned
subsidiary of the University of Cambridge responsible for commercialization arrangements for
university discoveries. The organization operates in three areas: technology transfer services,
consultancy services and provision of pre-seed and seed stage funds for members of the
University of Cambridge. 48
3.5.5. Specialized services:
Harvard Business School Microeconomics of Competiveness Cambridge IT Hardware Cluster
27
The main source of specialized services in the cluster is the technical design
consultancies. Major consultancies include Cambridge Consultants, TTP, Sagentia and the PA
Consulting Group. These firms provide a breeding ground for entrepreneurship, as technology
innovators are developing products from concept through to market success. They typically
engage in prototyping and small-scale production as well as in an advisory role. In additional to
technical design consultancies, the cluster also has an ecosystem of patent attorneys and other
providers of specialized services of importance to the IT Hardware cluster. 36
3.6. Related clusters:
A number of what we call first order related clusters are present in Cambridge. These
include IT Software, Biotechnology, Scientific Instrumentation and Telecommunications. The
most significant contribution of these related clusters is that they provide critical mass to enable
a VC ecosystem and other support services to develop in the cluster. There is also some talent
transfer between clusters. 47
We term tourism and education second order related clusters, however they are also
vital to the development of the IT hardware cluster. The education cluster, as outlined above,
provides a key source of intellectual property and human capital. Also because of the tourism
cluster, Cambridge is a more attractive place to live than many other UK cities of comparable
size. Significant investment has been made in improving the city centre environment (e.g. in the
Grand Arcade retail district and in leisure amenities around the old cattle market site) and
cultural offerings (inc theatres, concerts, festivals etc.) are more diverse than in other cities of
similar size 47, 36
Harvard Business School Microeconomics of Competiveness Cambridge IT Hardware Cluster
28
London, as a neighboring location of many important clusters, is also critical to the
success of the Cambridge IT Hardware cluster. In many respects, Cambridge shares London’s
labour market and this is a source of tremendous competitive advantage. Firstly, London
provides a more vibrant living environment. Certain people would be impossible to recruit if
they were forced to live outside a major city – reverse commuting allows Cambridge based
start-ups to continue to recruit people for whom the buzz of living in London is a major draw.
Secondly, London gives Cambridge based companies access to additional specialized skills. Some
areas of expertise, such as in highly specialized disciplines of marketing or management, are
next to impossible to source locally in Cambridge. 47
Cambridge also benefits from London’s highly developed transportation cluster (5 major
airports, high speed rail link to Paris and Brussels) which facilitates quick and easy access to
suppliers, customers, investors and talent located overseas (e.g. in Silicon Valley). Finally,
Cambridge benefits significantly from London’s financial cluster. Although Cambridge does have
two local VCs, the financial sector in the UK is very London centric with the vast majority of VCs
operating there. 36
Harvard Business School Microeconomics of Competiveness Cambridge IT Hardware Cluster
29
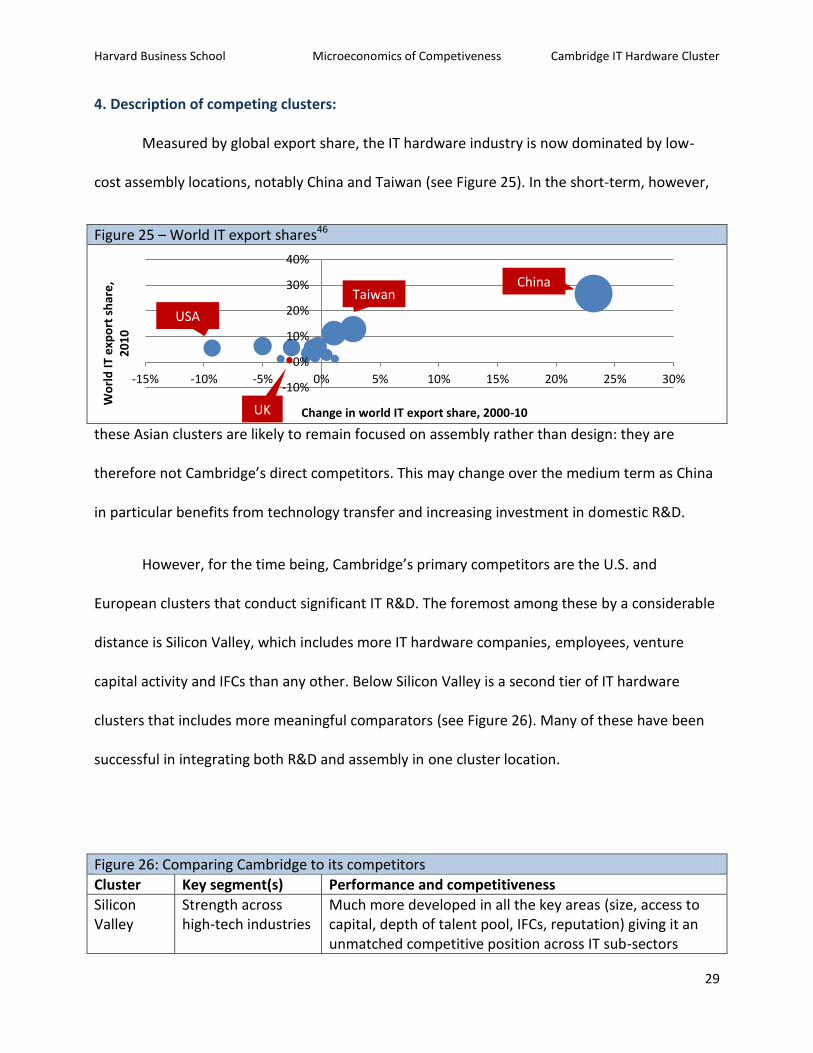
4. Description of competing clusters:
Measured by global export share, the IT hardware industry is now dominated by low-
cost assembly locations, notably China and Taiwan (see Figure 25). In the short-term, however,
Figure 25 – World IT export shares46
these Asian clusters are likely to remain focused on assembly rather than design: they are
therefore not Cambridge’s direct competitors. This may change over the medium term as China
in particular benefits from technology transfer and increasing investment in domestic R&D.
However, for the time being, Cambridge’s primary competitors are the U.S. and
European clusters that conduct significant IT R&D. The foremost among these by a considerable
distance is Silicon Valley, which includes more IT hardware companies, employees, venture
capital activity and IFCs than any other. Below Silicon Valley is a second tier of IT hardware
clusters that includes more meaningful comparators (see Figure 26). Many of these have been
successful in integrating both R&D and assembly in one cluster location.
Figure 26: Comparing Cambridge to its competitors
Cluster Key segment(s) Performance and competitiveness
Silicon Valley
Strength across high-tech industries
Much more developed in all the key areas (size, access to capital, depth of talent pool, IFCs, reputation) giving it an unmatched competitive position across IT sub-sectors
-10%
0%
10%
20%
30%
40%
-15% -10% -5% 0% 5% 10% 15% 20% 25% 30%
Wo
rld
IT e
xpo
rt s
har
e,
20
10
Change in world IT export share, 2000-10 UK
China
USA
Taiwan
Harvard Business School Microeconomics of Competiveness Cambridge IT Hardware Cluster
30
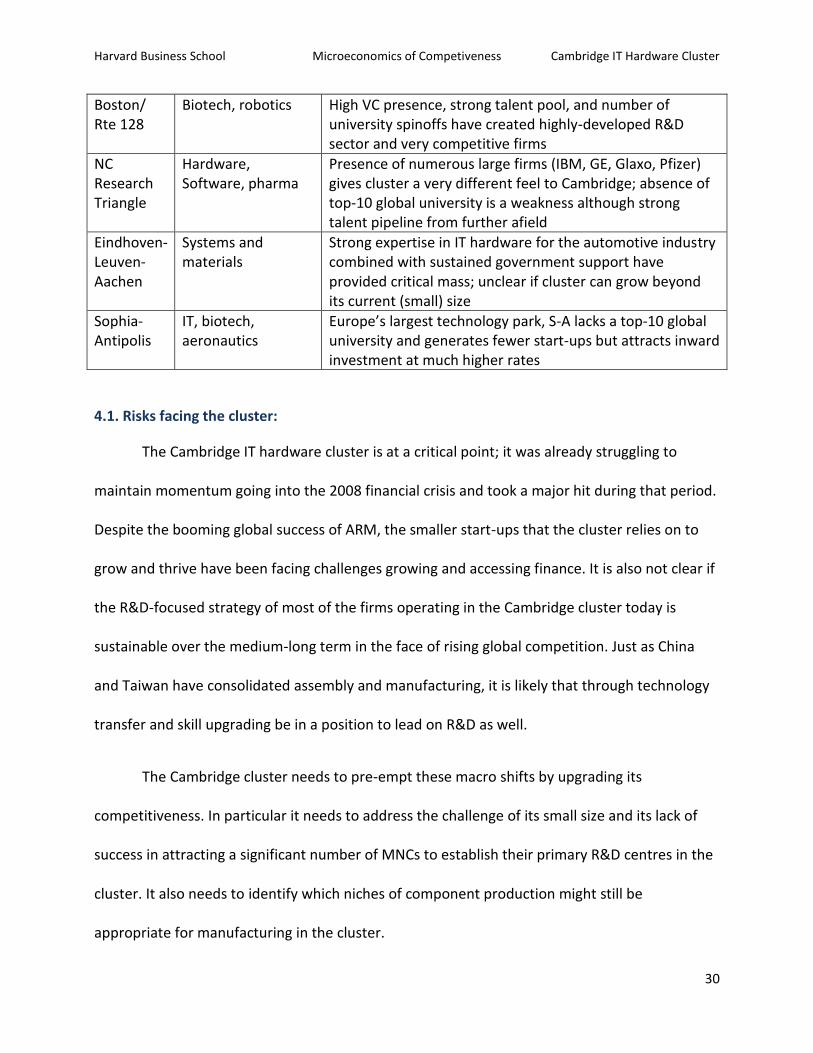
Boston/ Rte 128
Biotech, robotics High VC presence, strong talent pool, and number of university spinoffs have created highly-developed R&D sector and very competitive firms
NC Research Triangle
Hardware, Software, pharma
Presence of numerous large firms (IBM, GE, Glaxo, Pfizer) gives cluster a very different feel to Cambridge; absence of top-10 global university is a weakness although strong talent pipeline from further afield
Eindhoven-Leuven-Aachen
Systems and materials
Strong expertise in IT hardware for the automotive industry combined with sustained government support have provided critical mass; unclear if cluster can grow beyond its current (small) size
Sophia-Antipolis
IT, biotech, aeronautics
Europe’s largest technology park, S-A lacks a top-10 global university and generates fewer start-ups but attracts inward investment at much higher rates
4.1. Risks facing the cluster:
The Cambridge IT hardware cluster is at a critical point; it was already struggling to
maintain momentum going into the 2008 financial crisis and took a major hit during that period.
Despite the booming global success of ARM, the smaller start-ups that the cluster relies on to
grow and thrive have been facing challenges growing and accessing finance. It is also not clear if
the R&D-focused strategy of most of the firms operating in the Cambridge cluster today is
sustainable over the medium-long term in the face of rising global competition. Just as China
and Taiwan have consolidated assembly and manufacturing, it is likely that through technology
transfer and skill upgrading be in a position to lead on R&D as well.
The Cambridge cluster needs to pre-empt these macro shifts by upgrading its
competitiveness. In particular it needs to address the challenge of its small size and its lack of
success in attracting a significant number of MNCs to establish their primary R&D centres in the
cluster. It also needs to identify which niches of component production might still be
appropriate for manufacturing in the cluster.
Harvard Business School Microeconomics of Competiveness Cambridge IT Hardware Cluster
31
The cluster also faces challenges with its labour supply, both in terms of rising wages and
in terms of skill shortages. Both of these challenges are being exacerbated by central
government caps on skilled non-EU immigration which is bidding up wage rates for IT engineers.
However there is an underlying challenge that many young engineers are opting for software
training instead of hardware, and courses at technical universities are adjusting to meet this
demand. The cluster has few on-the-job apprenticeship programs to fill this gap directly.
Even where firms are able to find talent and a niche in the R&D space, they are
struggling to grow to scale in part because of challenges with finance. While London has a
reasonably strong VC network, the Cambridge cluster is often ineffective at accessing it.
Deleveraging by banks across the UK has made them unwilling to lend to SMEs in general and
many firms in the Cambridge cluster are finding debt financing difficult.
The lack of government support for the cluster is also a challenge, in particular given that
the abolition of the Regional Development Agencies has left regional development strategy in
unclear hands. Government has provided no overall strategy for competitiveness beyond deficit
reduction and tax cuts for businesses. Given that these policies have not translated into greater
lending to businesses or dealt with the underlying problems of high costs and poor
infrastructure a change of approach is needed.
Finally on the local level, Cambridge is an increasingly expensive area both for workers
and for firms to operate in. High land prices, an unwillingness to relax planning regulations, and
inadequate transport infrastructure are challenges to the growth of the cluster.

Harvard Business School Microeconomics of Competiveness Cambridge IT Hardware Cluster
32
5. Recommendations for the cluster:
Challenge Priority Timing Recommendation Resp. actor
Cluster is too small High ST Integrate Cambridge IFCs with similar bodies in London and Oxford to create a ‘Golden Triangle’ super-cluster
Cambridge Enterprise
Successful companies’ local growth have been limited (e.g., ARM)
High ST Work more closely with companies like ARM, Domino and CSR to understand what they need to expand locally given their global growth
Cambridge Enterprise
Limited VC funding High ST Build stronger links between London based VCs and Cambridge
Cambridge Enterprise
Immigration cap blocks entry of skilled workers
High MT Lobby central government to abandon immigration cap on non-EU workers, or at least to create an exemption for IT hardware engineers
Cambridge Enterprise
Lack of government support to clusters
High MT Lobby central government to adopt a cluster strategy
Cambridge Enterprise
No Regional Development Agencies
High MT Lobby central government to reinstate Regional Development Agencies, or equivalent bodies with a new name to support cluster growth
Council
Too few MNCs Med ST Approach other MNCs using ARM, CSR, etc. both as success stories and endorsements of the cluster’s vitality
Council investment team
Lack of on-the-job technical training
Med ST Work with central government to encourage the uptake of the new apprenticeship program by companies
Council investment team
Limited growth capital lending by banks
Med ST Encourage central government to continue pressuring banks via Project Merlin to increase SME lending for growth capital
Council investment team
Training programs focused on software
Med MT Work with Anglia Ruskin to redesign their engineering curriculum to boost talent supply for IT hardware
Cambridge Enterprise
High cost of land and housing
Med MT Relax planning restrictions to allow more housing to be built and drive down costs
Council
R&D spending relatively low compared to other IT hardware clusters
Med LT Develop contracts for collaboration between firms, university, and government to boost overall R&D spending to over 4% GDP to catch up with MA and CA
Cambridge Enterprise
Harvard Business School Microeconomics of Competiveness Cambridge IT Hardware Cluster
33
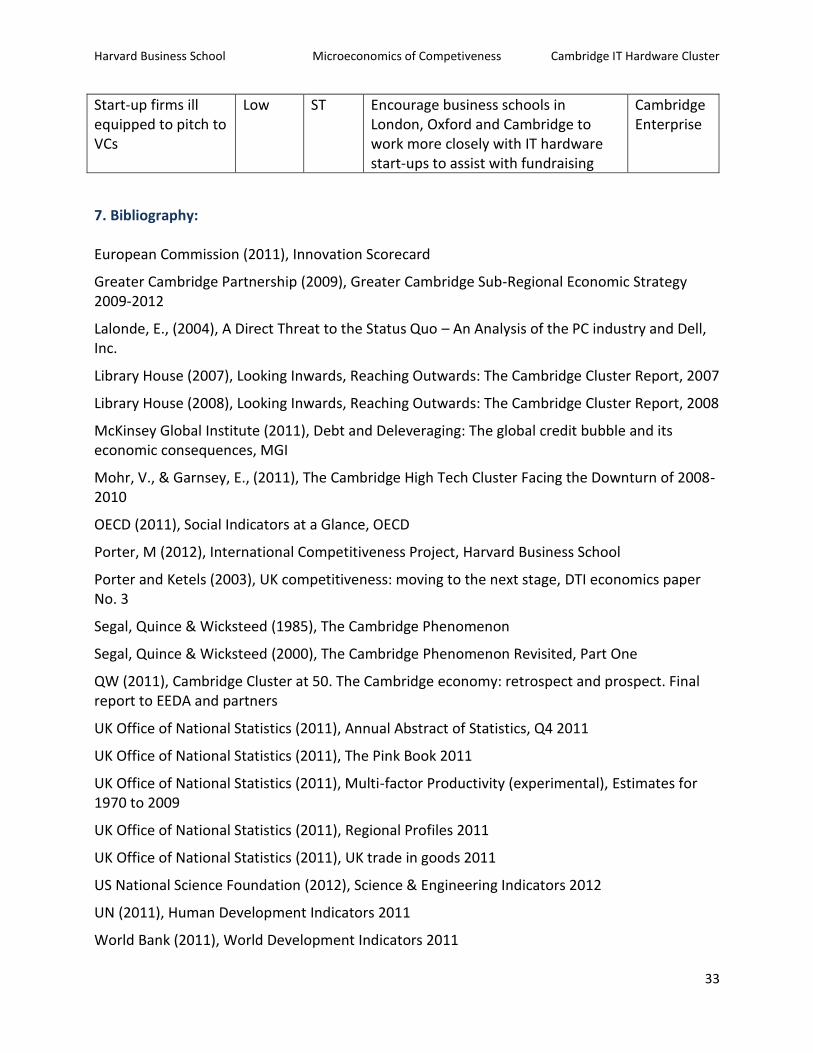
Start-up firms ill equipped to pitch to VCs
Low ST Encourage business schools in London, Oxford and Cambridge to work more closely with IT hardware start-ups to assist with fundraising
Cambridge Enterprise
7. Bibliography:
European Commission (2011), Innovation Scorecard
Greater Cambridge Partnership (2009), Greater Cambridge Sub-Regional Economic Strategy 2009-2012
Lalonde, E., (2004), A Direct Threat to the Status Quo – An Analysis of the PC industry and Dell, Inc.
Library House (2007), Looking Inwards, Reaching Outwards: The Cambridge Cluster Report, 2007
Library House (2008), Looking Inwards, Reaching Outwards: The Cambridge Cluster Report, 2008
McKinsey Global Institute (2011), Debt and Deleveraging: The global credit bubble and its economic consequences, MGI
Mohr, V., & Garnsey, E., (2011), The Cambridge High Tech Cluster Facing the Downturn of 2008-2010
OECD (2011), Social Indicators at a Glance, OECD
Porter, M (2012), International Competitiveness Project, Harvard Business School
Porter and Ketels (2003), UK competitiveness: moving to the next stage, DTI economics paper No. 3
Segal, Quince & Wicksteed (1985), The Cambridge Phenomenon
Segal, Quince & Wicksteed (2000), The Cambridge Phenomenon Revisited, Part One
QW (2011), Cambridge Cluster at 50. The Cambridge economy: retrospect and prospect. Final report to EEDA and partners
UK Office of National Statistics (2011), Annual Abstract of Statistics, Q4 2011
UK Office of National Statistics (2011), The Pink Book 2011
UK Office of National Statistics (2011), Multi-factor Productivity (experimental), Estimates for 1970 to 2009
UK Office of National Statistics (2011), Regional Profiles 2011
UK Office of National Statistics (2011), UK trade in goods 2011
US National Science Foundation (2012), Science & Engineering Indicators 2012
UN (2011), Human Development Indicators 2011
World Bank (2011), World Development Indicators 2011
Harvard Business School Microeconomics of Competiveness Cambridge IT Hardware Cluster
34
1 Prof. Michael E. Porter, International Cluster Competitiveness Project, Institute for Strategy and Competitiveness,
Harvard Business School; Richard Bryden, Project Director. Underlying data drawn from the UN Commodity Trade Statistics Database and the IMF BOP statistics. 2 UK Office for National Statistics, Annual Abstract of Statistics, Q4 2011,
http://www.ons.gov.uk/ons/publications/re-reference-tables.html?edition=tcm%3A77-242396 3 Michael Porter, International Cluster Competitiveness Project, Harvard University (based on UNCTAD trade data)
4 UK Office for National Statistics, The Pink Book, 2011
5 UK Office of National Statistics (2011), The Pink Book 2011
6 World Development Indicators, 2011
7 World Development Indicators, 2011
8 UK Office for National Statistics, Annual Abstract of Statistics, Q4 2011,
http://www.ons.gov.uk/ons/publications/re-reference-tables.html?edition=tcm%3A77-242396 9 McKinsey Global Institute, Debt and Deleveraging: The global credit bubble and its economic consequences, 2011
10 UK Office for National Statistics, Annual Abstract of Statistics, Q4 2011,
http://www.ons.gov.uk/ons/publications/re-reference-tables.html?edition=tcm%3A77-242396 11
European Association of Coal and Lignite, http://www.euracoal.be/pages/layout1sp.php?idpage=82 12
OECD Social Indicators, Society at a Glance, 2011 13
UN Human Development Indicators, 2011 14 OECD Social Indicators, Society at a Glance, 2011 15
World Bank Doing Business Indicators 2011, http://www.doingbusiness.org/data/exploreeconomies/united-kingdom/, accessed May 2012. 16
McKinsey Global Initiative, “Debt and deleveraging,” http://www.mckinsey.com/Insights/MGI/Research/Financial_Markets/Debt_and_deleveraging_The_global_credit_bubble_Update, accessed May 2012. 17
Prof Michael Porter, International Cluster Competitiveness Project, Harvard Business School 18
Michael Porter and Christian Ketels, UK competitiveness: moving to the next stage, DTI economics paper No. 3, 2003 19
European Commission Innovation Scorecard, 2011 20
Michael Porter and Christian Ketels, UK competitiveness: moving to the next stage, DTI economics paper No. 3, 2003 21
Barclays Capital, UK Outlook, August 2011 22
OECD, PISA, 2010 Country Profiles 23
UK Office for National Statistics, Annual Abstract of Statistics, Q4 2011, http://www.ons.gov.uk/ons/publications/re-reference-tables.html?edition=tcm%3A77-242396 24
UK Office for National Statistics, Annual Abstract of Statistics, Q4 2011, http://www.ons.gov.uk/ons/publications/re-reference-tables.html?edition=tcm%3A77-242396 25
UK Office of National Statistics, Multi-factor Productivity (experimental), Estimates for 1970 to 2009 (10 May 2011) http://www.ons.gov.uk/ons/rel/icp/multi-factor-productivity--experimental-/estimates-for-1970-to-2009/index.html 26
Office of National Statistics, Regional Profiles – Population and Migration – East of England – October 2011 (28 October 2011), http://www.ons.gov.uk/ons/rel/regional-trends/region-and-country-profiles/population-and-migration/population-and-migration---east-of-england.html, accessed May 2012. 27
Office of National Statistics, Ammendment: Changing Regional Economies: East of England (8 June 2007), http://www.ons.gov.uk/ons/rel/regional-analysis/changing-regional-economies/changing-regional-economies/changing-regional-economies---east-of-england.pdf, accessed May 2012.

Harvard Business School Microeconomics of Competiveness Cambridge IT Hardware Cluster
35
28
Office of National Statistics, Ammendment: Changing Regional Economies: East of England (8 June 2007), http://www.ons.gov.uk/ons/rel/regional-analysis/changing-regional-economies/changing-regional-economies/changing-regional-economies---east-of-england.pdf, accessed May 2012. 29
Office of National Statistics, Sub-Regional Productivity, October 2011, http://www.ons.gov.uk/ons/rel/regional-trends/regional-economic-analysis/sub-regional-productivity/art-sub-regional-productivity.html#tab-Results---England 30
Cambridge City Council, “Population Estimates,” http://www.cambridge.gov.uk/ccm/content/planning-and-building-control/research/population-estimates.en, accessed May 2012. 31
: Office of National Statistics, Ammendment: Changing Regional Economies: East of England (8 June 2007), http://www.ons.gov.uk/ons/rel/regional-analysis/changing-regional-economies/changing-regional-economies/changing-regional-economies---east-of-england.pdf, accessed May 2012. 32
US National Science Foundation, Science & Engineering Indicators 2012: http://www.nsf.gov/statistics/seind12/pdf/c04.pdf, accessed May 2012. 33
Office of National Statistics, Economic and Labour Marker Review (15 February 2011), http://www.ons.gov.uk/ons/rel/regional-trends/regional-economic-indicators/february-2011/index.html 34
BBC News, “UK house prices: October-December 2011,”http://news.bbc.co.uk/2/shared/spl/hi/in_depth/uk_house_prices/html/12ub.stm, accessed May 2012. 35
Greater Cambridge Partnership, “Greater Cambridge Sub-Regional Economic Strategy 2009-2012,” http://www.cambridgeshire.gov.uk/NR/rdonlyres/583EF36A-A106-43BF-9572-730578C02BDE/0/SRES200912.pdf, accessed May 2012. 36
SQW, “Cambridge Cluster at 50. The Cambridge economy: retrospect and prospect. Final report to EEDA and partners, March 2011,” http://www.cambridgeshire.gov.uk/NR/rdonlyres/B7DD1792-2659-4494-9C29-F45A188B1190/0/CambridgeclusterreportFINAL210311.pdf, accessed May 2012. 37
Segal, Quince & Wicksteed, The Cambridge Phenomenon Revisited, Part One (2000) 38
Office of National Statistics, UK trade in goods by classification of product by activity CPA(08) MQ10 (14 February 2012), http://www.ons.gov.uk/ons/rel/uktrade/monthly-review-of-external-trade-statistics/december-2011/tsd-uk-trade-in-goods-by-classification-of-product-by-activity-cpa-08--mq10.html 39
Library House, “Looking Inwards, Reaching Outwards: The Cambridge Cluster Report, 2007,” http://www.ifm.eng.cam.ac.uk/ctm/teg/documents/2007-11LibraryHouse-CambridgeClusterReport.pdf, accessed May 2012. 40
Vivian Mohr and Elizabeth Garnsey, “The Cambridge High Tech Cluster Facing the Downturn of 2008-2010,” http://www.ifm.eng.cam.ac.uk/free/Garnsey%20update%20Cam%20cluster%20150911.pdf, accessed May 2012. 41
Vivian Mohr and Elizabeth Garnsey, “The Cambridge High Tech Cluster Facing the Downturn of 2008-2010,” http://www.ifm.eng.cam.ac.uk/free/Garnsey%20update%20Cam%20cluster%20150911.pdf, accessed May 2012. 42
Vivian Mohr and Elizabeth Garnsey, “The Cambridge High Tech Cluster Facing the Downturn of 2008-2010,” http://www.ifm.eng.cam.ac.uk/free/Garnsey%20update%20Cam%20cluster%20150911.pdf, accessed May 2012. 43
Vivian Mohr and Elizabeth Garnsey, “The Cambridge High Tech Cluster Facing the Downturn of 2008-2010,” http://www.ifm.eng.cam.ac.uk/free/Garnsey%20update%20Cam%20cluster%20150911.pdf, accessed May 2012. 44
Library House, “Looking Inwards, Reaching Outwards: The Cambridge Cluster Report, 2008,” http://www.ifm.eng.cam.ac.uk/ctm/teg/documents/2008LHCambridgeClusterReport.pdf 45
Library House, “Looking Inwards, Reaching Outwards: The Cambridge Cluster Report, 2008,” http://www.ifm.eng.cam.ac.uk/ctm/teg/documents/2008LHCambridgeClusterReport.pdf 46
Prof. Michael E. Porter, International Cluster Competitiveness Project, Institute for Strategy and Competitiveness, Harvard Business School; Richard Bryden, Project Director. Underlying data drawn from the UN Commodity Trade Statistics Database and the IMF BOP statistics. 47
Library House, Competitive Advantage – The Cambridge Cluster Report 2008 48
http://www.enterprise.cam.ac.uk/ 49
http://www.cambridgenetwork.co.uk/home/ 50
http://www.rcuk.ac.uk/Pages/Home.aspx 51
http://www.cambridge.gov.uk/democracy/mgOutsideBodyDetails.aspx?ID=143