Embed Size (px)
Citation preview
7/28/2019 IT Lesson Learned
http://slidepdf.com/reader/full/it-lesson-learned 1/27
This document was downloaded from the Penspen Integrity Virtual Library
For further information, contact Penspen Integrity:
Penspen IntegrityUnits 7-8
St. Peter's Wharf Newcastle upon Tyne
NE6 1TZ
United Kingdom
Telephone: +44 (0)191 238 2200Fax: +44 (0)191 275 9786
Email: [email protected] Website: www.penspenintegrity.com
7/28/2019 IT Lesson Learned
http://slidepdf.com/reader/full/it-lesson-learned 2/27
Page 1
WTIA International Pipeline Integrity & Repairs Conference
Sydney, Australia.
Welding Technology Institute of Australia.
9th March 2004
PIPELINE INTEGRITY: SOME LESSONS LEARNT Hopkins, P1
ABSTRACT
The pipeline business now has many years of operational experience. This, combined with accessto sophisticated inspection tools such as intelligent pigs, improved coatings and protection, andadvanced calculation methods for the assessment of defects, should ensure that pipelines are bothsafe and secure. However, there continues to be frequent and tragic pipeline failures around theworld. What lessons can we learn from these inspections, assessments and failures?
This paper considers some of the lessons learnt from recent failures and field experiences, andconcludes with some guidance for all engineers in the pipeline business.
KEYWORDS
Pipeline, integrity, safety, management, pipeline failures, intelligent pigs, corrosion, outside force,surveillance, data management, metal loss, cracks, dents, standardisation, errors, lessons learnt.
1 Penspen Integrity, Hawthorn Suite, Units 7-8, St Peter’s Wharf, St Peter’s Basin, Newcastle uponTyne NE6 1TZ, UK. Tel. 44 (0) 191 238 2202. email [email protected]
7/28/2019 IT Lesson Learned
http://slidepdf.com/reader/full/it-lesson-learned 3/27
Page 2
1. INTRODUCTION
We are experiencing change in the pipeline business [1,2]: poor quality materials and a lack of understanding of major risk meant that 30 years ago, and before, we needed standards thatensured we had good quality pipe, careful routeing, etc.. But now we know that in-service defects(damage, corrosion) fail pipelines and cause casualties [3]. Hence, a pipeline’s ‘integrity’ is
dependent on the design, operation and management of a pipeline
Consequently, we are now seeing the publication of regulations and standards that formally requirepipeline operators to ‘manage’ their pipeline’s integrity and have in place formal risk managementplans that clearly mitigate and control risks.
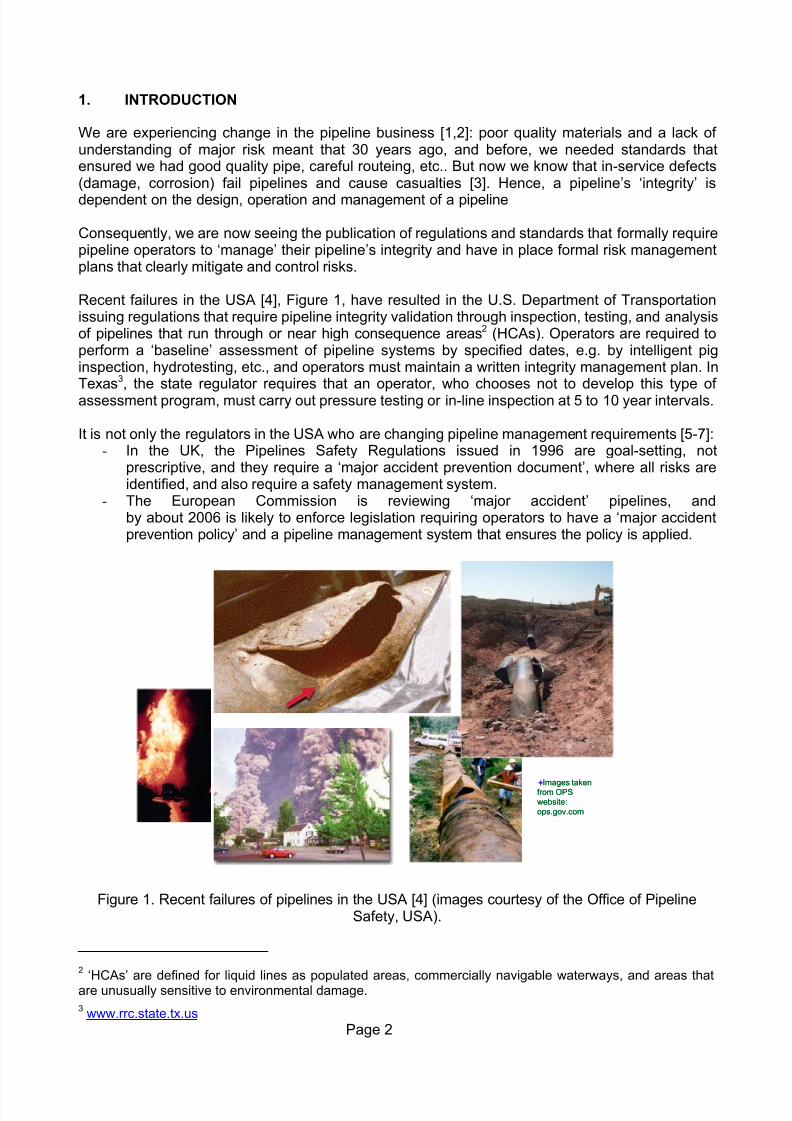
Recent failures in the USA [4], Figure 1, have resulted in the U.S. Department of Transportationissuing regulations that require pipeline integrity validation through inspection, testing, and analysisof pipelines that run through or near high consequence areas2 (HCAs). Operators are required toperform a ‘baseline’ assessment of pipeline systems by specified dates, e.g. by intelligent piginspection, hydrotesting, etc., and operators must maintain a written integrity management plan. InTexas3, the state regulator requires that an operator, who chooses not to develop this type of assessment program, must carry out pressure testing or in-line inspection at 5 to 10 year intervals.
It is not only the regulators in the USA who are changing pipeline management requirements [5-7]:- In the UK, the Pipelines Safety Regulations issued in 1996 are goal-setting, not
prescriptive, and they require a ‘major accident prevention document’, where all risks areidentified, and also require a safety management system.
- The European Commission is reviewing ‘major accident’ pipelines, andby about 2006 is likely to enforce legislation requiring operators to have a ‘major accidentprevention policy’ and a pipeline management system that ensures the policy is applied.
Figure 1. Recent failures of pipelines in the USA [4] (images courtesy of the Office of PipelineSafety, USA).
2
‘HCAs’ are defined for liquid lines as populated areas, commercially navigable waterways, and areas thatare unusually sensitive to environmental damage. 3 www.rrc.state.tx.us
lImages takenfrom OPSwebsite:ops.gov.com
lImages takenfrom OPSwebsite:ops.gov.com
7/28/2019 IT Lesson Learned
http://slidepdf.com/reader/full/it-lesson-learned 4/27
Page 3
The intentions of formalised pipeline integrity management are [4]:
i. accelerating the integrity assessment of pipelines in areas where failures would have ahigh consequence,
ii. improving operator integrity management systems,
iii. improving government's role in reviewing the adequacy of integrity programs and plans,
andiv. providing increased public assurance in pipeline safety.
In the USA, the American Petroleum Institute [8] and the American Society of MechanicalEngineers [9] have published guidelines on how operators can satisfy the new integritymanagement rules in the USA.
It is very important to operate a safe pipeline and satisfy regulations: as engineers and competentoperators we want to protect people and the environment, but we also need to protect ourselvesfrom litigation. In the USA there have been settlements approaching $100,000,000 in recentpipeline failures, and operating staff and management are facing imprisonment for mistakes made.
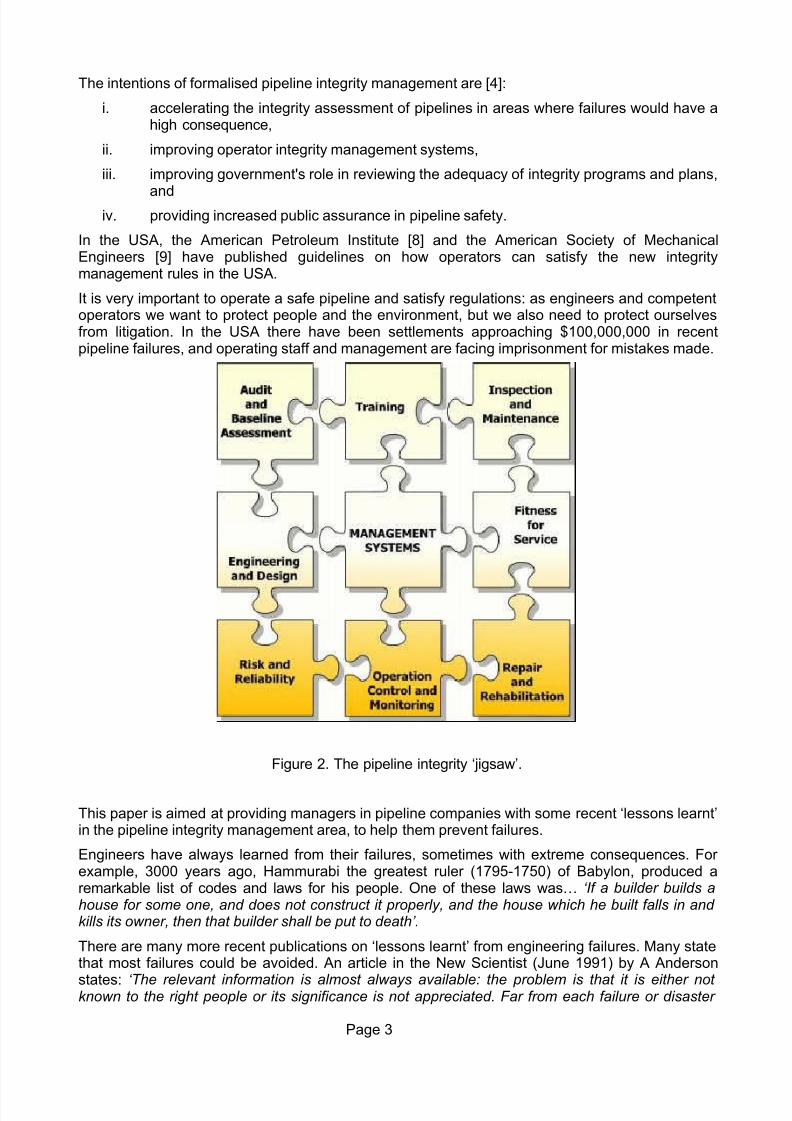
Figure 2. The pipeline integrity ‘jigsaw’.
This paper is aimed at providing managers in pipeline companies with some recent ‘lessons learnt’in the pipeline integrity management area, to help them prevent failures.
Engineers have always learned from their failures, sometimes with extreme consequences. For example, 3000 years ago, Hammurabi the greatest ruler (1795-1750) of Babylon, produced aremarkable list of codes and laws for his people. One of these laws was… ‘If a builder builds ahouse for some one, and does not construct it properly, and the house which he built falls in and kills its owner, then that builder shall be put to death’.
There are many more recent publications on ‘lessons learnt’ from engineering failures. Many statethat most failures could be avoided. An article in the New Scientist (June 1991) by A Anderson
states: ‘The relevant information is almost always available: the problem is that it is either not known to the right people or its significance is not appreciated. Far from each failure or disaster
7/28/2019 IT Lesson Learned
http://slidepdf.com/reader/full/it-lesson-learned 5/27
Page 4
being unique, there is usually a past history of similar events that could have resulted in failure but which for some reason didn't’.
This paper will first of all consider pipeline integrity and list some lessons learnt over the past 20years. Pipeline integrity also involves careful consideration of staff and their training needs [10-12],but another paper at this conference will consider these aspects [13].
2. PIPELINE INTEGRITY
In the past we have assumed that if we maintain our pipeline to the minimum requirements incodes or our company manuals, the pipeline will be safe. Recent failures have confirmed thisapproach as naï ve, and any engineer will tell you that an ageing asset requires increasing care, notconstant care.
Pipeline integrity is ensuring a pipeline is safe and secure. It starts with a good design andconstruction, but it involves all of a pipeline’s inspection, management and maintenance. Thispresents an operator with a complex ‘jigsaw’ to solve if they are to maintain high integrity, Figure 2
Pipeline integrity management is the management of all the elements of this complex jigsaw. The
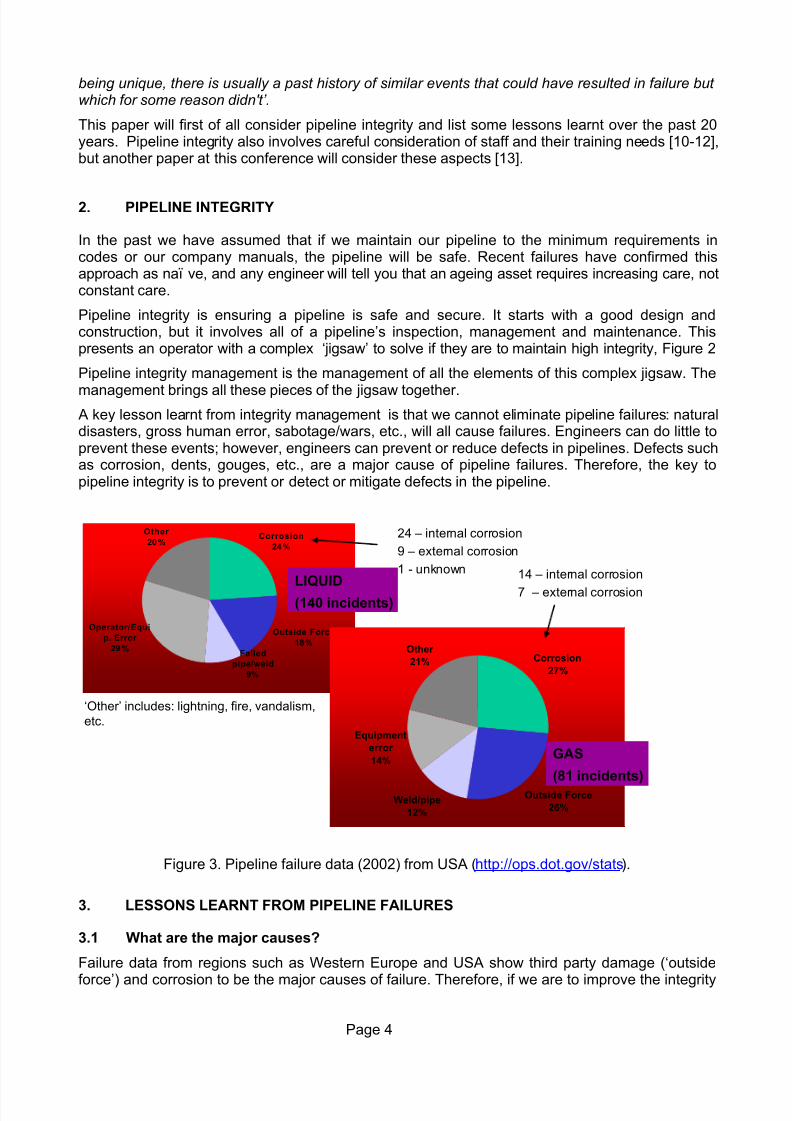
management brings all these pieces of the jigsaw together. A key lesson learnt from integrity management is that we cannot eliminate pipeline failures: naturaldisasters, gross human error, sabotage/wars, etc., will all cause failures. Engineers can do little toprevent these events; however, engineers can prevent or reduce defects in pipelines. Defects suchas corrosion, dents, gouges, etc., are a major cause of pipeline failures. Therefore, the key topipeline integrity is to prevent or detect or mitigate defects in the pipeline.
Figure 3. Pipeline failure data (2002) from USA (http://ops.dot.gov/stats).
3. LESSONS LEARNT FROM PIPELINE FAILURES
3.1 What are the major causes?
Failure data from regions such as Western Europe and USA show third party damage (‘outside
force’) and corrosion to be the major causes of failure. Therefore, if we are to improve the integrity
Corrosion
24%
Outside Force
18%
Other
20%
Operator/Equi
p. Error
29%Failed
pipe/weld
9%
Corrosion
27%
Outside Force
26%Weld/pipe
12%
Equipment
error
14%
Other
21%
LIQUID
(140 incidents)
GAS
(81 incidents)
14 – internal corrosion
7 – external corrosion
24 – internal corrosion
9 – external corrosion
1 - unknown
‘Other’ includes: lightning, fire, vandalism,etc.
7/28/2019 IT Lesson Learned
http://slidepdf.com/reader/full/it-lesson-learned 6/27
Page 5
of our pipelines we need to reduce third party damage and corrosion, and focus our design andoperation on achieving this reduction.
Figure 3 presents the latest failure data (for 2002) for pipelines in the USA. These data are freelyavailable and updated by the USA Office of Pipeline Safety
Pipeline failures are usually related to a breakdown in a ‘system’, e.g. the corrosion protection‘system’ has become faulty, and a combination of ageing coating, aggressive environment, and
rapid corrosion growth may lead to a corrosion failure. This type of failure is not simply a ‘corrosion’failure, but a ‘corrosion control system’ failure. Therefore, an engineer must appreciate the systemto prevent failure; understanding the equation that quantifies failure pressure is just one aspect.
3.2 What causes corrosion?
Pipeline protection starts with a good design and construction, but our pipelines are surrounded byhostile environments, and this can lead to corrosion.
We need to separate our pipe steel from the soil or water environment otherwise it will corrode.Usually, there is no corrosion allowance for external corrosion in pipelines; hence we need toprotect our outside surface. The pipe coating is the primary protection, and cathodic protection
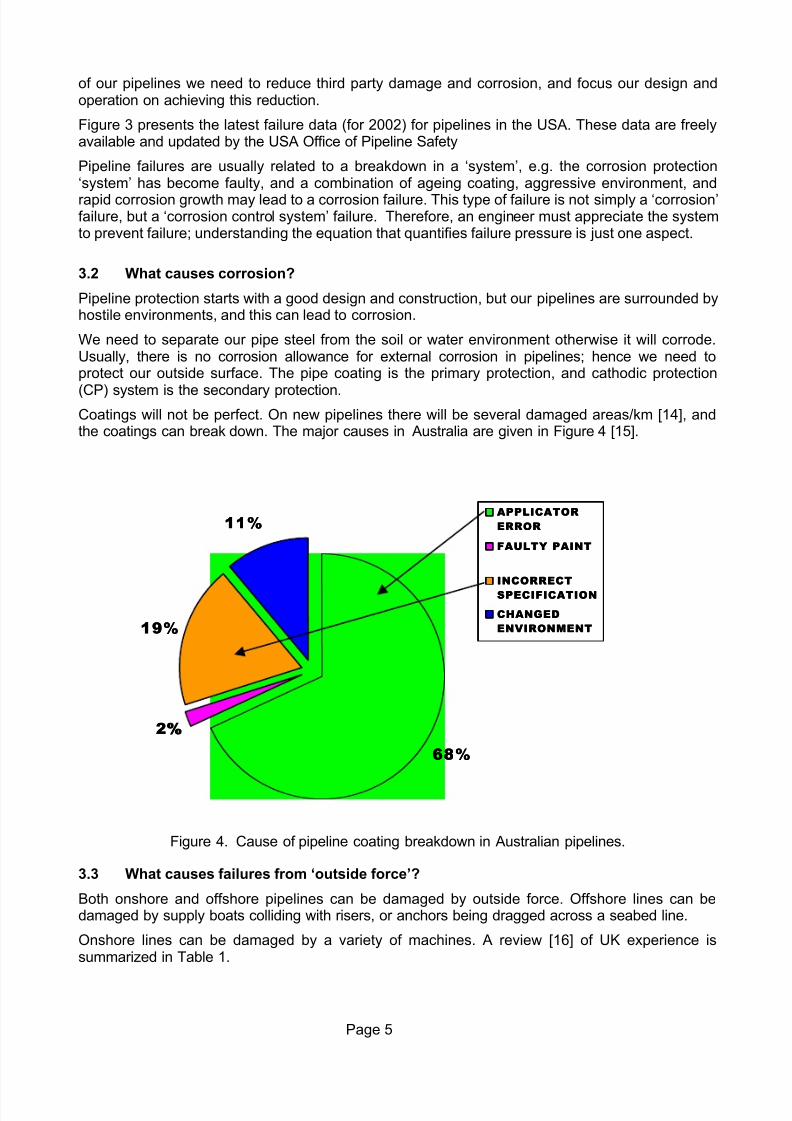
(CP) system is the secondary protection.Coatings will not be perfect. On new pipelines there will be several damaged areas/km [14], andthe coatings can break down. The major causes in Australia are given in Figure 4 [15].
Figure 4. Cause of pipeline coating breakdown in Australian pipelines.
3.3 What causes failures from ‘outside force’?
Both onshore and offshore pipelines can be damaged by outside force. Offshore lines can bedamaged by supply boats colliding with risers, or anchors being dragged across a seabed line.
Onshore lines can be damaged by a variety of machines. A review [16] of UK experience issummarized in Table 1.
68%68%
2%2%
19%19%
11%11%APPLICATORAPPLICATOR
ERRORERROR
FAULTY PAINTFAULTY PAINT
INCORRECTINCORRECT
SPECIFICATIONSPECIFICATION
CHANGEDCHANGED
ENVIRONMENTENVIRONMENT
7/28/2019 IT Lesson Learned
http://slidepdf.com/reader/full/it-lesson-learned 7/27
Page 6
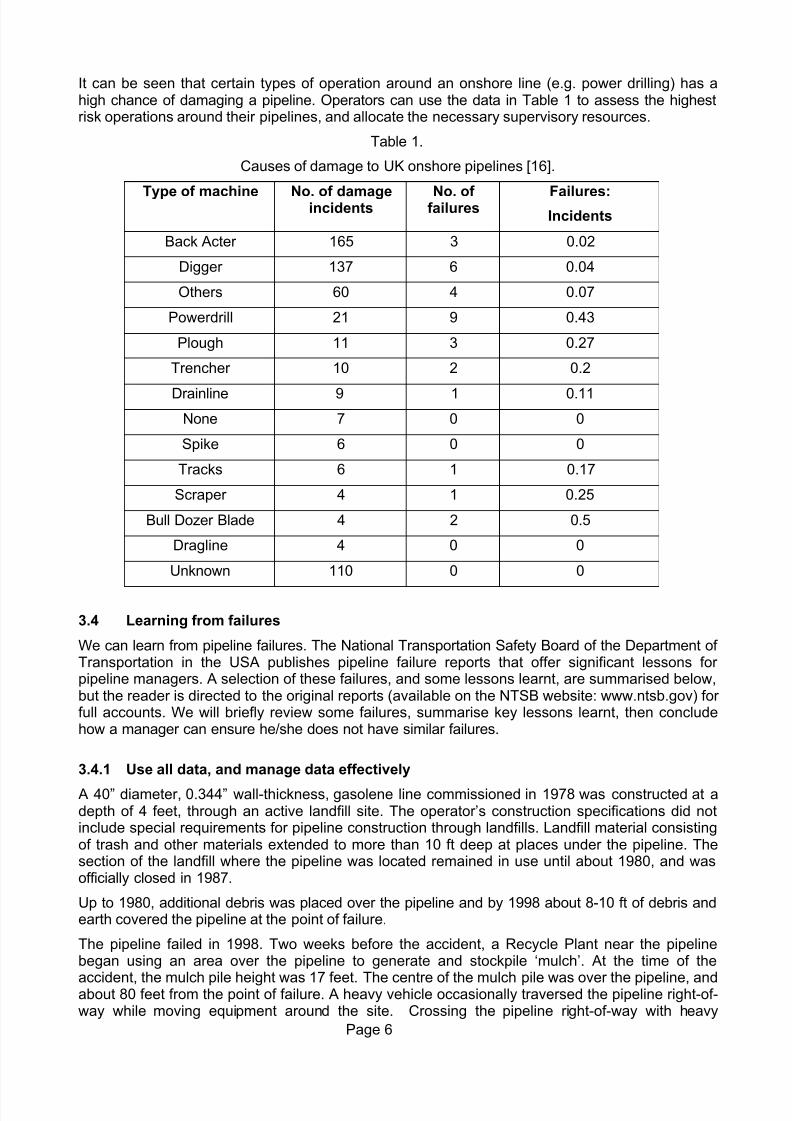
It can be seen that certain types of operation around an onshore line (e.g. power drilling) has ahigh chance of damaging a pipeline. Operators can use the data in Table 1 to assess the highestrisk operations around their pipelines, and allocate the necessary supervisory resources.
Table 1.
Causes of damage to UK onshore pipelines [16].
Type of machine No. of damageincidents No. of failures Failures:Incidents
Back Acter 165 3 0.02
Digger 137 6 0.04
Others 60 4 0.07
Powerdrill 21 9 0.43
Plough 11 3 0.27
Trencher 10 2 0.2
Drainline 9 1 0.11
None 7 0 0
Spike 6 0 0
Tracks 6 1 0.17
Scraper 4 1 0.25
Bull Dozer Blade 4 2 0.5
Dragline 4 0 0
Unknown 110 0 0
3.4 Learning from failures
We can learn from pipeline failures. The National Transportation Safety Board of the Department of Transportation in the USA publishes pipeline failure reports that offer significant lessons for pipeline managers. A selection of these failures, and some lessons learnt, are summarised below,but the reader is directed to the original reports (available on the NTSB website: www.ntsb.gov) for full accounts. We will briefly review some failures, summarise key lessons learnt, then concludehow a manager can ensure he/she does not have similar failures.
3.4.1 Use all data, and manage data effectively
A 40” diameter, 0.344” wall-thickness, gasolene line commissioned in 1978 was constructed at adepth of 4 feet, through an active landfill site. The operator’s construction specifications did notinclude special requirements for pipeline construction through landfills. Landfill material consistingof trash and other materials extended to more than 10 ft deep at places under the pipeline. Thesection of the landfill where the pipeline was located remained in use until about 1980, and wasofficially closed in 1987.
Up to 1980, additional debris was placed over the pipeline and by 1998 about 8-10 ft of debris andearth covered the pipeline at the point of failure.
The pipeline failed in 1998. Two weeks before the accident, a Recycle Plant near the pipelinebegan using an area over the pipeline to generate and stockpile ‘mulch’. At the time of the
accident, the mulch pile height was 17 feet. The centre of the mulch pile was over the pipeline, andabout 80 feet from the point of failure. A heavy vehicle occasionally traversed the pipeline right-of-way while moving equipment around the site. Crossing the pipeline right-of-way with heavy
7/28/2019 IT Lesson Learned
http://slidepdf.com/reader/full/it-lesson-learned 8/27
Page 7
buckle
Circumferential crack& diagonal cracks
Axialcrack
buckle
Circumferential crack& diagonal cracks
Axialcrack
equipment and storing materials on or near the right-of-way were against an agreement betweenthe operator and the Recycle Plant.
The pipeline operator had ran an intelligent pig (metal loss) through the pipeline in 1993 and foundno significant anomalies. Also, the aerial pipeline patrol pilot noted the mulch stockpile on theright-of-way during patrols, but did not believe this to be of concern. He further believed that theappropriate operator’s employees were aware of the mulch pile on the right-of-way. Finally, six
months prior to the pipeline failure, a ‘concerned citizen’ living in the community wrote to her congressman and expressed concerns about the safety and vulnerability of the pipeline in thelandfill. The Congressman wrote to the regional regulator (Office of Pipeline Safety (OPS)) askingto address these concerns. An inspector interviewed operator personnel and visited the landfill site,but noted no code violations; however, the visit by the engineer was made prior to the activities of Recycle Plant and the mulch being placed on the line.
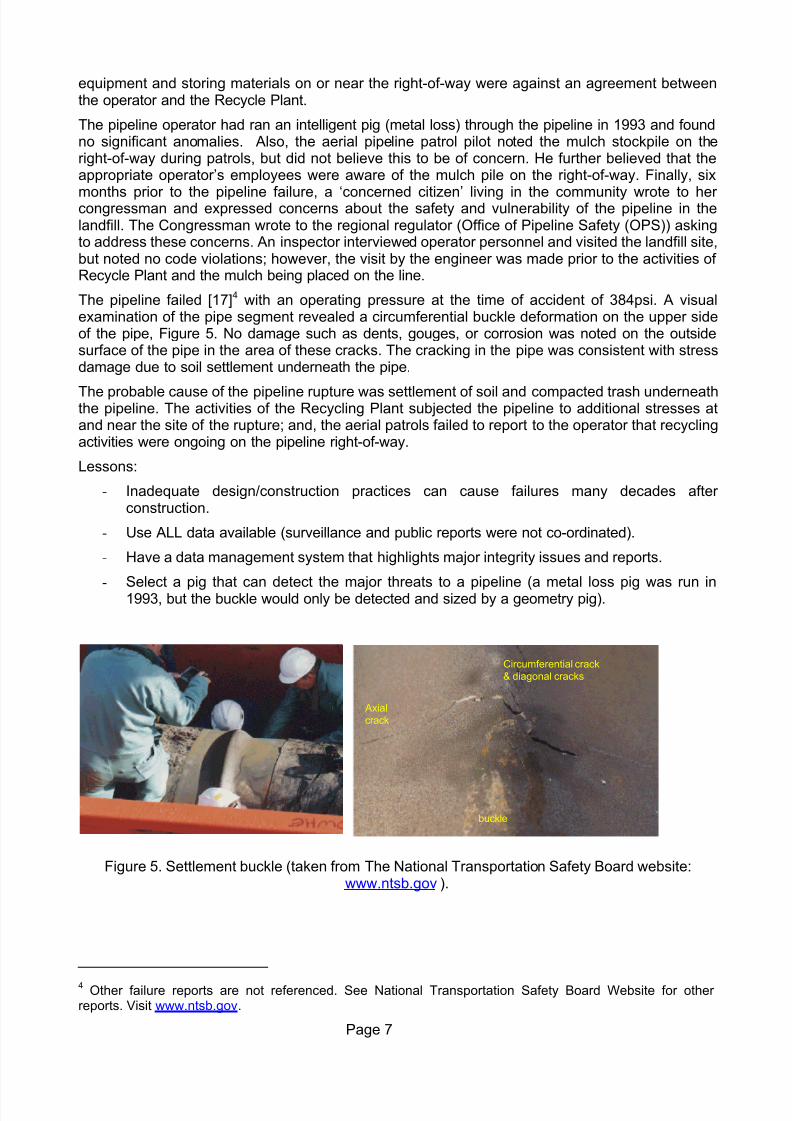
The pipeline failed [17]4 with an operating pressure at the time of accident of 384psi. A visualexamination of the pipe segment revealed a circumferential buckle deformation on the upper sideof the pipe, Figure 5. No damage such as dents, gouges, or corrosion was noted on the outsidesurface of the pipe in the area of these cracks. The cracking in the pipe was consistent with stressdamage due to soil settlement underneath the pipe.
The probable cause of the pipeline rupture was settlement of soil and compacted trash underneaththe pipeline. The activities of the Recycling Plant subjected the pipeline to additional stresses atand near the site of the rupture; and, the aerial patrols failed to report to the operator that recyclingactivities were ongoing on the pipeline right-of-way.
Lessons:
- Inadequate design/construction practices can cause failures many decades after construction.
- Use ALL data available (surveillance and public reports were not co-ordinated).
- Have a data management system that highlights major integrity issues and reports.
-
Select a pig that can detect the major threats to a pipeline (a metal loss pig was run in1993, but the buckle would only be detected and sized by a geometry pig).
Figure 5. Settlement buckle (taken from The National Transportation Safety Board website:www.ntsb.gov ).
4 Other failure reports are not referenced. See National Transportation Safety Board Website for other
reports. Visit www.ntsb.gov.
7/28/2019 IT Lesson Learned
http://slidepdf.com/reader/full/it-lesson-learned 9/27
Page 8
3.4.2 Select the correct pig and beware of dents in liquid lines
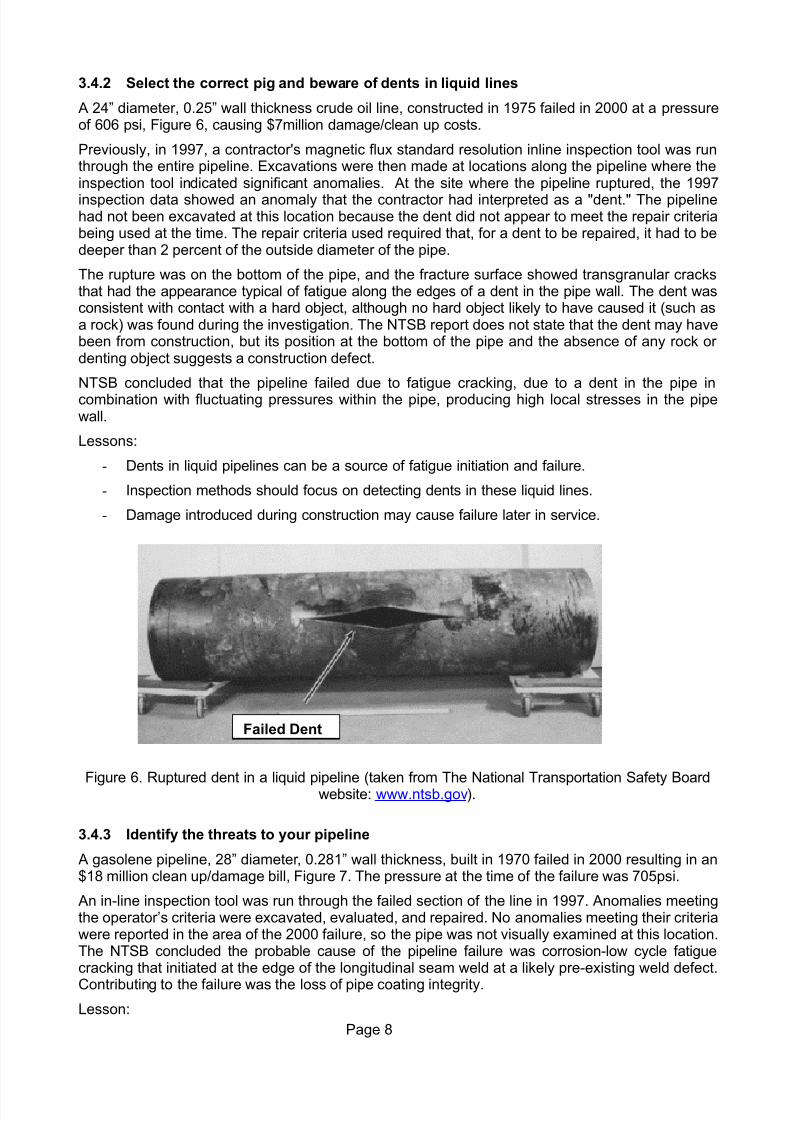
A 24” diameter, 0.25” wall thickness crude oil line, constructed in 1975 failed in 2000 at a pressureof 606 psi, Figure 6, causing $7million damage/clean up costs.
Previously, in 1997, a contractor's magnetic flux standard resolution inline inspection tool was runthrough the entire pipeline. Excavations were then made at locations along the pipeline where theinspection tool indicated significant anomalies. At the site where the pipeline ruptured, the 1997
inspection data showed an anomaly that the contractor had interpreted as a "dent." The pipelinehad not been excavated at this location because the dent did not appear to meet the repair criteriabeing used at the time. The repair criteria used required that, for a dent to be repaired, it had to bedeeper than 2 percent of the outside diameter of the pipe.
The rupture was on the bottom of the pipe, and the fracture surface showed transgranular cracksthat had the appearance typical of fatigue along the edges of a dent in the pipe wall. The dent wasconsistent with contact with a hard object, although no hard object likely to have caused it (such asa rock) was found during the investigation. The NTSB report does not state that the dent may havebeen from construction, but its position at the bottom of the pipe and the absence of any rock or denting object suggests a construction defect.
NTSB concluded that the pipeline failed due to fatigue cracking, due to a dent in the pipe incombination with fluctuating pressures within the pipe, producing high local stresses in the pipewall.
Lessons:
- Dents in liquid pipelines can be a source of fatigue initiation and failure.
- Inspection methods should focus on detecting dents in these liquid lines.
- Damage introduced during construction may cause failure later in service.
Figure 6. Ruptured dent in a liquid pipeline (taken from The National Transportation Safety Boardwebsite: www.ntsb.gov).
3.4.3 Identify the threats to your pipeline
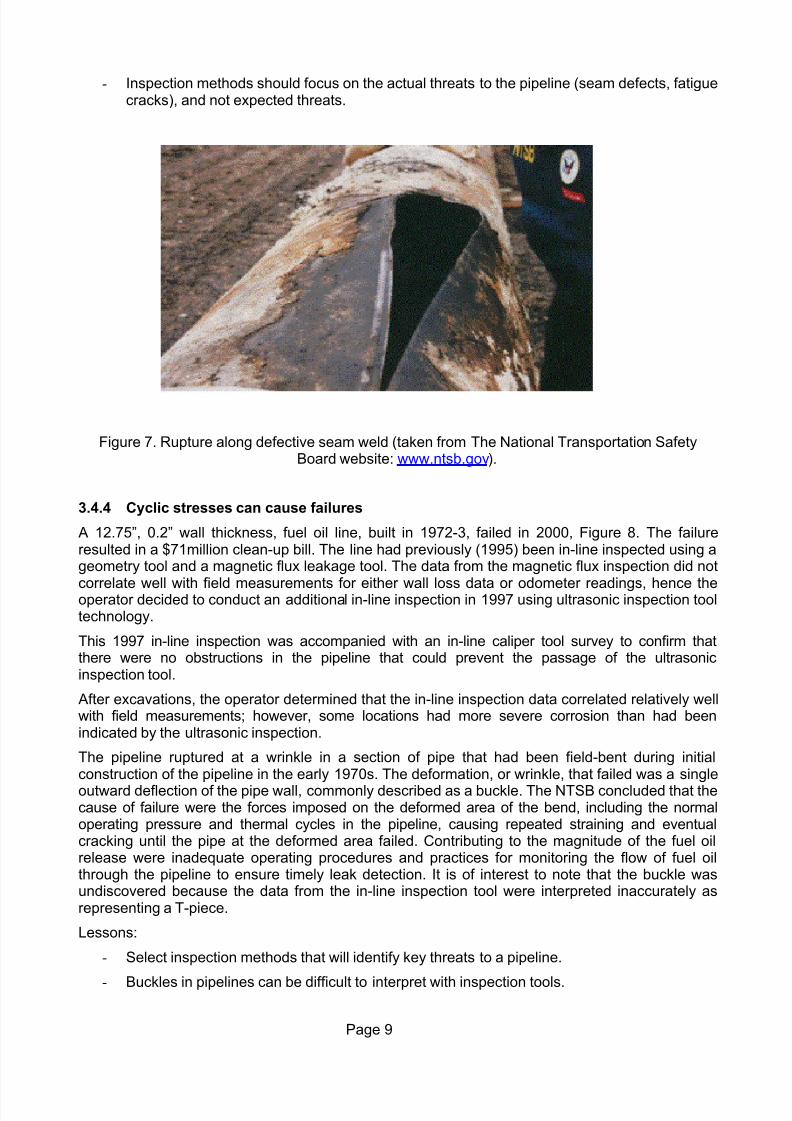
A gasolene pipeline, 28” diameter, 0.281” wall thickness, built in 1970 failed in 2000 resulting in an$18 million clean up/damage bill, Figure 7. The pressure at the time of the failure was 705psi.
An in-line inspection tool was run through the failed section of the line in 1997. Anomalies meetingthe operator’s criteria were excavated, evaluated, and repaired. No anomalies meeting their criteriawere reported in the area of the 2000 failure, so the pipe was not visually examined at this location.The NTSB concluded the probable cause of the pipeline failure was corrosion-low cycle fatiguecracking that initiated at the edge of the longitudinal seam weld at a likely pre-existing weld defect.
Contributing to the failure was the loss of pipe coating integrity.
Lesson:
Failed Dent
7/28/2019 IT Lesson Learned
http://slidepdf.com/reader/full/it-lesson-learned 10/27
Page 9
- Inspection methods should focus on the actual threats to the pipeline (seam defects, fatiguecracks), and not expected threats.
Figure 7. Rupture along defective seam weld (taken from The National Transportation SafetyBoard website: www.ntsb.gov).
3.4.4 Cyclic stresses can cause failures
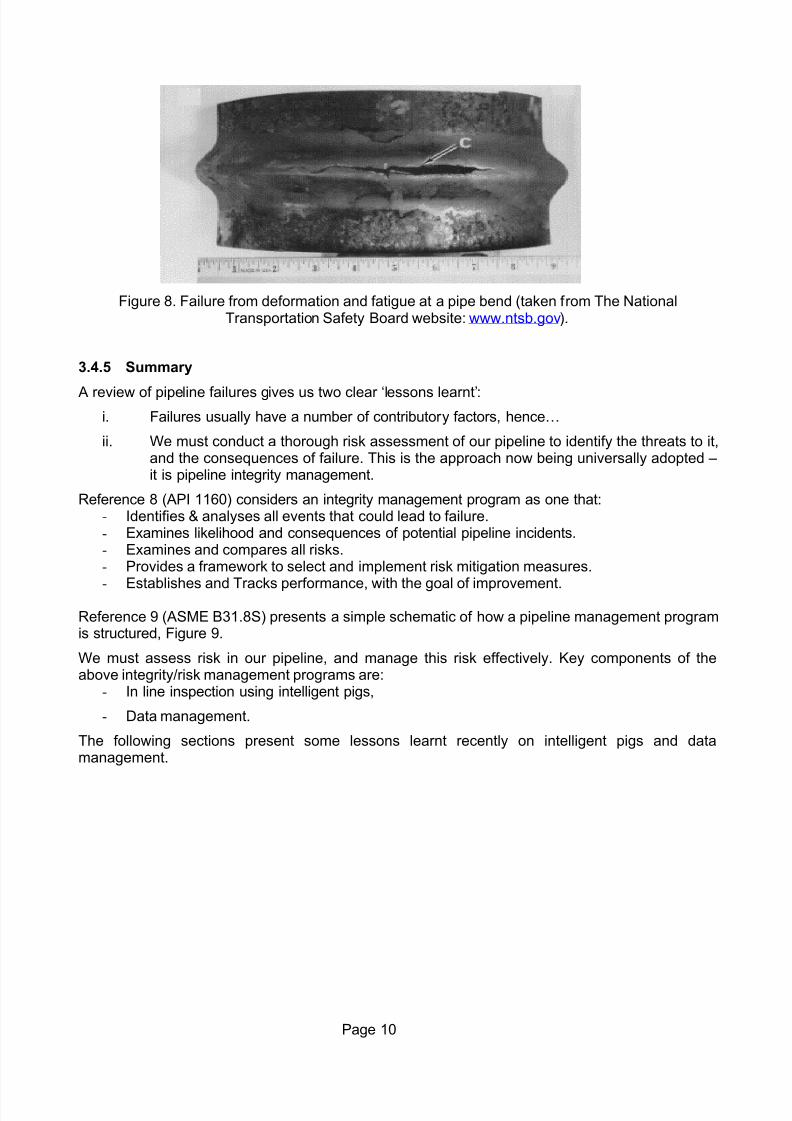
A 12.75”, 0.2” wall thickness, fuel oil line, built in 1972-3, failed in 2000, Figure 8. The failureresulted in a $71million clean-up bill. The line had previously (1995) been in-line inspected using ageometry tool and a magnetic flux leakage tool. The data from the magnetic flux inspection did not
correlate well with field measurements for either wall loss data or odometer readings, hence theoperator decided to conduct an additional in-line inspection in 1997 using ultrasonic inspection tooltechnology.
This 1997 in-line inspection was accompanied with an in-line caliper tool survey to confirm thatthere were no obstructions in the pipeline that could prevent the passage of the ultrasonicinspection tool.
After excavations, the operator determined that the in-line inspection data correlated relatively wellwith field measurements; however, some locations had more severe corrosion than had beenindicated by the ultrasonic inspection.
The pipeline ruptured at a wrinkle in a section of pipe that had been field-bent during initialconstruction of the pipeline in the early 1970s. The deformation, or wrinkle, that failed was a single
outward deflection of the pipe wall, commonly described as a buckle. The NTSB concluded that thecause of failure were the forces imposed on the deformed area of the bend, including the normaloperating pressure and thermal cycles in the pipeline, causing repeated straining and eventualcracking until the pipe at the deformed area failed. Contributing to the magnitude of the fuel oilrelease were inadequate operating procedures and practices for monitoring the flow of fuel oilthrough the pipeline to ensure timely leak detection. It is of interest to note that the buckle wasundiscovered because the data from the in-line inspection tool were interpreted inaccurately asrepresenting a T-piece.
Lessons:
- Select inspection methods that will identify key threats to a pipeline.
- Buckles in pipelines can be difficult to interpret with inspection tools.
7/28/2019 IT Lesson Learned
http://slidepdf.com/reader/full/it-lesson-learned 11/27
Page 10
Figure 8. Failure from deformation and fatigue at a pipe bend (taken from The NationalTransportation Safety Board website: www.ntsb.gov).
3.4.5 Summary
A review of pipeline failures gives us two clear ‘lessons learnt’:i. Failures usually have a number of contributory factors, hence…
ii. We must conduct a thorough risk assessment of our pipeline to identify the threats to it,and the consequences of failure. This is the approach now being universally adopted –it is pipeline integrity management.
Reference 8 (API 1160) considers an integrity management program as one that:- Identifies & analyses all events that could lead to failure.- Examines likelihood and consequences of potential pipeline incidents.- Examines and compares all risks.- Provides a framework to select and implement risk mitigation measures.-
Establishes and Tracks performance, with the goal of improvement.
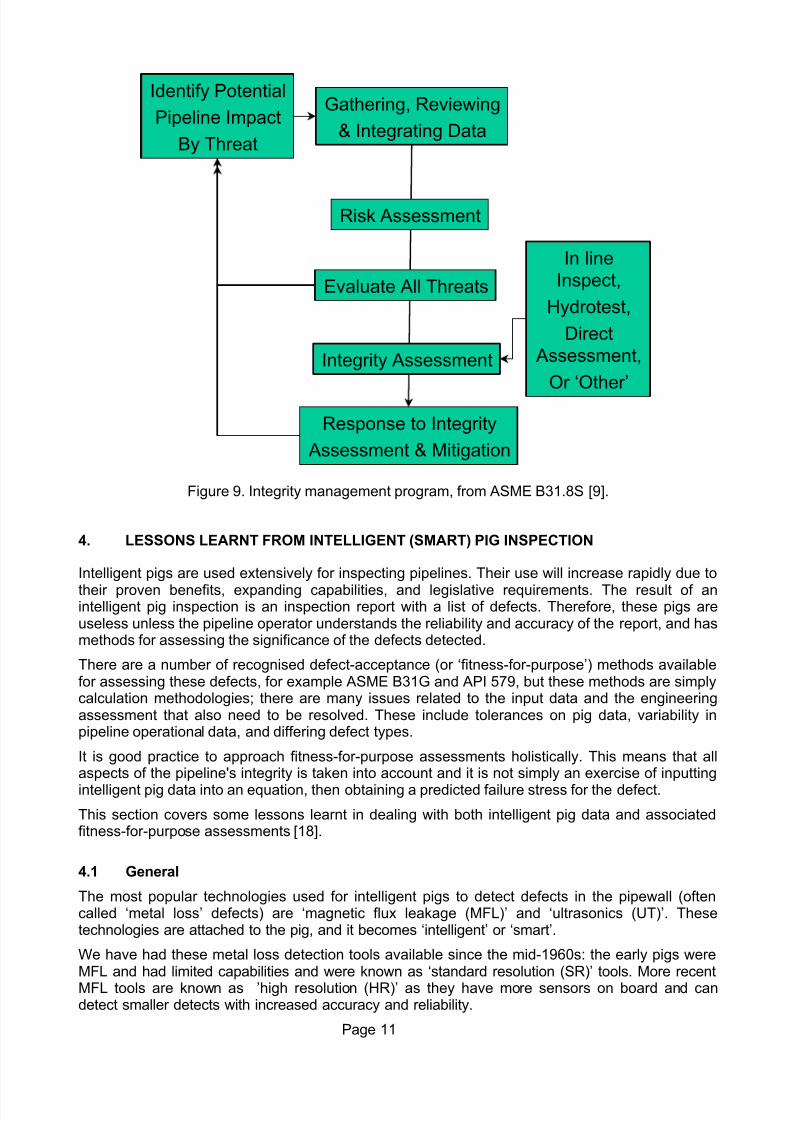
Reference 9 (ASME B31.8S) presents a simple schematic of how a pipeline management programis structured, Figure 9.
We must assess risk in our pipeline, and manage this risk effectively. Key components of theabove integrity/risk management programs are:
- In line inspection using intelligent pigs,
- Data management.
The following sections present some lessons learnt recently on intelligent pigs and datamanagement.
7/28/2019 IT Lesson Learned
http://slidepdf.com/reader/full/it-lesson-learned 12/27
Page 11
Identify Potential
Pipeline Impact
By Threat
Gathering, Reviewing
& Integrating Data
Risk Assessment
Evaluate All Threats
Integrity Assessment
Response to Integrity
Assessment & Mitigation
In lineInspect,
Hydrotest,
Direct Assessment,
Or ‘Other’
Figure 9. Integrity management program, from ASME B31.8S [9].
4. LESSONS LEARNT FROM INTELLIGENT (SMART) PIG INSPECTION
Intelligent pigs are used extensively for inspecting pipelines. Their use will increase rapidly due to
their proven benefits, expanding capabilities, and legislative requirements. The result of anintelligent pig inspection is an inspection report with a list of defects. Therefore, these pigs areuseless unless the pipeline operator understands the reliability and accuracy of the report, and hasmethods for assessing the significance of the defects detected.
There are a number of recognised defect-acceptance (or ‘fitness-for-purpose’) methods availablefor assessing these defects, for example ASME B31G and API 579, but these methods are simplycalculation methodologies; there are many issues related to the input data and the engineeringassessment that also need to be resolved. These include tolerances on pig data, variability inpipeline operational data, and differing defect types.
It is good practice to approach fitness-for-purpose assessments holistically. This means that allaspects of the pipeline's integrity is taken into account and it is not simply an exercise of inputting
intelligent pig data into an equation, then obtaining a predicted failure stress for the defect.
This section covers some lessons learnt in dealing with both intelligent pig data and associatedfitness-for-purpose assessments [18].
4.1 General
The most popular technologies used for intelligent pigs to detect defects in the pipewall (oftencalled ‘metal loss’ defects) are ‘magnetic flux leakage (MFL)’ and ‘ultrasonics (UT)’. Thesetechnologies are attached to the pig, and it becomes ‘intelligent’ or ‘smart’.
We have had these metal loss detection tools available since the mid-1960s: the early pigs wereMFL and had limited capabilities and were known as ‘standard resolution (SR)’ tools. More recentMFL tools are known as ’high resolution (HR)’ as they have more sensors on board and candetect smaller detects with increased accuracy and reliability.
7/28/2019 IT Lesson Learned
http://slidepdf.com/reader/full/it-lesson-learned 13/27
Page 12
Intelligent pigs that could detect cracks were introduced into the pipeline business in the 1990s.These tools initially used ultrasonics to detect the cracks, but vendors are now introducing MFLcrack detection tools.
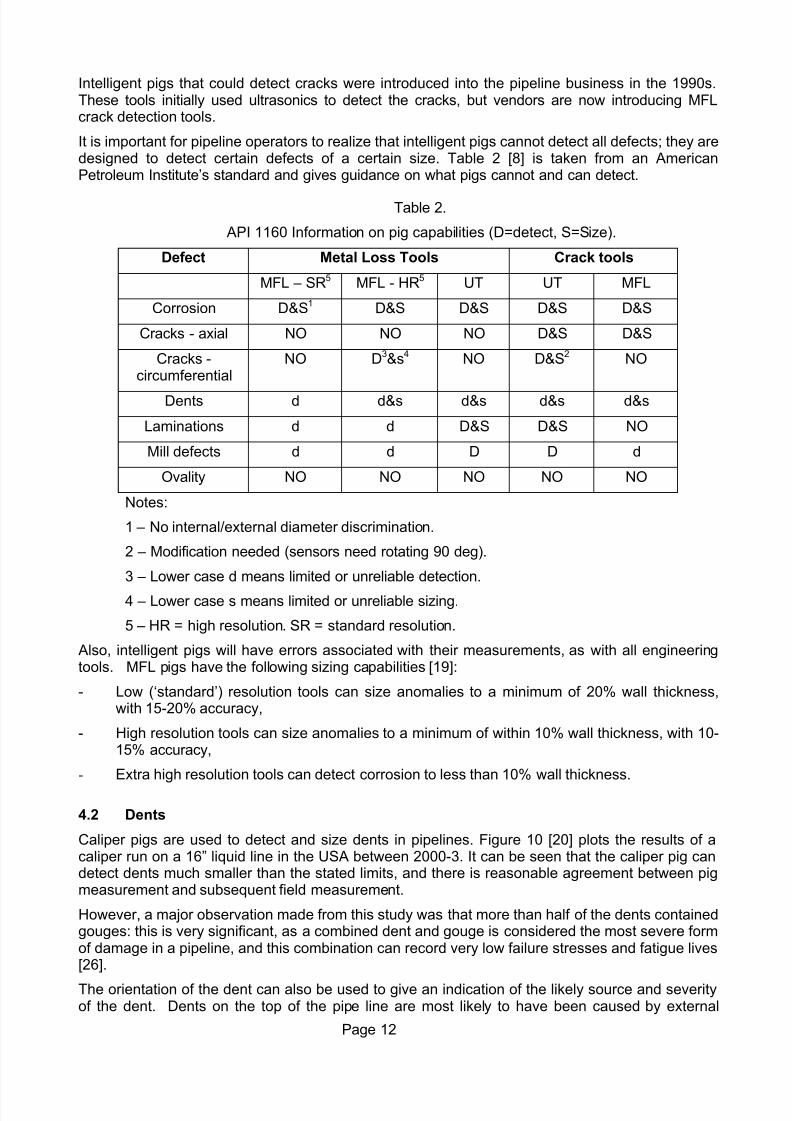
It is important for pipeline operators to realize that intelligent pigs cannot detect all defects; they aredesigned to detect certain defects of a certain size. Table 2 [8] is taken from an AmericanPetroleum Institute’s standard and gives guidance on what pigs cannot and can detect.
Table 2.
API 1160 Information on pig capabilities (D=detect, S=Size).
Defect Metal Loss Tools Crack tools
MFL – SR5 MFL - HR5 UT UT MFL
Corrosion D&S1 D&S D&S D&S D&S
Cracks - axial NO NO NO D&S D&S
Cracks -circumferential
NO D3&s4 NO D&S2 NO
Dents d d&s d&s d&s d&s
Laminations d d D&S D&S NO
Mill defects d d D D d
Ovality NO NO NO NO NO
Notes:
1 – No internal/external diameter discrimination.
2 – Modification needed (sensors need rotating 90 deg).
3 – Lower case d means limited or unreliable detection.
4 – Lower case s means limited or unreliable sizing.
5 – HR = high resolution. SR = standard resolution.
Also, intelligent pigs will have errors associated with their measurements, as with all engineeringtools. MFL pigs have the following sizing capabilities [19]:
- Low (‘standard’) resolution tools can size anomalies to a minimum of 20% wall thickness,with 15-20% accuracy,
- High resolution tools can size anomalies to a minimum of within 10% wall thickness, with 10-15% accuracy,
- Extra high resolution tools can detect corrosion to less than 10% wall thickness.
4.2 Dents
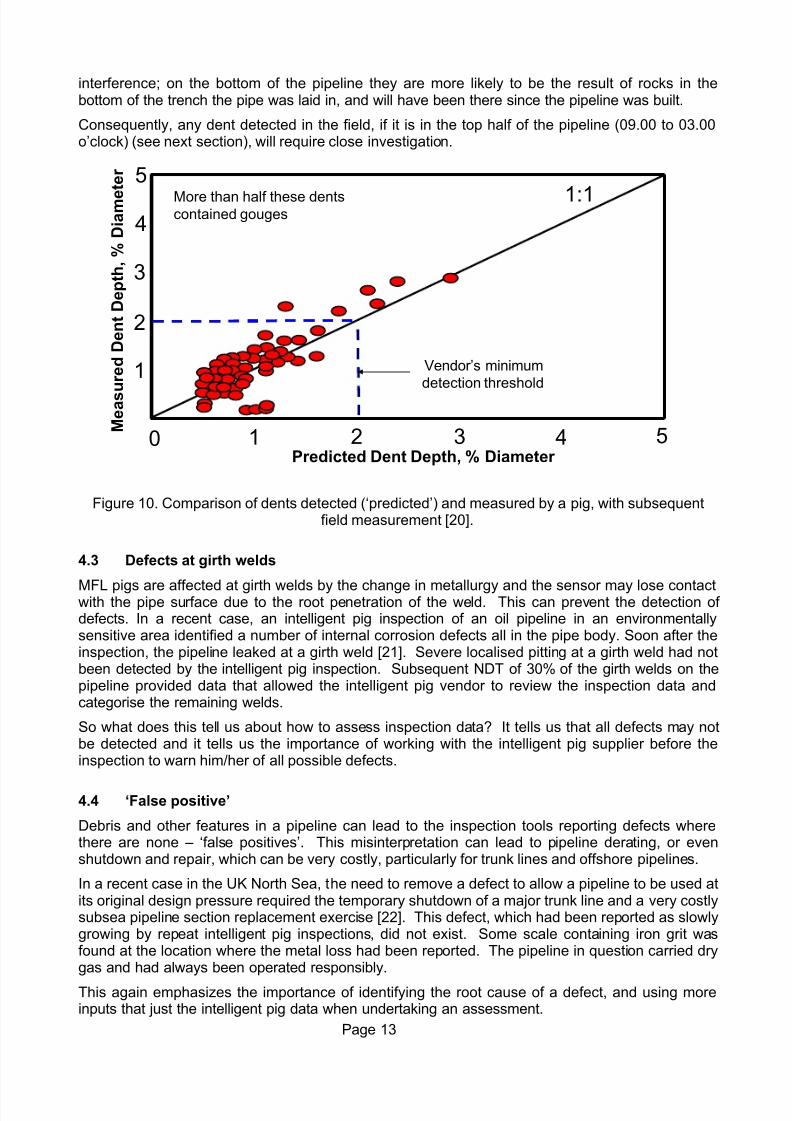
Caliper pigs are used to detect and size dents in pipelines. Figure 10 [20] plots the results of acaliper run on a 16” liquid line in the USA between 2000-3. It can be seen that the caliper pig candetect dents much smaller than the stated limits, and there is reasonable agreement between pigmeasurement and subsequent field measurement.
However, a major observation made from this study was that more than half of the dents containedgouges: this is very significant, as a combined dent and gouge is considered the most severe formof damage in a pipeline, and this combination can record very low failure stresses and fatigue lives[26].
The orientation of the dent can also be used to give an indication of the likely source and severityof the dent. Dents on the top of the pipe line are most likely to have been caused by external
7/28/2019 IT Lesson Learned
http://slidepdf.com/reader/full/it-lesson-learned 14/27
Page 13
interference; on the bottom of the pipeline they are more likely to be the result of rocks in thebottom of the trench the pipe was laid in, and will have been there since the pipeline was built.
Consequently, any dent detected in the field, if it is in the top half of the pipeline (09.00 to 03.00o’clock) (see next section), will require close investigation.
Figure 10. Comparison of dents detected (‘predicted’) and measured by a pig, with subsequentfield measurement [20].
4.3 Defects at girth welds
MFL pigs are affected at girth welds by the change in metallurgy and the sensor may lose contactwith the pipe surface due to the root penetration of the weld. This can prevent the detection of defects. In a recent case, an intelligent pig inspection of an oil pipeline in an environmentallysensitive area identified a number of internal corrosion defects all in the pipe body. Soon after theinspection, the pipeline leaked at a girth weld [21]. Severe localised pitting at a girth weld had notbeen detected by the intelligent pig inspection. Subsequent NDT of 30% of the girth welds on thepipeline provided data that allowed the intelligent pig vendor to review the inspection data andcategorise the remaining welds.
So what does this tell us about how to assess inspection data? It tells us that all defects may notbe detected and it tells us the importance of working with the intelligent pig supplier before theinspection to warn him/her of all possible defects.
4.4 ‘False positive’
Debris and other features in a pipeline can lead to the inspection tools reporting defects wherethere are none – ‘false positives’. This misinterpretation can lead to pipeline derating, or evenshutdown and repair, which can be very costly, particularly for trunk lines and offshore pipelines.
In a recent case in the UK North Sea, the need to remove a defect to allow a pipeline to be used atits original design pressure required the temporary shutdown of a major trunk line and a very costlysubsea pipeline section replacement exercise [22]. This defect, which had been reported as slowlygrowing by repeat intelligent pig inspections, did not exist. Some scale containing iron grit wasfound at the location where the metal loss had been reported. The pipeline in question carried drygas and had always been operated responsibly.
This again emphasizes the importance of identifying the root cause of a defect, and using moreinputs that just the intelligent pig data when undertaking an assessment.
More than half these dentscontained gouges
0 1 2 3 4 5
1
2
3
4
5
Predicted Dent Depth, % Diameter
M e a s u r e d D e n t D e p t h , % D
i a m e
t e r
Vendor’s minimumdetection threshold
1:1
7/28/2019 IT Lesson Learned
http://slidepdf.com/reader/full/it-lesson-learned 15/27
Page 14
4.5 Growth rate analysis
The estimation of corrosion growth rates based on intelligent pig data is increasingly common (seeprevious section). Corrosion defects reported by two pig runs can be compared and a corrosionrate estimated. This is done using processed data, comparing reported defect sizes or using thesensor signal data, and comparing signals to derive a change in signal and hence a change indefect depth [23]. These defects can then be assessed using ‘fitness for purpose’ methods [24,
26].This type of pig data analysis is extremely valuable for predicting when repairs should be done,when the pipeline should be re-inspected, and helps extend the economic life of the line. However,it must be treated with caution, and knowledge of corrosion processes and pipeline operation mustbe incorporated into any assessment. For example, pig accuracy and tolerances will invariablyproduce anomalies such as negative corrosion rates (the corrosion is decreasing in size) for somelocations.
Where an analysis is based on an unprocessed signal, the legitimacy of this method must bedemonstrated with practical test results (signals from a sample of defects before and after a knownincrease used to give an estimated growth that can be compared with the actual growth): to datethe author has seen no such validation. Methods based on the sized defects must consider the
corrosion process, treat the data consistently, and consider the sizing issues discussed above. A publication later this year [25], shows the errors associated with calculating corrosion rates fromsuccessive pig runs, and demonstrates the benefits of both improved pig accuracies and rationalstatistical analysis. Reference 26 gives the methods for assessing al types of pipeline defects,including corrosion.
4.6 Contract inspection accuracy and significant figures in reporting
Inspection tolerances agreed and quoted in an inspection contract can affect the way thatinspection companies report detected defects.
In a recent assessment of intelligent pig data, the accuracy quoted for the axial position of a
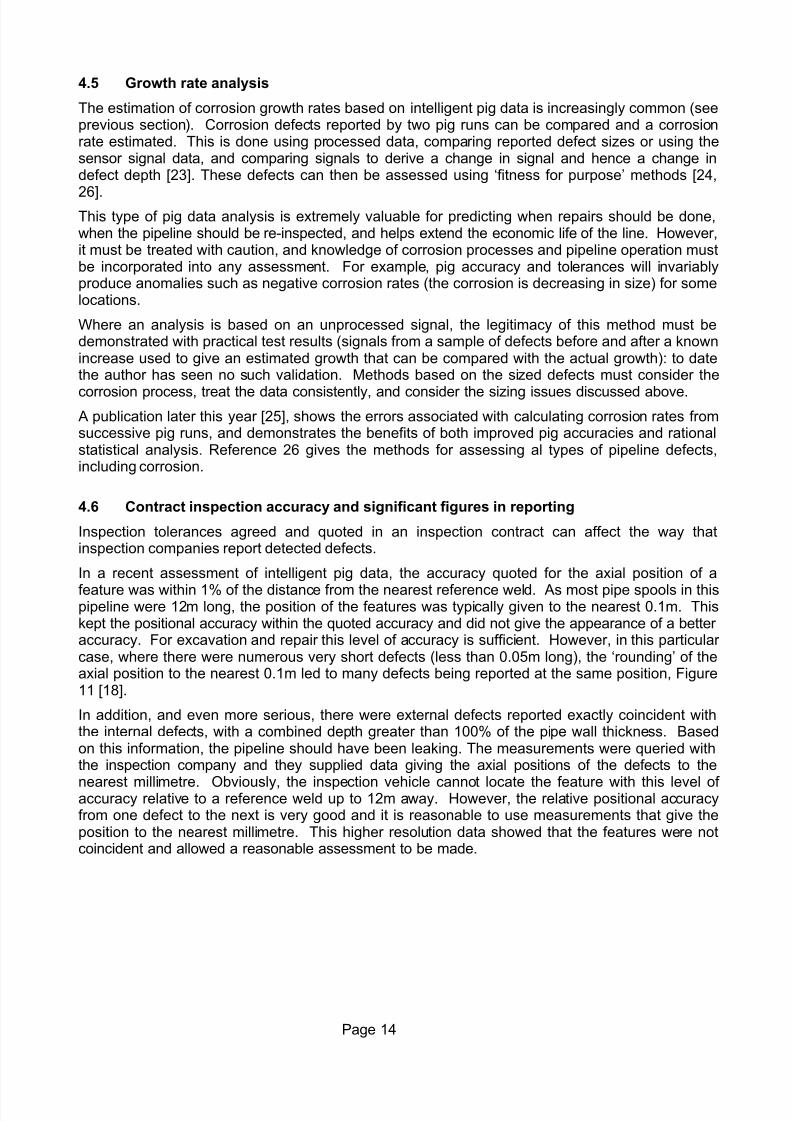
feature was within 1% of the distance from the nearest reference weld. As most pipe spools in thispipeline were 12m long, the position of the features was typically given to the nearest 0.1m. Thiskept the positional accuracy within the quoted accuracy and did not give the appearance of a better accuracy. For excavation and repair this level of accuracy is sufficient. However, in this particular case, where there were numerous very short defects (less than 0.05m long), the ‘rounding’ of theaxial position to the nearest 0.1m led to many defects being reported at the same position, Figure11 [18].
In addition, and even more serious, there were external defects reported exactly coincident withthe internal defects, with a combined depth greater than 100% of the pipe wall thickness. Basedon this information, the pipeline should have been leaking. The measurements were queried withthe inspection company and they supplied data giving the axial positions of the defects to the
nearest millimetre. Obviously, the inspection vehicle cannot locate the feature with this level of accuracy relative to a reference weld up to 12m away. However, the relative positional accuracyfrom one defect to the next is very good and it is reasonable to use measurements that give theposition to the nearest millimetre. This higher resolution data showed that the features were notcoincident and allowed a reasonable assessment to be made.
7/28/2019 IT Lesson Learned
http://slidepdf.com/reader/full/it-lesson-learned 16/27
Page 15
Figure 11. Example of defects reported as coincident due to reporting tolerances.
4.7 Shallow defects (less than 10% of the pipe wall)
Both old and new pipelines will inevitably contain some defects. This is reflected in the codes, i.e.
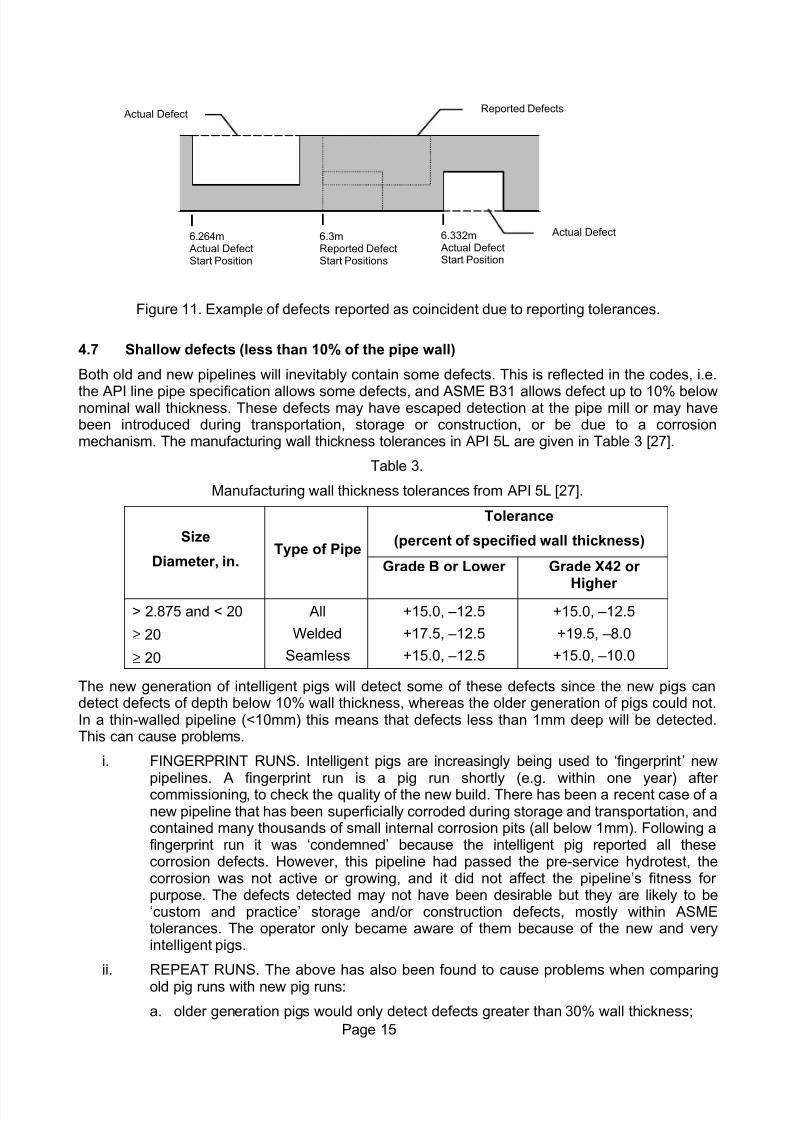
the API line pipe specification allows some defects, and ASME B31 allows defect up to 10% belownominal wall thickness. These defects may have escaped detection at the pipe mill or may havebeen introduced during transportation, storage or construction, or be due to a corrosionmechanism. The manufacturing wall thickness tolerances in API 5L are given in Table 3 [27].
Table 3.
Manufacturing wall thickness tolerances from API 5L [27].
Tolerance
(percent of specified wall thickness)Size
Diameter, in.Type of Pipe
Grade B or Lower Grade X42 or
Higher > 2.875 and < 20
≥ 20
≥ 20
All
Welded
Seamless
+15.0, –12.5
+17.5, –12.5
+15.0, –12.5
+15.0, –12.5
+19.5, –8.0
+15.0, –10.0
The new generation of intelligent pigs will detect some of these defects since the new pigs candetect defects of depth below 10% wall thickness, whereas the older generation of pigs could not.In a thin-walled pipeline (<10mm) this means that defects less than 1mm deep will be detected.This can cause problems.
i. FINGERPRINT RUNS. Intelligent pigs are increasingly being used to ‘fingerprint’ new
pipelines. A fingerprint run is a pig run shortly (e.g. within one year) after commissioning, to check the quality of the new build. There has been a recent case of anew pipeline that has been superficially corroded during storage and transportation, andcontained many thousands of small internal corrosion pits (all below 1mm). Following afingerprint run it was ‘condemned’ because the intelligent pig reported all thesecorrosion defects. However, this pipeline had passed the pre-service hydrotest, thecorrosion was not active or growing, and it did not affect the pipeline’s fitness for purpose. The defects detected may not have been desirable but they are likely to be‘custom and practice’ storage and/or construction defects, mostly within ASMEtolerances. The operator only became aware of them because of the new and veryintelligent pigs.
ii. REPEAT RUNS. The above has also been found to cause problems when comparing
old pig runs with new pig runs:
a. older generation pigs would only detect defects greater than 30% wall thickness;
Actual DefectReported Defects
Actual Defect6.3mReported DefectStart Positions
6.264m Actual DefectStart Position
6.332m Actual DefectStart Position
7/28/2019 IT Lesson Learned
http://slidepdf.com/reader/full/it-lesson-learned 17/27
Page 16
b. later generations of pigs could detect defects that where 20% of wall-thickness;
c. the current generation are capable of detecting defects less than 10% of wallthickness.
Therefore a pipeline that was fingerprinted using old technology and passed as ‘defect free’ (i.e. nodefect above 20% wall thickness), may (on a new run today) have 10,000 defects reported, allunder 20% wall thickness, but nevertheless reportable using new technology.
Clearly, there is a need to quantify the ‘workmanship’ level of defects on a fingerprint run,otherwise perfectly acceptable new constructions containing ‘custom and practice’ defects, will bethe subject of lengthy arguments between operator and constructor [28].
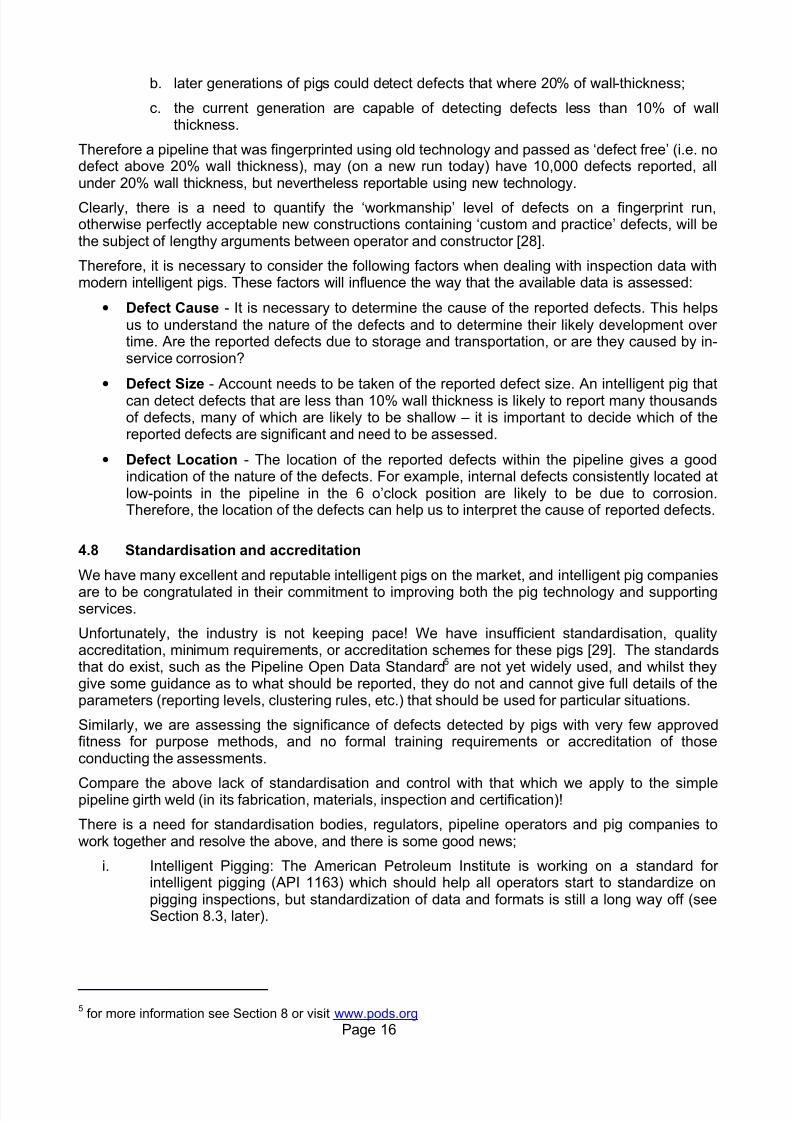
Therefore, it is necessary to consider the following factors when dealing with inspection data withmodern intelligent pigs. These factors will influence the way that the available data is assessed:
• Defect Cause - It is necessary to determine the cause of the reported defects. This helpsus to understand the nature of the defects and to determine their likely development over time. Are the reported defects due to storage and transportation, or are they caused by in-service corrosion?
• Defect Size - Account needs to be taken of the reported defect size. An intelligent pig thatcan detect defects that are less than 10% wall thickness is likely to report many thousandsof defects, many of which are likely to be shallow – it is important to decide which of thereported defects are significant and need to be assessed.
• Defect Location - The location of the reported defects within the pipeline gives a goodindication of the nature of the defects. For example, internal defects consistently located atlow-points in the pipeline in the 6 o’clock position are likely to be due to corrosion.Therefore, the location of the defects can help us to interpret the cause of reported defects.
4.8 Standardisation and accreditation
We have many excellent and reputable intelligent pigs on the market, and intelligent pig companies
are to be congratulated in their commitment to improving both the pig technology and supportingservices.
Unfortunately, the industry is not keeping pace! We have insufficient standardisation, qualityaccreditation, minimum requirements, or accreditation schemes for these pigs [29]. The standardsthat do exist, such as the Pipeline Open Data Standard5 are not yet widely used, and whilst theygive some guidance as to what should be reported, they do not and cannot give full details of theparameters (reporting levels, clustering rules, etc.) that should be used for particular situations.
Similarly, we are assessing the significance of defects detected by pigs with very few approvedfitness for purpose methods, and no formal training requirements or accreditation of thoseconducting the assessments.
Compare the above lack of standardisation and control with that which we apply to the simplepipeline girth weld (in its fabrication, materials, inspection and certification)!
There is a need for standardisation bodies, regulators, pipeline operators and pig companies towork together and resolve the above, and there is some good news;
i. Intelligent Pigging: The American Petroleum Institute is working on a standard for intelligent pigging (API 1163) which should help all operators start to standardize onpigging inspections, but standardization of data and formats is still a long way off (seeSection 8.3, later).
5 for more information see Section 8 or visit www.pods.org
7/28/2019 IT Lesson Learned
http://slidepdf.com/reader/full/it-lesson-learned 18/27
Page 17
ii. Defect Assessment: Reference 26 details a pipeline defect assessment manual thatwas sponsored by 15 major companies in the oil and gas pipeline business. Thismanual could be the basis of a defect assessment standard.
iii. Data Management: See Section 8.
5. LESSONS LEARNT FROM LEAK DETECTION
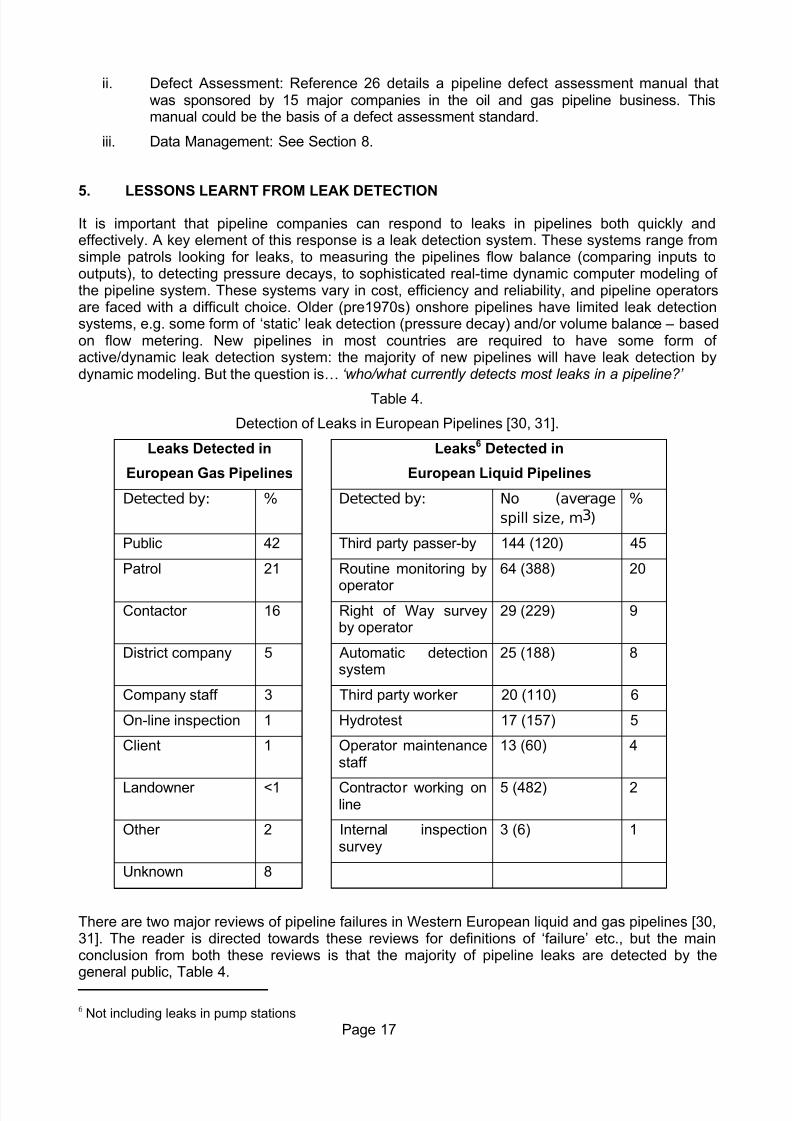
It is important that pipeline companies can respond to leaks in pipelines both quickly andeffectively. A key element of this response is a leak detection system. These systems range fromsimple patrols looking for leaks, to measuring the pipelines flow balance (comparing inputs tooutputs), to detecting pressure decays, to sophisticated real-time dynamic computer modeling of the pipeline system. These systems vary in cost, efficiency and reliability, and pipeline operatorsare faced with a difficult choice. Older (pre1970s) onshore pipelines have limited leak detectionsystems, e.g. some form of ‘static’ leak detection (pressure decay) and/or volume balance – basedon flow metering. New pipelines in most countries are required to have some form of active/dynamic leak detection system: the majority of new pipelines will have leak detection bydynamic modeling. But the question is… ‘who/what currently detects most leaks in a pipeline?’
Table 4.
Detection of Leaks in European Pipelines [30, 31].
Leaks Detected in
European Gas Pipelines
Leaks6 Detected in
European Liquid Pipelines
Detected by: % Detected by: No (average
spill size, m3)
%
Public 42 Third party passer-by 144 (120) 45
Patrol 21 Routine monitoring by
operator
64 (388) 20
Contactor 16 Right of Way surveyby operator
29 (229) 9
District company 5 Automatic detectionsystem
25 (188) 8
Company staff 3 Third party worker 20 (110) 6
On-line inspection 1 Hydrotest 17 (157) 5
Client 1 Operator maintenancestaff
13 (60) 4
Landowner <1 Contractor working online
5 (482) 2
Other 2 Internal inspectionsurvey
3 (6) 1
Unknown 8
There are two major reviews of pipeline failures in Western European liquid and gas pipelines [30,31]. The reader is directed towards these reviews for definitions of ‘failure’ etc., but the mainconclusion from both these reviews is that the majority of pipeline leaks are detected by thegeneral public, Table 4.
6 Not including leaks in pump stations
7/28/2019 IT Lesson Learned
http://slidepdf.com/reader/full/it-lesson-learned 19/27
Page 18
Many of the pipelines included in both of these reviews will be old and may not have active or dynamic leak detection systems fitted, and therefore it is not possible to draw conclusions on their effectiveness.
However, the lesson learnt from pipeline leaks is that they are more likely to be detected by apasser-by, than by the pipeline company.
Additionally, pipeline failures can take several hours for the pipeline operator to detect: following a
pipeline rupture, controllers often continue to operate a pipeline or restart a system that had shutdown, rather than promptly shutting the system down and isolating the leak.
6. LESSONS LEARNT FROM PIPELINE SURVEILLANCE
Most pipeline operators survey their pipelines by air, usually every two weeks. This survey ensuresthat the building density around a pipeline is not contravening limits set in codes and regulations,and – more important – checks that work is not taking place on or around (‘encroaching’) thepipeline that might damage it.
This air patrol gave the ‘first sighting’ of any activity in 30 – 60% of incidents [16], but many are
missed because of their short duration (between 60% and 90% of the total encroachment activitieslasted less than 2 weeks).
A recent report presented the results of a number of trials on the effectiveness of air patrols andcompared their effectiveness with that of modern satellites [32]
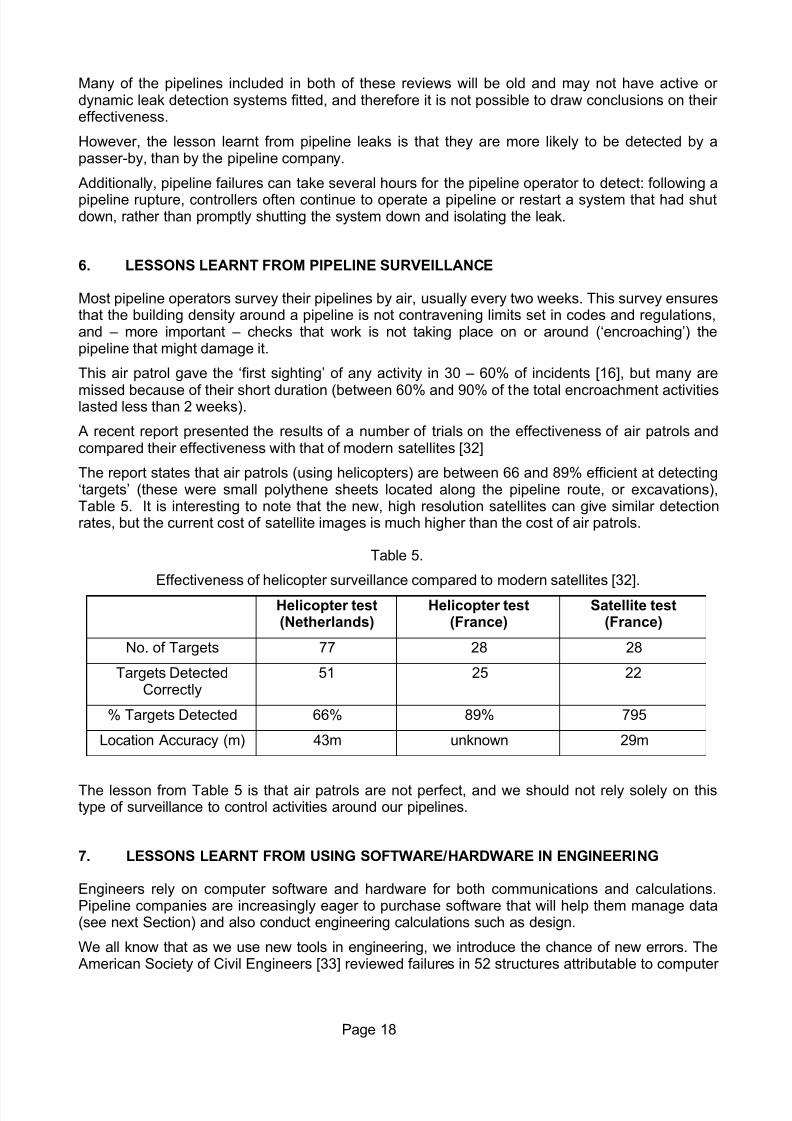
The report states that air patrols (using helicopters) are between 66 and 89% efficient at detecting‘targets’ (these were small polythene sheets located along the pipeline route, or excavations),Table 5. It is interesting to note that the new, high resolution satellites can give similar detectionrates, but the current cost of satellite images is much higher than the cost of air patrols.
Table 5.
Effectiveness of helicopter surveillance compared to modern satellites [32].
Helicopter test(Netherlands)
Helicopter test(France)
Satellite test(France)
No. of Targets 77 28 28
Targets DetectedCorrectly
51 25 22
% Targets Detected 66% 89% 795
Location Accuracy (m) 43m unknown 29m
The lesson from Table 5 is that air patrols are not perfect, and we should not rely solely on thistype of surveillance to control activities around our pipelines.
7. LESSONS LEARNT FROM USING SOFTWARE/HARDWARE IN ENGINEERING
Engineers rely on computer software and hardware for both communications and calculations.Pipeline companies are increasingly eager to purchase software that will help them manage data(see next Section) and also conduct engineering calculations such as design.
We all know that as we use new tools in engineering, we introduce the chance of new errors. The American Society of Civil Engineers [33] reviewed failures in 52 structures attributable to computer
7/28/2019 IT Lesson Learned
http://slidepdf.com/reader/full/it-lesson-learned 20/27
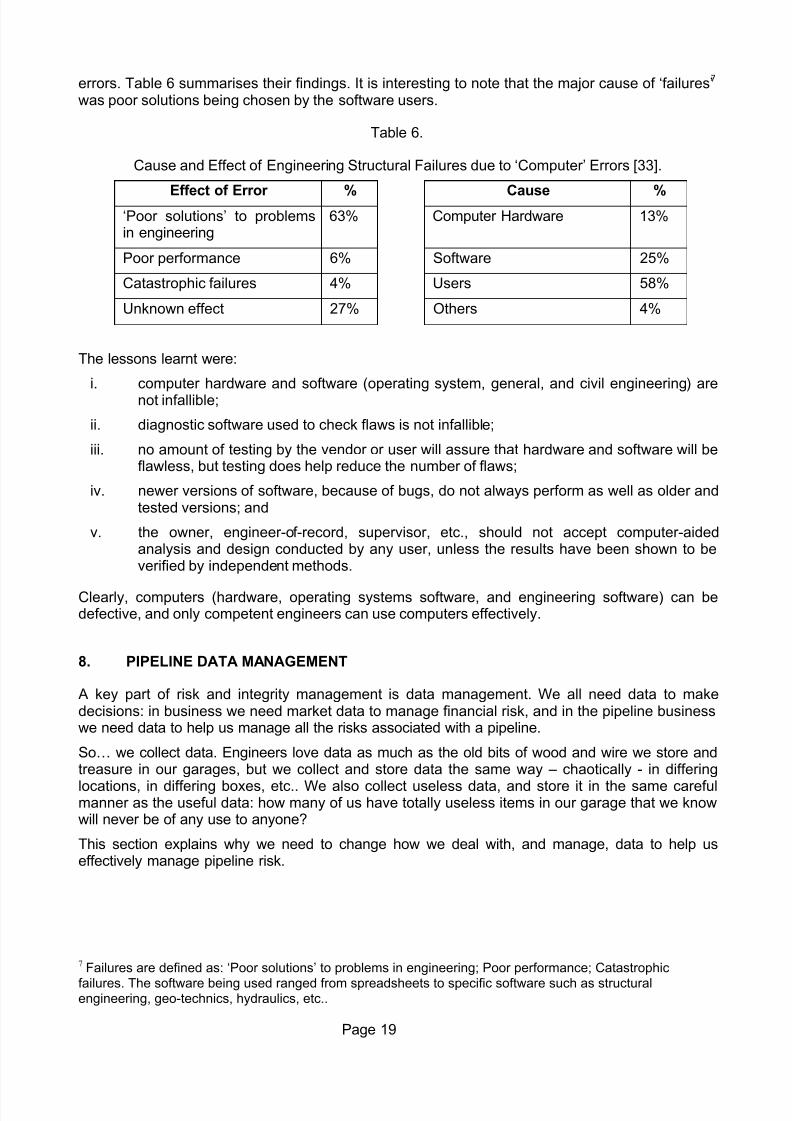
Page 19
errors. Table 6 summarises their findings. It is interesting to note that the major cause of ‘failures’7 was poor solutions being chosen by the software users.
Table 6.
Cause and Effect of Engineering Structural Failures due to ‘Computer’ Errors [33].
Effect of Error % Cause %‘Poor solutions’ to problemsin engineering
63% Computer Hardware 13%
Poor performance 6% Software 25%
Catastrophic failures 4% Users 58%
Unknown effect 27% Others 4%
The lessons learnt were:
i. computer hardware and software (operating system, general, and civil engineering) arenot infallible;
ii. diagnostic software used to check flaws is not infallible;
iii. no amount of testing by the vendor or user will assure that hardware and software will beflawless, but testing does help reduce the number of flaws;
iv. newer versions of software, because of bugs, do not always perform as well as older andtested versions; and
v. the owner, engineer-of-record, supervisor, etc., should not accept computer-aidedanalysis and design conducted by any user, unless the results have been shown to beverified by independent methods.
Clearly, computers (hardware, operating systems software, and engineering software) can bedefective, and only competent engineers can use computers effectively. 8. PIPELINE DATA MANAGEMENT
A key part of risk and integrity management is data management. We all need data to makedecisions: in business we need market data to manage financial risk, and in the pipeline businesswe need data to help us manage all the risks associated with a pipeline.
So… we collect data. Engineers love data as much as the old bits of wood and wire we store andtreasure in our garages, but we collect and store data the same way – chaotically - in differing
locations, in differing boxes, etc.. We also collect useless data, and store it in the same carefulmanner as the useful data: how many of us have totally useless items in our garage that we knowwill never be of any use to anyone?
This section explains why we need to change how we deal with, and manage, data to help useffectively manage pipeline risk.
7 Failures are defined as: ‘Poor solutions’ to problems in engineering; Poor performance; Catastrophic
failures. The software being used ranged from spreadsheets to specific software such as structuralengineering, geo-technics, hydraulics, etc..
7/28/2019 IT Lesson Learned
http://slidepdf.com/reader/full/it-lesson-learned 21/27
Page 20
8.1 Data management overview
Let us start this section with some simple questions:
• Is the bulk of the data you collect today, of use today?
• Does the data you collect today, address future issues?
• Are you prepared for tomorrow?
Collating data is relatively easy – we have large database packages that allow us to store anythingand everything. But data alone is useless – it is when it is transferred into knowledge and facilitatesdecision-making that it becomes of use.
To allow our data to become knowledge we need databases that are easily accessible and easilyanalysed, but one of our biggest problems is incompatibility between the databases we use: thesehuge data warehouses that store our data are often incompatible.
Pipeline companies will have a number of databases where they store data. These databases canreside in different departments/locations, and may not compatible or be easily accessible.
Pipeline companies are good at systematically recording component and assembly drawings(documents), but often do not keep comprehensive records of their attributes such as 'size','weight', 'where used‘, etc.. As a result, engineers often have problems accessing the detailedinformation they need. This leaves an unfortunate gap in their ability to manage their pipelineeffectively: it has been estimated that engineers spend 25% of their working day searching for data….
Data management systems should be able to manage both attribute and documentary productdata, as well as relationships between them, through a relational database system.
8.2 Data management in the pipeline business
The solution for the pipeline business is to systematically organise our data in our database:
i. DATA – Are essential to the safe management of our pipelines, and we are gatheringmore and more data.
ii. COMPUTERISATION – Companies are now spending time and money to integrate allaspects of the business & datasets, and are creating large…
iii. DATABASES – These are large, and can be used across a company, and resemble a‘warehouse’ (or ‘marts’) where we can collect our data.
iv. APPLICATIONS – The companies are using these data in ‘ Applications’ such as GIS, andrisk analysis programs: these Applications are constantly changing and improving, but our data must remain constant. As an industry, we will not develop Applications, so we neednot concern ourselves with them, but we must organise our data for their use.
v. JARGON, DIFFERING FORMATS & DIFFERING DATA REQUIREMENTS – But our applications all have differing data needs and formats.
vi. DATABASE DESIGN – Therefore, we need a standardised database design thatorganises all our business data requirements and formats, and it must be an…
vii. ‘OPEN’ ‘STANDARD’8 – it must be freely available to all, and adopted as a standard by allparties, including Applications and the Service Sector.
This sounds very easy… but it is not:
i. COMPATIBILITY – Transfer of data across companies is often not possible due todiffering formats, etc.. For example, the data a pipeline company receives from differing
8‘Open standard’ – a standard set of data structures and formats in the public domain available for all to use, preferably recognised by
an International Standards body such as ISO.
7/28/2019 IT Lesson Learned
http://slidepdf.com/reader/full/it-lesson-learned 22/27
Page 21
inspection companies (above ground inspections, river crossings, intelligent pigs, etc.)will all be presented in different formats.
ii. TRANSFERABILITY – As assets are bought and sold, the bought asset data has to beincorporated into the new owner’s systems – consistent data models, languages andformats are needed.
iii. INPUT/OUTPUT FOR APPLICATIONS – We need to be able to input data to our
databases, so we need consistency. When we access our databases through Applications (e.g. GIS), we need to ensure the data can be uploaded AND we can thendownload results into our database.
iv. SERVICE SECTOR – We need to specify the data we need from our inspectioncompanies, surveyors, etc., to allow easy storage. Also, when we ask our service sector to use our data (e.g. audits), we need the data to be easily transferable into their own Applications.
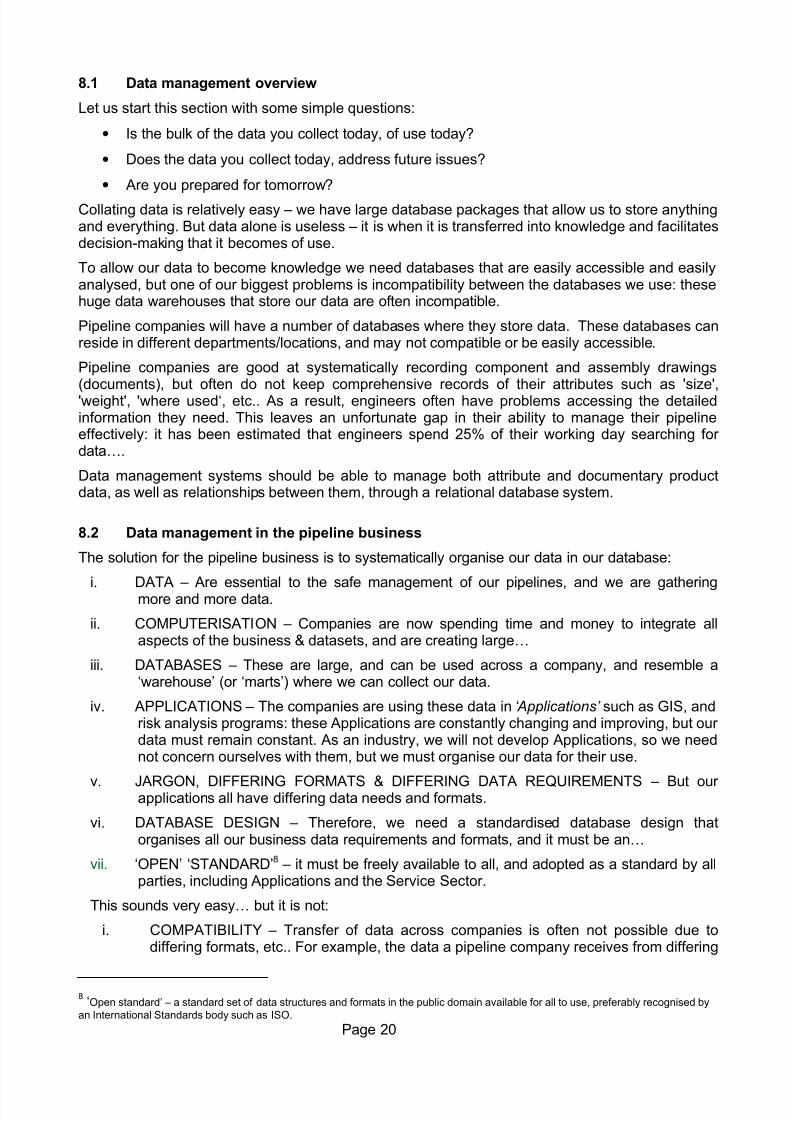
Figure 11. Data Management Domains [34].
8.3 The way forward
If we want to effectively manage our pipeline risk we need to both organize and standardise our data management, otherwise we will not be able to assess, monitor or control risk.
Currently, there are two basic data management approaches (‘domains’), Figure 11:i. In the application domain the database and data management functions are dependent
on, and an integral part, of an application, (e.g. a Geographic Information Systems (GIS)),where special software uses the data. The data reside within the application. These arethe most common in our business.
ii. In the warehouse domain the database and data management function is independent of any application. The data is contained in a ‘warehouse’ that can be accessed by anyapplication.
The pipeline business is dominated by the former approach. For example, a brief WEB searchusing the key words “pipeline+database” returned information on 68 organisations that operatedsome 100 software packages that utilised some form of database containing pipeline information.These are summarised in Table 7 [34].
Data Application Domain
Application C
Application A
Application B
Database
Database
Database
Application C
Application A
Application B
Database
Data Warehouse Domain
7/28/2019 IT Lesson Learned
http://slidepdf.com/reader/full/it-lesson-learned 23/27
Page 22
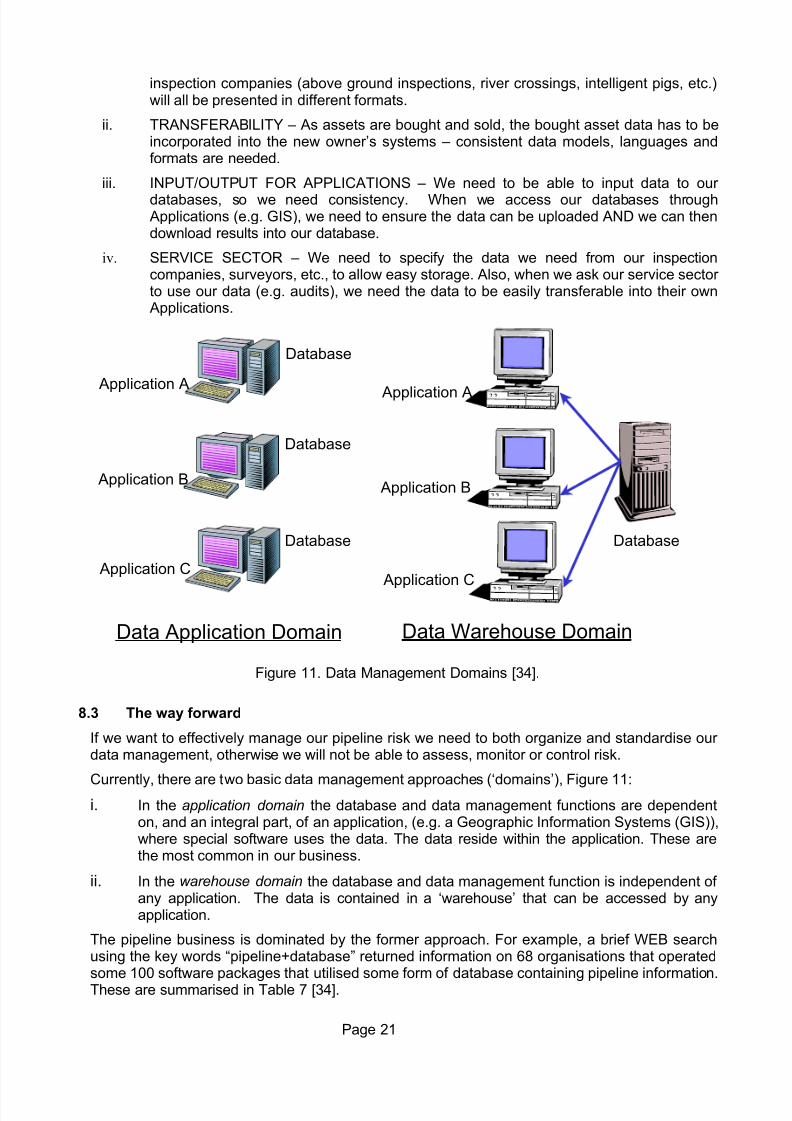
Table 7.
Summary of pipeline databases [34].
Type of database system % of total systems
Databases with limited or no applications 15%GIS, Mapping & Imagery Applications 38%
National / Regional Databases1 10%
Corrosion Protection / Pigging Systems 10%
Engineering Applications2 27%
1 In the main these are GIS-based systems.2 These include Risk, Integrity, Asset, Facilities and Project Management Applications.
The application domain creates a situation whereby data is "locked in" to an application andcannot be accessed by other applications. For example a database built up in a GIS application,may not easily be accessed by a risk assessment application. This may also ‘lock’ a pipelineoperator to the application vendor: a situation many now find unacceptable.
The solution, to the inherent failings of application domain data management, is to manageinformation independent of any application so that it is available to a wide variety of users andapplications. This approach is the data warehouse domain data management environment . It isbased on the simple principal that (software) applications and pipeline data have differingownership and life spans: data must last forever and resides within a pipeline operator, whereasapplications are continually being updated/changed and are the property of a software vendor.
This also means the skills and knowledge base of the people responsible for each will also residein different locations.
There are now two major initiatives in the pipeline business that are attempting to standardizehow we manage our data:
i. The ‘PODS’9 initiative in the USA [35] was the first step: the USA pipeline industry isbuilding its databases in accordance with a company-wide or industry-wide standard ‘toallow operators to compare their own performance with comparable companies or acrossthe pipeline industry’. The Pipeline Open Data Standard (PODS) is managed by, and for,the pipeline industry [35].
ii. The ‘ISPDM’10 initiative in Europe is providing further (similar) advances [34]. Thisindustry standard pipeline data management project was a $1milllion project supported by
the European Union, and finished at the end of 2002.
9. AFFIRMATION OF MAXIMUM ALLOWABLE OERATING PRESSURE (MAOP) ANDAUDITS
Some pipeline codes require regular, formal audits of pipelines to ensure they are operating atpressures within code requirements; for example, pipeline codes in the UK and Australia requirepipeline operators to regularly review their MAOP. This is important, as infrastructure changes, or pipeline condition, may require a reduction in MAOP.
9 www.pods.org
10 www.ispdm.org.
7/28/2019 IT Lesson Learned
http://slidepdf.com/reader/full/it-lesson-learned 24/27
Page 23
All pipelines should be the subject of regular risk reviews [8,9], regardless of their age This shouldinclude regular independent audits, and also include a thorough evaluation of the condition of apipeline if it is to be:
- uprated beyond its original design pressure, or extended beyond its design life,
- operated at a higher pressure than it has experienced in, say, the past four years,
- change of product,- change ownership: many pipelines are now either being transferred to new owners
(e.g. by acquisition or mergers), or are under scrutiny by third parties wanting to usethem to transmit their product. An integrity review is appropriate both for due diligencereasons and also for demonstrating security of (third party) supplies [12].
10. CONCLUDING REMARKS
i. The pipeline industry is changing: its plant is ageing, and new regulations are beingintroduced to force operators to effectively manage their pipeline’s integrity. Theregulations require the integrity management process to be included in a ‘Pipeline
(Integrity) Management System’, which ensures all processes and procedures areapplied, and performance measured, reviewed and audited. Operators in other parts of the world, who are not covered by such regulations, should learn from the lessons inthe USA: as our systems age, we must invest more in pipeline integrity. A good safetyrecord, or a dismissal of the experiences in USA as ‘unrepresentative’, is not an excuseto avoid this investment: this type of complacency and naivety will lead to failures.
ii. A key element of managing a pipeline’s integrity is a risk assessment (Figure 9), toidentify the major threats to a pipelines safety and security. Managers need to ensurethat their staff are suitably trained to do this work, have an efficient data managementsystem, but – more important – are aware of lessons being learnt by other operatorsthrough failures, inspection, etc..
iii. We can learn clear lessons from reviewing pipeline failures: Section 3 indicates thatfailures can be caused by inadequate co-ordination of data and staff, and inadequateappreciation of risks.
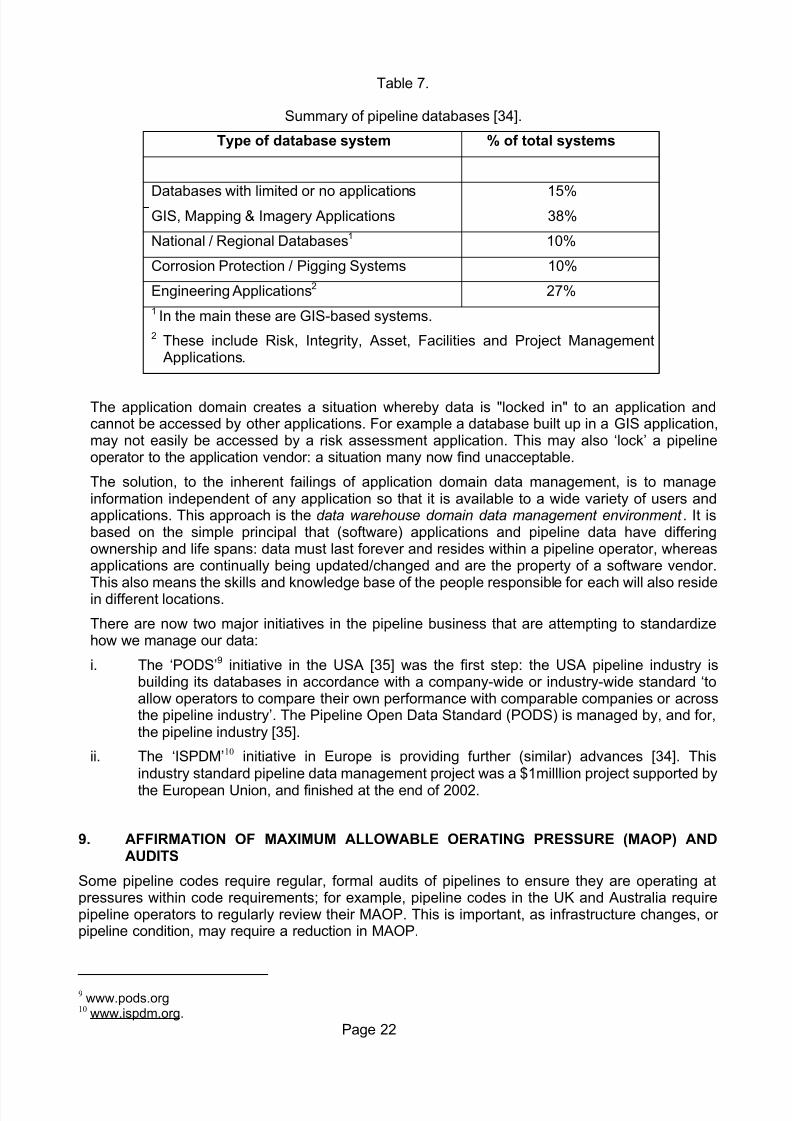
Figure 12. Position of technical and decision tools in pipeline integrity management.
DATA DATA DATA
Database
Pipeline
Integrity
Management System
Management
decision tools
Technical assessment
tools
Technicalimplementation
Management
actions
Regulations
software
software
software
7/28/2019 IT Lesson Learned
http://slidepdf.com/reader/full/it-lesson-learned 25/27
Page 24
iv. It is also clear now that in the modern day, pipeline managers will need access to largesets of data, technical tools (such as risk assessment software), and managementdecision tools, Figure 12, to allow them to operate their pipeline safely.
a. It is not sufficient to purely have a risk analysis software package, or a defectassessment model, and managers need to be careful with the use of softwarepackages (see Section 7 [33]). Figure 12 shows that it is not sufficient to have
technical assessment packages: these merely give numbers. Management mustmake the final decision on any technical assessment, using their experience of software tools. It is management that manages integrity, not a risk assessmentsoftware tool.
b. We have many databases and many technical tools available to us, but we do nothave the management decision tools that allow a manager to bring together al thedata and technical assessments: these types of decision tool would have avoidedthe failures mentioned in this paper. A complete package of tools is required toallow a pipeline integrity management system to function, and this is the major lesson learnt.
c. It is interesting that pipeline operators will spend $millions on hiring intelligent pigs,
but spend little on databases to manage the masses of data obtained from the pig.v. It is clear that we are living in rapidly changing times. A pipeline engineer will come
under increasing pressure, as companies ‘downsize’, and our engineering workforceretire in large numbers due to a high average ages, and our pipeline operators are‘stretched’ to record higher profits. It is essential that we aid our engineers and providethem with all the tools they need.
a. One important aid is a formal ‘lessons learnt’ procedure where engineers record andcirculate lessons learnt from both failures and ‘near misses’. This can be a simplefolder on the company’s main server, or a collection of technical notes easilyaccessible to all staff. Additionally, all companies should encourage staff to publish‘lessons learnt’, even if the failures being reported show deficiencies in company
practices.
11. ACKNOWLEDGEMENTS
The author would like to thank Penspen for permission to publish this paper, and his colleagues for contributions.
12. REFERENCES
[1]. P Hopkins, ‘Time to Change?’, Pipeline and Pipelines International Journal, September-October 2000. www.penspenintegrity.com
[2]. P Hopkins, ‘The Challenge of Change in Engineering’, Journal of Pipeline Integrity, Vol 1 No2, 2002. www.penspenintegrity.com
[3]. P Hopkins, ‘Changing To Pipeline Integrity Management’, PMI Conference, Venezuela, 8-12July 2002. www.penspenintegrity.com
[4]. Anon., Office of Pipeline Safety, USA. www.ops.dot.gov. [5]. Anon., ‘The Pipeline Safety Regulations 199’6 (SI 1996 No. 825), HMSO, UK, 1996.[6]. Anon., ‘A Guide to the Pipeline Safety Regulations, Guidance on Regulations’, L82, HSE
Books, HMSO, UK, 1996.[7]. Anon., ‘Regulatory Benchmark11 for the Control of Major Hazards Involving Pipelines’,
(Draft) Pipelines Safety Instrument, European Commission, Italy, July 1998.
11A ‘Benchmark’ serves as a basis for self-assessment performed by Member States to compare their
existing legislation.
7/28/2019 IT Lesson Learned
http://slidepdf.com/reader/full/it-lesson-learned 26/27

7/28/2019 IT Lesson Learned
http://slidepdf.com/reader/full/it-lesson-learned 27/27
[30]. D Lyons, ‘Western European Cross Country Oil Pipelines 30-year Performance Statistics’,CONCAWE, Brussels. Report no.1/02 February 2002. (www.concawe.be).
[31]. Anon., ‘Gas Pipeline Incidents - 4th EGIG Report’, Doc Number EGIG 99.R.0074.European Gas Incident Group (EGIG). 1999.
[32]. R Palmer-Jones et al, ‘Evaluation Of Satellite Technology For Pipeline Route Surveillance And The Prevention Of Third Party Interference Damage’, Conference on ‘Pipeline Pigging,Integrity Assessment & Repair’, Houston, February 2004.
[33]. Anon., ASCE Journal of Computing in Civil Engineering, or www.wmich.edu/jcce/e1241.htm [34]. B. Stirling, P. Hopkins, P. Day, ‘‘ISPDM’ – A 21st Century Data Hub for Pipeline System
Management’, Proceedings of IPC 2002: International Pipeline Conference (IPC 2002),Calgary, Alberta, Canada, September 29 to October 4, 2002.
[35]. T. McCallum, ‘Pipeline Open Data Standard’. Gas Research Institute Report 00/0207,December 2000.