Embed Size (px)
DESCRIPTION
ITALCEMENTI 2015 24 NOVEMBRE 15_11_24_NatixisConference_Final.
Citation preview

Italcementi Group Title 1 4 maggio 2012
Business update G. Maggiora – Chief Financial Officer
Mid Caps Conference
Natixis
Paris, 24 November 2015
Italcementi Group Natixis | Paris, 24 November 2015 2
Agenda
30 September 2015 Group Results
2015 Outlook
Opening Remarks
Italcementi Group Natixis | Paris, 24 November 2015 3
Industry consolidation and market volatility
Industry reshaping continues with HeidelbergCement's July 28, agreement to acquire control
of Italcementi from Italmobiliare. Closing expected in H1 2016, to be followed by mandatory
tender offer for the entire share capital of the company
HeidelbergCement and Italcementi management teams are currently cooperating to the extent
permitted by law to substantiate synergy objectives and identify best practices to be leveraged
across the future expanded Group
Until closing, our focus remains fixed on delivering on performance objectives and manage
revenue volatility arising from key Group markets, accentuated in Q3 2015
Italcementi Group Natixis | Paris, 24 November 2015 4
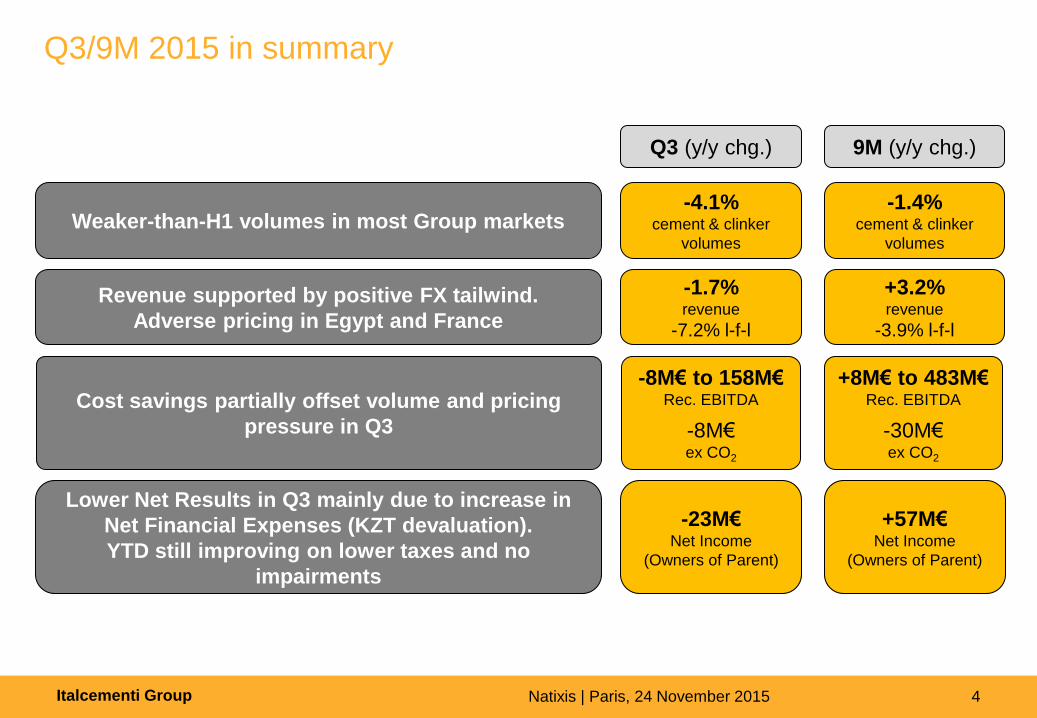
Q3/9M 2015 in summary
9M (y/y chg.) Q3 (y/y chg.)
-1.4% cement & clinker
volumes
Weaker-than-H1 volumes in most Group markets -4.1%
cement & clinker
volumes
+3.2% revenue
-3.9% l-f-l
Revenue supported by positive FX tailwind.
Adverse pricing in Egypt and France
-1.7% revenue
-7.2% l-f-l
+57M€ Net Income
(Owners of Parent)
Lower Net Results in Q3 mainly due to increase in
Net Financial Expenses (KZT devaluation).
YTD still improving on lower taxes and no
impairments
-23M€ Net Income
(Owners of Parent)
+8M€ to 483M€ Rec. EBITDA
-30M€ ex CO2
Cost savings partially offset volume and pricing
pressure in Q3
-8M€ to 158M€ Rec. EBITDA
-8M€ ex CO2
Italcementi Group Natixis | Paris, 24 November 2015 5
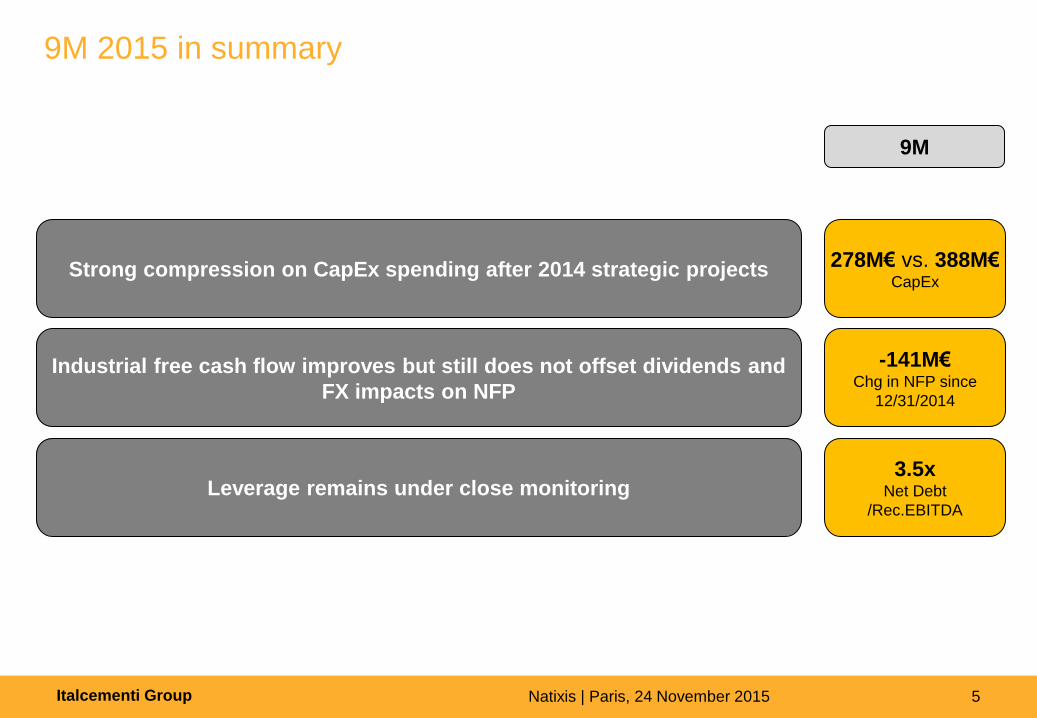
9M 2015 in summary
9M
278M€ vs. 388M€ CapEx
Strong compression on CapEx spending after 2014 strategic projects
-141M€ Chg in NFP since
12/31/2014
Industrial free cash flow improves but still does not offset dividends and
FX impacts on NFP
3.5x Net Debt
/Rec.EBITDA
Leverage remains under close monitoring
Italcementi Group Natixis | Paris, 24 November 2015 6
Agenda
30 September 2015 Group Results
2015 Outlook
Opening Remarks
Italcementi Group Natixis | Paris, 24 November 2015 7
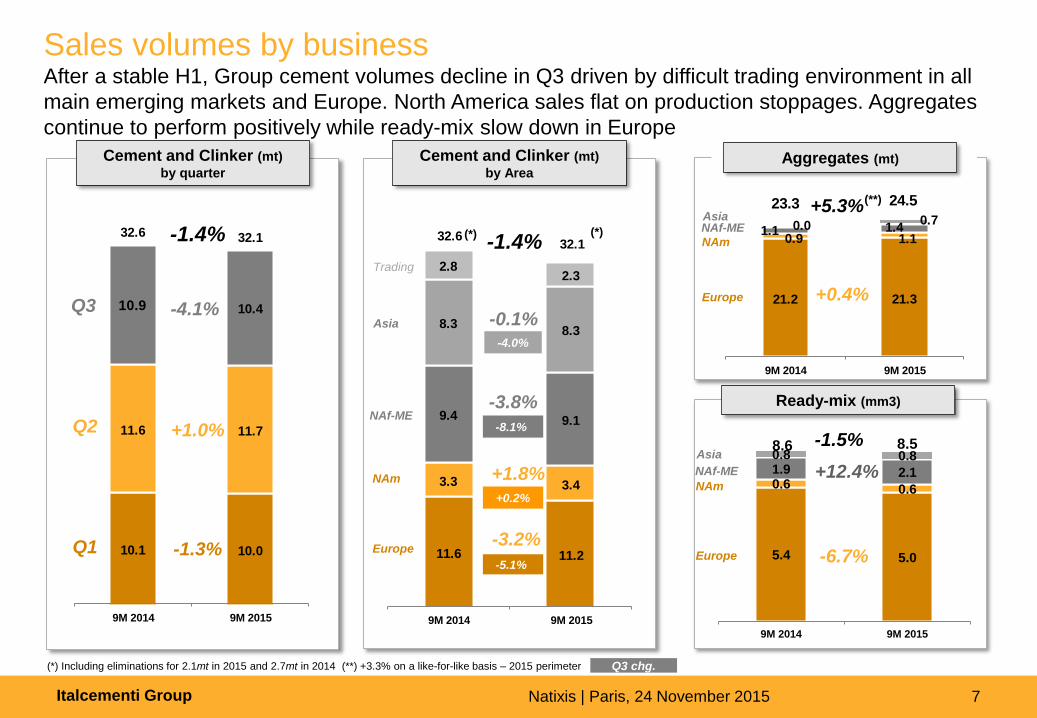
Sales volumes by business After a stable H1, Group cement volumes decline in Q3 driven by difficult trading environment in all
main emerging markets and Europe. North America sales flat on production stoppages. Aggregates
continue to perform positively while ready-mix slow down in Europe
(*) Including eliminations for 2.1mt in 2015 and 2.7mt in 2014 (**) +3.3% on a like-for-like basis – 2015 perimeter
Cement and Clinker (mt)
by Area
Cement and Clinker (mt)
by quarter
Ready-mix (mm3)
10.1 10.0
11.6 11.7
32.6 32.1
10.9 10.4
9M 2014 9M 2015
+1.0% Q2
-1.3% Q1
-1.4%
-4.1% Q3
11.6 11.2
3.3 3.4
9.4 9.1
8.38.3
2.82.3
32.632.1
9M 2014 9M 2015
Europe
NAf-ME
NAm
-3.2%
-3.8%
+1.8%
-1.4% (*) (*)
Trading
Asia -0.1%
Q3 chg.
-5.1%
-4.0%
+0.2%
-8.1%
21.2 21.3
0.9 1.11.1 1.40.0 0.7
23.3 24.5
9M 2014 9M 2015
+0.4%
+5.3%
Europe
NAf-ME
NAm
Asia
(**)
Aggregates (mt)
5.4 5.0
0.6 0.6
1.9 2.1
0.8 0.88.6 8.5
9M 2014 9M 2015
Europe
NAf-ME
NAm
Asia
-6.7%
-1.5%
+12.4%
Italcementi Group Natixis | Paris, 24 November 2015 8
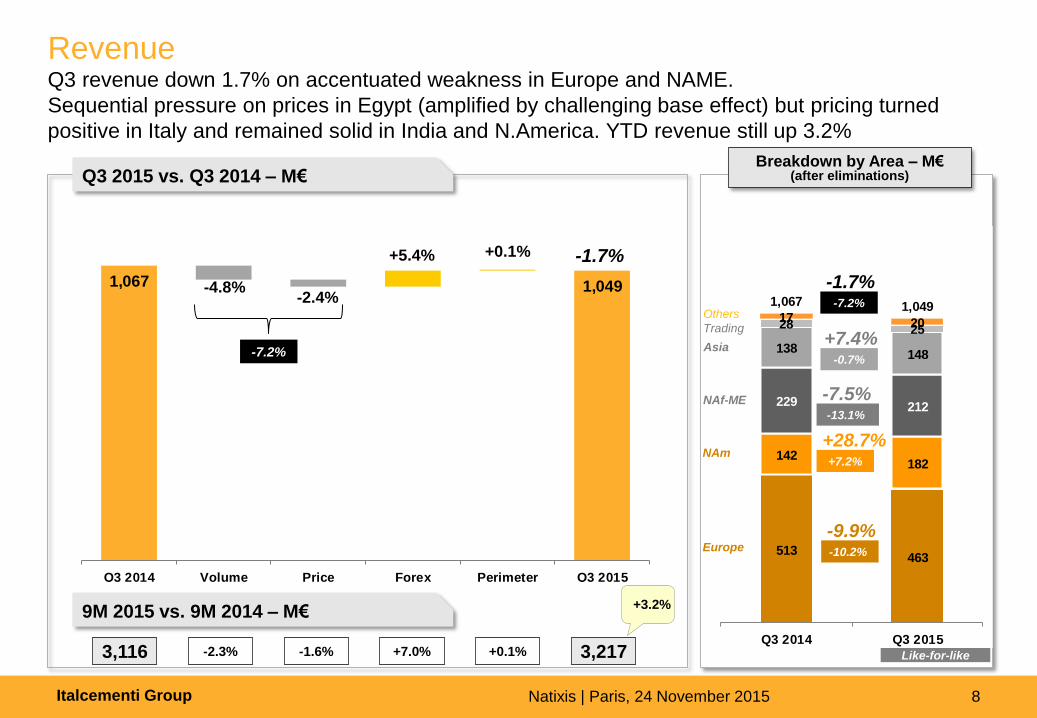
Revenue Q3 revenue down 1.7% on accentuated weakness in Europe and NAME.
Sequential pressure on prices in Egypt (amplified by challenging base effect) but pricing turned
positive in Italy and remained solid in India and N.America. YTD revenue still up 3.2%
Breakdown by Area – M€ (after eliminations)
Like-for-like
Q3 2015 vs. Q3 2014 – M€
9M 2015 vs. 9M 2014 – M€
-2.3% 3,116 +0.1% +7.0% 3,217 -1.6%
+3.2%
513463
142182
229 212
138148
28 2517 20
1,067 1,049
Q3 2014 Q3 2015
-9.9% -10.2%
+7.4% -0.7%
+28.7% +7.2%
-7.5% -13.1%
-1.7% -7.2%
Europe
NAf-ME
Others
Trading
NAm
Asia
1,067 1,049
Q3 2014 Volume Price Forex Perimeter Q3 2015
-1.7%
-7.2%
-2.4%
+5.4% +0.1%
-4.8%
Italcementi Group Natixis | Paris, 24 November 2015 9
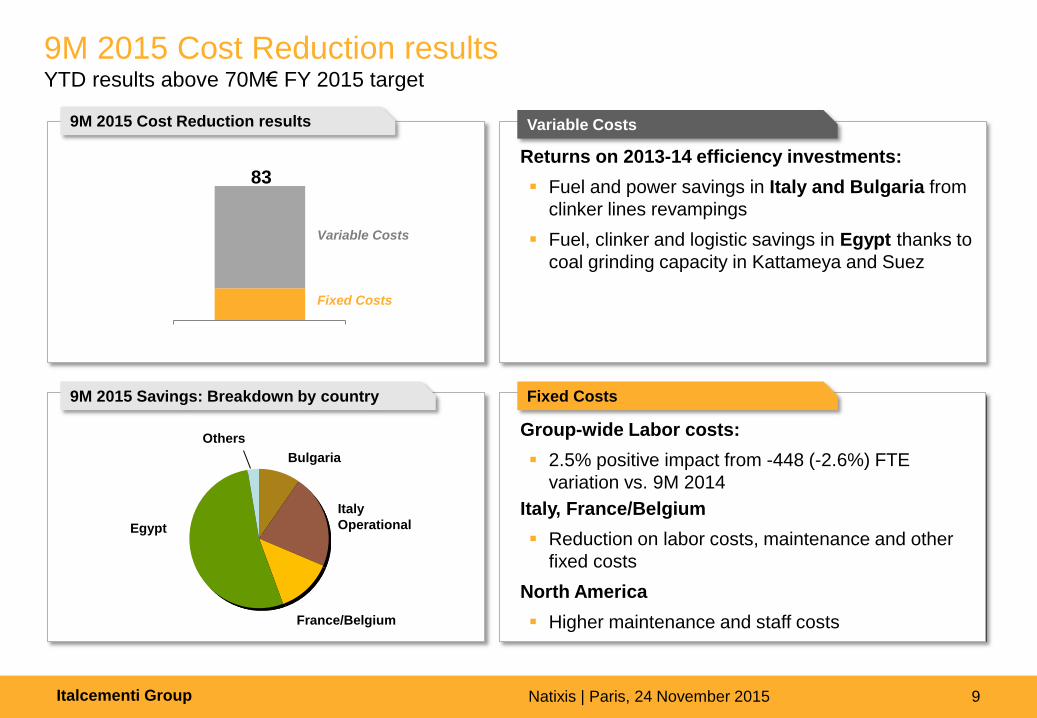
9M 2015 Cost Reduction results YTD results above 70M€ FY 2015 target
Variable Costs
Fixed Costs
9M 2015 Cost Reduction results
9M 2015 Savings: Breakdown by country
Egypt
Others
Italy
Operational
83
Variable Costs Fixed Costs
Bulgaria
France/Belgium
Returns on 2013-14 efficiency investments:
Fuel and power savings in Italy and Bulgaria from
clinker lines revampings
Fuel, clinker and logistic savings in Egypt thanks to
coal grinding capacity in Kattameya and Suez
Group-wide Labor costs:
2.5% positive impact from -448 (-2.6%) FTE
variation vs. 9M 2014
Italy, France/Belgium
Reduction on labor costs, maintenance and other
fixed costs
North America
Higher maintenance and staff costs
Italcementi Group Natixis | Paris, 24 November 2015 10
-15%
-10%
-5%
0%
5%
10%
15%
Q2'14 Q3'14 Q4'14 Q1'15 Q2'15 Q3'15
Price effect (+ negative; - positive)
Efficiency effect (Fuel Mix + consumpt. per ton) (+ neg.; - pos.)
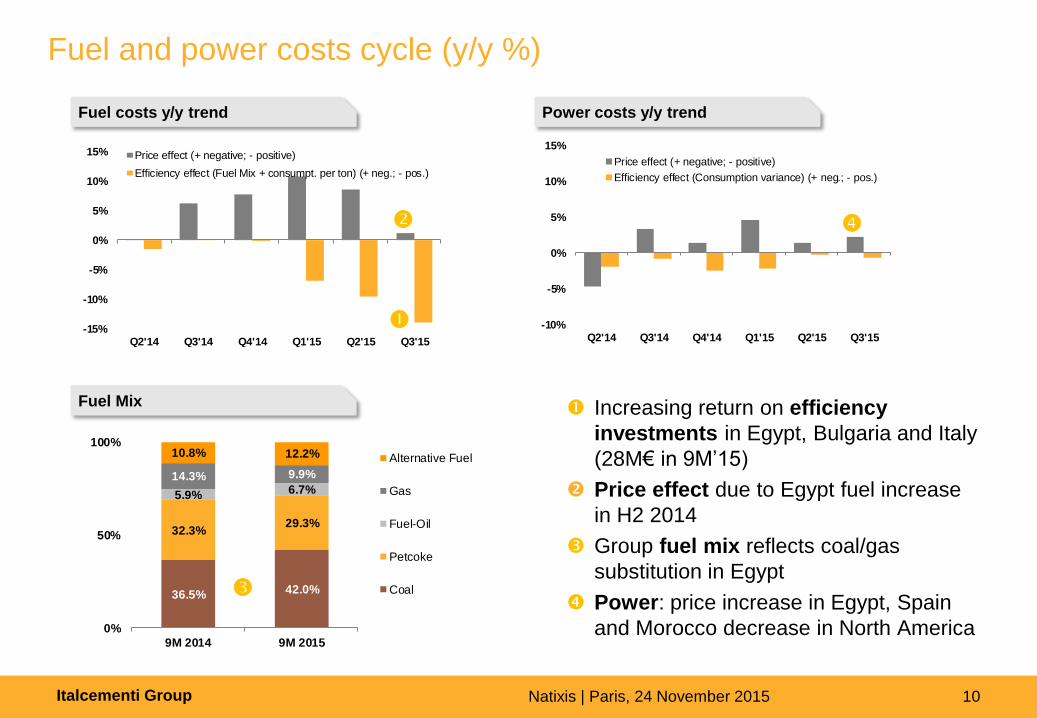
36.5% 42.0%
32.3%29.3%
5.9% 6.7%14.3% 9.9%
10.8% 12.2%
0%
50%
100%
9M 2014 9M 2015
Alternative Fuel
Gas
Fuel-Oil
Petcoke
Coal
Fuel and power costs cycle (y/y %)
Fuel costs y/y trend Power costs y/y trend
Fuel Mix
Increasing return on efficiency
investments in Egypt, Bulgaria and Italy
(28M€ in 9M’15)
Price effect due to Egypt fuel increase
in H2 2014
Group fuel mix reflects coal/gas
substitution in Egypt
Power: price increase in Egypt, Spain
and Morocco decrease in North America
-10%
-5%
0%
5%
10%
15%
Q2'14 Q3'14 Q4'14 Q1'15 Q2'15 Q3'15
Price effect (+ negative; - positive)
Efficiency effect (Consumption variance) (+ neg.; - pos.)
Italcementi Group Natixis | Paris, 24 November 2015 11
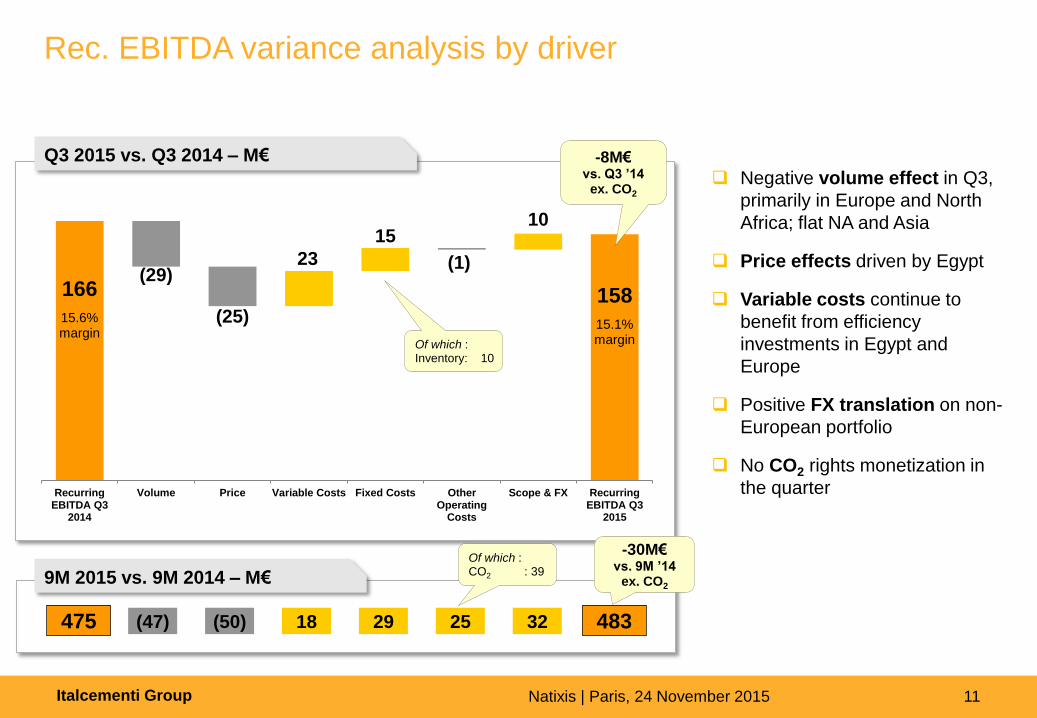
Rec. EBITDA variance analysis by driver
9M 2015 vs. 9M 2014 – M€
166
15.6% margin
158
15.1% margin
(29) 23 (1)
10
(25)
15
RecurringEBITDA Q3
2014
Volume Price Variable Costs Fixed Costs OtherOperating
Costs
Scope & FX RecurringEBITDA Q3
2015
Q3 2015 vs. Q3 2014 – M€
(47) (50) 18 29 25 32 475 483
Of which : CO2 : 39
-8M€ vs. Q3 ’14
ex. CO2
-30M€ vs. 9M ’14
ex. CO2
Negative volume effect in Q3,
primarily in Europe and North
Africa; flat NA and Asia
Price effects driven by Egypt
Variable costs continue to
benefit from efficiency
investments in Egypt and
Europe
Positive FX translation on non-
European portfolio
No CO2 rights monetization in
the quarter
Of which : Inventory: 10
Italcementi Group Natixis | Paris, 24 November 2015 12
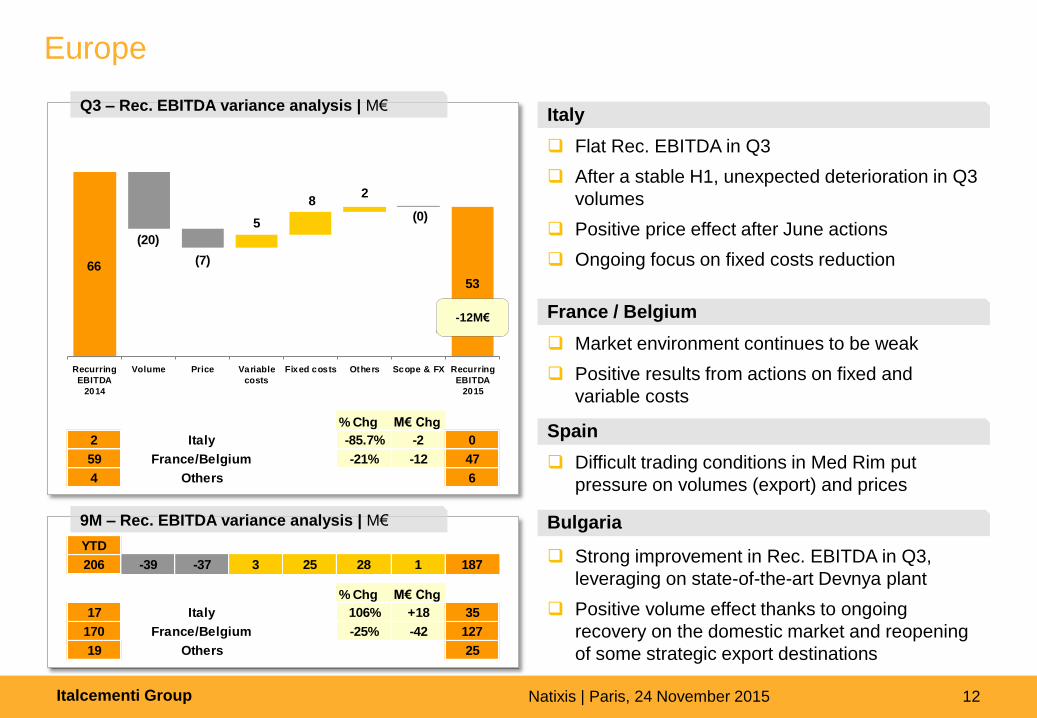
Europe
Flat Rec. EBITDA in Q3
After a stable H1, unexpected deterioration in Q3
volumes
Positive price effect after June actions
Ongoing focus on fixed costs reduction
Italy
France / Belgium
Market environment continues to be weak
Positive results from actions on fixed and
variable costs
Bulgaria
Strong improvement in Rec. EBITDA in Q3,
leveraging on state-of-the-art Devnya plant
Positive volume effect thanks to ongoing
recovery on the domestic market and reopening
of some strategic export destinations
Spain
Difficult trading conditions in Med Rim put
pressure on volumes (export) and prices
9M – Rec. EBITDA variance analysis | M€
Q3 – Rec. EBITDA variance analysis | M€
% Chg M€ Chg
2 Italy -85.7% -2 0
59 France/Belgium -21% -12 47
4 Others 6
66
53
(20)(0)
(0)
0
5
8
66
53
(20)
(7)
(0)5
82
Recurring
EBITDA
2014
Volume Price Variable
costs
Fixed costs Others Scope & FX Recurring
EBITDA
2015
-12M€
YTD
206 -39 -37 3 25 28 1 187
% Chg M€ Chg
17 Italy 106% +18 35
170 France/Belgium -25% -42 127
19 Others 25
Italcementi Group Natixis | Paris, 24 November 2015 13
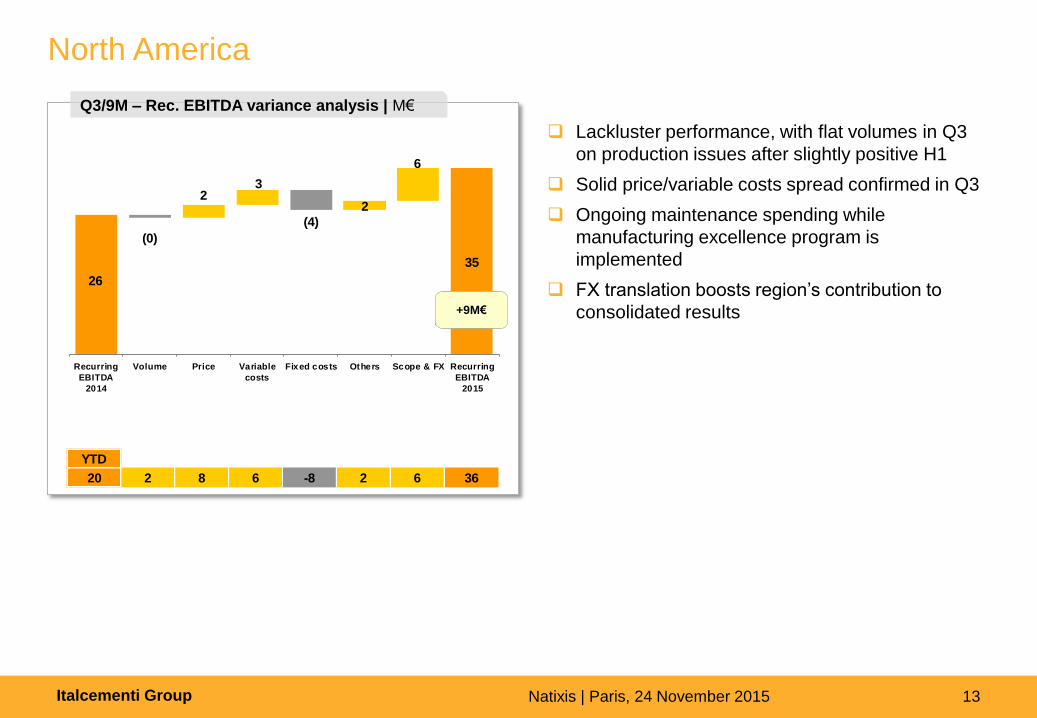
North America
Lackluster performance, with flat volumes in Q3
on production issues after slightly positive H1
Solid price/variable costs spread confirmed in Q3
Ongoing maintenance spending while
manufacturing excellence program is
implemented
FX translation boosts region’s contribution to
consolidated results
YTD
20 2 8 6 -8 2 6 36
26
35
(4)
6
(0)
23
2
Recurring
EBITDA
2014
Volume Price Variable
costs
Fixed costs Others Scope & FX Recurring
EBITDA
2015
Q3/9M – Rec. EBITDA variance analysis | M€
+9M€
Italcementi Group Natixis | Paris, 24 November 2015 14
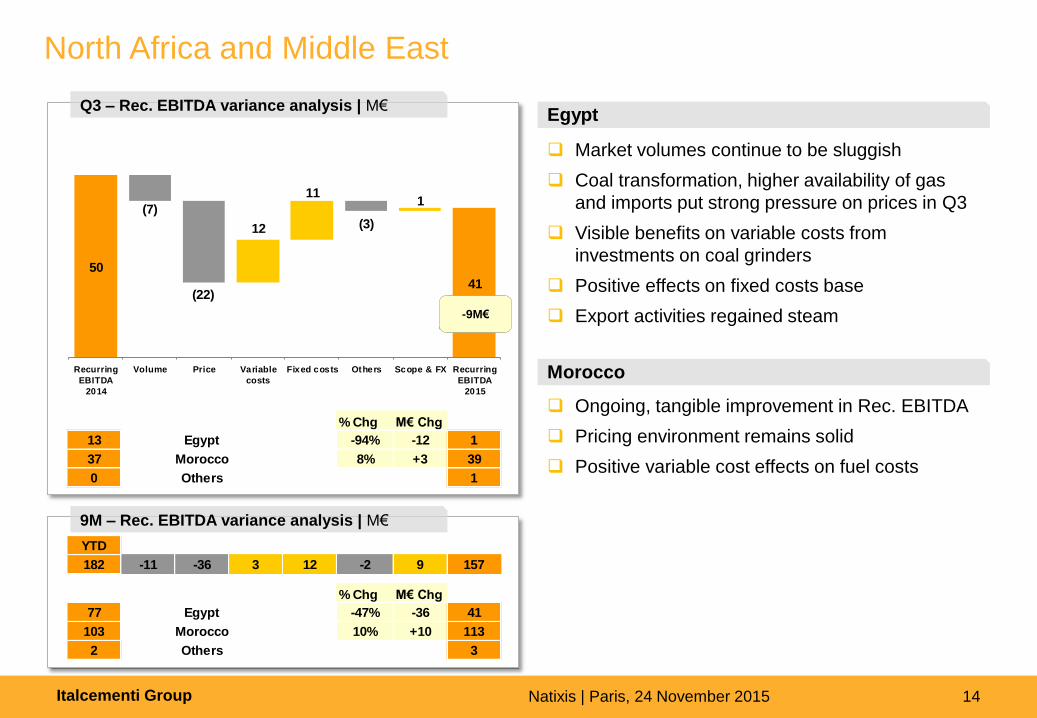
North Africa and Middle East
Market volumes continue to be sluggish
Coal transformation, higher availability of gas
and imports put strong pressure on prices in Q3
Visible benefits on variable costs from
investments on coal grinders
Positive effects on fixed costs base
Export activities regained steam
Egypt
Ongoing, tangible improvement in Rec. EBITDA
Pricing environment remains solid
Positive variable cost effects on fuel costs
Morocco
9M – Rec. EBITDA variance analysis | M€
Q3 – Rec. EBITDA variance analysis | M€
% Chg M€ Chg
13 Egypt -94% -12 1
37 Morocco 8% +3 39
0 Others 1
50
41
(7)
(22)
(3)12
111
Recurring
EBITDA
2014
Volume Price Variable
costs
Fixed costs Others Scope & FX Recurring
EBITDA
2015
-9M€
YTD
182 -11 -36 3 12 -2 9 157
% Chg M€ Chg
77 Egypt -47% -36 41
103 Morocco 10% +10 113
2 Others 3
Italcementi Group Natixis | Paris, 24 November 2015 15
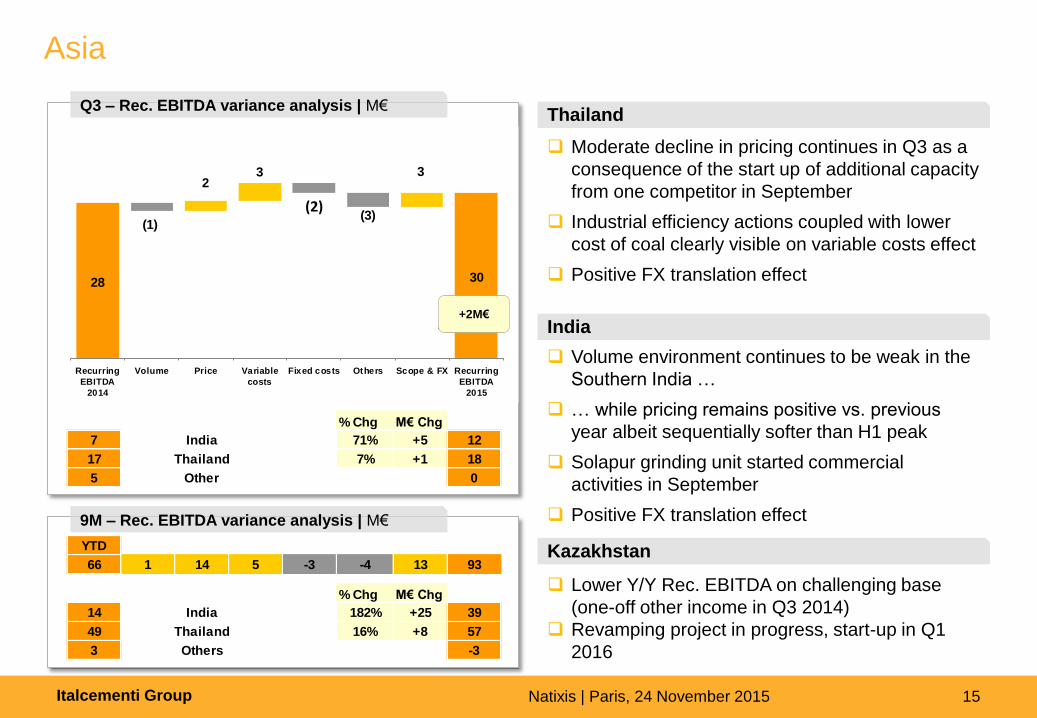
Asia
Moderate decline in pricing continues in Q3 as a
consequence of the start up of additional capacity
from one competitor in September
Industrial efficiency actions coupled with lower
cost of coal clearly visible on variable costs effect
Positive FX translation effect
Thailand
India
Lower Y/Y Rec. EBITDA on challenging base
(one-off other income in Q3 2014)
Revamping project in progress, start-up in Q1
2016
Kazakhstan
9M – Rec. EBITDA variance analysis | M€
Q3 – Rec. EBITDA variance analysis | M€
Volume environment continues to be weak in the
Southern India …
… while pricing remains positive vs. previous
year albeit sequentially softer than H1 peak
Solapur grinding unit started commercial
activities in September
Positive FX translation effect
YTD
66 1 14 5 -3 -4 13 93
% Chg M€ Chg
14 India 182% +25 39
49 Thailand 16% +8 57
3 Others -3
% Chg M€ Chg
7 India 71% +5 12
17 Thailand 7% +1 18
5 Other 0
28 30
(2)(3)
3
(1)
23
Recurring
EBITDA
2014
Volume Price Variable
costs
Fixed costs Others Scope & FX Recurring
EBITDA
2015
+2M€
Italcementi Group Natixis | Paris, 24 November 2015 16
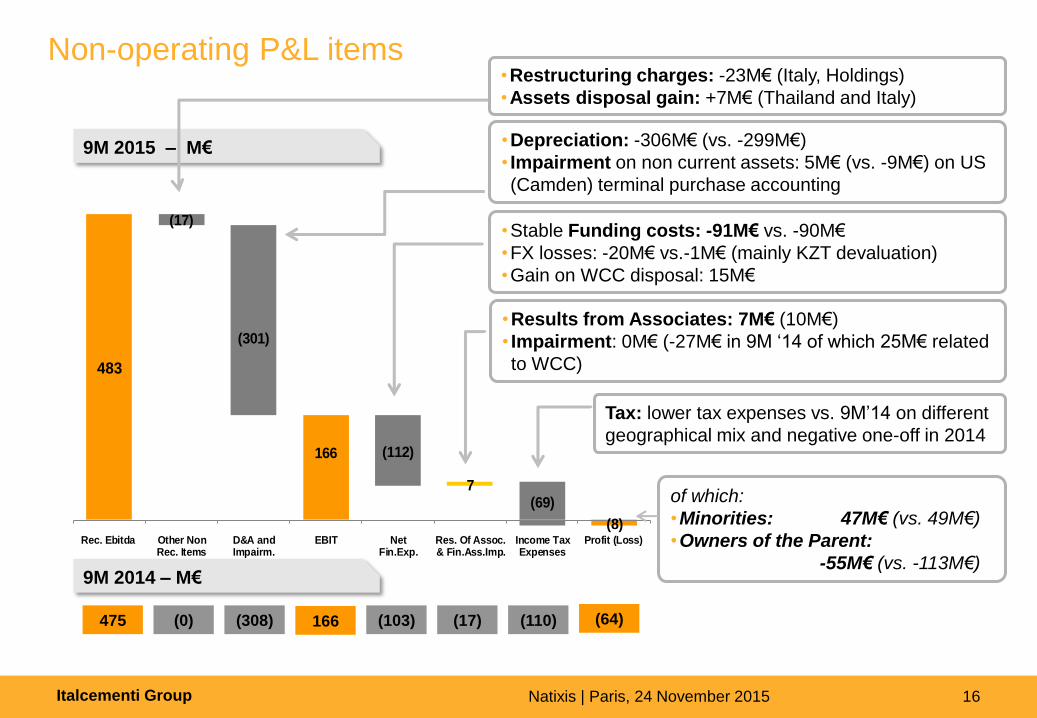
483
7
(17)
(301)
(112)
(69)
166
(8)Rec. Ebitda Other Non
Rec. ItemsD&A andImpairm.
EBIT NetFin.Exp.
Res. Of Assoc.& Fin.Ass.Imp.
Income TaxExpenses
Profit (Loss)
Non-operating P&L items
9M 2015 – M€
9M 2014 – M€
475 (64) (308) (17)
•Stable Funding costs: -91M€ vs. -90M€
•FX losses: -20M€ vs.-1M€ (mainly KZT devaluation)
•Gain on WCC disposal: 15M€
(110) (0) (103)
•Results from Associates: 7M€ (10M€)
• Impairment: 0M€ (-27M€ in 9M ‘14 of which 25M€ related
to WCC)
•Depreciation: -306M€ (vs. -299M€)
• Impairment on non current assets: 5M€ (vs. -9M€) on US
(Camden) terminal purchase accounting
166
of which:
•Minorities: 47M€ (vs. 49M€)
•Owners of the Parent:
-55M€ (vs. -113M€)
Tax: lower tax expenses vs. 9M’14 on different
geographical mix and negative one-off in 2014
•Restructuring charges: -23M€ (Italy, Holdings)
•Assets disposal gain: +7M€ (Thailand and Italy)
Italcementi Group Natixis | Paris, 24 November 2015 17
(3) (29) (2,174) N.F.P.
31.12.13
15
2015 – M€
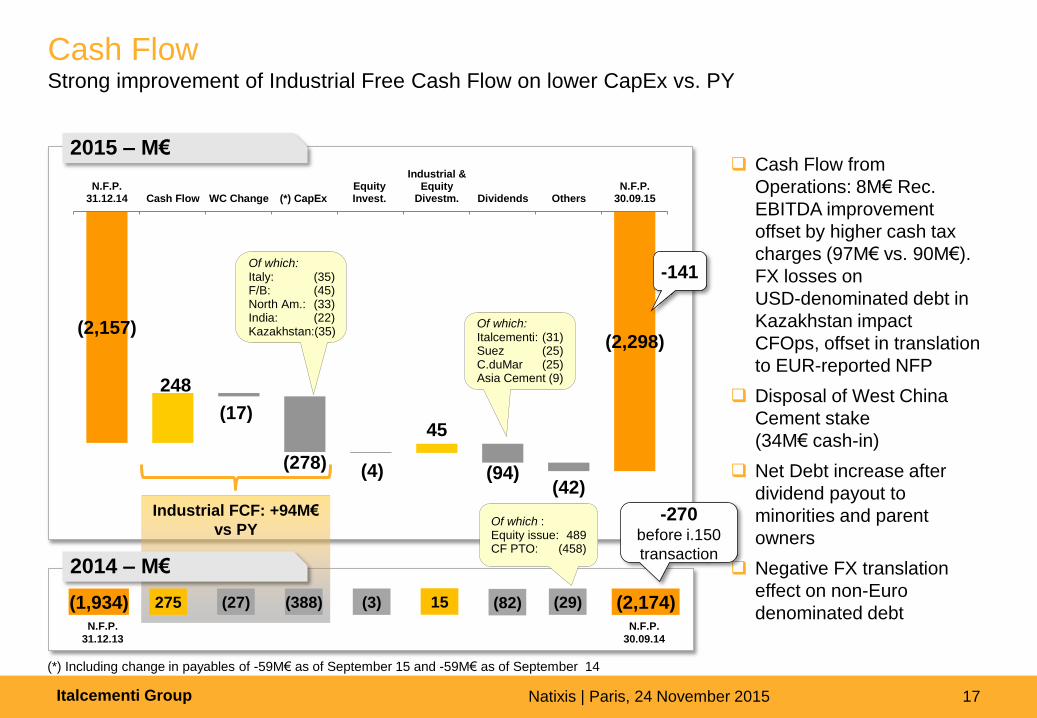
Cash Flow Strong improvement of Industrial Free Cash Flow on lower CapEx vs. PY
Cash Flow from
Operations: 8M€ Rec.
EBITDA improvement
offset by higher cash tax
charges (97M€ vs. 90M€).
FX losses on
USD-denominated debt in
Kazakhstan impact
CFOps, offset in translation
to EUR-reported NFP
Disposal of West China
Cement stake
(34M€ cash-in)
Net Debt increase after
dividend payout to
minorities and parent
owners
Negative FX translation
effect on non-Euro
denominated debt
(*) Including change in payables of -59M€ as of September 15 and -59M€ as of September 14
(2,157) (2,298)
248
45 (17)
(278) (4) (94) (42)
N.F.P.31.12.14 Cash Flow WC Change (*) CapEx
EquityInvest.
Industrial &Equity
Divestm. Dividends OthersN.F.P.
30.09.15
Of which: Italy: (35) F/B: (45) North Am.: (33) India: (22) Kazakhstan:(35)
-141
-270 before i.150
transaction
(82)
Of which: Italcementi: (31) Suez (25) C.duMar (25) Asia Cement (9)
Industrial FCF: +94M€
vs PY
2014 – M€
(1,934) 275 (27) (388)
Of which : Equity issue: 489 CF PTO: (458)
N.F.P.
30.09.14
Italcementi Group Natixis | Paris, 24 November 2015 18
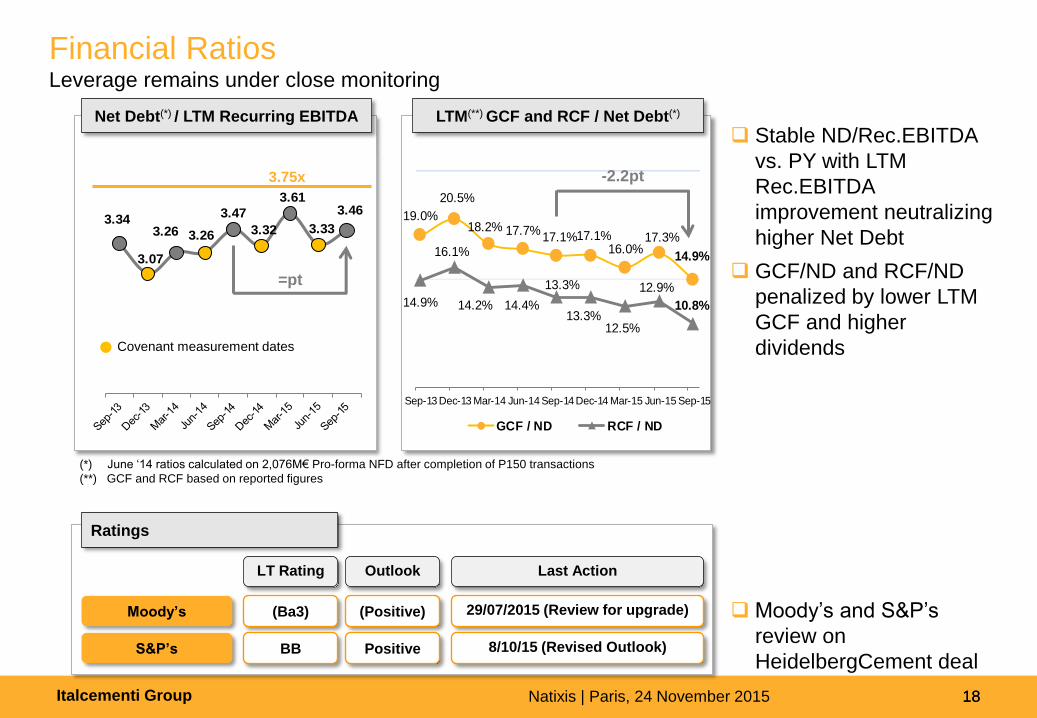
Net Debt(*) / LTM Recurring EBITDA LTM(**) GCF and RCF / Net Debt(*)
Financial Ratios Leverage remains under close monitoring
18
(*) June ‘14 ratios calculated on 2,076M€ Pro-forma NFD after completion of P150 transactions
(**) GCF and RCF based on reported figures
Moody’s
S&P’s
(Ba3)
BB
LT Rating Outlook Last Action
(Positive)
Positive
29/07/2015 (Review for upgrade)
8/10/15 (Revised Outlook)
Ratings
Moody’s and S&P’s
review on
HeidelbergCement deal
3.34
3.07
3.26 3.26
3.47
3.32
3.61
3.33
3.46
3.75x
Covenant measurement dates
19.0%
20.5%
18.2% 17.7%17.1%17.1%
16.0%17.3%
14.9%
14.9%
16.1%
14.2% 14.4%
13.3%
13.3%12.5%
12.9%
10.8%
Sep-13 Dec-13 Mar-14 Jun-14 Sep-14 Dec-14 Mar-15 Jun-15 Sep-15
GCF / ND RCF / ND
Stable ND/Rec.EBITDA
vs. PY with LTM
Rec.EBITDA
improvement neutralizing
higher Net Debt
GCF/ND and RCF/ND
penalized by lower LTM
GCF and higher
dividends
=pt
-2.2pt
Italcementi Group Natixis | Paris, 24 November 2015 19
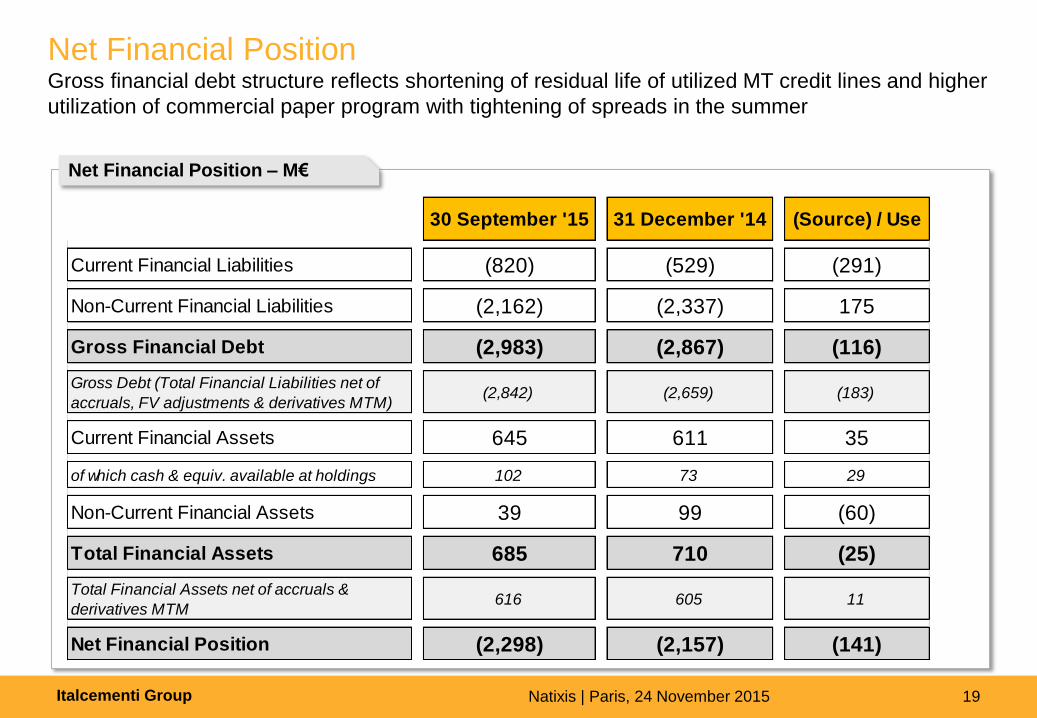
Net Financial Position Gross financial debt structure reflects shortening of residual life of utilized MT credit lines and higher
utilization of commercial paper program with tightening of spreads in the summer
Net Financial Position – M€
30 September '15 31 December '14 (Source) / Use
Current Financial Liabilities (820) (529) (291)
Non-Current Financial Liabilities (2,162) (2,337) 175
Gross Financial Debt (2,983) (2,867) (116)
Gross Debt (Total Financial Liabilities net of
accruals, FV adjustments & derivatives MTM)(2,842) (2,659) (183)
Current Financial Assets 645 611 35
of which cash & equiv. available at holdings 102 73 29
Non-Current Financial Assets 39 99 (60)
Total Financial Assets 685 710 (25)
Total Financial Assets net of accruals &
derivatives MTM616 605 11
Net Financial Position (2,298) (2,157) (141)
Italcementi Group Natixis | Paris, 24 November 2015 20
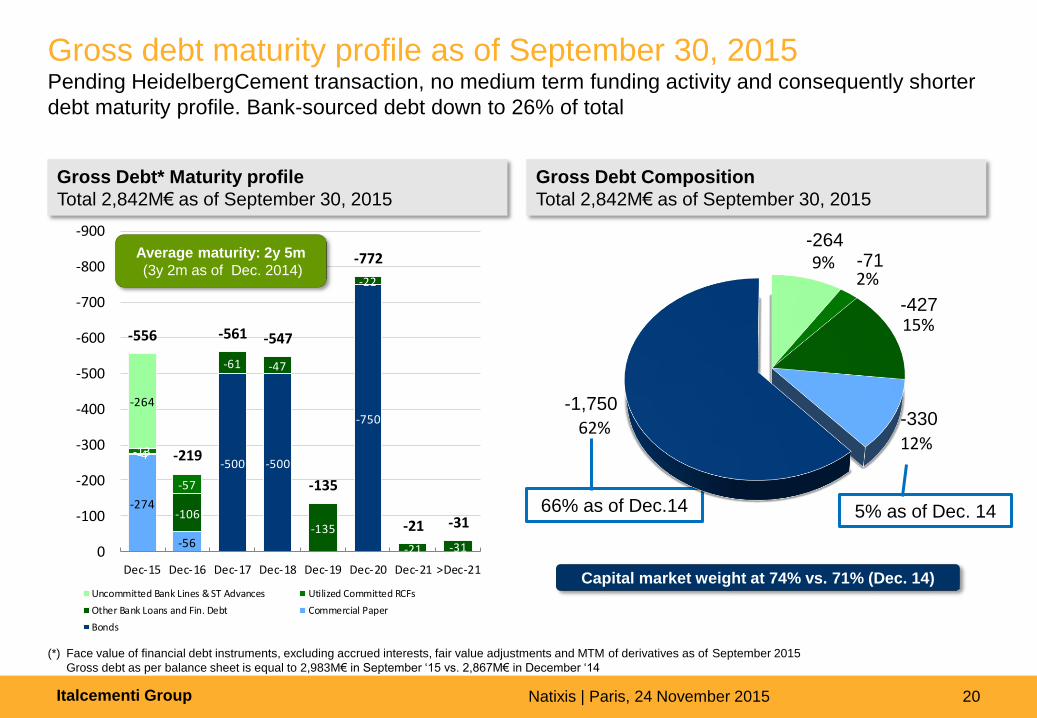
Gross debt maturity profile as of September 30, 2015 Pending HeidelbergCement transaction, no medium term funding activity and consequently shorter
debt maturity profile. Bank-sourced debt down to 26% of total
(*) Face value of financial debt instruments, excluding accrued interests, fair value adjustments and MTM of derivatives as of September 2015
Gross debt as per balance sheet is equal to 2,983M€ in September ‘15 vs. 2,867M€ in December ‘14
Gross Debt* Maturity profile
Total 2,842M€ as of September 30, 2015
Gross Debt Composition
Total 2,842M€ as of September 30, 2015
Capital market weight at 74% vs. 71% (Dec. 14)
66% as of Dec.14 5% as of Dec. 14
-500 -500
-750
-274
-56
-4
-106
-61 -47
-135
-22
-21 -31
-13
-57
-264
-556
-219
-561 -547
-135
-772
-21 -31
-900
-800
-700
-600
-500
-400
-300
-200
-100
0Dec-15 Dec-16 Dec-17 Dec-18 Dec-19 Dec-20 Dec-21 >Dec-21
Uncommitted Bank Lines & ST Advances Utilized Committed RCFs
Other Bank Loans and Fin. Debt Commercial Paper
Bonds
Average maturity: 2y 5m
(3y 2m as of Dec. 2014) 9%2%
15%
12%62%
Uncommitted Bank Lines & ST Advances
Utilized Committed RCFs
Other Bank Loans and Fin. Debt
Commercial Paper
Bonds
-264 -71
-330 -1,750
-427
Italcementi Group Natixis | Paris, 24 November 2015 21
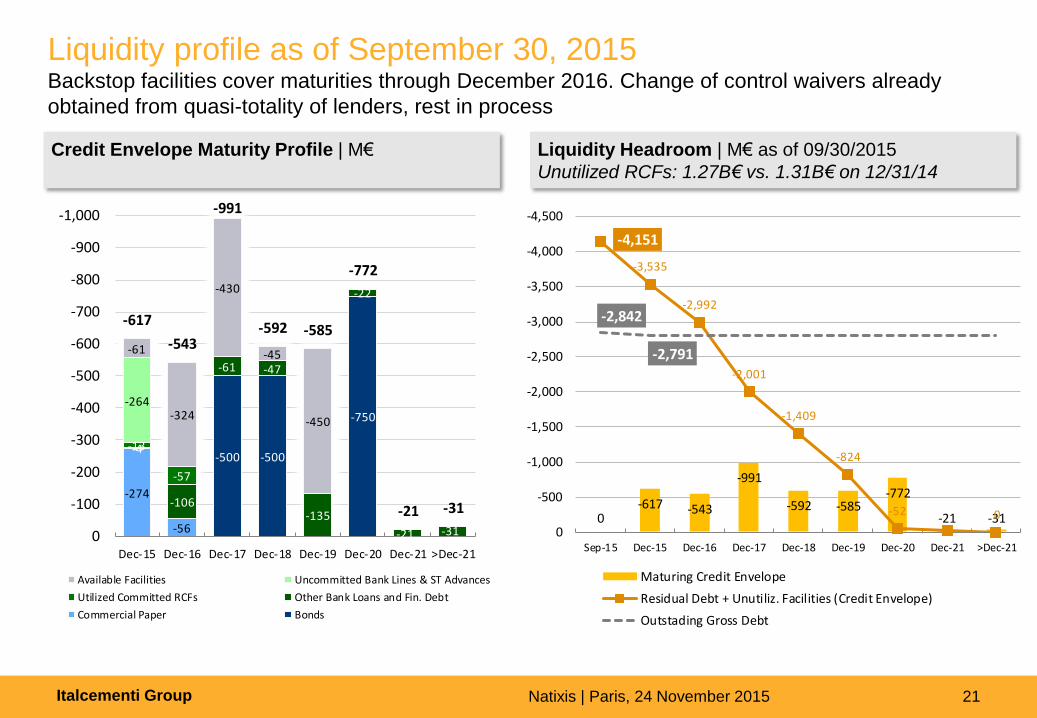
Credit Envelope Maturity Profile | M€
Liquidity Headroom | M€ as of 09/30/2015
Unutilized RCFs: 1.27B€ vs. 1.31B€ on 12/31/14
Liquidity profile as of September 30, 2015 Backstop facilities cover maturities through December 2016. Change of control waivers already
obtained from quasi-totality of lenders, rest in process
-500 -500
-750
-274
-56
-4
-106
-61 -47
-135
-22
-21 -31
-13
-57
-264
-61
-324
-430
-45
-450
-617
-543
-991
-592 -585
-772
-21 -31
-1,000
-900
-800
-700
-600
-500
-400
-300
-200
-100
0Dec-15 Dec-16 Dec-17 Dec-18 Dec-19 Dec-20 Dec-21 >Dec-21
Available Facilities Uncommitted Bank Lines & ST Advances
Utilized Committed RCFs Other Bank Loans and Fin. Debt
Commercial Paper Bonds
0-617 -543
-991
-592 -585-772
-21 -31
-4,151
-3,535
-2,992
-2,001
-1,409
-824
-52 0
-2,842
-2,791
-4,500
-4,000
-3,500
-3,000
-2,500
-2,000
-1,500
-1,000
-500
0Sep-15 Dec-15 Dec-16 Dec-17 Dec-18 Dec-19 Dec-20 Dec-21 >Dec-21
Maturing Credit Envelope
Residual Debt + Unutiliz. Facilities (Credit Envelope)
Outstading Gross Debt
Italcementi Group Natixis | Paris, 24 November 2015 22
Agenda
30 September 2015 Group Results
2015 Outlook
Opening Remarks
Italcementi Group Natixis | Paris, 24 November 2015 23
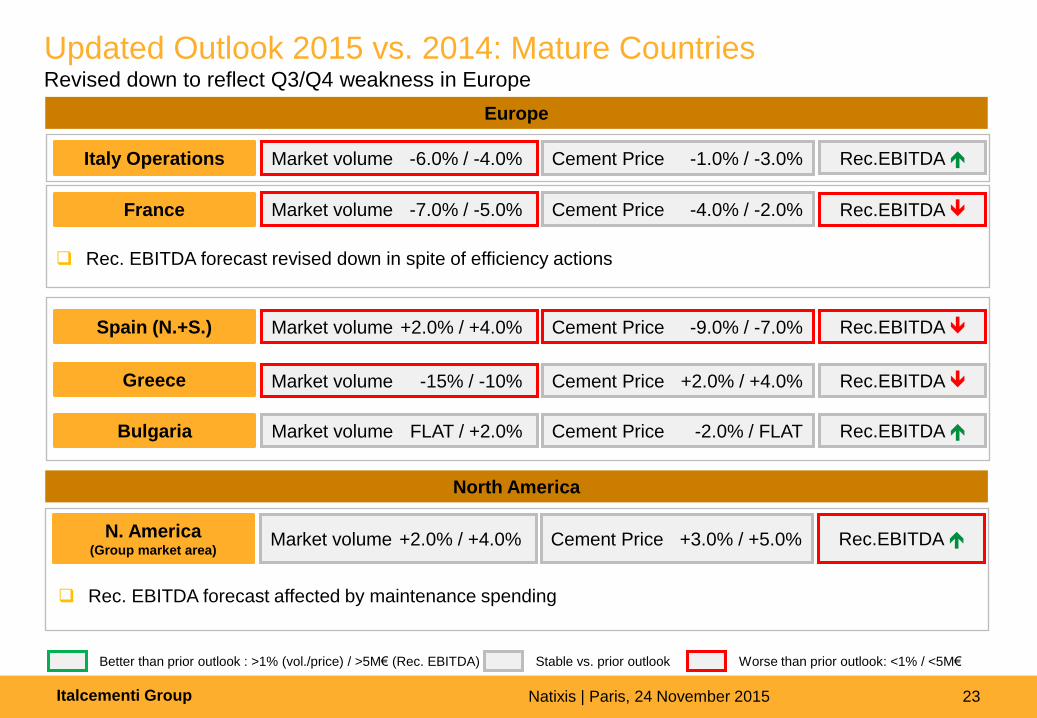
Updated Outlook 2015 vs. 2014: Mature Countries Revised down to reflect Q3/Q4 weakness in Europe
Europe
North America
Italy Operations Market volume -6.0% / -4.0% Rec.EBITDA Cement Price -1.0% / -3.0%
Market volume -5% / -1.5% Rec.EBITDA Cement Price -1% / +1% France Market volume -7.0% / -5.0% Rec.EBITDA Cement Price -4.0% / -2.0%
Spain (N.+S.) Market volume +2.0% / +4.0% Cement Price -9.0% / -7.0% Rec.EBITDA
Greece Market volume -15% / -10% Rec.EBITDA Cement Price +2.0% / +4.0% Rec.EBITDA
N. America (Group market area)
Market volume +2.0% / +4.0% Rec.EBITDA Cement Price +3.0% / +5.0%
Bulgaria Market volume FLAT / +2.0% Cement Price -2.0% / FLAT Rec.EBITDA
Better than prior outlook : >1% (vol./price) / >5M€ (Rec. EBITDA)
Stable vs. prior outlook
Worse than prior outlook: <1% / <5M€
Rec. EBITDA forecast affected by maintenance spending
Rec. EBITDA forecast revised down in spite of efficiency actions
Italcementi Group Natixis | Paris, 24 November 2015 24
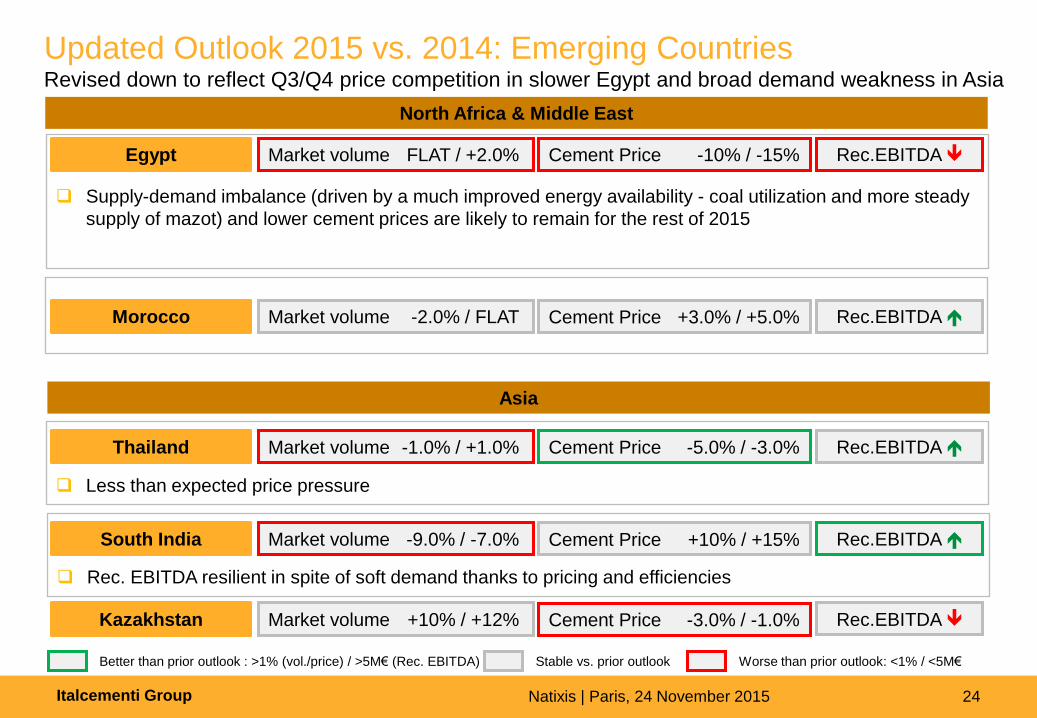
Updated Outlook 2015 vs. 2014: Emerging Countries Revised down to reflect Q3/Q4 price competition in slower Egypt and broad demand weakness in Asia
North Africa & Middle East
Asia
Egypt Market volume FLAT / +2.0% Rec.EBITDA Cement Price -10% / -15%
Morocco Market volume -2.0% / FLAT Rec.EBITDA Cement Price +3.0% / +5.0%
Thailand Market volume -1.0% / +1.0% Rec.EBITDA Cement Price -5.0% / -3.0%
South India Market volume -9.0% / -7.0% Rec.EBITDA Cement Price +10% / +15%
Kazakhstan Market volume +10% / +12% Rec.EBITDA Cement Price -3.0% / -1.0%
Better than prior outlook : >1% (vol./price) / >5M€ (Rec. EBITDA)
Stable vs. prior outlook
Worse than prior outlook: <1% / <5M€
Supply-demand imbalance (driven by a much improved energy availability - coal utilization and more steady
supply of mazot) and lower cement prices are likely to remain for the rest of 2015
Less than expected price pressure
Rec. EBITDA resilient in spite of soft demand thanks to pricing and efficiencies
Italcementi Group Natixis | Paris, 24 November 2015 25
Outlook
Given Q3/Q4 trends in several key markets, Rec. EBITDA outlook revised to slightly negative
vs. previous year
Net Debt at year end still at prior forecast levels (slight increase vs. 2014) thanks to offsetting
CapEx and Working Capital actions
Recovery expectations for 2016 not impaired but, sequentially, H1 will start from adverse
H2’15 baseline
Focus on cash flow is key driver of 2016 budget planning with significant selectivity applied to
CapEx spending
Italcementi Group Natixis | Paris, 24 November 2015 26 26 Analyst Meeting – 8 March 2010 26 26 Analyst Meeting – 8 March 2010 26 Analyst Meeting – 8 March 2010 26 26 Analyst Meeting - 7 May 2009 26 Analyst Meeting - 07 May 2009
Appendix 1 9M 2015
Italcementi Group Natixis | Paris, 24 November 2015 27
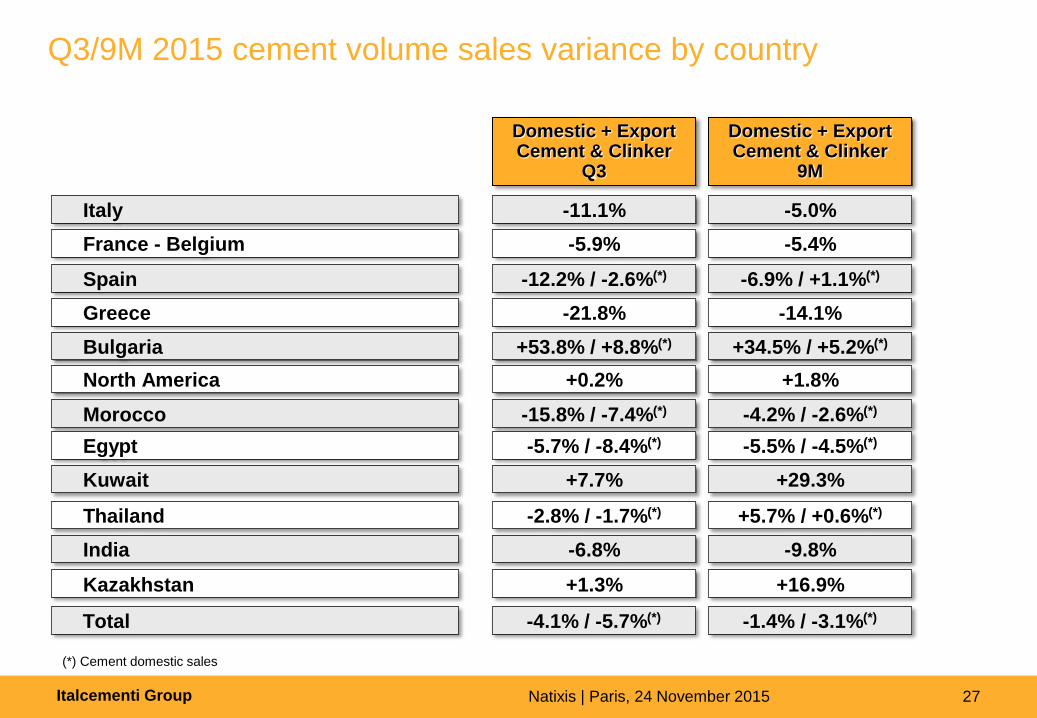
Q3/9M 2015 cement volume sales variance by country
Domestic + Export Cement & Clinker
9M
Italy
France - Belgium
Spain
Greece
North America
Bulgaria
Morocco
Egypt
Kuwait
Thailand
India
Kazakhstan
-5.0%
-5.4%
-6.9% / +1.1%(*)
-14.1%
+1.8%
+34.5% / +5.2%(*)
-4.2% / -2.6%(*)
-5.5% / -4.5%(*)
+29.3%
+5.7% / +0.6%(*)
-9.8%
+16.9%
Total -1.4% / -3.1%(*)
Domestic + Export Cement & Clinker
Q3
-11.1%
-5.9%
-12.2% / -2.6%(*)
-21.8%
+0.2%
+53.8% / +8.8%(*)
-15.8% / -7.4%(*)
-5.7% / -8.4%(*)
+7.7%
-2.8% / -1.7%(*)
-6.8%
+1.3%
-4.1% / -5.7%(*)
(*) Cement domestic sales
Italcementi Group Natixis | Paris, 24 November 2015 28
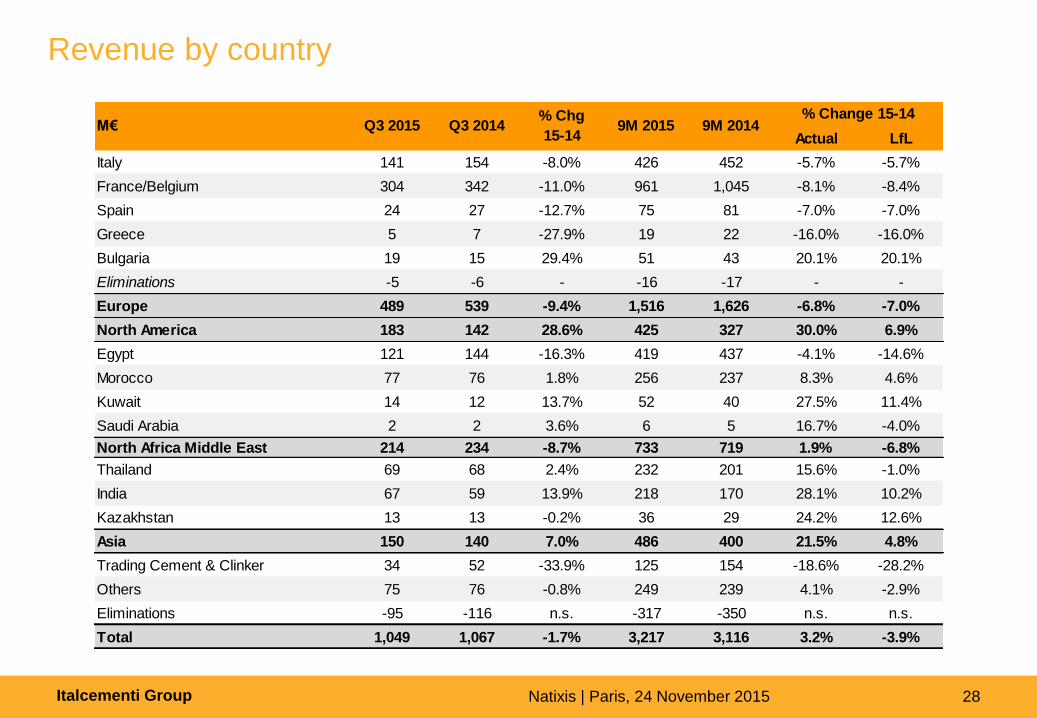
Revenue by country
Actual LfL
Italy 141 154 -8.0% 426 452 -5.7% -5.7%
France/Belgium 304 342 -11.0% 961 1,045 -8.1% -8.4%
Spain 24 27 -12.7% 75 81 -7.0% -7.0%
Greece 5 7 -27.9% 19 22 -16.0% -16.0%
Bulgaria 19 15 29.4% 51 43 20.1% 20.1%
Eliminations -5 -6 - -16 -17 - -
Europe 489 539 -9.4% 1,516 1,626 -6.8% -7.0%
North America 183 142 28.6% 425 327 30.0% 6.9%
Egypt 121 144 -16.3% 419 437 -4.1% -14.6%
Morocco 77 76 1.8% 256 237 8.3% 4.6%
Kuwait 14 12 13.7% 52 40 27.5% 11.4%
Saudi Arabia 2 2 3.6% 6 5 16.7% -4.0%
North Africa Middle East 214 234 -8.7% 733 719 1.9% -6.8%
Thailand 69 68 2.4% 232 201 15.6% -1.0%
India 67 59 13.9% 218 170 28.1% 10.2%
Kazakhstan 13 13 -0.2% 36 29 24.2% 12.6%
Asia 150 140 7.0% 486 400 21.5% 4.8%
Trading Cement & Clinker 34 52 -33.9% 125 154 -18.6% -28.2%
Others 75 76 -0.8% 249 239 4.1% -2.9%
Eliminations -95 -116 n.s. -317 -350 n.s. n.s.
Total 1,049 1,067 -1.7% 3,217 3,116 3.2% -3.9%
Q3 2015 Q3 2014 9M 2015 9M 2014% Change 15-14
M€% Chg
15-14
Italcementi Group Natixis | Paris, 24 November 2015 29
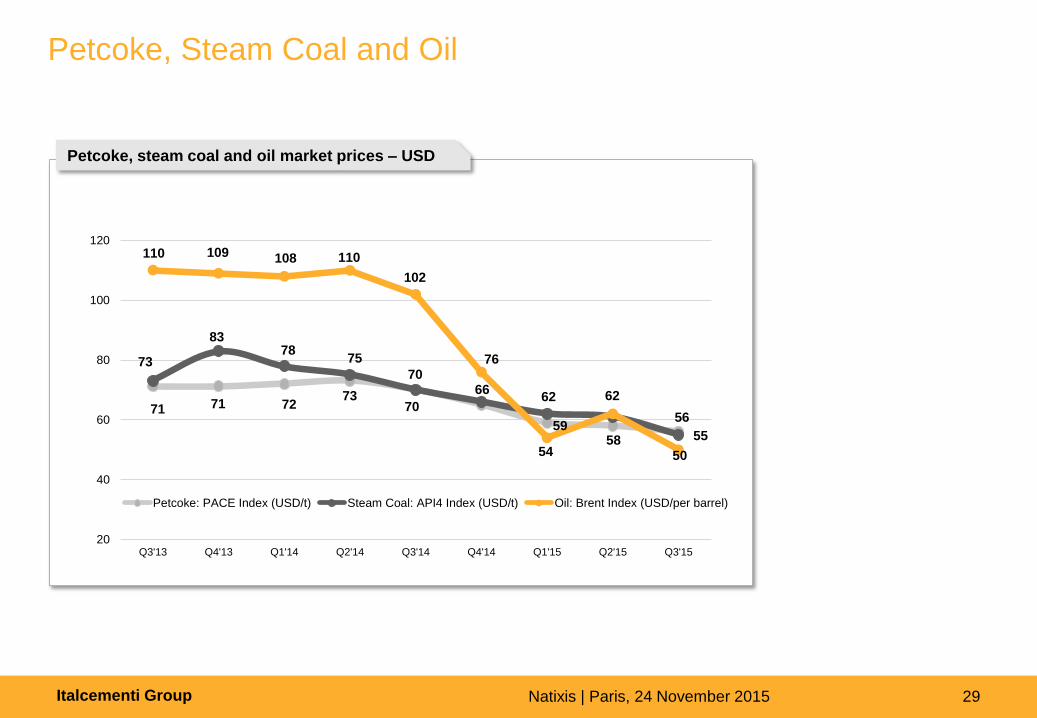
Petcoke, Steam Coal and Oil
71 71 72 73
70
59 58
56
73
83 78
75
70 66
62
55
110 109 108 110
102
76
54
62
50
20
40
60
80
100
120
Q3'13 Q4'13 Q1'14 Q2'14 Q3'14 Q4'14 Q1'15 Q2'15 Q3'15
Petcoke: PACE Index (USD/t) Steam Coal: API4 Index (USD/t) Oil: Brent Index (USD/per barrel)
Petcoke, steam coal and oil market prices – USD
Italcementi Group Natixis | Paris, 24 November 2015 30
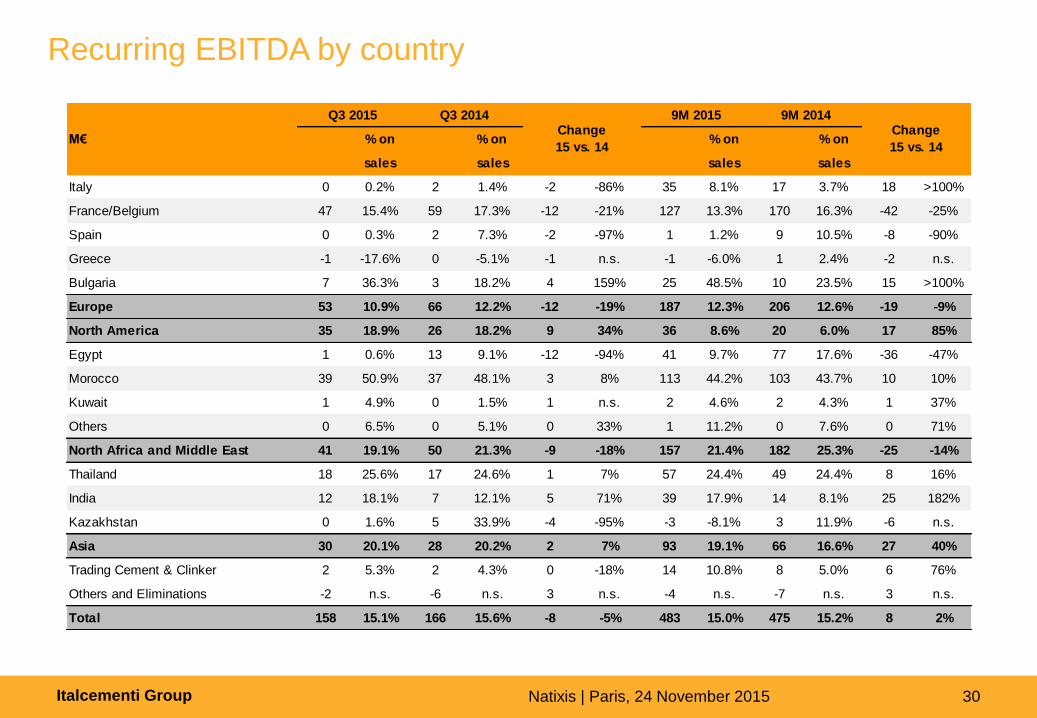
Recurring EBITDA by country
% on % on % on % on
sales sales sales sales
Italy 0 0.2% 2 1.4% -2 -86% 35 8.1% 17 3.7% 18 >100%
France/Belgium 47 15.4% 59 17.3% -12 -21% 127 13.3% 170 16.3% -42 -25%
Spain 0 0.3% 2 7.3% -2 -97% 1 1.2% 9 10.5% -8 -90%
Greece -1 -17.6% 0 -5.1% -1 n.s. -1 -6.0% 1 2.4% -2 n.s.
Bulgaria 7 36.3% 3 18.2% 4 159% 25 48.5% 10 23.5% 15 >100%
Europe 53 10.9% 66 12.2% -12 -19% 187 12.3% 206 12.6% -19 -9%
North America 35 18.9% 26 18.2% 9 34% 36 8.6% 20 6.0% 17 85%
Egypt 1 0.6% 13 9.1% -12 -94% 41 9.7% 77 17.6% -36 -47%
Morocco 39 50.9% 37 48.1% 3 8% 113 44.2% 103 43.7% 10 10%
Kuwait 1 4.9% 0 1.5% 1 n.s. 2 4.6% 2 4.3% 1 37%
Others 0 6.5% 0 5.1% 0 33% 1 11.2% 0 7.6% 0 71%
North Africa and Middle East 41 19.1% 50 21.3% -9 -18% 157 21.4% 182 25.3% -25 -14%
Thailand 18 25.6% 17 24.6% 1 7% 57 24.4% 49 24.4% 8 16%
India 12 18.1% 7 12.1% 5 71% 39 17.9% 14 8.1% 25 182%
Kazakhstan 0 1.6% 5 33.9% -4 -95% -3 -8.1% 3 11.9% -6 n.s.
Asia 30 20.1% 28 20.2% 2 7% 93 19.1% 66 16.6% 27 40%
Trading Cement & Clinker 2 5.3% 2 4.3% 0 -18% 14 10.8% 8 5.0% 6 76%
Others and Eliminations -2 n.s. -6 n.s. 3 n.s. -4 n.s. -7 n.s. 3 n.s.
Total 158 15.1% 166 15.6% -8 -5% 483 15.0% 475 15.2% 8 2%
9M 2014 Change
15 vs. 14M€
Q3 2015 Q3 2014Change
15 vs. 14
9M 2015
Italcementi Group Natixis | Paris, 24 November 2015 31
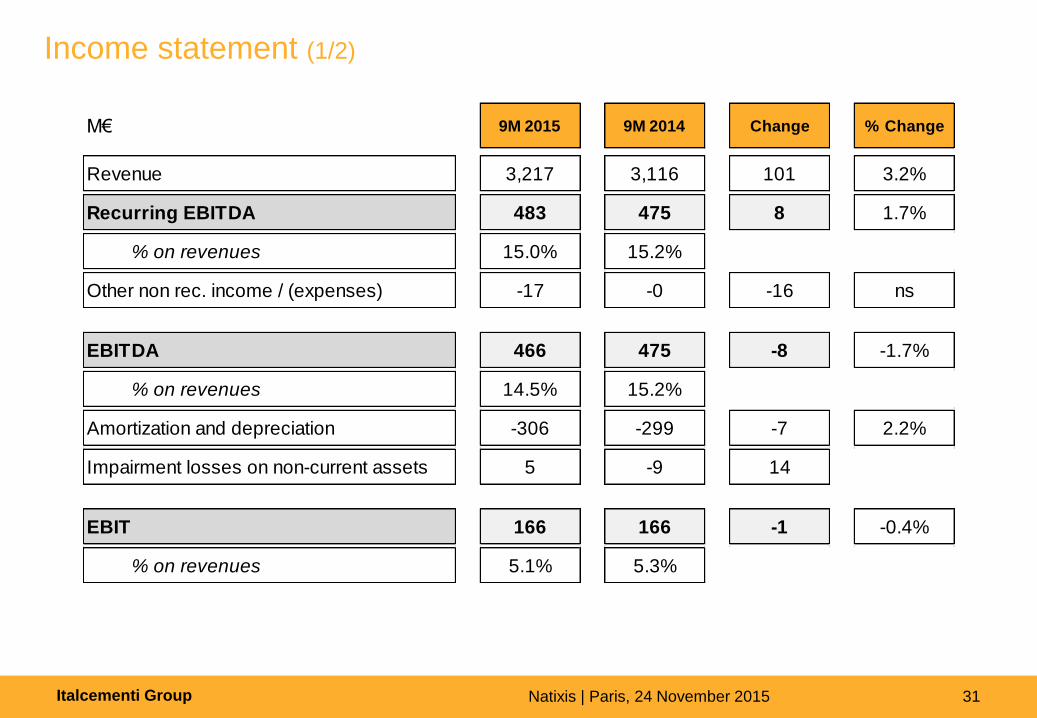
Income statement (1/2)
M€ 9M 2015 9M 2014 Change % Change
Revenue 3,217 3,116 101 3.2%
Recurring EBITDA 483 475 8 1.7%
% on revenues 15.0% 15.2%
Other non rec. income / (expenses) -17 -0 -16 ns
EBITDA 466 475 -8 -1.7%
% on revenues 14.5% 15.2%
Amortization and depreciation -306 -299 -7 2.2%
Impairment losses on non-current assets 5 -9 14
EBIT 166 166 -1 -0.4%
% on revenues 5.1% 5.3%
Italcementi Group Natixis | Paris, 24 November 2015 32
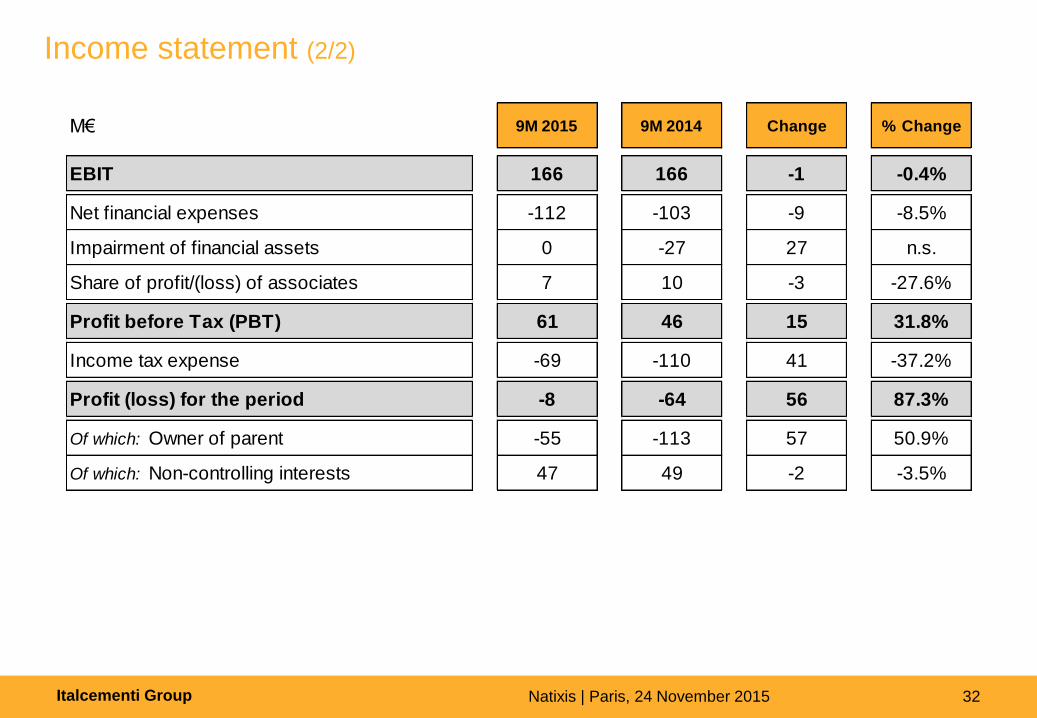
Income statement (2/2)
M€ 9M 2015 9M 2014 Change % Change
EBIT 166 166 -1 -0.4%
Net financial expenses -112 -103 -9 -8.5%
Impairment of financial assets 0 -27 27 n.s.
Share of profit/(loss) of associates 7 10 -3 -27.6%
Profit before Tax (PBT) 61 46 15 31.8%
Income tax expense -69 -110 41 -37.2%
Profit (loss) for the period -8 -64 56 87.3%
Of which: Owner of parent -55 -113 57 50.9%
Of which: Non-controlling interests 47 49 -2 -3.5%
Italcementi Group Natixis | Paris, 24 November 2015 33
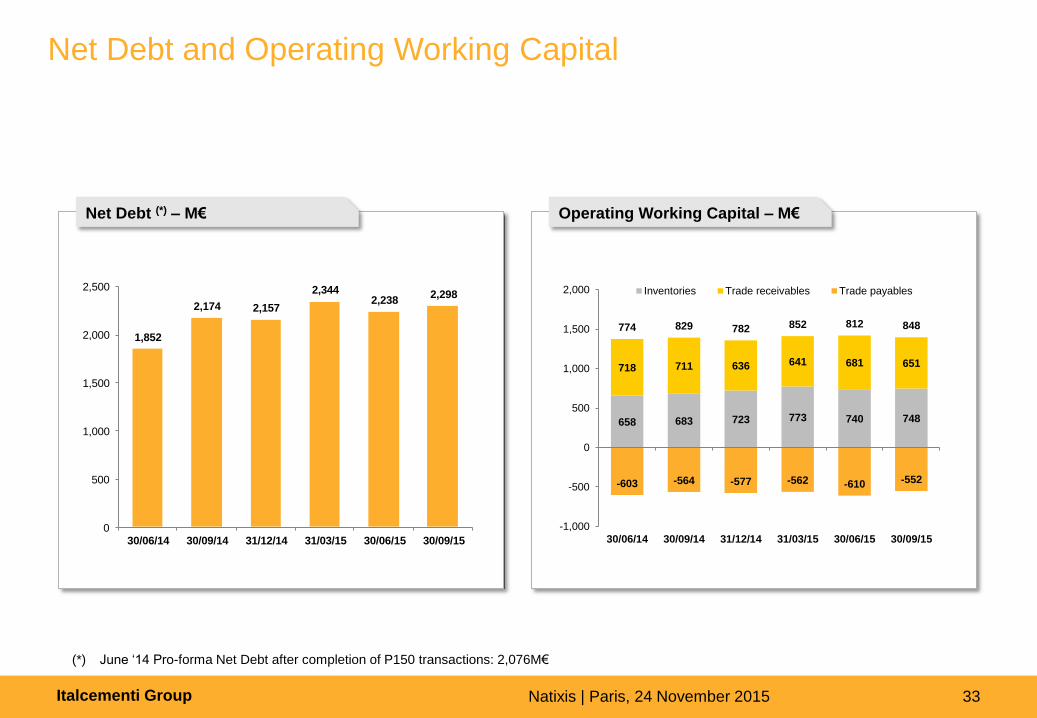
Net Debt and Operating Working Capital
Net Debt (*) – M€ Operating Working Capital – M€
(*) June ‘14 Pro-forma Net Debt after completion of P150 transactions: 2,076M€
1,852
2,174 2,157
2,3442,238
2,298
0
500
1,000
1,500
2,000
2,500
30/06/14 30/09/14 31/12/14 31/03/15 30/06/15 30/09/15
658 683 723 773 740 748
718 711 636 641 681 651
-603 -564 -577 -562 -610 -552
774 829 782 852 812 848
-1,000
-500
0
500
1,000
1,500
2,000
30/06/14 30/09/14 31/12/14 31/03/15 30/06/15 30/09/15
Inventories Trade receivables Trade payables
Italcementi Group Natixis | Paris, 24 November 2015 34
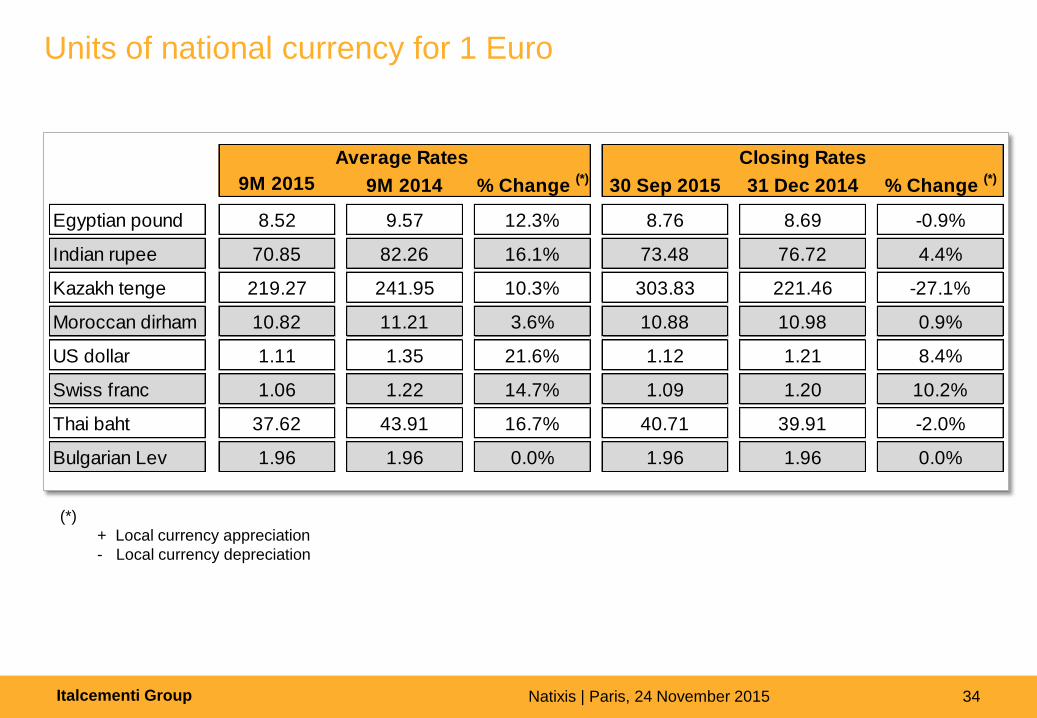
(*)
+ Local currency appreciation
- Local currency depreciation
Units of national currency for 1 Euro
Average Rates Closing Rates
9M 2015 9M 2014 % Change (*)
30 Sep 2015 31 Dec 2014 % Change (*)
Egyptian pound 8.52 9.57 12.3% 8.76 8.69 -0.9%
Indian rupee 70.85 82.26 16.1% 73.48 76.72 4.4%
Kazakh tenge 219.27 241.95 10.3% 303.83 221.46 -27.1%
Moroccan dirham 10.82 11.21 3.6% 10.88 10.98 0.9%
US dollar 1.11 1.35 21.6% 1.12 1.21 8.4%
Swiss franc 1.06 1.22 14.7% 1.09 1.20 10.2%
Thai baht 37.62 43.91 16.7% 40.71 39.91 -2.0%
Bulgarian Lev 1.96 1.96 0.0% 1.96 1.96 0.0%
Italcementi Group Natixis | Paris, 24 November 2015 35 35 Analyst Meeting – 8 March 2010 35 35 Analyst Meeting – 8 March 2010 35 Analyst Meeting – 8 March 2010 35 35 Analyst Meeting - 7 May 2009 35 Analyst Meeting - 07 May 2009
Appendix 2 FY 2014
Italcementi Group Natixis | Paris, 24 November 2015 36
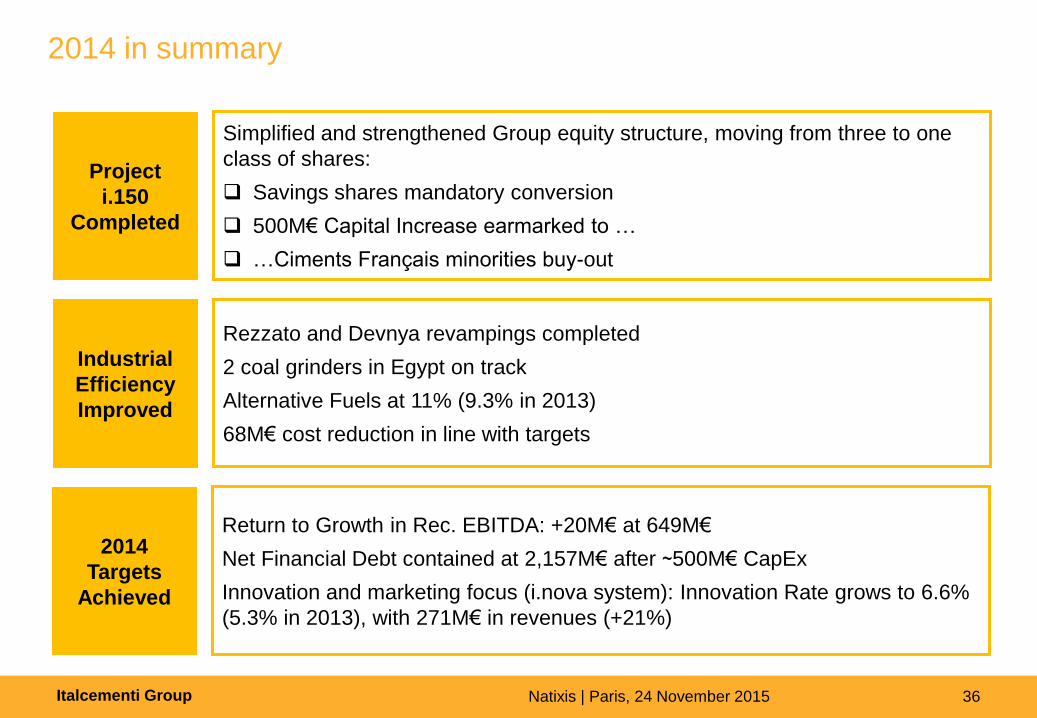
2014 in summary
Project
i.150
Completed
Simplified and strengthened Group equity structure, moving from three to one
class of shares:
Savings shares mandatory conversion
500M€ Capital Increase earmarked to …
…Ciments Français minorities buy-out
Industrial
Efficiency
Improved
Rezzato and Devnya revampings completed
2 coal grinders in Egypt on track
Alternative Fuels at 11% (9.3% in 2013)
68M€ cost reduction in line with targets
2014
Targets
Achieved
Return to Growth in Rec. EBITDA: +20M€ at 649M€
Net Financial Debt contained at 2,157M€ after ~500M€ CapEx
Innovation and marketing focus (i.nova system): Innovation Rate grows to 6.6%
(5.3% in 2013), with 271M€ in revenues (+21%)
Italcementi Group Natixis | Paris, 24 November 2015 37
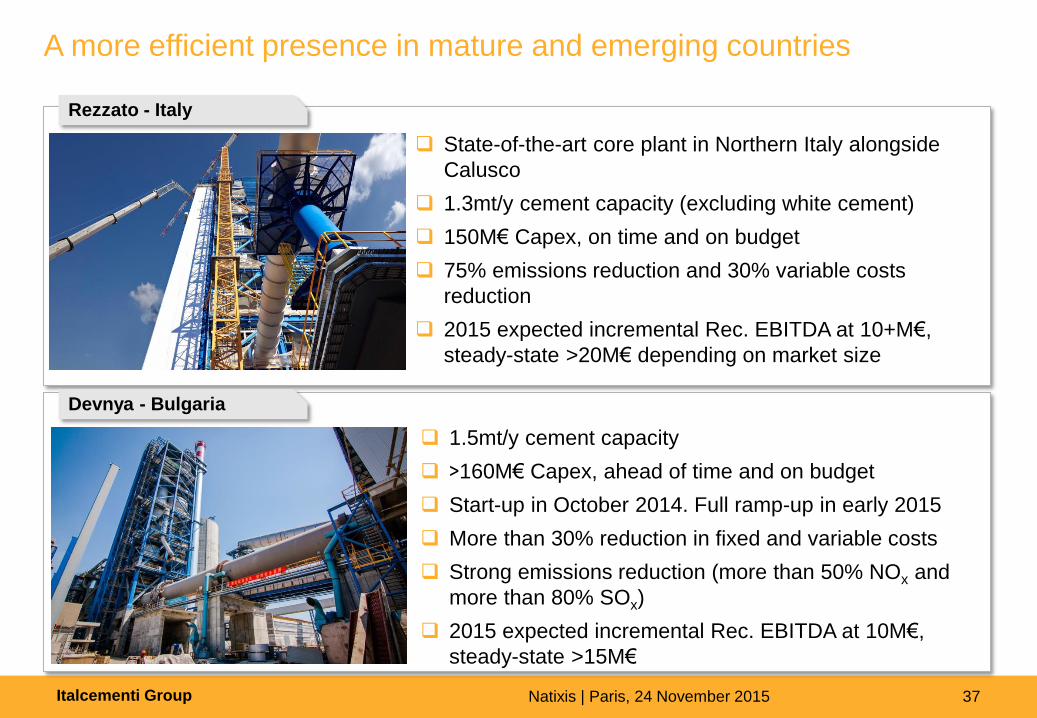
A more efficient presence in mature and emerging countries
State-of-the-art core plant in Northern Italy alongside
Calusco
1.3mt/y cement capacity (excluding white cement)
150M€ Capex, on time and on budget
75% emissions reduction and 30% variable costs
reduction
2015 expected incremental Rec. EBITDA at 10+M€,
steady-state >20M€ depending on market size
1.5mt/y cement capacity
>160M€ Capex, ahead of time and on budget
Start-up in October 2014. Full ramp-up in early 2015
More than 30% reduction in fixed and variable costs
Strong emissions reduction (more than 50% NOx and
more than 80% SOx)
2015 expected incremental Rec. EBITDA at 10M€,
steady-state >15M€
Rezzato - Italy
Devnya - Bulgaria
Italcementi Group Natixis | Paris, 24 November 2015 38
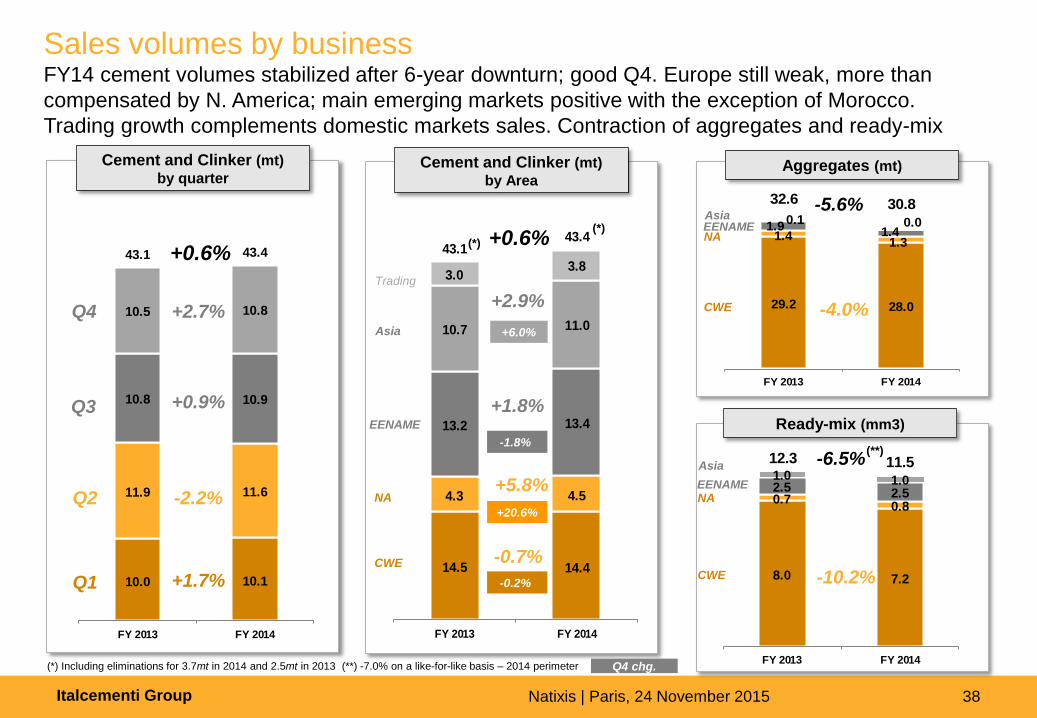
Sales volumes by business FY14 cement volumes stabilized after 6-year downturn; good Q4. Europe still weak, more than
compensated by N. America; main emerging markets positive with the exception of Morocco.
Trading growth complements domestic markets sales. Contraction of aggregates and ready-mix
(*) Including eliminations for 3.7mt in 2014 and 2.5mt in 2013 (**) -7.0% on a like-for-like basis – 2014 perimeter Q4 chg.
Cement and Clinker (mt)
by quarter
10.0 10.1
11.9 11.6
10.8 10.9
43.1 43.4
10.5 10.8
FY 2013 FY 2014
-2.2% Q2
+1.7% Q1
+0.6%
+0.9% Q3
Q4 +2.7%
14.5 14.4
4.3 4.5
13.2 13.4
10.7 11.0
3.03.8
43.143.4
FY 2013 FY 2014
Cement and Clinker (mt)
by Area
+0.6% (*)
(*)
CWE
EENAME
Trading
NA
Asia
-0.7%
+1.8%
+5.8%
+2.9%
-0.2%
+6.0%
+20.6%
-1.8%
29.2 28.0
1.41.3
1.9 1.40.1 0.00.0
0.0
32.6 30.8
FY 2013 FY 2014
-4.0%
-5.6%
CWE
EENAME
NA
Asia
Aggregates (mt)
8.0 7.2
0.70.8
2.5 2.5
1.0 1.0
12.3 11.5
FY 2013 FY 2014
Ready-mix (mm3)
CWE
EENAME
NA
Asia
-10.2%
-6.5% (**)
Italcementi Group Natixis | Paris, 24 November 2015 39
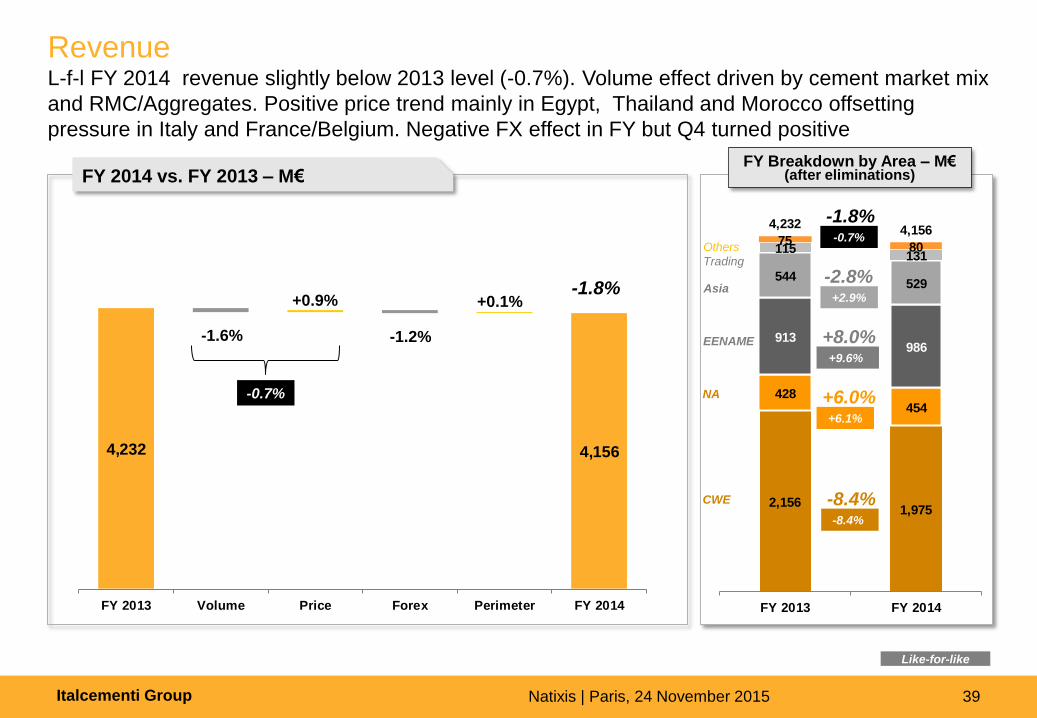
Revenue L-f-l FY 2014 revenue slightly below 2013 level (-0.7%). Volume effect driven by cement market mix
and RMC/Aggregates. Positive price trend mainly in Egypt, Thailand and Morocco offsetting
pressure in Italy and France/Belgium. Negative FX effect in FY but Q4 turned positive
FY Breakdown by Area – M€ (after eliminations)
Like-for-like
FY 2014 vs. FY 2013 – M€
-1.8%
4,232 4,156
FY 2013 Volume Price Forex Perimeter FY 2014
-0.7%
-1.6% -1.2%
+0.1% +0.9%
2,1561,975
428454
913986
544529
115131
7580
4,2324,156
FY 2013 FY 2014
-8.4% -8.4%
-2.8% +2.9%
+6.0% +6.1%
+8.0% +9.6%
-1.8% -0.7%
CWE
EENAME
Others
Trading
NA
Asia
Italcementi Group Natixis | Paris, 24 November 2015 40
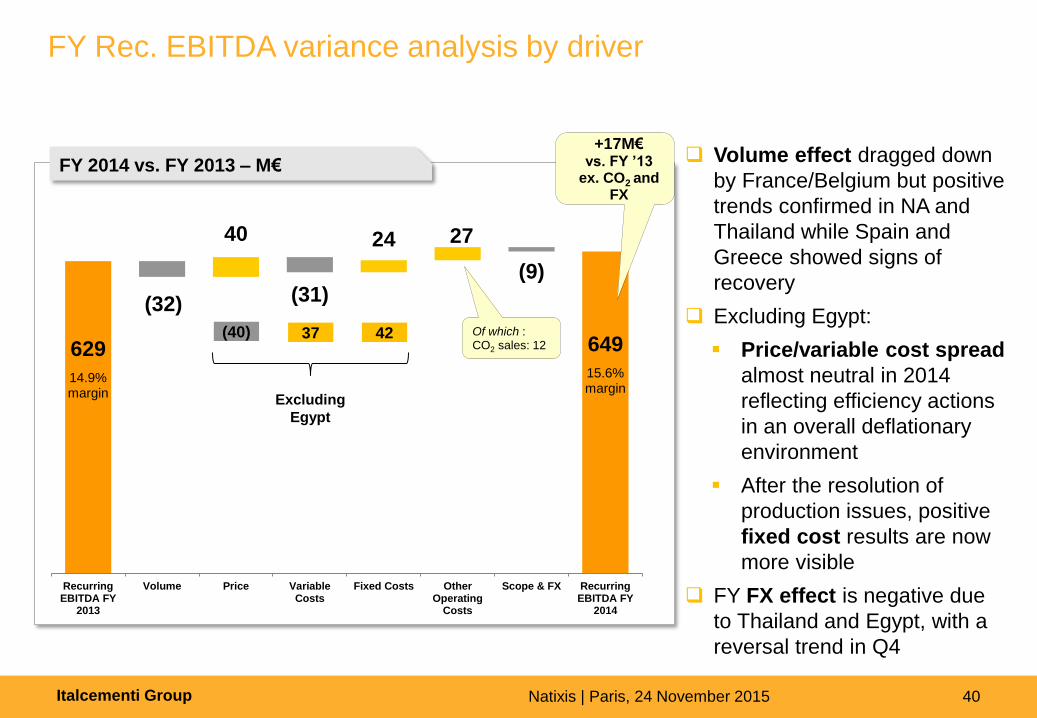
FY Rec. EBITDA variance analysis by driver
629
14.9% margin
649
15.6% margin
(32) (31)
27
(9)
40 24
RecurringEBITDA FY
2013
Volume Price VariableCosts
Fixed Costs OtherOperating
Costs
Scope & FX RecurringEBITDA FY
2014
FY 2014 vs. FY 2013 – M€
Of which : CO2 sales: 12
+17M€ vs. FY ’13
ex. CO2 and FX
Volume effect dragged down
by France/Belgium but positive
trends confirmed in NA and
Thailand while Spain and
Greece showed signs of
recovery
Excluding Egypt:
Price/variable cost spread
almost neutral in 2014
reflecting efficiency actions
in an overall deflationary
environment
After the resolution of
production issues, positive
fixed cost results are now
more visible
FY FX effect is negative due
to Thailand and Egypt, with a
reversal trend in Q4
(40) 37
Excluding
Egypt
42
Italcementi Group Natixis | Paris, 24 November 2015 41
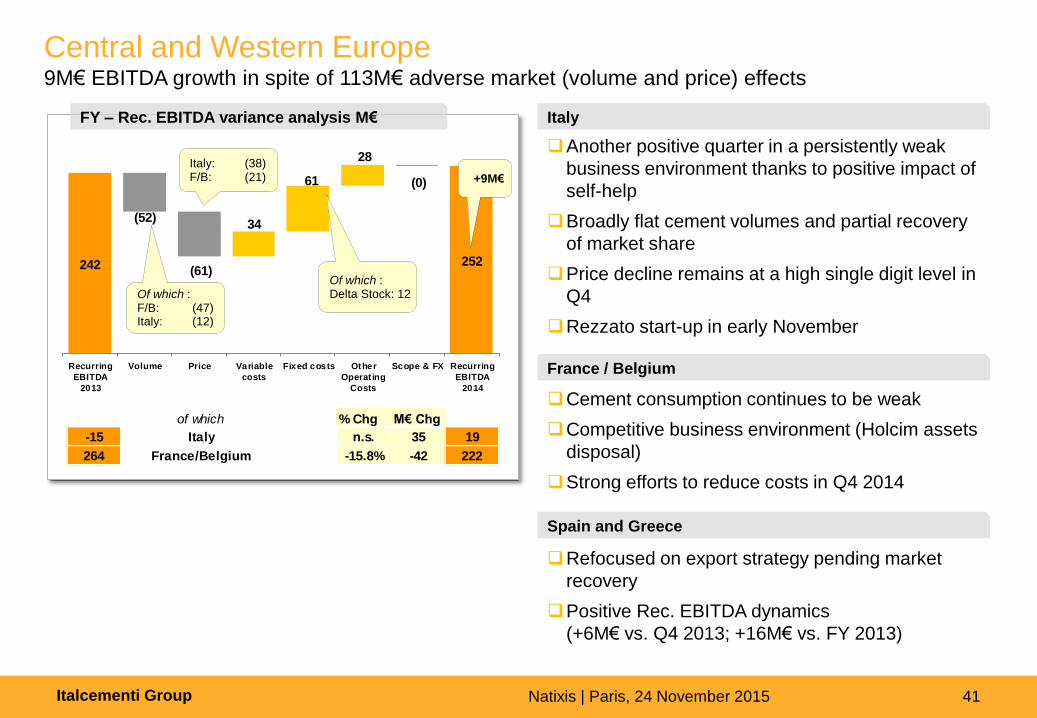
Central and Western Europe 9M€ EBITDA growth in spite of 113M€ adverse market (volume and price) effects
Another positive quarter in a persistently weak
business environment thanks to positive impact of
self-help
Broadly flat cement volumes and partial recovery
of market share
Price decline remains at a high single digit level in
Q4
Rezzato start-up in early November
Italy
France / Belgium
Cement consumption continues to be weak
Competitive business environment (Holcim assets
disposal)
Strong efforts to reduce costs in Q4 2014
Spain and Greece
Refocused on export strategy pending market
recovery
Positive Rec. EBITDA dynamics
(+6M€ vs. Q4 2013; +16M€ vs. FY 2013)
of which % Chg M€ Chg
-15 Italy n.s. 35 19
264 France/Belgium -15.8% -42 222
5362
(14)
(0)
(0)0
8
29
242 252
(52)
(0)
(61)
34
61
28
Recurring
EBITDA
2013
Volume Price Variable
costs
Fixed costs Other
Operat ing
Costs
Scope & FX Recurring
EBITDA
2014
FY – Rec. EBITDA variance analysis M€
Of which : F/B: (47) Italy: (12)
Italy: (38) F/B: (21) +9M€
Of which : Delta Stock: 12
Italcementi Group Natixis | Paris, 24 November 2015 42
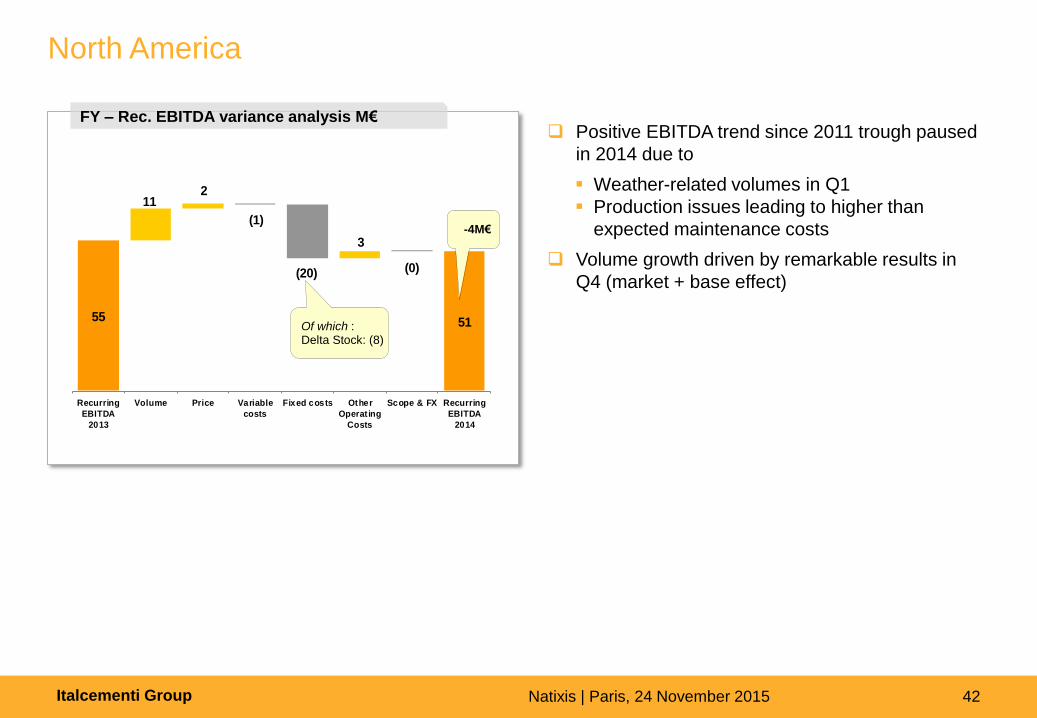
North America
Positive EBITDA trend since 2011 trough paused
in 2014 due to
Weather-related volumes in Q1
Production issues leading to higher than
expected maintenance costs
Volume growth driven by remarkable results in
Q4 (market + base effect)
FY – Rec. EBITDA variance analysis M€
Q4
22 10 0 2 -3 1 1 31
55 51
(1)
(20) (0)
112
3
Recurring
EBITDA
2013
Volume Price Variable
costs
Fixed costs Other
Operat ing
Costs
Scope & FX Recurring
EBITDA
2014
Of which : Delta Stock: (8)
-4M€
Italcementi Group Natixis | Paris, 24 November 2015 43
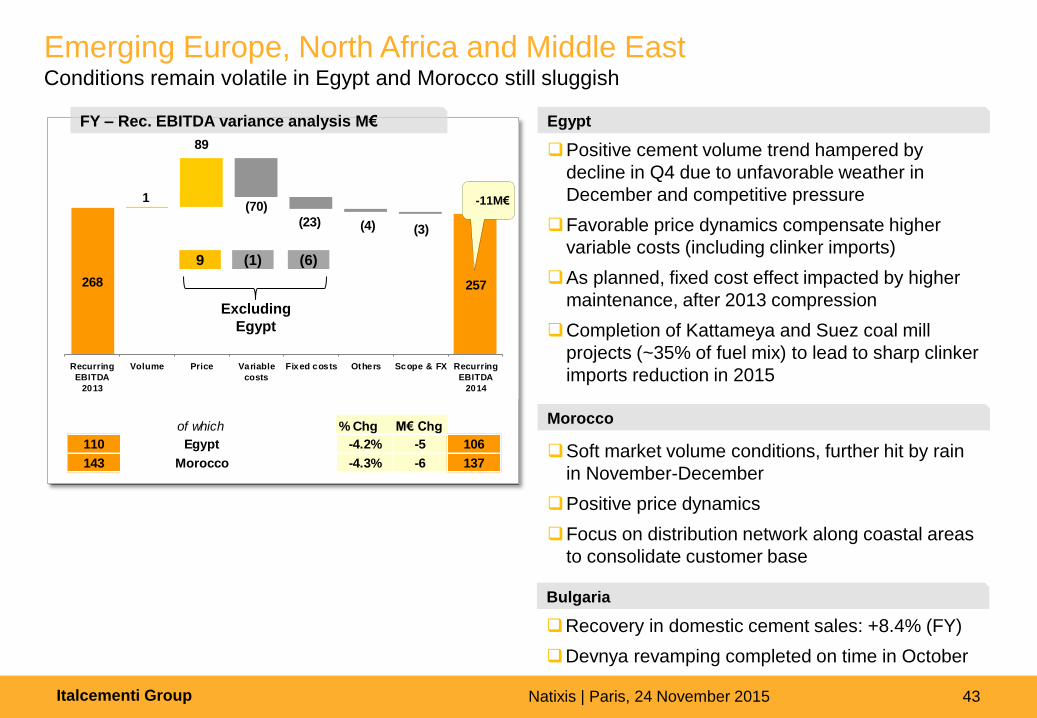
Emerging Europe, North Africa and Middle East Conditions remain volatile in Egypt and Morocco still sluggish
Positive cement volume trend hampered by
decline in Q4 due to unfavorable weather in
December and competitive pressure
Favorable price dynamics compensate higher
variable costs (including clinker imports)
As planned, fixed cost effect impacted by higher
maintenance, after 2013 compression
Completion of Kattameya and Suez coal mill
projects (~35% of fuel mix) to lead to sharp clinker
imports reduction in 2015
Egypt
Soft market volume conditions, further hit by rain
in November-December
Positive price dynamics
Focus on distribution network along coastal areas
to consolidate customer base
Morocco
Recovery in domestic cement sales: +8.4% (FY)
Devnya revamping completed on time in October
Bulgaria
of which % Chg M€ Chg
110 Egypt -4.2% -5 106
143 Morocco -4.3% -6 137
268 257
(70)
(4) (3)
1
89
(23)
Recurring
EBITDA
2013
Volume Price Variable
costs
Fixed costs Others Scope & FX Recurring
EBITDA
2014
FY – Rec. EBITDA variance analysis M€
(1) 9
Excluding
Egypt
(6)
-11M€
Italcementi Group Natixis | Paris, 24 November 2015 44
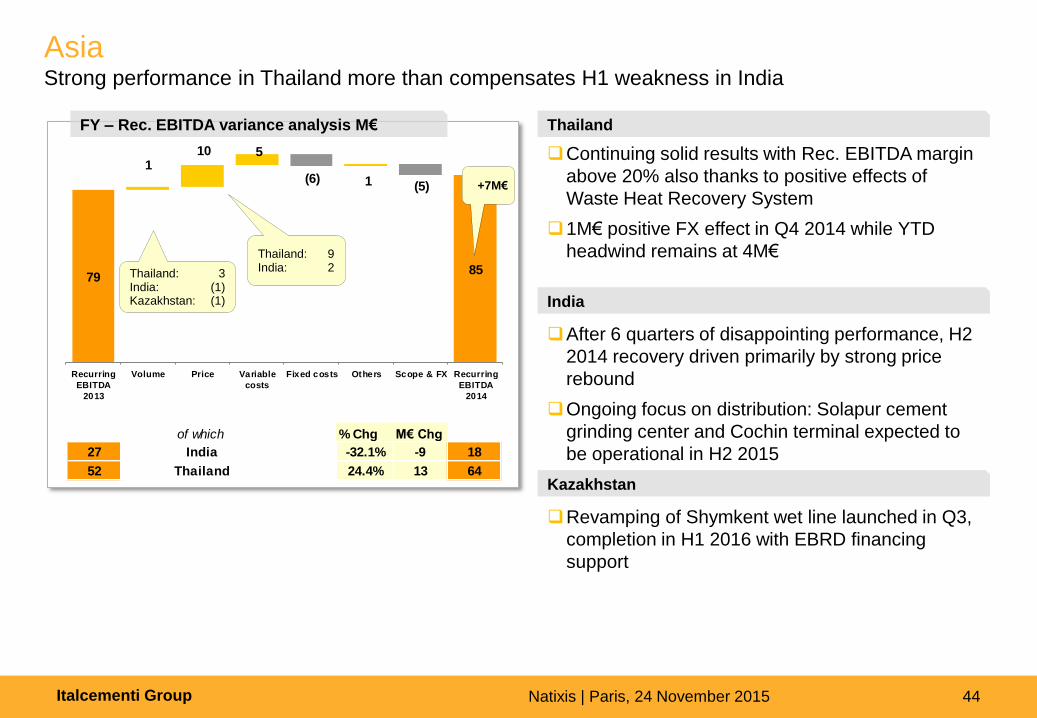
Asia Strong performance in Thailand more than compensates H1 weakness in India
Continuing solid results with Rec. EBITDA margin
above 20% also thanks to positive effects of
Waste Heat Recovery System
1M€ positive FX effect in Q4 2014 while YTD
headwind remains at 4M€
Thailand
After 6 quarters of disappointing performance, H2
2014 recovery driven primarily by strong price
rebound
Ongoing focus on distribution: Solapur cement
grinding center and Cochin terminal expected to
be operational in H2 2015
India
Revamping of Shymkent wet line launched in Q3,
completion in H1 2016 with EBRD financing
support
Kazakhstan
of which % Chg M€ Chg
27 India -32.1% -9 18
52 Thailand 24.4% 13 64
7985
5
(6) 1 (5)
110
Recurring
EBITDA
2013
Volume Price Variable
costs
Fixed costs Others Scope & FX Recurring
EBITDA
2014
Thailand: 3 India: (1) Kazakhstan: (1)
Thailand: 9 India: 2
FY – Rec. EBITDA variance analysis M€
+7M€
Italcementi Group Natixis | Paris, 24 November 2015 45
649
(5)
(417)
(139)
(15)227
(121) (49)
Rec. Ebitda Other NonRec. Items
D&A andImpairm.
EBIT NetFin.Exp.
Res. OfAssoc. &
Fin.Ass.Imp.
Income TaxExpenses
Profit (Loss)
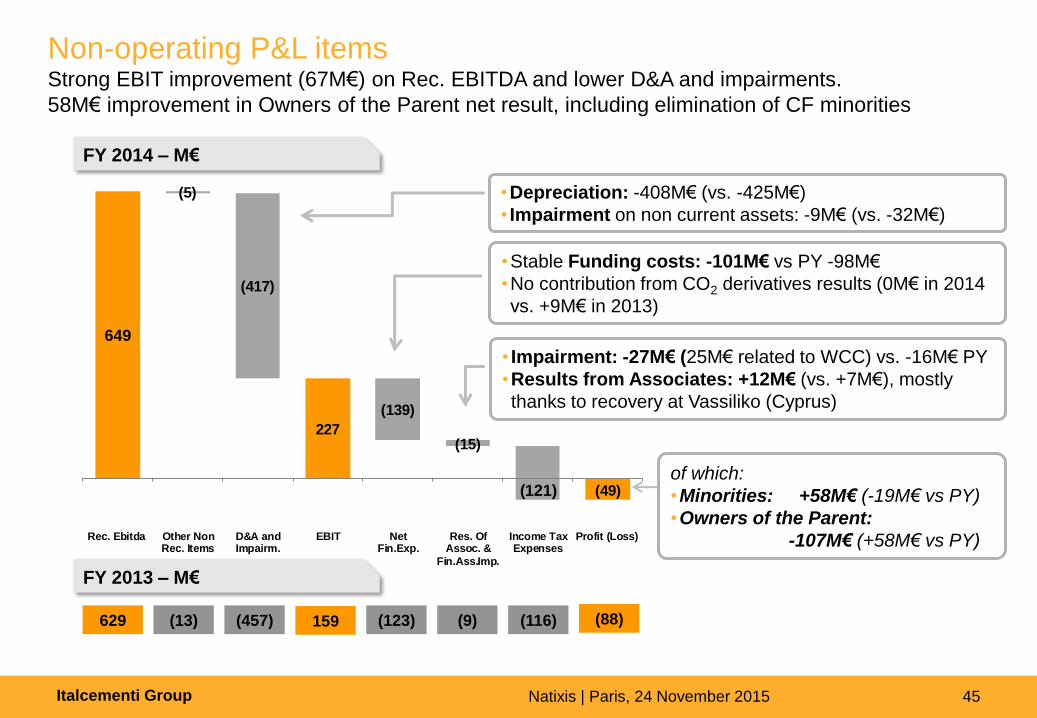
Non-operating P&L items Strong EBIT improvement (67M€) on Rec. EBITDA and lower D&A and impairments.
58M€ improvement in Owners of the Parent net result, including elimination of CF minorities
FY 2014 – M€
FY 2013 – M€
629 (88) (457) (9)
•Stable Funding costs: -101M€ vs PY -98M€
•No contribution from CO2 derivatives results (0M€ in 2014
vs. +9M€ in 2013)
(116) (13) (123)
• Impairment: -27M€ (25M€ related to WCC) vs. -16M€ PY
•Results from Associates: +12M€ (vs. +7M€), mostly
thanks to recovery at Vassiliko (Cyprus)
•Depreciation: -408M€ (vs. -425M€)
• Impairment on non current assets: -9M€ (vs. -32M€)
159
of which:
•Minorities: +58M€ (-19M€ vs PY)
•Owners of the Parent:
-107M€ (+58M€ vs PY)
Italcementi Group Natixis | Paris, 24 November 2015 46
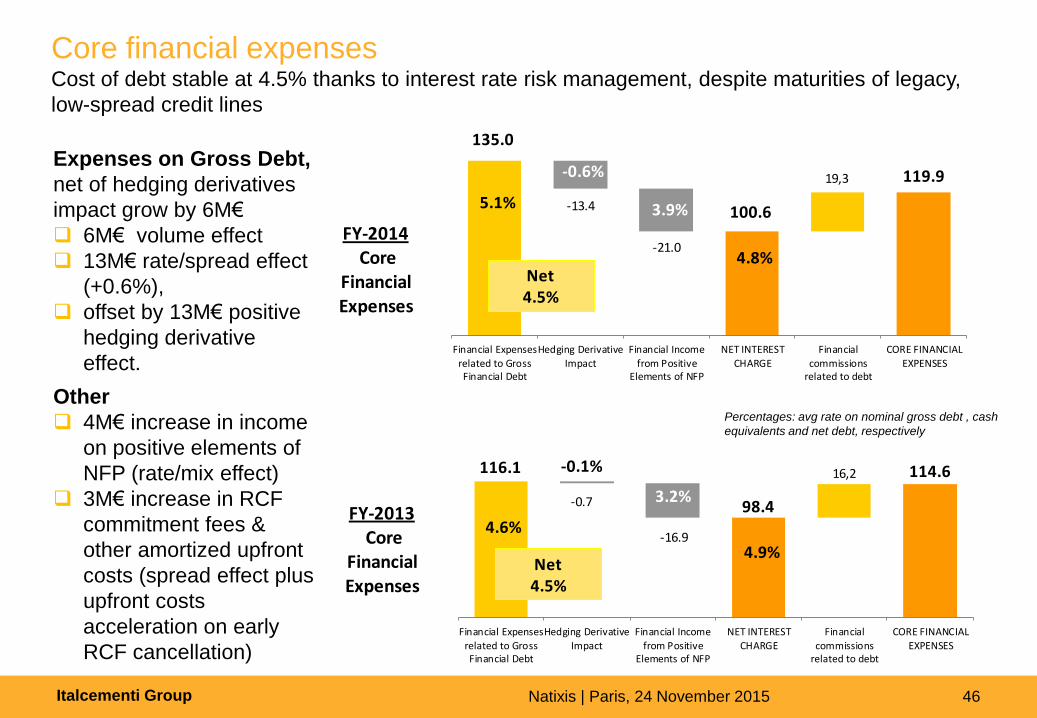
Core financial expenses Cost of debt stable at 4.5% thanks to interest rate risk management, despite maturities of legacy,
low-spread credit lines
Expenses on Gross Debt,
net of hedging derivatives
impact grow by 6M€
6M€ volume effect
13M€ rate/spread effect
(+0.6%),
offset by 13M€ positive
hedging derivative
effect.
Other
4M€ increase in income
on positive elements of
NFP (rate/mix effect)
3M€ increase in RCF
commitment fees &
other amortized upfront
costs (spread effect plus
upfront costs
acceleration on early
RCF cancellation)
Percentages: avg rate on nominal gross debt , cash
equivalents and net debt, respectively
116.1
98.4
114.6
-0.7
-16.9
16,2
Financial Expenses
related to GrossFinancial Debt
Hedging Derivative
Impact
Financial Income
from PositiveElements of NFP
NET INTEREST
CHARGE
Financial
commissionsrelated to debt
CORE FINANCIAL
EXPENSES
FY-2013Core
Financial Expenses
4.6%
-0.1%
3.2%
4.9%Net4.5%
135.0
100.6
119.9
-13.4
-21.0
19,3
Financial Expenses
related to GrossFinancial Debt
Hedging Derivative
Impact
Financial Income
from PositiveElements of NFP
NET INTEREST
CHARGE
Financial
commissionsrelated to debt
CORE FINANCIAL
EXPENSES
FY-2014Core
Financial Expenses
Net4.5%
5.1%
-0.6%
3.9%
4.8%
Italcementi Group Natixis | Paris, 24 November 2015 47
(4) 7 (1,934) (1,991) 398 38 (336)
N.F.P.
31.12.12
N.F.P.
31.12.13
(84) 37
FY 2014 – M€
FY 2013 – M€
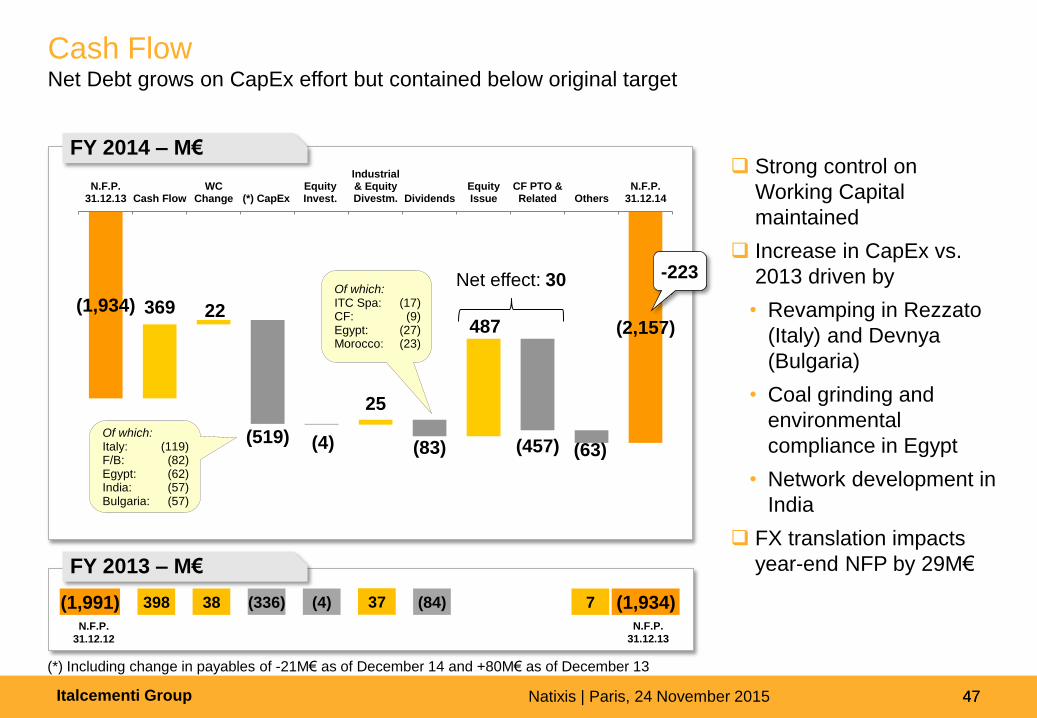
Cash Flow Net Debt grows on CapEx effort but contained below original target
Strong control on
Working Capital
maintained
Increase in CapEx vs.
2013 driven by
• Revamping in Rezzato
(Italy) and Devnya
(Bulgaria)
• Coal grinding and
environmental
compliance in Egypt
• Network development in
India
FX translation impacts
year-end NFP by 29M€
47
(*) Including change in payables of -21M€ as of December 14 and +80M€ as of December 13
(1,934)
(2,157) 369 22
25
487
(519) (4) (83) (457) (63)
N.F.P.31.12.13 Cash Flow
WCChange (*) CapEx
EquityInvest.
Industrial& EquityDivestm. Dividends
EquityIssue
CF PTO &Related Others
N.F.P.31.12.14
Net effect: 30
Of which: Italy: (119) F/B: (82) Egypt: (62) India: (57) Bulgaria: (57)
-223 Of which: ITC Spa: (17) CF: (9) Egypt: (27) Morocco: (23)
Italcementi Group Natixis | Paris, 24 November 2015 48
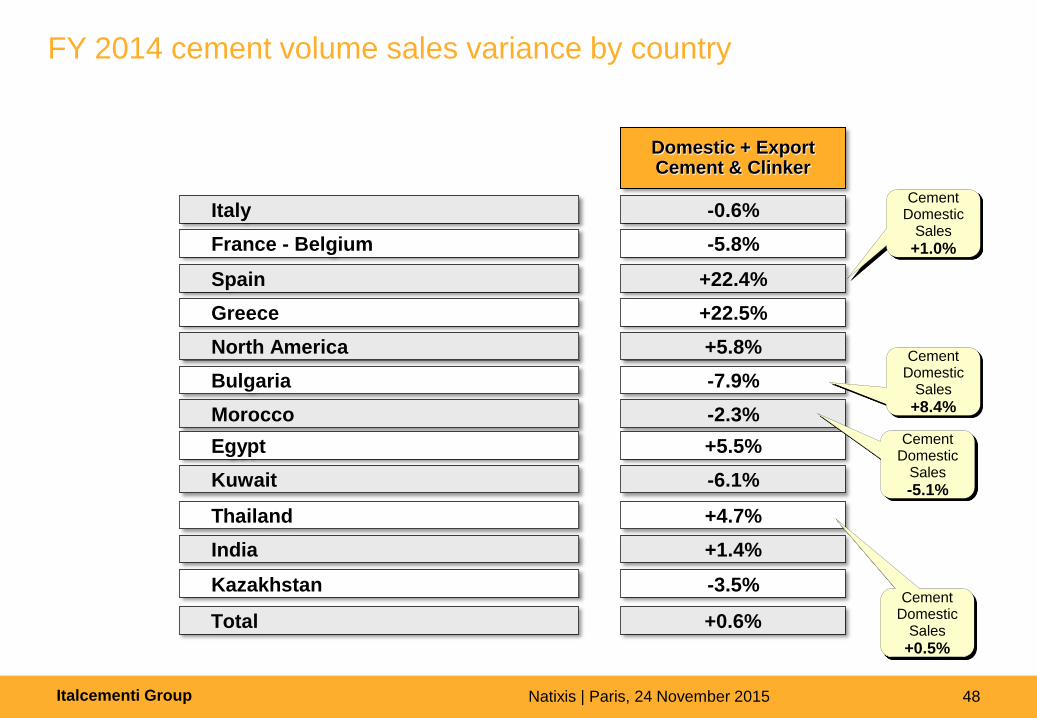
FY 2014 cement volume sales variance by country
Domestic + Export Cement & Clinker
Italy
France - Belgium
Spain
Greece
North America
Bulgaria
Morocco
Egypt
Kuwait
Thailand
India
Kazakhstan
-0.6%
-5.8%
+22.4%
+22.5%
+5.8%
-7.9%
-2.3%
+5.5%
-6.1%
+4.7%
+1.4%
-3.5%
Cement Domestic
Sales
+1.0%
Total +0.6%
Cement Domestic
Sales
+8.4%
Cement Domestic
Sales
+0.5%
Cement Domestic
Sales
-5.1%
Italcementi Group Natixis | Paris, 24 November 2015 49
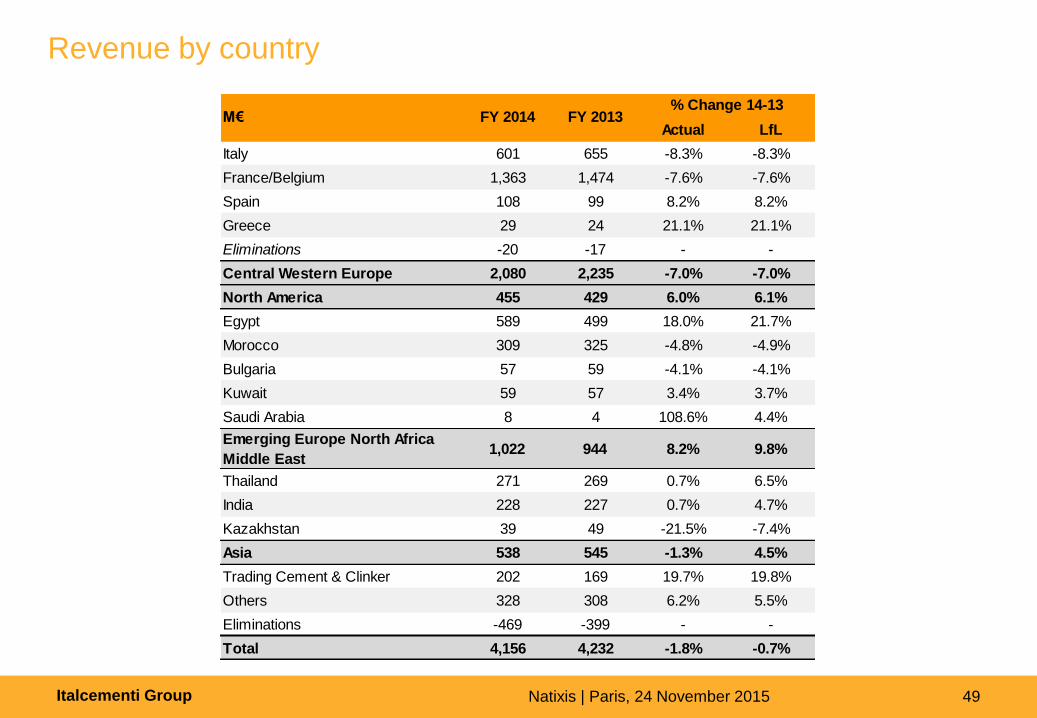
Revenue by country
Actual LfL
Italy 601 655 -8.3% -8.3%
France/Belgium 1,363 1,474 -7.6% -7.6%
Spain 108 99 8.2% 8.2%
Greece 29 24 21.1% 21.1%
Eliminations -20 -17 - -
Central Western Europe 2,080 2,235 -7.0% -7.0%
North America 455 429 6.0% 6.1%
Egypt 589 499 18.0% 21.7%
Morocco 309 325 -4.8% -4.9%
Bulgaria 57 59 -4.1% -4.1%
Kuwait 59 57 3.4% 3.7%
Saudi Arabia 8 4 108.6% 4.4%
Emerging Europe North Africa
Middle East1,022 944 8.2% 9.8%
Thailand 271 269 0.7% 6.5%
India 228 227 0.7% 4.7%
Kazakhstan 39 49 -21.5% -7.4%
Asia 538 545 -1.3% 4.5%
Trading Cement & Clinker 202 169 19.7% 19.8%
Others 328 308 6.2% 5.5%
Eliminations -469 -399 - -
Total 4,156 4,232 -1.8% -0.7%
FY 2014 FY 2013% Change 14-13
M€
Italcementi Group Natixis | Paris, 24 November 2015 50
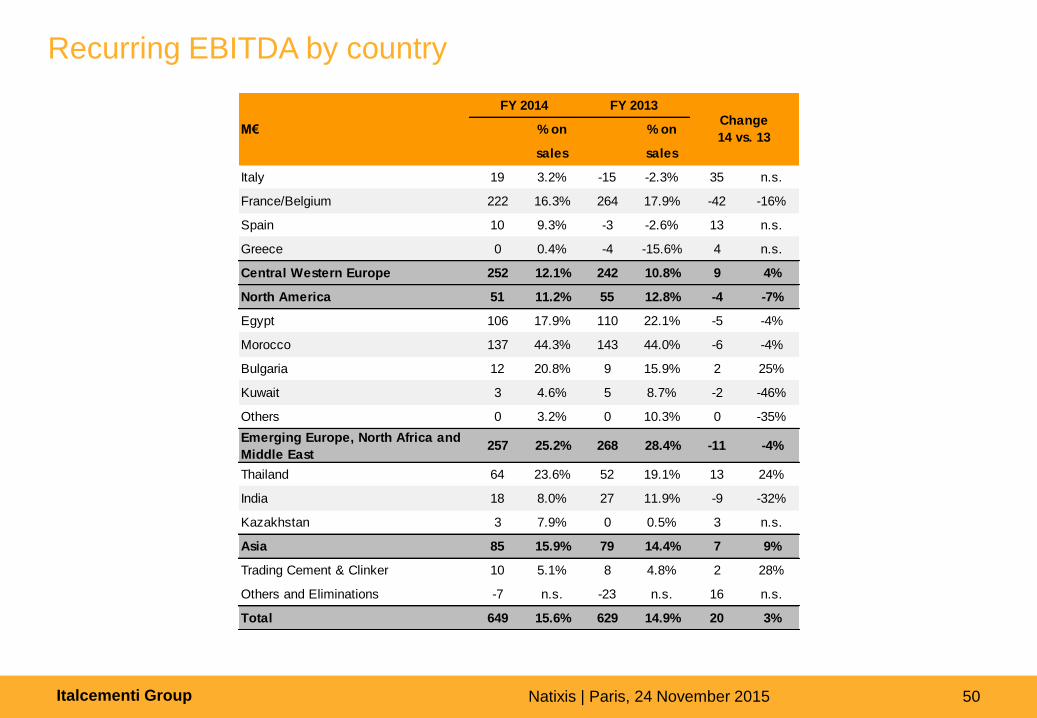
Recurring EBITDA by country
% on % on
sales sales
Italy 19 3.2% -15 -2.3% 35 n.s.
France/Belgium 222 16.3% 264 17.9% -42 -16%
Spain 10 9.3% -3 -2.6% 13 n.s.
Greece 0 0.4% -4 -15.6% 4 n.s.
Central Western Europe 252 12.1% 242 10.8% 9 4%
North America 51 11.2% 55 12.8% -4 -7%
Egypt 106 17.9% 110 22.1% -5 -4%
Morocco 137 44.3% 143 44.0% -6 -4%
Bulgaria 12 20.8% 9 15.9% 2 25%
Kuwait 3 4.6% 5 8.7% -2 -46%
Others 0 3.2% 0 10.3% 0 -35%
Emerging Europe, North Africa and
Middle East257 25.2% 268 28.4% -11 -4%
Thailand 64 23.6% 52 19.1% 13 24%
India 18 8.0% 27 11.9% -9 -32%
Kazakhstan 3 7.9% 0 0.5% 3 n.s.
Asia 85 15.9% 79 14.4% 7 9%
Trading Cement & Clinker 10 5.1% 8 4.8% 2 28%
Others and Eliminations -7 n.s. -23 n.s. 16 n.s.
Total 649 15.6% 629 14.9% 20 3%
FY 2013Change
14 vs. 13M€
FY 2014
Italcementi Group Natixis | Paris, 24 November 2015 51 51 Analyst Meeting – 8 March 2010 51 51 Analyst Meeting – 8 March 2010 51 Analyst Meeting – 8 March 2010 51 51 Analyst Meeting - 7 May 2009 51 Analyst Meeting - 07 May 2009
Appendix 3 Group Overview
Italcementi Group Natixis | Paris, 24 November 2015 52
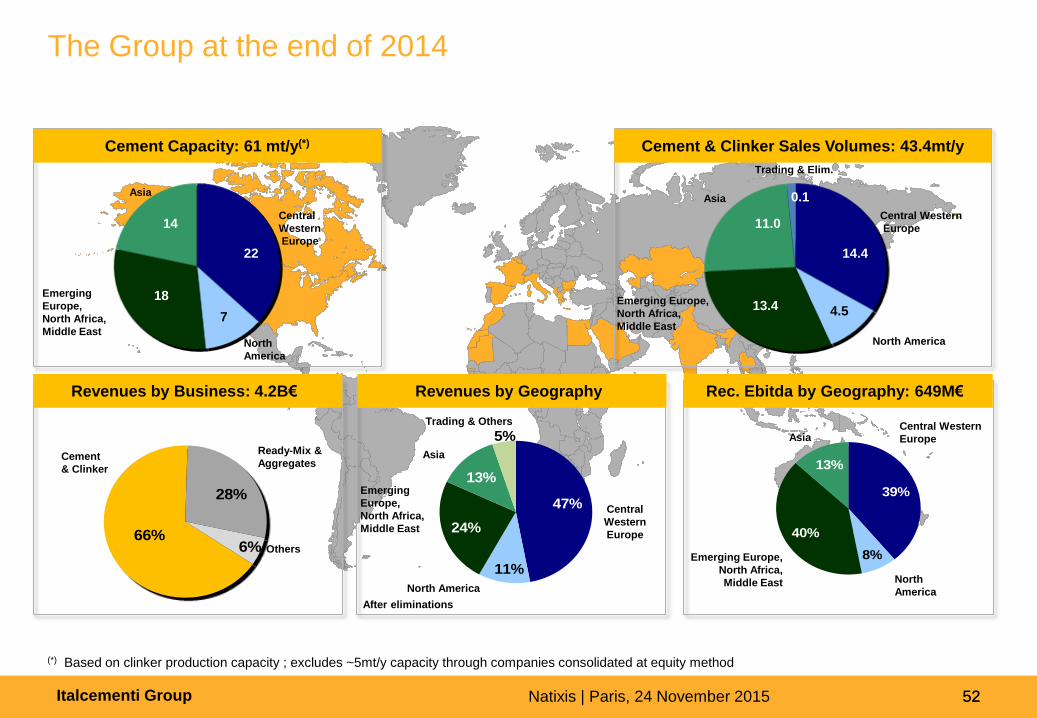
The Group at the end of 2014
47%
11%
24%
13%
5%
Rec. Ebitda by Geography: 649M€ Revenues by Geography
After eliminations
Revenues by Business: 4.2B€
66%
28%
6%
Ready-Mix &
Aggregates
Others
Cement
& Clinker
Central
Western
Europe
Emerging
Europe,
North Africa,
Middle East
Asia
North America
39%
8%
40%
13%
Central Western
Europe
Emerging Europe,
North Africa,
Middle East
Asia
North
America
Central Western
Europe
Emerging Europe,
North Africa,
Middle East
Asia
North America
14.4
13.4 4.5
11.0
Cement & Clinker Sales Volumes: 43.4mt/y
(*) Based on clinker production capacity ; excludes ~5mt/y capacity through companies consolidated at equity method
Trading & Others
Trading & Elim.
0.1
Central
Western
Europe
Emerging
Europe,
North Africa,
Middle East
Asia
North
America
22
18
7
14
Cement Capacity: 61 mt/y(*)
52
Italcementi Group Natixis | Paris, 24 November 2015 53
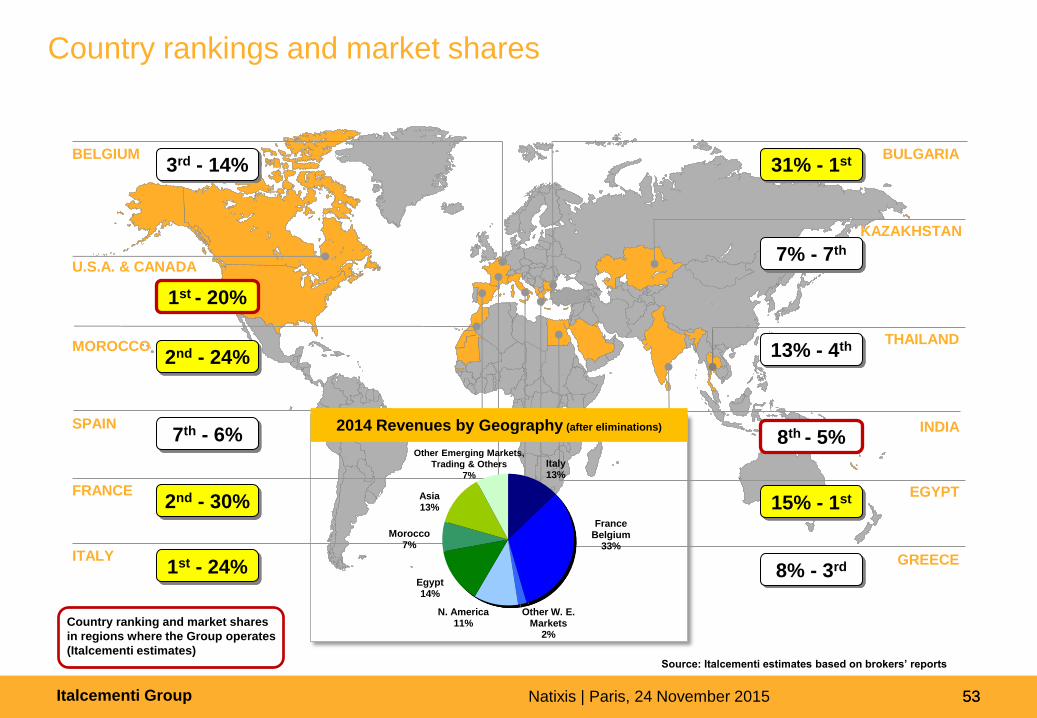
Country rankings and market shares
53
Source: Italcementi estimates based on brokers’ reports
BELGIUM 3rd - 14%
U.S.A. & CANADA
1st - 20%
MOROCCO 2nd - 24%
SPAIN 7th - 6%
FRANCE 2nd - 30%
ITALY 1st - 24%
BULGARIA 31% - 1st
KAZAKHSTAN
7% - 7th
INDIA
THAILAND 13% - 4th
EGYPT 15% - 1st
GREECE 8% - 3rd
Italy 13%
France Belgium
33%
Other W. E. Markets
2%
N. America 11%
Egypt 14%
Morocco 7%
Asia 13%
Other Emerging Markets,
Trading & Others
7%
Country ranking and market shares
in regions where the Group operates
(Italcementi estimates)
2014 Revenues by Geography (after eliminations)
8th - 5%
Italcementi Group Natixis | Paris, 24 November 2015 54
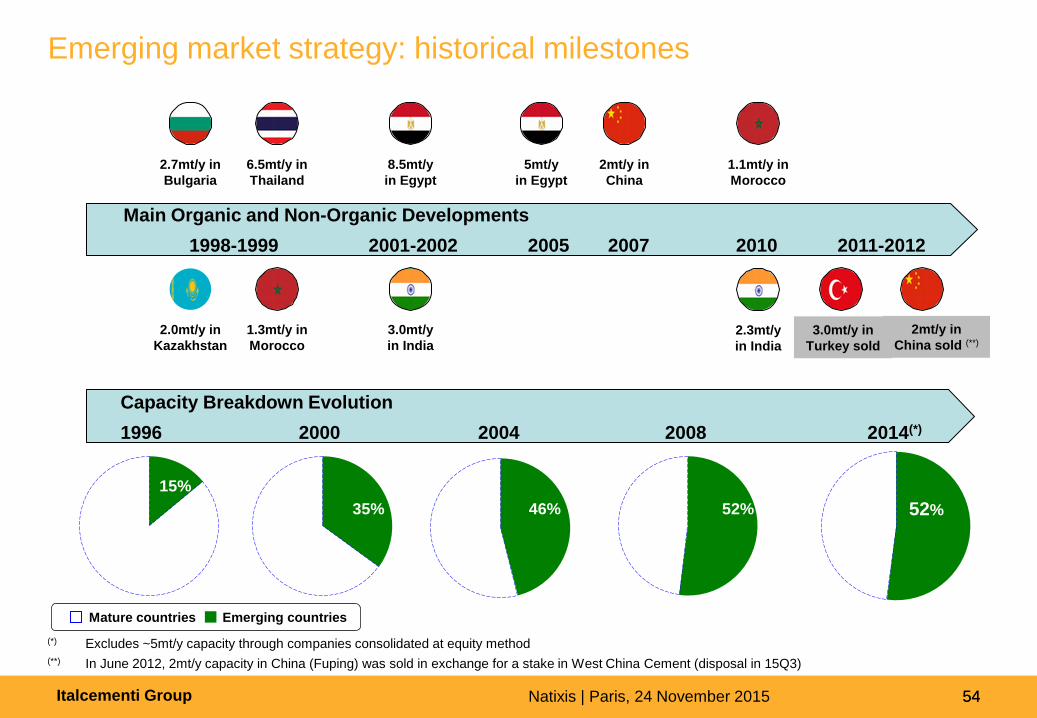
Emerging market strategy: historical milestones
15%
35% 46% 52% 52%
Main Organic and Non-Organic Developments
1998-1999 2001-2002 2005 2007 2010 2011-2012
2.7mt/y in
Bulgaria
Mature countries Emerging countries
2.0mt/y in
Kazakhstan
2mt/y in
China
6.5mt/y in
Thailand
1.3mt/y in
Morocco
8.5mt/y
in Egypt
3.0mt/y
in India
5mt/y
in Egypt
3.0mt/y in
Turkey sold
2.3mt/y
in India
1.1mt/y in
Morocco
Capacity Breakdown Evolution
1996 2000 2004 2008 2014(*)
(*) Excludes ~5mt/y capacity through companies consolidated at equity method
(**) In June 2012, 2mt/y capacity in China (Fuping) was sold in exchange for a stake in West China Cement (disposal in 15Q3)
2mt/y in
China sold (**)
54
Italcementi Group Natixis | Paris, 24 November 2015 55
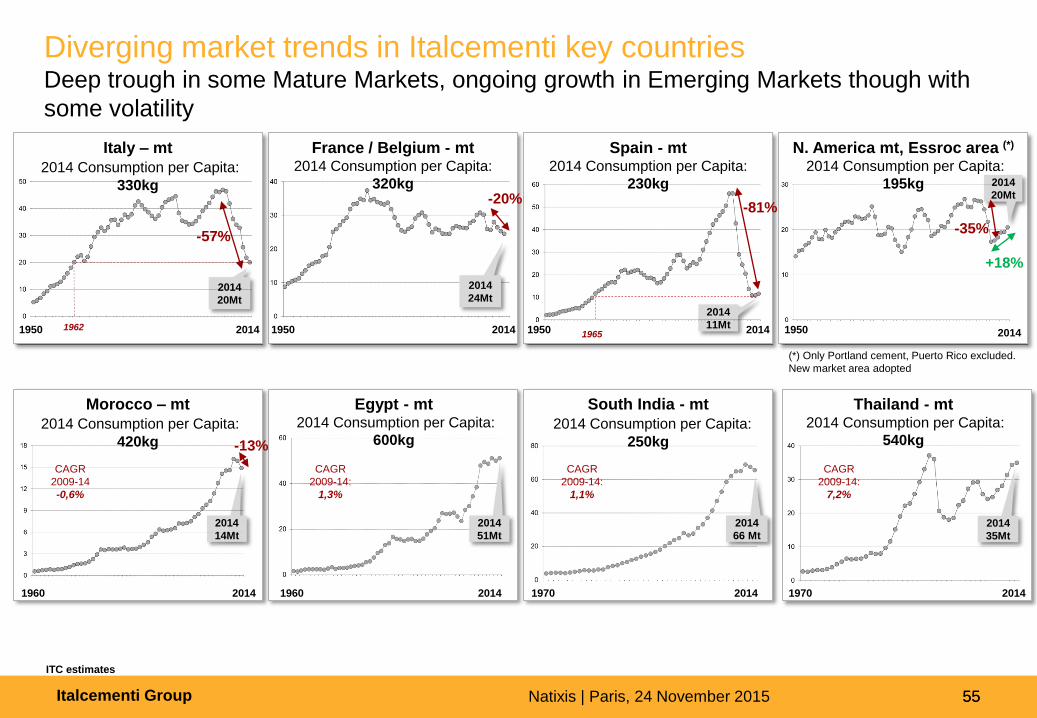
France / Belgium - mt 2014 Consumption per Capita:
320kg
55
2014
20Mt
1950 2014
-57%
1962
Italy – mt
2014 Consumption per Capita:
330kg
N. America mt, Essroc area (*)
2014 Consumption per Capita:
195kg
(*) Only Portland cement, Puerto Rico excluded.
New market area adopted
ITC estimates
Morocco – mt
2014 Consumption per Capita:
420kg
South India - mt
2014 Consumption per Capita:
250kg
Thailand - mt 2014 Consumption per Capita:
540kg
1950 2014
2014
20Mt
-35%
+18%
1960 2014 1970 2014
2014
66 Mt
CAGR
2009-14:
1,1%
1970 2014
CAGR
2009-14:
7,2%
1950 2014
-20%
2014
24Mt
CAGR
2009-14
-0,6%
2014
14Mt
1960 2014
CAGR
2009-14:
1,3%
2014
51Mt
Spain - mt 2014 Consumption per Capita:
230kg
2014
11Mt 1950 2014 1965
-81%
-13%
2014
35Mt
Diverging market trends in Italcementi key countries Deep trough in some Mature Markets, ongoing growth in Emerging Markets though with
some volatility
Egypt - mt 2014 Consumption per Capita:
600kg
Italcementi Group Natixis | Paris, 24 November 2015 56
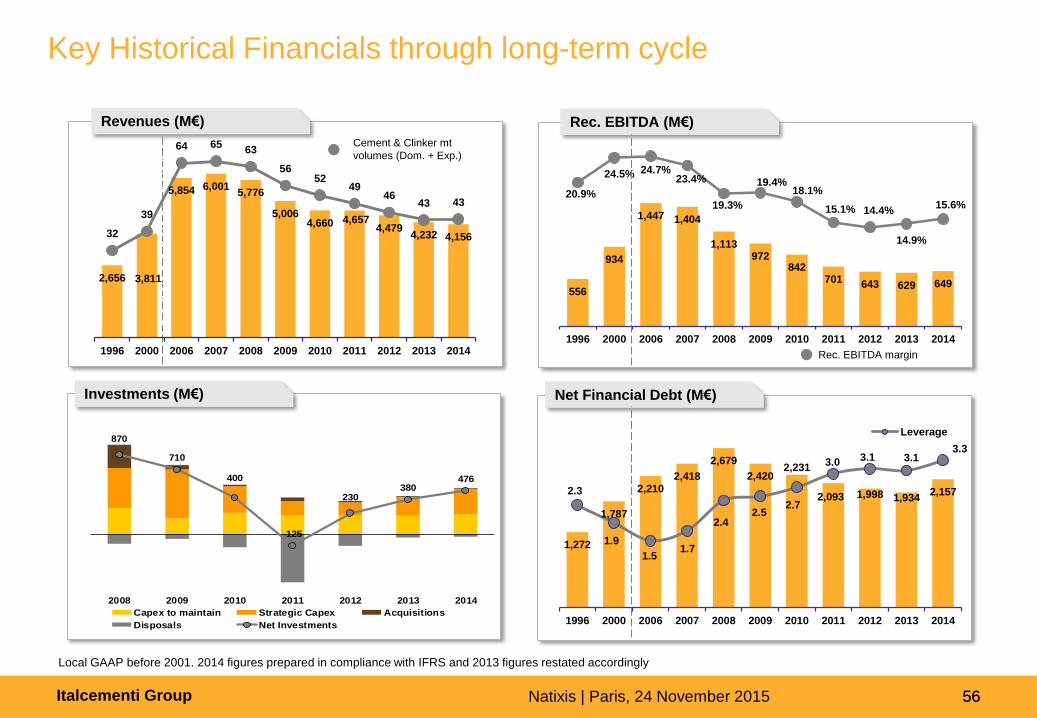
Key Historical Financials through long-term cycle
Local GAAP before 2001. 2014 figures prepared in compliance with IFRS and 2013 figures restated accordingly
1,272
1,787
2,210 2,418
2,679
2,420 2,231
2,093 1,998 1,934 2,157 2.3
1.9
1.5 1.7
2.4 2.5
2.7
3.0 3.1 3.1 3.3
1996 2000 2006 2007 2008 2009 2010 2011 2012 2013 2014
Leverage
Investments (M€)
556
934
1,447 1,404
1,113 972
842 701 643 629 649
20.9%
24.5% 24.7% 23.4%
19.3%
19.4% 18.1%
15.1% 14.4%
14.9%
15.6%
1996 2000 2006 2007 2008 2009 2010 2011 2012 2013 2014
Rec. EBITDA margin
Rec. EBITDA (M€) Revenues (M€)
Net Financial Debt (M€)
870
710
400
-125
230380
476
2008 2009 2010 2011 2012 2013 2014
Capex to maintain Strategic Capex Acquisitions
Disposals Net Investments
56
2,656 3,811
5,854 6,0015,776
5,0064,660 4,657
4,4794,232 4,15632
39
64 6563
5652
4946
43 43
1996 2000 2006 2007 2008 2009 2010 2011 2012 2013 2014
Cement & Clinker mt
volumes (Dom. + Exp.)
Italcementi Group Natixis | Paris, 24 November 2015 57
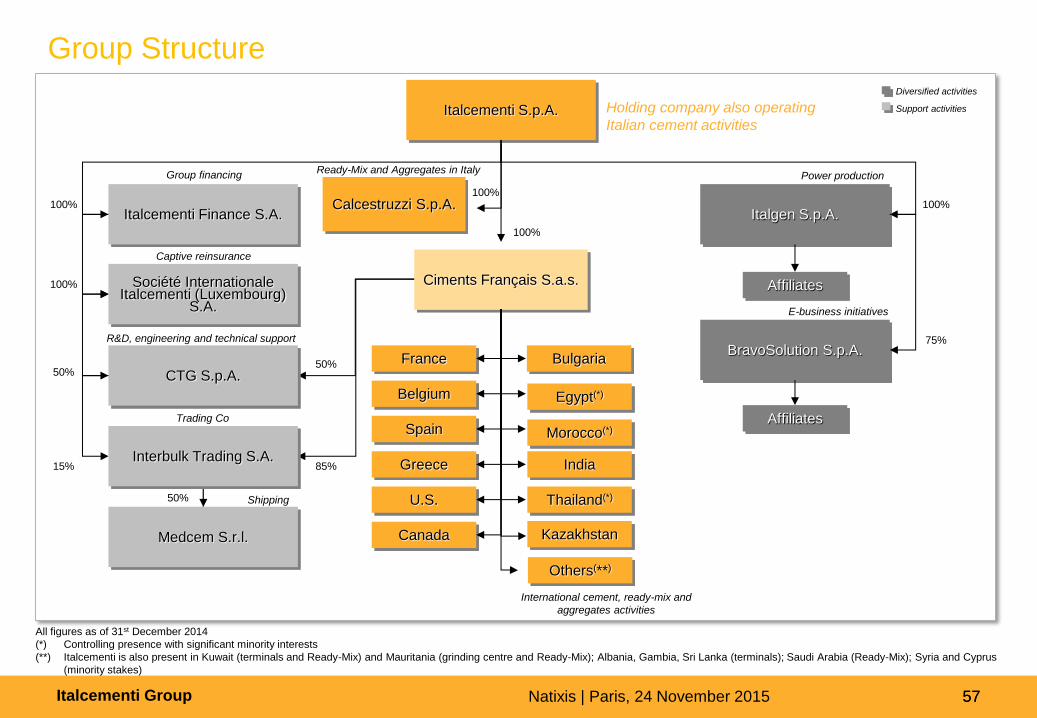
Group Structure
57
Italcementi S.p.A. Holding company also operating
Italian cement activities
Italgen S.p.A.
BravoSolution S.p.A.
E-business initiatives
Power production
75%
100% Italcementi Finance S.A.
Société Internationale Italcementi (Luxembourg)
S.A.
CTG S.p.A.
R&D, engineering and technical support
Captive reinsurance
Trading Co
Group financing
50%
85%
50%
15%
100%
100%
Medcem S.r.l.
Shipping
Interbulk Trading S.A.
50%
Support activities
Diversified activities
Ciments Français S.a.s.
Bulgaria
Egypt(*)
Thailand(*)
100%
International cement, ready-mix and
aggregates activities
France
Belgium
Canada
Spain
Greece
U.S.
Others(**)
Morocco(*)
India
Kazakhstan
All figures as of 31st December 2014
(*) Controlling presence with significant minority interests
(**) Italcementi is also present in Kuwait (terminals and Ready-Mix) and Mauritania (grinding centre and Ready-Mix); Albania, Gambia, Sri Lanka (terminals); Saudi Arabia (Ready-Mix); Syria and Cyprus
(minority stakes)
Affiliates
Affiliates
Calcestruzzi S.p.A. 100%
Ready-Mix and Aggregates in Italy
Italcementi Group Natixis | Paris, 24 November 2015 58
Accounting policies
Consolidated Financial Statements have been drawn up in compliance with IFRS as applicable at
September 30, 2015 and endorsed by the E.U. Commission. There are no significant changes in
the consolidation perimeter in 9M 2015 vs. 2014.
Changes in IFRS
With regard to application of IAS 16 “Property, plant and equipment”, the Group has reviewed
its industrial assets and revised their useful lives. The revision has determined lower
Depreciation for 10.2M€ in the 9M
Accounting for CVAE (Cotisation sur la Valeur Ajoutée des Entreprises) in France has been
reviewed. CVAE is now reported consistently with similar tax items in other jurisdictions, as
“Income Tax Expense” instead of “Other taxes”. The impact on Rec. EBITDA is +5.4M€ in the
9M 2014, offset by higher “Income Tax Expense”
Changes in Operating segments
With full effect since January 1, 2015, operations in Bulgaria have been reclassified to CWE
from EENAME in the operating segment disclosure. After this change, the new definitions of
the areas are Europe and North Africa and Middle East. 2014 data are restated accordingly
Italcementi Group Natixis | Paris, 24 November 2015 59
Disclaimer This presentation contains forward-looking statements regarding future events and future results of Italcementi and its affiliates
that are based on the current expectations, estimates, forecasts and projections about the industries in which the Italcementi
Group operates, and on the beliefs and assumptions of the management of the Italcementi Group. In particular, among other
statements, certain statements with regard to management objectives, trends in results of operations, margins, costs, return on
equity, risk management, competition, changes in business strategy and the acquisition and disposition of assets are forward-
looking in nature. Words such as ‘expects’, ‘anticipates’, ‘scenario’, ‘outlook’, ‘targets’, ‘goals’, ‘projects’, ‘intends’, ‘plans’,
‘believes’, ‘seeks’, ‘estimates’, as well as any variation of such words and similar expressions, are intended to identify such
forward-looking statements. Those forward-looking statements are only assumptions and are subject to risks, uncertainties and
assumptions that are difficult to predict because they relate to events and depend upon circumstances that will occur in the
future. Therefore, actual results of the Italcementi Group or of its affiliates may differ materially and adversely from those
expressed or implied in any forward-looking statement and Italcementi Group does not assume any liability with respect thereto.
Factors that might cause or contribute to such differences include, but are not limited to, global economic conditions, the impact
of competition, or political and economic developments in the countries in which the Italcementi Group operates. Any forward-
looking statements made by or on behalf of the Italcementi Group speak only as of the date they are made. The Italcementi
Group does not undertake to update forward-looking statements to reflect any change in their expectations with regard thereto,
or any change in events, conditions or circumstances which any such statement is based on. The reader is advised to consult
any further disclosure that may be made in documents filed by the Italcementi Group with the Italian Market Authorities.
The Manager in Charge of preparing Italcementi S.p.A financial reports, Carlo Bianchini, hereby certifies pursuant to paragraph
2 of art. 154-bis of the Consolidated Law on Finance (Testo Unico della Finanza), that the accounting disclosures of this
document are consistent with the accounting documents, ledgers and entries.
This presentation has been prepared solely for the use at the meeting/Analyst Meeting with investors and analysts at the date
shown below. Under no circumstances may this presentation be deemed to be an offer to sell, a solicitation to buy or a
solicitation of an offer to buy securities of any kind in any jurisdiction where such an offer, solicitation or sale should follow any
registration, qualification, notice, disclosure or application under the securities laws and regulations of any such jurisdiction.
Italcementi Group Natixis | Paris, 24 November 2015 60
Investor Relations
Contacts
Investor Relations Department Via G. Camozzi, 124 - 24121 Bergamo - Italy
www.italcementigroup.com
Arturo Carchio, IR
Tel. +39 035 39 68 66 E-mail: [email protected]
Fabienne Moreau, IR
Tel. +33 1 4291 7758 E-mail: [email protected]