Embed Size (px)
Citation preview
22
Ivory Case Study
I: Ivory World WISE Seizure Data Analysis of illegal ivory (kg) data was based on seizure records in World WISE from 2005 to 2014. Source of shipment does not necessarily indicate origin of the specimen. Destination of shipment does not necessarily indicate the final destination and could indicate a transit country. Ivory and ivory pieces were used in the analysis and conversions were applied to convert number of items to kg. See table for details on conversions. Figure. Seized Ivory (kg), 2005 to 2014. Conversions applied.
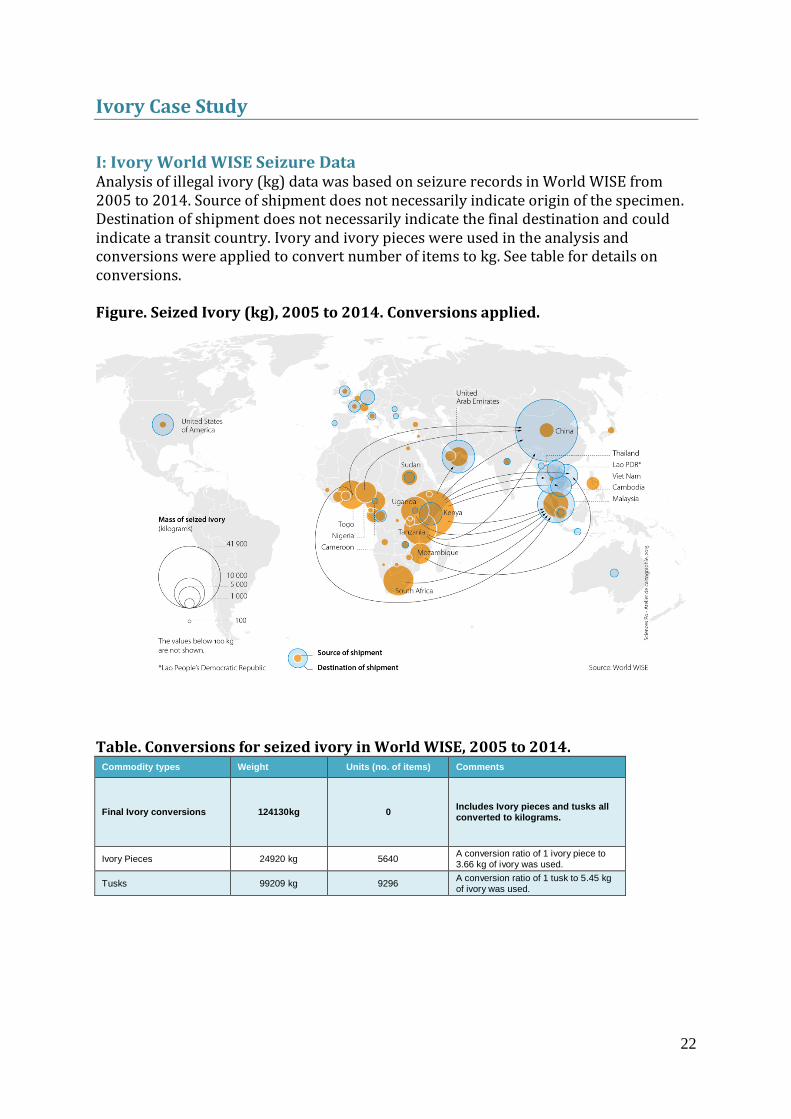
Table. Conversions for seized ivory in World WISE, 2005 to 2014.
Commodity types Weight Units (no. of items) Comments
Final Ivory conversions 124130kg 0 Includes Ivory pieces and tusks all converted to kilograms.
Ivory Pieces 24920 kg 5640 A conversion ratio of 1 ivory piece to 3.66 kg of ivory was used.
Tusks 99209 kg 9296 A conversion ratio of 1 tusk to 5.45 kg of ivory was used.
23
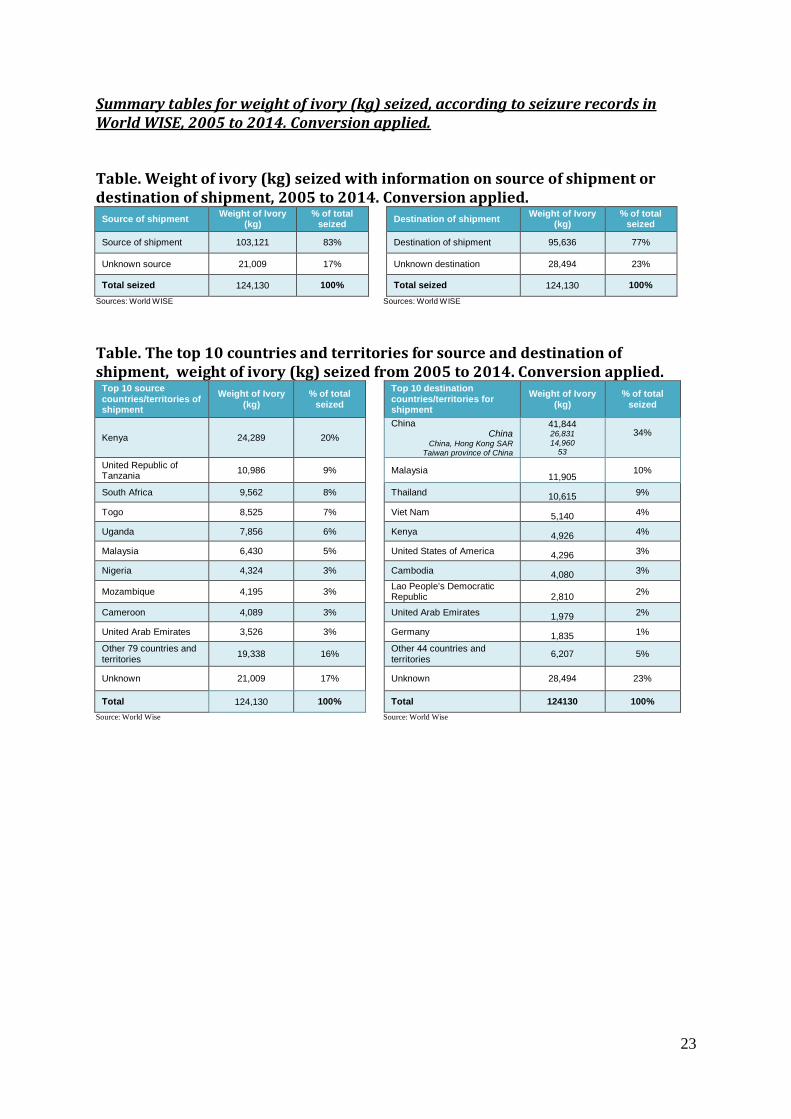
Summary tables for weight of ivory (kg) seized, according to seizure records in World WISE, 2005 to 2014. Conversion applied. Table. Weight of ivory (kg) seized with information on source of shipment or destination of shipment, 2005 to 2014. Conversion applied.
Source of shipment Weight of Ivory
(kg) % of total
seized
Destination of shipment Weight of Ivory
(kg) % of total
seized
Source of shipment 103,121 83%
Destination of shipment 95,636 77%
Unknown source 21,009 17%
Unknown destination 28,494 23%
Total seized 124,130 100%
Total seized 124,130 100%
Sources: World WISE Sources: World WISE Table. The top 10 countries and territories for source and destination of shipment, weight of ivory (kg) seized from 2005 to 2014. Conversion applied.
Top 10 source countries/territories of shipment
Weight of Ivory (kg)
% of total seized
Top 10 destination countries/territories for shipment
Weight of Ivory (kg)
% of total seized
Kenya 24,289 20%
China China
China, Hong Kong SAR Taiwan province of China
41,844 26,831 14,960
53
34%
United Republic of Tanzania
10,986 9%
Malaysia 11,905
10%
South Africa 9,562 8%
Thailand 10,615 9%
Togo 8,525 7%
Viet Nam 5,140 4%
Uganda 7,856 6%
Kenya 4,926 4%
Malaysia 6,430 5%
United States of America 4,296 3%
Nigeria 4,324 3%
Cambodia 4,080 3%
Mozambique 4,195 3%
Lao People's Democratic Republic 2,810
2%
Cameroon 4,089 3%
United Arab Emirates 1,979 2%
United Arab Emirates 3,526 3%
Germany 1,835 1%
Other 79 countries and territories
19,338 16%
Other 44 countries and territories
6,207 5%
Unknown 21,009 17%
Unknown 28,494 23%
Total 124,130 100%
Total 124130 100%
Source: World Wise Source: World Wise
24
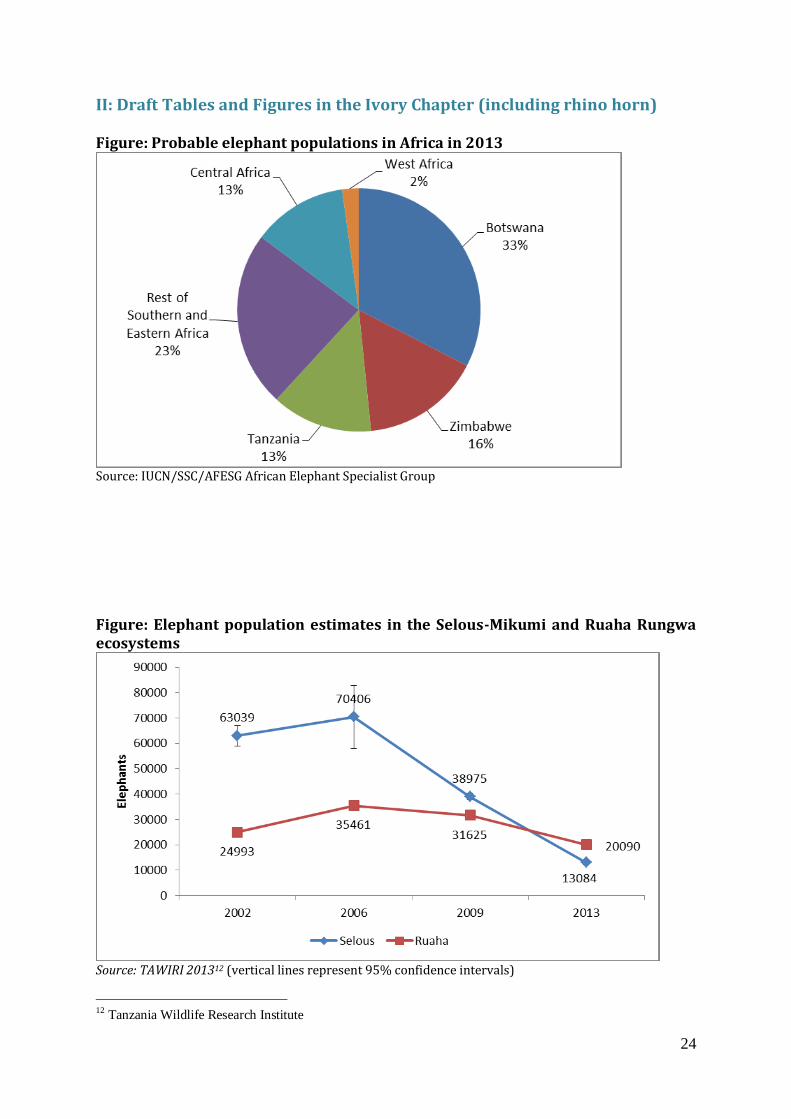
II: Draft Tables and Figures in the Ivory Chapter (including rhino horn) Figure: Probable elephant populations in Africa in 2013
Source: IUCN/SSC/AFESG African Elephant Specialist Group
Figure: Elephant population estimates in the Selous-Mikumi and Ruaha Rungwa ecosystems
Source: TAWIRI 201312 (vertical lines represent 95% confidence intervals)
12
Tanzania Wildlife Research Institute
25
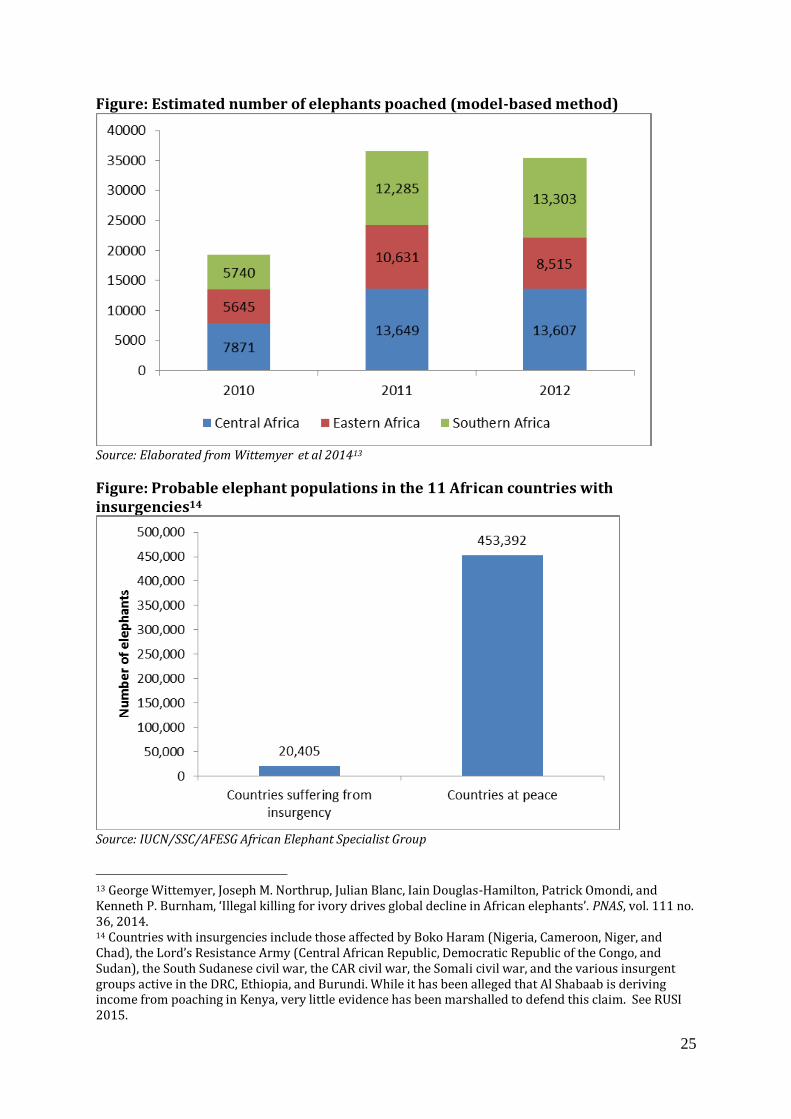
Figure: Estimated number of elephants poached (model-based method)
Source: Elaborated from Wittemyer et al 201413
Figure: Probable elephant populations in the 11 African countries with insurgencies14
Source: IUCN/SSC/AFESG African Elephant Specialist Group
13 George Wittemyer, Joseph M. Northrup, Julian Blanc, Iain Douglas-Hamilton, Patrick Omondi, and Kenneth P. Burnham, ‘Illegal killing for ivory drives global decline in African elephants’. PNAS, vol. 111 no. 36, 2014. 14 Countries with insurgencies include those affected by Boko Haram (Nigeria, Cameroon, Niger, and Chad), the Lord’s Resistance Army (Central African Republic, Democratic Republic of the Congo, and Sudan), the South Sudanese civil war, the CAR civil war, the Somali civil war, and the various insurgent groups active in the DRC, Ethiopia, and Burundi. While it has been alleged that Al Shabaab is deriving income from poaching in Kenya, very little evidence has been marshalled to defend this claim. See RUSI 2015.
26
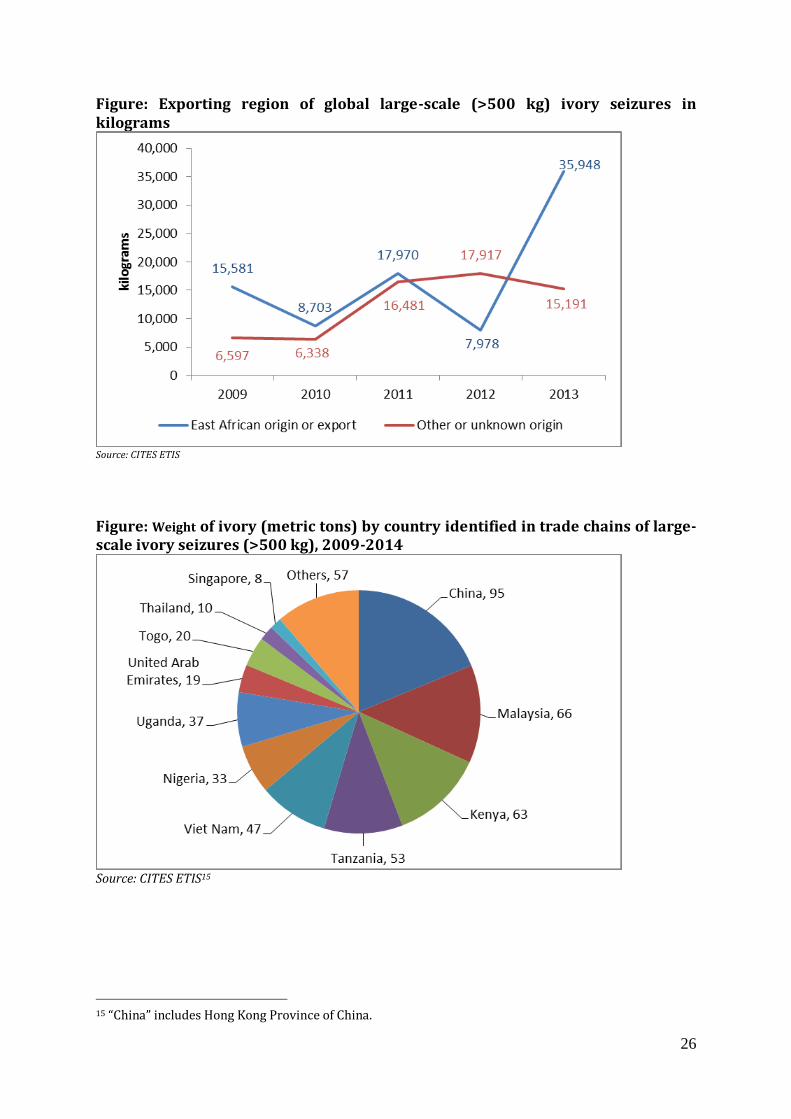
Figure: Exporting region of global large-scale (>500 kg) ivory seizures in kilograms
Source: CITES ETIS
Figure: Weight of ivory (metric tons) by country identified in trade chains of large-scale ivory seizures (>500 kg), 2009-2014
Source: CITES ETIS15
15 “China” includes Hong Kong Province of China.
27
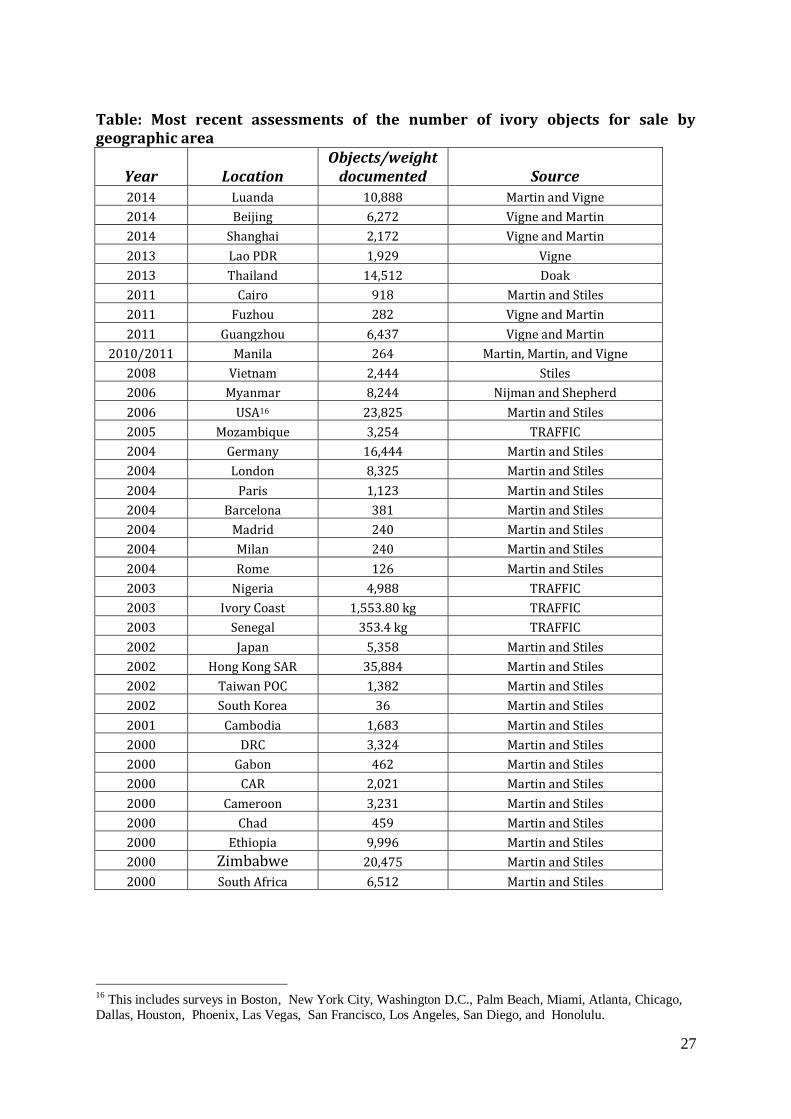
Table: Most recent assessments of the number of ivory objects for sale by geographic area
Year Location Objects/weight
documented Source
2014 Luanda 10,888 Martin and Vigne
2014 Beijing 6,272 Vigne and Martin
2014 Shanghai 2,172 Vigne and Martin
2013 Lao PDR 1,929 Vigne
2013 Thailand 14,512 Doak
2011 Cairo 918 Martin and Stiles
2011 Fuzhou 282 Vigne and Martin
2011 Guangzhou 6,437 Vigne and Martin
2010/2011 Manila 264 Martin, Martin, and Vigne
2008 Vietnam 2,444 Stiles
2006 Myanmar 8,244 Nijman and Shepherd
2006 USA16 23,825 Martin and Stiles
2005 Mozambique 3,254 TRAFFIC
2004 Germany 16,444 Martin and Stiles
2004 London 8,325 Martin and Stiles
2004 Paris 1,123 Martin and Stiles
2004 Barcelona 381 Martin and Stiles
2004 Madrid 240 Martin and Stiles
2004 Milan 240 Martin and Stiles
2004 Rome 126 Martin and Stiles
2003 Nigeria 4,988 TRAFFIC
2003 Ivory Coast 1,553.80 kg TRAFFIC
2003 Senegal 353.4 kg TRAFFIC
2002 Japan 5,358 Martin and Stiles
2002 Hong Kong SAR 35,884 Martin and Stiles
2002 Taiwan POC 1,382 Martin and Stiles
2002 South Korea 36 Martin and Stiles
2001 Cambodia 1,683 Martin and Stiles
2000 DRC 3,324 Martin and Stiles
2000 Gabon 462 Martin and Stiles
2000 CAR 2,021 Martin and Stiles
2000 Cameroon 3,231 Martin and Stiles
2000 Chad 459 Martin and Stiles
2000 Ethiopia 9,996 Martin and Stiles
2000 Zimbabwe 20,475 Martin and Stiles
2000 South Africa 6,512 Martin and Stiles
16 This includes surveys in Boston, New York City, Washington D.C., Palm Beach, Miami, Atlanta, Chicago,
Dallas, Houston, Phoenix, Las Vegas, San Francisco, Los Angeles, San Diego, and Honolulu.
28
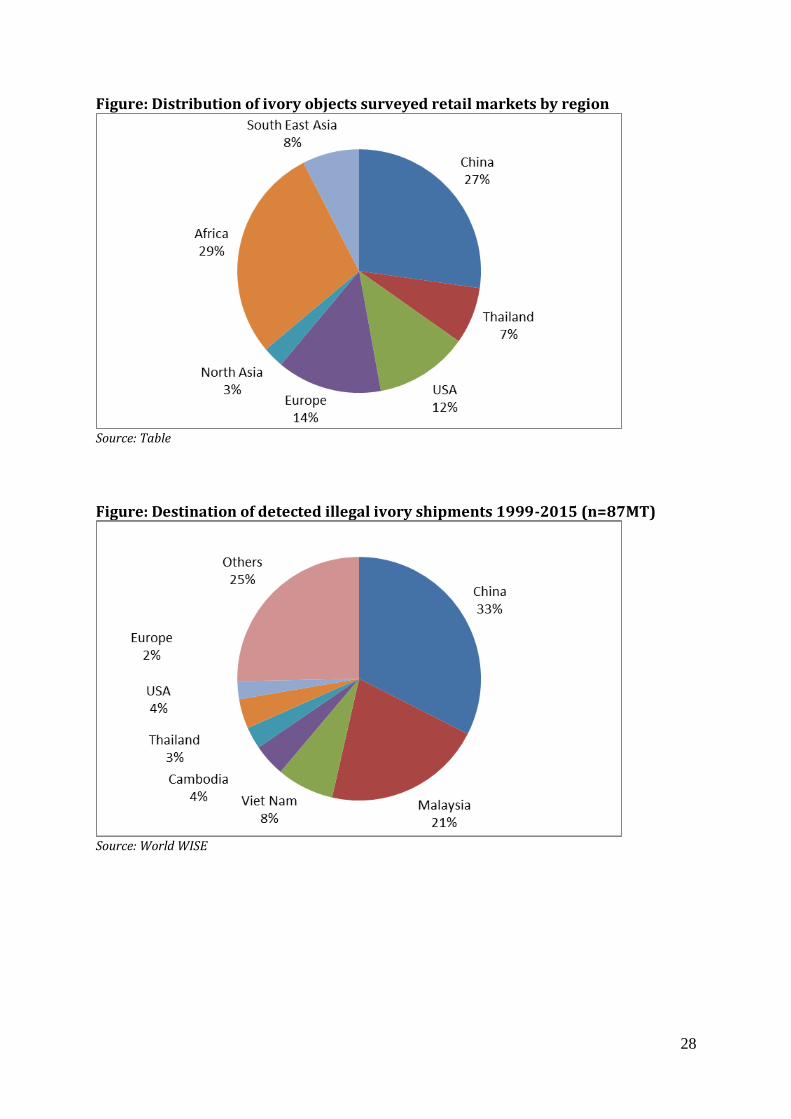
Figure: Distribution of ivory objects surveyed retail markets by region
Source: Table
Figure: Destination of detected illegal ivory shipments 1999-2015 (n=87MT)
Source: World WISE
29
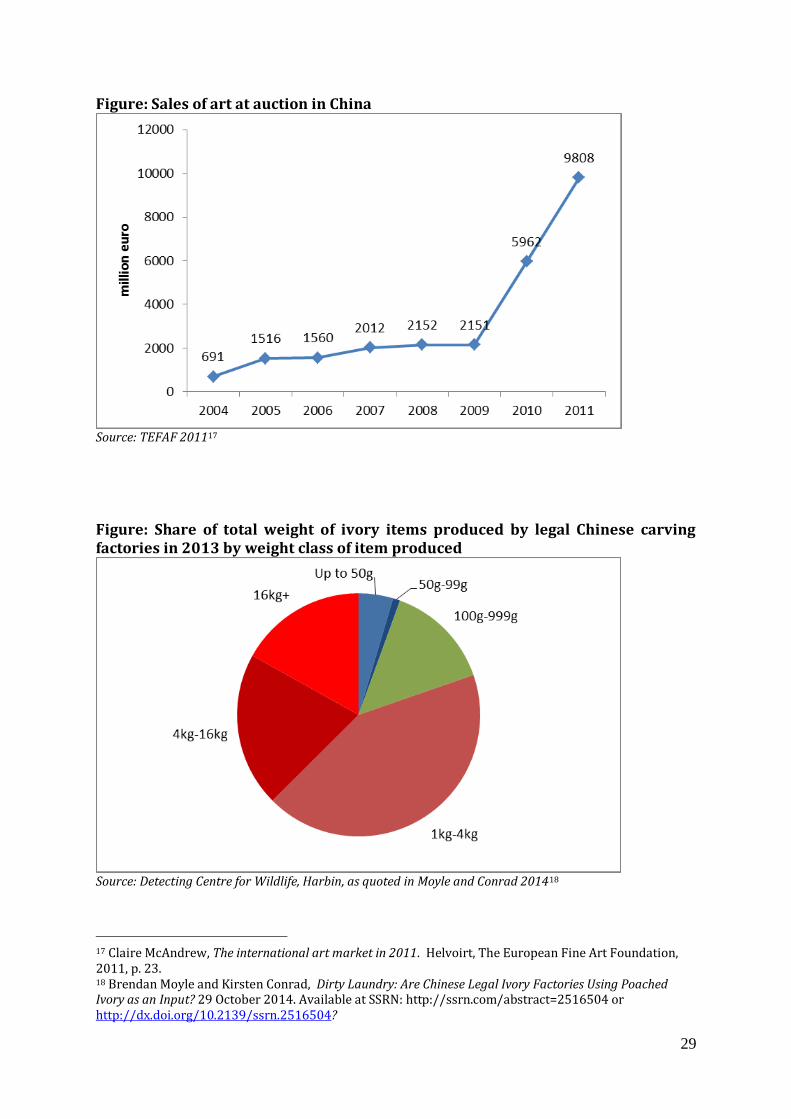
Figure: Sales of art at auction in China
Source: TEFAF 201117
Figure: Share of total weight of ivory items produced by legal Chinese carving factories in 2013 by weight class of item produced
Source: Detecting Centre for Wildlife, Harbin, as quoted in Moyle and Conrad 201418
17 Claire McAndrew, The international art market in 2011. Helvoirt, The European Fine Art Foundation, 2011, p. 23. 18 Brendan Moyle and Kirsten Conrad, Dirty Laundry: Are Chinese Legal Ivory Factories Using Poached Ivory as an Input? 29 October 2014. Available at SSRN: http://ssrn.com/abstract=2516504 or http://dx.doi.org/10.2139/ssrn.2516504?
30
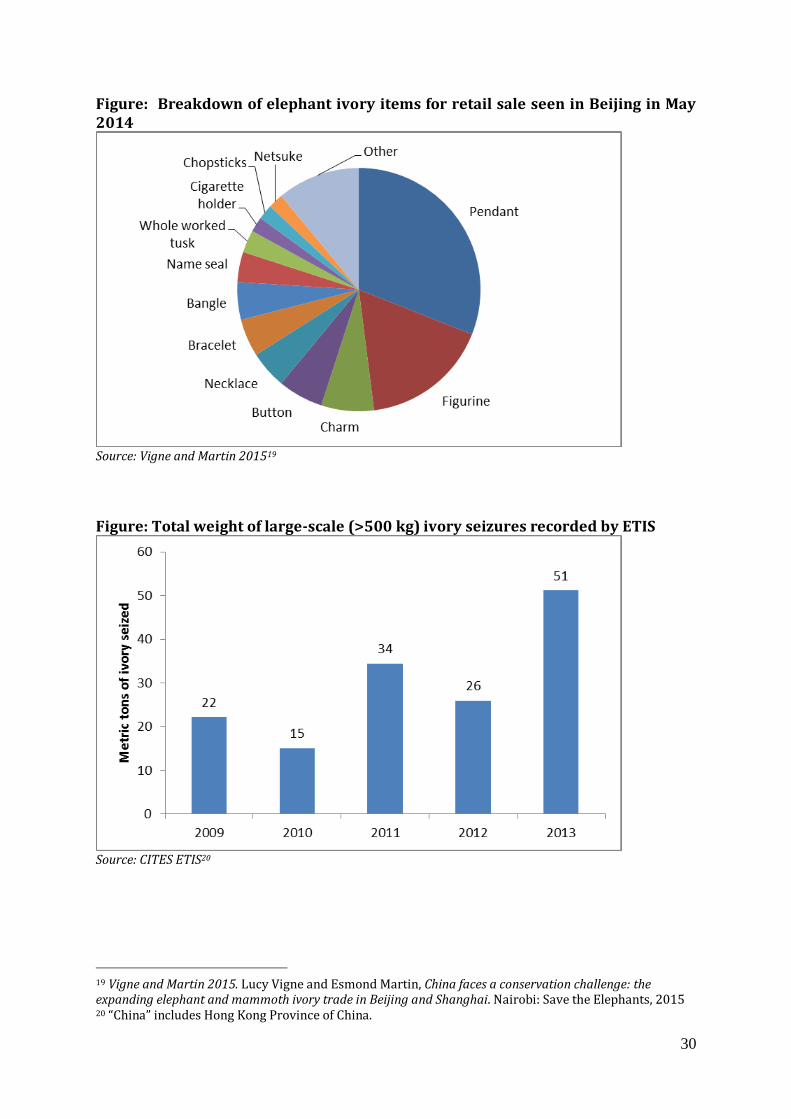
Figure: Breakdown of elephant ivory items for retail sale seen in Beijing in May 2014
Source: Vigne and Martin 201519
Figure: Total weight of large-scale (>500 kg) ivory seizures recorded by ETIS
Source: CITES ETIS20
19 Vigne and Martin 2015. Lucy Vigne and Esmond Martin, China faces a conservation challenge: the expanding elephant and mammoth ivory trade in Beijing and Shanghai. Nairobi: Save the Elephants, 2015 20 “China” includes Hong Kong Province of China.
31
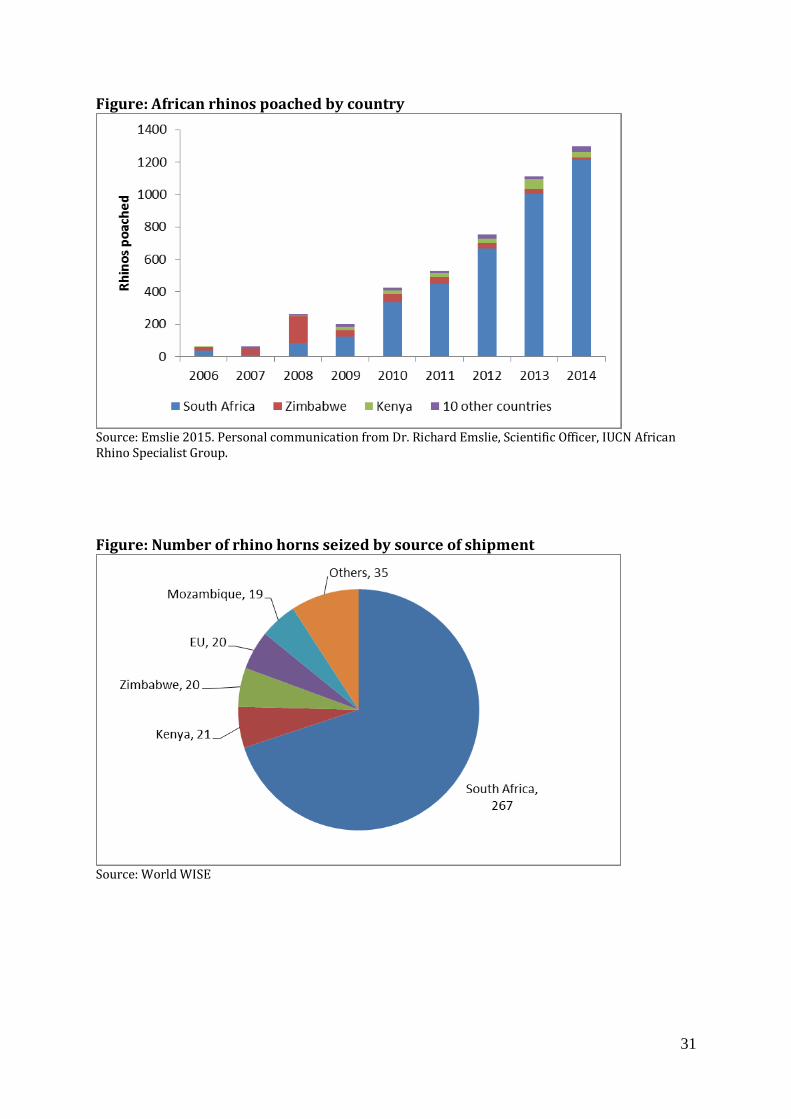
Figure: African rhinos poached by country
Source: Emslie 2015. Personal communication from Dr. Richard Emslie, Scientific Officer, IUCN African Rhino Specialist Group.
Figure: Number of rhino horns seized by source of shipment
Source: World WISE
32
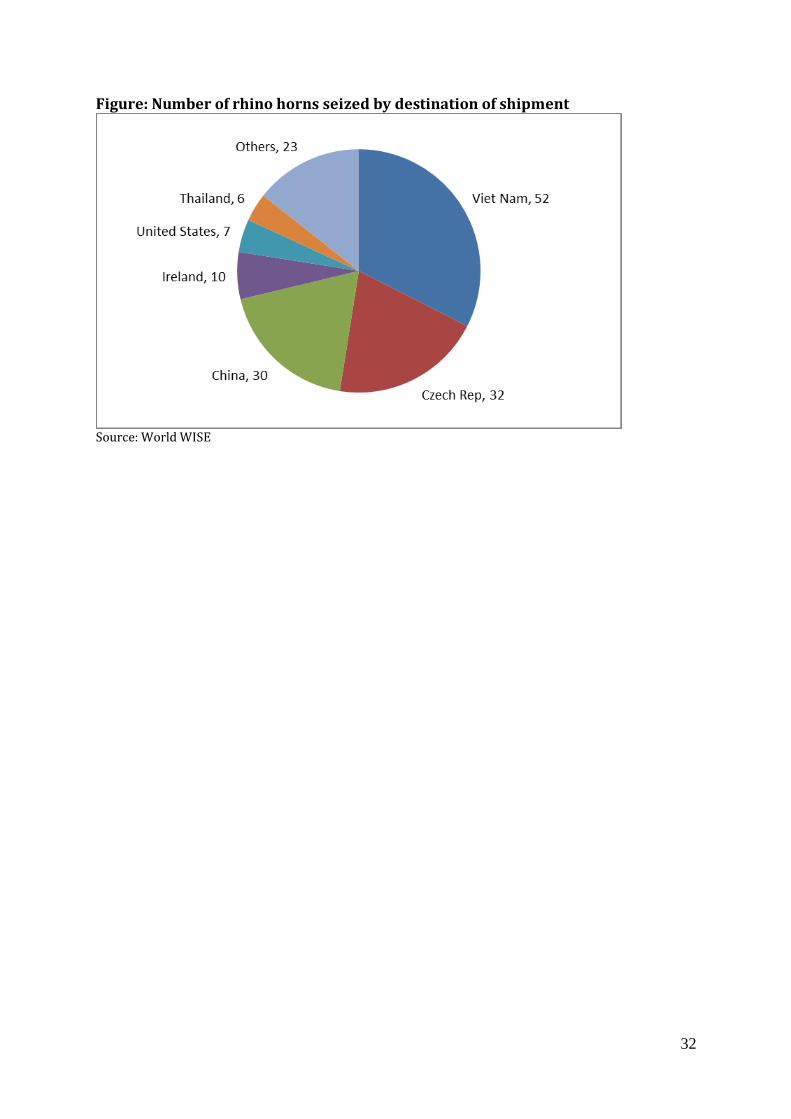
Figure: Number of rhino horns seized by destination of shipment
Source: World WISE