Embed Size (px)
Citation preview
Computers & Geosciences 28 (2002) 387–397
Java classes for nonprocedural variogram modeling$
Barton R. Faulkner
US EPA National Risk Management Laboratory, Subsurface Protection and Remediation Division, P.O. Box 1198,
Ada, OK 74820, USA
Received 9 August 2000; received in revised form 5 March 2001; accepted 10 March 2001
Abstract
A set of JavaTM classes was written for variogram modeling to support research for US EPA’s RegionalVulnerability Assessment Program (ReVA). The modeling objectives of this research program are to use
conceptual programming tools for numerical analysis for regional risk assessment. The classes presented use ofobject-oriented design elements, and their use is described for the benefit of programmers. To help facilitatetheir use, class diagrams and standard JavaDoc commenting were employed. Java’s support for polymorphism and
inheritance is used and these are described as ways to promote extension of these classes for other geostatisticalapplications. Among the advantages is the ease of programming, code reuse, and conceptual, rather than proceduralimplementation.
A graphical application for variogram modeling that uses the classes is also provided and described. It can also beused by non-programmers. This application uses a generalized least-squares fitting algorithm for robust parametricvariogram model fitting through the variogram cloud. This feature makes this program unique from other freelyavailable variogram modeling programs, though the classes are presented primarily so they may be extended for use in
other Java programs. More traditional variogram plotting and fitting utilities are also provided. This application isgraphical and platform-neutral. It uses classes of the recently proposed Java API for linear algebra, called the JAMApackage. Published by Elsevier Science Ltd.
Keywords: Object-oriented modeling; ReVA; Iteratively reweighted least squares; Multi-disciplinary modeling; JAMA; Variogram
cloud
1. Introduction
The US Environmental Protection Agency’s Office of
Research and Development has recently developed itsEcological Research Strategy which expresses theanticipated growth of the use of ecological modeling as
a risk management tool. In particular, it describesmodeling as a predictive tool that will be used to guideregulatory policies by integrating multiple environmen-
tal media, multiple stressors, and multiple scales. In
response to this, the Regional Vulnerability Assessment(ReVA) program has been started to develop prototypemulti-discipline modeling frameworks at the regional
scale. These efforts call for more efficient and conceptualcomputer modeling approaches analogous to the goalsof the object-oriented software development philosophy.
The ability to interface among multiple model compo-nents as objects will be essential to the success of thesemodeling goals since the effort will require multi-
disciplinary collaboration.Many of the ReVA modeling tools will be statistical
and GIS-based. They will require assimilation ofspatial data from various sources, and hence require a
framework for the behavior of variance at regional
$Code available from server at http.==www.iamg.org=CGEditor=index.htm.
E-mail addresses: [email protected] (B.R. Faulkner).
0098-3004/02/$ - see front matter Published by Elsevier Science Ltd.
PII: S 0 0 9 8 - 3 0 0 4 ( 0 1 ) 0 0 0 4 9 - 8
scale, even though data which will be used was oftencollected to characterize variance at smaller scales.
Bl .ooschl and Sivapalan (1995) have developed a mathe-matical framework to accommodate this scalingphenomenon and reduce errors. It is, not surprisingly,
based on the variogram. The Java classes presented inthis paper will be used to develop statistical models inthis framework for regional vulnerability assessment.They are designed to implement variogram modeling
elements in modeling applications without recoding, andto reduce the traditional reliance on modeling specia-lists.
The Java programming language, released in 1996,has received enormous attention from the generalsoftware development community, and it has been
called the most hyped programming language in history.It is well known as a language that was designed for, andis particularly well suited for World Wide Web
programming, since it offers classes and interfaces forseamlessly retrieving data across networks, is easilyembedded into HTML pages as applets, and providesflexible mechanisms for launching applets from the most
popular web browsers. Less well known, however, is thepower and flexibility of the Java application program-ming interface, and the power of the object-oriented
elements that the language itself supports. There isnothing to exclude the use of these features to broadenthe faculty for demanding numerical algorithms in the
geosciences. At present, the author knows of nopublished classes for doing variogram modeling withJava.Several features of these classes make them unique
from other variogram modeling tools:
1. They implement object-oriented design.2. They are platform-neutral.3. They illustrate the ease of Java programming for
numerical computation in a nonprocedural style,which may be unknown to many geoscientists.
4. Although they can implement traditional lag binning
(discussed below) the emphasis is on the variogramcloud.
5. They combine several variogram model fittingoptions, including a robust iteratively reweighted
least-squares algorithm, with immediate graphicaldisplay.
The purpose of this paper is to present the classes andan application for interactively building variogram
models. The classes also demonstrate the use of JAMA:[A Java matrix package], a freely-available Java packagefor matrix operations. The object-oriented framework of
the classes is described so that they can be easilyextended and improved upon.
2. Methods
2.1. Review of variogram parametric model fitting byleast squares
Although the concepts presented in this section aregenerally well known to geoscientists, a brief review ispresented to clarify the variogram fitting elements thatare handled with the Java classes. For more detailed
descriptions, readers are referred to the referencesprovided.Since the variogram of a random function Z, 2gðhÞ ¼
Var½ZðsÞ@Zðsþ hÞ� : 8s; sþ hADCRd , must be esti-mated from the available data, several variogram estima-tors have been proposed. The most popular is the averaged
or binned estimator (Cressie, 1985; M.uuller, 1999):
2#ggðhðl ÞÞ ¼1
Nðhðl ÞÞ
XNi¼1
½ZðsiÞ@Zðsi þ hÞ�2 : hATðhðl ÞÞ;
ð1Þ
where N is the number of data pairs that fall in the bin
region, T , in the neighborhood of hðl Þ; l ¼ 1;y; k. Tand l are usually defined somewhat arbitrarily by thevariogram modeler. If l is defined to enumerate all
possible pairs of data for which N ¼ 1, Eq. (1) is calledthe variogram cloud.If it can be assumed that the data are equally spaced,
the standard deviation of each binned average or
estimation value, in the case of the variogram cloud,
can be estimated as sCffiffiffiffiffiffiffiffiffiffiffiffiffiffiffiffiffiffiffiffiffiffiffiffiffiffiffiffiffiffiffiffiffiffiffiffiffiffiffiffiffiffiffi½2#ggðjjhðl ÞjjÞ�2=Nðhðl ÞÞ
q(Cressie,
1985). In fitting a parametric empirical model to the
estimation values, one of the least-squares methods is
often used. According to Cressie (1985), ordinary
weighted least squares with weights 1=s2 is appropriatefor variogram estimation under many circumstances. In
general, however, it is not appropriate to use ordinary
weighted least squares when the fitting values are
correlated, as in the situation of variogram estimators.
In these situations generalized least squares, which
minimizes
½2#gg@2g�0S@1½2#gg@2g� ð2Þ
in which S is the variance–covariance matrix of the
estimation values, is appropriate. Cressie (1985) derived
an expression for the elements of S, and the (approx-imate) numerical minimization of Eq. (2) is computa-
tionally expensive, even with present-day microprocessors,
since it requires repeated inversion of a matrix sized
by the number of estimation values:
Sðl; kÞ ¼2½2gðhðl ÞÞ�½2gðhðkÞÞ�
Nhðl ÞNhðkÞ
XNhðl Þ
i¼1
XNhðkÞ
j¼1
G2; ð3Þ
B.R. Faulkner / Computers & Geosciences 28 (2002) 387–397388
where G is
Therefore, this method of generalized least squares canonly practically be used with a limited number ofestimation points.
By asymptotic theory, M .uuller (1999) has shown that
using iteratively reweighted least squares with theweights adjusted iteratively by Eq. (3) with the corre-sponding improving parametric fit of g yields statistically
gðsl@sk þ hðl ÞÞ þ gðsl@sk@hðkÞÞ@gðsl@skÞ@gðsl@sk þ hðl Þ@hðkÞÞ
½2gðhðl ÞÞ�0:5½2gðhðkÞÞ�0:5:
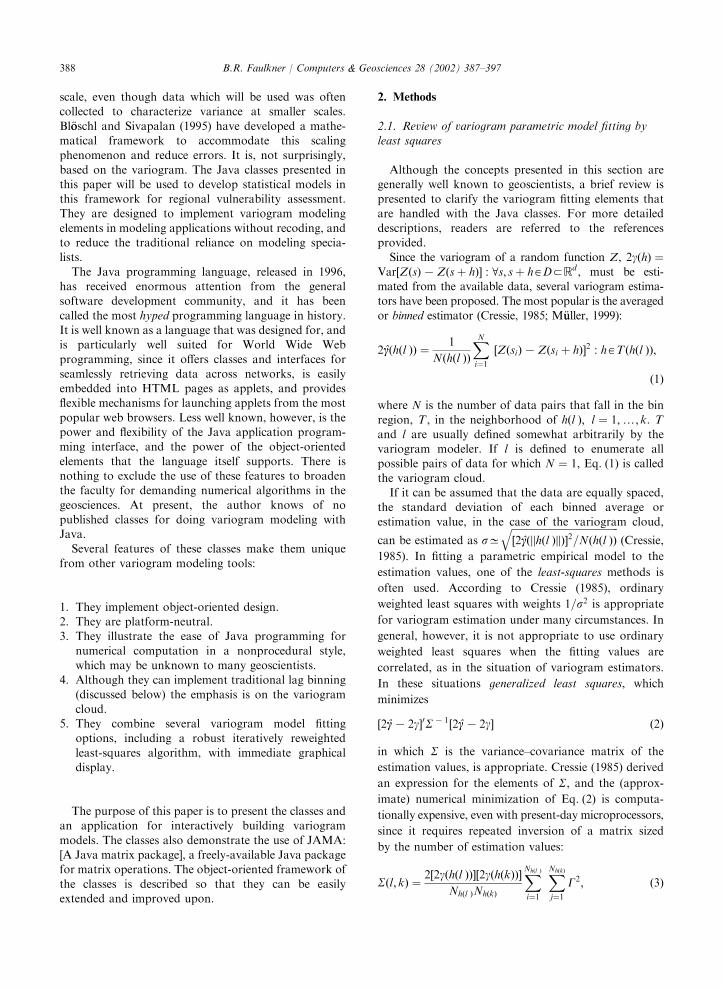
Fig. 1. Class diagram for Java classes for nonprocedural variogram modeling.
B.R. Faulkner / Computers & Geosciences 28 (2002) 387–397 389
consistent and efficient estimates of the model para-meters, even in the presence of severe heteroscedasticity,
which is likely in the case of the variogram cloud. Heargues that modern microprocessors can accommodatethis method, making binning obsolete in many situa-
tions. This provides a more robust way of fittingvariograms than ordinary weighted least squares.Having the ability to fit a parametric model from the
variogram cloud provides two major advantages:
1. It removes the subjective involvement of the modeler
from picking binning parameters, allowing expertiseto be focused on more defensible decisions, such asthe selection of the number of directions, the
bandwidth, and the tolerance, which are explicitlyrelated to the geological or geographical setting.
2. It provides a more robust and statistically defensible
model fit which can then be used in uncertaintyestimation.
Therefore, the classes presented here are designed tomodel the variogram cloud with iteratively reweightedleast-squares fitting. Working with the variogram cloud
does not make variogram modeling easier however, andusers may need to invest some effort in investigating theresults obtained by iteratively reweighted least squares
since they do not provide a ‘‘black box’’ solution tovariogram modeling. However, statistical modeling withregional data often requires using sparse data and istherefore often feasible with modern personal compu-
ters. Fitting through the variogram cloud may be anoptimal choice in many examples.
3. Description of the Java classes
The application consists of the 10 classes shown in the
class diagram in Fig. 1. This class diagram lists the nameof each class in bold in the upper box. If a class inherits astandard Java class, interface, or external class or
interface, the name of the parent class or interface isshown in the upper right-hand corner. Static methodsare underlined. Public method names are listed follow-
ing the plus signs, and their return types are shownfollowing the colon. Inner classes, if present, are shownin a separate box appended to the bottom of the class
box.Lines connecting the boxes illustrate the relationship
structure among the classes. Diamonds indicate the‘‘has’’ relationship, arrows (Fig. 2) indicate the inheri-
tance relationship, and the circle indicates the ‘‘using’’relationship. The ‘‘has’’ relationship indicates that oneclass creates an instance of another class. Class relation-
ships are described in detail by Booch (1994).Five of the classes were designed to be reusable as
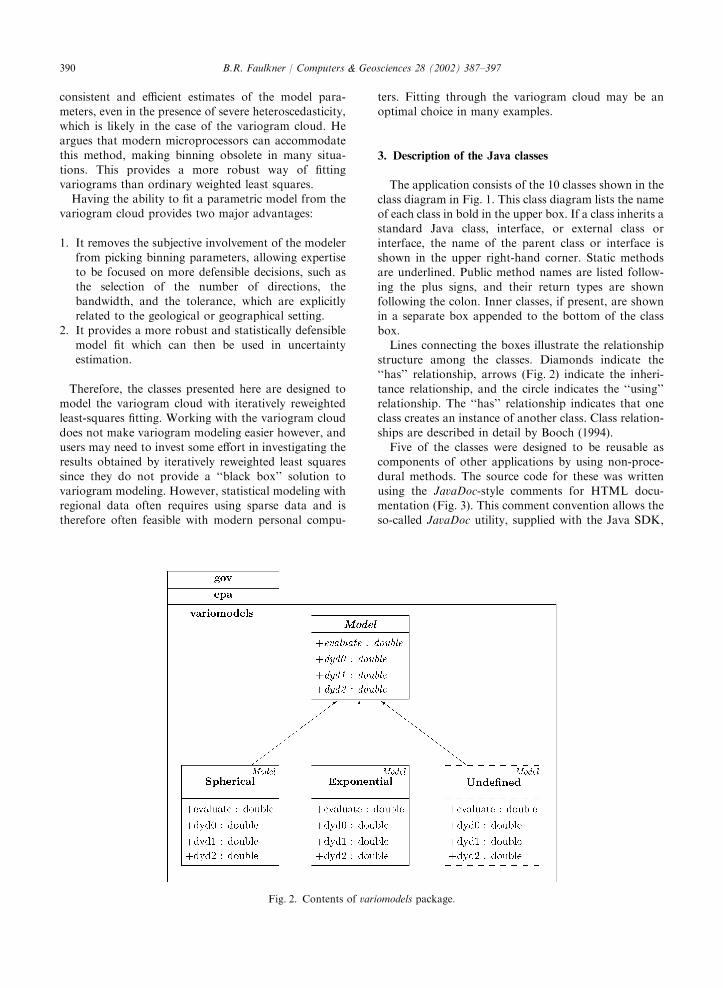
components of other applications by using non-proce-
dural methods. The source code for these was writtenusing the JavaDoc-style comments for HTML docu-mentation (Fig. 3). This comment convention allows theso-called JavaDoc utility, supplied with the Java SDK,
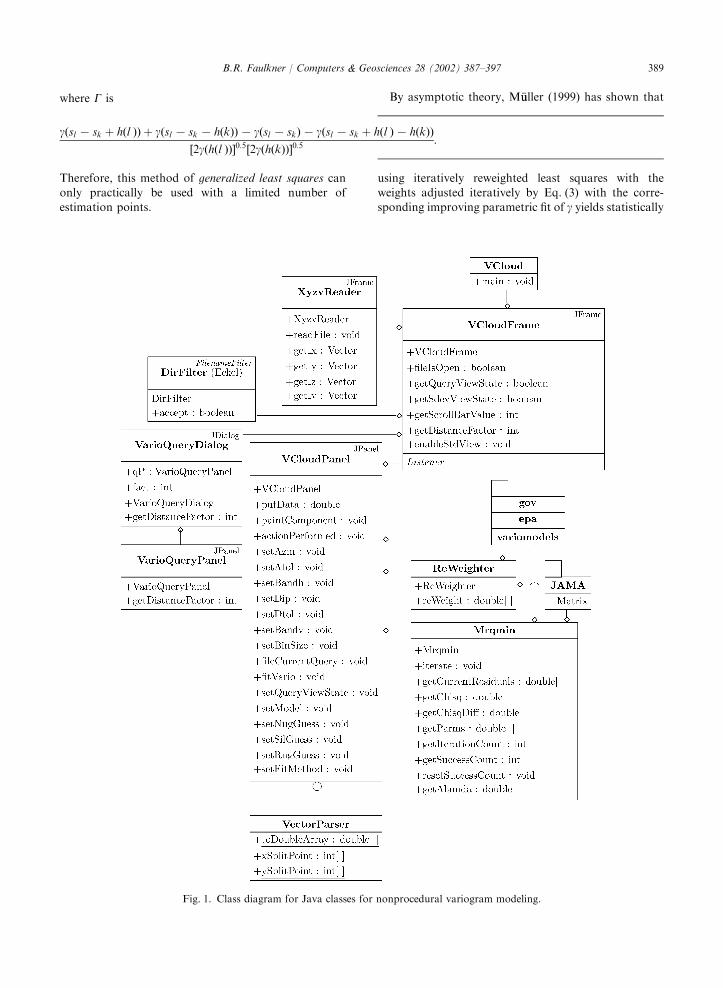
Fig. 2. Contents of variomodels package.
B.R. Faulkner / Computers & Geosciences 28 (2002) 387–397390
to automatically generate class documentation. What
follows in this section is a brief description of the fiveclasses and the VarioModels package that contains thevariogram model information. More detailed explana-
tions of the classes and their methods may be found inthe JavaDoc generated HTML pages.
XyzvReader extends javax.swing.JFrame. This classextends JFrame only to provide a lightweight frame for
an instance of the JTable class, which is part of the JavaSwing graphical extension to the Java language, usedhere to view the loaded data. Since the JTable class is
used, it may be easily modified to incorporate all themajor features of a spreadsheet by programmers ifdesired (e.g., see Geary, 1999). The XyzvReader reads a
file which can consist of up to 4 columns of data (for 3-Ddata), or 2 or 3 columns for 1- or 2-D data, the lastcolumn is always assigned as the measured value at thecorresponding locations. When its readFile method is
called, it parses the file and assigns these data to
instances of Java’s Vector class, created via the
XyzvReader constructor. The data can then be retrievedusing calls to the get x, get y, get z, and get v methods.Due to the multi-platform nature of this class, the
XyzvReader will stop reading a file when the number oftokens within a line is different from that of the previousline. One simple way to accomplish this is to place an
extra line below the last line of data with a single token,such as the string ‘‘end.’’ That is, for 2-D data the inputfile should look something like this:
Fig. 3. JavaDoc-generated HTML file from course code comments.
1030210.3 483199.0 0.053333
1030370.1 602797.4 0.002550
1035004.3 605509.2 0.002322
1035736.7 494176.4 0.910000
?1035736.7 494176.4 0.910000
end
B.R. Faulkner / Computers & Geosciences 28 (2002) 387–397 391
Data for 3-D might look like this:
VCloudPanel extends javax.swing.JPanel. This classconducts most of its operations through adjustmentsthat have been set up beforehand, and then are executed
when it receives messages from the Java Virtual machine(JVM) to repaint the panel. Therefore, its use is based onsupplying various pieces of information such as the
spatial query parameters, following the convention ofGSLIB (Deutsch and Journel, 1998). VCloudPanel alsohas a method that writes the current variogram
estimation points to a user-named text output file.VCloudPanel is the most complex class of this package.Mrqmin. This is essentially just a Java version of the
well-known C programs mrqmin.c and mrqcof.c (Press
et al., 1992). As Fig. 1 shows, it is implemented byVCloudPanel in its fitVario method,ReWeighter. This is the (iterative) reweighter for
generalized least squares. It is a Java implementationof the derivation of Cressie (1985). It is used in theapplication by VCloudPanel’s fitVario method. The
proper way to use it is via the following algorithm(Cressie, 1985):
(i) obtain ½#gg@gð#yypÞ�, the vector of residuals from the
current estimate, #yyp, of the parameters, y, by
ordinary weighted least squares. This is done viaMrqmin’s getCurrentResiduals method;
(ii) obtain #SSpwith g ¼ gð#yy
pÞ from Eq. (3). This can be
done with ReWeighter’s reWeight method;(iii) minimize Eq. (2) with S ¼ #SS
pand g ¼ gð#yy
pÞ to
obtain #yypþ1. That is, use Mrqmin’s iterate method;
(iv) obtain #SSpþ1
with g ¼ gð#yypþ1
Þ from Eq. (3). That is,use ReWeighter’s reWeight method again;
(v) assign #yypþ1
’#yyp, go to (ii), and repeat until #yy does
not change significantly. The getParms method of
Mrqmin returns #yy.
VectorParser This is a utility provided to convert theslower, but easier to program Java vectors into Javanative arrays for improved computational speed, and to
split instances of Java’s Point class into its componentnative integer arrays.
In addition the variogram models were placed in aJava package, variomodels (Fig. 2). This was doneprimarily so that programmers or users can add
additional classes representing any number of valid
variogram models. This object-oriented technique is partof a general idea called polymorphism. This version
contains only two prebuilt classes, Spherical andExponential. Any other valid variogram models can bewritten as Java classes, which can then be plugged in to
the application by adding their source files to thevariomodels package.In order to guarantee the new variogram models will
be compatible with the application, an interface used.
An interface cannot be implemented by itself. In fact,writing any operations as body for a method in aninterface will result in a compile-time error. Instead, the
interface is implemented with the implements keyword,and programmers building other variogram modelsshould override the methods of the Model interface for
the evaluation of the particular model and its derivativeswith respect to the parameters. Fig. 2 represents thisdiagrammatically. Methods of the Model interface are
shown in italics to indicate they are abstract, bydefinition. The Spherical and Exponential classes areconcrete, i.e., they can be constructed directly. In thisversion, all models have three parameters; however, it
would be a relatively simple matter to modify theseclasses to implement nested variograms or to incorpo-rate an arbitrary number of parameters. These ap-
proaches have been taken in other published computerprograms (e.g., Jian et al., 1996; Pardo-Ig !uuzquiza, 1999).For a Java programmer, the classes may be used to
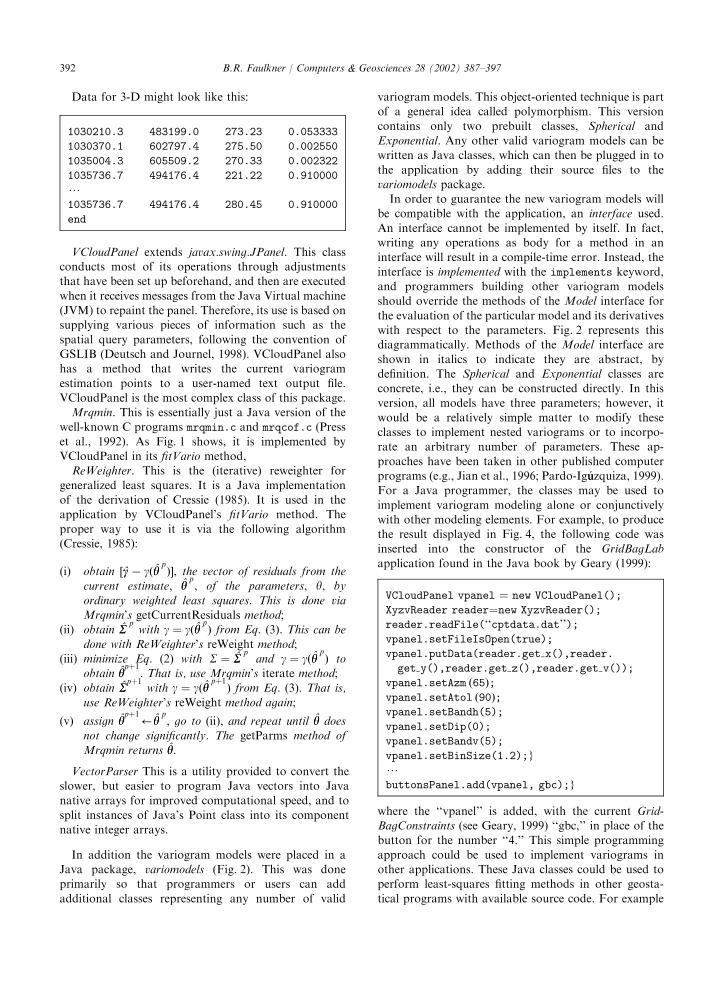
implement variogram modeling alone or conjunctivelywith other modeling elements. For example, to producethe result displayed in Fig. 4, the following code wasinserted into the constructor of the GridBagLab
application found in the Java book by Geary (1999):
where the ‘‘vpanel’’ is added, with the current Grid-BagConstraints (see Geary, 1999) ‘‘gbc,’’ in place of thebutton for the number ‘‘4.’’ This simple programming
approach could be used to implement variograms inother applications. These Java classes could be used toperform least-squares fitting methods in other geosta-
tical programs with available source code. For example
1030210.3 483199.0 273.23 0.053333
1030370.1 602797.4 275.50 0.002550
1035004.3 605509.2 270.33 0.002322
1035736.7 494176.4 221.22 0.910000
?1035736.7 494176.4 280.45 0.910000
end
VCloudPanel vpanel ¼ new VCloudPanel();
XyzvReader reader¼new XyzvReader();
reader.readFile(‘‘cptdata.dat’’);
vpanel.setFileIsOpen(true);
vpanel.putData(reader.get x(),reader.
get y(),reader.get z(),reader.get v());
vpanel.setAzm ð65Þ;vpanel.setAtol ð90Þ;vpanel.setBandh(5);
vpanel.setDip(0);
vpanel.setBandv(5);
vpanel.setBinSize(1.2);g?buttonsPanel.add(vpanel, gbc);g
B.R. Faulkner / Computers & Geosciences 28 (2002) 387–397392
Carr and Mela (1998) have published such a
geostatistical package in Visual Basic. Java also providessupport for native methods to increase this flexibility.
4. Description of the application
The application is an implementation of the above
classes made by adding the five application-specificclasses,
VCloud: The base class to execute the ‘‘main’’ method,the entry point for a Java application.VCloudFrame: The window frame of the main
application with the user menus.
DirFilter: This is a portion of a class that appears inThinking in Java by Eckel (1998). When a user addsextra concrete subclasses of Model in the variomodels
package these are automatically read, loaded, and listedin VCloudFrame’s menu. Therefore, it is not necessaryto modify any existing classes when extra variogram
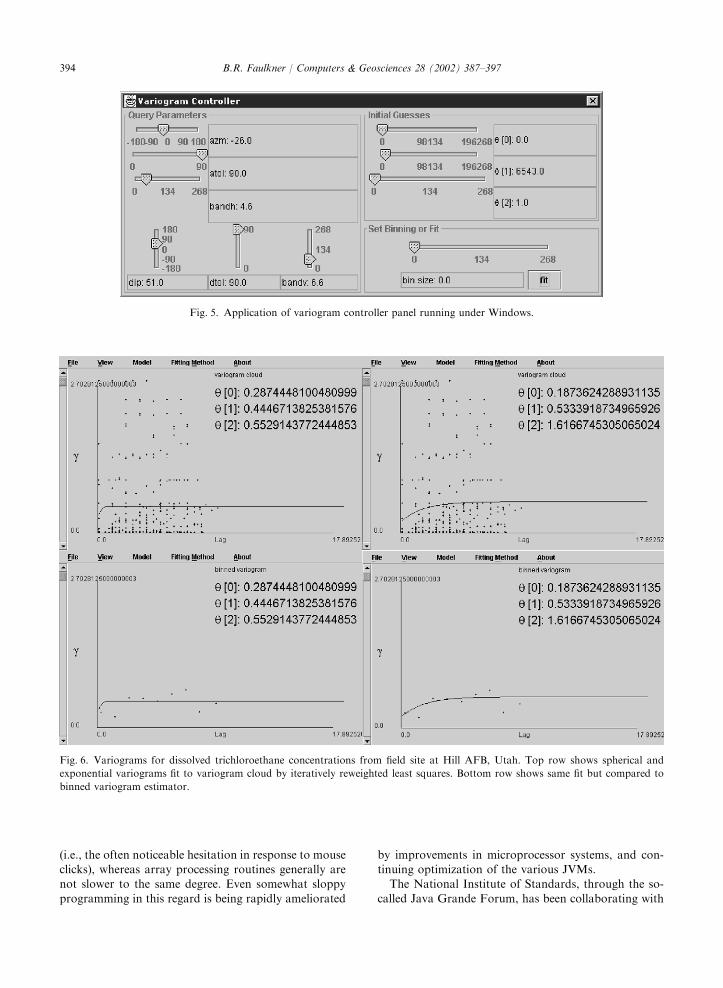
model classes are added to the package. Added classesmust, however, be placed in the .=gov=epa=variomodels= subdirectory.VarioQueryDialog: The variogram ‘‘controller’’ dialog
frame.VarioQueryPanel: The panel that listens to user adjust-
ments to the parameters. In this application, this is the way
the various parameters are fed to VCloudPanel (Fig. 5).
The spatial query parameters that can be adjusted in the
query panel are described by Deutsch and Journel(1998). A rough, graphical schematic rendering of thespatial query geometry is displayed in red on theVCloudPanel to help the user visualize them during
adjustment. This feature can be turned off by deselectingthe check box in the VCloudFrame menu. If the user fitsa variogram and the computations are successful, a
representation of the fitted variogram will appear, alongwith the fit values of the parameters. This representationwill persist until the fit button is pressed again. This is
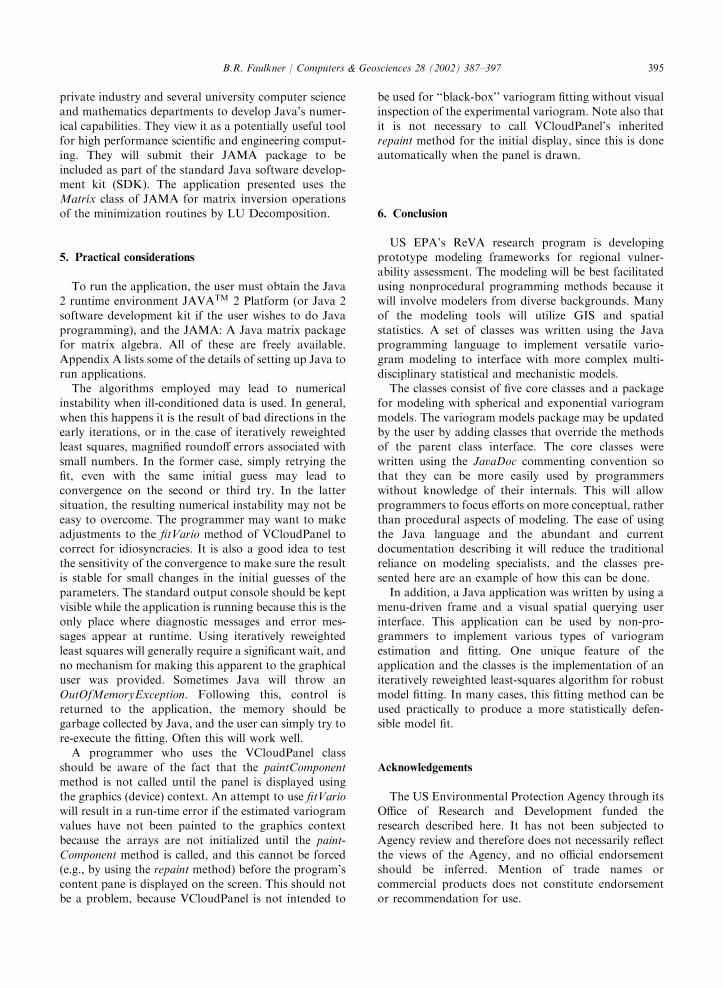
useful to check the result of changing the bin size afterthe fit. This is most helpful when using generalized leastsquares with the variogram cloud (Fig. 6).
4.1. Java’s performance for numerical computing
The price paid for the conveniences that come fromusing Java and object-orientation is loss of speed. In theobject-orientation jargon this is called the abstractionpenalty (Cary et al., 1997), i.e., the loss of performance
incurred by generalizing algorithm implementation.However, in the author’s experience, this supposeddownfall has been greatly exaggerated. In general, Java
can be used in ways that minimize slowness to make itperform nearly as fast as C or Fortran, withoutforegoing object orientation. Most complaints seem to
be related primarily to the performance of the graphicaluser interface, compared to native windowing systems
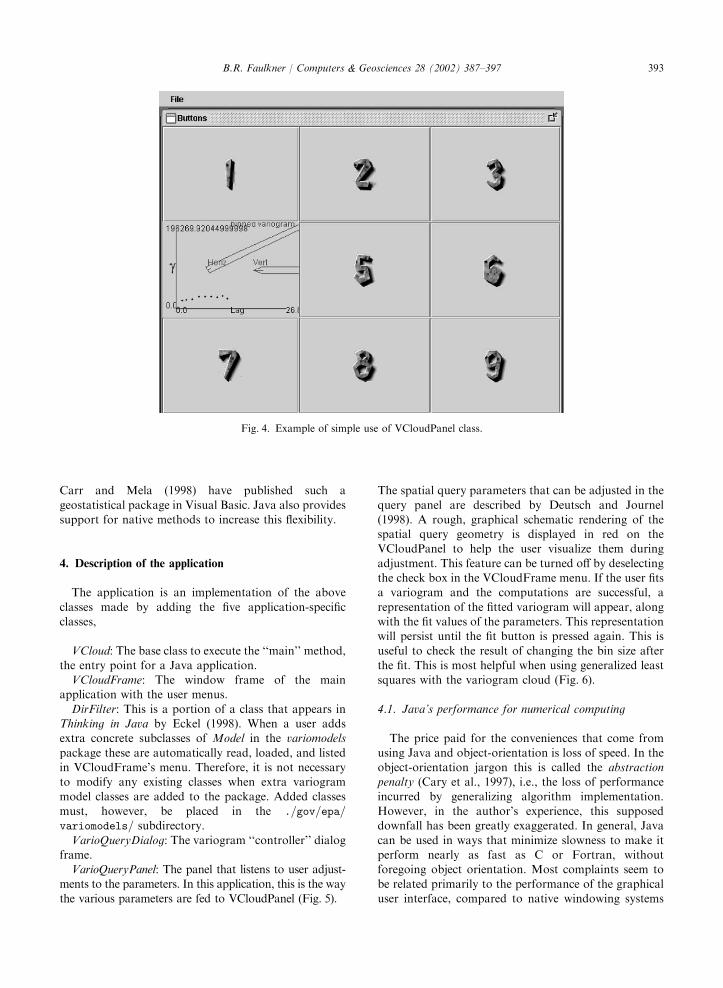
Fig. 4. Example of simple use of VCloudPanel class.
B.R. Faulkner / Computers & Geosciences 28 (2002) 387–397 393
(i.e., the often noticeable hesitation in response to mouseclicks), whereas array processing routines generally arenot slower to the same degree. Even somewhat sloppy
programming in this regard is being rapidly ameliorated
by improvements in microprocessor systems, and con-tinuing optimization of the various JVMs.The National Institute of Standards, through the so-
called Java Grande Forum, has been collaborating with
Fig. 5. Application of variogram controller panel running under Windows.
Fig. 6. Variograms for dissolved trichloroethane concentrations from field site at Hill AFB, Utah. Top row shows spherical and
exponential variograms fit to variogram cloud by iteratively reweighted least squares. Bottom row shows same fit but compared to
binned variogram estimator.
B.R. Faulkner / Computers & Geosciences 28 (2002) 387–397394
private industry and several university computer scienceand mathematics departments to develop Java’s numer-
ical capabilities. They view it as a potentially useful toolfor high performance scientific and engineering comput-ing. They will submit their JAMA package to be
included as part of the standard Java software develop-ment kit (SDK). The application presented uses theMatrix class of JAMA for matrix inversion operationsof the minimization routines by LU Decomposition.
5. Practical considerations
To run the application, the user must obtain the Java2 runtime environment JAVATM 2 Platform (or Java 2
software development kit if the user wishes to do Javaprogramming), and the JAMA: A Java matrix packagefor matrix algebra. All of these are freely available.
Appendix A lists some of the details of setting up Java torun applications.The algorithms employed may lead to numerical
instability when ill-conditioned data is used. In general,when this happens it is the result of bad directions in theearly iterations, or in the case of iteratively reweightedleast squares, magnified roundoff errors associated with
small numbers. In the former case, simply retrying thefit, even with the same initial guess may lead toconvergence on the second or third try. In the latter
situation, the resulting numerical instability may not beeasy to overcome. The programmer may want to makeadjustments to the fitVario method of VCloudPanel to
correct for idiosyncracies. It is also a good idea to testthe sensitivity of the convergence to make sure the resultis stable for small changes in the initial guesses of theparameters. The standard output console should be kept
visible while the application is running because this is theonly place where diagnostic messages and error mes-sages appear at runtime. Using iteratively reweighted
least squares will generally require a significant wait, andno mechanism for making this apparent to the graphicaluser was provided. Sometimes Java will throw an
OutOfMemoryException. Following this, control isreturned to the application, the memory should begarbage collected by Java, and the user can simply try to
re-execute the fitting. Often this will work well.A programmer who uses the VCloudPanel class
should be aware of the fact that the paintComponentmethod is not called until the panel is displayed using
the graphics (device) context. An attempt to use fitVariowill result in a run-time error if the estimated variogramvalues have not been painted to the graphics context
because the arrays are not initialized until the paint-Component method is called, and this cannot be forced(e.g., by using the repaint method) before the program’s
content pane is displayed on the screen. This should notbe a problem, because VCloudPanel is not intended to
be used for ‘‘black-box’’ variogram fitting without visualinspection of the experimental variogram. Note also that
it is not necessary to call VCloudPanel’s inheritedrepaint method for the initial display, since this is doneautomatically when the panel is drawn.
6. Conclusion
US EPA’s ReVA research program is developingprototype modeling frameworks for regional vulner-
ability assessment. The modeling will be best facilitatedusing nonprocedural programming methods because itwill involve modelers from diverse backgrounds. Many
of the modeling tools will utilize GIS and spatialstatistics. A set of classes was written using the Javaprogramming language to implement versatile vario-
gram modeling to interface with more complex multi-disciplinary statistical and mechanistic models.The classes consist of five core classes and a package
for modeling with spherical and exponential variogrammodels. The variogram models package may be updatedby the user by adding classes that override the methodsof the parent class interface. The core classes were
written using the JavaDoc commenting convention sothat they can be more easily used by programmerswithout knowledge of their internals. This will allow
programmers to focus efforts on more conceptual, ratherthan procedural aspects of modeling. The ease of usingthe Java language and the abundant and current
documentation describing it will reduce the traditionalreliance on modeling specialists, and the classes pre-sented here are an example of how this can be done.In addition, a Java application was written by using a
menu-driven frame and a visual spatial querying userinterface. This application can be used by non-pro-grammers to implement various types of variogram
estimation and fitting. One unique feature of theapplication and the classes is the implementation of aniteratively reweighted least-squares algorithm for robust
model fitting. In many cases, this fitting method can beused practically to produce a more statistically defen-sible model fit.
Acknowledgements
The US Environmental Protection Agency through itsOffice of Research and Development funded theresearch described here. It has not been subjected to
Agency review and therefore does not necessarily reflectthe views of the Agency, and no official endorsementshould be inferred. Mention of trade names or
commercial products does not constitute endorsementor recommendation for use.
B.R. Faulkner / Computers & Geosciences 28 (2002) 387–397 395
Appendix. Some notes on configuring Java to run the
application
The application uses features that are not found in theJava 1 API. It requires Java 2 (e.g., either Java 1.2 SDKor Java 1.3 SDK, or corresponding JVM). The JVM isalso called the Java Runtime Environment (JRE). The
current download version of the JRE contains about6 Mb. The current Windows download of the Java 1.3SDK contains about 31 Mb. The Blackdown project,
Sun Microsystems, and Borland now provide freelydownloadable Java 2 SDK’s for Linux. Currently,Macintosh provides its own Java machine. If your
computer is not listed in the usual documentationsources, you may need to search to find alternative Javamachines. This application has been tested on Red HatLinux 6.0, Digital DEC 3000 workstation (Tru64 Unix),
Sun Ultrasparc (Solaris 7) Windows NT 4.0, andWindows 95.At the time of writing this, support for full Java 2 on
the Macintosh is still pending; however, the most recentversion of the Mac ‘‘MRJ SDK’’ contains support forSwing. Currently, Mac users must download the entire
Java SDK and use a tool called ‘‘JBindery’’ in order tocreate a ‘‘bindlet’’ in order to run applications (notapplets) in Java. The ‘‘bindlet’’ is essentially a script that
contains the information on the classpath. This isnecessary because Mac does not have a command lineconsole. Using the JBindery is fairly simple. You mustsimply enter the various classpaths in a graphical user
interface.One way to use the package JAMA, is to place the
jama.jar file in a subdirectory of the one containing
variogram classes. Similarly, the gov.epa.variomodelspackage can be used by creating a subdirectory structuregov=epa=variomodels=. The package contents shouldbe placed there. It is the Java 2 convention to use thisdirectory structure to define packages and avoid namespace conflicts that could result from packages having
the same name. By convention, the domain nameprogrammer’s affiliation organization (in this caseepa.gov) as parent directories to the package directory,is in reverse order. This should prevent name space
conflicts.The most difficult part of using a Java application for
a Java novice will be properly setting the Java classpath
environment variable. One way to do this in Windows isto insert the following line in the autoexec.bat file
SET CLASSPATH¼.;$jdk1.*=lib;
where $ is the directory in which the Java SDK wasinstalled, and jdk1.* may be jdk1.2.2, jdk1.2.1,jdk1.3, or other name, depending on the SDK or JRE
that was installed. Setting the CLASSPATH¼.; is notnecessary with most installations, but it will not hurt, as
it tells the Java interpreter to look in the currentdirectory for the application class files as well as the lib
directory which contains the compressed classes of theJava API. Under Unix, the classpath is set usingsomething like
setenv CLASSPATH your java classes:
for the C shell, or
export CLASSPATH¼your java classes
for the Bourne Again shell.To use the variomodels package, you must copy the 3
class files Model.class, Spherical.class, and
Exponential.class to a local subdirectory called
=gov=epa=variomodels=.
To run the application use your computer’s shell orcommand line, go to the directory into which you have
placed the downloaded class files (vc.jar, compressedin jar format) and the packages and type:
java -classpath vc.jar VCloud.
Note that Java is case sensitive. For additional
information, consult the Sun Microsystems Java FAQpages which may contain other information useful tousing Java on your computer.
References
Bl .ooschl, G., Sivapalan, M., 1995. Scale issues in hydrological
modeling: a review. Hydrological Processes 9, 251–290.
Booch, G., 1994. Object-Oriented Analysis and Design with
Applications, 2nd Edn. Addison-Wesley, Reading, MA,
589pp.
Carr, J.R., Mela, K., 1998. Visual Basic programs for one, two,
or three-dimensional geostatistical analysis. Computers a
Geosciences 24 (6), 531–536.
Cary, J.R., Shasharina, S.G., Cummings, J.C., Reynders,
J.V.W., Hinker, P.J., 1997. Comparison of C++ and
Fortran 90 for object-oriented scientific programming.
Computer Physics Communications 105 (1), 20–36.
Cressie, N., 1985. Fitting variogram models by weighted least
squares. Mathematical Geology 17 (5), 563–586.
Deutsch, C.V., Journel, A.G., 1998. GSLIB Geostatistical
Software Library and User’s Guide, 2nd Edn. Oxford
University Press, New York, 369pp.
Eckel, B., 1998. Thinking in Java. Prentice-Hall, Upper Saddle
River, NJ, 1098pp.
Geary, D.M., 1999. Graphic Java 2, Vol. II: Swing, 3rd Edn.
Prentice-Hall, Upper Saddle River, NJ, 1622pp.
JAMA: A Java Matrix Package. http:==math.nist.gov=javanumerics= jama=.
Java Grande Forum. http:==www.javagrande.org=.
B.R. Faulkner / Computers & Geosciences 28 (2002) 387–397396
JAVATM 2 Platform Standard Edition. http:==java.sun.com=j2se=index.html.
Jian, X., Olea, R.A., Yu, Y., 1996. Semivariogram modelling by
weighted least squares. Computers a Geosciences 22 (3),
387–397.
M .uuller, W.G., 1999. Least-squares fitting from the variogram
cloud. Statistics a Probability Letters 43 (1), 93–98.
Pardo-Ig !uuzquiza, E., 1999. VARFIT: a Fortran-77 program for
fitting variogram models by weighted least squares.
Computers a Geosciences 25 (3), 251–261.
Press, W.H., Teukolsky, S.A., Vetterling, W.T., Flannery, B.P.,
1992. Numerical Recipes in C, 2nd Edn. Cambridge
University Press, Cambridge, UK, 994pp.
B.R. Faulkner / Computers & Geosciences 28 (2002) 387–397 397


![[DRAFT PARALLEL BASELINE RISK ASSESSMENT FOR THE … · 2018. 9. 8. · the variogram using curve fitting techniques. Using the variogram model, ... simulation and geostatistics [kriging])](https://img.pdfslide.net/doc/110x75/5fc60f92e935cb467b6d8a3d/draft-parallel-baseline-risk-assessment-for-the-2018-9-8-the-variogram-using.jpg)