Embed Size (px)
Citation preview
JBOSS Profiler
Performance Profiling
Contents
● Motivation – The problem● Profiling● Profiling Tools● Java and Profiling● JBoss Profiler● Example
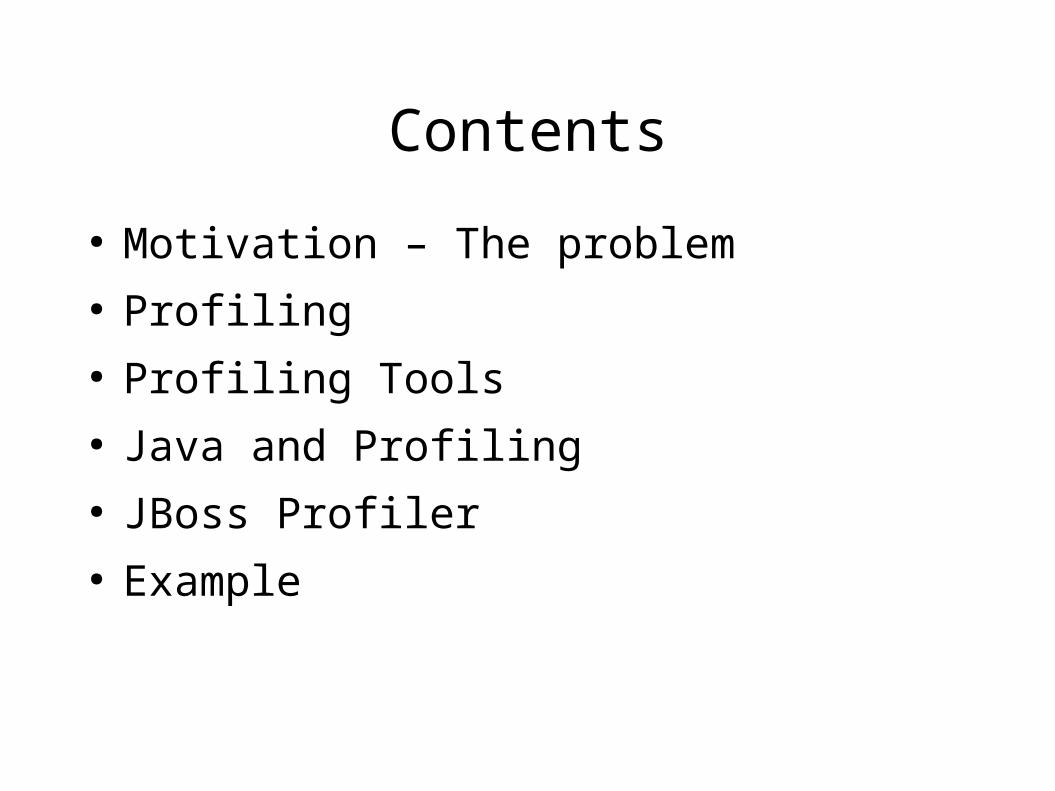
Motivation
● More computing sins are committed in the name of efficiency (without necessarily achieving it) than for any other single reason - including blind stupidity. -- Prof. William A. Wulf
● We should forget about small efficiencies, say about 97% of the time: premature optimization is the root of all evil. -- Prof. Donald E. Knuth
What is a profiler
● A program that helps you figure out where a program is – spending most of its time. – discover how it is using memory.– how many of what sorts of object.
What is a profiler tool
● Tool used for program analysis● program analysis is the use of specialized
software, called a profiler, to gather data about a program's execution.
● The profiler is used to determine – how long certain parts of the program take to execute– how often they are executed– to generate the call graph (the mathematical graph of
which functions call which other functions)
Influental Profiler
● 1982 Gprof: a Call Graph Execution Profiler– adding a stopwatch to each function (compile with –pg flag with gcc,
run program -> gmon.out run gprof program analyses gmon.out)
● JProbe● OptimizeIT● 2004 gprof and appeared on the list of the 20
most influental PLDI (programming language design and implementation) of all time

Methods of data gathering
● Statistical profilers– Sampling
● a timer thread suspends all threads periodically (10ms)● looks up the call stack of each thread
– Proc: fast– Const: how many times was the method called – cant deduce.
– Instrumenting● Proc:
– can potentially be very specific● Cons:
– can cause bugs– slows down the target program
How can I performance profile my Java code?
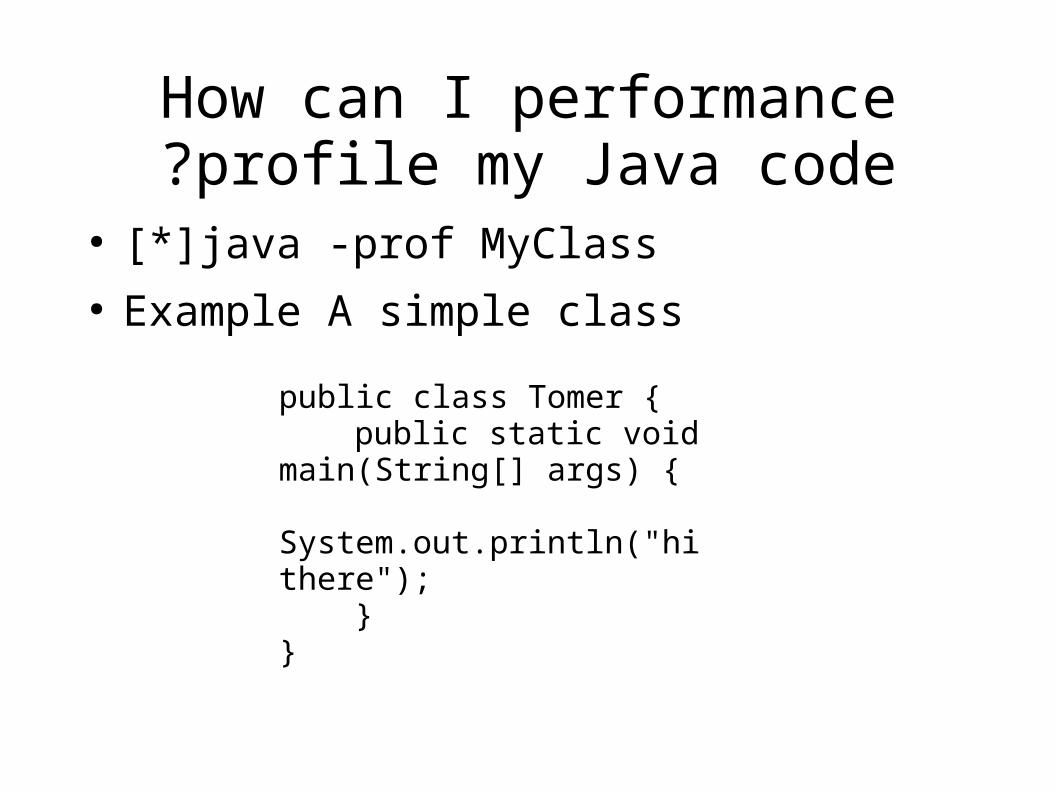
● [*]java -prof MyClass● Example A simple class
public class Tomer {public static void
main(String[] args) {
System.out.println("hi there");}
}
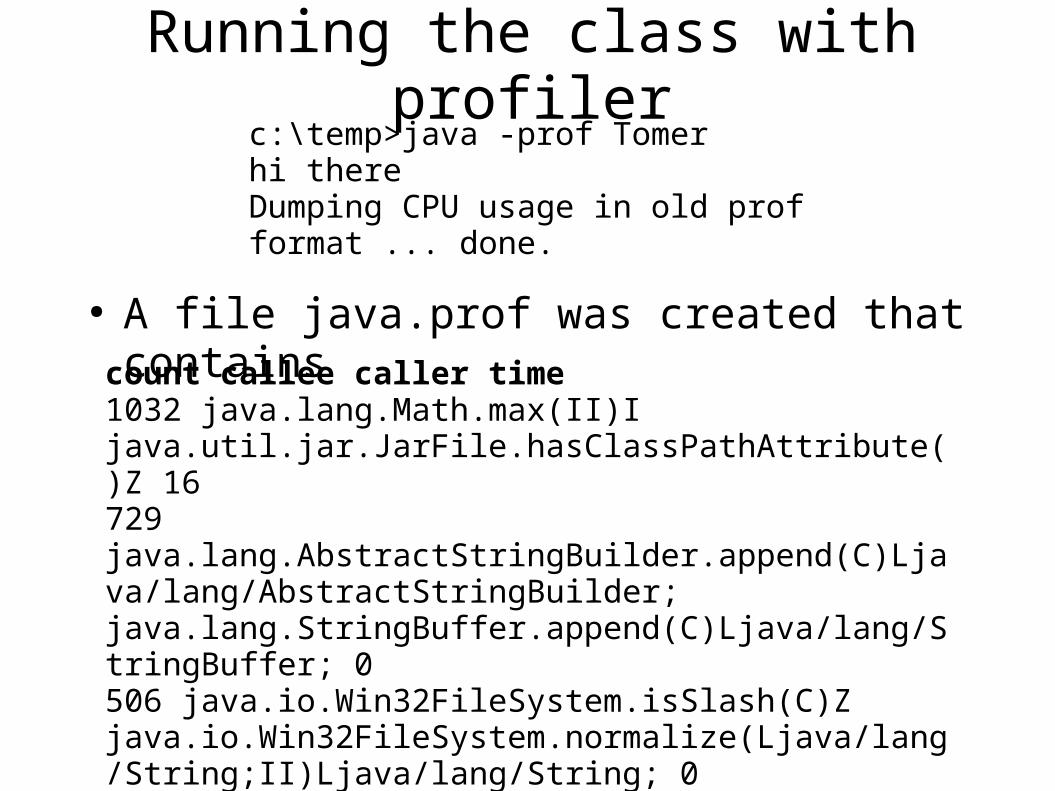
Running the class with profiler
● A file java.prof was created that contains
c:\temp>java -prof Tomerhi thereDumping CPU usage in old prof format ... done.
count callee caller time1032 java.lang.Math.max(II)I java.util.jar.JarFile.hasClassPathAttribute()Z 16729 java.lang.AbstractStringBuilder.append(C)Ljava/lang/AbstractStringBuilder; java.lang.StringBuffer.append(C)Ljava/lang/StringBuffer; 0506 java.io.Win32FileSystem.isSlash(C)Z java.io.Win32FileSystem.normalize(Ljava/lang/String;II)Ljava/lang/String; 0506 java.lang.String.charAt(I)C
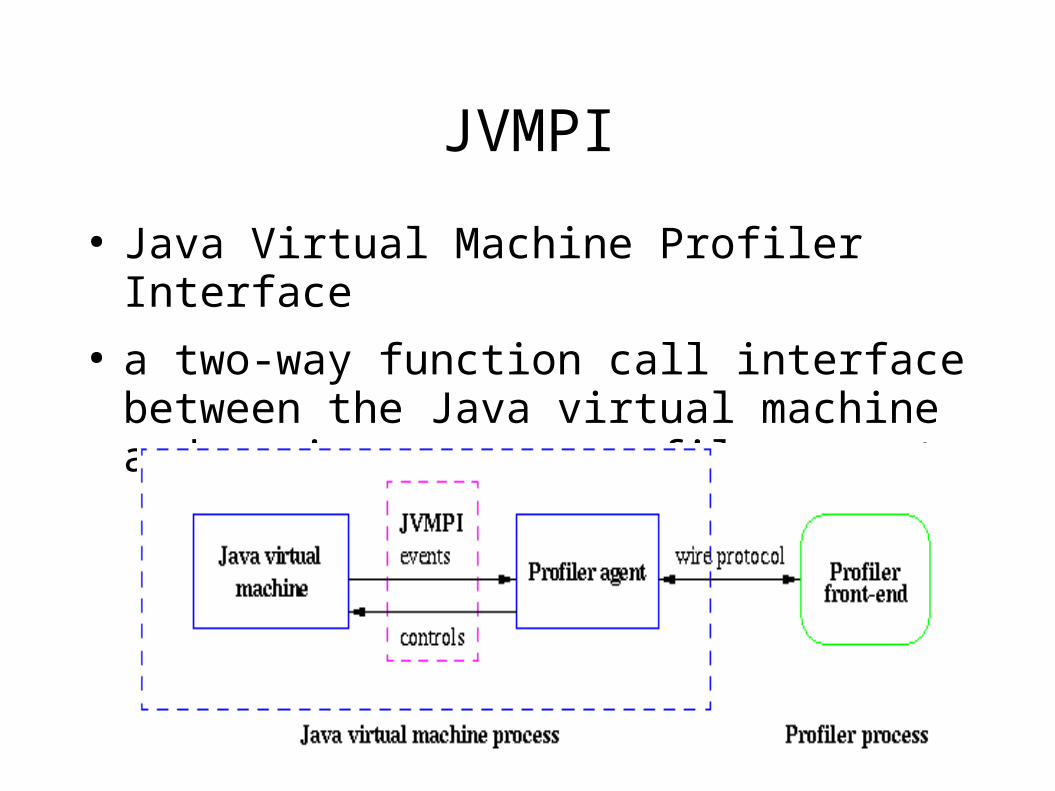
JVMPI
● Java Virtual Machine Profiler Interface● a two-way function call interface between the
Java virtual machine and an in-process profiler agent
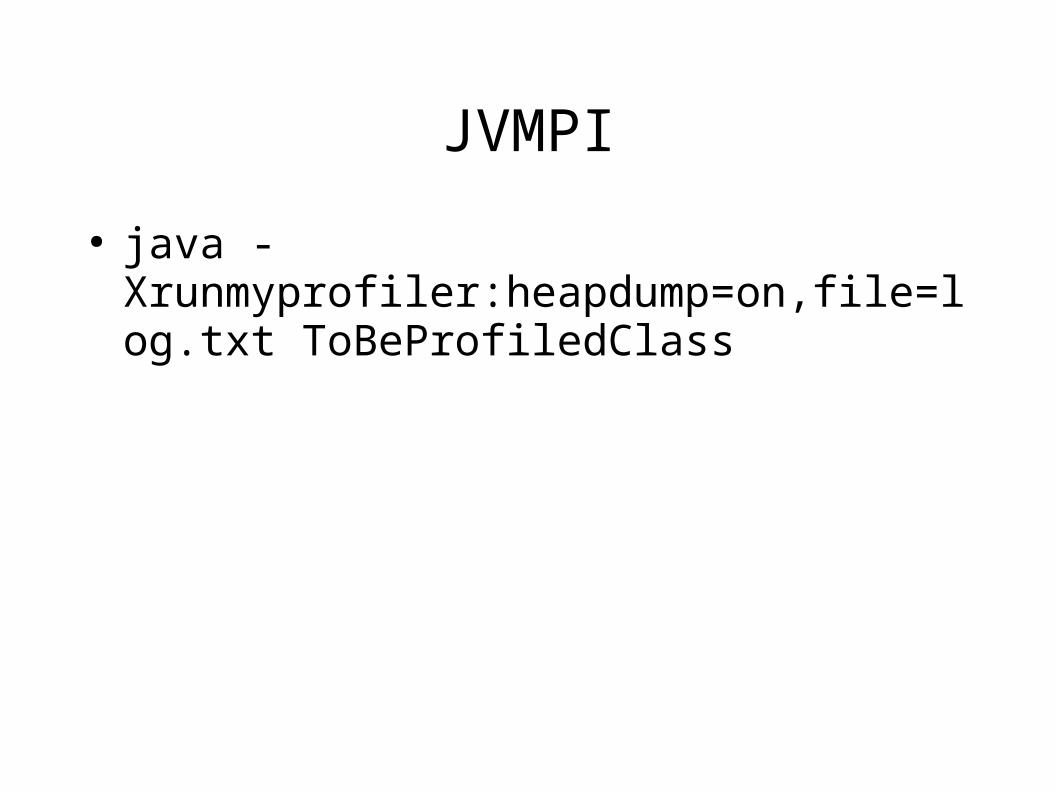
JVMPI
● java -Xrunmyprofiler:heapdump=on,file=log.txt ToBeProfiledClass
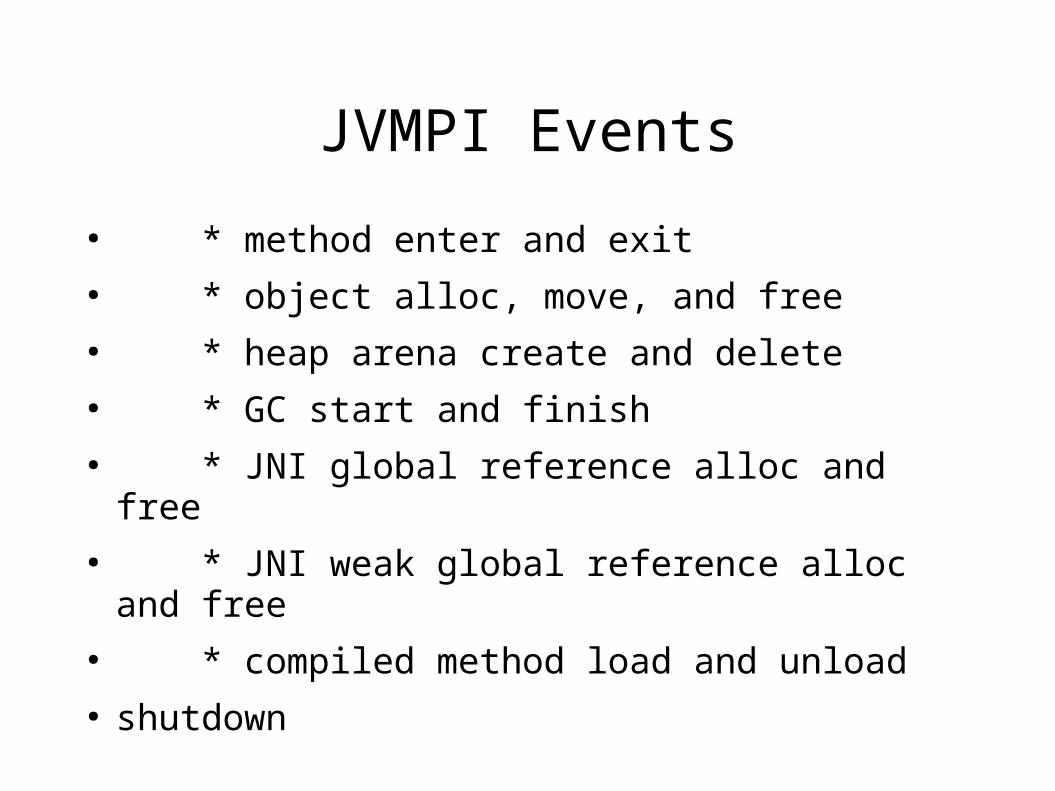
JVMPI Events
● * method enter and exit● * object alloc, move, and free● * heap arena create and delete● * GC start and finish● * JNI global reference alloc and free● * JNI weak global reference alloc and free● * compiled method load and unload● shutdown
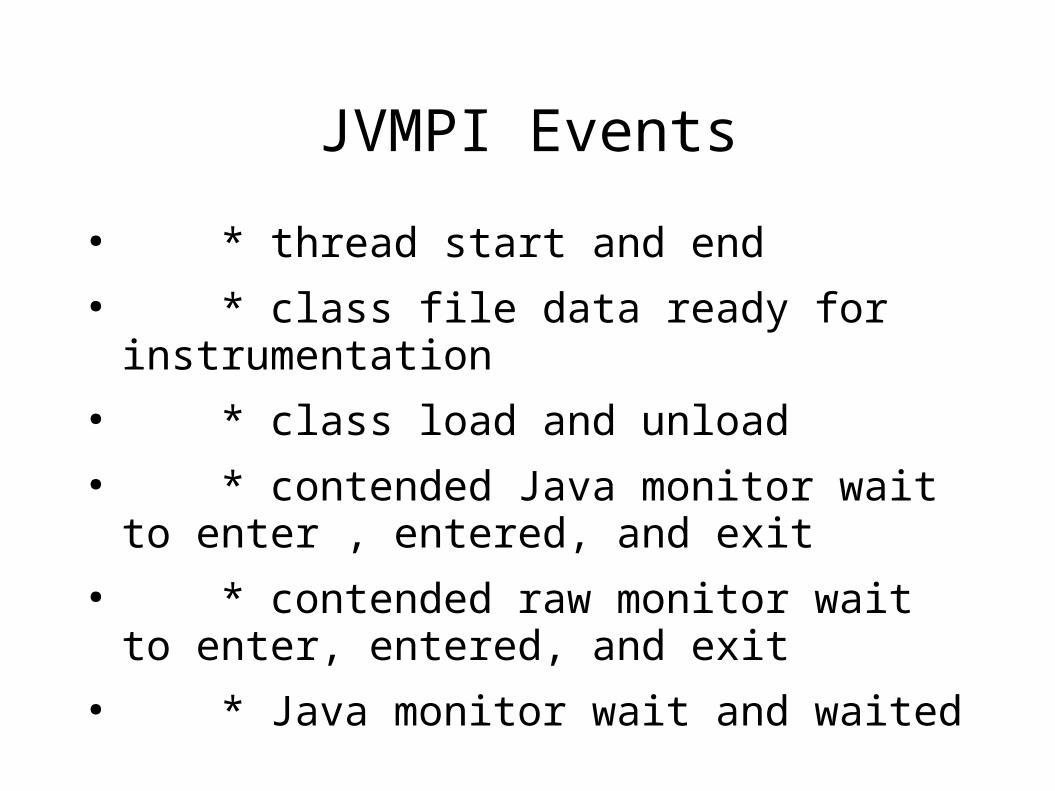
JVMPI Events
● * thread start and end● * class file data ready for instrumentation● * class load and unload● * contended Java monitor wait to enter ,
entered, and exit● * contended raw monitor wait to enter, entered,
and exit● * Java monitor wait and waited
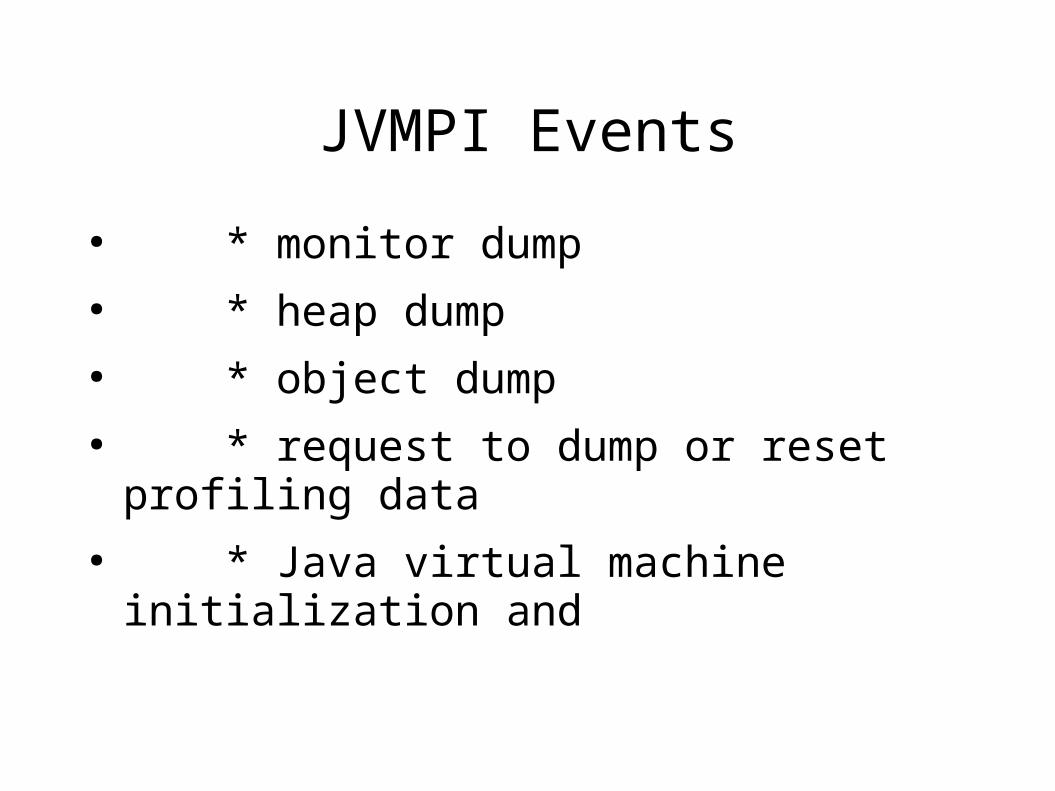
JVMPI Events
● * monitor dump● * heap dump● * object dump● * request to dump or reset profiling data● * Java virtual machine initialization and

Profilers
● Jprobe profiler● Optimizeit● CodeWarrior (IDE that has a profiler in it)● Jprof● Jinsight● HpJMeter● Numega and many more
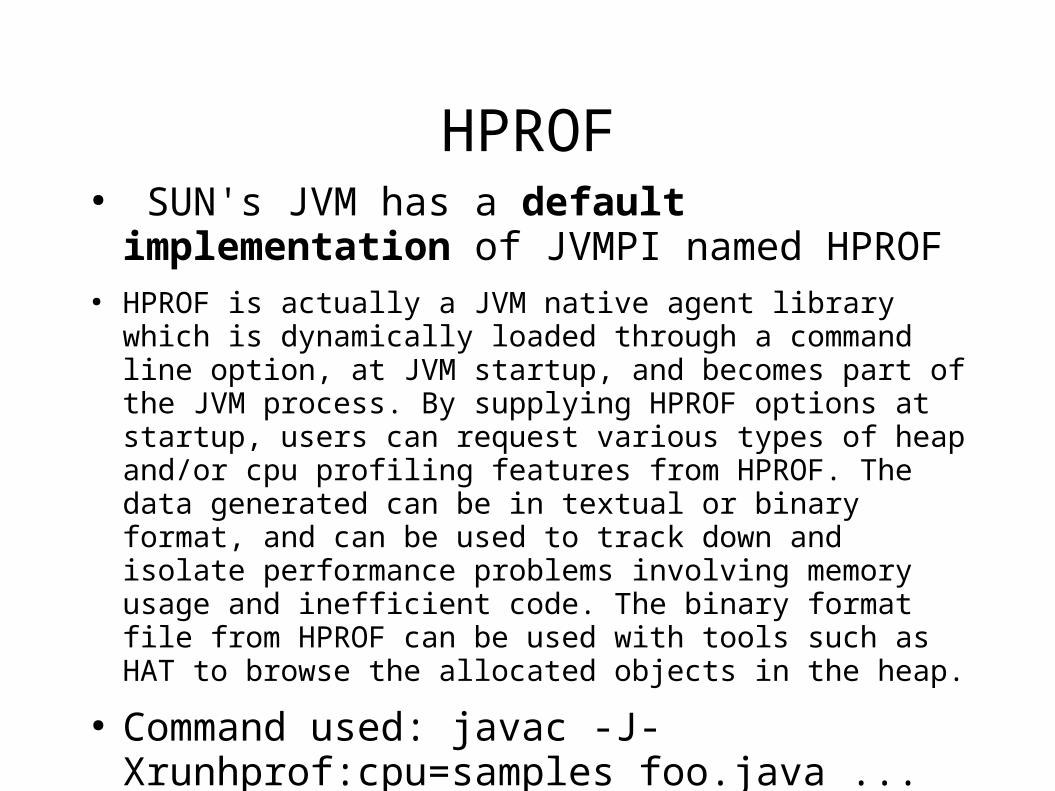
HPROF● SUN's JVM has a default implementation of
JVMPI named HPROF● HPROF is actually a JVM native agent library which is
dynamically loaded through a command line option, at JVM startup, and becomes part of the JVM process. By supplying HPROF options at startup, users can request various types of heap and/or cpu profiling features from HPROF. The data generated can be in textual or binary format, and can be used to track down and isolate performance problems involving memory usage and inefficient code. The binary format file from HPROF can be used with tools such as HAT to browse the allocated objects in the heap.
● Command used: javac -J-Xrunhprof:cpu=samples foo.java ...
HPROF
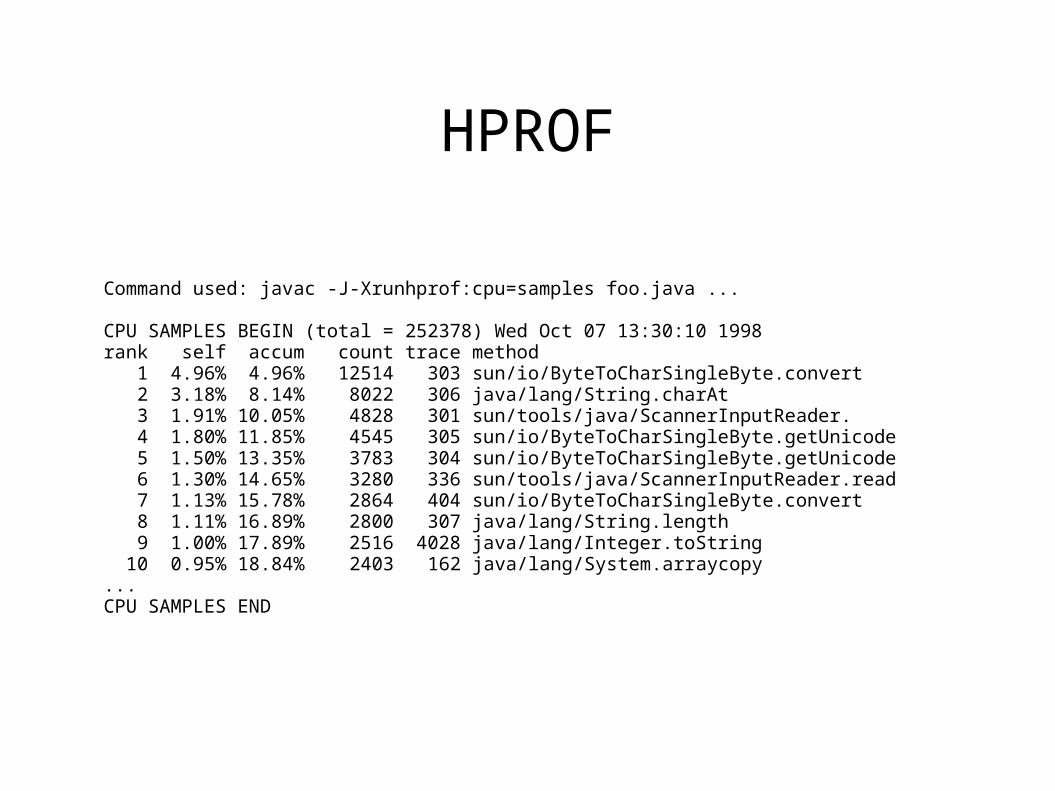
Command used: javac -J-Xrunhprof:cpu=samples foo.java ...
CPU SAMPLES BEGIN (total = 252378) Wed Oct 07 13:30:10 1998rank self accum count trace method 1 4.96% 4.96% 12514 303 sun/io/ByteToCharSingleByte.convert 2 3.18% 8.14% 8022 306 java/lang/String.charAt 3 1.91% 10.05% 4828 301 sun/tools/java/ScannerInputReader. 4 1.80% 11.85% 4545 305 sun/io/ByteToCharSingleByte.getUnicode 5 1.50% 13.35% 3783 304 sun/io/ByteToCharSingleByte.getUnicode 6 1.30% 14.65% 3280 336 sun/tools/java/ScannerInputReader.read 7 1.13% 15.78% 2864 404 sun/io/ByteToCharSingleByte.convert 8 1.11% 16.89% 2800 307 java/lang/String.length 9 1.00% 17.89% 2516 4028 java/lang/Integer.toString 10 0.95% 18.84% 2403 162 java/lang/System.arraycopy...CPU SAMPLES END
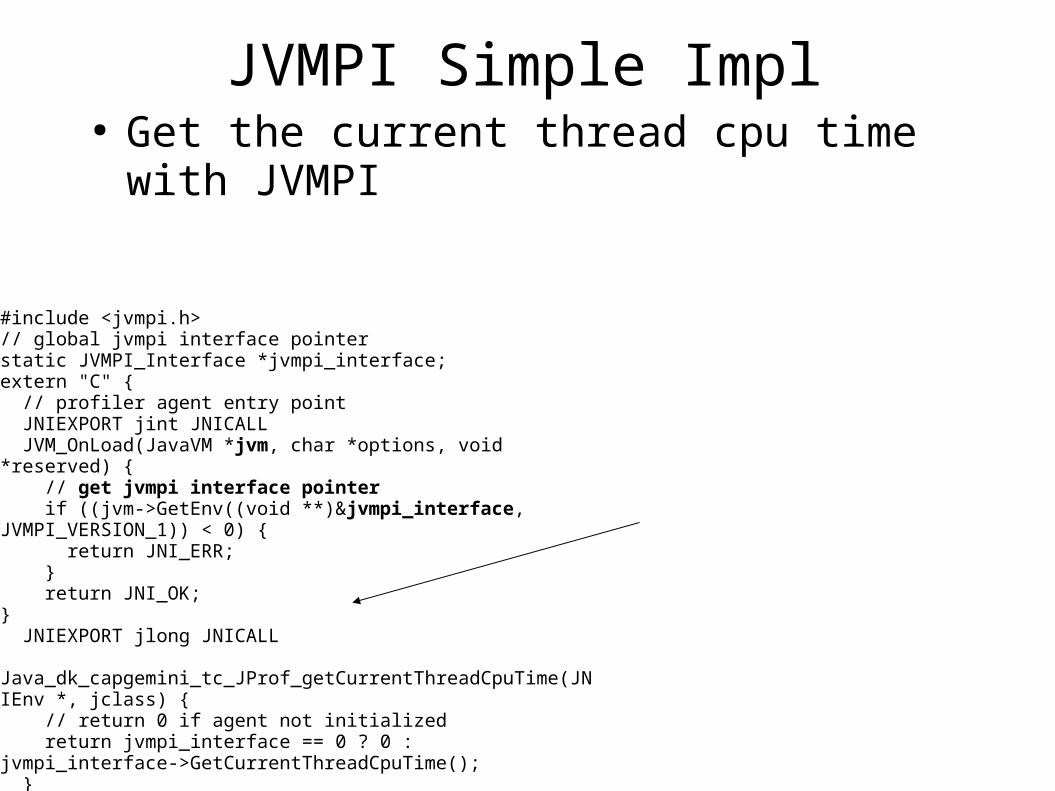
JVMPI Simple Impl● Get the current thread cpu time with JVMPI
#include <jvmpi.h>// global jvmpi interface pointerstatic JVMPI_Interface *jvmpi_interface;extern "C" { // profiler agent entry point JNIEXPORT jint JNICALL JVM_OnLoad(JavaVM *jvm, char *options, void *reserved) { // get jvmpi interface pointer if ((jvm->GetEnv((void **)&jvmpi_interface, JVMPI_VERSION_1)) < 0) { return JNI_ERR; } return JNI_OK;} JNIEXPORT jlong JNICALL Java_dk_capgemini_tc_JProf_getCurrentThreadCpuTime(JNIEnv *, jclass) { // return 0 if agent not initialized return jvmpi_interface == 0 ? 0 :jvmpi_interface->GetCurrentThreadCpuTime(); }}
package dk.capgemini.tc;public class JProf {
public static native long getCurrentThreadCpuTime(); static { System.loadLibrary("capjprof"); }}
JBOSS Profiler
● It's based on a JVMPI agent written in C● captures the events from the JVM into binary log
files● web-application that analyzes that● JBoss-profiler it's easier to configure than most
existing profilers
Jboss Profiler Features
● You can setup triggers for starting the data-event capturing
● Regular exclusion filters ● Find which objects still are alived
Features
● method entry/exit (CPU and Time) ● object-alloc ● thread start/end ● class loading ● object-release
Interceptors
● JVMPI (which is being converted to JVMTI) ● AOP
– we can focus excatly on what we need and instrumentate only the classes we would need to analyze
Getting Data into Production Environments
● sleep mode ● select events for a finite number of methods
Front-ends
● WEB application ● developing an ant integration which will generate
reports that will extend functionality on JUnit
Installation
● Not a final module● Download it from CVS / Sourceforge● Current version 1.0.0 published in february 05
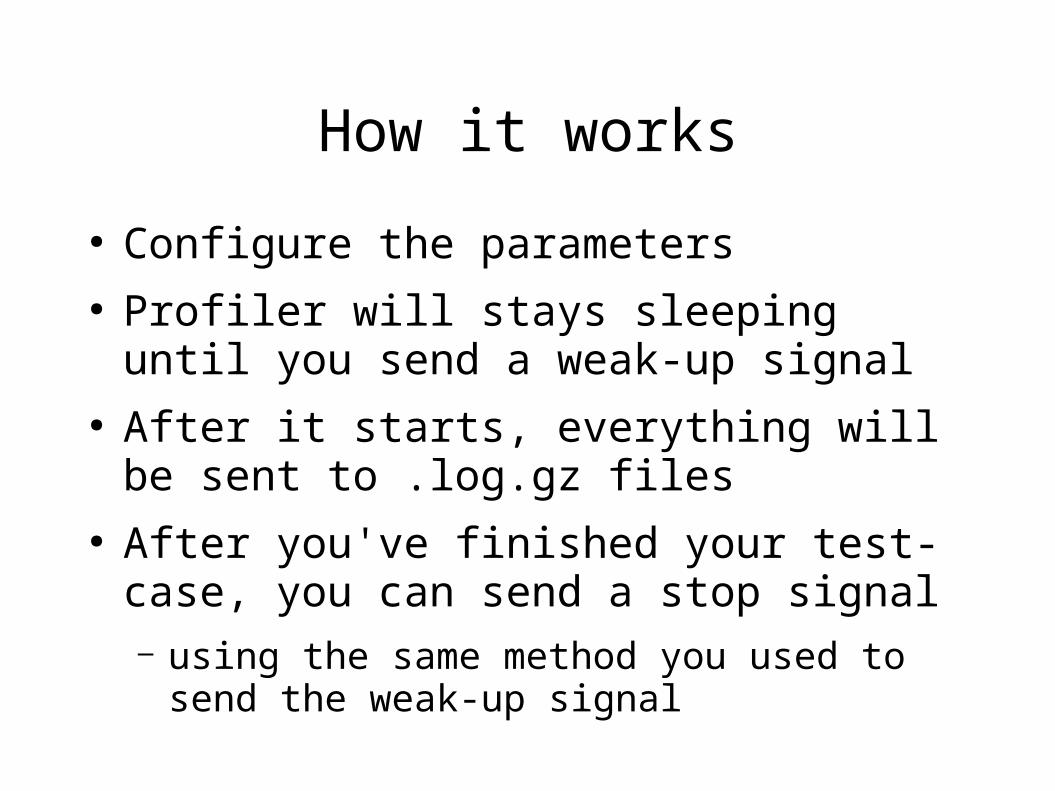
How it works
● Configure the parameters● Profiler will stays sleeping until you send a weak-
up signal● After it starts, everything will be sent to .log.gz
files● After you've finished your test-case, you can send
a stop signal– using the same method you used to send the weak-up
signal
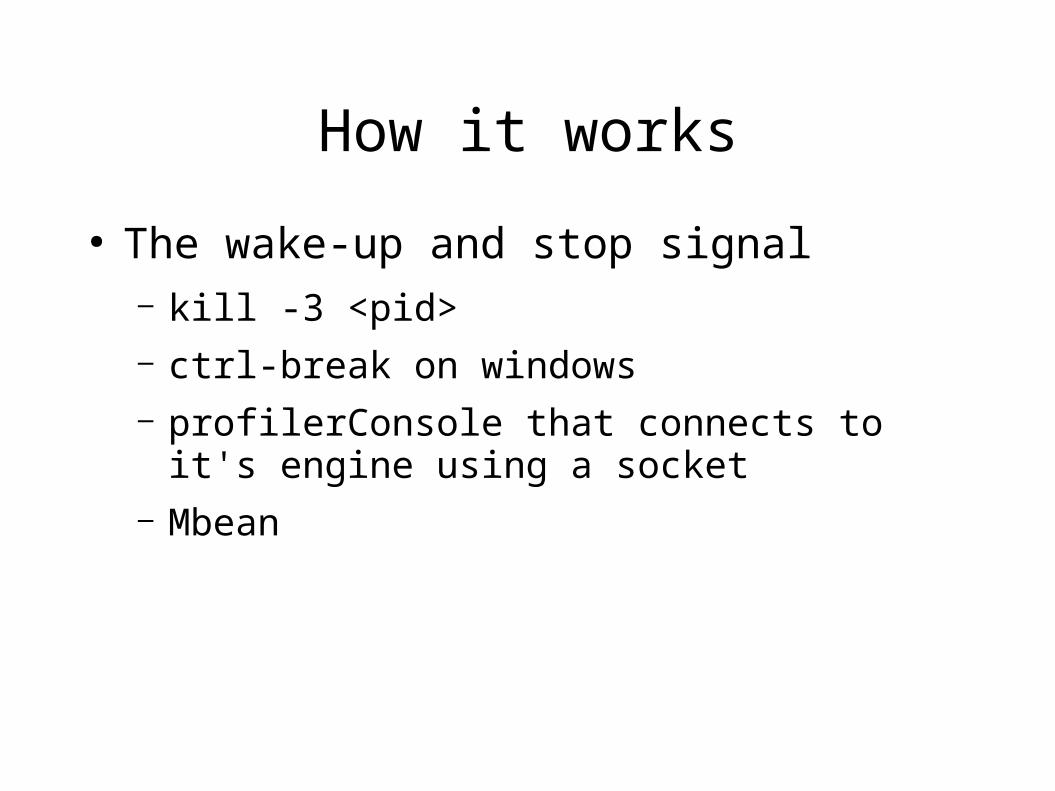
How it works
● The wake-up and stop signal– kill -3 <pid>– ctrl-break on windows– profilerConsole that connects to it's engine using a
socket– Mbean
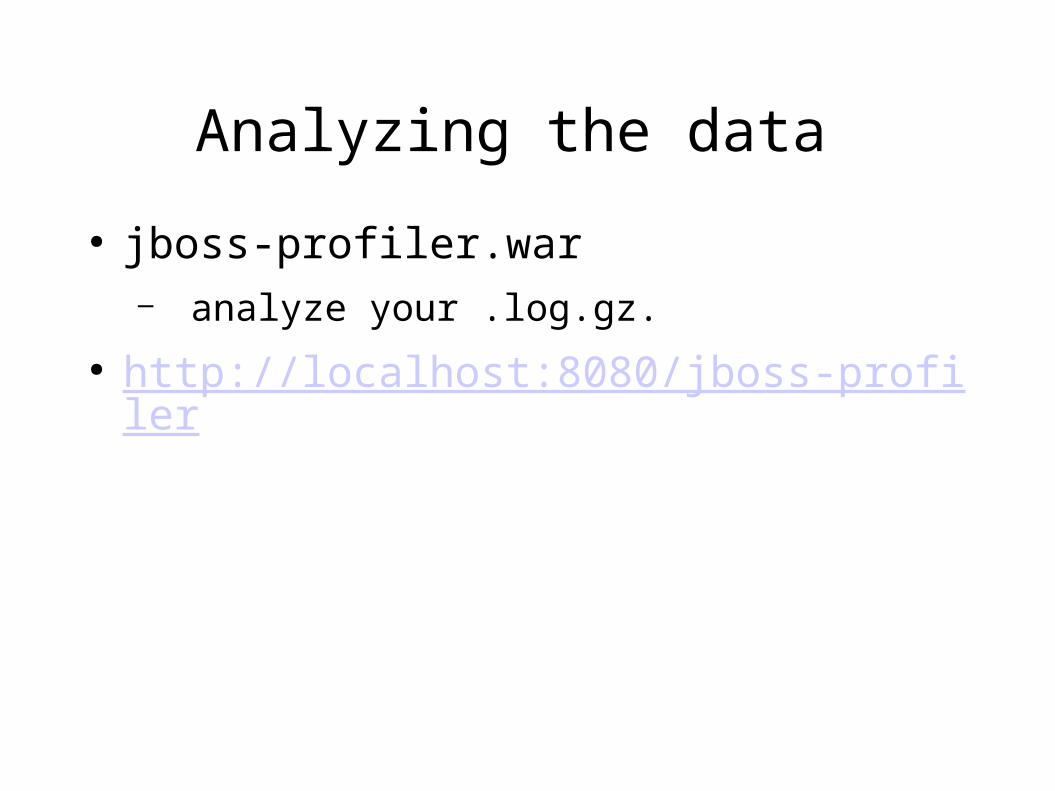
Analyzing the data
● jboss-profiler.war– analyze your .log.gz.
● http://localhost:8080/jboss-profiler
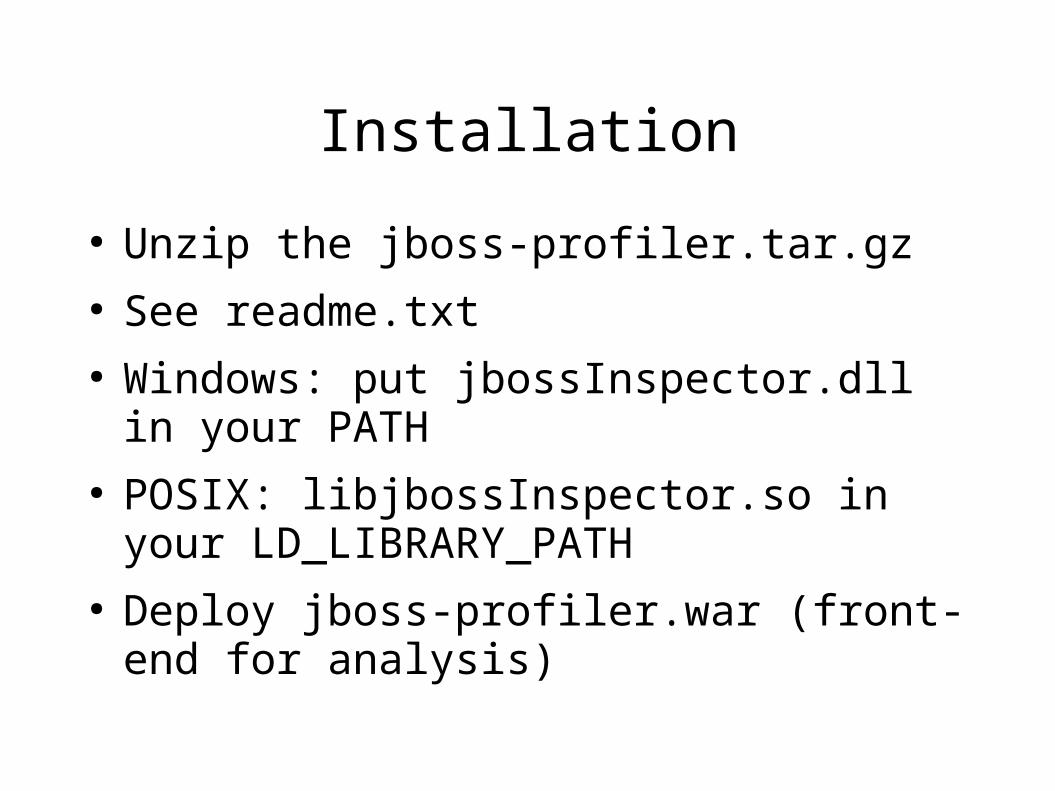
Installation
● Unzip the jboss-profiler.tar.gz● See readme.txt● Windows: put jbossInspector.dll in your PATH● POSIX: libjbossInspector.so in your
LD_LIBRARY_PATH● Deploy jboss-profiler.war (front-end for analysis)
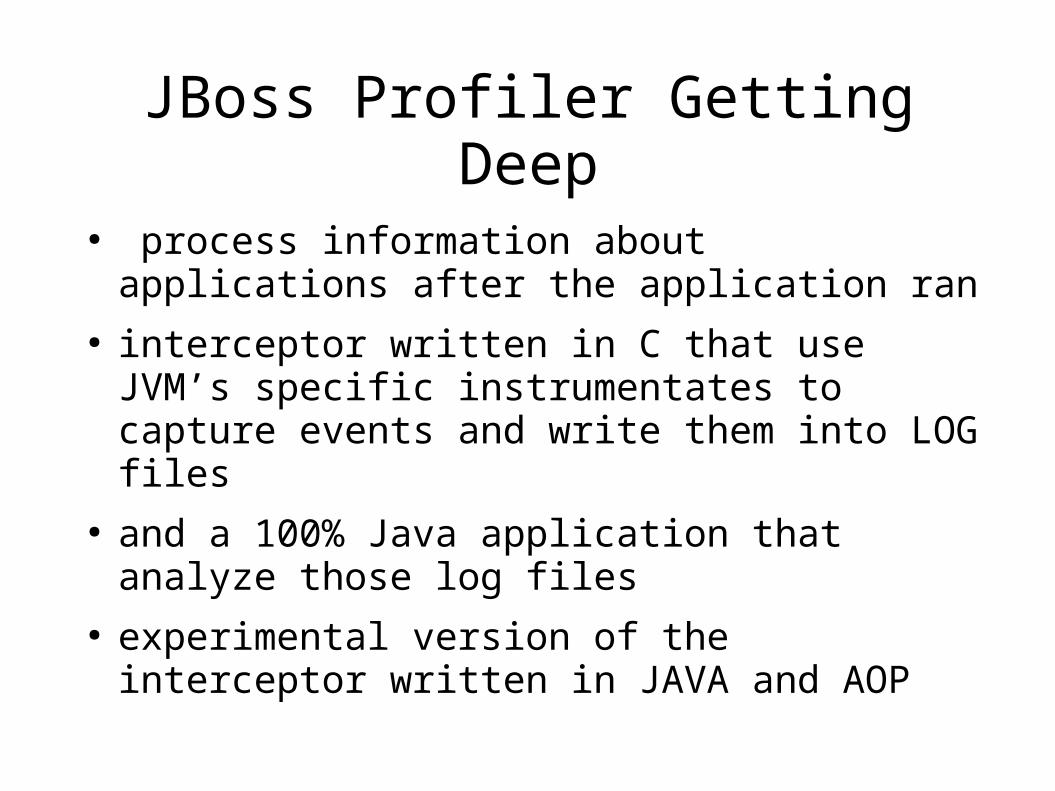
JBoss Profiler Getting Deep
● process information about applications after the application ran
● interceptor written in C that use JVM’s specific instrumentates to capture events and write them into LOG files
● and a 100% Java application that analyze those log files
● experimental version of the interceptor written in JAVA and AOP
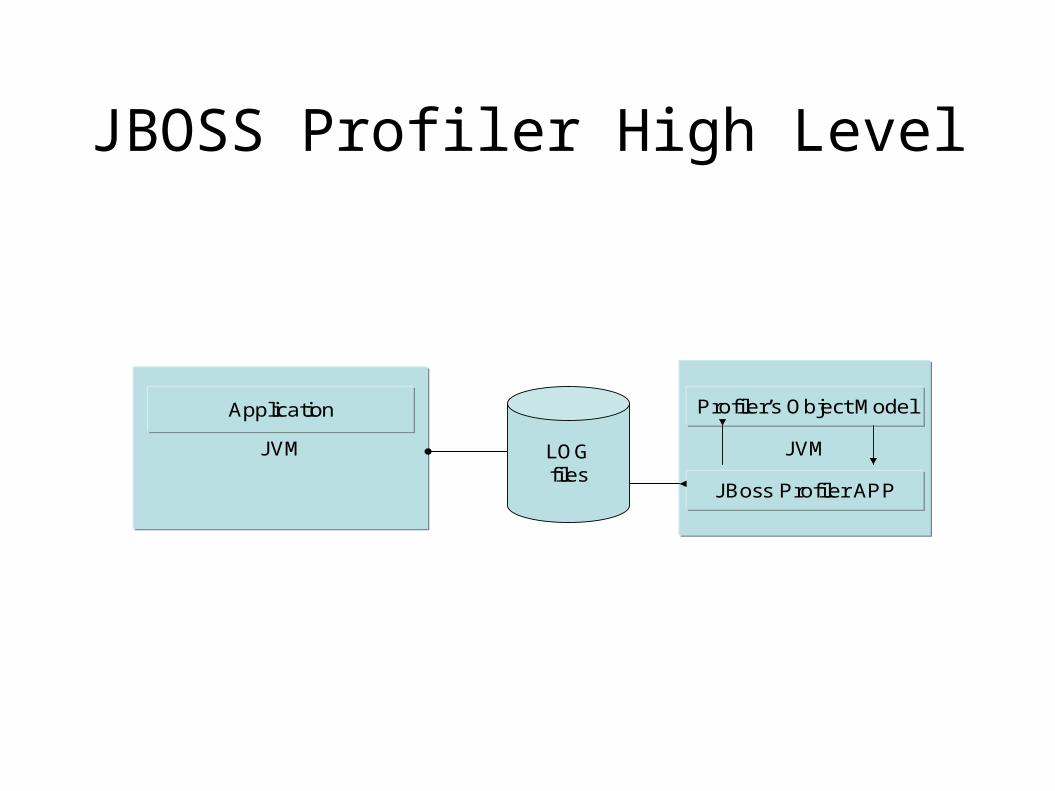
JBOSS Profiler High Level
JVM
Application
LOGfiles
JVM
Profiler’s Object Model
JBoss Profiler APP
jbossInspector.dll
● C written DLL● captures the events
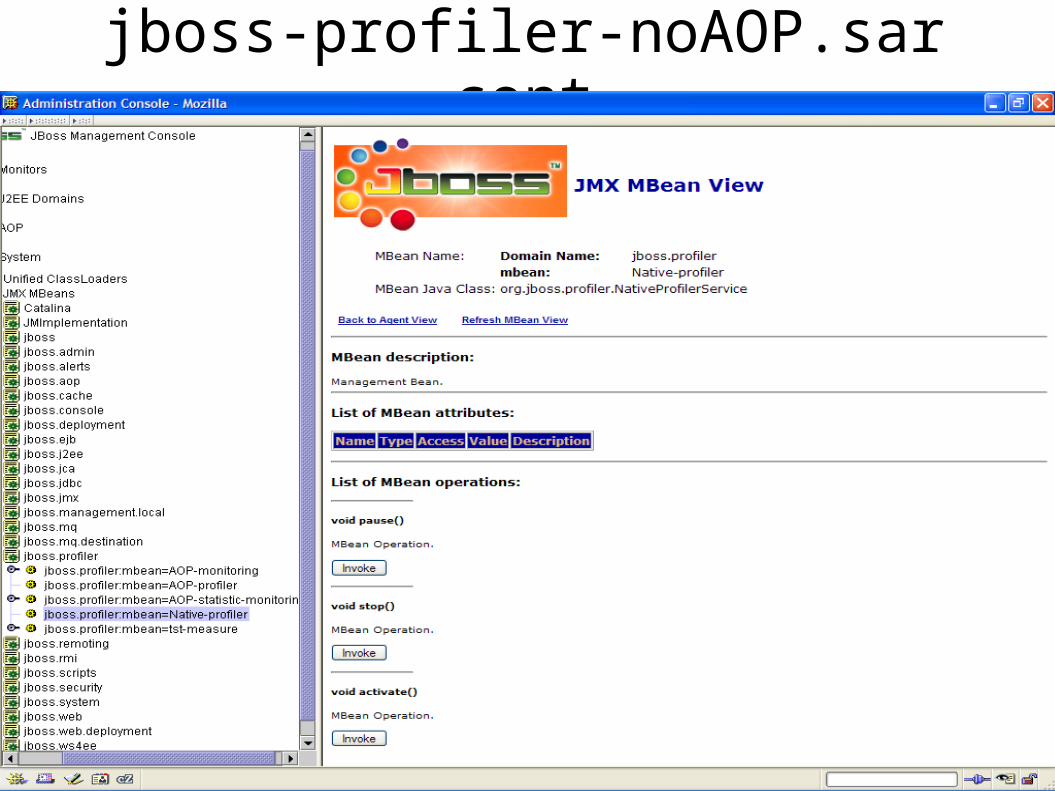
jboss-profiler-noAOP.sar
● JMX – MBean● You can execute these following methods from
MBeans – Activate
● Start the data-capturing of the profiler. It’s like a weak-up signal
● After that all the events will be captured according to filter’s settings
jboss-profiler-noAOP.sar cont
● Pause– The profiler will come back to it’s original state by
not consuming any extra resource from the application
● Stop– Closes all the resources and stop any profiler’s
activity – Profiler cannot be activated again
jboss-profiler-noAOP.sar cont

Resources● http://java.sun.com/developer/technicalArticles/Programming/HPROF.html
● http://www.javaworld.com/javaworld/javatips/jw-javatip92_p.html
● http://java.sun.com/j2se/1.3/docs/guide/jvmpi/jvmpi.html
● http://www.jboss.org/wiki/Wiki.jsp?page=JBossProfiler&version=2
● http://www.owlnet.rice.edu/~comp320/2005/notes/tut06-profiling/
● http://linuxgazette.net/100/vinayak.html