Embed Size (px)
Citation preview

Jenny HEATHCOTE
Chronic Hepatitis C“The Non Responder”!
Jenny Heathcote MD
University of Toronto
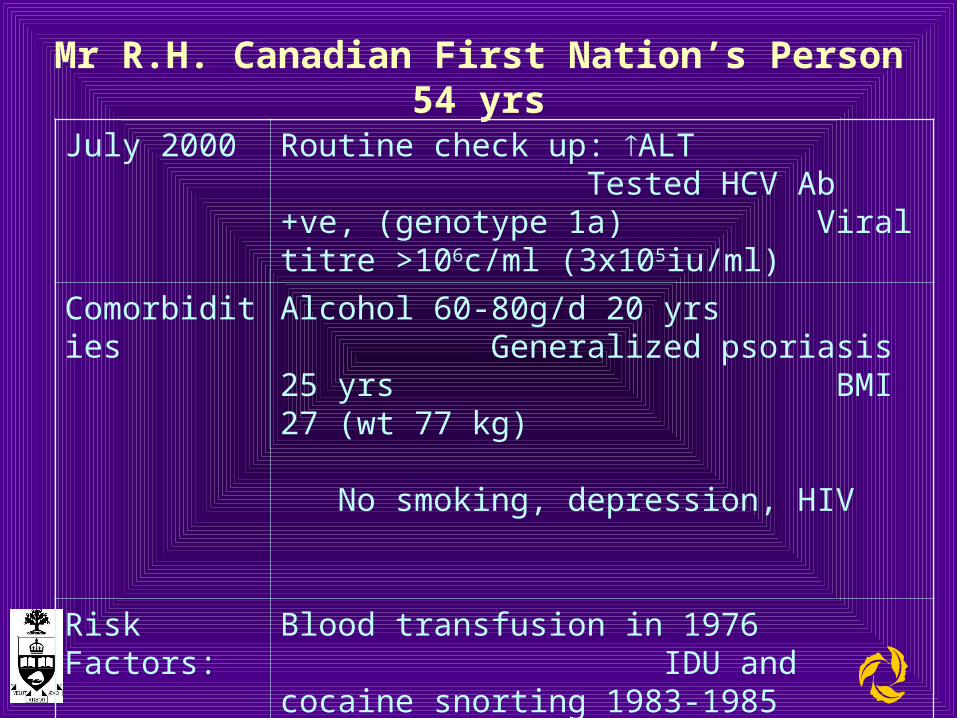
Mr R.H. Canadian First Nation’s Person 54 yrs
July 2000 Routine check up: ALT Tested HCV Ab +ve, (genotype 1a) Viral titre >106c/ml (3x10⁵iu/ml)
Comorbidities Alcohol 60-80g/d 20 yrs Generalized psoriasis 25 yrs BMI 27 (wt 77 kg) No smoking, depression, HIV
Risk Factors: Blood transfusion in 1976 IDU and cocaine snorting 1983-1985
Examination: Normal
Liver biopsy A 1 F 4 + steatohepatitis
Therapy IFN2b 3mu ttw + RBV daily
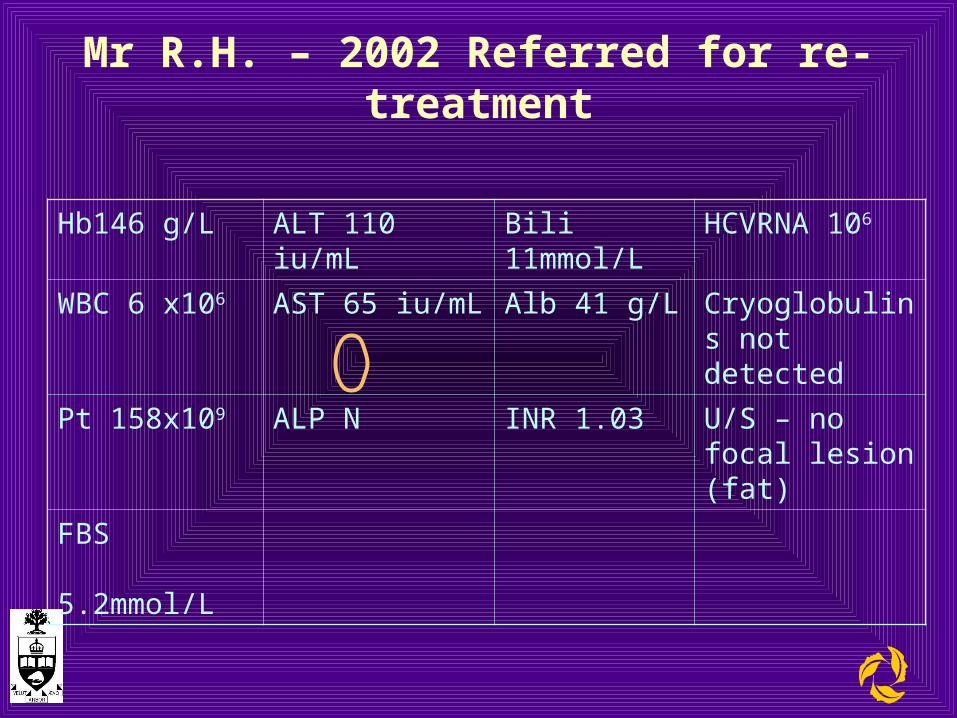
Mr R.H. – 2002 Referred for re-treatment
Hb146 g/L ALT 110 iu/mL Bili 11mmol/L HCVRNA 106
WBC 6 x10⁶ AST 65 iu/mL Alb 41 g/L Cryoglobulins not detected
Pt 158x109 ALP N INR 1.03 U/S – no focal lesion (fat)
FBS 5.2mmol/L
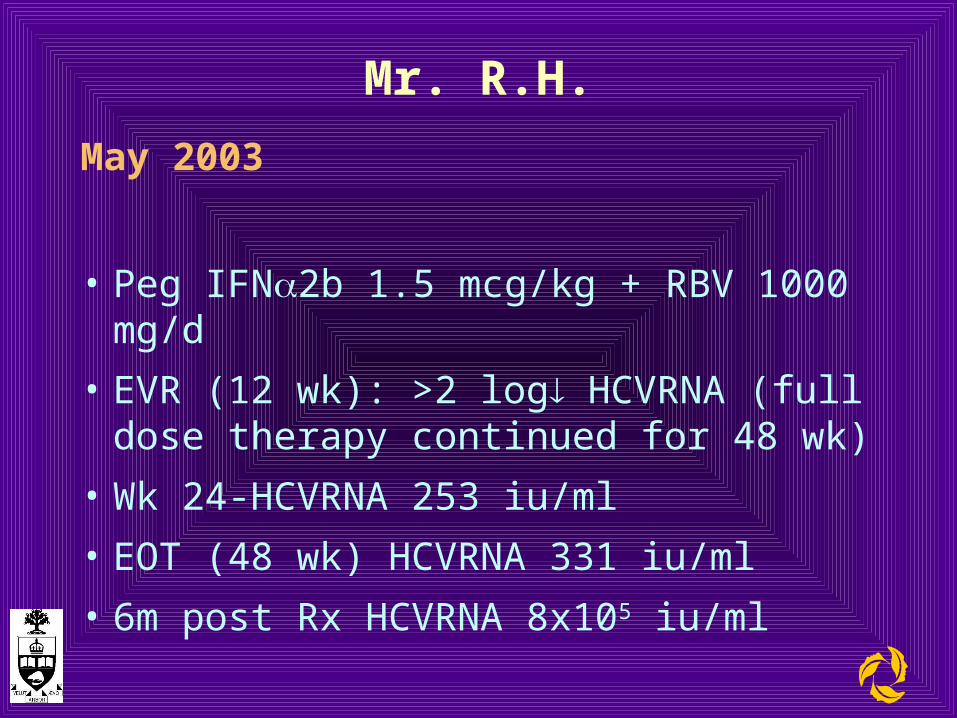
Mr. R.H.
May 2003
• Peg IFN2b 1.5 mcg/kg + RBV 1000 mg/d
• EVR (12 wk): >2 log HCVRNA (full dose therapy continued for 48 wk)
• Wk 24-HCVRNA 253 iu/ml
• EOT (48 wk) HCVRNA 331 iu/ml
• 6m post Rx HCVRNA 8x10⁵ iu/ml
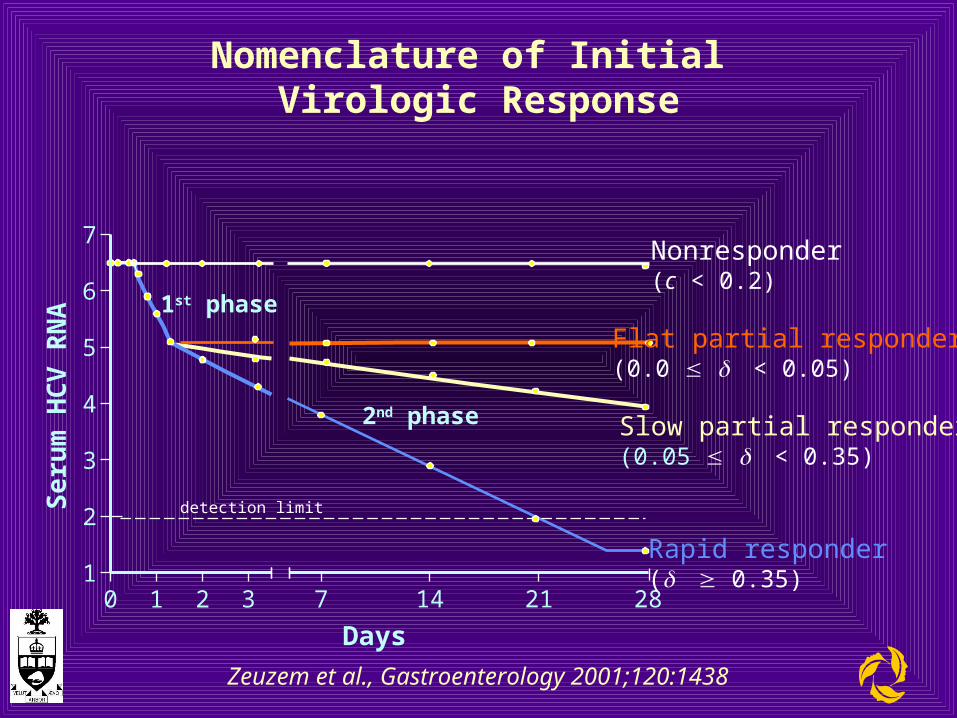
Nomenclature of Initial Virologic Response
0 1 2 31
2
3
4
5
6
7
7 14 21 28
detection limit
Days
Se
rum
HC
V R
NA 1st phase
2nd phase
Flat partial responder(0.0 < 0.05)
Slow partial responder(0.05 < 0.35)
Rapid responder( 0.35)
Nonresponder(c < 0.2)
Zeuzem et al., Gastroenterology 2001;120:1438
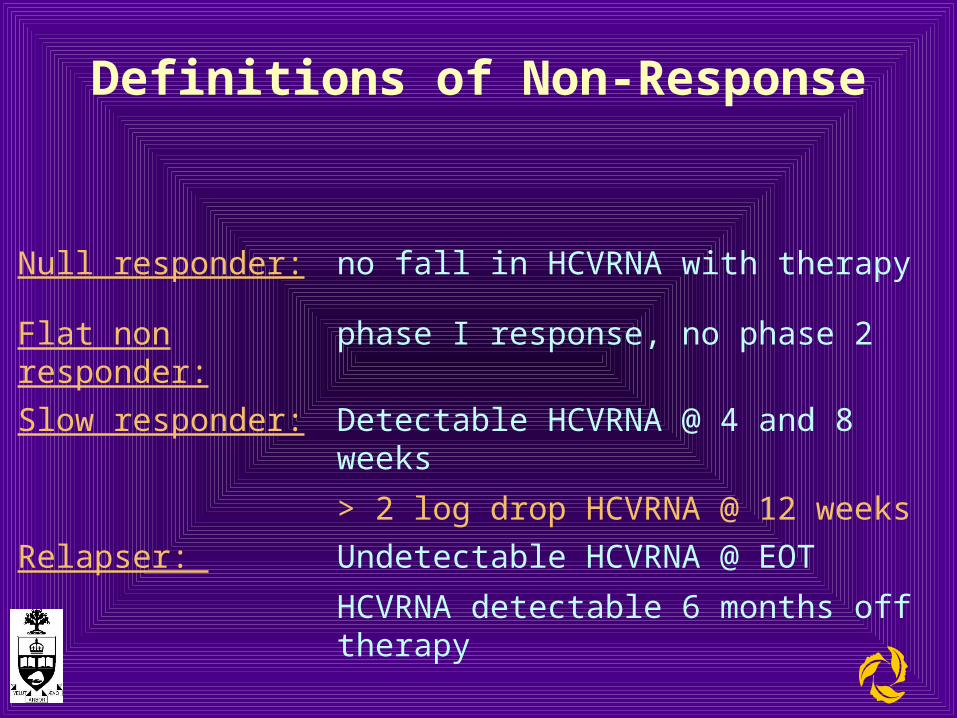
Definitions of Non-Response
Null responder: no fall in HCVRNA with therapy
Flat non responder: phase I response, no phase 2
Slow responder: Detectable HCVRNA @ 4 and 8 weeks
> 2 log drop HCVRNA @ 12 weeks
Relapser: Undetectable HCVRNA @ EOT
HCVRNA detectable 6 months off therapy
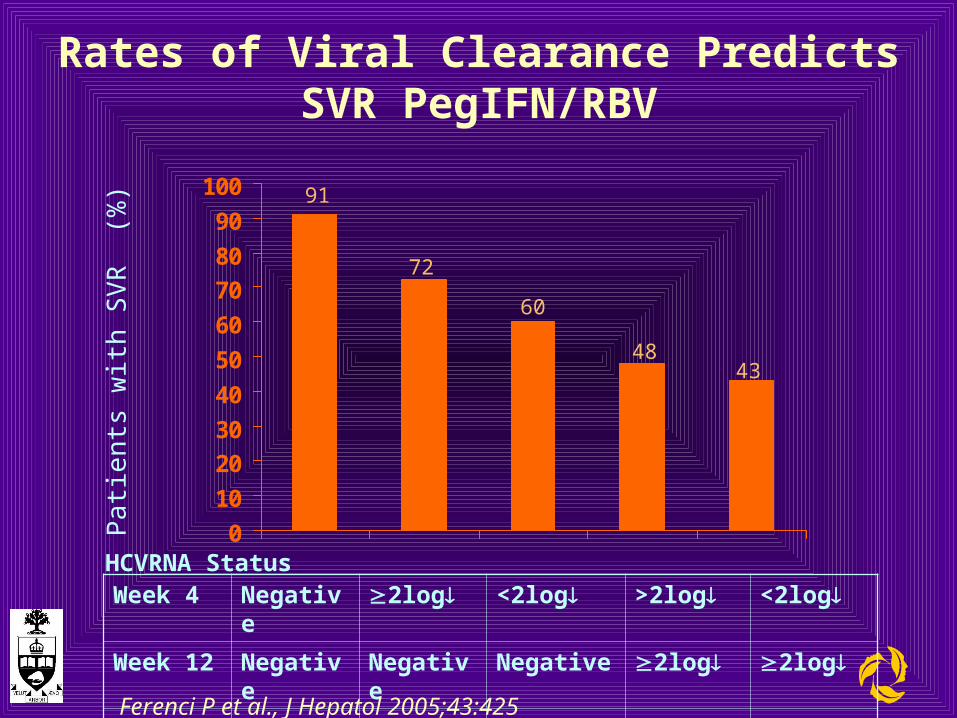
Rates of Viral Clearance Predicts SVR PegIFN/RBV
0
10
20
30
40
50
60
70
80
90
100 91
72
60
4843
Week 4 Negative 2log <2log >2log <2log
Week 12 Negative Negative Negative 2log 2log
Week 24 Negative Negative Negative Negative Negative
HCVRNA Status
Ferenci P et al., J Hepatol 2005;43:425
Pa
tient
s w
ith S
VR
(%
)
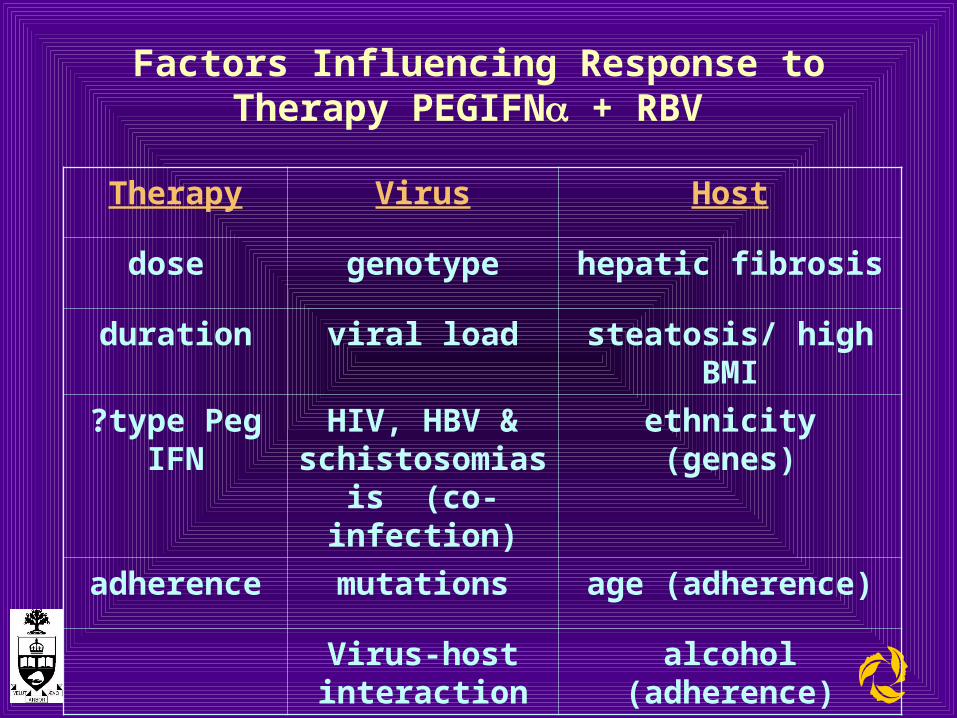
Factors Influencing Response to Therapy PEGIFN + RBV
Therapy Virus Host
dose genotype hepatic fibrosis
duration viral load steatosis/ high BMI
?type Peg IFN
HIV, HBV & schistosomiasis
(co-infection)
ethnicity (genes)
adherence mutations age (adherence)
Virus-host interaction
alcohol (adherence)
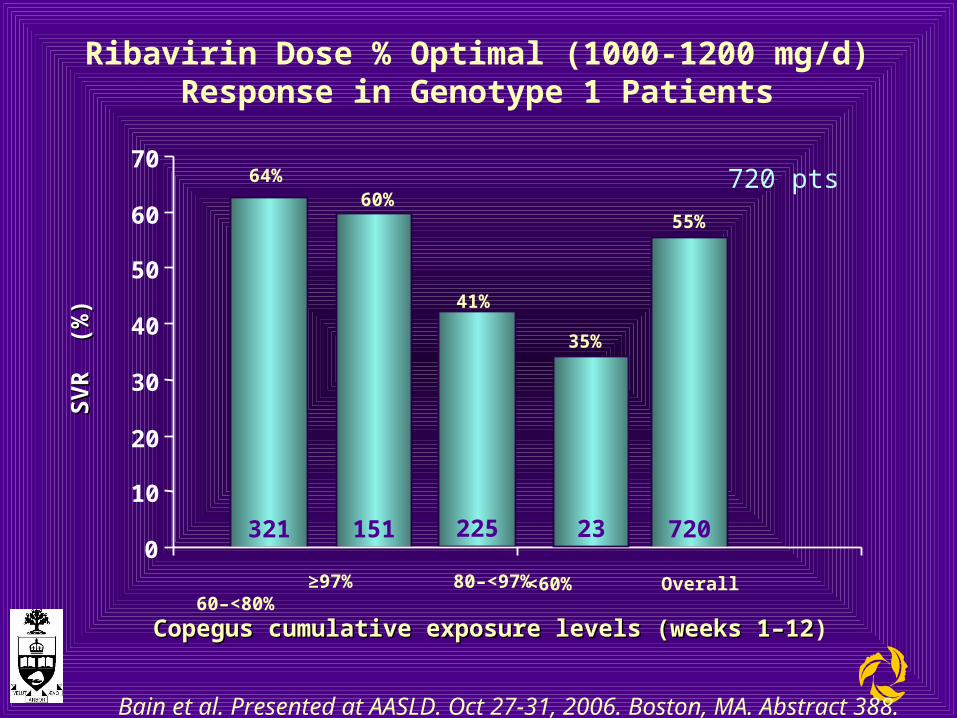
Ribavirin Dose % Optimal (1000-1200 mg/d)Response in Genotype 1 Patients
Copegus cumulative exposure levels (weeks 1–12Copegus cumulative exposure levels (weeks 1–12)
321 151 7202250
10
20
30
40
50
60
70
SV
R
(%)
SV
R
(%)
≥97% 80–<97% 60–<80% <60% Overall
23
64%60%
41%
55%
35%
Bain et al. Presented at AASLD. Oct 27-31, 2006. Boston, MA. Abstract 388.
720 pts
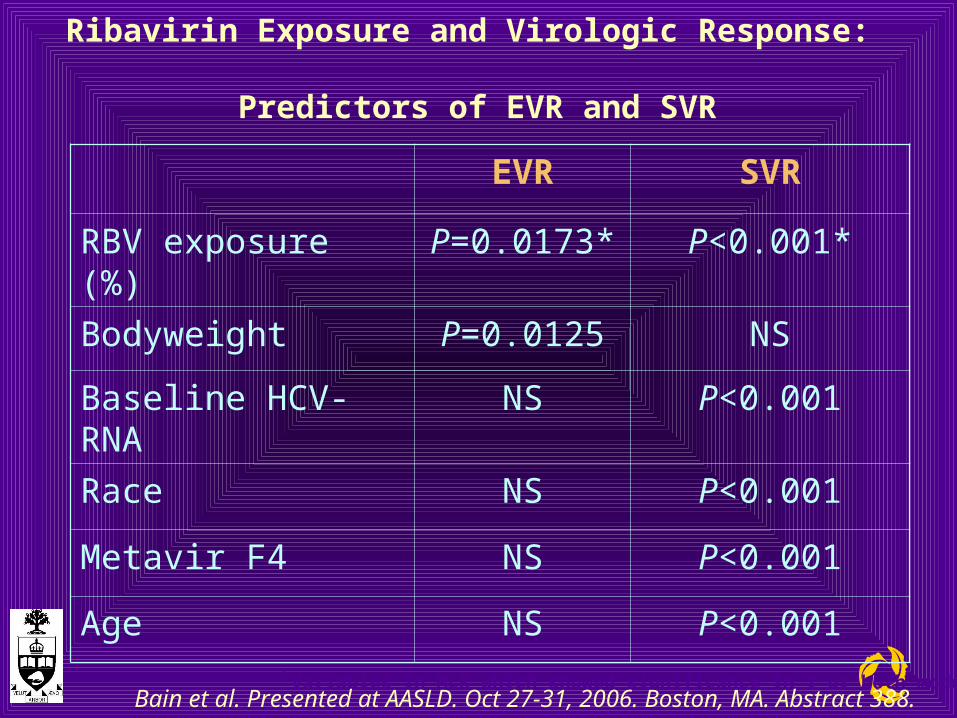
Ribavirin Exposure and Virologic Response: Predictors of EVR and SVR
EVR SVR
RBV exposure (%) P=0.0173* P<0.001*
Bodyweight P=0.0125 NS
Baseline HCV-RNA NS P<0.001
Race NS P<0.001
Metavir F4 NS P<0.001
Age NS P<0.001
*Variables in MLR which showed significance in 1 or both modelsBain et al. Presented at AASLD. Oct 27-31, 2006. Boston, MA. Abstract 388.
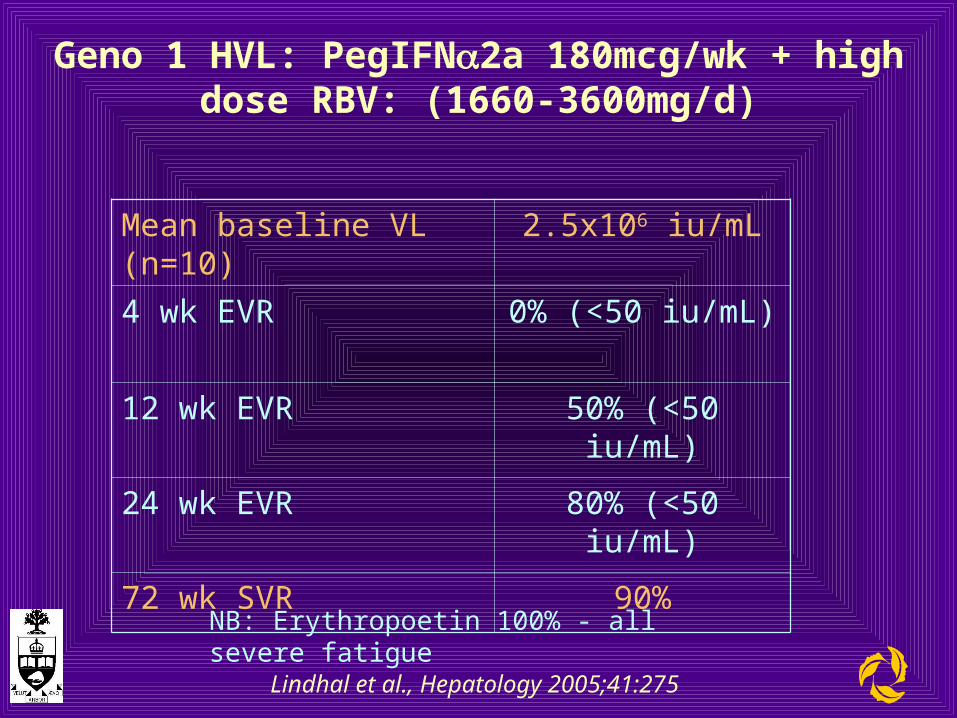
Geno 1 HVL: PegIFN2a 180mcg/wk + high dose RBV: (1660-3600mg/d)
Mean baseline VL (n=10) 2.5x10⁶ iu/mL
4 wk EVR 0% (<50 iu/mL)
12 wk EVR 50% (<50 iu/mL)
24 wk EVR 80% (<50 iu/mL)
72 wk SVR 90%
Lindhal et al., Hepatology 2005;41:275
NB: Erythropoetin 100% - all severe fatigue
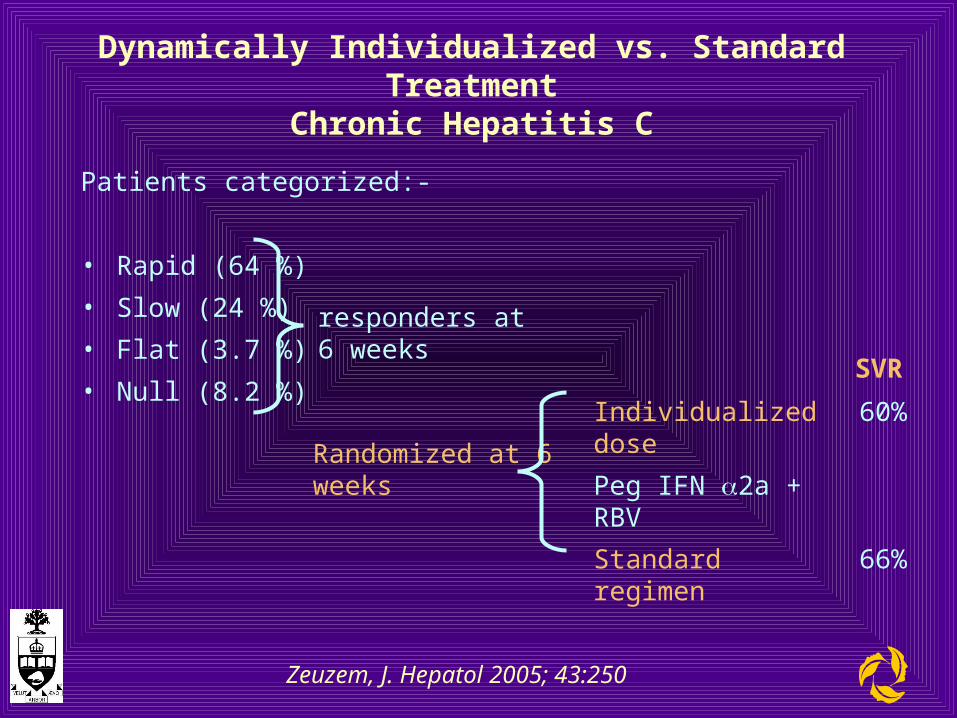
Dynamically Individualized vs. Standard TreatmentChronic Hepatitis C
Patients categorized:-
• Rapid (64 %)
• Slow (24 %)
• Flat (3.7 %)
• Null (8.2 %)
responders at 6 weeks
Zeuzem, J. Hepatol 2005; 43:250
Randomized at 6 weeks
Individualized dose 60%
Peg IFN 2a + RBV
Standard regimen 66%
SVR
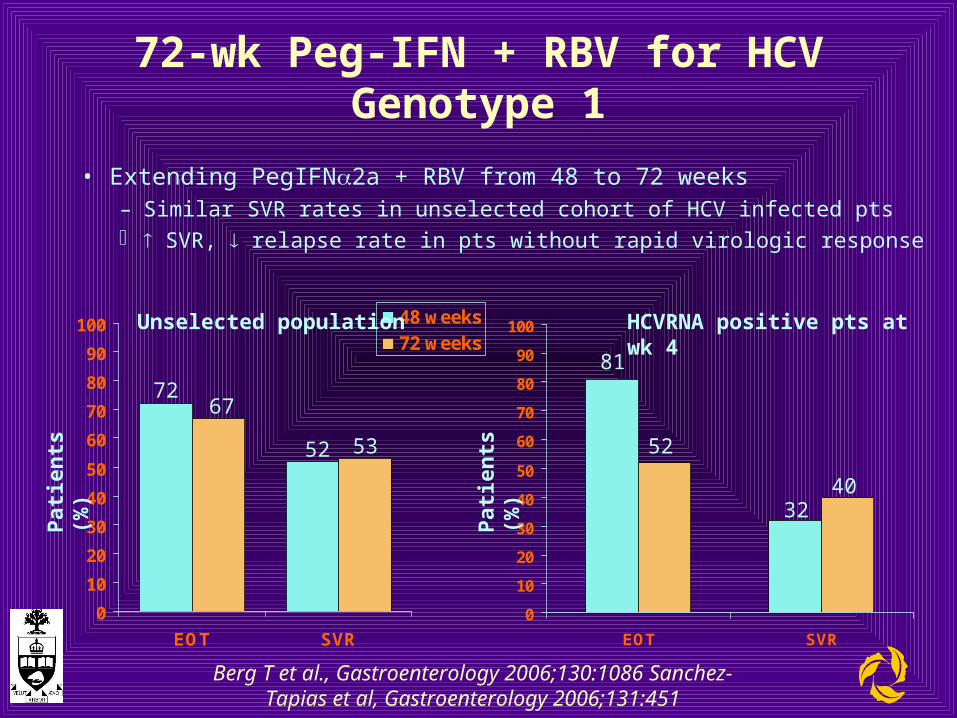
72-wk Peg-IFN + RBV for HCVGenotype 1
• Extending PegIFN2a + RBV from 48 to 72 weeks– Similar SVR rates in unselected cohort of HCV infected pts SVR, relapse rate in pts without rapid virologic response
Berg T et al., Gastroenterology 2006;130:1086 Sanchez-Tapias et al, Gastroenterology 2006;131:451
0
10
20
30
40
50
60
70
80
90
100
EOT SVR
48 weeks72 weeks
7267
52 53
0
10
20
30
40
50
60
70
80
90
100
EOT SVR
81
52
3240
Pat
ien
ts (
%)
Pat
ien
ts (
%)
Unselected population HCVRNA positive pts at wk 4
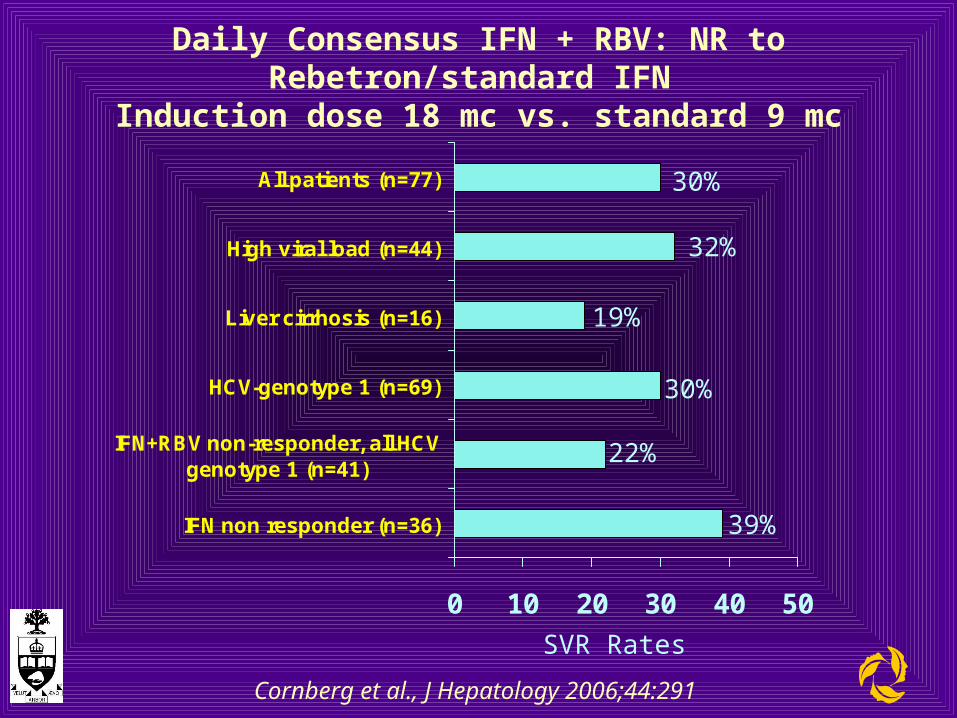
Daily Consensus IFN + RBV: NR to Rebetron/standard IFN Induction dose 18 mc vs. standard 9 mc
0 10 20 30 40 50
IFN non responder (n=36)
IFN+RBV non-responder, all HCVgenotype 1 (n=41)
HCV-genotype 1 (n=69)
Liver cirrhosis (n=16)
High viral load (n=44)
All patients (n=77) 30%
32%
19%
30%
22%
39%
Cornberg et al., J Hepatology 2006;44:291
SVR Rates
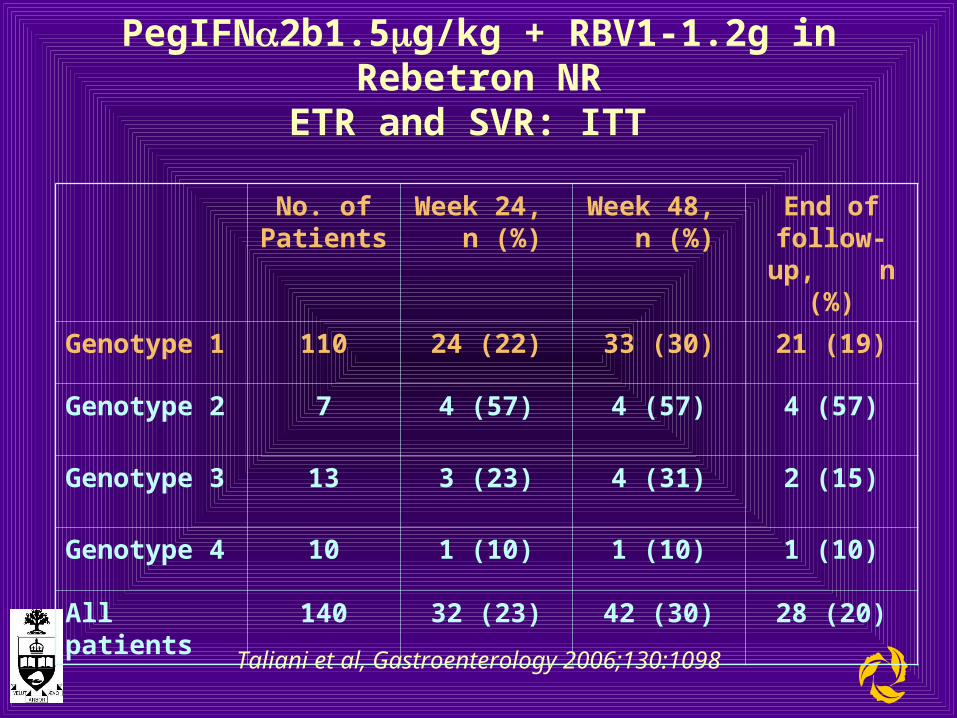
PegIFN2b1.5g/kg + RBV1-1.2g in Rebetron NRETR and SVR: ITT
No. of Patients
Week 24, n (%)
Week 48, n (%)
End of follow-up,
n (%)
Genotype 1 110 24 (22) 33 (30) 21 (19)
Genotype 2 7 4 (57) 4 (57) 4 (57)
Genotype 3 13 3 (23) 4 (31) 2 (15)
Genotype 4 10 1 (10) 1 (10) 1 (10)
All patients 140 32 (23) 42 (30) 28 (20)
Taliani et al, Gastroenterology 2006;130:1098
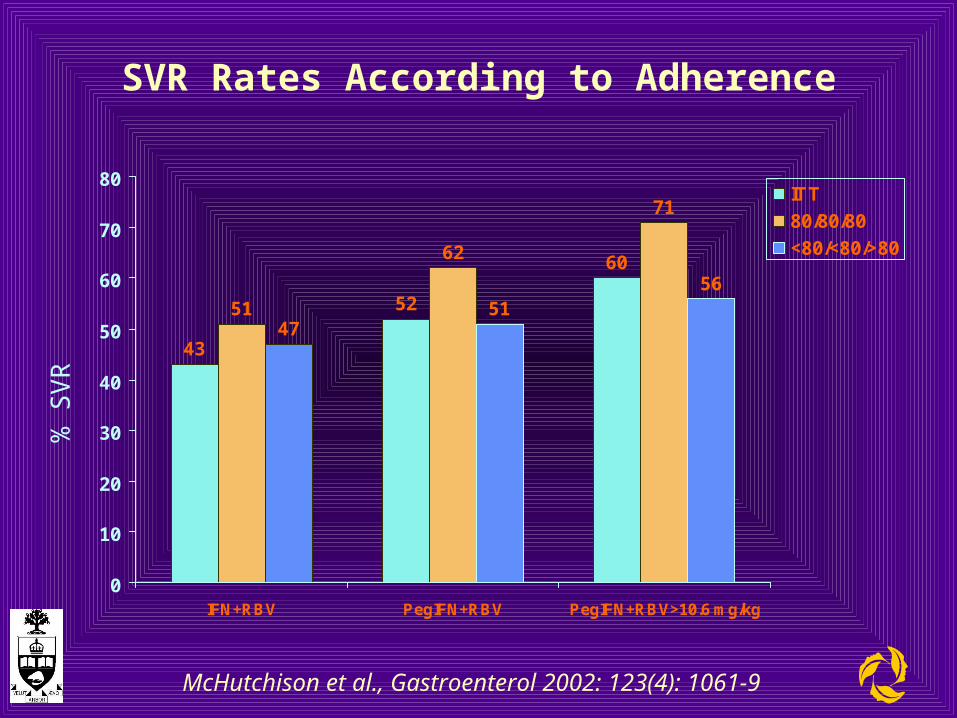
SVR Rates According to Adherence
McHutchison et al., Gastroenterol 2002: 123(4): 1061-9
43
52
60
51
62
71
4751
56
0
10
20
30
40
50
60
70
80
IFN+RBV PegIFN+RBV PegIFN+RBV>10.6 mg/kg
ITT
80/80/80
<80/<80/>80
% S
VR

Proportion of Patients Dispensed >12, 24 or 48 PegIntron Injections:
BIC Enrollees vs. Controls (matched groups)
72%
52%
22%
64%
41%
13%
0%
20%
40%
60%
80%
100%
12+ 24+ 48+
Number of Peg-Intron Injections Dispensed
BIC Control
n=780 n=638 n=333n=780 n=638 n=333
Per
cen
t o
f p
atie
nts
P= 0.0005
P<0.001
P=0.0020
72%
52%
22%
64%
41%
13%
0%
20%
40%
60%
80%
100%
12+ 24+ 48+
Number of Peg-Intron Injections Dispensed
BIC Control
n=780 n=638 n=333n=780 n=638 n=333
Per
cen
t o
f p
atie
nts
P= 0.0005
P<0.001
P=0.0020
Hussein et al, Schering-Plough data presented at ISPOR, Philadelphia, PA, USA, May 20-24, 2006
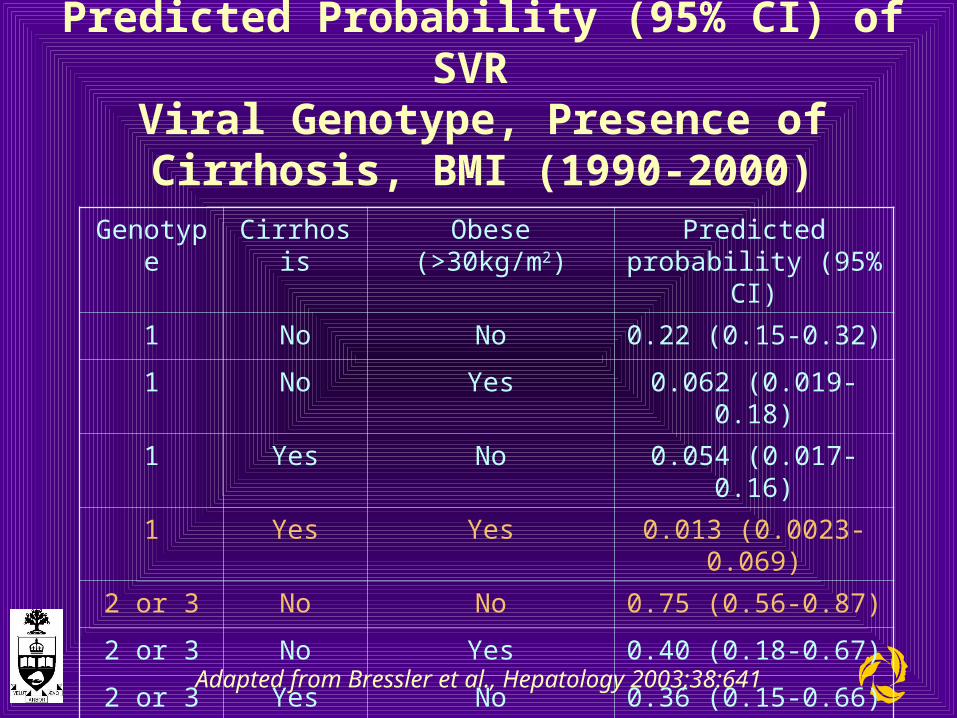
Predicted Probability (95% CI) of SVR Viral Genotype, Presence of Cirrhosis, BMI
(1990-2000)
Adapted from Bressler et al., Hepatology 2003;38:641
Genotype Cirrhosis Obese (>30kg/m2) Predicted probability (95% CI)
1 No No 0.22 (0.15-0.32)
1 No Yes 0.062 (0.019-0.18)
1 Yes No 0.054 (0.017-0.16)
1 Yes Yes 0.013 (0.0023-0.069)
2 or 3 No No 0.75 (0.56-0.87)
2 or 3 No Yes 0.40 (0.18-0.67)
2 or 3 Yes No 0.36 (0.15-0.66)
2 or 3 Yes Yes 0.12 (0.029-0.37)

Viral Factors that Influence Response to Therapy
• Genotype 2>3>4>1
• Baseline viral load (HVL v LVL)
• Viral load decline (RVR v SVR)
• Co-infection (HIV/HBV)
• Quasispecies development
• Virus interferes with function of crucial genes in several antiviral pathways
– ? Host dependent
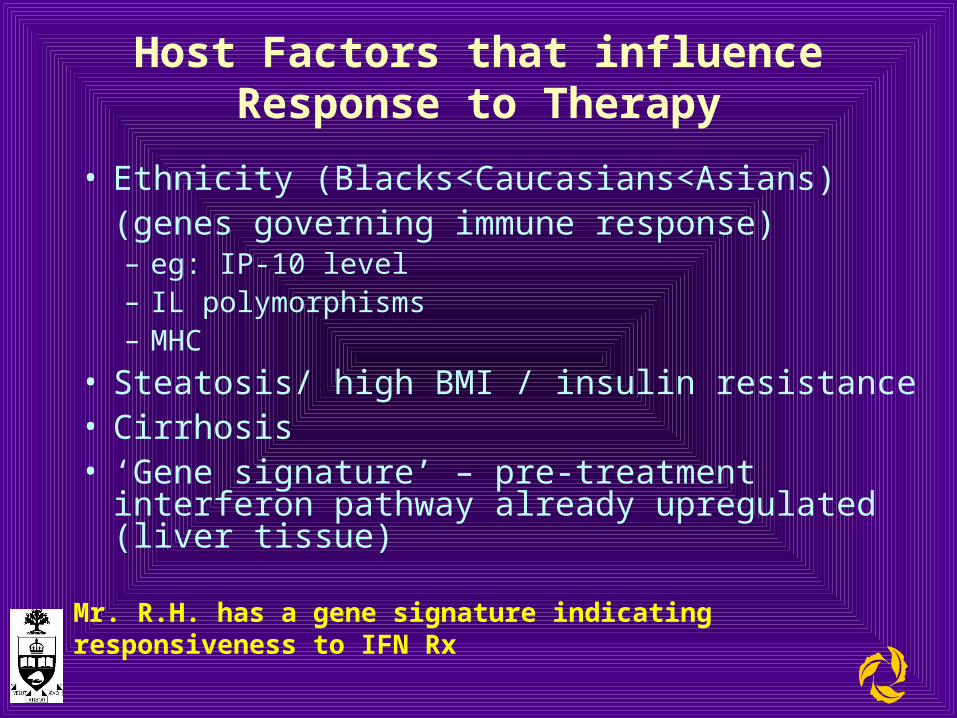
Host Factors that influence Response to Therapy
• Ethnicity (Blacks<Caucasians<Asians)(genes governing immune response) – eg: IP-10 level– IL polymorphisms– MHC
• Steatosis/ high BMI / insulin resistance• Cirrhosis• ‘Gene signature’ – pre-treatment interferon
pathway already upregulated (liver tissue)
Mr. R.H. has a gene signature indicating responsiveness to IFN Rx
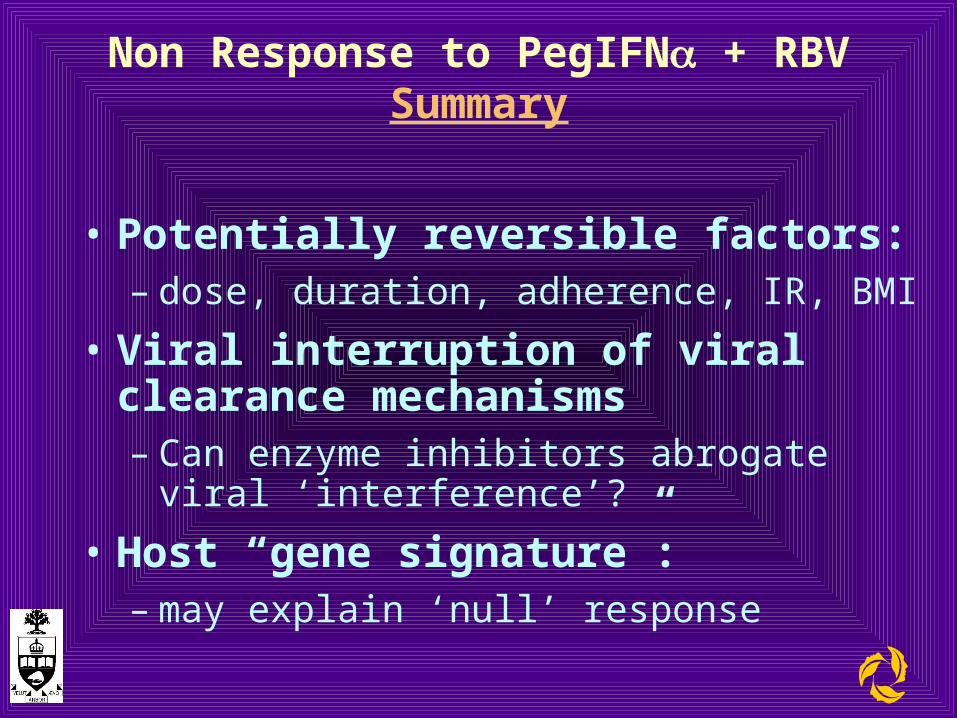
Non Response to PegIFN + RBVSummary
• Potentially reversible factors:– dose, duration, adherence, IR, BMI
• Viral interruption of viral clearance mechanisms– Can enzyme inhibitors abrogate viral
‘interference’?
• Host “gene signature”: – may explain ‘null’ response

QUESTIONS
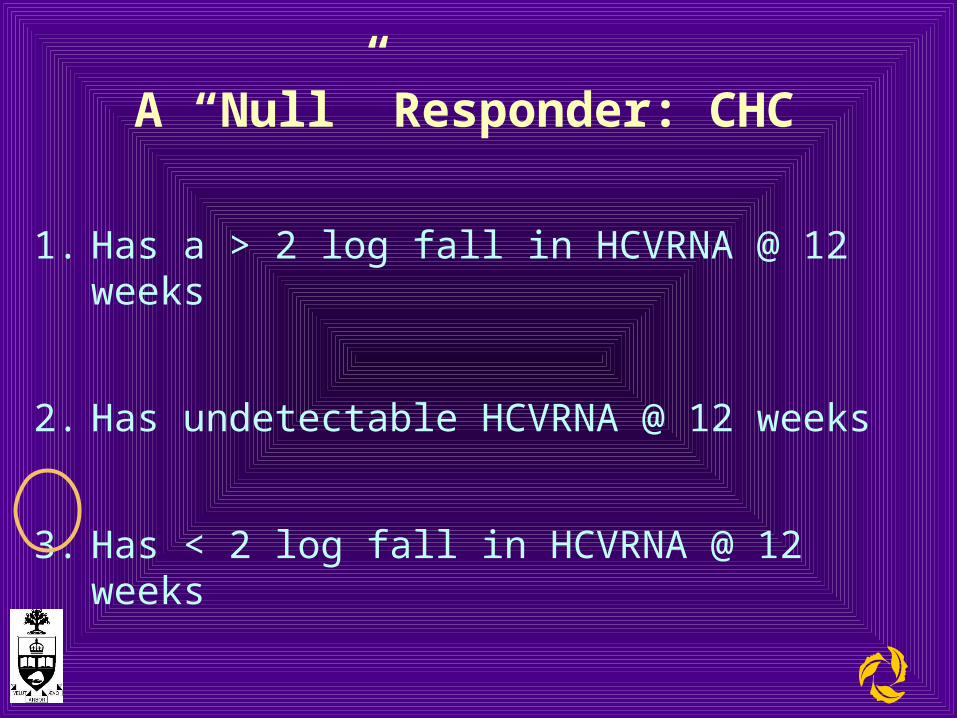
A “Null” Responder: CHC
1. Has a > 2 log fall in HCVRNA @ 12 weeks
2. Has undetectable HCVRNA @ 12 weeks
3. Has < 2 log fall in HCVRNA @ 12 weeks
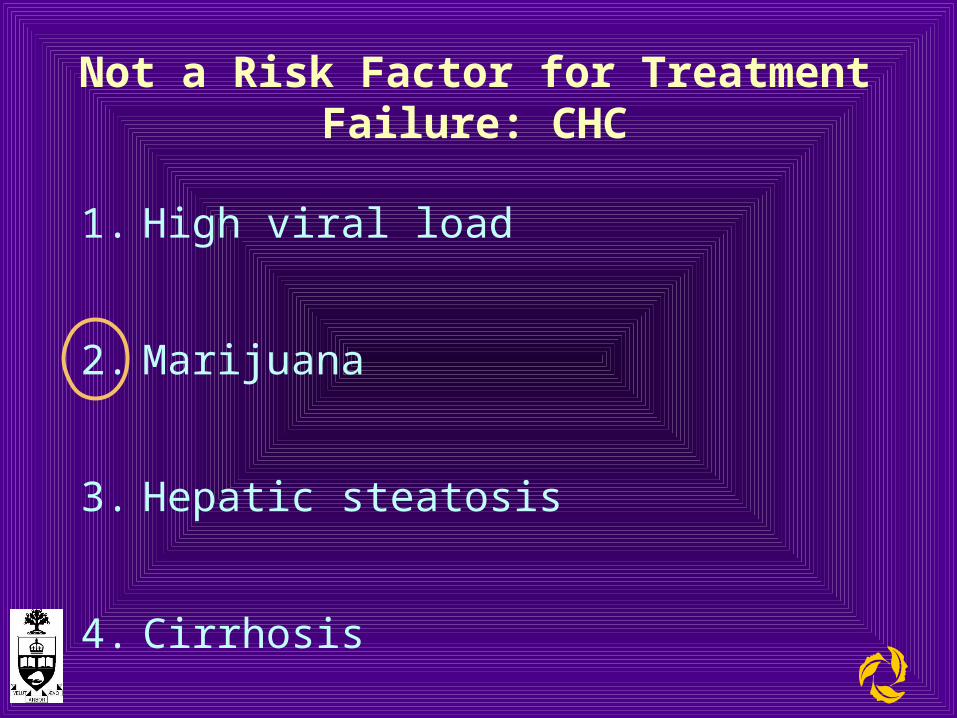
Not a Risk Factor for Treatment Failure: CHC
1. High viral load
2. Marijuana
3. Hepatic steatosis
4. Cirrhosis
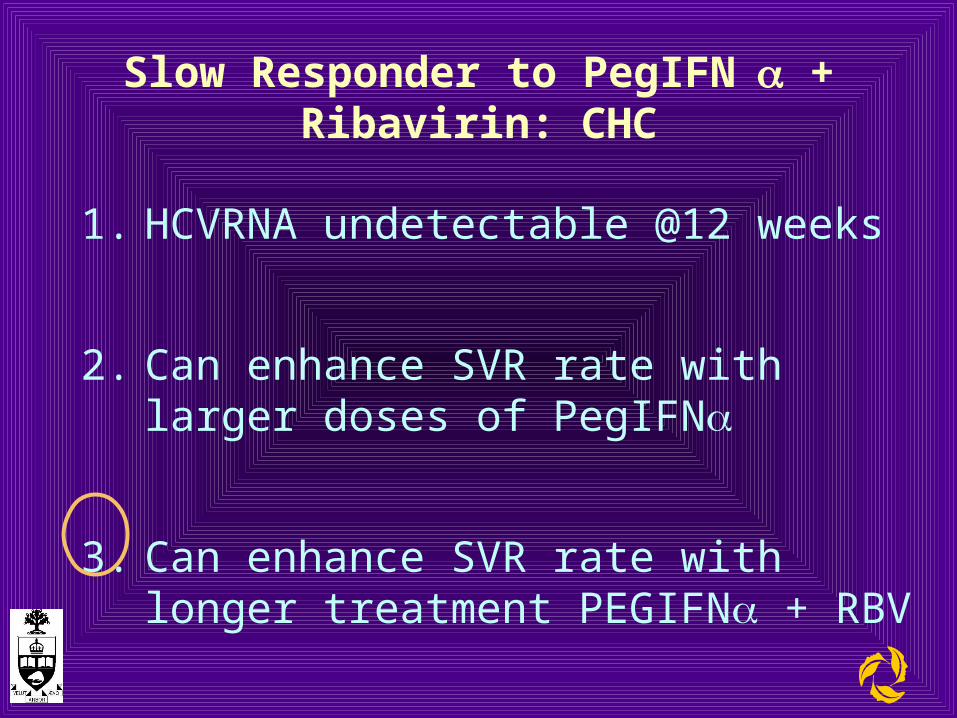
Slow Responder to PegIFN + Ribavirin: CHC
1. HCVRNA undetectable @12 weeks
2. Can enhance SVR rate with larger doses of PegIFN
3. Can enhance SVR rate with longer treatment PEGIFN + RBV
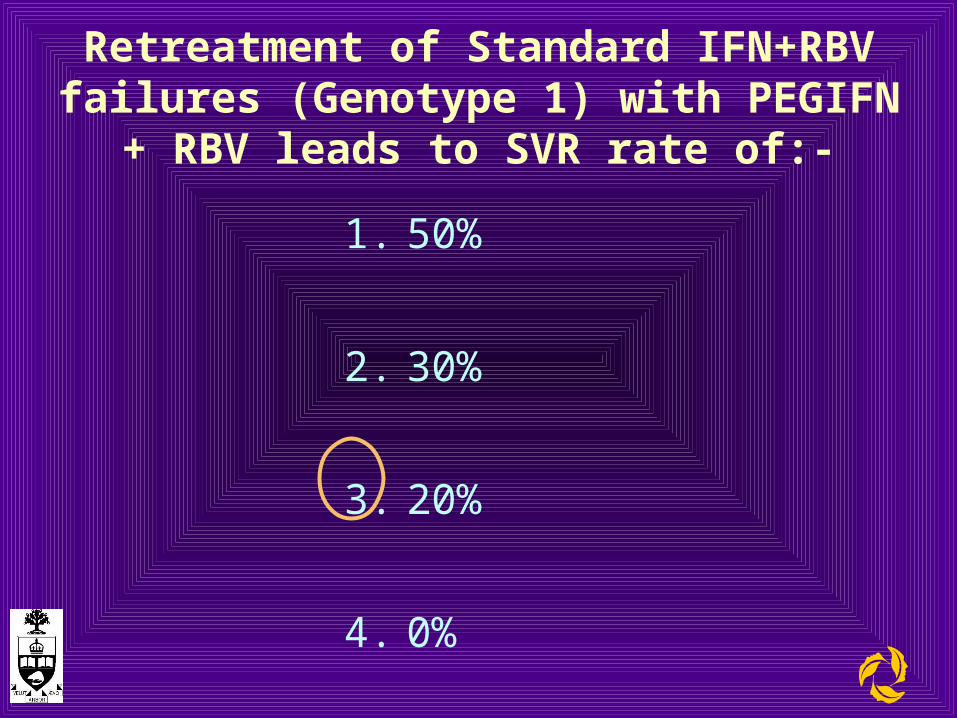
Retreatment of Standard IFN+RBV failures (Genotype 1) with PEGIFN + RBV leads to
SVR rate of:-
1. 50%
2. 30%
3. 20%
4. 0%