Embed Size (px)
Citation preview
1
JICA’s cooperation to promote High-Efficiency Coal Power Plants in Indonesia
November 29th, 2011
Japan International Cooperation Agency(JICA)
Seminar on The Project for Promotion of Clean Coal Technology (CCT ) in Indonesia
Contents
1. Relationship between Indonesia and Japan on coal2. Objective of the Project and schedule 3. Progress of the Project
(1) Background and issues to be addressed (2) Study of CCT Roadmap (3) Finalized CCT Roadmap (4) Model Power Plant study
2
3
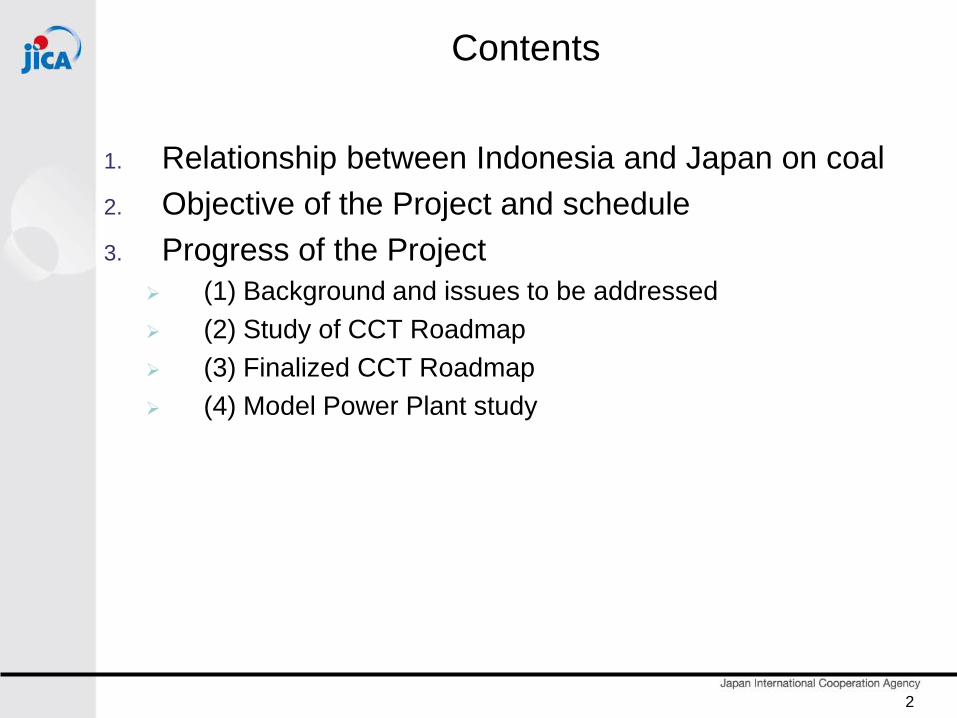
1. Relationship between Indonesia and Japan on coal
(1) Japan’s coal import (the Largest importer in the world) Total import of coal: 187million tons (2010) Approx. 80% of coal import from Australia (64%) and Indonesia
(18%) 99% of domestic consumptions depends on imported coal
(2) Indonesia’s coal export (2nd largest exporter in the world) Coal production increased 283 million tons in 2009 to be 325 million
tons in 2010 (14.8% increase) and predicted to be 335 to 350 million tons in 2011 (7.6% increase).
More than 70% of coal exported. Main destinations are India (16.7%), China (16.5%), South Korea (14.3%), Japan (13.8%) and Taiwan (10.6%).
(3) Cooperation needs for CCT introduction for efficient use Introduction of CCT to achieve highly efficient energy use
requested by Gov. of Indonesia (MEMR, PLN) Reduction of adverse environmental burden to cope with global
environmental issues such as GHG emissions
2. Objective of the Project and schedule(1/3)
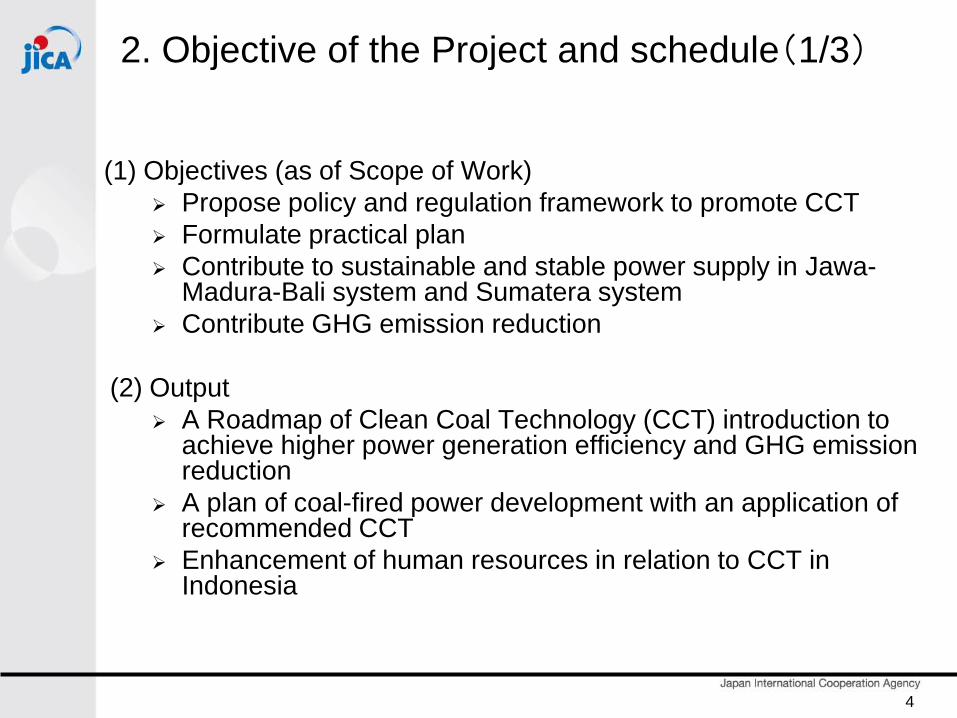
(1) Objectives (as of Scope of Work) Propose policy and regulation framework to promote CCT Formulate practical plan Contribute to sustainable and stable power supply in Jawa-
Madura-Bali system and Sumatera system Contribute GHG emission reduction
(2) Output A Roadmap of Clean Coal Technology (CCT) introduction to
achieve higher power generation efficiency and GHG emission reduction
A plan of coal-fired power development with an application of recommended CCT
Enhancement of human resources in relation to CCT in Indonesia
4
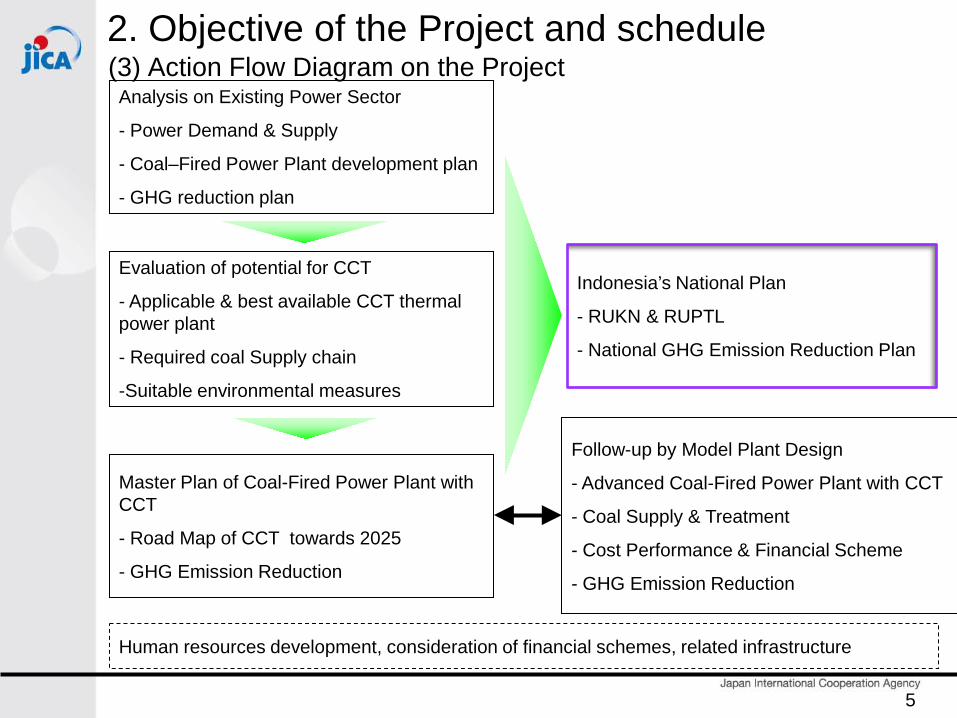
(3) Action Flow Diagram on the ProjectAnalysis on Existing Power Sector
- Power Demand & Supply
- Coal–Fired Power Plant development plan
- GHG reduction plan
Master Plan of Coal-Fired Power Plant with CCT
- Road Map of CCT towards 2025
- GHG Emission Reduction
Evaluation of potential for CCT
- Applicable & best available CCT thermal power plant
- Required coal Supply chain
-Suitable environmental measures
Follow-up by Model Plant Design
- Advanced Coal-Fired Power Plant with CCT
- Coal Supply & Treatment
- Cost Performance & Financial Scheme
- GHG Emission Reduction
Indonesia’s National Plan
- RUKN & RUPTL
- National GHG Emission Reduction Plan
Human resources development, consideration of financial schemes, related infrastructure
5
2. Objective of the Project and schedule
2. Objective of the Project and schedule(4) Schedule
6
Period2011 2012
4 5 6 7 8 9 10 11 12 1 2 3 4 5
Study stage
Work in Indonesia
Steering Committee
SeminarSite Reconnaissance StudyEnvironmental and Social Consideration Study
CP Training
OutcomeInception Draft Final
1st Steering Committee 3rd
Basic Study Pre-FS for CCT Model Power Plant
Site Reconnaissance Study
Final (July 2012)
1st Seminar 2nd
CCT Roadmap
1st SHM 2nd SHM 3rd
SEA study
IEE study
Interim
2nd Steering Committee
Contract
Contract
Roadmap Pre-FS
Period2011 2012
4 5 6 7 8 9 10 11 12 1 2 3 4 5
Study stage
Work in Indonesia
Steering Committee
Seminar
・Site Reconnaissance Study・Environmental and Social Consideration Study・Potential Study
CP Training
Outcome InceptionDraft Final
1st Steering Committee 4th
Basic Study Pre-FS for CCT Model Power Plant
Site Reconnaissance Study
Final (July 2012)
1st Seminar2nd
CCT Roadmap
1st SHM 2nd SHM3rd
IEE study
Interim
2nd Steering Committee
Contract
Contract
Roadmap Pre-FS
3rd Steering Committee
Potential StudyContract
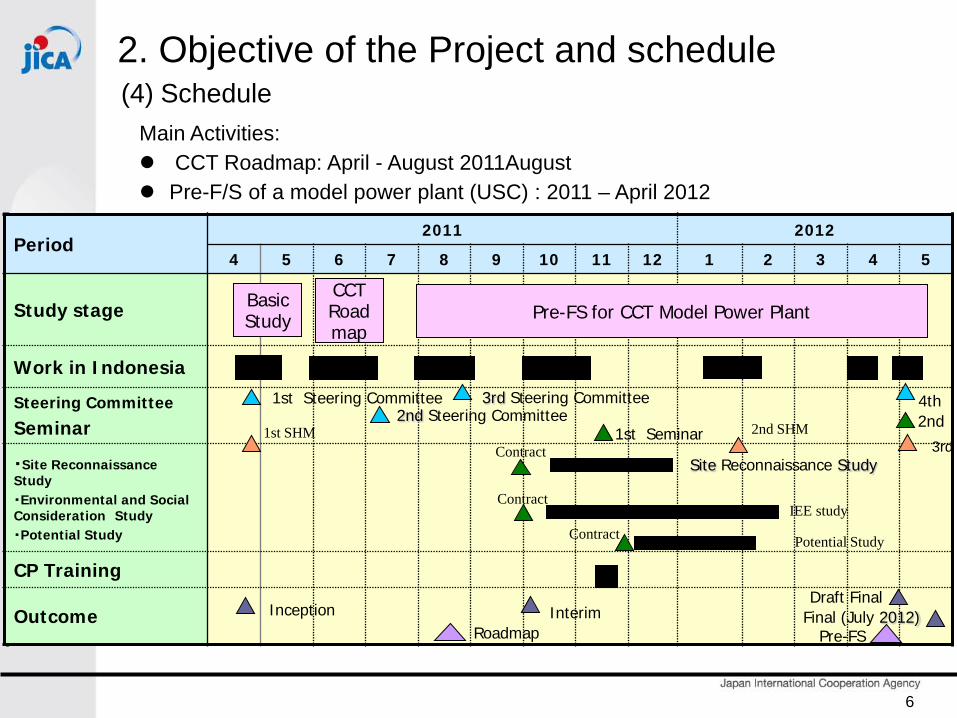
Main Activities: CCT Roadmap: April - August 2011August Pre-F/S of a model power plant (USC) : 2011 – April 2012
7
0.0
500.0
1,000.0
1,500.0
2010 2011 2012 2013 2014 2015 2016 2017 2018 2019
200
220
240
260
2009 2011 2013 2015 2017 2019
Growing Economy (CAGR)
Growing Population (CAGR)
Growing usage of electricity (CAGR)
Population (Mn)
0
100
200
300
400
2009 2010 2011 2012 2013 2014 2015 2016 2017 2018 2019
9.4%
136.6
334.4
Electricity Sales (TWh) +145%
0
1000
2000
3000
4000
2009 2011 2013 2015 2017 2019
GDP(IDR Tn)
2,177
3,9436.1%
256
231
1.1%
0%
25%
50%
75%
100%
2009 2011 2013 2015 2017 2019
Electrification ratio
65%91%3.4%
Rapidly growing demand for electricity (CAGR)
Energy Demand (Mil BOE)
712
1,316
7.1%
Growing energy demand (CAGR)
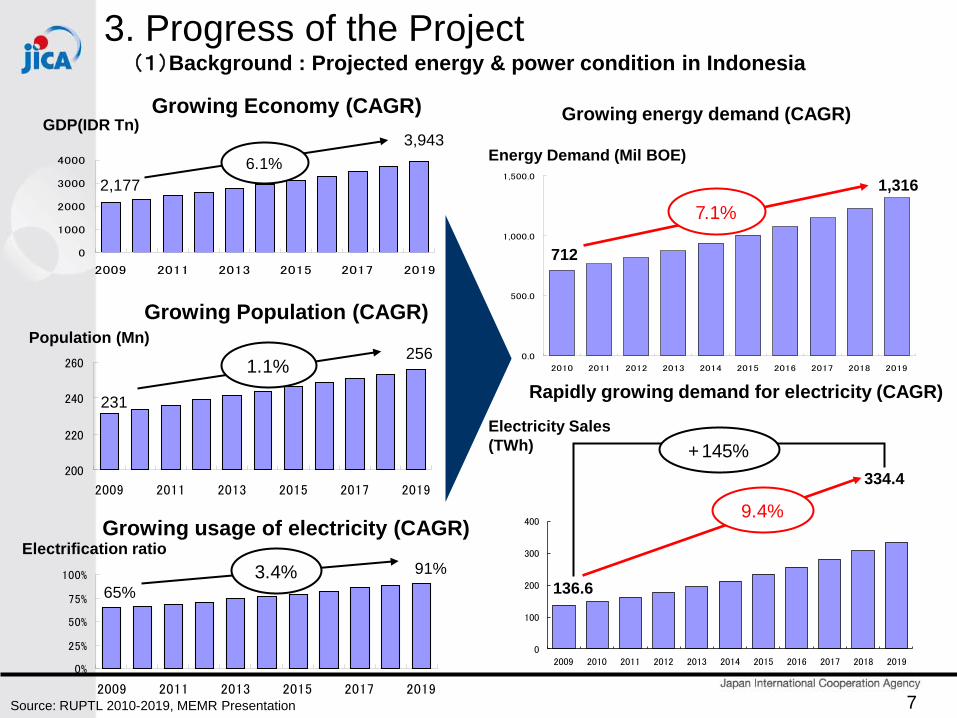
Source: RUPTL 2010-2019, MEMR Presentation
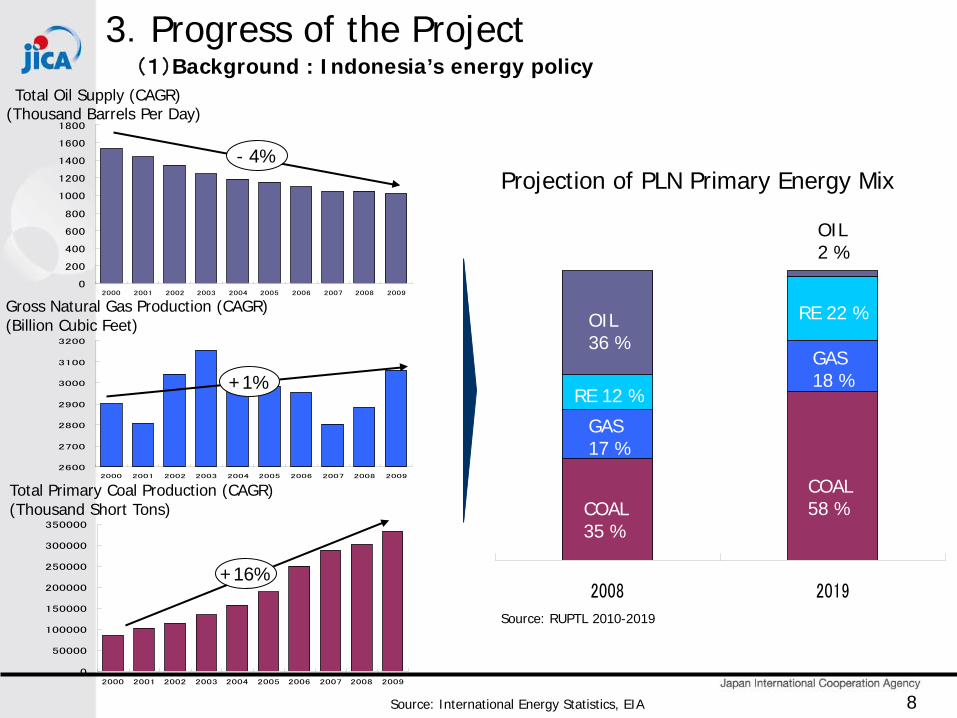
3. Progress of the Project(1)Background : Projected energy & power condition in Indonesia
2008 2019
0
200
400
600
800
1000
1200
1400
1600
1800
2000 2001 2002 2003 2004 2005 2006 2007 2008 2009
2600
2700
2800
2900
3000
3100
3200
2000 2001 2002 2003 2004 2005 2006 2007 2008 2009
Projection of PLN Primary Energy Mix
Source: RUPTL 2010-2019
Total Oil Supply (CAGR)
0
50000
100000
150000
200000
250000
300000
350000
2000 2001 2002 2003 2004 2005 2006 2007 2008 2009
(Thousand Barrels Per Day)
Gross Natural Gas Production (CAGR) (Billion Cubic Feet)
Total Primary Coal Production (CAGR) (Thousand Short Tons) COAL
35 %
GAS17 %
RE 12 %
OIL36 %
COAL58 %
GAS18 %
RE 22 %
OIL2 %
Source: International Energy Statistics, EIA
- 4%
+1%
+16%
3.Progress of the Project(1)Background : Indonesia’s energy policy
8
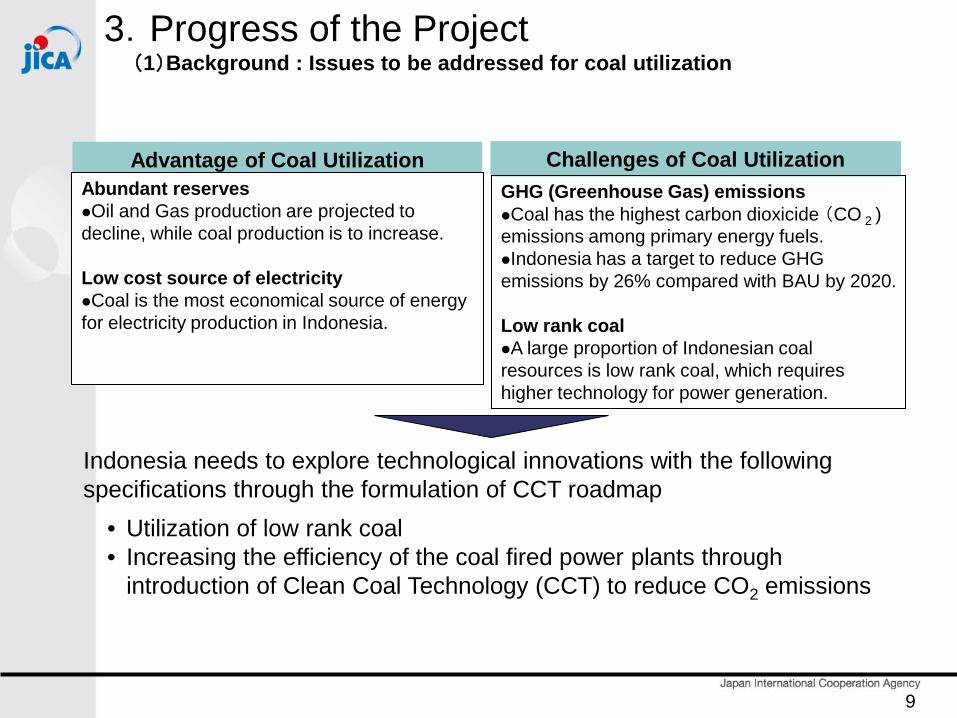
3.Progress of the Project(1)Background : Issues to be addressed for coal utilization
Challenges of Coal UtilizationAdvantage of Coal UtilizationAbundant reservesOil and Gas production are projected to decline, while coal production is to increase.
Low cost source of electricity Coal is the most economical source of energy for electricity production in Indonesia.
GHG (Greenhouse Gas) emissions Coal has the highest carbon dioxicide (CO 2 ) emissions among primary energy fuels.Indonesia has a target to reduce GHG emissions by 26% compared with BAU by 2020.
Low rank coalA large proportion of Indonesian coal resources is low rank coal, which requires higher technology for power generation.
Indonesia needs to explore technological innovations with the following specifications through the formulation of CCT roadmap
• Utilization of low rank coal• Increasing the efficiency of the coal fired power plants through
introduction of Clean Coal Technology (CCT) to reduce CO2 emissions
9
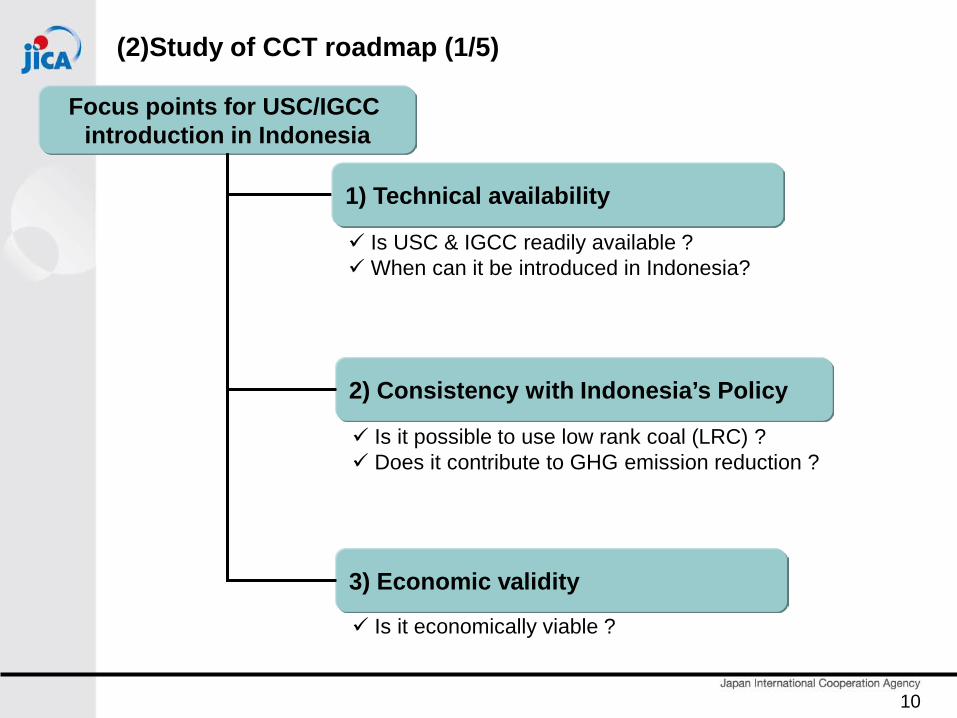
Focus points for USC/IGCC introduction in Indonesia
2) Consistency with Indonesia’s Policy
3) Economic validity
Is it possible to use low rank coal (LRC) ? Does it contribute to GHG emission reduction ?
Is USC & IGCC readily available ?When can it be introduced in Indonesia?
Is it economically viable ?
1) Technical availability
(2)Study of CCT roadmap (1/5)
10
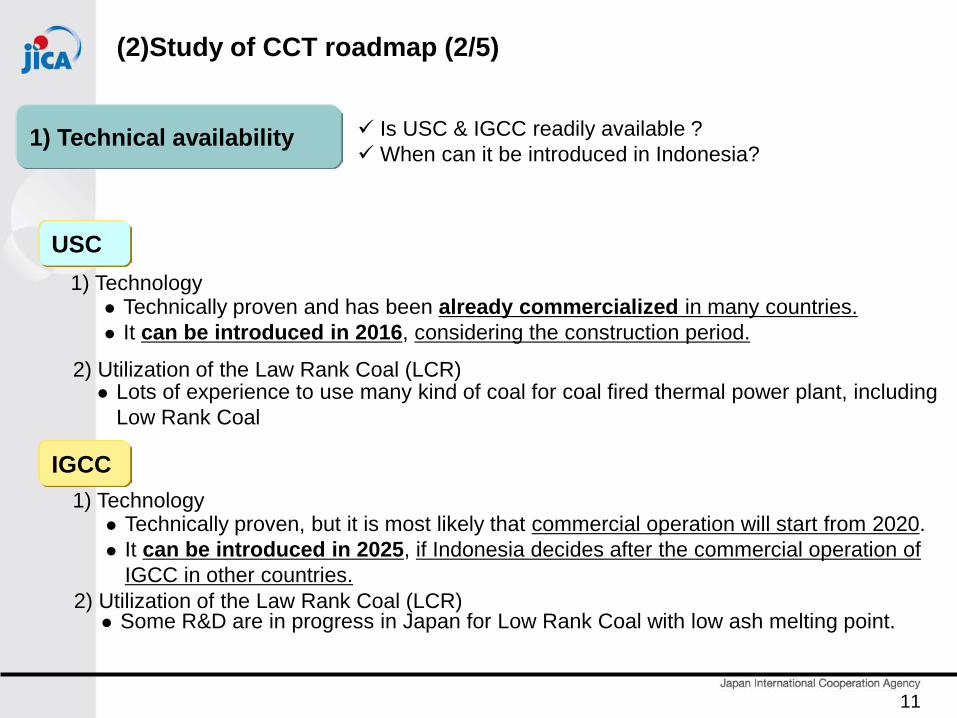
1) Technical availability Is USC & IGCC readily available ?When can it be introduced in Indonesia?
Technically proven and has been already commercialized in many countries. It can be introduced in 2016, considering the construction period.
USC
IGCC
Technically proven, but it is most likely that commercial operation will start from 2020. It can be introduced in 2025, if Indonesia decides after the commercial operation of
IGCC in other countries.
1) Technology
2) Utilization of the Law Rank Coal (LCR) Lots of experience to use many kind of coal for coal fired thermal power plant, including
Low Rank Coal
Some R&D are in progress in Japan for Low Rank Coal with low ash melting point.
1) Technology
2) Utilization of the Law Rank Coal (LCR)
(2)Study of CCT roadmap (2/5)
11
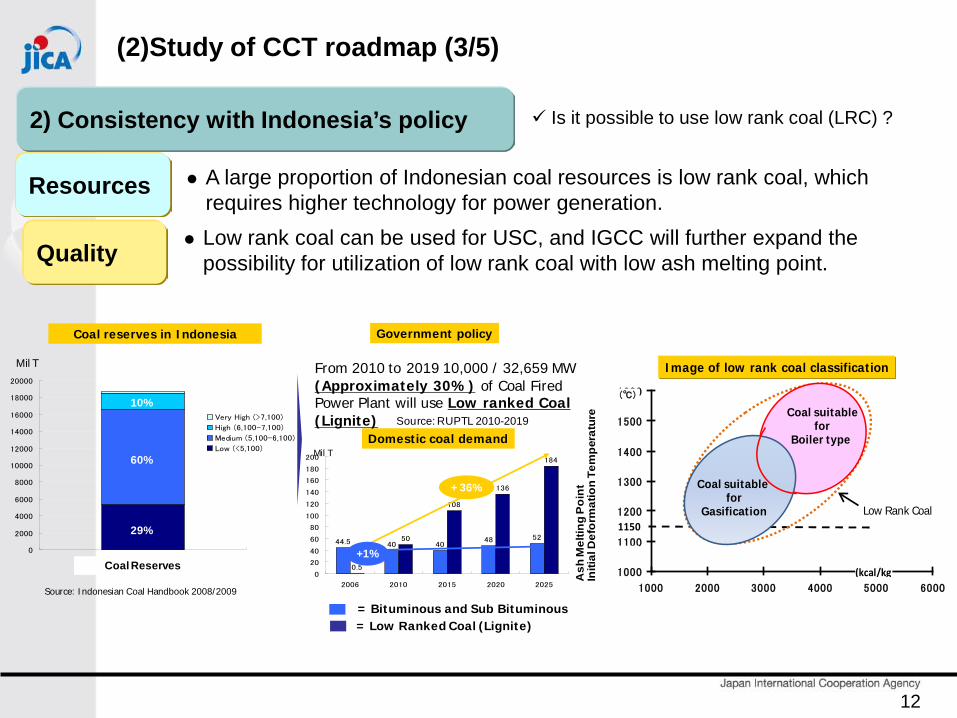
2) Consistency with Indonesia’s policy Is it possible to use low rank coal (LRC) ?
A large proportion of Indonesian coal resources is low rank coal, which requires higher technology for power generation.
Resources
Quality Low rank coal can be used for USC, and IGCC will further expand the possibility for utilization of low rank coal with low ash melting point.
1000
1100
1200
1300
1400
1500
1600
1000 2000 3000 4000 5000 6000
1150
(kcal/kg
(℃)
Ash
Mel
ting
Poi
ntIn
itial
Def
orm
atio
n Te
mpe
ratu
re
Low Rank Coal
Image of low rank coal classification
Coal suitablefor
Boiler type
Coal suitable for
Gasification
44.5 40 4048 52
0.5
50
108
136
184
0
20
40
60
80
100
120
140
160
180
200
2006 2010 2015 2020 2025
0
2000
4000
6000
8000
10000
12000
14000
16000
18000
20000
Reserves
Very High (>7,100)
High (6,100-7,100)
Medium (5,100-6,100)
Low (<5,100)
29%
60%
10%
Mil T
Coal Reserves
Source: Indonesian Coal Handbook 2008/2009
Domestic coal demand
+ 36%
+1%
Coal reserves in Indonesia
Mil T
Government policy
Source: RUPTL 2010-2019
From 2010 to 2019 10,000 / 32,659 MW (Approximately 30%) of Coal Fired Power Plant will use Low ranked Coal (Lignite)
= Bituminous and Sub Bituminous= Low Ranked Coal (Lignite)
(2)Study of CCT roadmap (3/5)
12
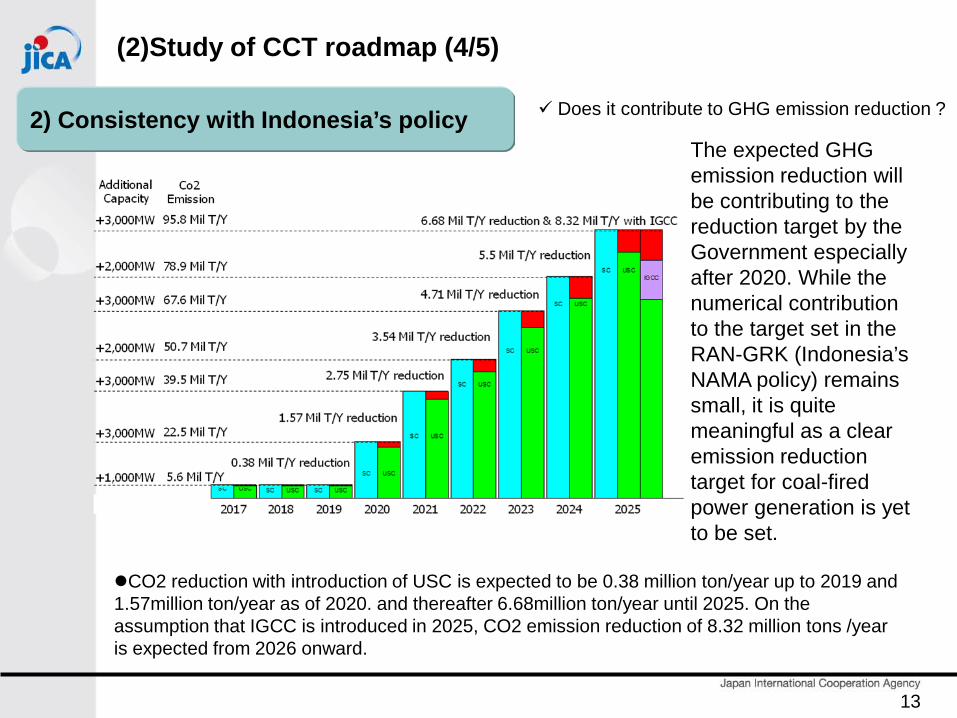
CO2 reduction with introduction of USC is expected to be 0.38 million ton/year up to 2019 and 1.57million ton/year as of 2020. and thereafter 6.68million ton/year until 2025. On the assumption that IGCC is introduced in 2025, CO2 emission reduction of 8.32 million tons /year is expected from 2026 onward.
2) Consistency with Indonesia’s policyThe expected GHG emission reduction will be contributing to the reduction target by the Government especially after 2020. While the numerical contribution to the target set in the RAN-GRK (Indonesia’s NAMA policy) remains small, it is quite meaningful as a clear emission reduction target for coal-fired power generation is yet to be set.
Does it contribute to GHG emission reduction ?
(2)Study of CCT roadmap (4/5)
13
5.3
5.4
5.5
5.6
5.7
5.8
5.9
5.3
5.4
5.5
5.6
5.7
5.8
5.9
5.3
5.4
5.5
5.6
5.7
5.8
5.9
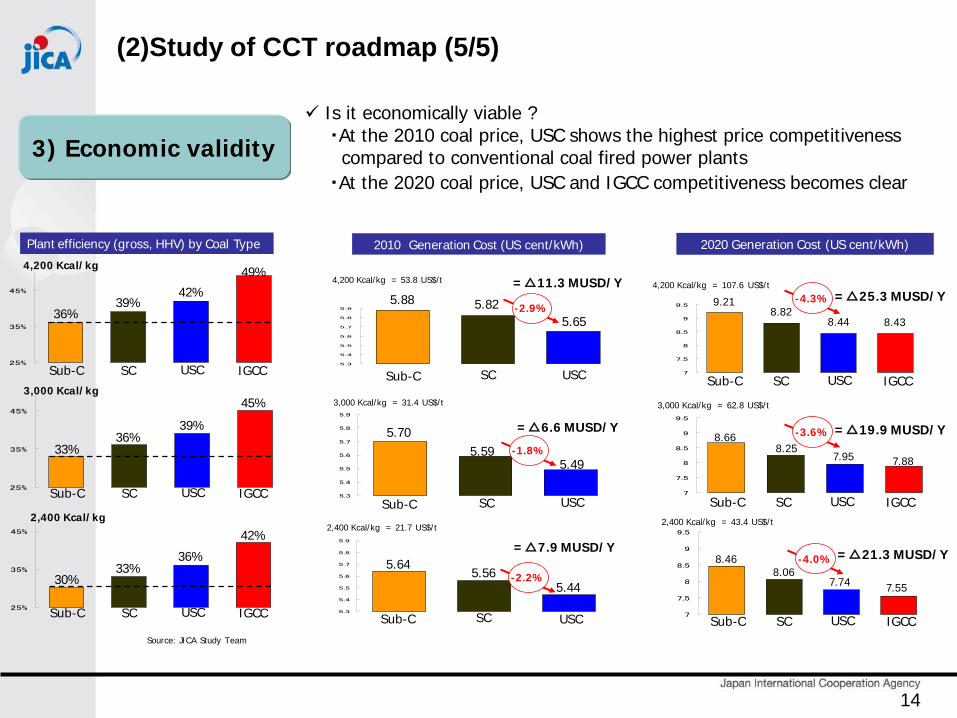
Plant efficiency (gross, HHV) by Coal Type
Source: JICA Study Team
25%
35%
45%
25%
35%
45%
25%
35%
45%
Sub-C SC USC IGCC
Sub-C SC USC IGCC
Sub-C SC USC IGCC
36%39%
42%
49%
33%36%
39%
45%
30%33%
36%
42%
4,200 Kcal/kg
3,000 Kcal/kg
2,400 Kcal/kg
Sub-C SC USC
Sub-C SC USC
Sub-C SC USC
5.88 5.82 5.65
5.70 5.59
5.49
5.64 5.56
5.44
2010 Generation Cost (US cent/kWh)
-2.9%
-2.2%
-1.8%
=△11.3 MUSD/Y
=△6.6 MUSD/Y
=△7.9 MUSD/Y
4,200 Kcal/kg = 53.8 US$/t
3,000 Kcal/kg = 31.4 US$/t
2,400 Kcal/kg = 21.7 US$/t
7
7.5
8
8.5
9
9.5
7
7.5
8
8.5
9
9.5
7
7.5
8
8.5
9
9.5
9.218.82
8.44 8.43
8.668.25
7.95 7.88
8.468.06
7.74 7.55
Sub-C SC USC IGCC
Sub-C SC USC IGCC
Sub-C SC USC IGCC
2020 Generation Cost (US cent/kWh)
-4.3%
-3.6%
-4.0%
=△25.3 MUSD/Y
=△19.9 MUSD/Y
=△21.3 MUSD/Y
4,200 Kcal/kg = 107.6 US$/t
3,000 Kcal/kg = 62.8 US$/t
2,400 Kcal/kg = 43.4 US$/t
3) Economic validity Is it economically viable ?
・At the 2010 coal price, USC shows the highest price competitiveness compared to conventional coal fired power plants
・At the 2020 coal price, USC and IGCC competitiveness becomes clear
(2)Study of CCT roadmap (5/5)
14
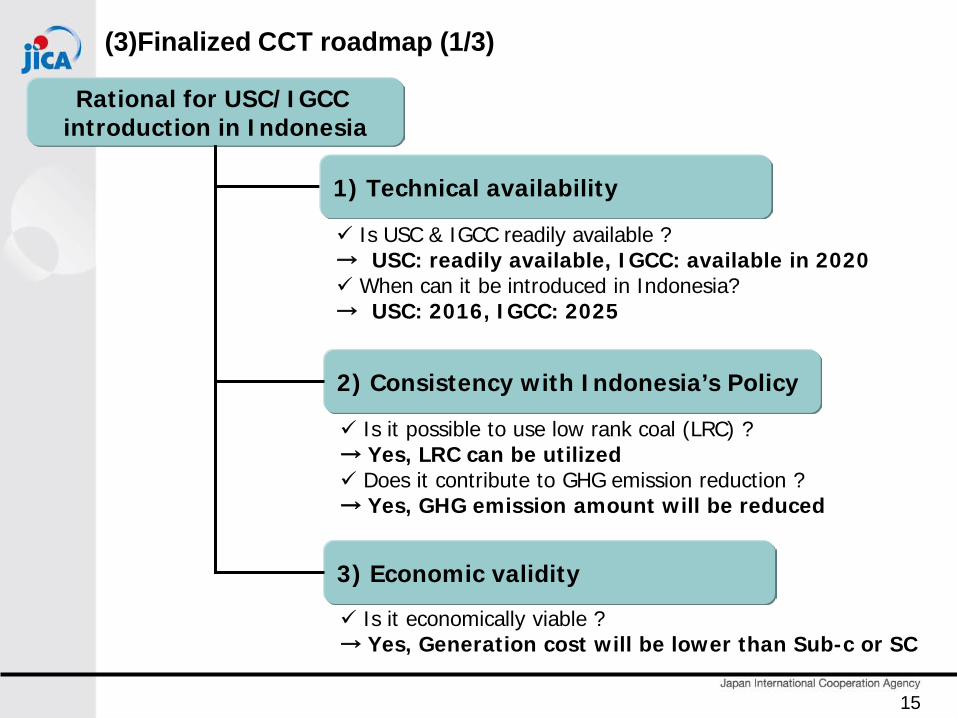
(3)Finalized CCT roadmap (1/3)
Rational for USC/IGCC introduction in Indonesia
2) Consistency with Indonesia’s Policy
3) Economic validity
Is it possible to use low rank coal (LRC) ?→ Yes, LRC can be utilized Does it contribute to GHG emission reduction ?→ Yes, GHG emission amount will be reduced
Is USC & IGCC readily available ?→ USC: readily available, IGCC: available in 2020 When can it be introduced in Indonesia?→ USC: 2016, IGCC: 2025
Is it economically viable ?→ Yes, Generation cost will be lower than Sub-c or SC
1) Technical availability
15
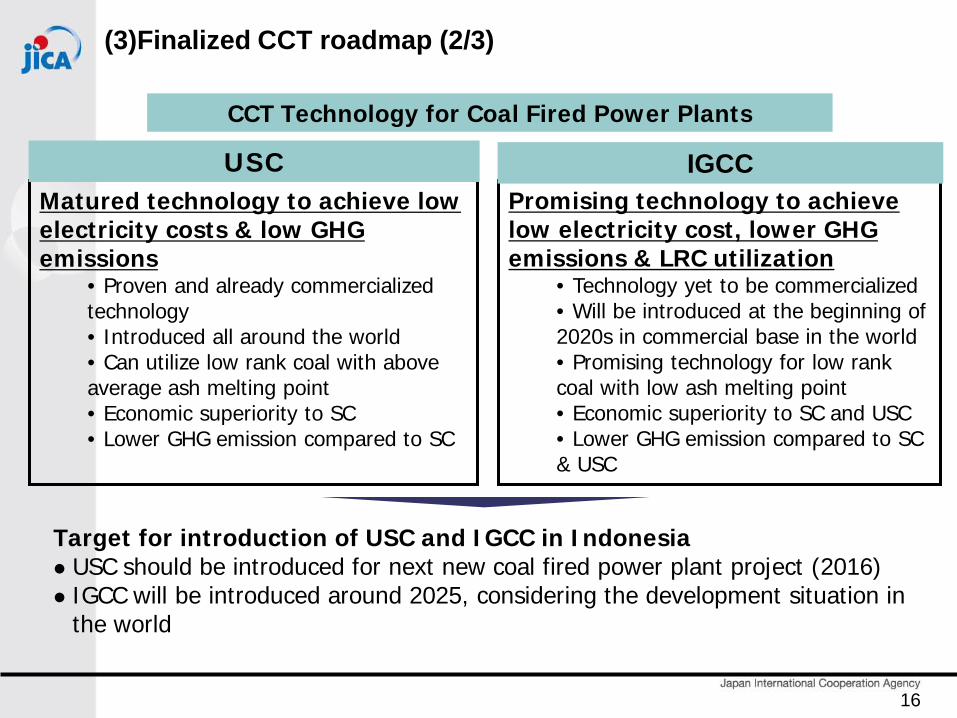
Target for introduction of USC and IGCC in Indonesia USC should be introduced for next new coal fired power plant project (2016) IGCC will be introduced around 2025, considering the development situation in
the world
CCT Technology for Coal Fired Power Plants
Matured technology to achieve lowelectricity costs & low GHGemissions
• Proven and already commercialized technology• Introduced all around the world• Can utilize low rank coal with above average ash melting point• Economic superiority to SC• Lower GHG emission compared to SC
Promising technology to achievelow electricity cost, lower GHG emissions & LRC utilization
• Technology yet to be commercialized• Will be introduced at the beginning of 2020s in commercial base in the world • Promising technology for low rank coal with low ash melting point• Economic superiority to SC and USC • Lower GHG emission compared to SC & USC
USC IGCC
(3)Finalized CCT roadmap (2/3)
16
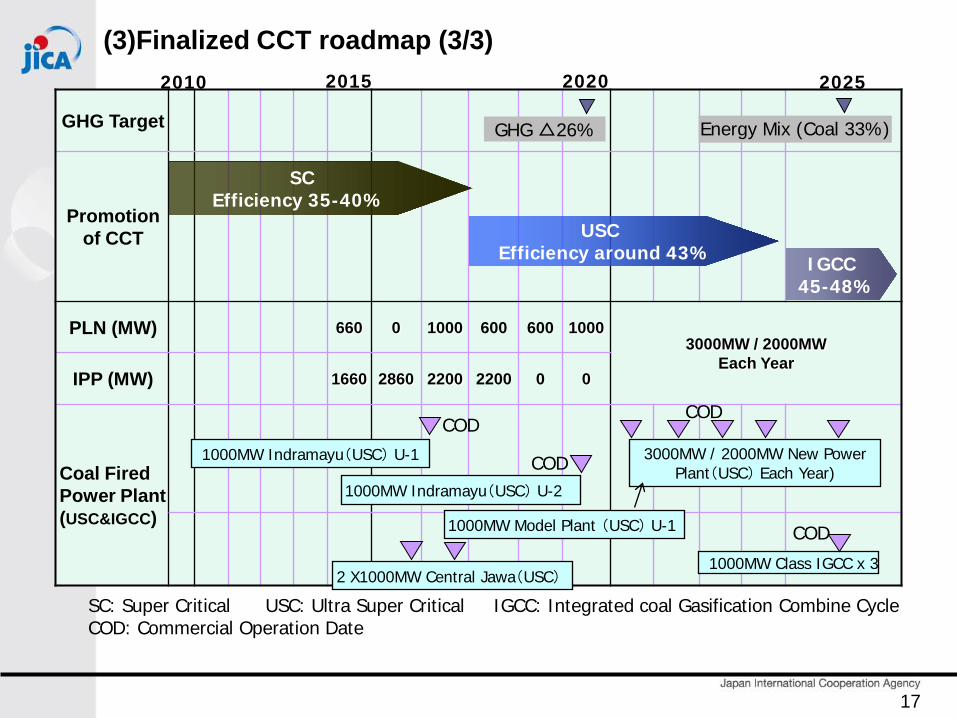
GHG Target
Promotion of CCT
PLN (MW) 660 0 1000 600 600 10003000MW / 2000MW
Each YearIPP (MW) 1660 2860 2200 2200 0 0
Coal Fired Power Plant (USC&IGCC)
GHG △26% Energy Mix (Coal 33%)
1000MW Model Plant (USC) U-1
1000MW Indramayu(USC) U-1
1000MW Indramayu(USC) U-2
3000MW / 2000MW New Power Plant(USC) Each Year)
COD
1000MW Class IGCC x 3
COD
COD
COD
SC: Super Critical USC: Ultra Super Critical IGCC: Integrated coal Gasification Combine Cycle COD: Commercial Operation Date
2010 2015 2020 2025
SCEfficiency 35-40%
USC Efficiency around 43% IGCC
45-48%
2 X1000MW Central Jawa(USC)
(3)Finalized CCT roadmap (3/3)
17
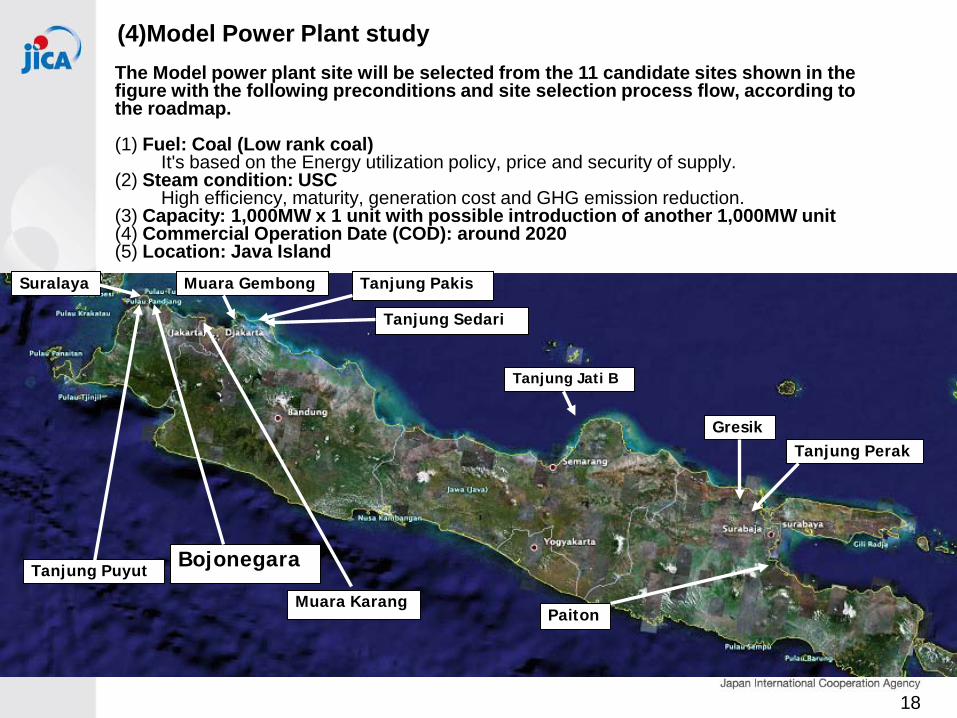
Suralaya
Tanjung Puyut Bojonegara
Muara Karang
Muara Gembong Tanjung Pakis
Tanjung Sedari
Tanjung Jati B
GresikTanjung Perak
Paiton
(4)Model Power Plant studyThe Model power plant site will be selected from the 11 candidate sites shown in the figure with the following preconditions and site selection process flow, according to the roadmap.
(1) Fuel: Coal (Low rank coal)It's based on the Energy utilization policy, price and security of supply.
(2) Steam condition: USCHigh efficiency, maturity, generation cost and GHG emission reduction.
(3) Capacity: 1,000MW x 1 unit with possible introduction of another 1,000MW unit(4) Commercial Operation Date (COD): around 2020(5) Location: Java Island
18
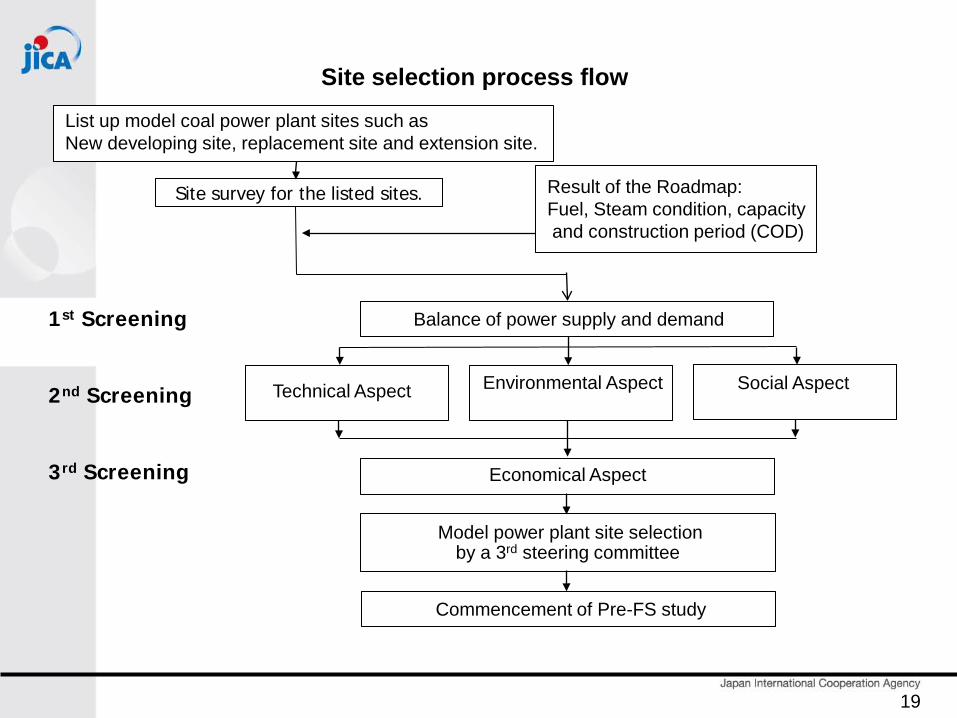
Site survey for the listed sites.
List up model coal power plant sites such as New developing site, replacement site and extension site.
Result of the Roadmap:Fuel, Steam condition, capacityand construction period (COD)
Site selection process flow
1st Screening
2nd Screening
3rd Screening
Technical Aspect
Balance of power supply and demand
Environmental Aspect Social Aspect
Economical Aspect
Model power plant site selection by a 3rd steering committee
Commencement of Pre-FS study
19