Embed Size (px)
Citation preview
August 2009
OFFICE OF CHIEF ECONOMIST
IInnddoonneessiiaa UUppddaattee
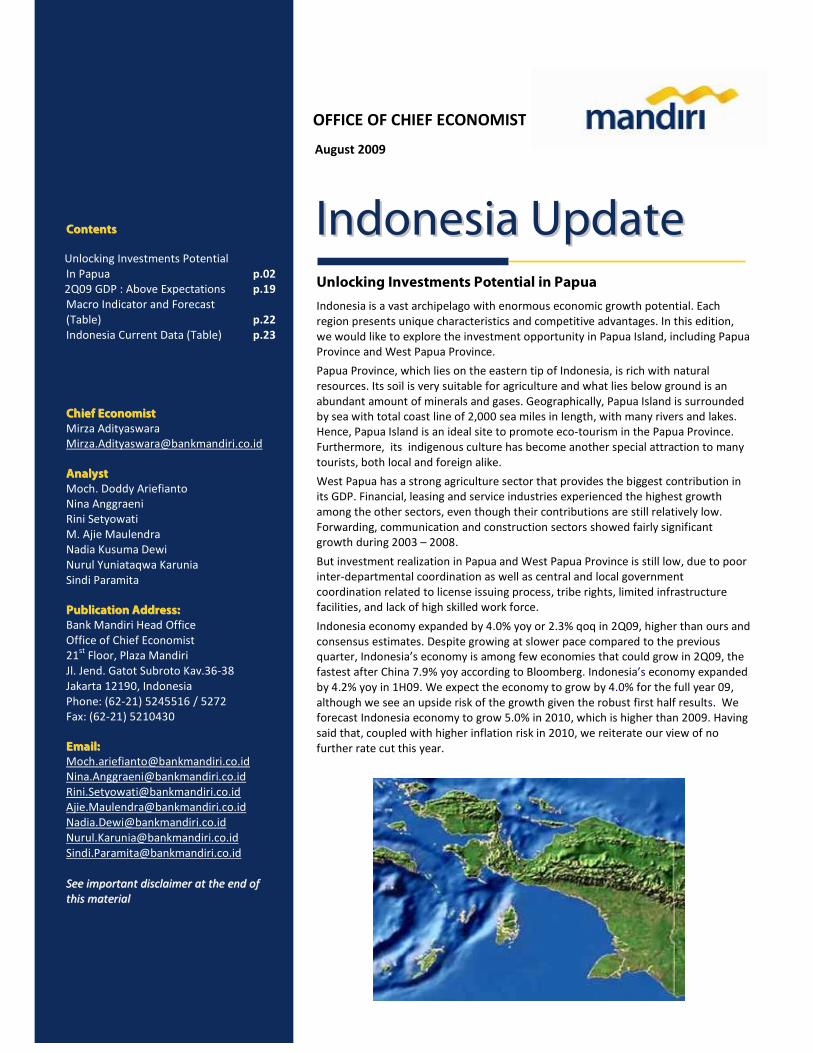
Unlocking Investments Potential in Papua
Indonesia is a vast archipelago with enormous economic growth potential. Each
region presents unique characteristics and competitive advantages. In this edition,
we would like to explore the investment opportunity in Papua Island, including Papua
Province and West Papua Province.
Papua Province, which lies on the eastern tip of Indonesia, is rich with natural
resources. Its soil is very suitable for agriculture and what lies below ground is an
abundant amount of minerals and gases. Geographically, Papua Island is surrounded
by sea with total coast line of 2,000 sea miles in length, with many rivers and lakes.
Hence, Papua Island is an ideal site to promote eco-tourism in the Papua Province.
Furthermore, its indigenous culture has become another special attraction to many
tourists, both local and foreign alike.
West Papua has a strong agriculture sector that provides the biggest contribution in
its GDP. Financial, leasing and service industries experienced the highest growth
among the other sectors, even though their contributions are still relatively low.
Forwarding, communication and construction sectors showed fairly significant
growth during 2003 – 2008.
But investment realization in Papua and West Papua Province is still low, due to poor
inter-departmental coordination as well as central and local government
coordination related to license issuing process, tribe rights, limited infrastructure
facilities, and lack of high skilled work force.
Indonesia economy expanded by 4.0% yoy or 2.3% qoq in 2Q09, higher than ours and
consensus estimates. Despite growing at slower pace compared to the previous
quarter, Indonesia’s economy is among few economies that could grow in 2Q09, the
fastest after China 7.9% yoy according to Bloomberg. Indonesia’s economy expanded
by 4.2% yoy in 1H09. We expect the economy to grow by 4.0% for the full year 09,
although we see an upside risk of the growth given the robust first half results. We
forecast Indonesia economy to grow 5.0% in 2010, which is higher than 2009. Having
said that, coupled with higher inflation risk in 2010, we reiterate our view of no
further rate cut this year.
CCoonntteennttss
Unlocking Investments Potential
In Papua
p.02
2Q09 GDP : Above Expectations p.19
Macro Indicator and Forecast
(Table)
p.22
Indonesia Current Data (Table) p.23
CChhiieeff EEccoonnoommiisstt
Mirza Adityaswara
AAnnaallyysstt
Moch. Doddy Ariefianto
Nina Anggraeni
Rini Setyowati
M. Ajie Maulendra
Nadia Kusuma Dewi
Nurul Yuniataqwa Karunia
Sindi Paramita
PPuubblliiccaattiioonn AAddddrreessss::
Bank Mandiri Head Office
Office of Chief Economist
21st
Floor, Plaza Mandiri
Jl. Jend. Gatot Subroto Kav.36-38
Jakarta 12190, Indonesia
Phone: (62-21) 5245516 / 5272
Fax: (62-21) 5210430
EEmmaaiill::
SSeeee iimmppoorrttaanntt ddiissccllaaiimmeerr aatt tthhee eenndd ooff
tthhiiss mmaatteerriiaall
© Office of Chief Economist Page 2 of 24
Indonesia is a vast archipelago with enormous economic
growth potential. Each region in this country has different
characteristic and competitive advantages. Hence, regional
development policies issued by each regional government that
focus on its competitive advantage is expected to optimize the
economic growth.
Considering the importance of regional economic potency,
Bank Mandiri Office of Chief Economist initiates to conduct
some regional potency studies. One of our studies is Papua
island economic potency that will capture Papua Province and
West Papua Province. We choose this region to analyze
because of many reasons as follows:
1. The significant size of Papua island in Eastern Part of
Indonesia (KTI), where KTI itself has become the big target
of development in Indonesia further. So far, the country’s
development is stressed more in Java island;
2. Papua Island owns a various number of natural resources
which are not fully explored yet because of its poor
infrastructure condition and lack of human resources
capability;
3. Papua is one among the regions that achieve special
autonomous status from the Central Government.
The aim of this study is also to make a preliminary study
before a seminar titled ”Papua Investment Day” which will be
conducted in October 2009.
This study will be undergone in two editions of our Indonesia
Update. The first edition will focus on the sector of economic
potency in Papua Province and West Papua Province, despite
the investment development of those two provinces. While
the second will be stressed on strategic aspects that has big
influence to the investment in Papua, such as decentralization
and region enlargement, migration, special autonomous,
regional fiscal policy, banking sector, investment obstacles
that will involve infrastructure development, human
resources, and local land regulation, as well as input in the
policy.
UNLOCKING INVESTMENTS POTENTIAL IN PAPUA Nadia Kusuma Dewi ([email protected]) M. Ajie Maulendra ([email protected])
© Office of Chief Economist Page 3 of 24
A. ECONOMIC POTENCY IN PAPUA PROVINCE
Regional Gross Domestic Product of Papua Province
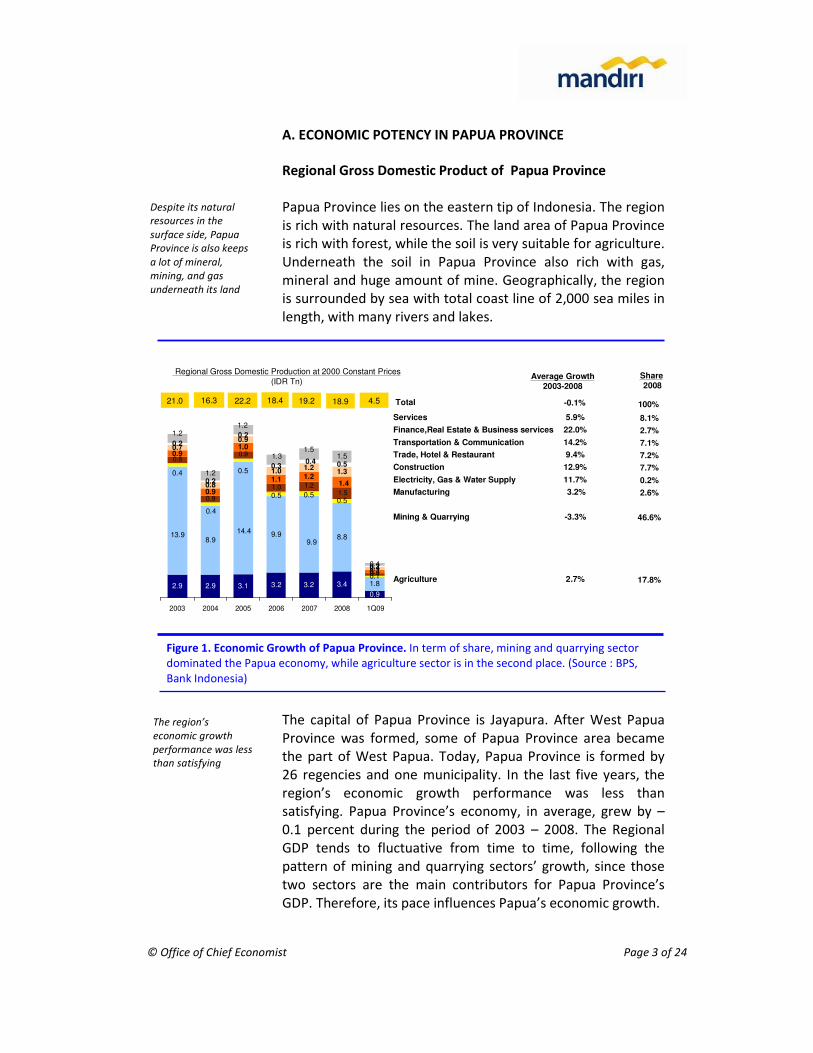
Papua Province lies on the eastern tip of Indonesia. The region
is rich with natural resources. The land area of Papua Province
is rich with forest, while the soil is very suitable for agriculture.
Underneath the soil in Papua Province also rich with gas,
mineral and huge amount of mine. Geographically, the region
is surrounded by sea with total coast line of 2,000 sea miles in
length, with many rivers and lakes.
The capital of Papua Province is Jayapura. After West Papua
Province was formed, some of Papua Province area became
the part of West Papua. Today, Papua Province is formed by
26 regencies and one municipality. In the last five years, the
region’s economic growth performance was less than
satisfying. Papua Province’s economy, in average, grew by –
0.1 percent during the period of 2003 – 2008. The Regional
GDP tends to fluctuative from time to time, following the
pattern of mining and quarrying sectors’ growth, since those
two sectors are the main contributors for Papua Province’s
GDP. Therefore, its pace influences Papua’s economic growth.
Despite its natural
resources in the
surface side, Papua
Province is also keeps
a lot of mineral,
mining, and gas
underneath its land
The region’s
economic growth
performance was less
than satisfying
Figure 1. Economic Growth of Papua Province. In term of share, mining and quarrying sector
dominated the Papua economy, while agriculture sector is in the second place. (Source : BPS,
Bank Indonesia)
Regional Gross Domestic Production at 2000 Constant Prices
(IDR Tn)
2.9 2.9 3.1 3.2 3.2 3.4
0.9
8.99.9 8.8
1.8
0.5
0.1
0.8
0.9
0.9
1.0 1.2
0.4
0.9
0.9
1.0
1.1
0.4
0.7
0.8
0.9
1.0 1.3
0.4
0.2
0.2
0.2
0.3 0.5
0.2
1.5
0.4
9.913.9
14.4
0.50.5
0.5
0.4
0.4
1.5
1.41.2
1.20.4
1.51.3
1.2
1.2
1.2
2003 2004 2005 2006 2007 2008 1Q09
Services
Finance,Real Estate & Business services
Transportation & Communication
Trade, Hotel & Restaurant
Construction
Electricity, Gas & Water Supply
Manufacturing
Mining & Quarrying
Agriculture
Average Growth2003-2008
5.9%
22.0%
14.2%
9.4%
12.9%
11.7%
3.2%
-3.3%
2.7%
21.0 16.3 22.2 18.4 19.2 Total -0.1%18.9 4.5
Share 2008
8.1%
2.7%
7.1%
7.2%
7.7%
0.2%
2.6%
46.6%
17.8%
100%
© Office of Chief Economist Page 4 of 24
Opportunity in Mining and Quarrying Sectors
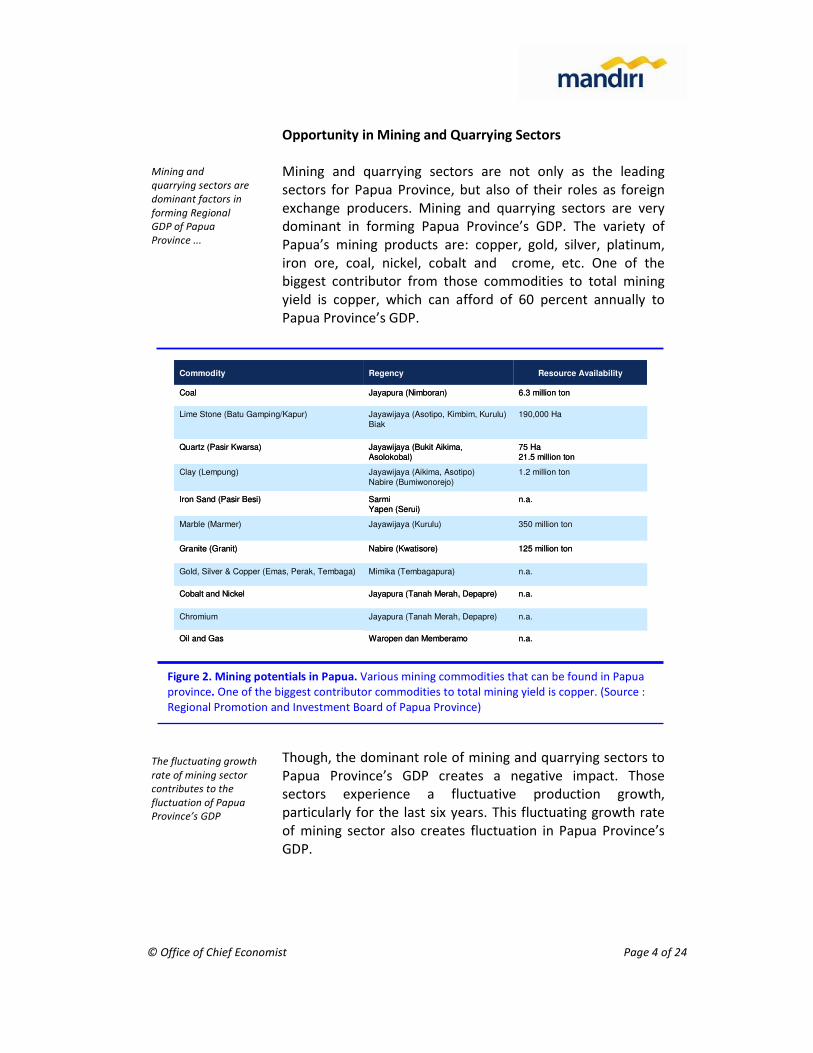
Mining and quarrying sectors are not only as the leading
sectors for Papua Province, but also of their roles as foreign
exchange producers. Mining and quarrying sectors are very
dominant in forming Papua Province’s GDP. The variety of
Papua’s mining products are: copper, gold, silver, platinum,
iron ore, coal, nickel, cobalt and crome, etc. One of the
biggest contributor from those commodities to total mining
yield is copper, which can afford of 60 percent annually to
Papua Province’s GDP.
Though, the dominant role of mining and quarrying sectors to
Papua Province’s GDP creates a negative impact. Those
sectors experience a fluctuative production growth,
particularly for the last six years. This fluctuating growth rate
of mining sector also creates fluctuation in Papua Province’s
GDP.
Mining and
quarrying sectors are
dominant factors in
forming Regional
GDP of Papua
Province ...
The fluctuating growth
rate of mining sector
contributes to the
fluctuation of Papua
Province’s GDP
Figure 2. Mining potentials in Papua. Various mining commodities that can be found in Papua
province. One of the biggest contributor commodities to total mining yield is copper. (Source :
Regional Promotion and Investment Board of Papua Province)
.
n.a.SarmiYapen (Serui)
Iron Sand (Pasir Besi)
n.a.Waropen dan MemberamoOil and Gas
n.a.Jayapura (Tanah Merah, Depapre)Chromium
n.a.Jayapura (Tanah Merah, Depapre)Cobalt and Nickel
n.a.Mimika (Tembagapura)Gold, Silver & Copper (Emas, Perak, Tembaga)
125 million tonNabire (Kwatisore)Granite (Granit)
350 million tonJayawijaya (Kurulu)Marble (Marmer)
1.2 million tonJayawijaya (Aikima, Asotipo)
Nabire (Bumiwonorejo)
Clay (Lempung)
75 Ha21.5 million ton
Jayawijaya (Bukit Aikima, Asolokobal)
Quartz (Pasir Kwarsa)
190,000 HaJayawijaya (Asotipo, Kimbim, Kurulu)
Biak
Lime Stone (Batu Gamping/Kapur)
6.3 million tonJayapura (Nimboran)Coal
Resource Availability RegencyCommodity
© Office of Chief Economist Page 5 of 24
The Opportunity of Agriculture Sector
Agriculture sector is a primary sector that consist several sub
sectors of food crops, plantation, livestock, forestry, and
fishery. Agriculture roles as the second biggest contributor to
Regional GDP, after mining and quarrying sector.
Food crops sub sector such as paddy rice and potato, fruits
and vegetables, is the largest contributor to agriculture sector.
This sub sector is an important sector since majority of people
population in Papua Province (65 percent) work as farmer.
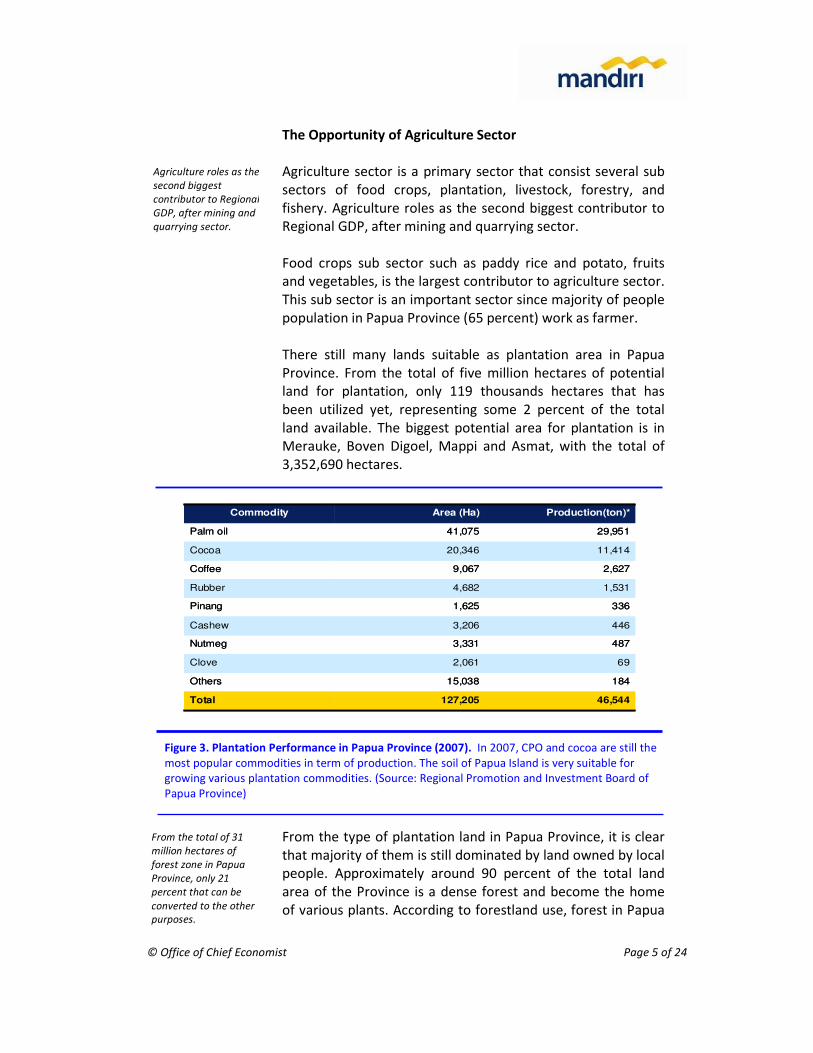
There still many lands suitable as plantation area in Papua
Province. From the total of five million hectares of potential
land for plantation, only 119 thousands hectares that has
been utilized yet, representing some 2 percent of the total
land available. The biggest potential area for plantation is in
Merauke, Boven Digoel, Mappi and Asmat, with the total of
3,352,690 hectares.
From the type of plantation land in Papua Province, it is clear
that majority of them is still dominated by land owned by local
people. Approximately around 90 percent of the total land
area of the Province is a dense forest and become the home
of various plants. According to forestland use, forest in Papua
Figure 3. Plantation Performance in Papua Province (2007). In 2007, CPO and cocoa are still the
most popular commodities in term of production. The soil of Papua Island is very suitable for
growing various plantation commodities. (Source: Regional Promotion and Investment Board of
Papua Province)
Commodity Area (Ha) Production(ton)*
Palm oil 41,075 29,951
Cocoa 20,346 11,414
Coffee 9,067 2,627
Rubber 4,682 1,531
Pinang 1,625 336
Cashew 3,206 446
Nutmeg 3,331 487
Clove 2,061 69
Others 15,038 184
Total 127,205 46,544
Commodity Area (Ha) Production(ton)*
Palm oil 41,075 29,951
Cocoa 20,346 11,414
Coffee 9,067 2,627
Rubber 4,682 1,531
Pinang 1,625 336
Cashew 3,206 446
Nutmeg 3,331 487
Clove 2,061 69
Others 15,038 184
Total 127,205 46,544
Agriculture roles as the
second biggest
contributor to Regional
GDP, after mining and
quarrying sector.
From the total of 31
million hectares of
forest zone in Papua
Province, only 21
percent that can be
converted to the other
purposes.
© Office of Chief Economist Page 6 of 24
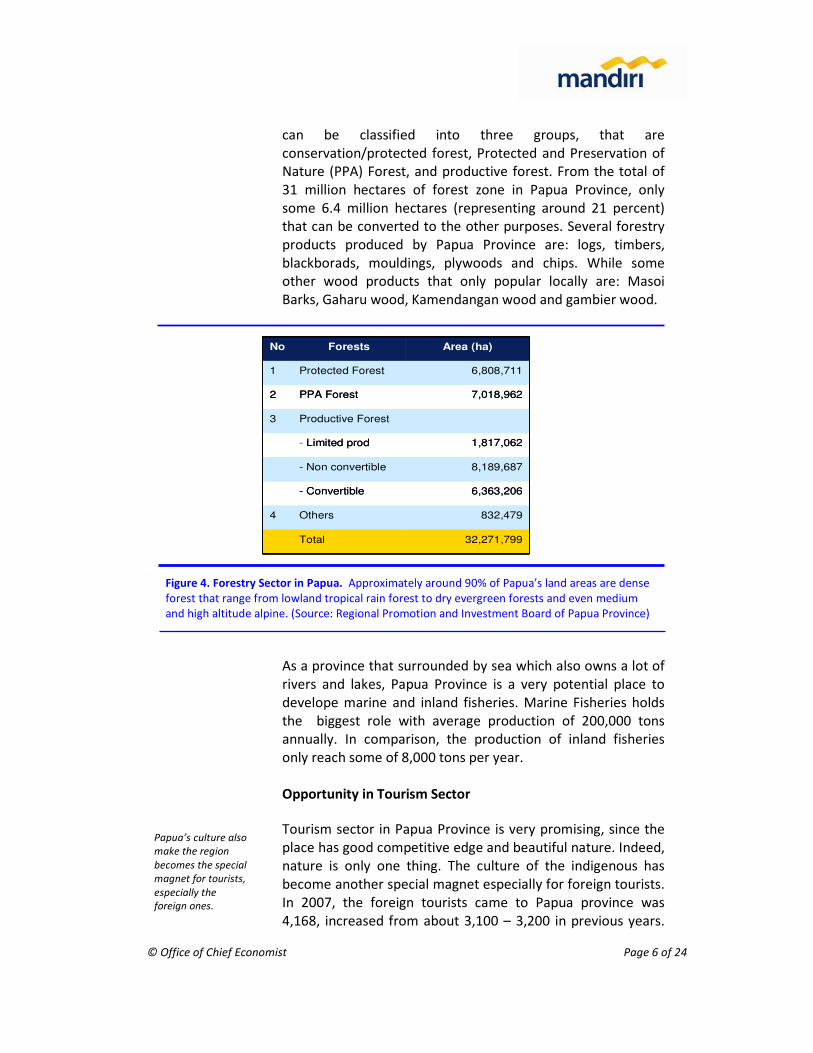
can be classified into three groups, that are
conservation/protected forest, Protected and Preservation of
Nature (PPA) Forest, and productive forest. From the total of
31 million hectares of forest zone in Papua Province, only
some 6.4 million hectares (representing around 21 percent)
that can be converted to the other purposes. Several forestry
products produced by Papua Province are: logs, timbers,
blackborads, mouldings, plywoods and chips. While some
other wood products that only popular locally are: Masoi
Barks, Gaharu wood, Kamendangan wood and gambier wood.
As a province that surrounded by sea which also owns a lot of
rivers and lakes, Papua Province is a very potential place to
develope marine and inland fisheries. Marine Fisheries holds
the biggest role with average production of 200,000 tons
annually. In comparison, the production of inland fisheries
only reach some of 8,000 tons per year.
Opportunity in Tourism Sector
Tourism sector in Papua Province is very promising, since the
place has good competitive edge and beautiful nature. Indeed,
nature is only one thing. The culture of the indigenous has
become another special magnet especially for foreign tourists.
In 2007, the foreign tourists came to Papua province was
4,168, increased from about 3,100 – 3,200 in previous years.
Papua’s culture also
make the region
becomes the special
magnet for tourists,
especially the
foreign ones.
Figure 4. Forestry Sector in Papua. Approximately around 90% of Papua’s land areas are dense
forest that range from lowland tropical rain forest to dry evergreen forests and even medium
and high altitude alpine. (Source: Regional Promotion and Investment Board of Papua Province)
No Forests Area (ha)
1 Protected Forest 6,808,711
2 PPA Forest 7,018,962
3 Productive Forest
- Limited prod 1,817,062
- Non convertible 8,189,687
- Convertible 6,363,206
4 Others 832,479
Total 32,271,799
No Forests Area (ha)
1 Protected Forest 6,808,711
2 PPA Forest 7,018,962
3 Productive Forest
- Limited prod 1,817,062
- Non convertible 8,189,687
- Convertible 6,363,206
4 Others 832,479
Total 32,271,799
© Office of Chief Economist Page 7 of 24
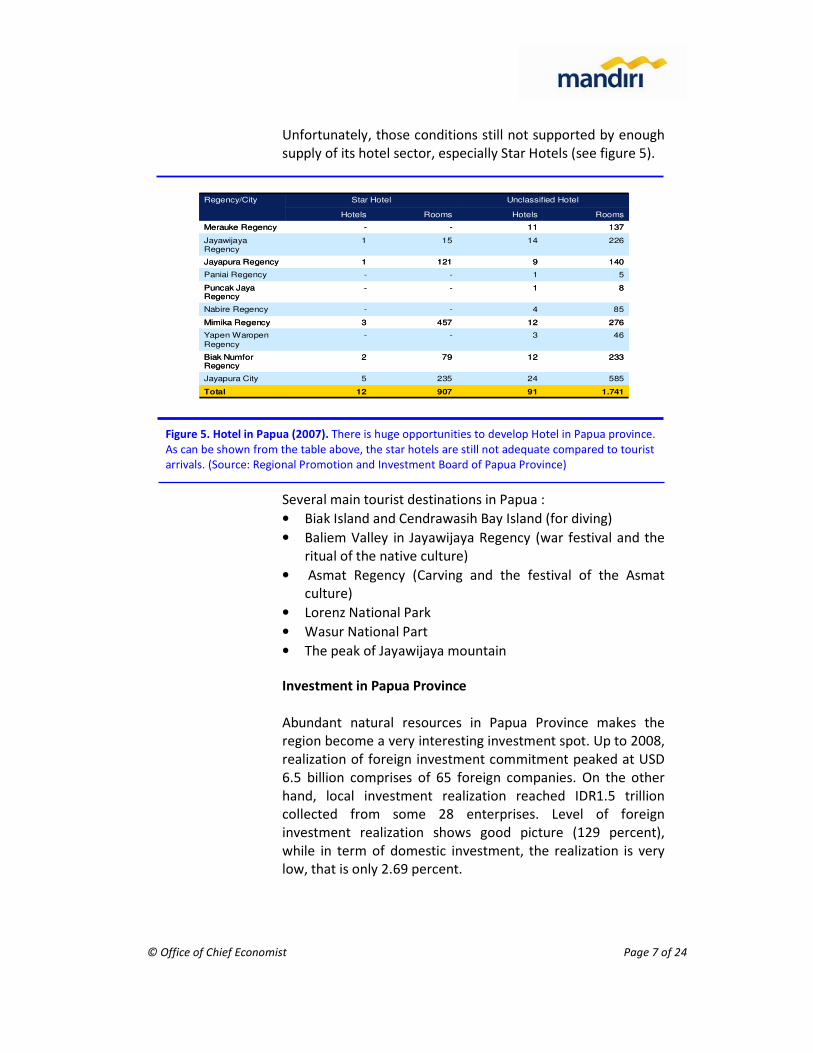
Unfortunately, those conditions still not supported by enough
supply of its hotel sector, especially Star Hotels (see figure 5).
Several main tourist destinations in Papua :
• Biak Island and Cendrawasih Bay Island (for diving)
• Baliem Valley in Jayawijaya Regency (war festival and the
ritual of the native culture)
• Asmat Regency (Carving and the festival of the Asmat
culture)
• Lorenz National Park
• Wasur National Part
• The peak of Jayawijaya mountain
Investment in Papua Province
Abundant natural resources in Papua Province makes the
region become a very interesting investment spot. Up to 2008,
realization of foreign investment commitment peaked at USD
6.5 billion comprises of 65 foreign companies. On the other
hand, local investment realization reached IDR1.5 trillion
collected from some 28 enterprises. Level of foreign
investment realization shows good picture (129 percent),
while in term of domestic investment, the realization is very
low, that is only 2.69 percent.
Figure 5. Hotel in Papua (2007). There is huge opportunities to develop Hotel in Papua province.
As can be shown from the table above, the star hotels are still not adequate compared to tourist
arrivals. (Source: Regional Promotion and Investment Board of Papua Province)
.
Regency/City Star Hotel Unclassified Hotel
Hotels Rooms Hotels Rooms
Merauke Regency - - 11 137
Jayawijaya Regency
1 15 14 226
Jayapura Regency 1 121 9 140
Paniai Regency - - 1 5
Puncak Jaya Regency
- - 1 8
Nabire Regency - - 4 85
Mimika Regency 3 457 12 276
Yapen Waropen
Regency
- - 3 46
Biak Numfor Regency
2 79 12 233
Jayapura City 5 235 24 585
Total 12 907 91 1.741
© Office of Chief Economist Page 8 of 24
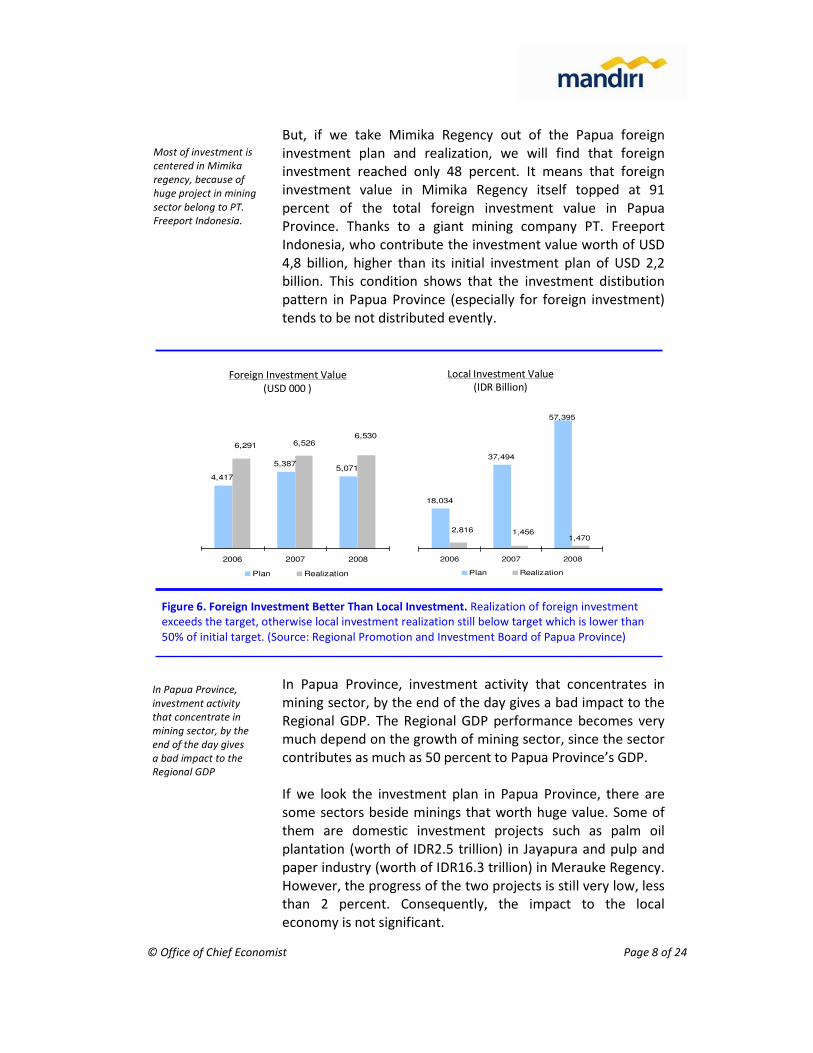
But, if we take Mimika Regency out of the Papua foreign
investment plan and realization, we will find that foreign
investment reached only 48 percent. It means that foreign
investment value in Mimika Regency itself topped at 91
percent of the total foreign investment value in Papua
Province. Thanks to a giant mining company PT. Freeport
Indonesia, who contribute the investment value worth of USD
4,8 billion, higher than its initial investment plan of USD 2,2
billion. This condition shows that the investment distibution
pattern in Papua Province (especially for foreign investment)
tends to be not distributed evently.
In Papua Province, investment activity that concentrates in
mining sector, by the end of the day gives a bad impact to the
Regional GDP. The Regional GDP performance becomes very
much depend on the growth of mining sector, since the sector
contributes as much as 50 percent to Papua Province’s GDP.
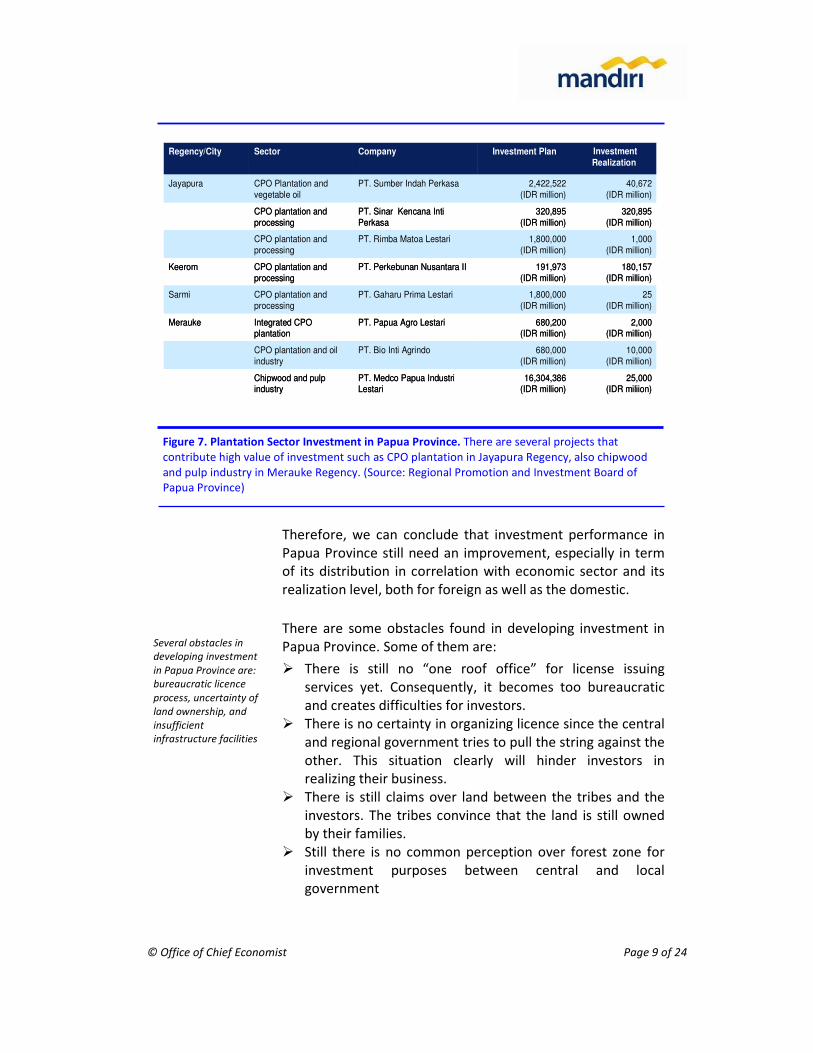
If we look the investment plan in Papua Province, there are
some sectors beside minings that worth huge value. Some of
them are domestic investment projects such as palm oil
plantation (worth of IDR2.5 trillion) in Jayapura and pulp and
paper industry (worth of IDR16.3 trillion) in Merauke Regency.
However, the progress of the two projects is still very low, less
than 2 percent. Consequently, the impact to the local
economy is not significant.
Most of investment is
centered in Mimika
regency, because of
huge project in mining
sector belong to PT.
Freeport Indonesia.
Figure 6. Foreign Investment Better Than Local Investment. Realization of foreign investment
exceeds the target, otherwise local investment realization still below target which is lower than
50% of initial target. (Source: Regional Promotion and Investment Board of Papua Province)
18,034
37,494
57,395
1,4701,4562,816
2006 2007 2008
Plan Realization
4,417
5,3875,071
6,5306,5266,291
2006 2007 2008
Plan Realization
Foreign Investment Value
(USD 000 )
Local Investment Value
(IDR Billion)
In Papua Province,
investment activity
that concentrate in
mining sector, by the
end of the day gives
a bad impact to the
Regional GDP
© Office of Chief Economist Page 9 of 24
Therefore, we can conclude that investment performance in
Papua Province still need an improvement, especially in term
of its distribution in correlation with economic sector and its
realization level, both for foreign as well as the domestic.
There are some obstacles found in developing investment in
Papua Province. Some of them are:
� There is still no “one roof office” for license issuing
services yet. Consequently, it becomes too bureaucratic
and creates difficulties for investors.
� There is no certainty in organizing licence since the central
and regional government tries to pull the string against the
other. This situation clearly will hinder investors in
realizing their business.
� There is still claims over land between the tribes and the
investors. The tribes convince that the land is still owned
by their families.
� Still there is no common perception over forest zone for
investment purposes between central and local
government
Several obstacles in
developing investment
in Papua Province are:
bureaucratic licence
process, uncertainty of
land ownership, and
insufficient
infrastructure facilities
Figure 7. Plantation Sector Investment in Papua Province. There are several projects that
contribute high value of investment such as CPO plantation in Jayapura Regency, also chipwood
and pulp industry in Merauke Regency. (Source: Regional Promotion and Investment Board of
Papua Province)
Regency/City Sector Company Investment Plan Investment
Realization
Jayapura CPO Plantation and
vegetable oil
PT. Sumber Indah Perkasa 2,422,522
(IDR million)
40,672
(IDR million)
CPO plantation and
processing
PT. Sinar Kencana Inti
Perkasa
320,895
(IDR million)
320,895
(IDR million)
CPO plantation and
processing
PT. Rimba Matoa Lestari 1,800,000
(IDR million)
1,000
(IDR million)
Keerom CPO plantation and
processing
PT. Perkebunan Nusantara II 191,973
(IDR million)
180,157
(IDR million)
Sarmi CPO plantation and
processing
PT. Gaharu Prima Lestari 1,800,000
(IDR million)
25
(IDR million)
Merauke Integrated CPO plantation
PT. Papua Agro Lestari 680,200(IDR million)
2,000(IDR million)
CPO plantation and oil
industry
PT. Bio Inti Agrindo 680,000
(IDR million)
10,000
(IDR million)
Chipwood and pulp industry
PT. Medco Papua IndustriLestari
16,304,386(IDR million)
25,000(IDR miliion)
© Office of Chief Economist Page 10 of 24
� Insufficient infrastructure facilities to support investment,
such as road condition and power supply.
B. ECONOMIC POTENCY OF WEST PAPUA
Regional Gross Domestic Product of West Papua Province
In West Papua, there are eight regencies and one municipality,
with Manokwari as the provincial capital. West Papua’s
economy grew by an average of 6.6 percent during 2003 –
2008. Different from Papua Province’s Gross Domestic Product
structure which mainly dominated by mining and quarrying
sectors, composition of West Papua’s GDP is more diversity,
where agriculture sector provides the biggest contribution
(28.20 percent). Financial, leasing and service industries
experience the highest growth among the other sectors, even
though their contributions are still relatively low. Forwarding,
communication and construction sectors showed a fairly
significant growth during 2003 – 2008.
Different from Papua
Province, the
composition of West
Papua’s GDP is more
diversity
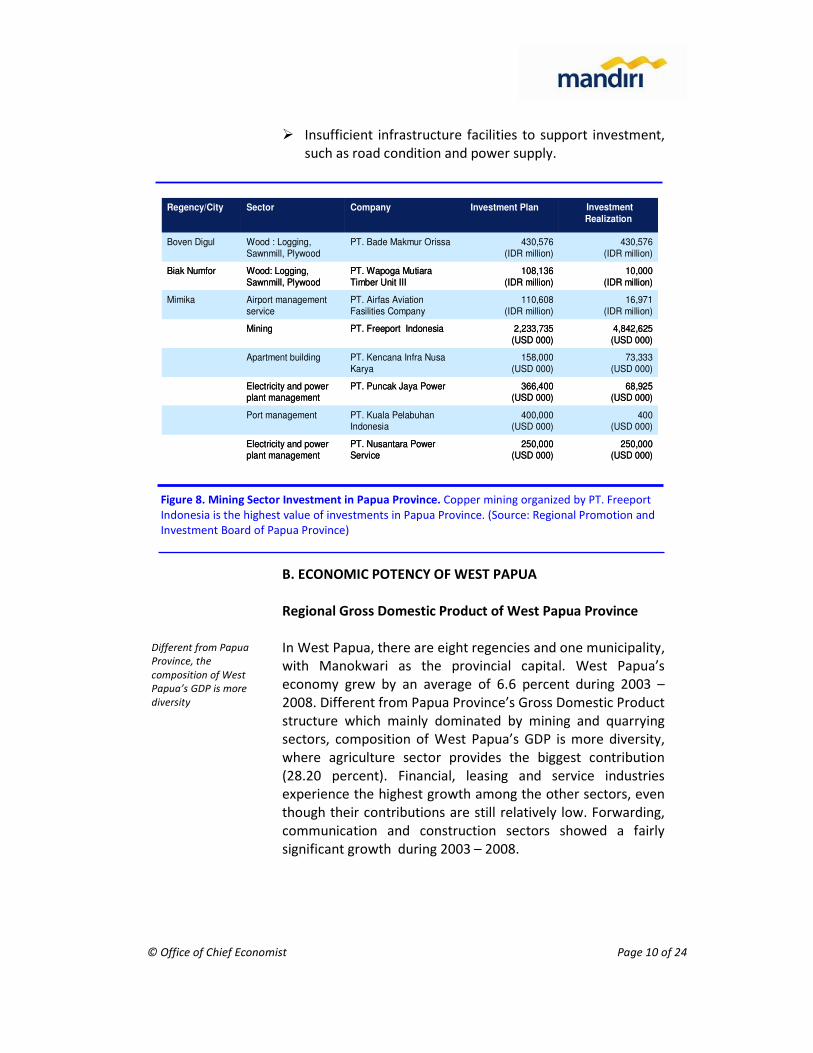
Figure 8. Mining Sector Investment in Papua Province. Copper mining organized by PT. Freeport
Indonesia is the highest value of investments in Papua Province. (Source: Regional Promotion and
Investment Board of Papua Province)
Regency/City Sector Company Investment Plan Investment
Realization
Boven Digul Wood : Logging, Sawnmill, Plywood
PT. Bade Makmur Orissa 430,576(IDR million)
430,576(IDR million)
Biak Numfor Wood: Logging, Sawnmill, Plywood
PT. Wapoga MutiaraTimber Unit III
108,136(IDR million)
10,000(IDR million)
Mimika Airport management service
PT. Airfas Aviation Fasilities Company
110,608(IDR million)
16,971(IDR million)
Mining PT. Freeport Indonesia 2,233,735 (USD 000)
4,842,625(USD 000)
Apartment building PT. Kencana Infra NusaKarya
158,000(USD 000)
73,333(USD 000)
Electricity and power plant management
PT. Puncak Jaya Power 366,400(USD 000)
68,925(USD 000)
Port management PT. Kuala PelabuhanIndonesia
400,000(USD 000)
400(USD 000)
Electricity and power plant management
PT. Nusantara Power Service
250,000(USD 000)
250,000(USD 000)
© Office of Chief Economist Page 11 of 24
Potency of Mining and Quarrying Sectors
West Papua’s main mining products are oil and gas, located in
the regencies of Bintuni Bay, South Sorong, and Fak Fak. In
fact, Bintuni Bay Regency is the largest oil and gas zone in
Papua. Multinational company, British Petroleum (BP),
holding hand with state-run Pertamina under the flag of
Tangguh Project are now exploring the largest Liquid Natural
Gas (LNG) resource with total supply of 23.7 TFC (trillion feet
cubic) which some 14.4 TCF has received certification of
guarateed source. Total investment of Tangguh Project is
USD6.5 billion, and expected to produce at LNG least 7.6
million ton gas.
Recently, BP Indonesia has concesssion to export as much as
2.6 million ton of gas to Fuqian in China for at least 25 years
with the average rate of USD3.35 per MMBtu; South Korea’s
SK Power gained license to sell 0.55 million ton for 20 years
with the price of USD3.5 per MMBtu; Posco Korea 0.55 million
ton for 20 years with the price of USD3.36 per MMBtu; and
The US-based Sempra (West Coast, USA) is allowed to export
some 3.7 million ton for 20 years with the price of USD5.95
per MMBtu.
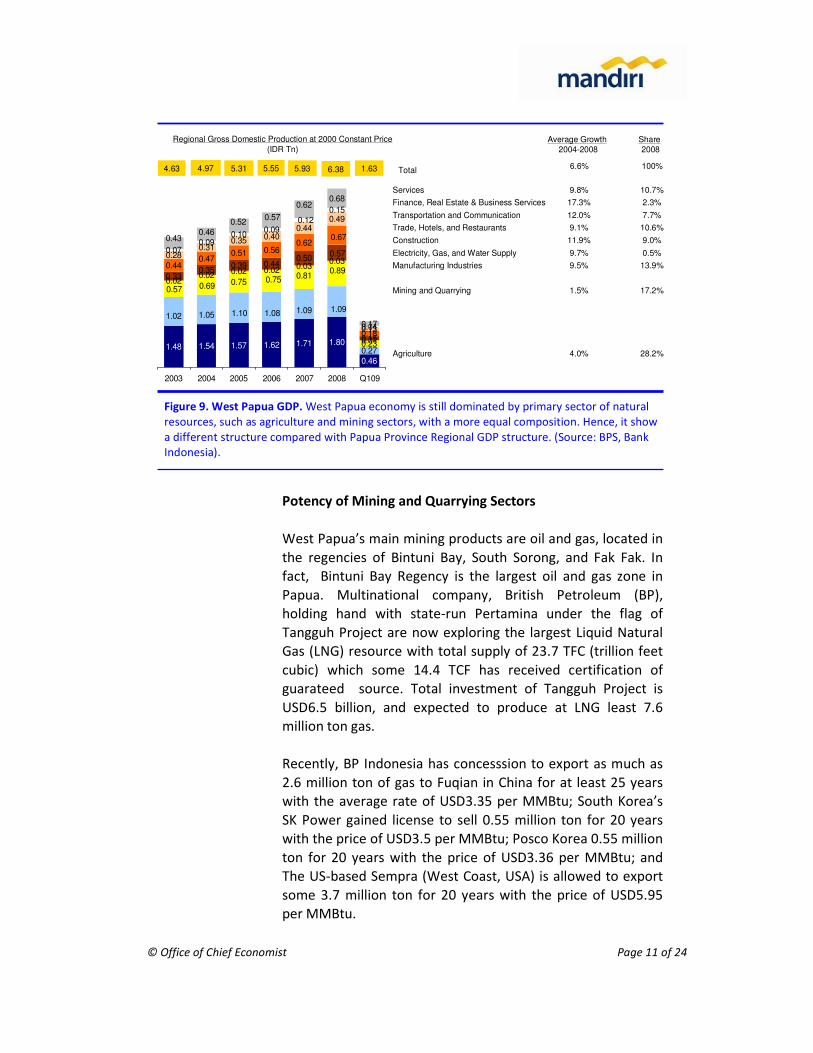
Figure 9. West Papua GDP. West Papua economy is still dominated by primary sector of natural
resources, such as agriculture and mining sectors, with a more equal composition. Hence, it show
a different structure compared with Papua Province Regional GDP structure. (Source: BPS, Bank
Indonesia).
Regional Gross Domestic Production at 2000 Constant Price
(IDR Tn)
1.48 1.54 1.57 1.62 1.71 1.80
0.46
0.270.23
0.020.02 0.02 0.02 0.03
0.03
0.01
0.330.35
0.39 0.440.50
0.15
0.440.47
0.51 0.56
0.18
0.280.31
0.35 0.40
0.49
0.13
0.070.09
0.100.09
0.15
0.04
0.68
0.17
1.091.081.051.09
1.02 1.10
0.890.810.750.750.690.57
0.57
0.670.62
0.440.12
0.62
0.570.52
0.460.43
2003 2004 2005 2006 2007 2008 Q109
Services
Finance, Real Estate & Business Services
Transportation and Communication
Trade, Hotels, and Restaurants
Construction
Electricity, Gas, and Water Supply
Manufacturing Industries
Mining and Quarrying
Agriculture
Average Growth
2004-2008
9.8%
17.3%
12.0%
9.1%
11.9%
9.7%
9.5%
1.5%
4.0%
4.63 4.97 5.31 5.55 5.93 Total6.6%6.38 1.63
Share
2008
10.7%
2.3%
7.7%
10.6%
9.0%
0.5%
13.9%
17.2%
28.2%
100%
© Office of Chief Economist Page 12 of 24
While, coal resource base spread out in some places such as
Bintuni Bay, Fak Fak, Sorong and Raja Ampat. Coal reserve in
Bintuni Bay Regency available in Horna (4.5 million metric
tons) and Timbuni with total reserve of 14.29 million metric
tons. Calorie value produced by the coal reaches 5,870 –
7,935 calorie/kg. However the resources have not explored
commercially yet. The other potential mining and quarrying
resources in West Papua are copper, zinc, nickel, iron ore,
granite, gold, lime stone, marble, and phosphate.
The potency of Agriculture, Plantation and Forestry Sectors
In 2006, the percentage of land size used for agriculture
purposes of the total land size that suitable for agriculture in
West Papua is still around 21.3 percent. It means that land for
developing the agriculture business in West Papua is still
available. Some products that potential to develop in this
region are paddy rice, corn, cassava, sweet potato, and
vegetables. So far, some agriculture commodities that have
been developed commercially in large estate are cacao, and
palm oil tree. While, smallhoders estate are more vary, such
as coconut, palm oil, clove, coffee and cacao. Cacao
plantation is concentrated in Manokwari Regency, mainly in
the districts of Ransiki, Oransbari, Warmare and Prafi. One of
the largest cocoa plant in West Papua owned by PT Cokran,
who manage land size of 20,000 Ha. While PTPN II is the
largest state own company who operates palm oil plantation
in West Papua. Other big operator, Medco Papua Hijau
Selaras, will come and join the business further.
In West Papua, some
agriculture
commodities that have
been developed
commercially in large
estate are cacao and
palm oil
© Office of Chief Economist Page 13 of 24
Forestry and its products such as plywood and furniture
products are also potential to developed in West Papua.
Prohibition in shipping log to other region contributes to the
development of local wood processing industry. Furniture
industry can be found in the regency of South Sorong which
spread out in Terminabua District, Ayamaru District,
Moswaren District, Aitinyo Disctrict, and Alfiat District. In
Sorong, a lot of Small and Medium Enterprices (SME) work in
the area of wood processing business. Their machineries and
other equipments are fairly sufficient.
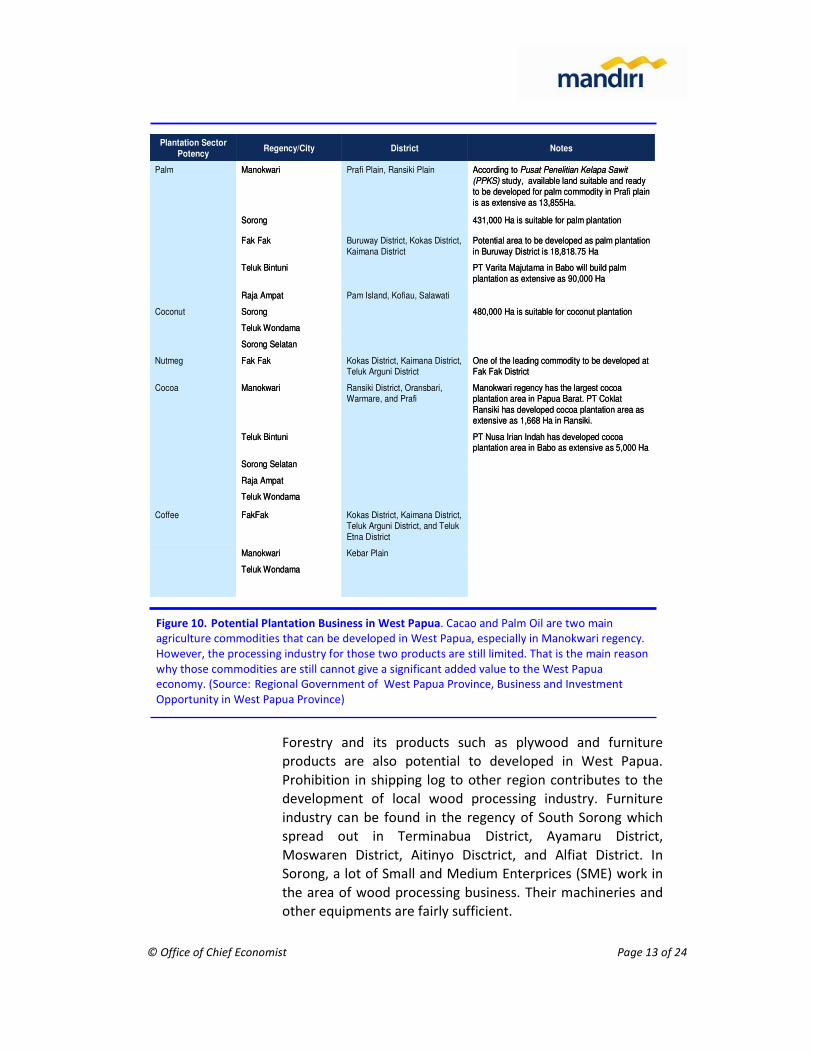
Figure 10. Potential Plantation Business in West Papua. Cacao and Palm Oil are two main
agriculture commodities that can be developed in West Papua, especially in Manokwari regency.
However, the processing industry for those two products are still limited. That is the main reason
why those commodities are still cannot give a significant added value to the West Papua
economy. (Source: Regional Government of West Papua Province, Business and Investment
Opportunity in West Papua Province)
Kokas District, Kaimana District, Teluk Arguni District, and Teluk
Etna District
FakFakCoffee
Teluk Wondama
Raja Ampat
Sorong Selatan
PT Nusa Irian Indah has developed cocoa plantation area in Babo as extensive as 5,000 Ha
Teluk Bintuni
Kebar PlainManokwari
One of the leading commodity to be developed at Fak Fak District
Kokas District, Kaimana District, Teluk Arguni District
Fak FakNutmeg
Manokwari regency has the largest cocoa plantation area in Papua Barat. PT Coklat
Ransiki has developed cocoa plantation area as extensive as 1,668 Ha in Ransiki.
Ransiki District, Oransbari, Warmare, and Prafi
ManokwariCocoa
Teluk Wondama
Sorong Selatan
PT Varita Majutama in Babo will build palm
plantation as extensive as 90,000 Ha
Teluk Bintuni
Teluk Wondama
480,000 Ha is suitable for coconut plantationSorongCoconut
Potential area to be developed as palm plantation
in Buruway District is 18,818.75 Ha
Buruway District, Kokas District,
Kaimana District
Fak Fak
431,000 Ha is suitable for palm plantationSorong
Pam Island, Kofiau, SalawatiRaja Ampat
According to Pusat Penelitian Kelapa Sawit
(PPKS) study, available land suitable and ready to be developed for palm commodity in Prafi plain
is as extensive as 13,855Ha.
Prafi Plain, Ransiki PlainManokwariPalm
District NotesRegency/CityPlantation Sector
Potency
© Office of Chief Economist Page 14 of 24
Potential Opportunity in Marine and Fishery Sectors
West Papua’s large coastal and waters territory makes this
area to be very potential zone to develop fishery industry. The
fishery potency in Arafuru Ocean, especially in the regencies
of Bintuni Bay, Fak Fak and Kaimana is predicted around
799,566 tons. However, only 273,566 ton or representing
some 35.87 percent of the total has been explored yet.
Variety of the marine resource in West Papua are lobsters,
prawns, pomfrets, tunas, cabs, several kinds of seaweeds,
seabass, snappers, shark fins, Spanish Mackerel, squids, and
anchovies. Fishery sector receive a high attention in Sorong.
The city has a sufficient fishery seaport, which is completed
with jetty run by private sector. Fishery industry activities in
Sorong includes fishing, processing and canning.
Opportunity in Tourism Sector
Tourism sector is expected to be one of the leading sector in
West Papua in the future. Tourism activity that can be offered
are eco tourism such as fauna sanctuary in Sidey Wabian and
natural preserve, under water tourism such as small islands of
Raja Ampat, cultural tourism like Papera Monument, and
religious tourism in Mansinam Island. Several investment
opportunities in West Papua are:
1. Organizing/managing tourism objects, and put it into
tourism package.
2. Build up some travel agencies
3. Developing other supporting facilities for tourism activities
such as hotels, restaurants, including its derivatives like
handicraft centre.
Investment in West Papua
West Papua Province needs investors to help the region to
develop in order to boost its economic growth, creating
working opportunities, as well as improving its business
competitive edge. Investor’s interest in investing in West
Papua is fairly high. It can be seen from the escalation in
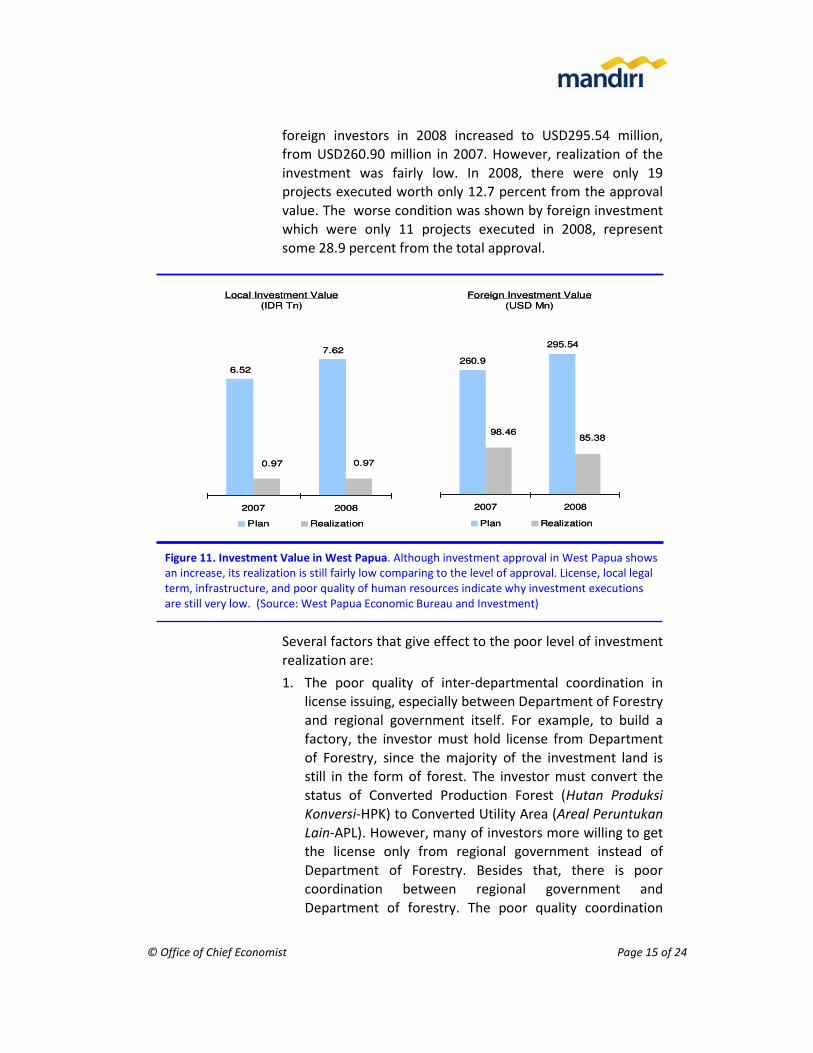
investment approval level. Local investment approval in 2008
was 40 projects worth IDR7.62 trillion, increased from IDR6.52
trillion from previous year. While investment approval of
West Papua has huge
marine and fishery
potency which are not
fully explored yet
Tourism sector,
which mainly be
stressed on the eco
tourism sector, is
expected to be one
of the leading sector
in the future in West
Papua
Although investment
approval in West
Papua is increasing, its
realization is still fairly
low
© Office of Chief Economist Page 15 of 24
foreign investors in 2008 increased to USD295.54 million,
from USD260.90 million in 2007. However, realization of the
investment was fairly low. In 2008, there were only 19
projects executed worth only 12.7 percent from the approval
value. The worse condition was shown by foreign investment
which were only 11 projects executed in 2008, represent
some 28.9 percent from the total approval.
Several factors that give effect to the poor level of investment
realization are:
1. The poor quality of inter-departmental coordination in
license issuing, especially between Department of Forestry
and regional government itself. For example, to build a
factory, the investor must hold license from Department
of Forestry, since the majority of the investment land is
still in the form of forest. The investor must convert the
status of Converted Production Forest (Hutan Produksi
Konversi-HPK) to Converted Utility Area (Areal Peruntukan
Lain-APL). However, many of investors more willing to get
the license only from regional government instead of
Department of Forestry. Besides that, there is poor
coordination between regional government and
Department of forestry. The poor quality coordination
Figure 11. Investment Value in West Papua. Although investment approval in West Papua shows
an increase, its realization is still fairly low comparing to the level of approval. License, local legal
term, infrastructure, and poor quality of human resources indicate why investment executions
are still very low. (Source: West Papua Economic Bureau and Investment)
6.52
7.62
0.970.97
2007 2008
Plan Realization
Local Investment Value
(IDR Tn)
Foreign Investment Value
(USD Mn)
260.9
295.54
85.3898.46
2007 2008
Plan Realization
6.52
7.62
0.970.97
2007 2008
Plan Realization
Local Investment Value
(IDR Tn)
Foreign Investment Value
(USD Mn)
260.9
295.54
85.3898.46
2007 2008
Plan Realization
© Office of Chief Economist Page 16 of 24
some of the time resulted to the ongoing investment
project has to be given up before law.
2. Law no. 21 / 2001 regarding Special Autonomy for Papua
and West Papua Provinces, specifically article no. 43
accomodates a protection to local people’s (tribes) rights,
which one of them is rights of land. Consequently,
conflicts between the investors and the tribe are often
occur, disputing the rights of land. Therefore, in practice,
legal certainty on this matter is an urgent thing to settle. A
more detail technical policy is and active role of the local
government needed in overcoming the problem.
3. Limited infrastructure facilities.
4. Human resource quality that is still fairly low
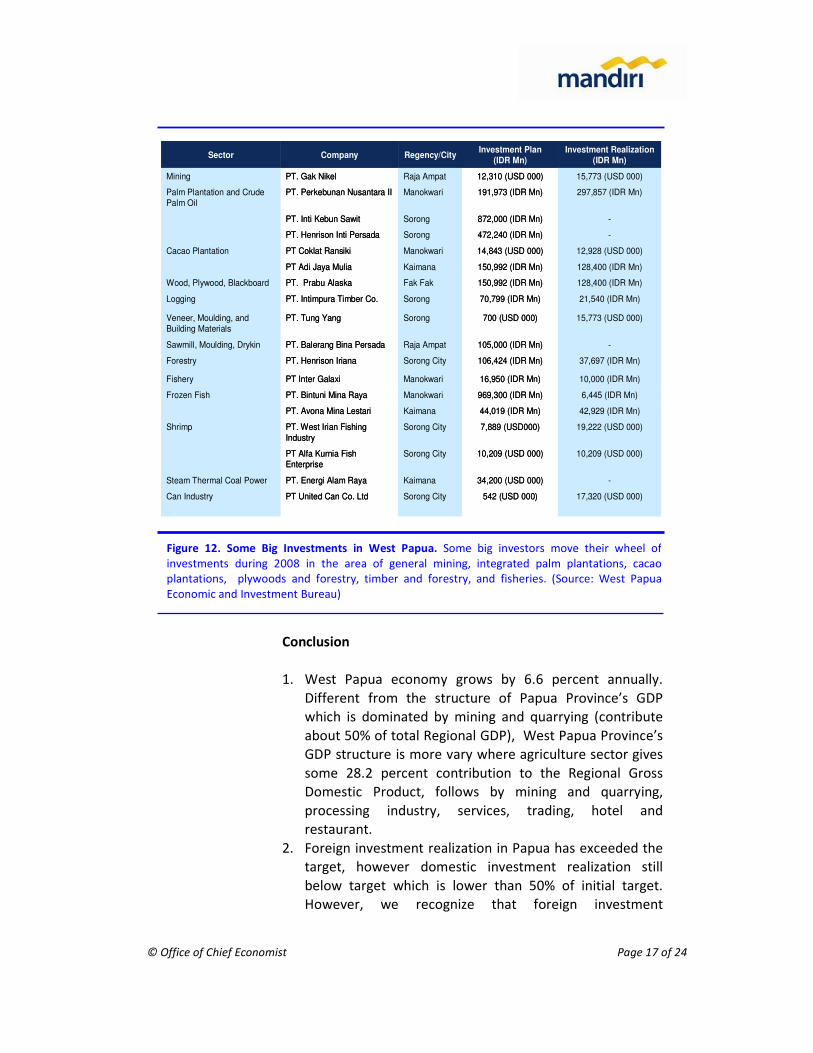
By distribution, Sorong Regency, Sorong City, Manokwari
Regency and Raja Ampat Regency are the most wanted region
for investment. Some big investments in West Papua can be
seen in the table below:
© Office of Chief Economist Page 17 of 24
Conclusion
1. West Papua economy grows by 6.6 percent annually.
Different from the structure of Papua Province’s GDP
which is dominated by mining and quarrying (contribute
about 50% of total Regional GDP), West Papua Province’s
GDP structure is more vary where agriculture sector gives
some 28.2 percent contribution to the Regional Gross
Domestic Product, follows by mining and quarrying,
processing industry, services, trading, hotel and
restaurant.
2. Foreign investment realization in Papua has exceeded the
target, however domestic investment realization still
below target which is lower than 50% of initial target.
However, we recognize that foreign investment
Figure 12. Some Big Investments in West Papua. Some big investors move their wheel of
investments during 2008 in the area of general mining, integrated palm plantations, cacao
plantations, plywoods and forestry, timber and forestry, and fisheries. (Source: West Papua
Economic and Investment Bureau)
42,929 (IDR Mn)44,019 (IDR Mn)KaimanaPT. Avona Mina Lestari
6,445 (IDR Mn)969,300 (IDR Mn)ManokwariPT. Bintuni Mina RayaFrozen Fish
10,000 (IDR Mn)16,950 (IDR Mn)ManokwariPT Inter GalaxiFishery
10,209 (USD 000)10,209 (USD 000)Sorong CityPT Alfa Kurnia Fish
Enterprise
19,222 (USD 000)7,889 (USD000)Sorong CityPT. West Irian Fishing
Industry
Shrimp
37,697 (IDR Mn)106,424 (IDR Mn)Sorong CityPT. Henrison IrianaForestry
-34,200 (USD 000)KaimanaPT. Energi Alam RayaSteam Thermal Coal Power
-105,000 (IDR Mn)Raja AmpatPT. Balerang Bina PersadaSawmill, Moulding, Drykin
17,320 (USD 000)542 (USD 000)Sorong CityPT United Can Co. LtdCan Industry
15,773 (USD 000)700 (USD 000)SorongPT. Tung YangVeneer, Moulding, and Building Materials
21,540 (IDR Mn)70,799 (IDR Mn)SorongPT. Intimpura Timber Co.Logging
15,773 (USD 000)12,310 (USD 000)Raja AmpatPT. Gak NikelMining
-872,000 (IDR Mn)SorongPT. Inti Kebun Sawit
297,857 (IDR Mn)191,973 (IDR Mn)ManokwariPT. Perkebunan Nusantara IIPalm Plantation and Crude Palm Oil
150,992 (IDR Mn)
150,992 (IDR Mn)
14,843 (USD 000)
472,240 (IDR Mn)
Investment Plan (IDR Mn)
12,928 (USD 000)ManokwariPT Coklat RansikiCacao Plantation
-SorongPT. Henrison Inti Persada
128,400 (IDR Mn)Fak FakPT. Prabu AlaskaWood, Plywood, Blackboard
128,400 (IDR Mn)KaimanaPT Adi Jaya Mulia
Regency/CityInvestment Realization
(IDR Mn)CompanySector
© Office of Chief Economist Page 18 of 24
distribution pattern in Papua province is centered in one
regency and focused on mining sector which booked very
high value of investment (Freeport).
3. The investor’s interest to invest in West Papua is actually
fairly high, shown by the increasing investment approval.
However, the projects execution level are still fairly low.
4. Finally, we found some factors causing low investment
realization in Papua and West Papua Province, there are :
poor inter-departmental coordination as well as central
and local government coordination related to license
issuing process, tribe rights, limited infrastructure
facilities, and lack of high skilled work force.
© Office of Chief Economist Page 19 of 24
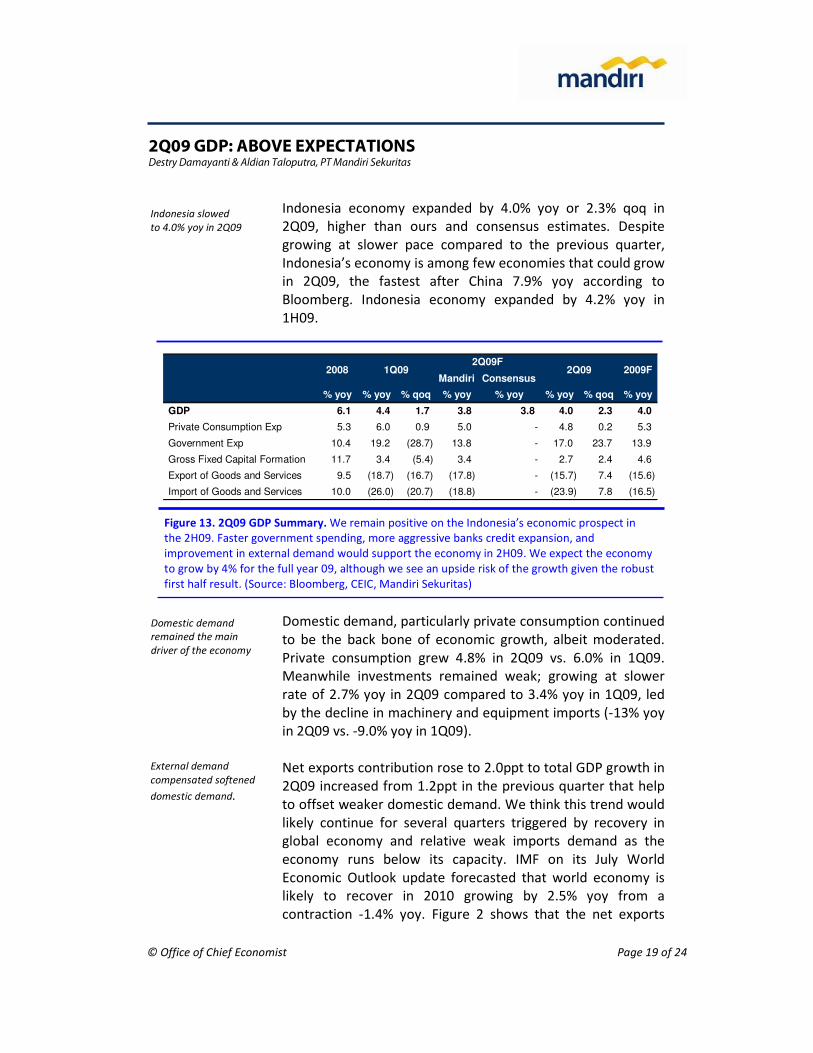
Indonesia economy expanded by 4.0% yoy or 2.3% qoq in
2Q09, higher than ours and consensus estimates. Despite
growing at slower pace compared to the previous quarter,
Indonesia’s economy is among few economies that could grow
in 2Q09, the fastest after China 7.9% yoy according to
Bloomberg. Indonesia economy expanded by 4.2% yoy in
1H09.
Domestic demand, particularly private consumption continued
to be the back bone of economic growth, albeit moderated.
Private consumption grew 4.8% in 2Q09 vs. 6.0% in 1Q09.
Meanwhile investments remained weak; growing at slower
rate of 2.7% yoy in 2Q09 compared to 3.4% yoy in 1Q09, led
by the decline in machinery and equipment imports (-13% yoy
in 2Q09 vs. -9.0% yoy in 1Q09).
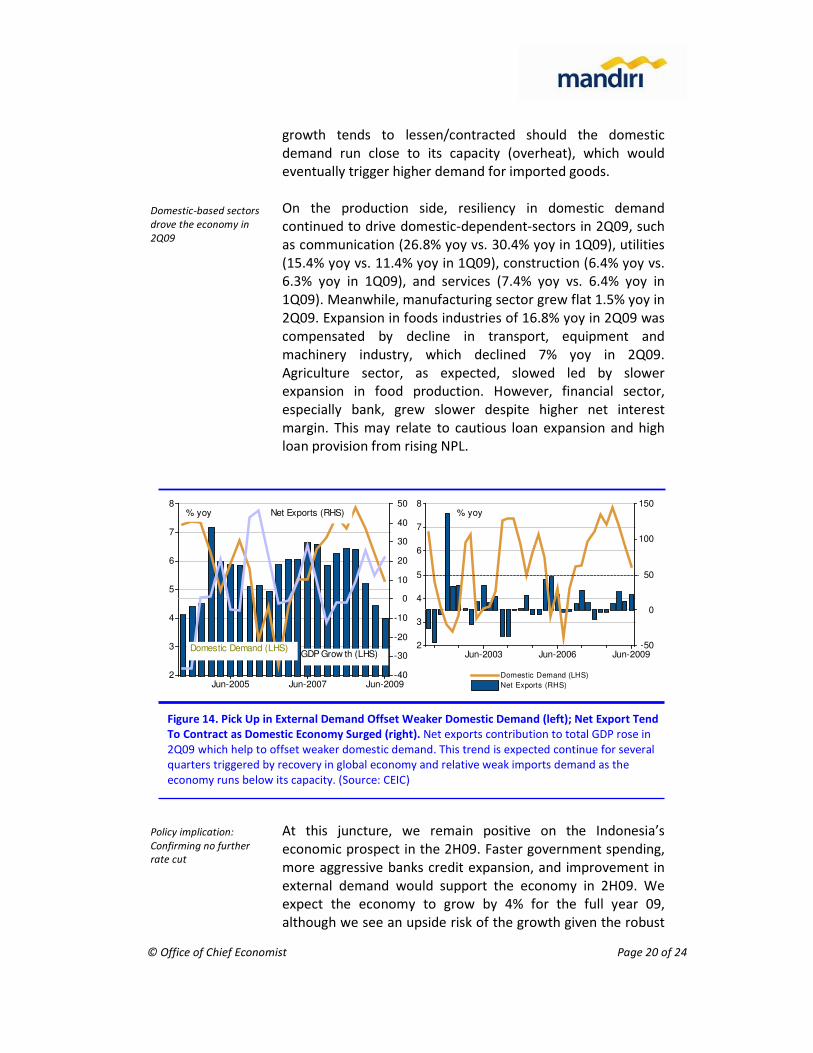
Net exports contribution rose to 2.0ppt to total GDP growth in
2Q09 increased from 1.2ppt in the previous quarter that help
to offset weaker domestic demand. We think this trend would
likely continue for several quarters triggered by recovery in
global economy and relative weak imports demand as the
economy runs below its capacity. IMF on its July World
Economic Outlook update forecasted that world economy is
likely to recover in 2010 growing by 2.5% yoy from a
contraction -1.4% yoy. Figure 2 shows that the net exports
Domestic demand
remained the main
driver of the economy
External demand
compensated softened
domestic demand.
Indonesia slowed
to 4.0% yoy in 2Q09
Figure 13. 2Q09 GDP Summary. We remain positive on the Indonesia’s economic prospect in
the 2H09. Faster government spending, more aggressive banks credit expansion, and
improvement in external demand would support the economy in 2H09. We expect the economy
to grow by 4% for the full year 09, although we see an upside risk of the growth given the robust
first half result. (Source: Bloomberg, CEIC, Mandiri Sekuritas)
Mandiri Consensus
% yoy % yoy % qoq % yoy % yoy % yoy % qoq % yoy
GDP 6.1 4.4 1.7 3.8 3.8 4.0 2.3 4.0
Private Consumption Exp 5.3 6.0 0.9 5.0 - 4.8 0.2 5.3
Government Exp 10.4 19.2 (28.7) 13.8 - 17.0 23.7 13.9
Gross Fixed Capital Formation 11.7 3.4 (5.4) 3.4 - 2.7 2.4 4.6
Export of Goods and Services 9.5 (18.7) (16.7) (17.8) - (15.7) 7.4 (15.6)
Import of Goods and Services 10.0 (26.0) (20.7) (18.8) - (23.9) 7.8 (16.5)
20082Q09F
2009F2Q091Q09
2Q09 GDP: ABOVE EXPECTATIONS Destry Damayanti & Aldian Taloputra, PT Mandiri Sekuritas
© Office of Chief Economist Page 20 of 24
growth tends to lessen/contracted should the domestic
demand run close to its capacity (overheat), which would
eventually trigger higher demand for imported goods.
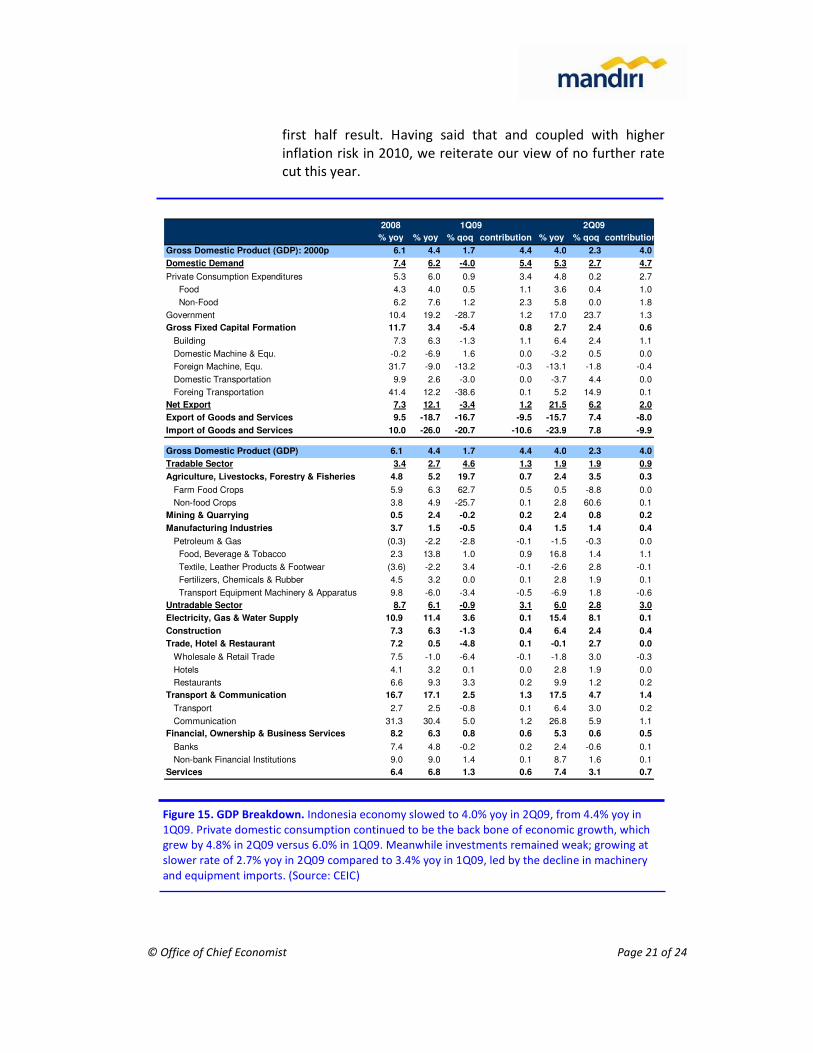
On the production side, resiliency in domestic demand
continued to drive domestic-dependent-sectors in 2Q09, such
as communication (26.8% yoy vs. 30.4% yoy in 1Q09), utilities
(15.4% yoy vs. 11.4% yoy in 1Q09), construction (6.4% yoy vs.
6.3% yoy in 1Q09), and services (7.4% yoy vs. 6.4% yoy in
1Q09). Meanwhile, manufacturing sector grew flat 1.5% yoy in
2Q09. Expansion in foods industries of 16.8% yoy in 2Q09 was
compensated by decline in transport, equipment and
machinery industry, which declined 7% yoy in 2Q09.
Agriculture sector, as expected, slowed led by slower
expansion in food production. However, financial sector,
especially bank, grew slower despite higher net interest
margin. This may relate to cautious loan expansion and high
loan provision from rising NPL.
At this juncture, we remain positive on the Indonesia’s
economic prospect in the 2H09. Faster government spending,
more aggressive banks credit expansion, and improvement in
external demand would support the economy in 2H09. We
expect the economy to grow by 4% for the full year 09,
although we see an upside risk of the growth given the robust
Domestic-based sectors
drove the economy in
2Q09
Policy implication:
Confirming no further
rate cut
Figure 14. Pick Up in External Demand Offset Weaker Domestic Demand (left); Net Export Tend
To Contract as Domestic Economy Surged (right). Net exports contribution to total GDP rose in
2Q09 which help to offset weaker domestic demand. This trend is expected continue for several
quarters triggered by recovery in global economy and relative weak imports demand as the
economy runs below its capacity. (Source: CEIC)
Jun-2005 Jun-2007 Jun-2009
8
7
6
5
4
3
2
50
40
30
20
10
0
-10
-20
-30
-40
GDP Grow th (LHS)Domestic Demand (LHS)
Net Exports (RHS)% yoy
Jun-2003 Jun-2006 Jun-2009
8
7
6
5
4
3
2
150
100
50
0
-50
Domestic Demand (LHS)
Net Exports (RHS)
% yoy
© Office of Chief Economist Page 21 of 24
first half result. Having said that and coupled with higher
inflation risk in 2010, we reiterate our view of no further rate
cut this year.
Figure 15. GDP Breakdown. Indonesia economy slowed to 4.0% yoy in 2Q09, from 4.4% yoy in
1Q09. Private domestic consumption continued to be the back bone of economic growth, which
grew by 4.8% in 2Q09 versus 6.0% in 1Q09. Meanwhile investments remained weak; growing at
slower rate of 2.7% yoy in 2Q09 compared to 3.4% yoy in 1Q09, led by the decline in machinery
and equipment imports. (Source: CEIC)
2008
% yoy % yoy % qoq contribution % yoy % qoq contribution
Gross Domestic Product (GDP): 2000p 6.1 4.4 1.7 4.4 4.0 2.3 4.0
Domestic Demand 7.4 6.2 -4.0 5.4 5.3 2.7 4.7
Private Consumption Expenditures 5.3 6.0 0.9 3.4 4.8 0.2 2.7
Food 4.3 4.0 0.5 1.1 3.6 0.4 1.0
Non-Food 6.2 7.6 1.2 2.3 5.8 0.0 1.8
Government 10.4 19.2 -28.7 1.2 17.0 23.7 1.3
Gross Fixed Capital Formation 11.7 3.4 -5.4 0.8 2.7 2.4 0.6
Building 7.3 6.3 -1.3 1.1 6.4 2.4 1.1
Domestic Machine & Equ. -0.2 -6.9 1.6 0.0 -3.2 0.5 0.0
Foreign Machine, Equ. 31.7 -9.0 -13.2 -0.3 -13.1 -1.8 -0.4
Domestic Transportation 9.9 2.6 -3.0 0.0 -3.7 4.4 0.0
Foreing Transportation 41.4 12.2 -38.6 0.1 5.2 14.9 0.1
Net Export 7.3 12.1 -3.4 1.2 21.5 6.2 2.0
Export of Goods and Services 9.5 -18.7 -16.7 -9.5 -15.7 7.4 -8.0
Import of Goods and Services 10.0 -26.0 -20.7 -10.6 -23.9 7.8 -9.9
Gross Domestic Product (GDP) 6.1 4.4 1.7 4.4 4.0 2.3 4.0
Tradable Sector 3.4 2.7 4.6 1.3 1.9 1.9 0.9
Agriculture, Livestocks, Forestry & Fisheries 4.8 5.2 19.7 0.7 2.4 3.5 0.3
Farm Food Crops 5.9 6.3 62.7 0.5 0.5 -8.8 0.0
Non-food Crops 3.8 4.9 -25.7 0.1 2.8 60.6 0.1
Mining & Quarrying 0.5 2.4 -0.2 0.2 2.4 0.8 0.2
Manufacturing Industries 3.7 1.5 -0.5 0.4 1.5 1.4 0.4
Petroleum & Gas (0.3) -2.2 -2.8 -0.1 -1.5 -0.3 0.0
Food, Beverage & Tobacco 2.3 13.8 1.0 0.9 16.8 1.4 1.1
Textile, Leather Products & Footwear (3.6) -2.2 3.4 -0.1 -2.6 2.8 -0.1
Fertilizers, Chemicals & Rubber 4.5 3.2 0.0 0.1 2.8 1.9 0.1
Transport Equipment Machinery & Apparatus 9.8 -6.0 -3.4 -0.5 -6.9 1.8 -0.6
Untradable Sector 8.7 6.1 -0.9 3.1 6.0 2.8 3.0
Electricity, Gas & Water Supply 10.9 11.4 3.6 0.1 15.4 8.1 0.1
Construction 7.3 6.3 -1.3 0.4 6.4 2.4 0.4
Trade, Hotel & Restaurant 7.2 0.5 -4.8 0.1 -0.1 2.7 0.0
Wholesale & Retail Trade 7.5 -1.0 -6.4 -0.1 -1.8 3.0 -0.3
Hotels 4.1 3.2 0.1 0.0 2.8 1.9 0.0
Restaurants 6.6 9.3 3.3 0.2 9.9 1.2 0.2
Transport & Communication 16.7 17.1 2.5 1.3 17.5 4.7 1.4
Transport 2.7 2.5 -0.8 0.1 6.4 3.0 0.2
Communication 31.3 30.4 5.0 1.2 26.8 5.9 1.1
Financial, Ownership & Business Services 8.2 6.3 0.8 0.6 5.3 0.6 0.5
Banks 7.4 4.8 -0.2 0.2 2.4 -0.6 0.1
Non-bank Financial Institutions 9.0 9.0 1.4 0.1 8.7 1.6 0.1
Services 6.4 6.8 1.3 0.6 7.4 3.1 0.7
1Q09 2Q09
© Office of Chief Economist Page 22 of 24
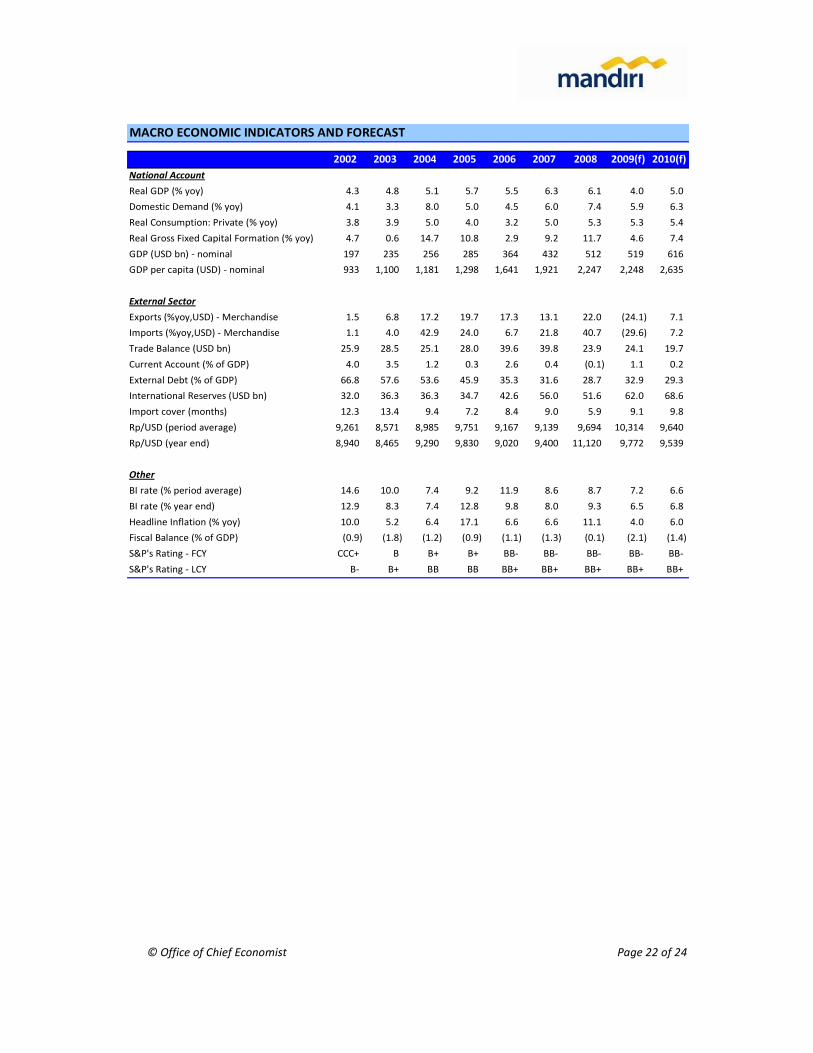
2002 2003 2004 2005 2006 2007 2008 2009(f) 2010(f)
National Account
Real GDP (% yoy) 4.3 4.8 5.1 5.7 5.5 6.3 6.1 4.0 5.0
Domestic Demand (% yoy) 4.1 3.3 8.0 5.0 4.5 6.0 7.4 5.9 6.3
Real Consumption: Private (% yoy) 3.8 3.9 5.0 4.0 3.2 5.0 5.3 5.3 5.4
Real Gross Fixed Capital Formation (% yoy) 4.7 0.6 14.7 10.8 2.9 9.2 11.7 4.6 7.4
GDP (USD bn) - nominal 197 235 256 285 364 432 512 519 616
GDP per capita (USD) - nominal 933 1,100 1,181 1,298 1,641 1,921 2,247 2,248 2,635
External Sector
Exports (%yoy,USD) - Merchandise 1.5 6.8 17.2 19.7 17.3 13.1 22.0 (24.1) 7.1
Imports (%yoy,USD) - Merchandise 1.1 4.0 42.9 24.0 6.7 21.8 40.7 (29.6) 7.2
Trade Balance (USD bn) 25.9 28.5 25.1 28.0 39.6 39.8 23.9 24.1 19.7
Current Account (% of GDP) 4.0 3.5 1.2 0.3 2.6 0.4 (0.1) 1.1 0.2
External Debt (% of GDP) 66.8 57.6 53.6 45.9 35.3 31.6 28.7 32.9 29.3
International Reserves (USD bn) 32.0 36.3 36.3 34.7 42.6 56.0 51.6 62.0 68.6
Import cover (months) 12.3 13.4 9.4 7.2 8.4 9.0 5.9 9.1 9.8
Rp/USD (period average) 9,261 8,571 8,985 9,751 9,167 9,139 9,694 10,314 9,640
Rp/USD (year end) 8,940 8,465 9,290 9,830 9,020 9,400 11,120 9,772 9,539
Other
BI rate (% period average) 14.6 10.0 7.4 9.2 11.9 8.6 8.7 7.2 6.6
BI rate (% year end) 12.9 8.3 7.4 12.8 9.8 8.0 9.3 6.5 6.8
Headline Inflation (% yoy) 10.0 5.2 6.4 17.1 6.6 6.6 11.1 4.0 6.0
Fiscal Balance (% of GDP) (0.9) (1.8) (1.2) (0.9) (1.1) (1.3) (0.1) (2.1) (1.4)
S&P's Rating - FCY CCC+ B B+ B+ BB- BB- BB- BB- BB-
S&P's Rating - LCY B- B+ BB BB BB+ BB+ BB+ BB+ BB+
MACRO ECONOMIC INDICATORS AND FORECAST
© Office of Chief Economist Page 23 of 24
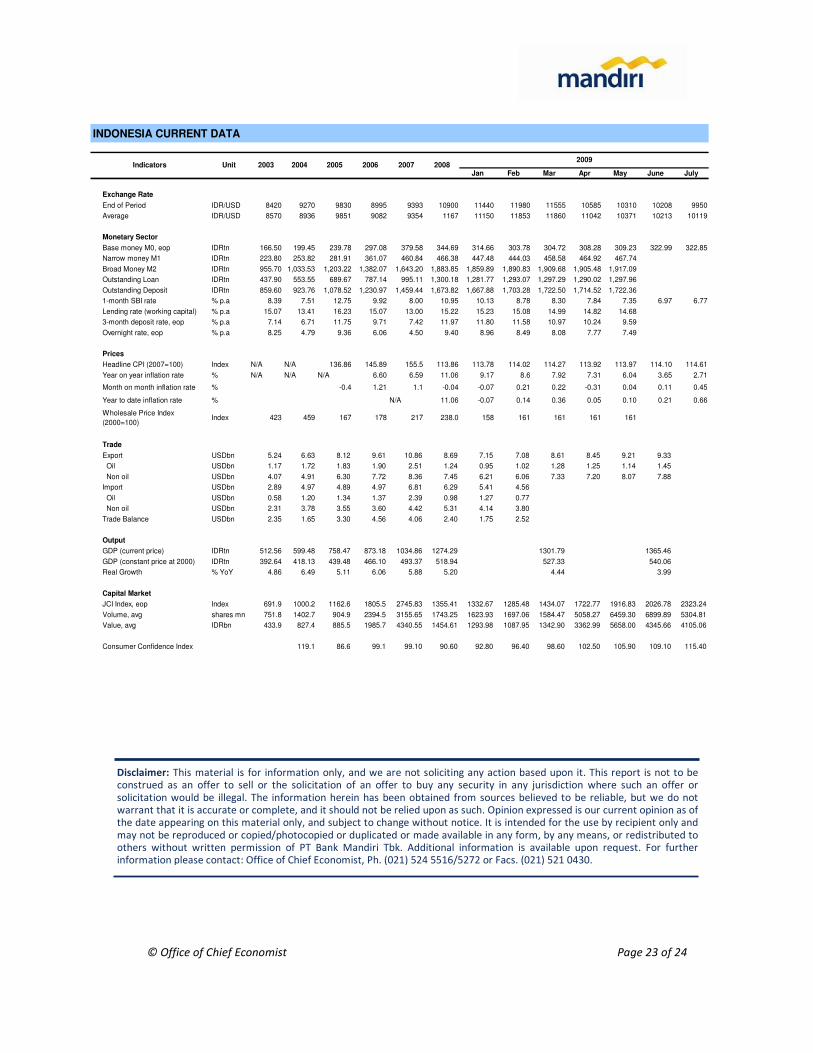
INDONESIA CURRENT DATA
Jan Feb Mar Apr May June July
Exchange Rate
End of Period IDR/USD 8420 9270 9830 8995 9393 10900 11440 11980 11555 10585 10310 10208 9950
Average IDR/USD 8570 8936 9851 9082 9354 1167 11150 11853 11860 11042 10371 10213 10119
Monetary Sector
Base money M0, eop IDRtn 166.50 199.45 239.78 297.08 379.58 344.69 314.66 303.78 304.72 308.28 309.23 322.99 322.85
Narrow money M1 IDRtn 223.80 253.82 281.91 361.07 460.84 466.38 447.48 444.03 458.58 464.92 467.74
Broad Money M2 IDRtn 955.70 1,033.53 1,203.22 1,382.07 1,643.20 1,883.85 1,859.89 1,890.83 1,909.68 1,905.48 1,917.09
Outstanding Loan IDRtn 437.90 553.55 689.67 787.14 995.11 1,300.18 1,281.77 1,293.07 1,297.29 1,290.02 1,297.96
Outstanding Deposit IDRtn 859.60 923.76 1,078.52 1,230.97 1,459.44 1,673.82 1,667.88 1,703.28 1,722.50 1,714.52 1,722.36
1-month SBI rate % p.a 8.39 7.51 12.75 9.92 8.00 10.95 10.13 8.78 8.30 7.84 7.35 6.97 6.77
Lending rate (working capital) % p.a 15.07 13.41 16.23 15.07 13.00 15.22 15.23 15.08 14.99 14.82 14.68
3-month deposit rate, eop % p.a 7.14 6.71 11.75 9.71 7.42 11.97 11.80 11.58 10.97 10.24 9.59
Overnight rate, eop % p.a 8.25 4.79 9.36 6.06 4.50 9.40 8.96 8.49 8.08 7.77 7.49
Prices
Headline CPI (2007=100) Index N/A N/A 136.86 145.89 155.5 113.86 113.78 114.02 114.27 113.92 113.97 114.10 114.61
Year on year inflation rate % N/A N/A N/A 6.60 6.59 11.06 9.17 8.6 7.92 7.31 6.04 3.65 2.71
Month on month inflation rate % -0.4 1.21 1.1 -0.04 -0.07 0.21 0.22 -0.31 0.04 0.11 0.45
Year to date inflation rate % N/A 11.06 -0.07 0.14 0.36 0.05 0.10 0.21 0.66
Wholesale Price Index
(2000=100)Index 423 459 167 178 217 238.0 158 161 161 161 161
Trade
Export USDbn 5.24 6.63 8.12 9.61 10.86 8.69 7.15 7.08 8.61 8.45 9.21 9.33
Oil USDbn 1.17 1.72 1.83 1.90 2.51 1.24 0.95 1.02 1.28 1.25 1.14 1.45
Non oil USDbn 4.07 4.91 6.30 7.72 8.36 7.45 6.21 6.06 7.33 7.20 8.07 7.88
Import USDbn 2.89 4.97 4.89 4.97 6.81 6.29 5.41 4.56
Oil USDbn 0.58 1.20 1.34 1.37 2.39 0.98 1.27 0.77
Non oil USDbn 2.31 3.78 3.55 3.60 4.42 5.31 4.14 3.80
Trade Balance USDbn 2.35 1.65 3.30 4.56 4.06 2.40 1.75 2.52
Output
GDP (current price) IDRtn 512.56 599.48 758.47 873.18 1034.86 1274.29 1301.79 1365.46
GDP (constant price at 2000) IDRtn 392.64 418.13 439.48 466.10 493.37 518.94 527.33 540.06
Real Growth % YoY 4.86 6.49 5.11 6.06 5.88 5.20 4.44 3.99
Capital Market
JCI Index, eop Index 691.9 1000.2 1162.6 1805.5 2745.83 1355.41 1332.67 1285.48 1434.07 1722.77 1916.83 2026.78 2323.24
Volume, avg shares mn 751.8 1402.7 904.9 2394.5 3155.65 1743.25 1623.93 1697.06 1584.47 5058.27 6459.30 6899.89 5304.81
Value, avg IDRbn 433.9 827.4 885.5 1985.7 4340.55 1454.61 1293.98 1087.95 1342.90 3362.99 5658.00 4345.66 4105.06
Consumer Confidence Index 119.1 86.6 99.1 99.10 90.60 92.80 96.40 98.60 102.50 105.90 109.10 115.40
2007 20082009
Indicators 2003 2004Unit 20062005
Disclaimer: This material is for information only, and we are not soliciting any action based upon it. This report is not to beconstrued as an offer to sell or the solicitation of an offer to buy any security in any jurisdiction where such an offer or
solicitation would be illegal. The information herein has been obtained from sources believed to be reliable, but we do not warrant that it is accurate or complete, and it should not be relied upon as such. Opinion expressed is our current opinion as of the date appearing on this material only, and subject to change without notice. It is intended for the use by recipient only and
may not be reproduced or copied/photocopied or duplicated or made available in any form, by any means, or redistributed to others without written permission of PT Bank Mandiri Tbk. Additional information is available upon request. For further information please contact: Office of Chief Economist, Ph. (021) 524 5516/5272 or Facs. (021) 521 0430.
© Office of Chief Economist Page 24 of 24
OOvveerrsseeaass OOffffiicceess
Hongkong Branch
7th
Floor, Far East Finance Centre
16 Harcourt Road, Hongkong
Tel: 852-2527-6611
Fax: 852-2529-8131
Singapore Branch
3 Anson Road #12-01/02, Springleaf Tower
Singapore 079909
Tel: 65-6213-5688
Fax: 65-6438-3363
Cayman Islands Branch
Cardinal Plaza 3rd
Floor
30 Cardinal Avenue, PO Box 10198,
Grand Cayman, KY1-1002, Cayman Islands
Tel: 1-345-945-8891
Fax: 1-345-945-8892
Bank Mandiri (Europe) Limited, London
Cardinal Court (2nd
Floor),
23 Thomas More Street
London EIW IYY, United Kingdom
Tel: 44-207-553-8688
Fax: 44-207-553-8699
Shanghai Representative Office
3401, Bank of China Tower
200 Yin Cheng (M) Road,
Pudong New Area, Shanghai, 200120
People’s Republic of China
Tel: 86-21-5037-2509
Fax: 86-21-5037-2507
Dilli Branch – Timor Leste
Avenida Presidente Nicolao Lobato
No.12, Colmera
Dilli – Timor Leste
Tel: +670-331-7777
Fax: +670-331-7190/74444
HHeeaadd OOffffiiccee
Plaza Mandiri
Jl. Jend. Gatot Subroto Kav. 36-38
Jakarta 12190, Indonesia
Tel: (62-21) 526 5045 – 526 5095
Fax: (62-21) 526 8372 – 526 5008
Website: www.bankmandiri.co.id
Agus Martowardojo
President Director & CEO
Tel: (62-21) 524 5001, Fax: (62-21) 526 3459
I Wayan Agus Mertayasa
Deputy President Director
Tel: (62-21) 524 5969, Fax: (62-21) 526 3408
Riswinandi
Director Corporate Banking
Tel: (62-21) 524 5108, Fax: (62-21) 5296 4053
Zulkifli Zaini
Director Commercial Banking
Tel: (62-21) 524 5274, Fax: (62-21) 526 3617
Budi Gunadi Sadikin
Director Micro & Retail Banking
Tel: (62-21) 524 5649, Fax: (62-21) 252 1585
Thomas Arifin
Director Treasury & International Banking
Tel: (62-21) 524 5245, Fax: (62-21) 526 3763
Abdul Rachman
Director Special Assets Management
Tel: (62-21) 524 5653, Fax: (62-21) 252 4651
Ogi Prastomiyono
Director Compliance & Human Capital
Tel: (62-21) 524 5345, Fax: (62-21) 252 4651
Sentot A. Sentausa
Director Risk Management
Tel: (62-21) 524 5801, Fax: (62-21) 526 8213
Sasmita
Director Technology & Operation
Tel: (62-21) 524 5580, Fax: (62-21) 252 1585
Bambang Setiawan
Director Corporate Secretary, Legal & Customer Care
Tel: (62-21) 524 5040, Fax: (62-21) 252 1585
Pahala N. Mansury
EVP Coordinator Finance & Strategy
Tel: (62-21) 524 5577, Fax: (62-21) 526 8213
Haryanto Budiman
EVP Coordinator Change Management Office
Tel: (62-21) 524 5243, Fax: (62-21) 526 8213
Mansyur S. Nasution
EVP Coordinator Consumer Finance
Tel: (62-21) 524 5036, Fax: (62-21) 5296 4116
Riyani T. Bondan
EVP Coordinator Internal Audit
Tel: (62-21) 524 5131, Fax: (62-21) 526 3623