Embed Size (px)
Citation preview
PhilipsLighting
June 23, 1998
John WhybrowPresident and
CEO PhilipsLighting
PhilipsLighting
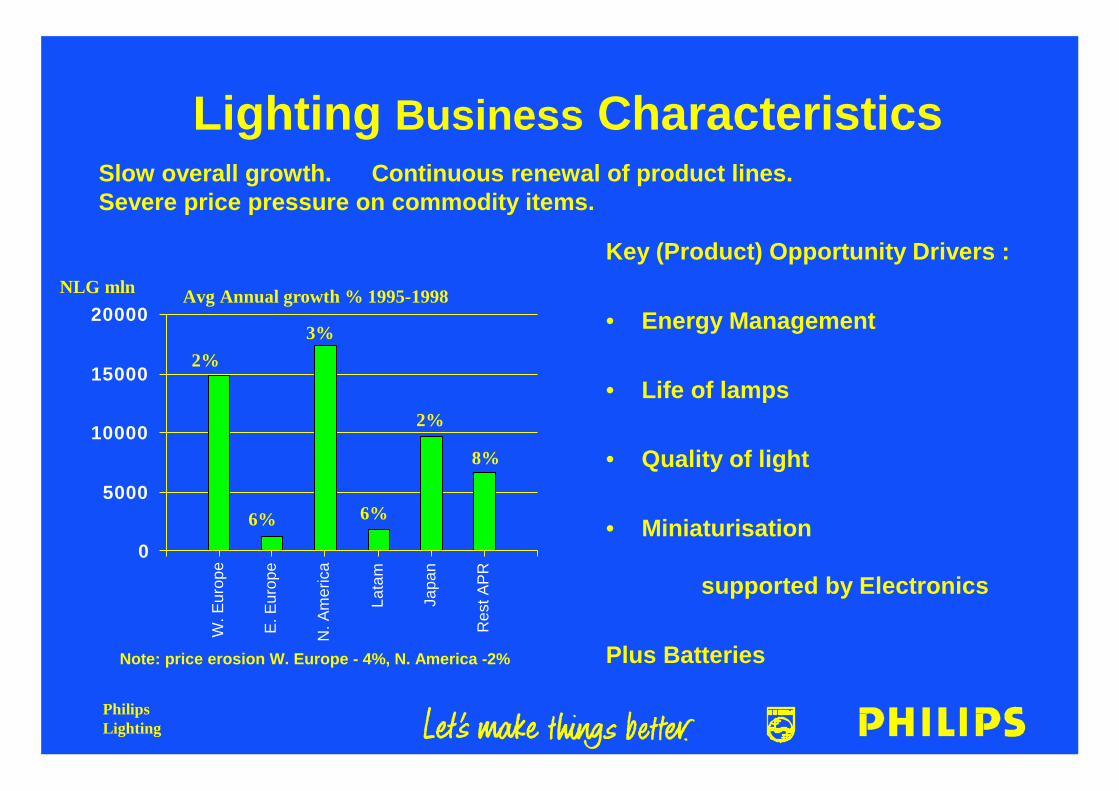
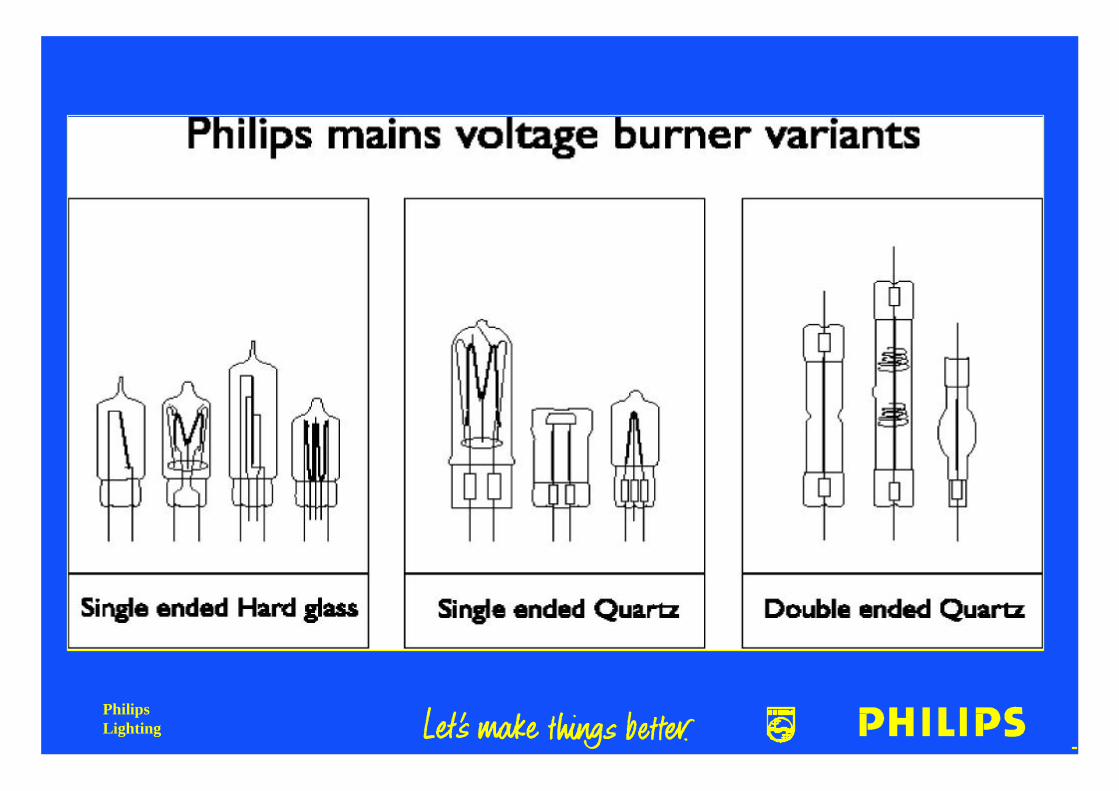
Lighting Business Characteristics
0
5000
10000
15000
20000
W. E
urop
e
E. E
urop
e
N. A
mer
ica
Lata
m
Japa
n
Res
t AP
R
Key (Product) Opportunity Drivers :
• Energy Management
• Life of lamps
• Quality of light
• Miniaturisation
supported by Electronics
Plus Batteries
Slow overall growth. Continuous renewal of product lines.Severe price pressure on commodity items.
NLG mln Avg Annual growth % 1995-1998
2%
6%
3%
6%
2%
8%
Note: price erosion W. Europe - 4%, N. America -2%
PhilipsLighting
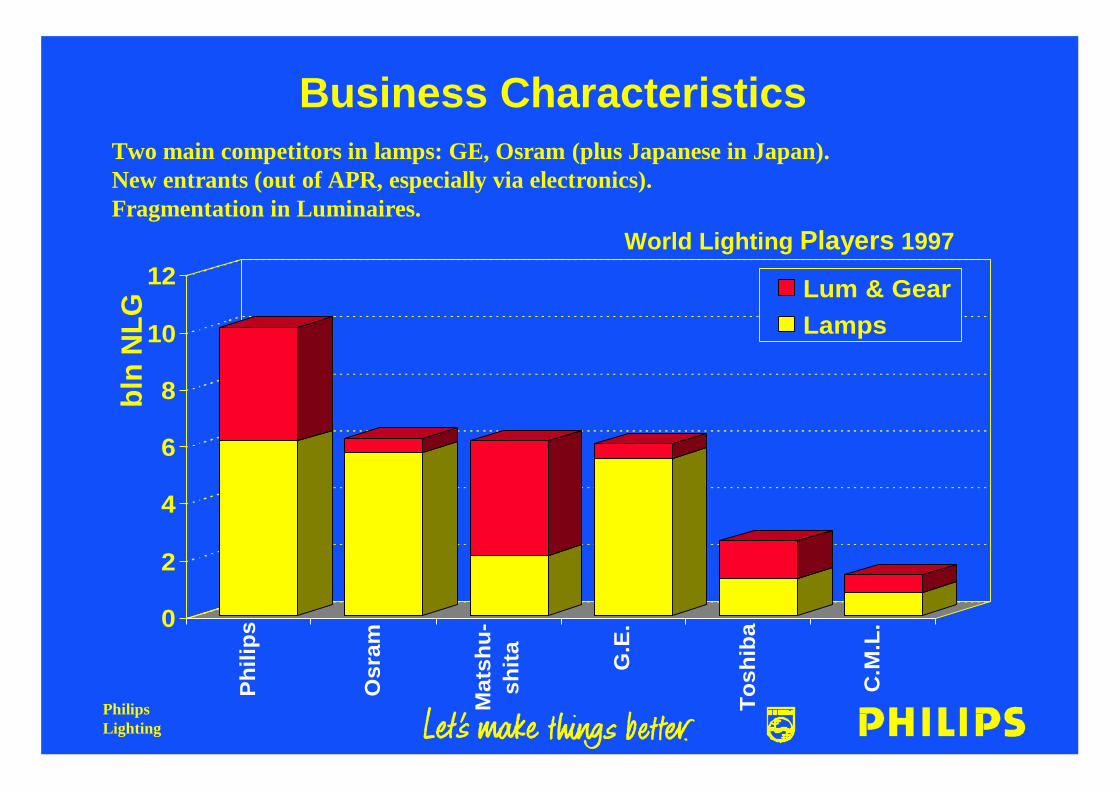
Business Characteristics
0
2
4
6
8
10
12P
hili
ps
Osr
am
Mat
shu
-sh
ita
G.E
.
To
shib
a
C.M
.L.
Lum & GearLamps
bln
NLG
Two main competitors in lamps: GE, Osram (plus Japanese in Japan).New entrants (out of APR, especially via electronics).Fragmentation in Luminaires.
World Lighting Players 1997
PhilipsLighting
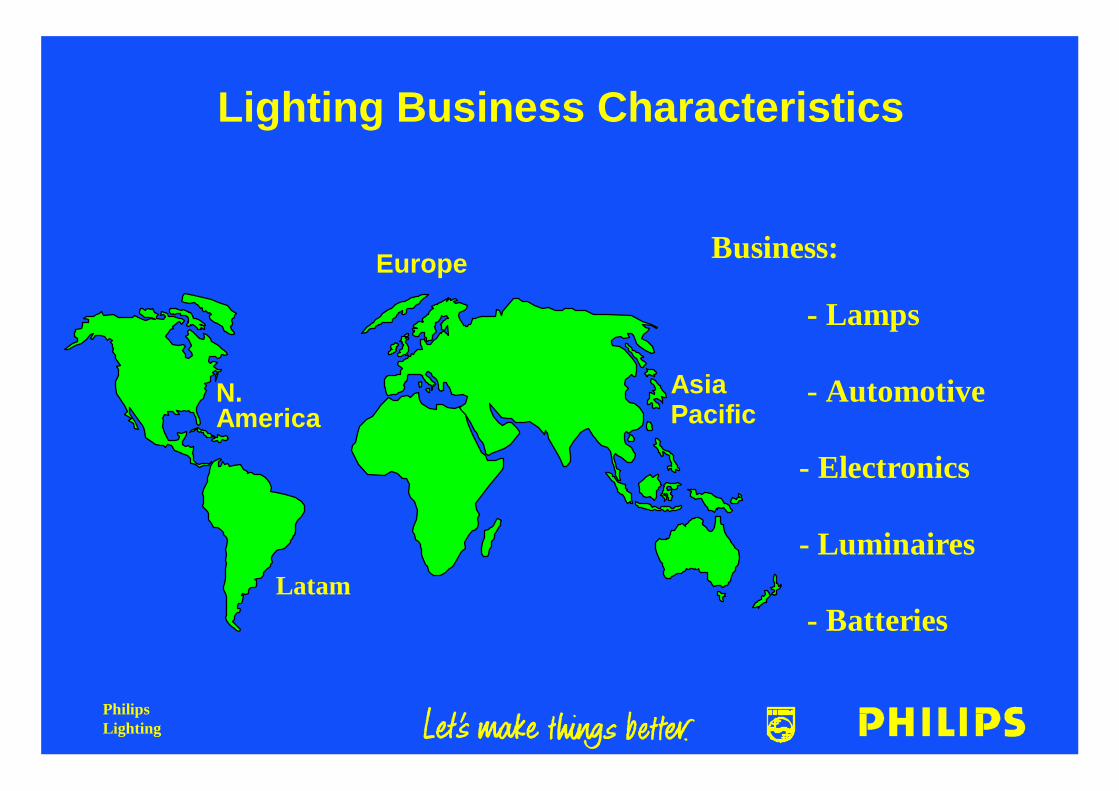
Lighting Business Characteristics
Business:
- Lamps
- Automotive
- Electronics
- Luminaires
- Batteries
N. America
Europe
Asia Pacific
Latam
PhilipsLighting
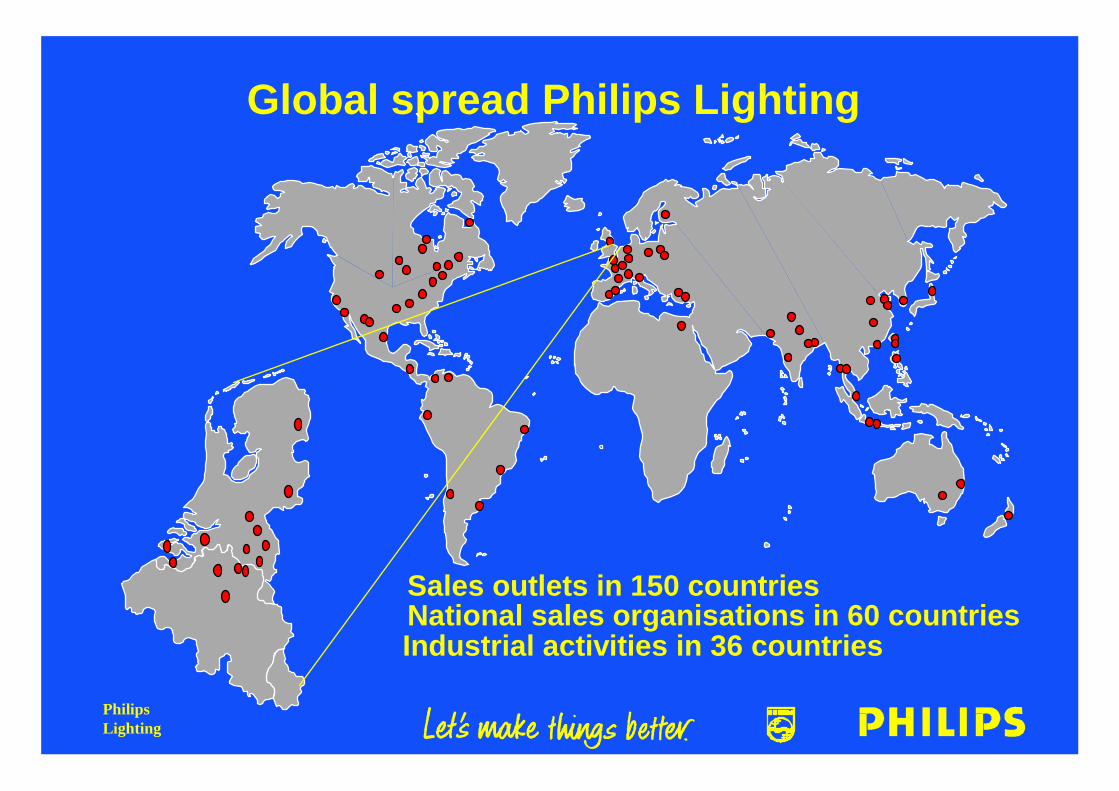
Global spread Philips Lighting
Sales outlets in 150 countriesNational sales organisations in 60 countriesIndustrial activities in 36 countries
PhilipsLighting
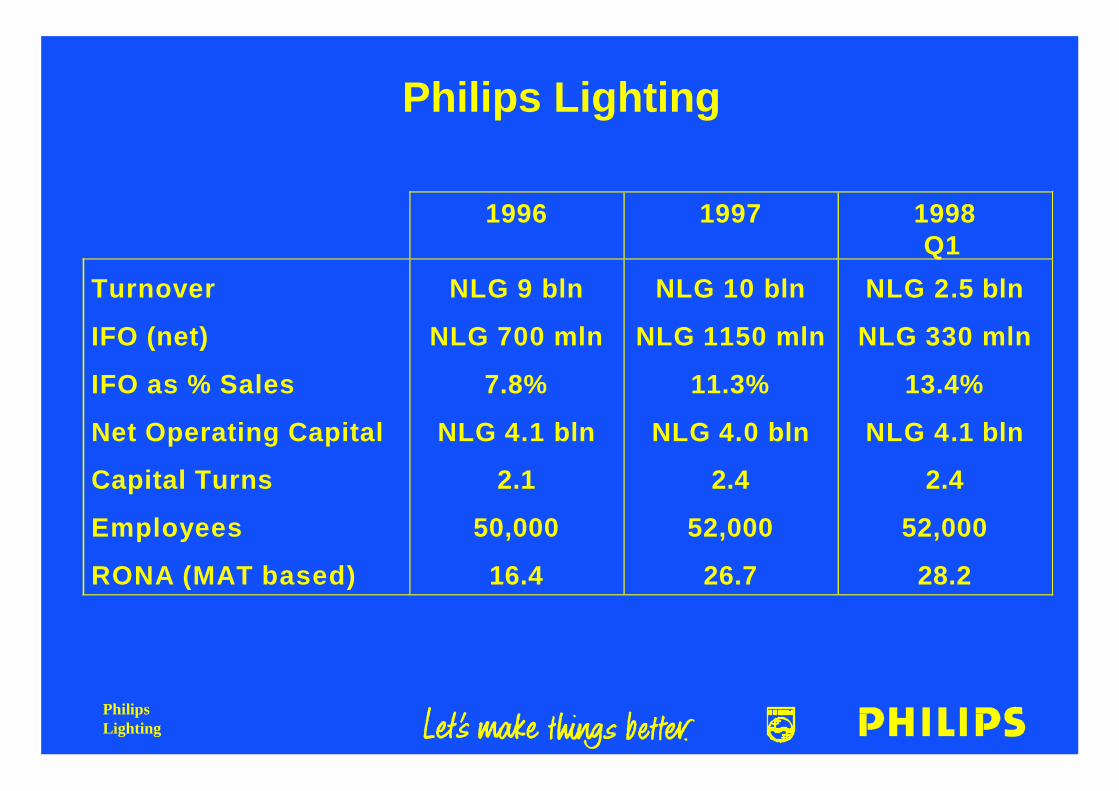
Philips Lighting
1996 1997 1998Q1
Turnover
IFO (net)
IFO as % Sales
Net Operating Capital
Capital Turns
Employees
RONA (MAT based)
NLG 9 bln
NLG 700 mln
7.8%
NLG 4.1 bln
2.1
50,000
16.4
NLG 10 bln
NLG 1150 mln
11.3%
NLG 4.0 bln
2.4
52,000
26.7
NLG 2.5 bln
NLG 330 mln
13.4%
NLG 4.1 bln
2.4
52,000
28.2
PhilipsLighting
Philips Lighting
• 107 years old.
• A cornerstone of Philips.
• Well respected.
PhilipsLighting
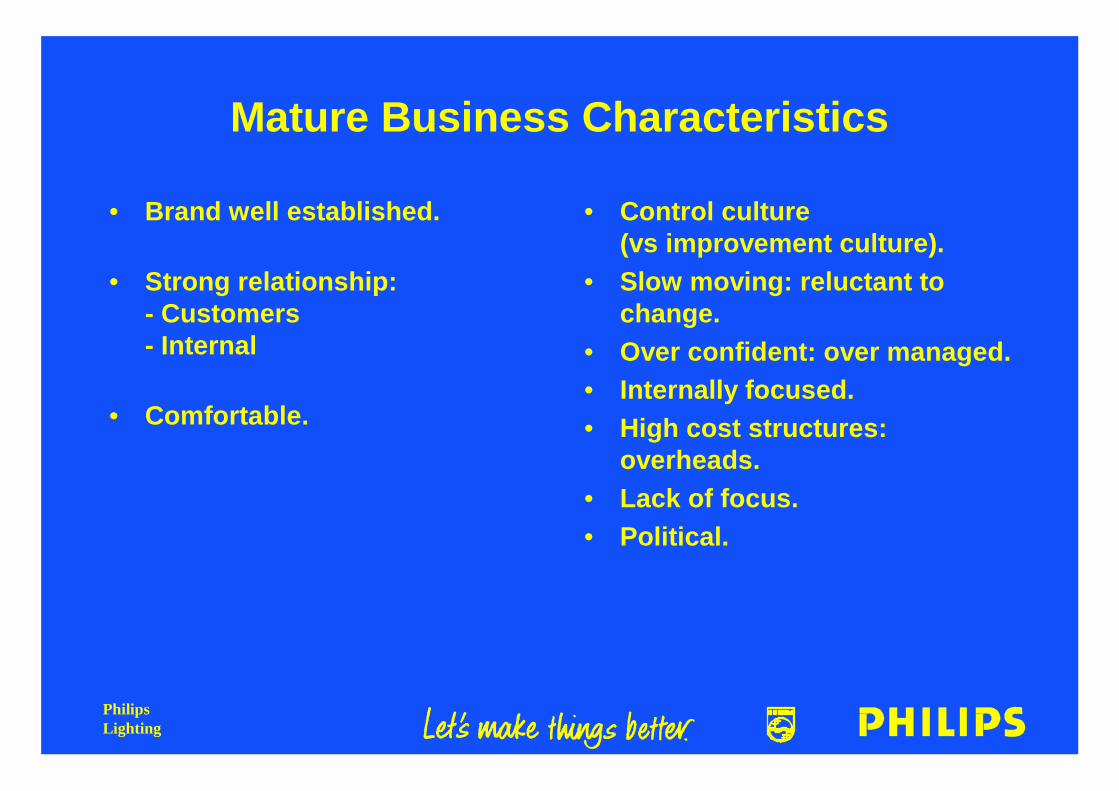
Mature Business Characteristics
• Brand well established.
• Strong relationship:- Customers- Internal
• Comfortable.
• Control culture(vs improvement culture).
• Slow moving: reluctant tochange.
• Over confident: over managed.• Internally focused.• High cost structures:
overheads.• Lack of focus.• Political.
PhilipsLighting
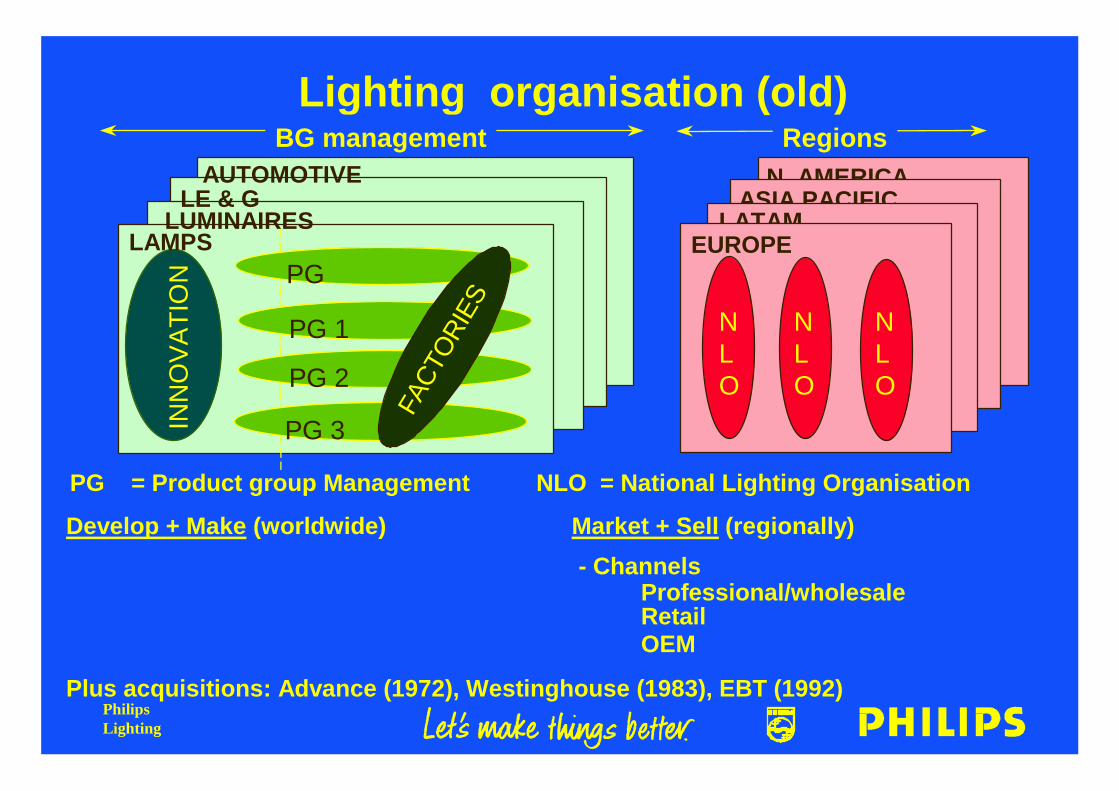
Lighting organisation (old)
N. AMERICAASIA PACIFIC
LATAM
RegionsBG management
PG = Product group Management NLO = National Lighting Organisation
LAMPS
INN
OV
ATI
ON
LUMINAIRESLE & G
AUTOMOTIVE
PG
PG 1
PG 2
PG 3FA
CTO
RIES
EUROPE
NLO
NLO
NLO
Develop + Make (worldwide) Market + Sell (regionally)
- ChannelsProfessional/wholesaleRetailOEM
Plus acquisitions: Advance (1972), Westinghouse (1983), EBT (1992)
PhilipsLighting
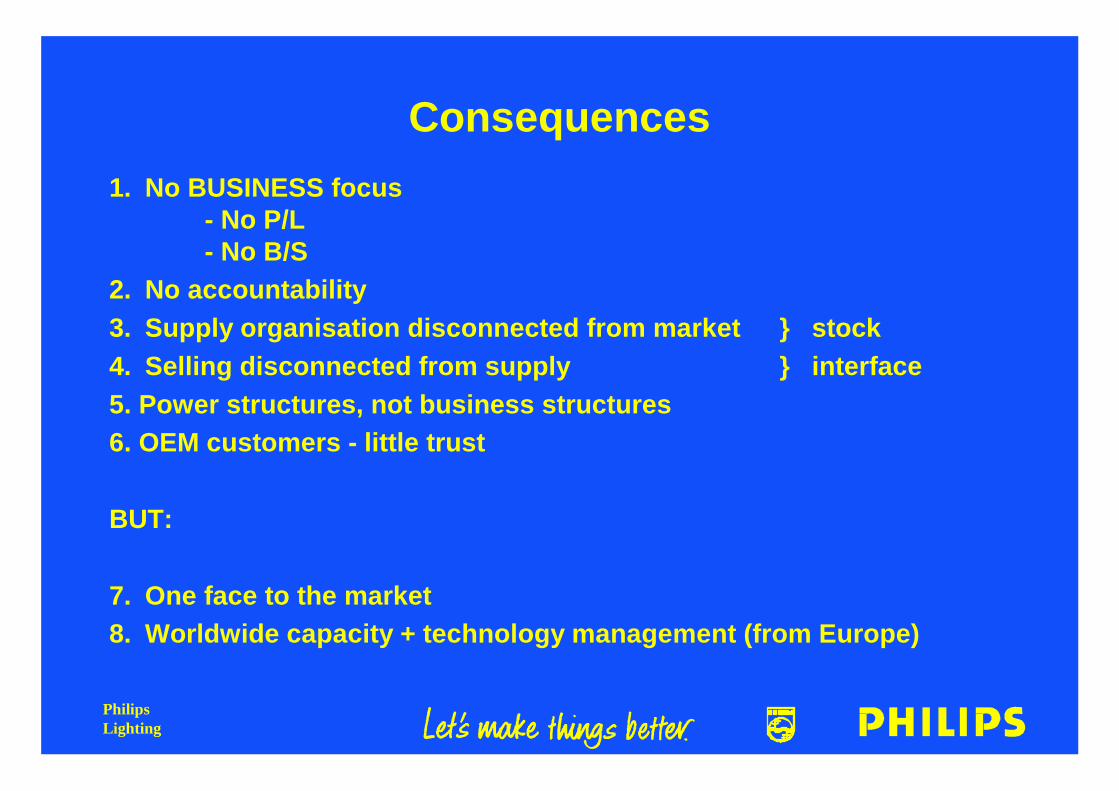
Consequences1. No BUSINESS focus
- No P/L- No B/S
2. No accountability3. Supply organisation disconnected from market } stock4. Selling disconnected from supply } interface5. Power structures, not business structures6. OEM customers - little trust
BUT:
7. One face to the market8. Worldwide capacity + technology management (from Europe)
PhilipsLighting
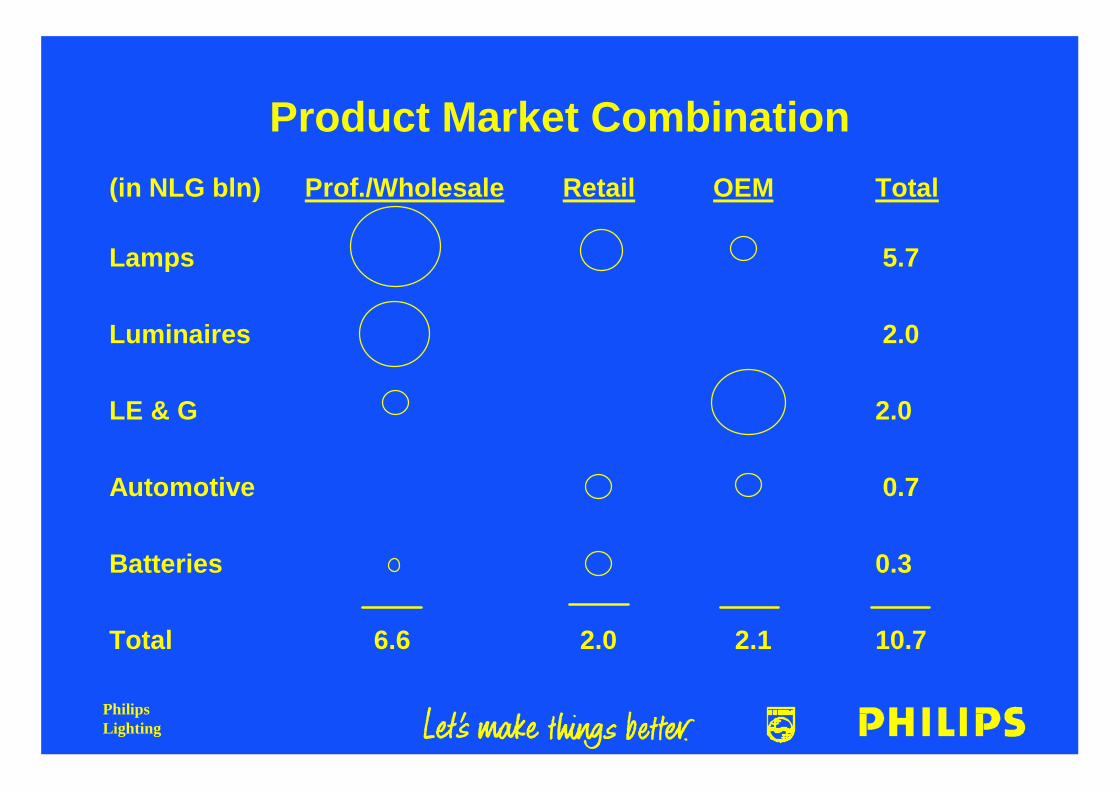
(in NLG bln) Prof./Wholesale Retail OEM Total
Lamps 5.7
Luminaires 2.0
LE & G 2.0
Automotive 0.7
Batteries 0.3
Total 6.6 2.0 2.1 10.7
Product Market Combination
PhilipsLighting
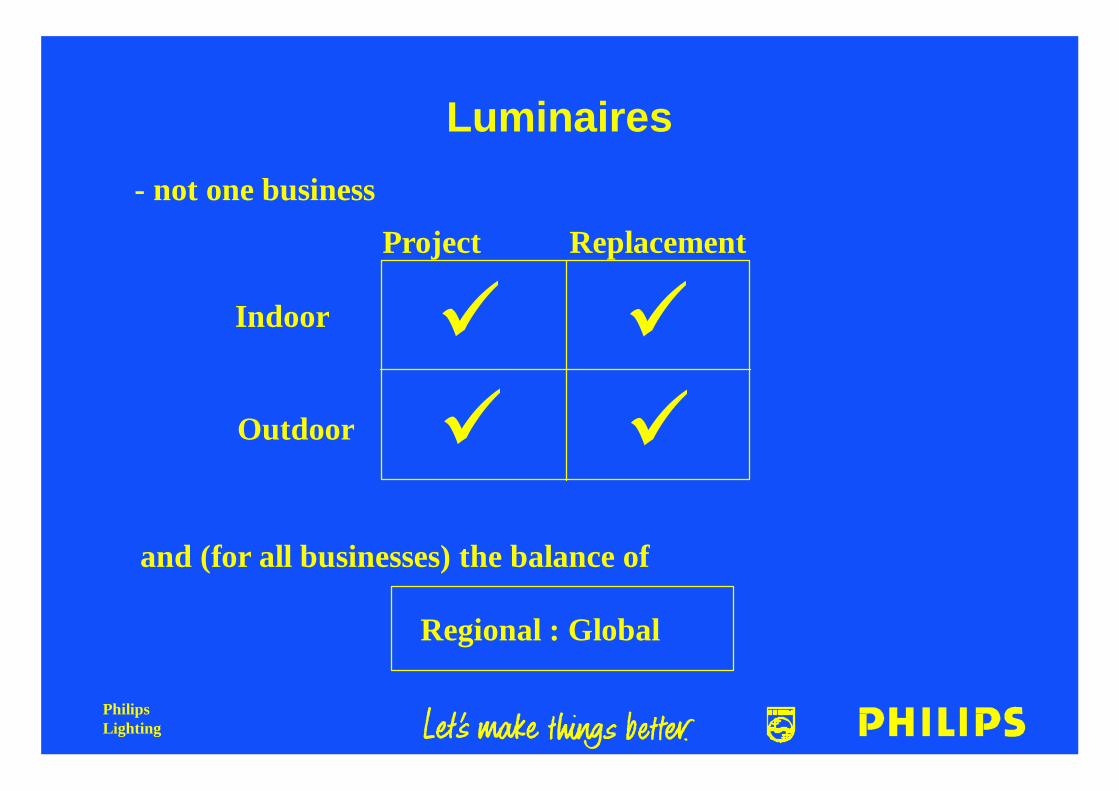
Luminaires
üü
üü
Project Replacement
Indoor
Outdoor
- not one business
and (for all businesses) the balance of
Regional : Global

PhilipsLighting
(in NLG bln) Prof./Wholesale Retail OEM Total
Lamps 5.7
Luminaires 2.0
LE & G 2.0
Automotive 0.7
Batteries 0.3
Total 6.6 2.0 2.1 10.7
Product Market Combination
PhilipsLighting
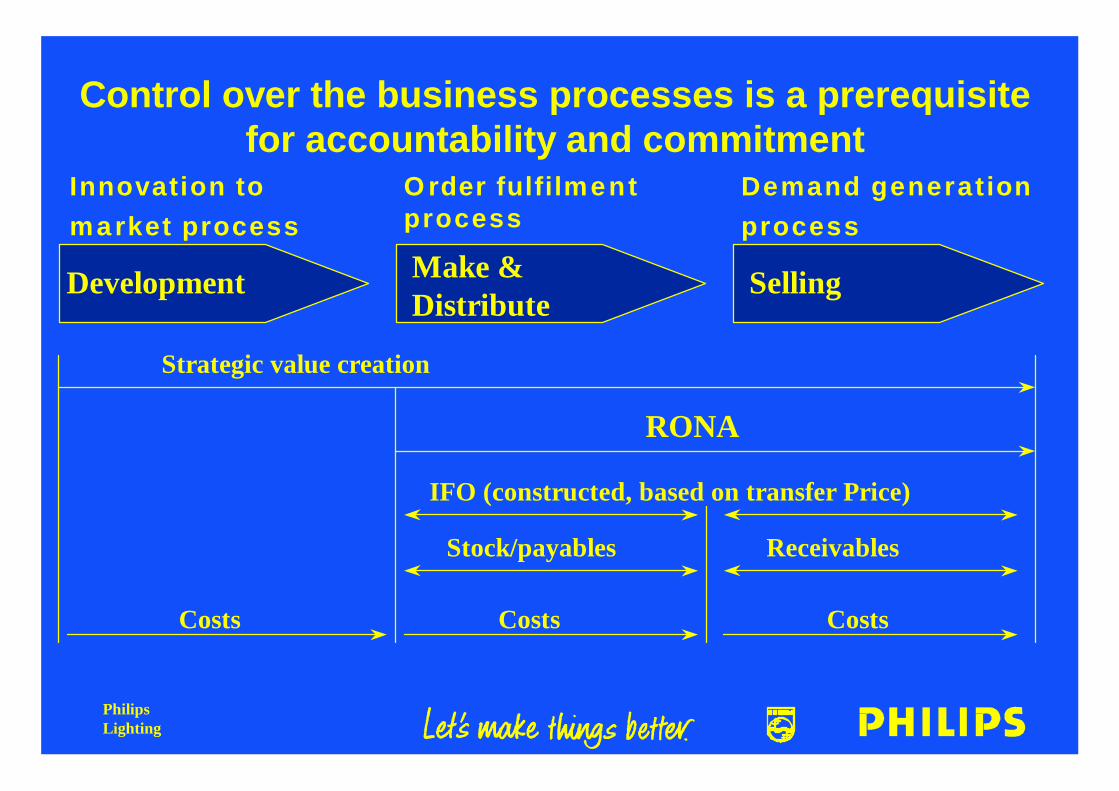
Control over the business processes is a prerequisitefor accountability and commitment
Innovation tomarket process
O rder fulfilmentprocess
Demand generationprocess
Development Make &Distribute
Selling
RONA
IFO (constructed, based on transfer Price)
Stock/payables Receivables
Costs
Strategic value creation
CostsCosts
PhilipsLighting
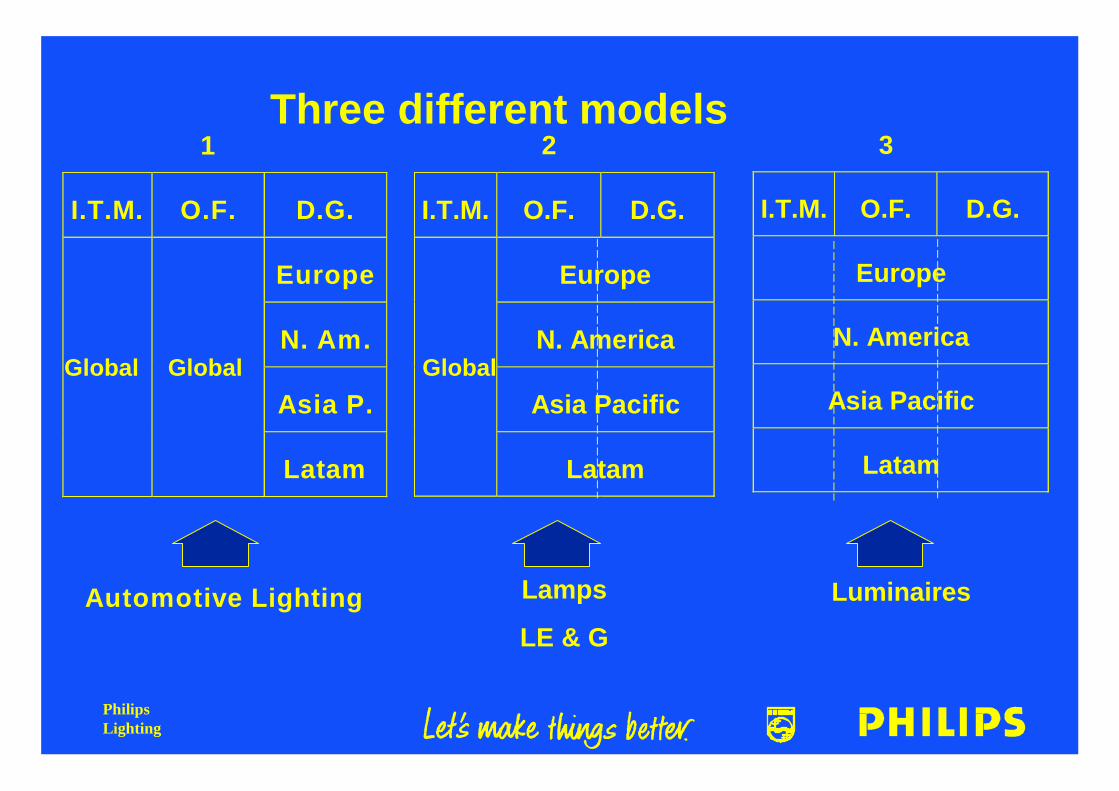
Three different models2
I.T.M. O.F. D.G.
Europe
N. America
Asia Pacific
Latam
Lamps
LE & G
1
I.T.M. O.F. D.G.
Europe
N. Am.
Asia P.
Latam
Automotive Lighting
3
I.T.M. O.F. D.G.
Europe
N. America
Asia Pacific
Latam
Luminaires
Global Global Global
PhilipsLighting
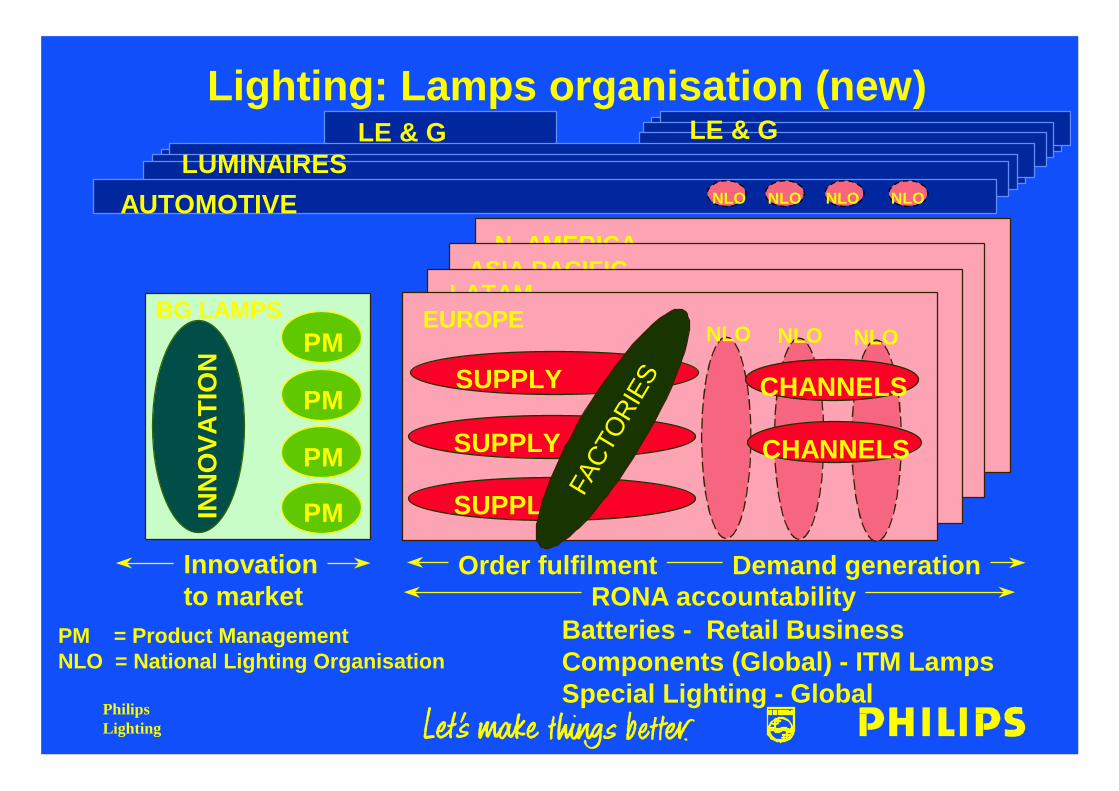
Lighting: Lamps organisation (new)
PM = Product ManagementNLO = National Lighting Organisation
LE & G
Order fulfilmentInnovationto market RONA accountability
N. AMERICAASIA PACIFIC
LATAMBG LAMPS
INN
OV
ATI
ON
PMEUROPE
PM
PM
PM
NLO NLO NLO
SUPPLY
SUPPLY
SUPPLY
CHANNELS
CHANNELS
Demand generation
LE & GLUMINAIRES
NLO NLO NLO NLO
Batteries - Retail BusinessComponents (Global) - ITM LampsSpecial Lighting - Global
FACT
ORI
ES
AUTOMOTIVE
PhilipsLighting
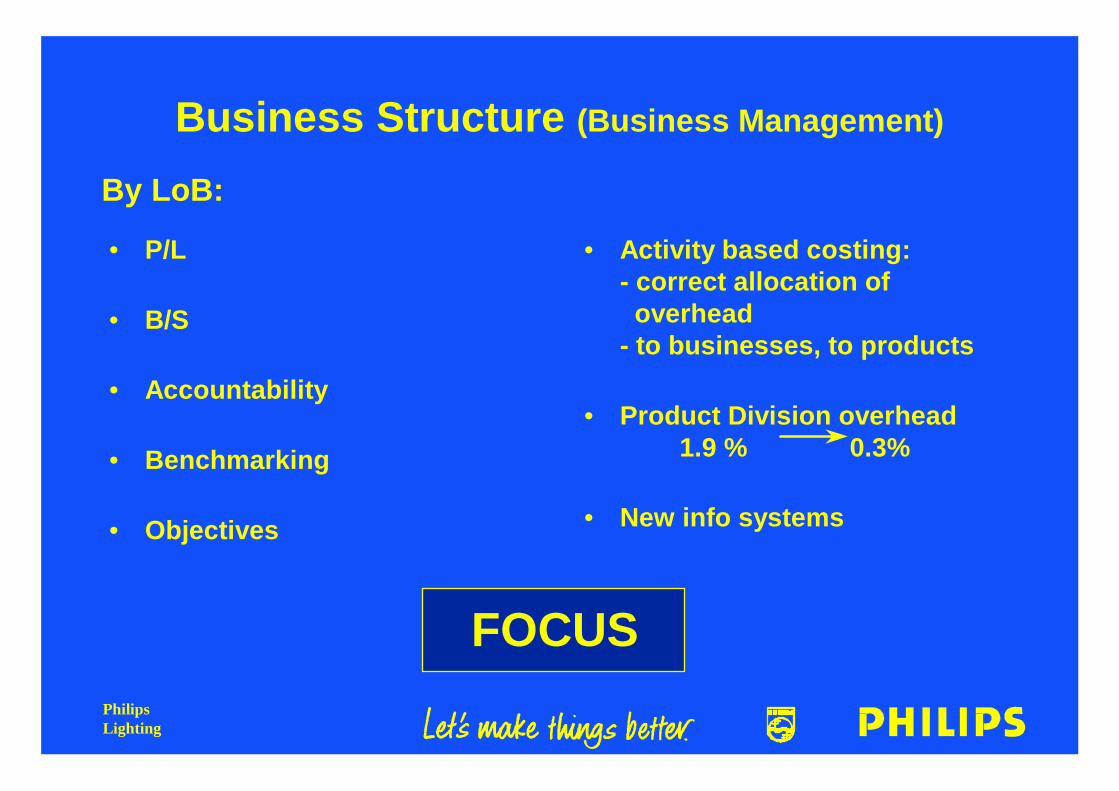
Business Structure (Business Management)
FOCUS
• P/L
• B/S
• Accountability
• Benchmarking
• Objectives
• Activity based costing:- correct allocation of overhead- to businesses, to products
• Product Division overhead1.9 % 0.3%
• New info systems
By LoB:
PhilipsLighting
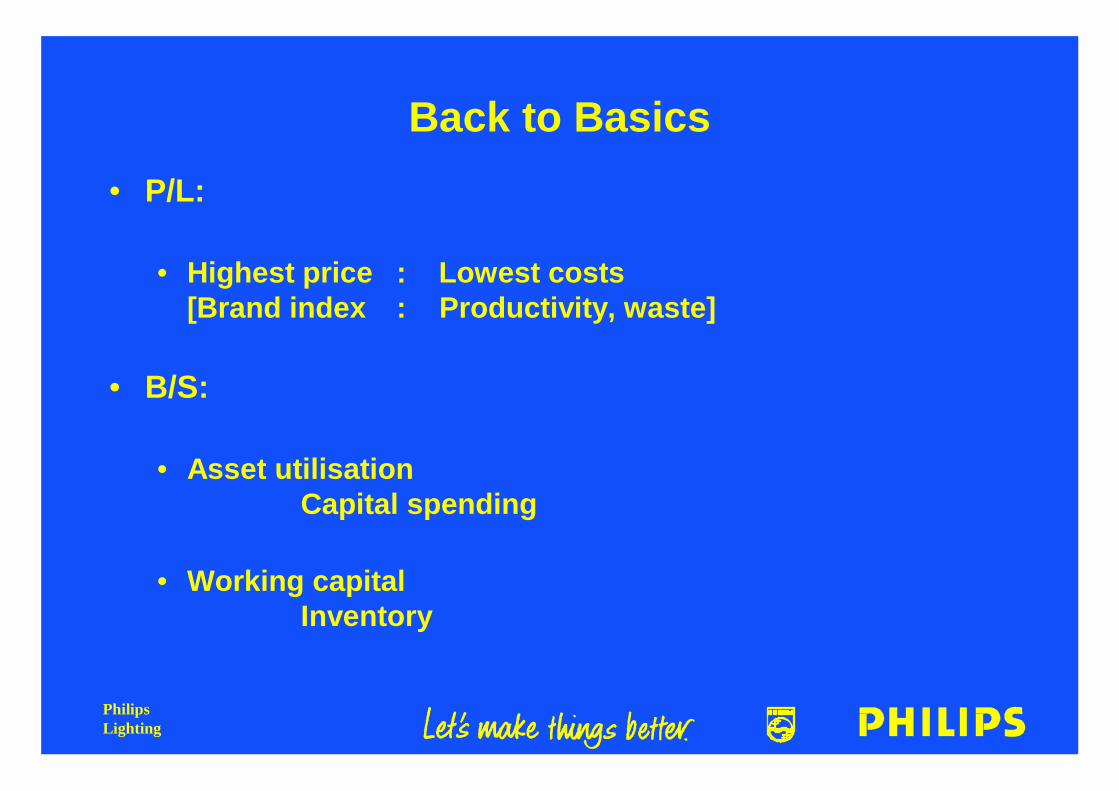
Back to Basics
• P/L:
• Highest price : Lowest costs[Brand index : Productivity, waste]
• B/S:
• Asset utilisationCapital spending
• Working capitalInventory
PhilipsLighting
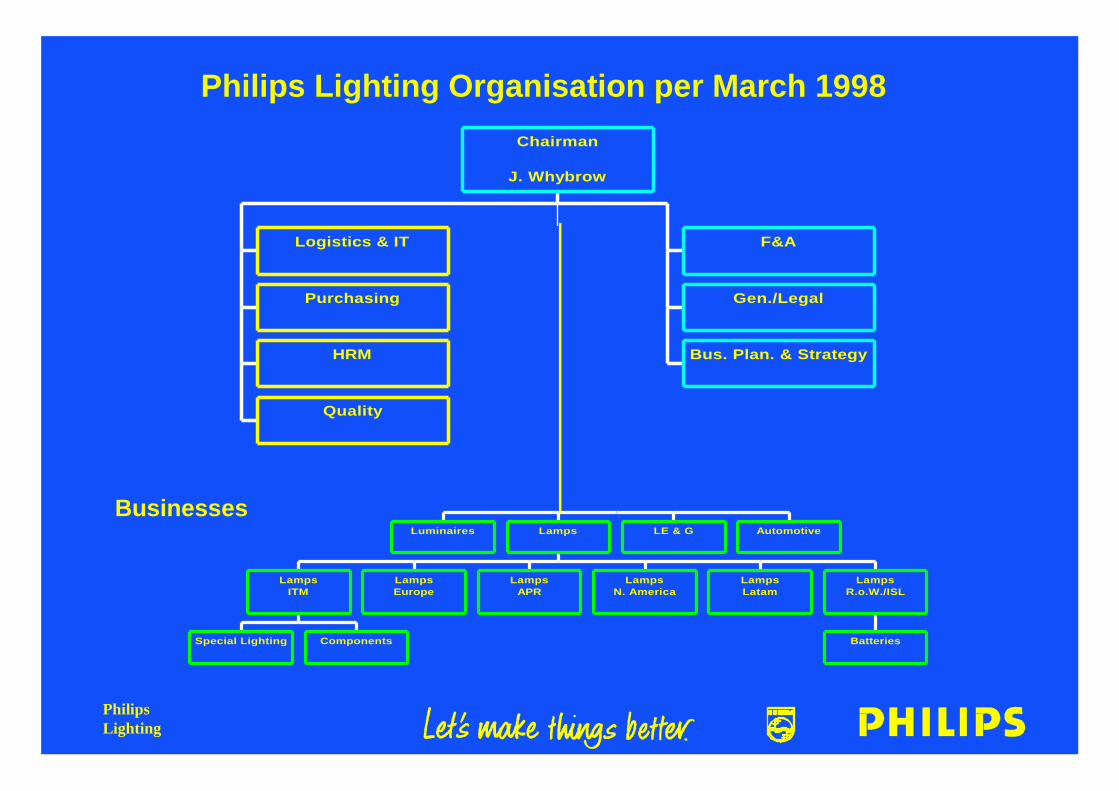
Philips Lighting Organisation per March 1998
Logistics & ITJ. Braat
PurchasingJ. Pipping
HRMH. v. Reenen
QualityM. Chew
F&AR. Ruijter
Gen./LegalH. van Dongen
Bus. Plan. & StrategyC. Frumau
Chairman
J. Whybrow
LuminairesK. Stam
Special LightingP. Hut
ComponentsP. v. Campfort
LampsITM
T. v.d. Put
LampsEurope
H. Willmy
LampsAPR
D. Hamill
LampsN. AmericaL. Wilton
LampsLatam
A. Schevers
BatteriesF. Wishaupt
LampsR.o.W./ISLR. Ruijter
LampsJ. Whybrow
LE & GP. v. Strijp
AutomotiveT. v. Deursen
Businesses

PhilipsLighting
Organisation
Development
Roadshow
PhilipsLighting
CONTENTS
• Financial results• The need for change• Principles & structure• Business process & discipline• Improvement & breakthrough• Strategic plan
PhilipsLighting
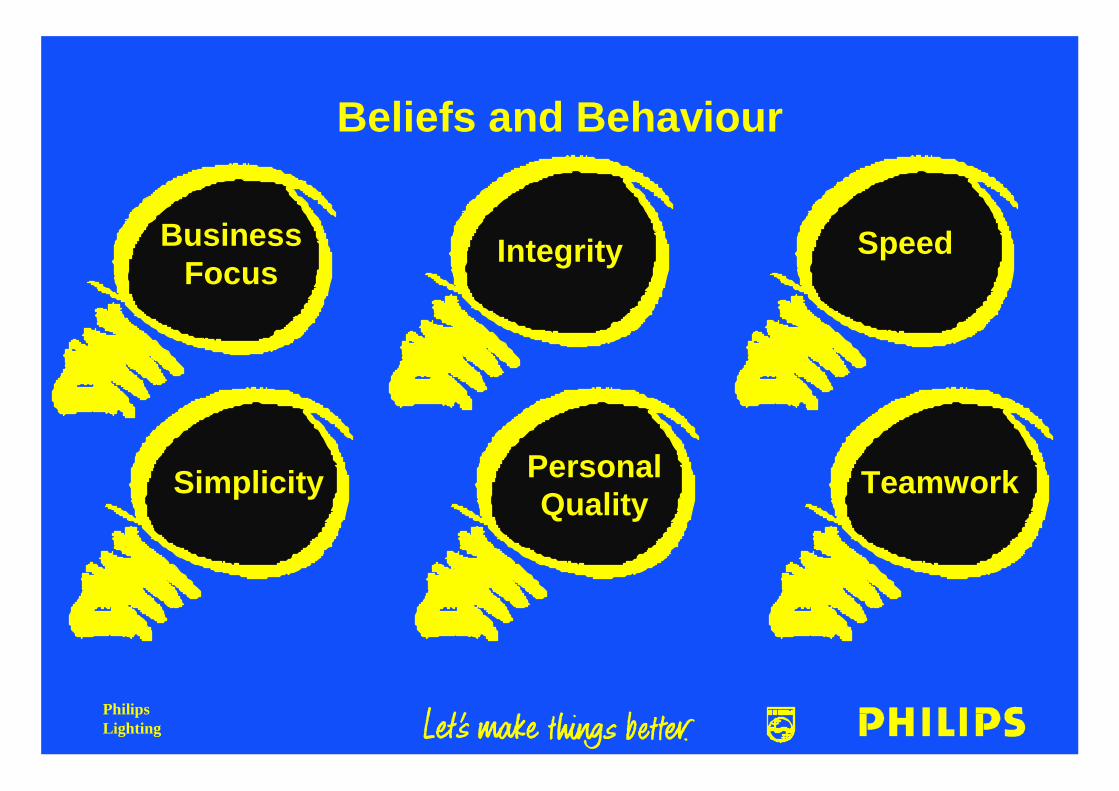
Beliefs and Behaviour
Integrity
Simplicity
Speed
TeamworkPersonalQuality
BusinessFocus
PhilipsLighting
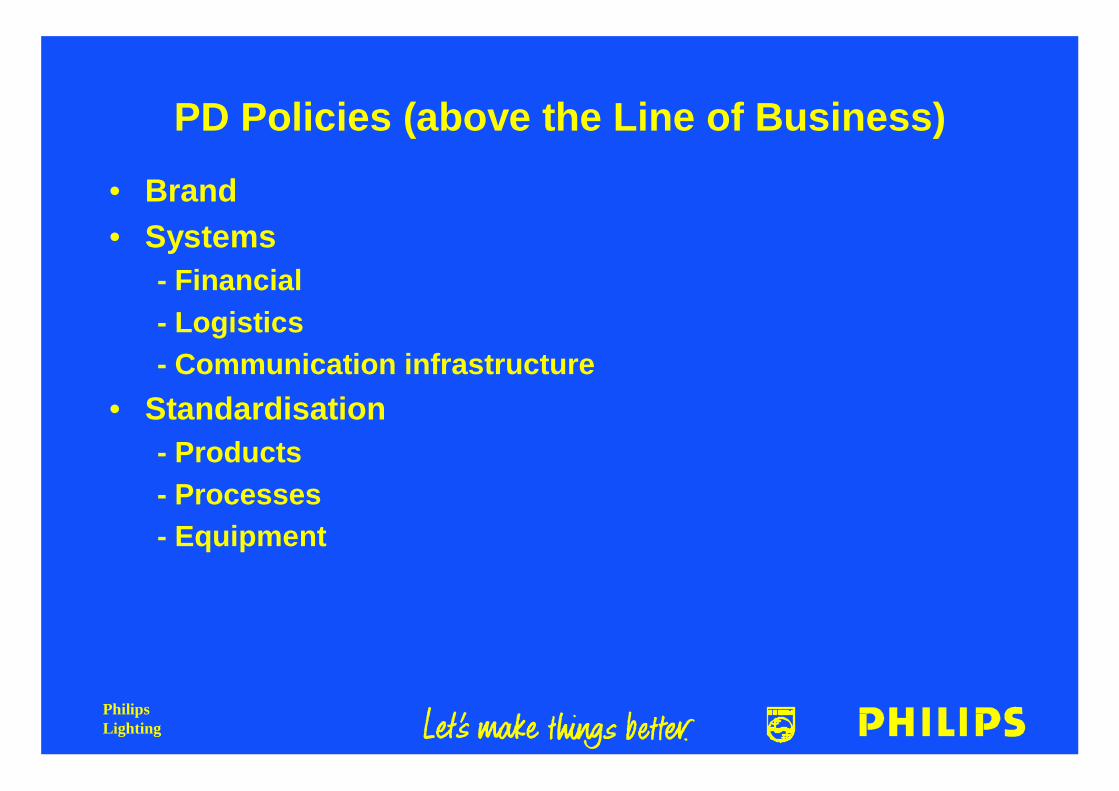
PD Policies (above the Line of Business)
• Brand• Systems
- Financial- Logistics- Communication infrastructure
• Standardisation- Products- Processes- Equipment
PhilipsLighting
PhilipsLighting
PD Policies (above the Line of Business)
• Common view on strategy- Technology- Products
• Improvement principlesBusiness Excellence
• HRM Policies

PhilipsLighting
Components
ITM
PhilipsLighting
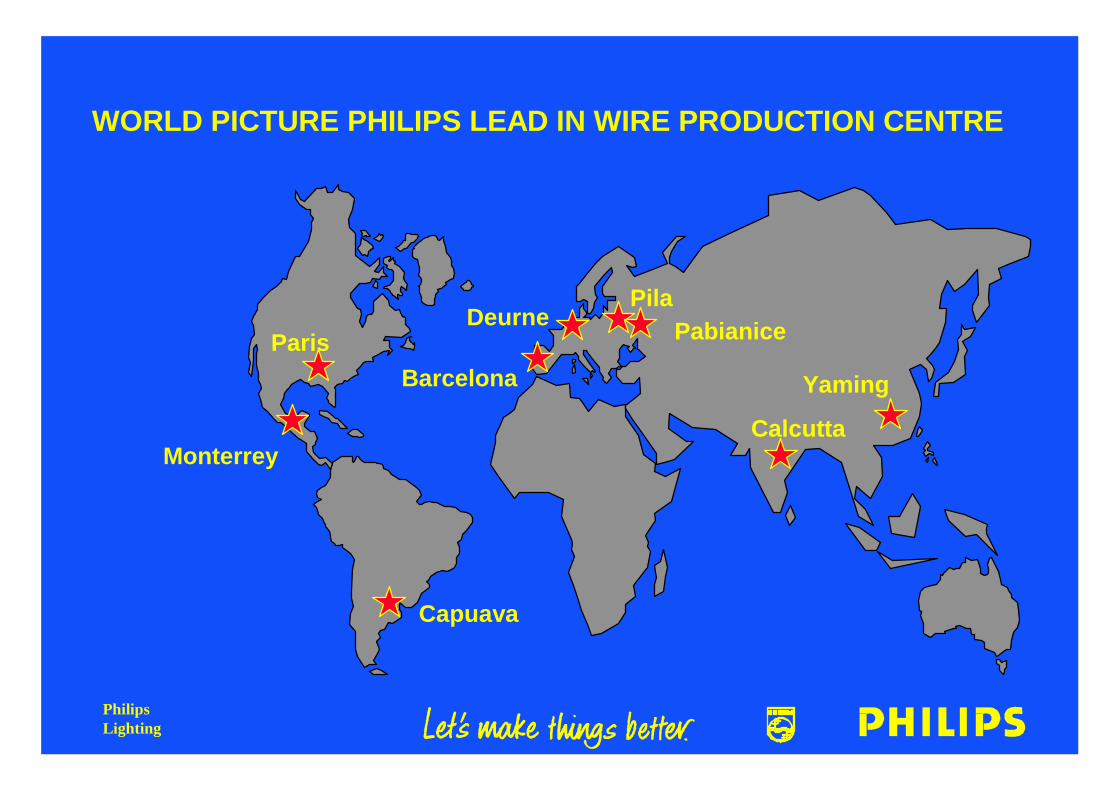
WORLD PICTURE PHILIPS LEAD IN WIRE PRODUCTION CENTRE
DeurnePila
Paris
Capuava
Monterrey
Yaming
Calcutta
Barcelona
Pabianice
PhilipsLighting
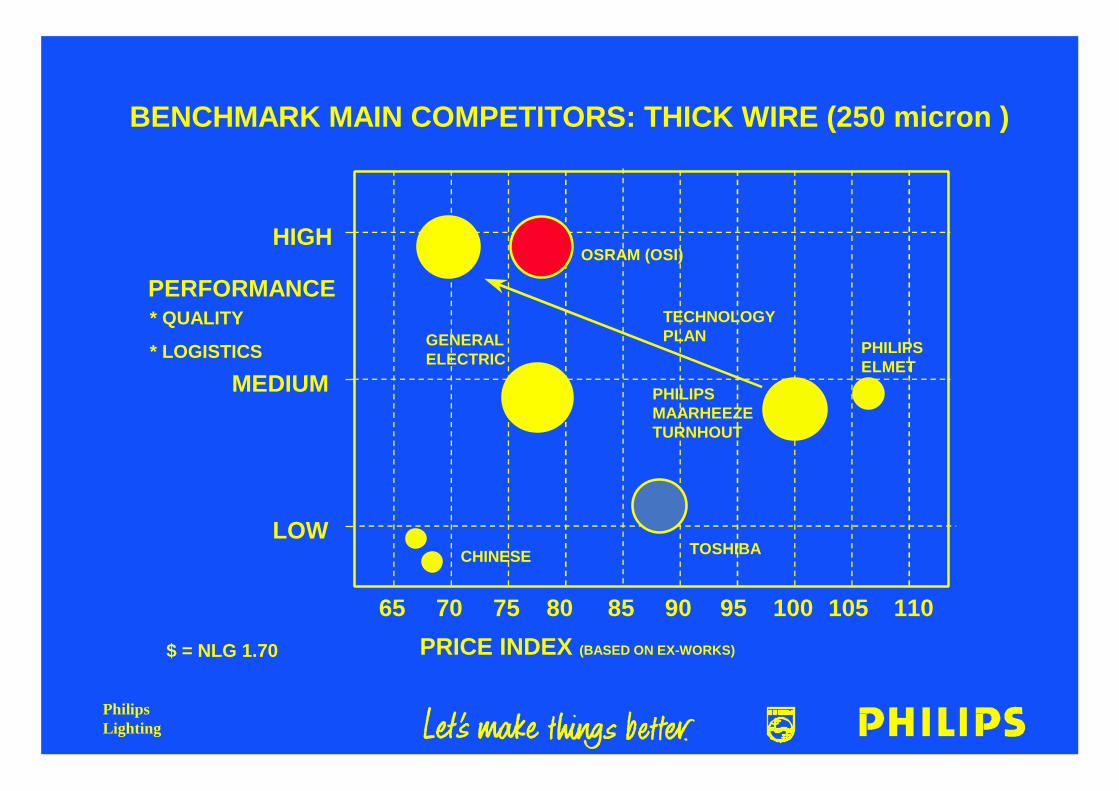
BENCHMARK MAIN COMPETITORS: THICK WIRE (250 micron )
65 70 75 80 90 95 100 105 110
PRICE INDEX (BASED ON EX-WORKS)
PERFORMANCE
HIGH
MEDIUM
LOW
* QUALITY
* LOGISTICS
85
GENERALELECTRIC
CHINESE
$ = NLG 1.70
PHILIPSMAARHEEZETURNHOUT
OSRAM (OSI)
TOSHIBA
PHILIPSELMET
TECHNOLOGYPLAN
PhilipsLighting
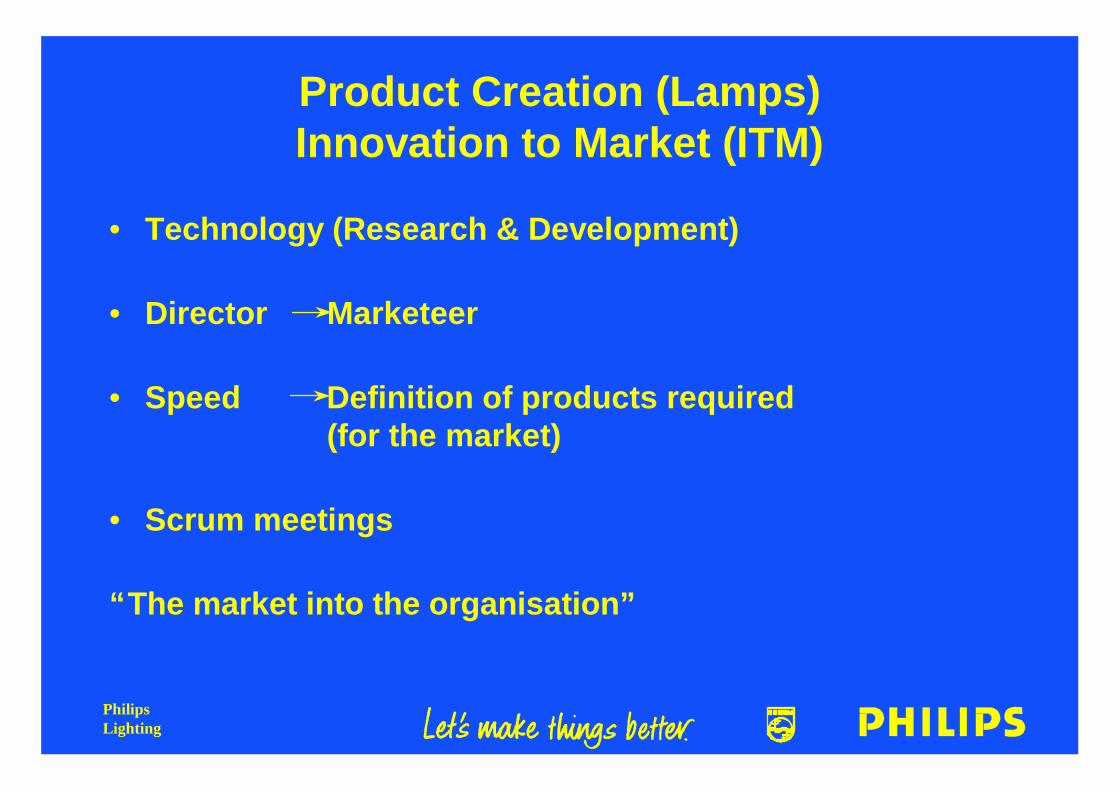
Product Creation (Lamps)Innovation to Market (ITM)
• Technology (Research & Development)
• Director Marketeer
• Speed Definition of products required (for the market)
• Scrum meetings
“The market into the organisation”
PhilipsLighting
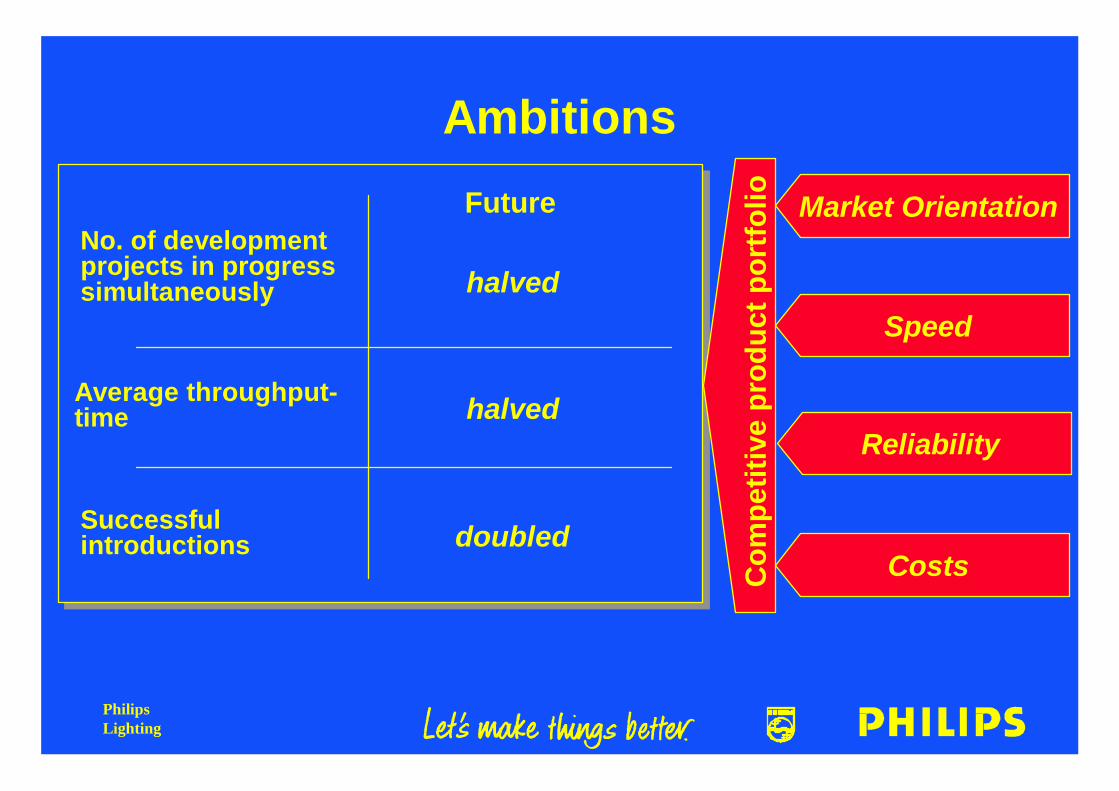
Ambitions
No. of developmentprojects in progresssimultaneously
Average throughput-time
Successfulintroductions
Future
halved
halved
doubled
Reliability
Costs
Market Orientation
Speed
Com
petit
ive
prod
uct p
ortf
olio
PhilipsLighting
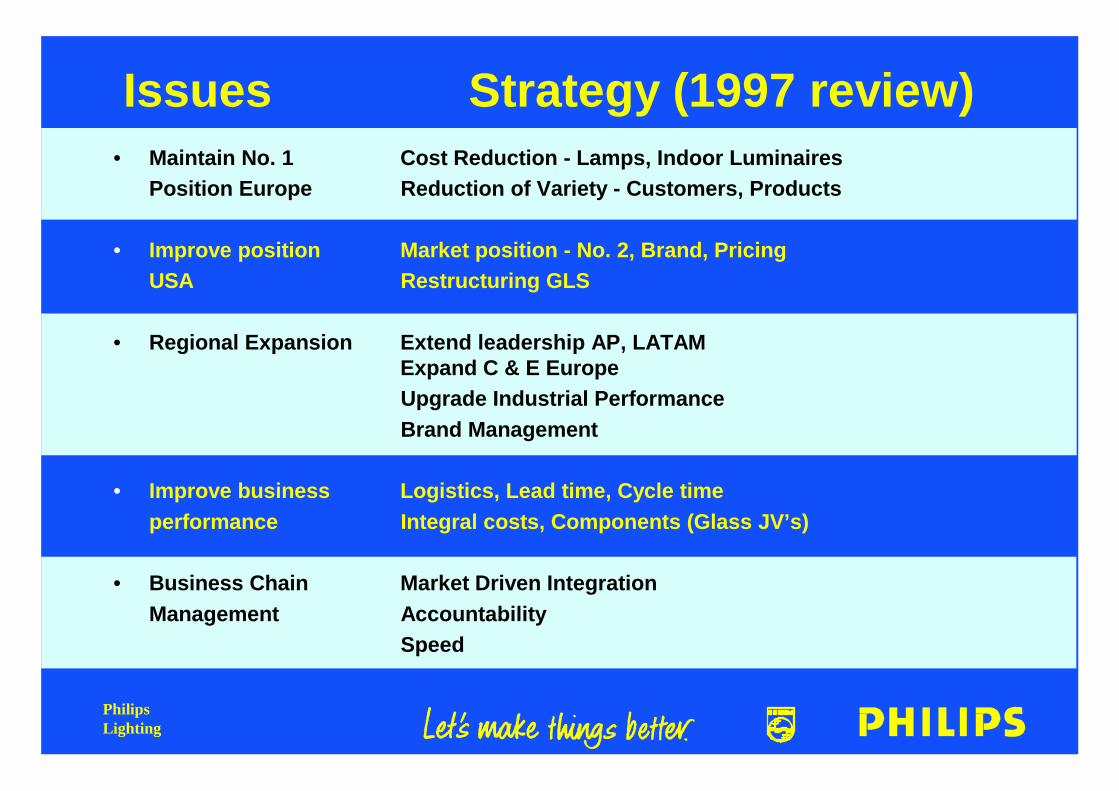
Issues Strategy (1997 review)• Maintain No. 1 Cost Reduction - Lamps, Indoor Luminaires
Position Europe Reduction of Variety - Customers, Products
• Improve position Market position - No. 2, Brand, PricingUSA Restructuring GLS
• Regional Expansion Extend leadership AP, LATAMExpand C & E EuropeUpgrade Industrial PerformanceBrand Management
• Improve business Logistics, Lead time, Cycle timeperformance Integral costs, Components (Glass JV’s)
• Business Chain Market Driven IntegrationManagement Accountability
Speed
PhilipsLighting
Business ExcellenceProgramme
Philips Lighting
PhilipsLighting
BEST for Lighting
BusinessExcellence:
Speed &Teamwork
forLighting
PhilipsLighting
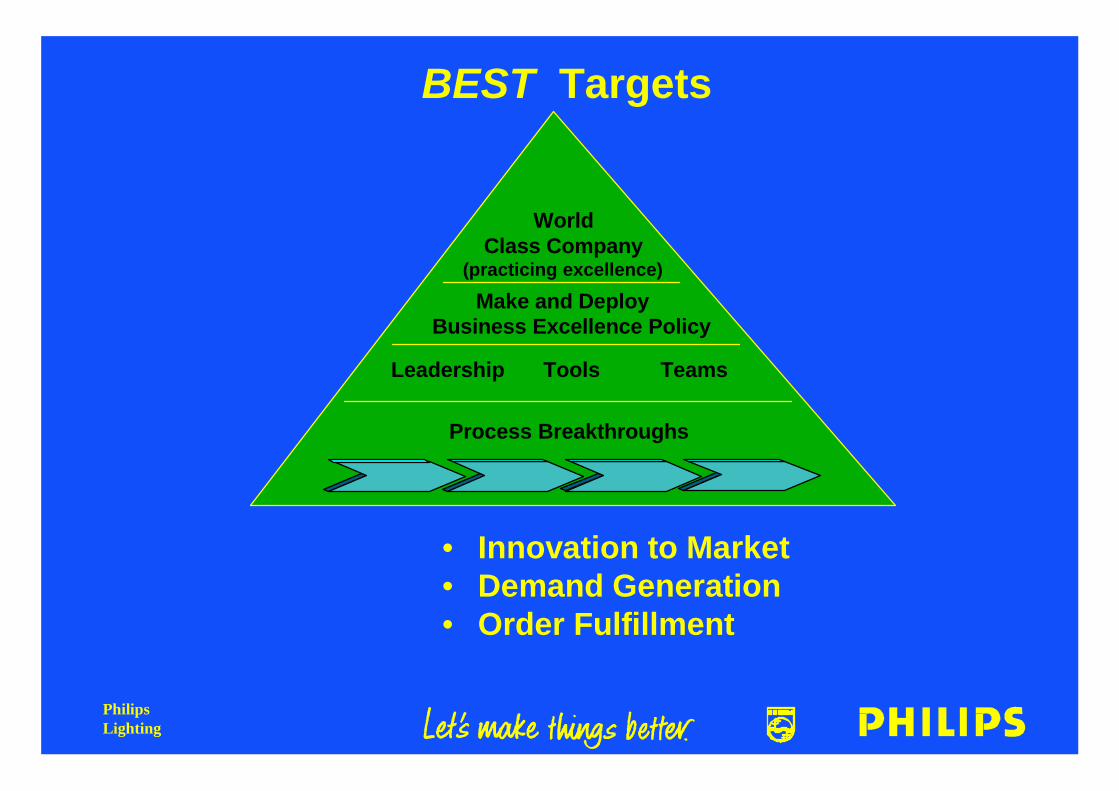
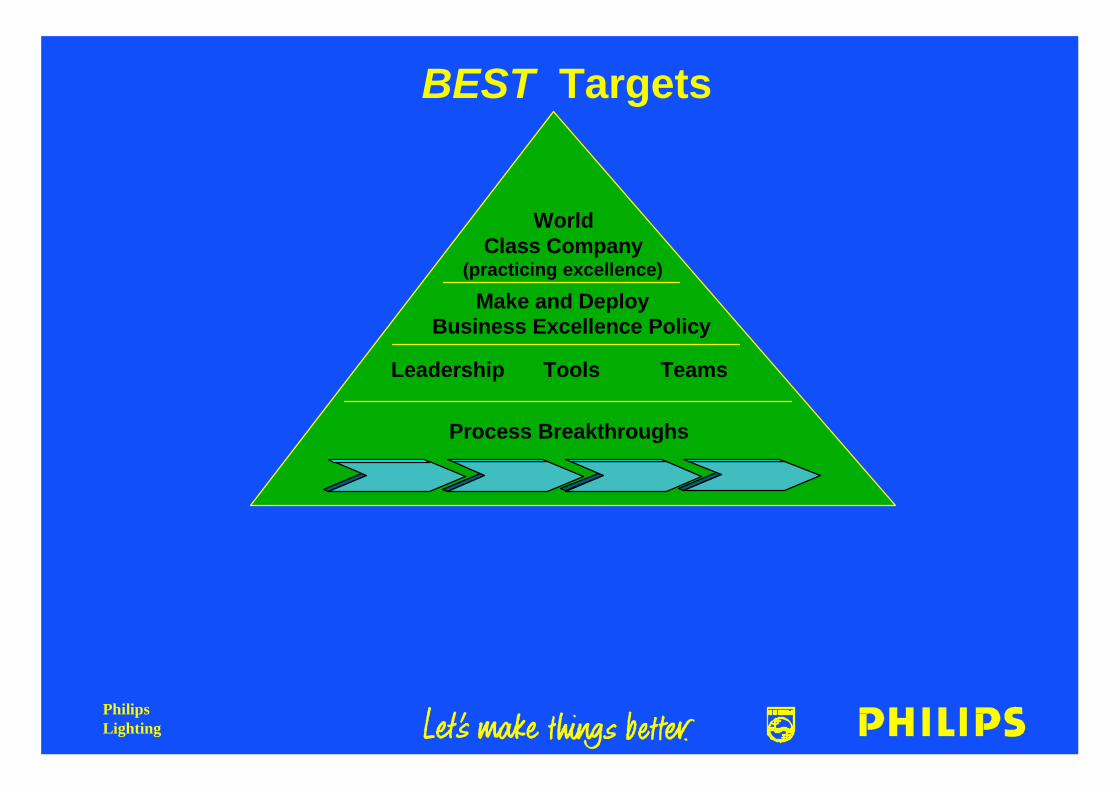
BEST Targets
(practicing excellence)
Business Excellence PolicyMake and Deploy
Leadership Tools Teams
WorldClass Company
Process Breakthroughs
• Innovation to Market• Demand Generation• Order Fulfillment
PhilipsLighting
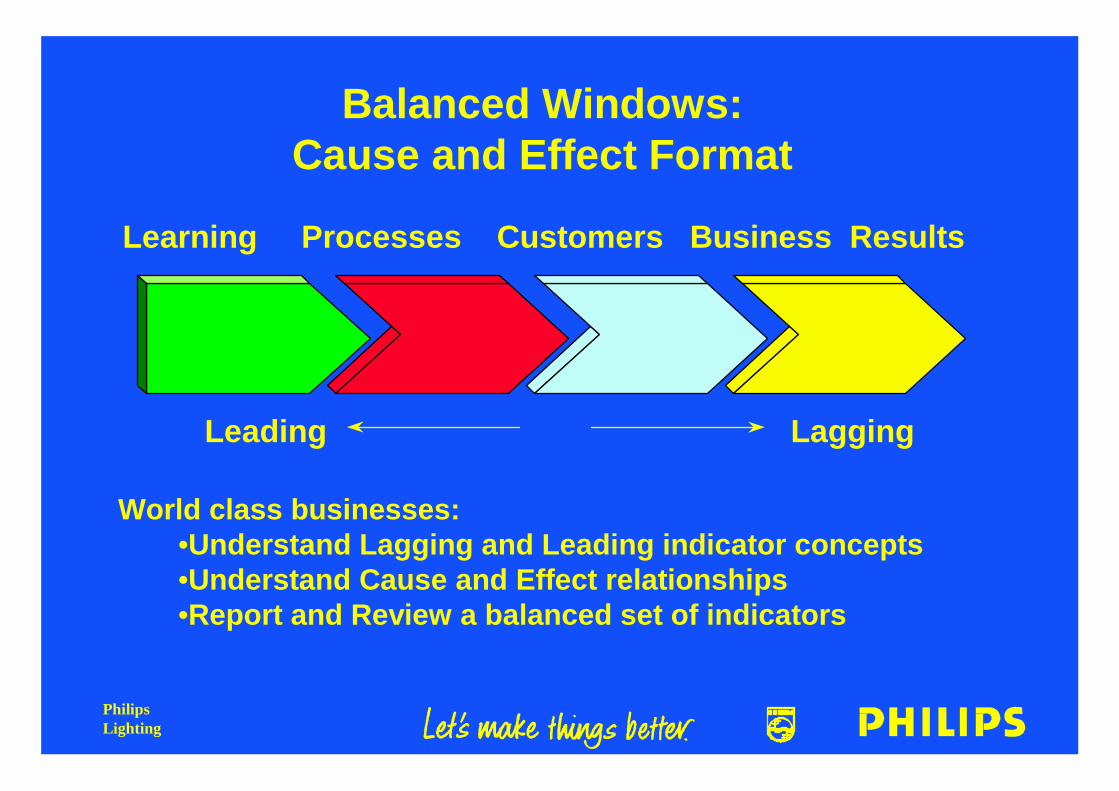
Balanced Windows:Cause and Effect Format
Learning Processes Customers Business Results
Leading Lagging
World class businesses:•Understand Lagging and Leading indicator concepts•Understand Cause and Effect relationships•Report and Review a balanced set of indicators
PhilipsLighting
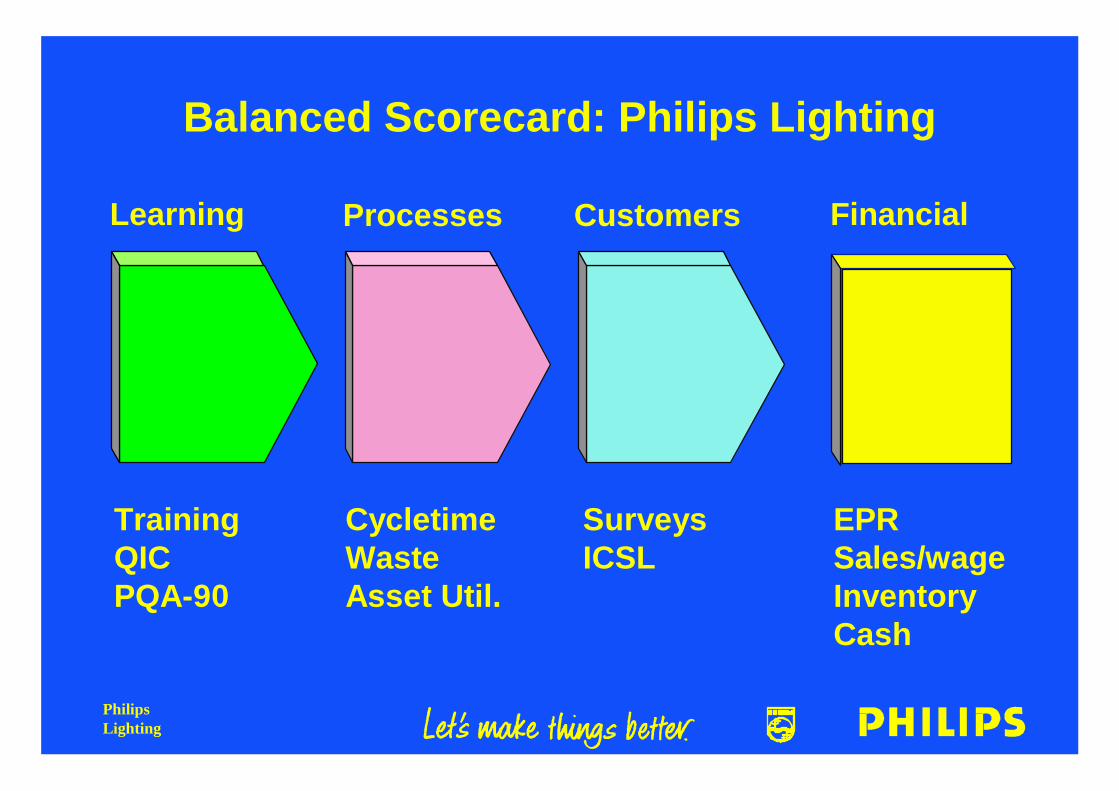
Balanced Scorecard: Philips Lighting
Customers FinancialProcessesLearning
EPRSales/wageInventoryCash
SurveysICSL
CycletimeWasteAsset Util.
TrainingQICPQA-90
PhilipsLighting
BEST Targets
(practicing excellence)
Business Excellence PolicyMake and Deploy
Leadership Tools Teams
WorldClass Company
Process Breakthroughs
PhilipsLighting
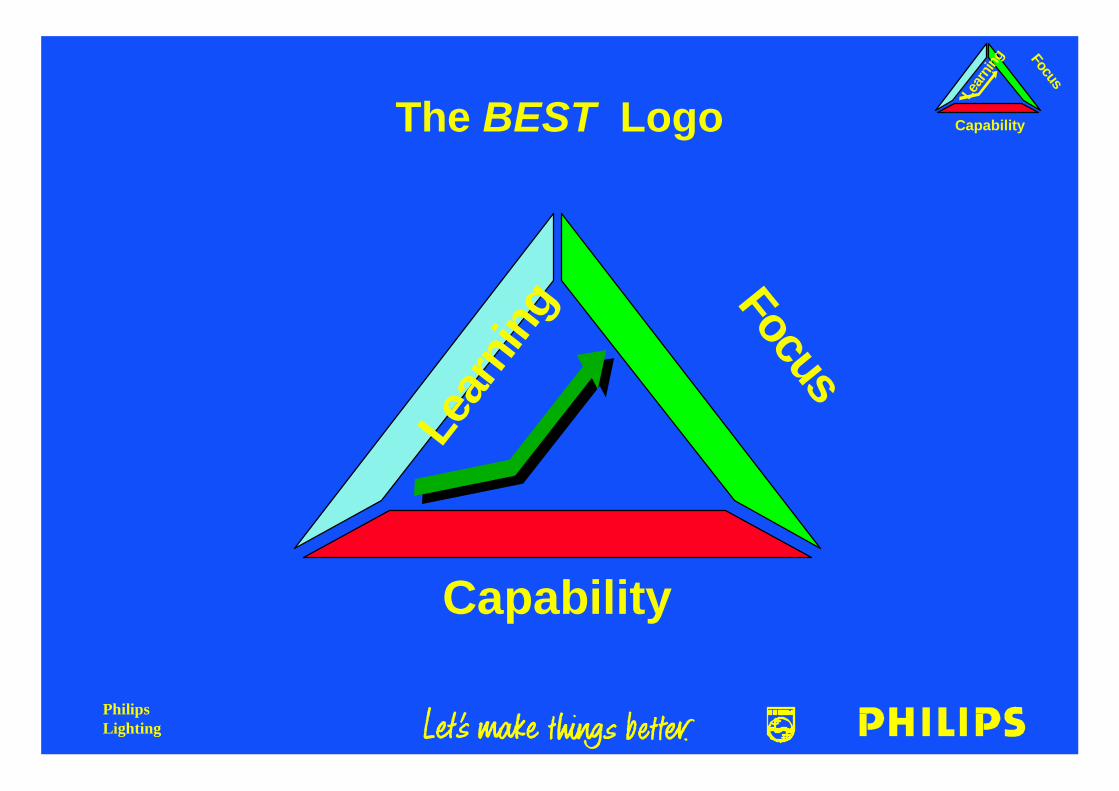
The BEST Logo
Focus
Capability
Lear
ning
Focus
Capability
Lear
ning
PhilipsLighting
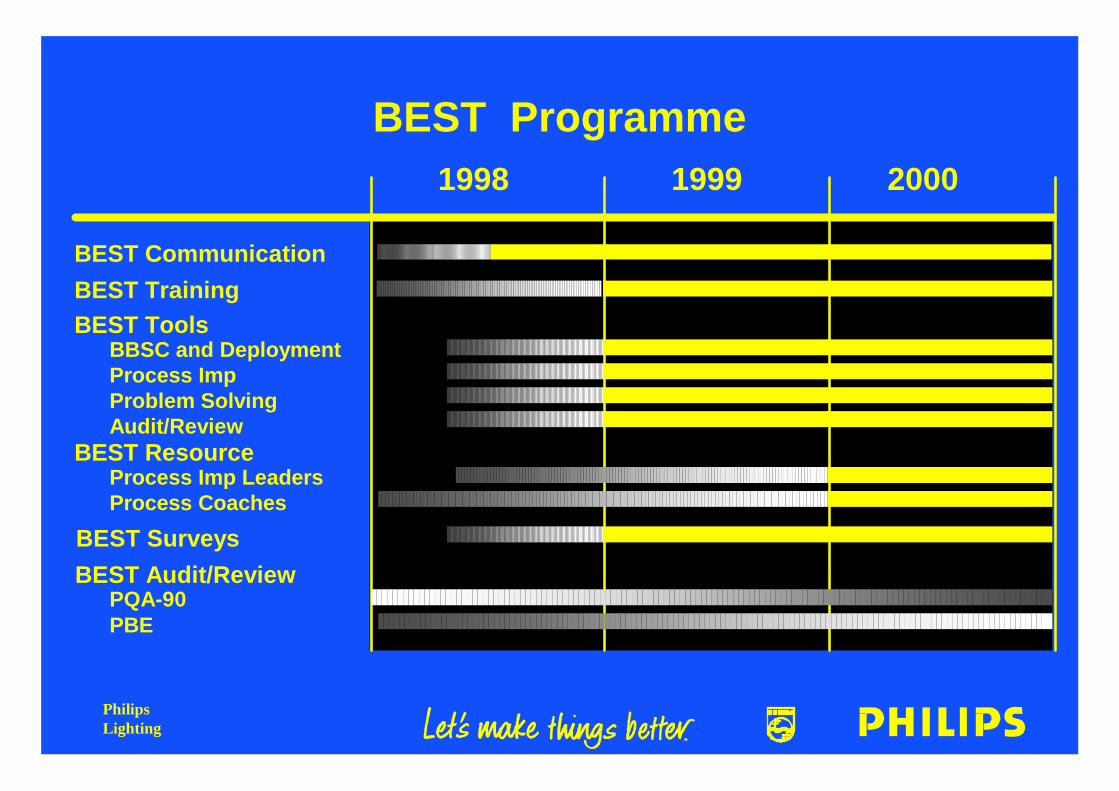
BEST Programme1998 1999
BEST Training
2000
BEST ResourceProcess Imp LeadersProcess Coaches
BEST Communication
BEST ToolsBBSC and DeploymentProcess ImpProblem SolvingAudit/Review
BEST Audit/ReviewPQA-90PBE
BEST Surveys

PhilipsLighting
PhilipsLighting
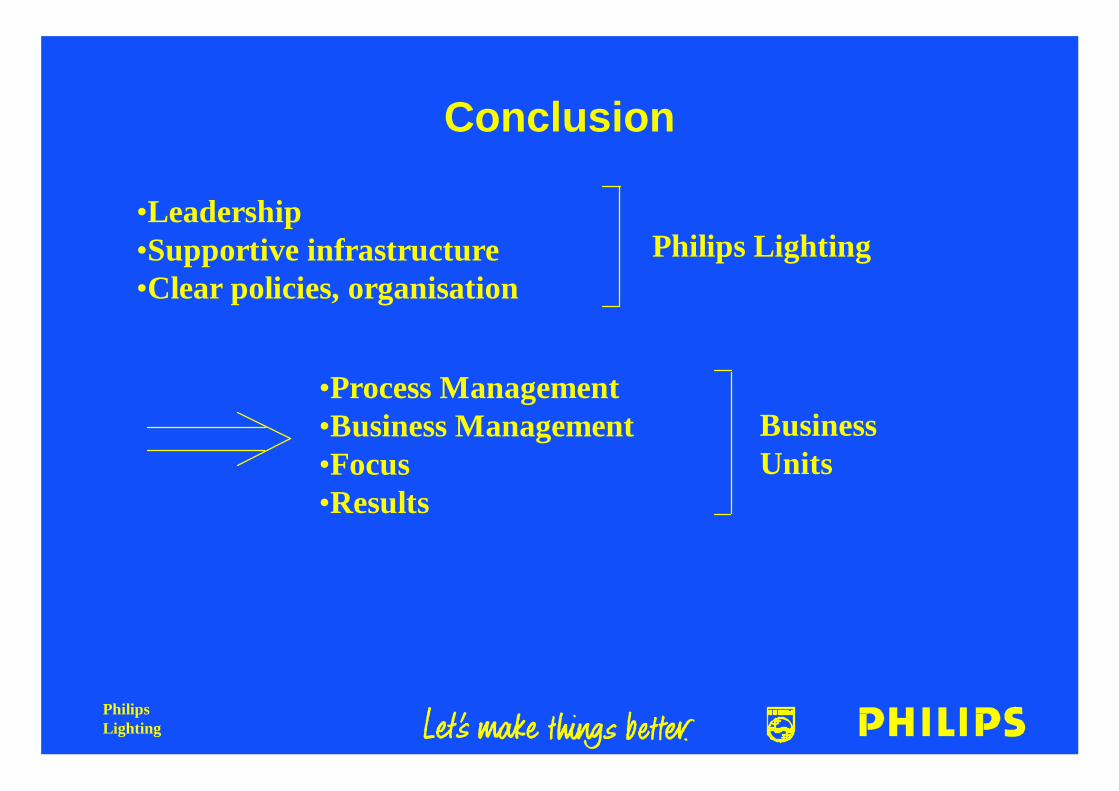
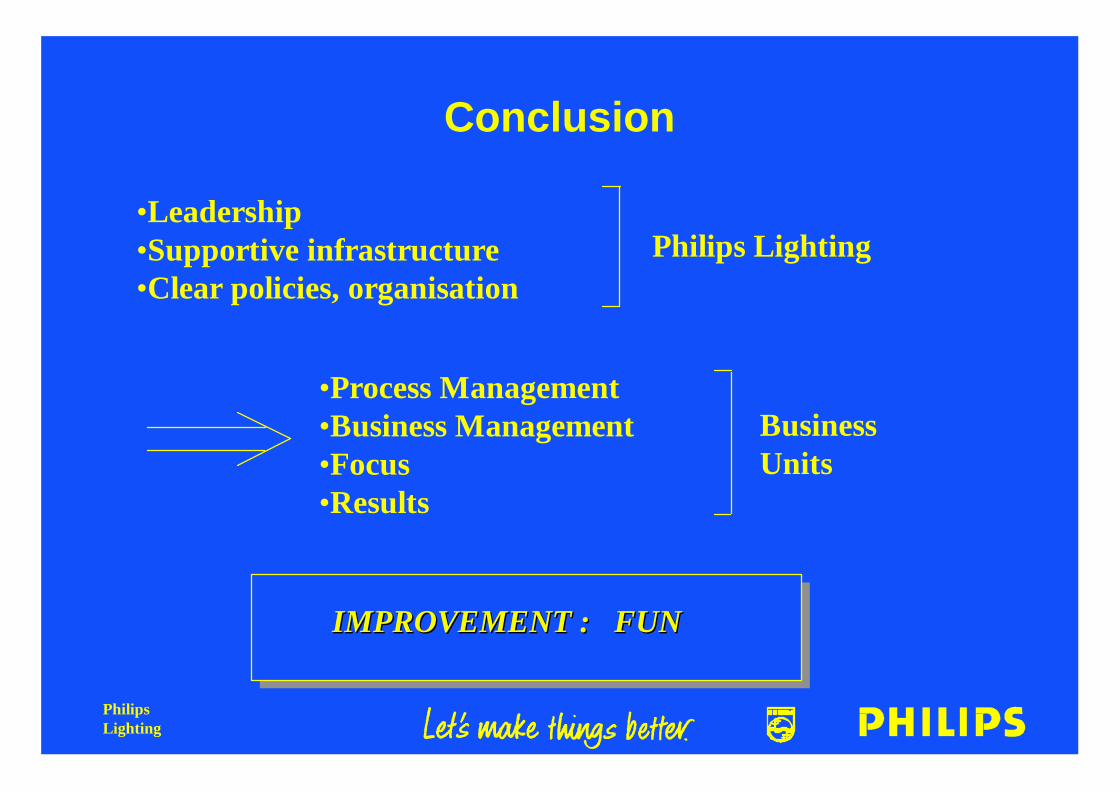
Conclusion
•Leadership•Supportive infrastructure•Clear policies, organisation
Philips Lighting
•Process Management•Business Management•Focus•Results
BusinessUnits
PhilipsLighting
Conclusion
•Leadership•Supportive infrastructure•Clear policies, organisation
Philips Lighting
•Process Management•Business Management•Focus•Results
BusinessUnits
IMPROVEMENT : FUNIMPROVEMENT : FUN
PhilipsLighting
“The underlying source of competitive
advantage is the sustainable capacity
for change”
R. Pascale

PhilipsLighting
Thank you
PhilipsLighting
BU Luminaires
Kick Stam
June 1998
PhilipsLighting
Redesign of the Luminaires Business
• Business scope and characteristic
• Difference in structure 1996 versus now
• Supply chain redesign
• Next steps in business redesign
• Results so far
PhilipsLighting
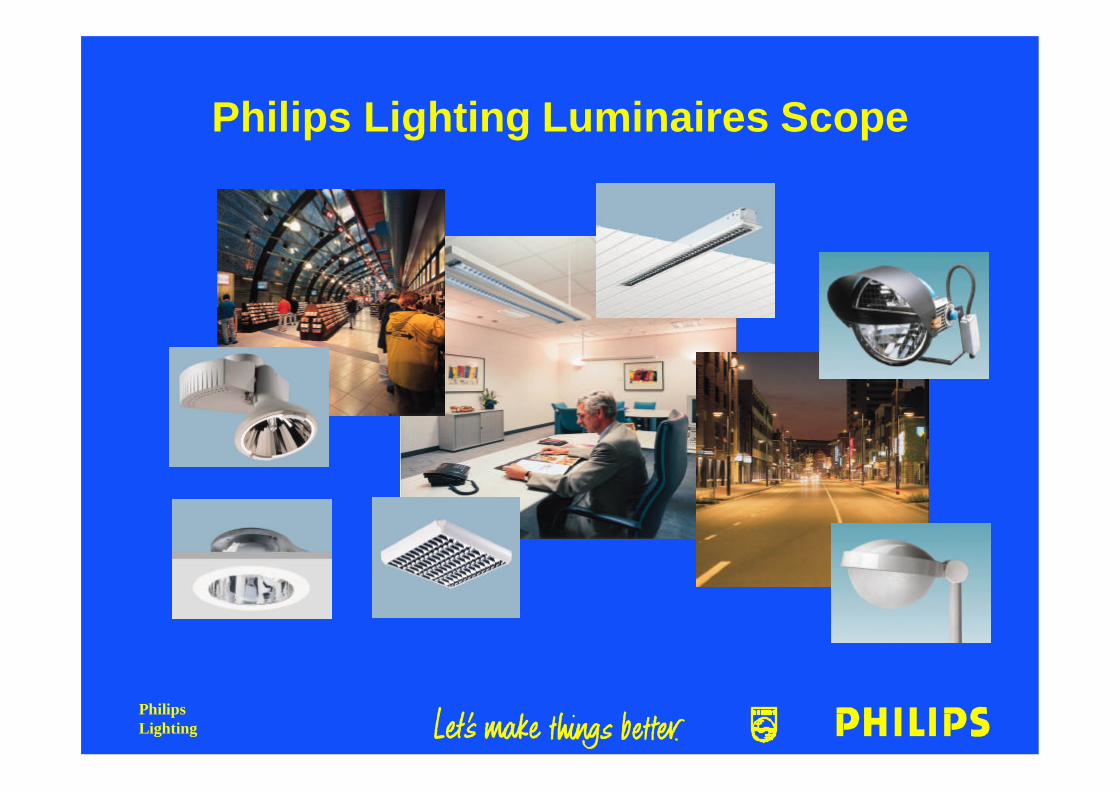
Philips Lighting Luminaires Scope
PhilipsLighting
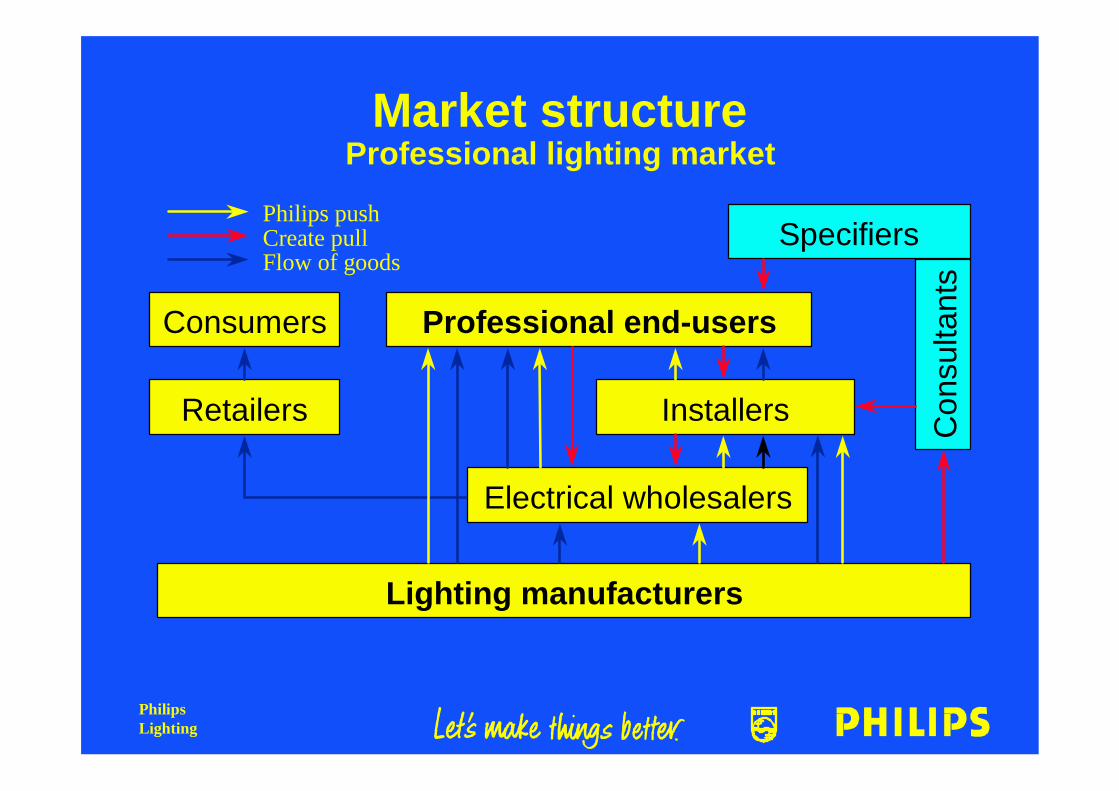
Market structureProfessional lighting market
Professional end-usersConsumers
Retailers Installers
Electrical wholesalers
Lighting manufacturers
Specifiers
Con
sulta
nts
Philips pushCreate pullFlow of goods
PhilipsLighting
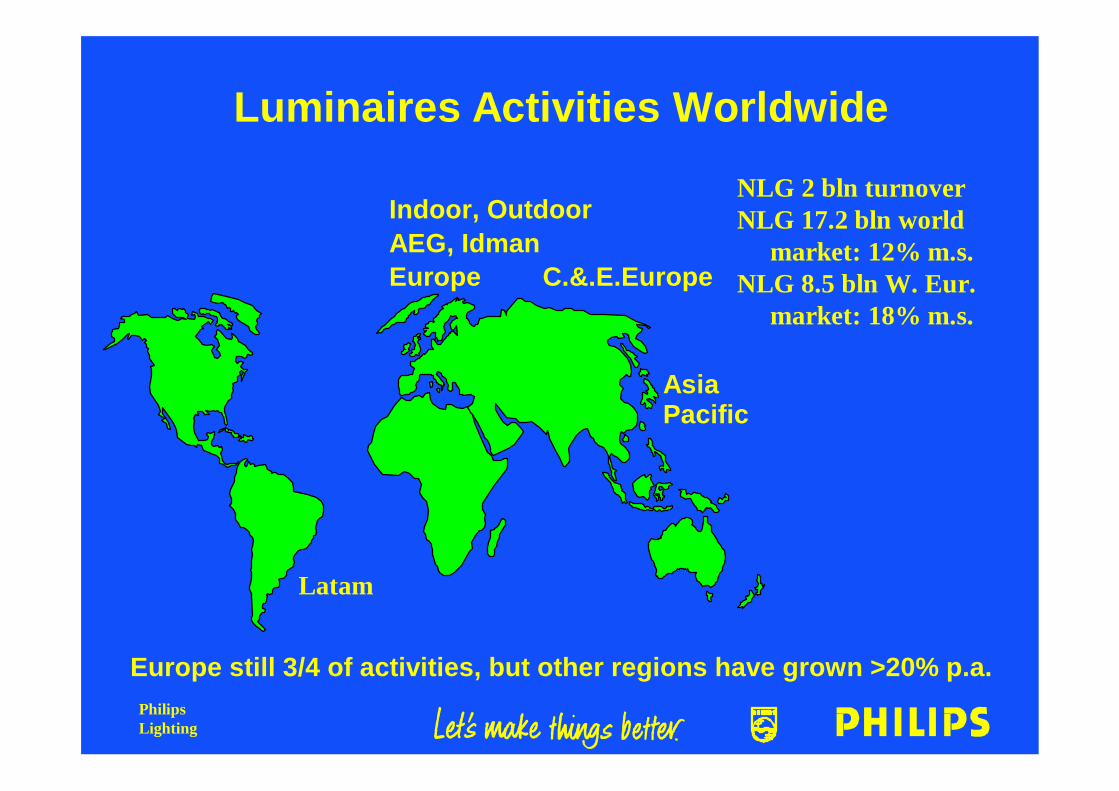
Luminaires Activities Worldwide
NLG 2 bln turnoverNLG 17.2 bln world market: 12% m.s.NLG 8.5 bln W. Eur. market: 18% m.s.
Indoor, Outdoor AEG, IdmanEurope
Asia Pacific
Latam
Europe still 3/4 of activities, but other regions have grown >20% p.a.
C.&.E.Europe
PhilipsLighting
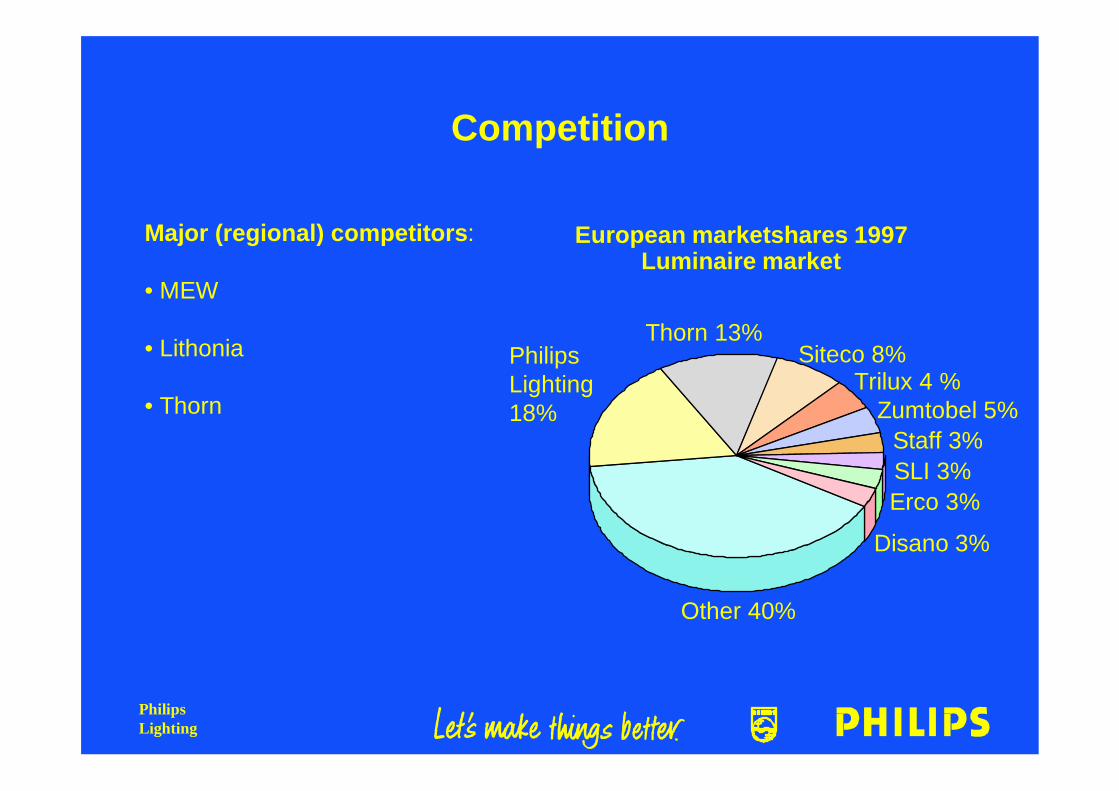
Competition
Trilux 4 %Siteco 8%
Zumtobel 5%Staff 3%SLI 3%Erco 3%
Disano 3%
Other 40%
Thorn 13%PhilipsLighting18%
European marketshares 1997Luminaire market
Major (regional) competitors:
• MEW
• Lithonia
• Thorn
PhilipsLighting
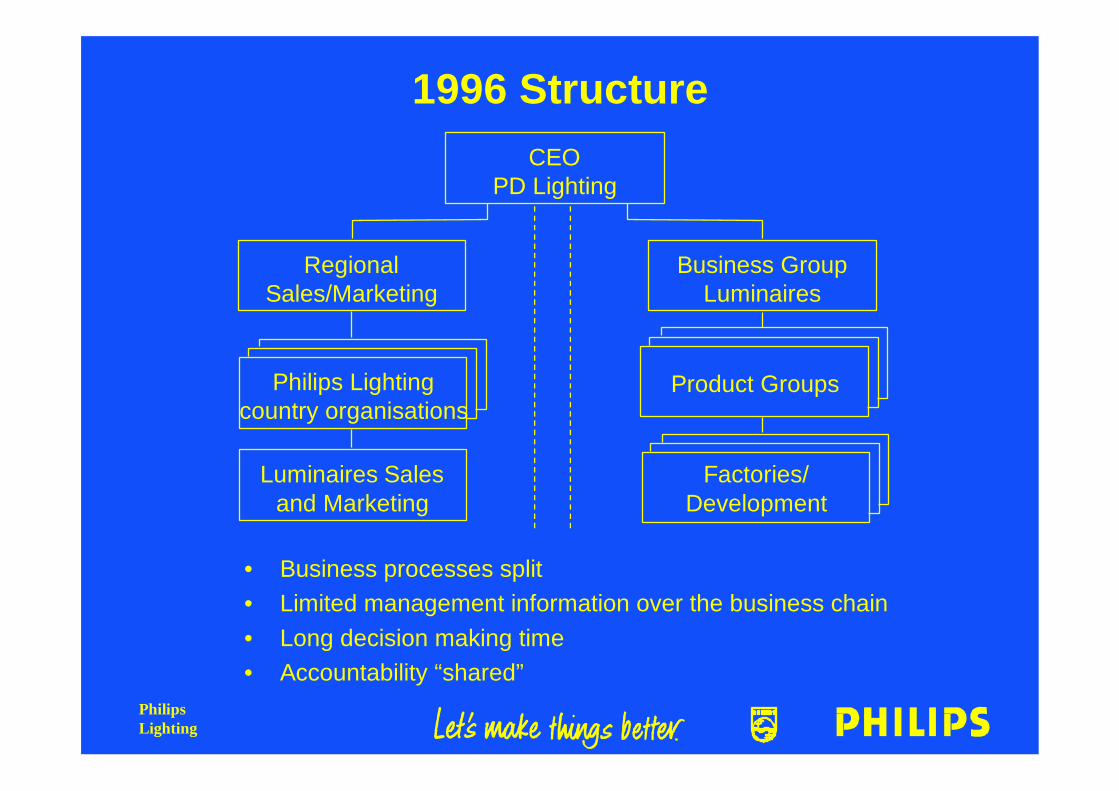
1996 Structure
• Business processes split• Limited management information over the business chain• Long decision making time• Accountability “shared”
CEOPD Lighting
RegionalSales/Marketing
Philips Lightingcountry organisations
Luminaires Salesand Marketing
Product Groups
Business GroupLuminaires
Factories/Development
PhilipsLighting
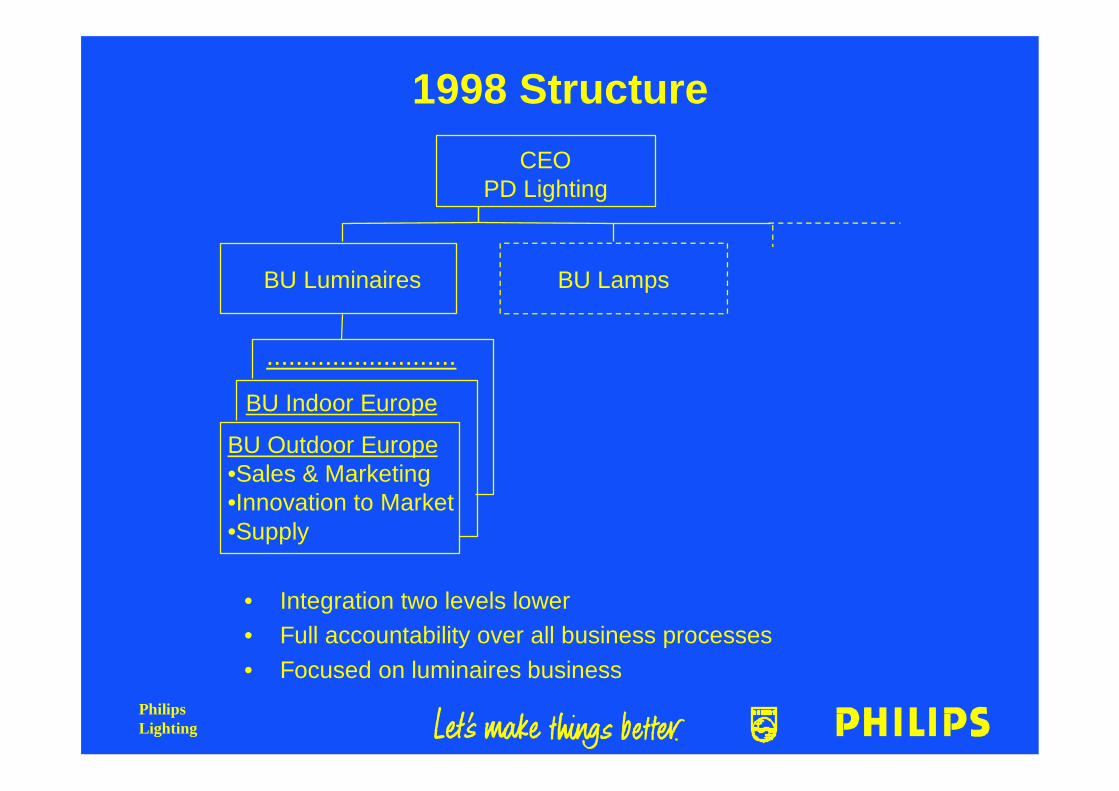
1998 Structure
• Integration two levels lower• Full accountability over all business processes• Focused on luminaires business
CEOPD Lighting
BU Luminaires
BU Outdoor Europe•Sales & Marketing•Innovation to Market•Supply
BU Lamps
BU Indoor Europe
..........................
PhilipsLighting
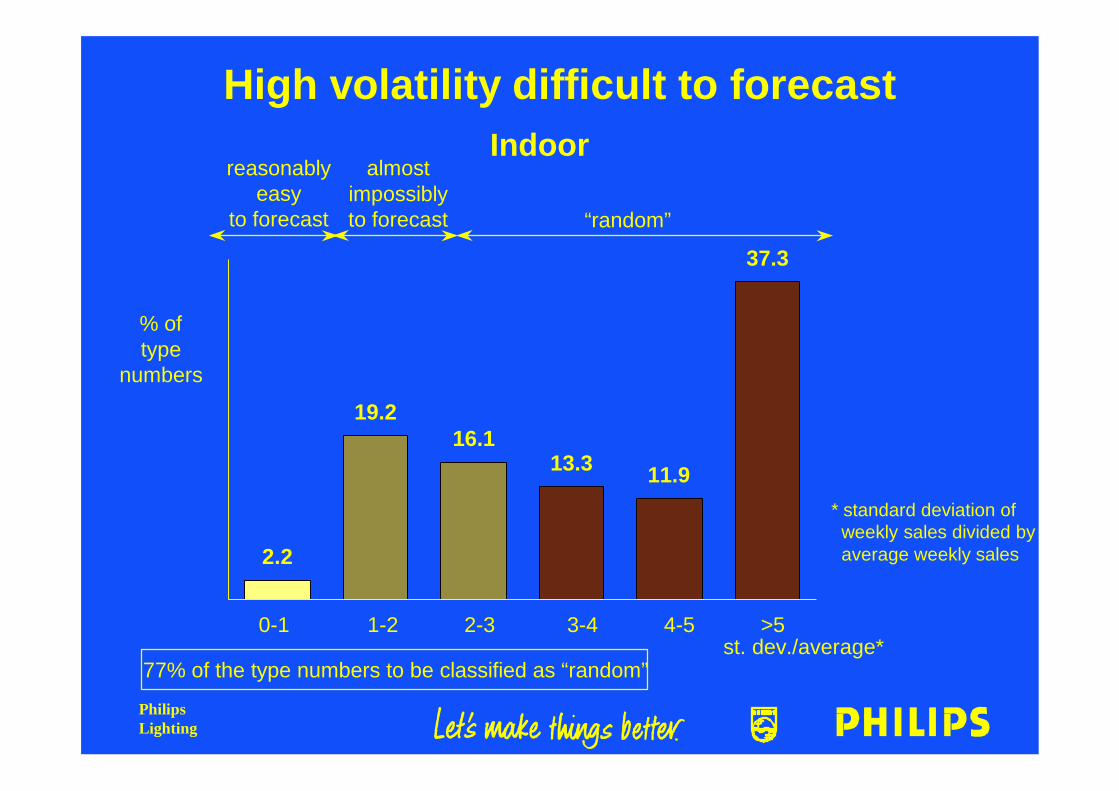
High volatility difficult to forecast
2.2
19.216.1
13.3 11.9
37.3
77% of the type numbers to be classified as “random”
Indoorreasonably
easyto forecast
almostimpossiblyto forecast “random”
% oftype
numbers
0-1 1-2 2-3 3-4 4-5 >5st. dev./average*
* standard deviation of weekly sales divided by average weekly sales
PhilipsLighting
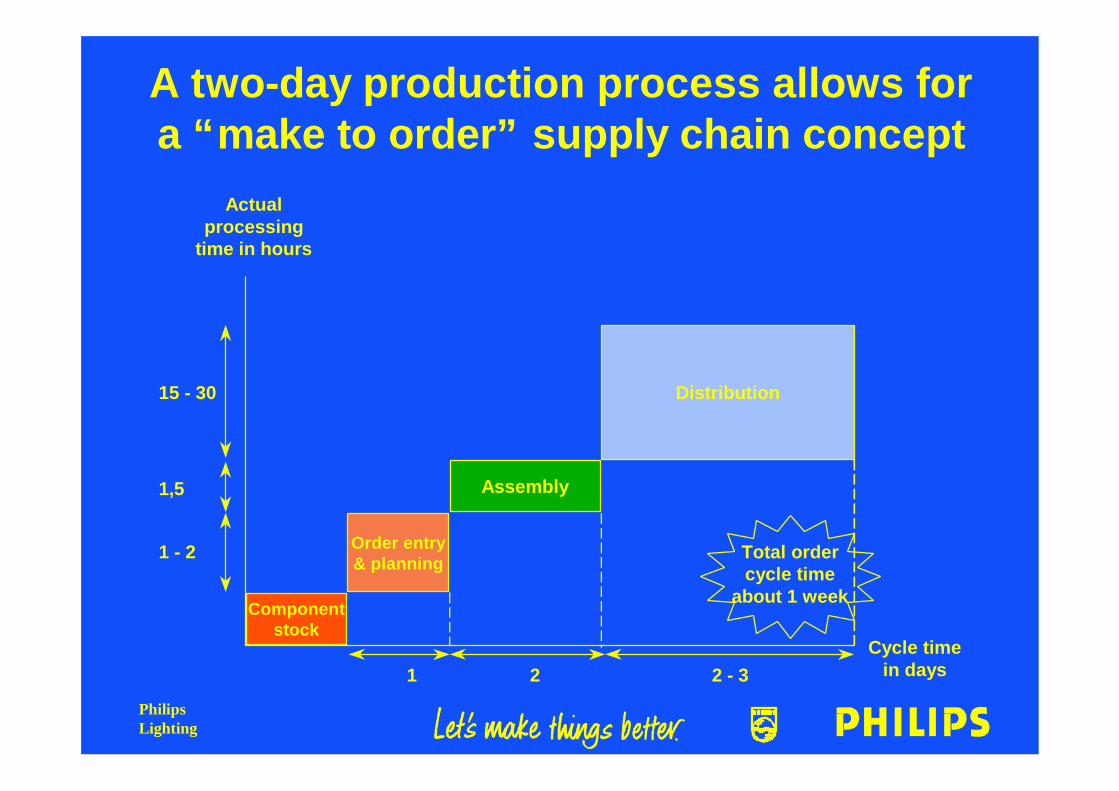
A two-day production process allows fora “make to order” supply chain concept
Actualprocessing
time in hours
Componentstock
Order entry& planning
Assembly
Distribution
Cycle timein days
15 - 30
1,5
1 - 2
1 2 2 - 3
Total ordercycle time
about 1 week
PhilipsLighting
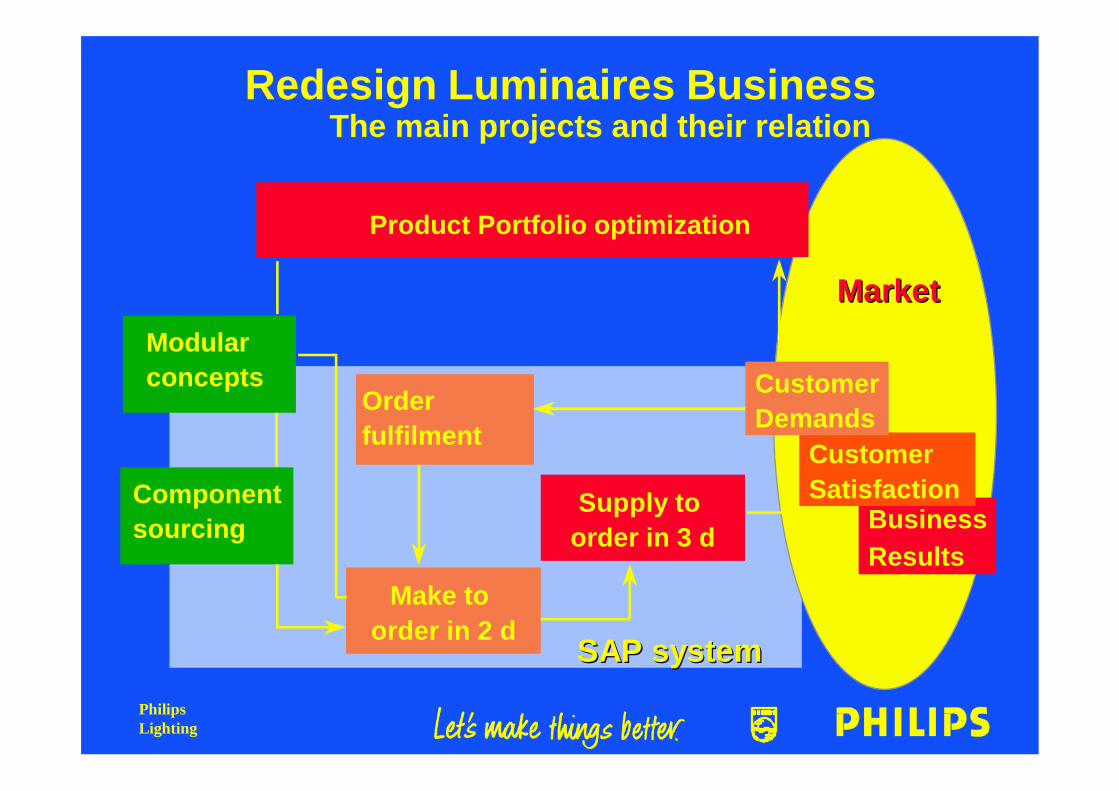
Redesign Luminaires BusinessThe main projects and their relation
Supply to order in 3 d
Make to order in 2 d
Product Portfolio optimization
Modularconcepts
Componentsourcing
Order fulfilment
MarketMarket
SAP systemSAP system
BusinessResults
CustomerSatisfaction
CustomerDemands
PhilipsLighting
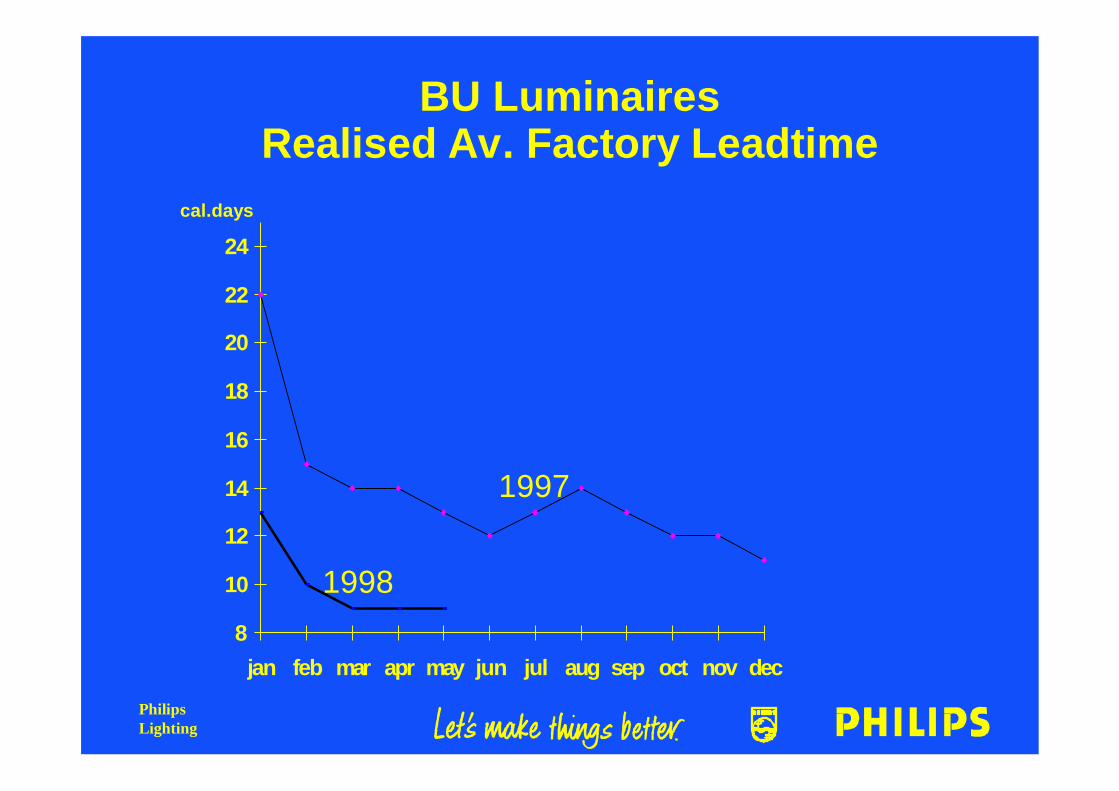
8
10
12
14
16
18
20
22
24
jan feb mar apr may jun jul aug sep oct nov dec
cal.days
1997
1998
BU LuminairesRealised Av. Factory Leadtime
PhilipsLighting
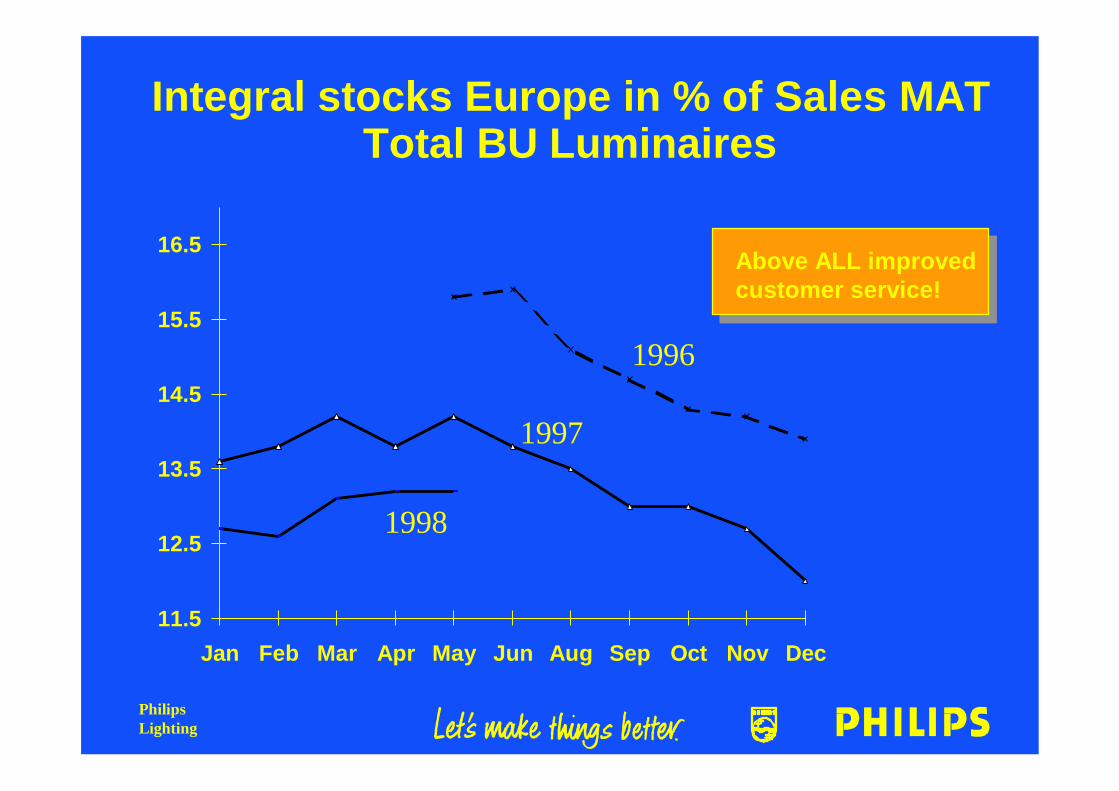
11.5
12.5
13.5
14.5
15.5
16.5
Jan Feb Mar Apr May Jun Aug Sep Oct Nov Dec
1996
1997
1998
Integral stocks Europe in % of Sales MATTotal BU Luminaires
Above ALL improvedcustomer service!
PhilipsLighting
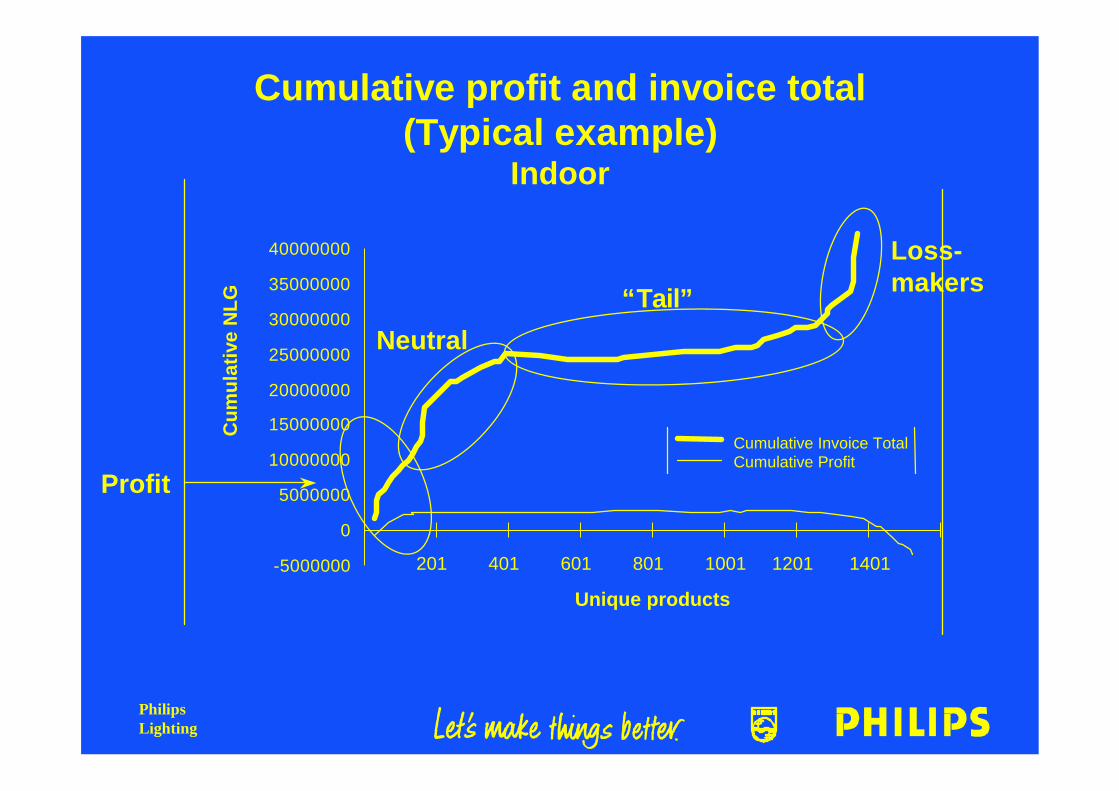
Cumulative profit and invoice total(Typical example)
Indoor
-5000000
0
5000000
10000000
15000000
20000000
25000000
30000000
35000000
40000000
Unique products
Cum
ulat
ive
NLG
201 401 601 801 1001 1201 1401
Profit
Loss-makers
Cumulative Invoice Total Cumulative Profit
Neutral“Tail”
PhilipsLighting
Next phase in business redesignSales re-engineering
started 1/1/98
Goals:
• Sales force productivity
• Account- and projectprofitability
• Preparation for SAP/R3 implementation- activity based costing- true time spent
PhilipsLighting
Expected breakthroughs
• Double productive customer interaction time
• Transparency in account- and project profitability
PhilipsLighting
Results sofar
• Capital rotation speed from 4.45 to 6.0
• Stock turns 6.3 to 9.0 (‘99 10 turns)
• Cost of organisation down
• Speed to adapt
• Improved customer service
• Clear accountability

PhilipsLighting