Embed Size (px)
Citation preview
Josip Juraj Strossmayer University of Osijek
Ruđer Bošković Institute, Zagreb
University of Dubrovnik
University Postgraduate Interdisciplinary Doctoral Study of
"Molecular Biosciences"
Josip Brajković, dipl.ing.
CHARACTERISTICS AND DISTRIBUTION OF TCAST SATELLITE
DNA IN TRIBOLIUM CASTANEUM EUCHROMATIN AND ITS
POSSIBLE ROLE IN GENE EXPRESSION.
DOCTORAL THESIS
Zagreb, 2012
Josip Juraj Strossmayer University of Osijek
Ruđer Bošković Institute, Zagreb
University of Dubrovnik
University Postgraduate Interdisciplinary Doctoral Study of
"Molecular Biosciences"
Josip Brajković, dipl.ing.
CHARACTERISTICS AND DISTRIBUTION OF TCAST SATELLITE
DNA IN TRIBOLIUM CASTANEUM EUCHROMATIN AND ITS
POSSIBLE ROLE IN GENE EXPRESSION.
PhD thesis proposed to
university postgraduate interdisciplinary
doctoral study committee in order to achieve academic degree
doctor of molecular biosciences - module bioinformatics
Zagreb, 2012
Josip Juraj Strossmayer University of Osijek
Ruđer Bošković Institute, Zagreb
University of Dubrovnik
University Postgraduate Interdisciplinary Doctoral Study of
"Molecular Biosciences"
Josip Brajković, dipl.ing.
CHARACTERISTICS AND DISTRIBUTION OF TCAST SATELLITE
DNA IN TRIBOLIUM CASTANEUM EUCHROMATIN AND ITS
POSSIBLE ROLE IN GENE EXPRESSION.
DOCTORAL THESIS
Supervisor:
Dr.sc. Đurđica Ugarković
Zagreb, 2012
iv
TEMELJNA DOKUMENTACIJSKA KARTICA
Sveučilište Josipa Jurja Strossmayera u Osijeku Doktorski rad
Institut Ruđer Bošković, Zagreb
Sveučilište u Dubrovniku
Studij Molekularne bioznanosti
Znanstveno područje: Prirodne znanosti
Znanstveno polje: Biologija
SVOJSTVA I RASPROSTRANJENOST TCAST SATELITNE DNA U EUKROMATINU VRSTE
TRIBOLIUM CASTANEUM I NJENA MOGUĆA ULOGA U GENSKOJ EKSPRESIJI.
Josip Brajković, dipl ing.
Rad je izrađen na Institutu Ruđer Bošković, Bijenička cesta 54, 1000 Zagreb
Mentor: Dr.sc. Đurđica Ugarković, red.prof.
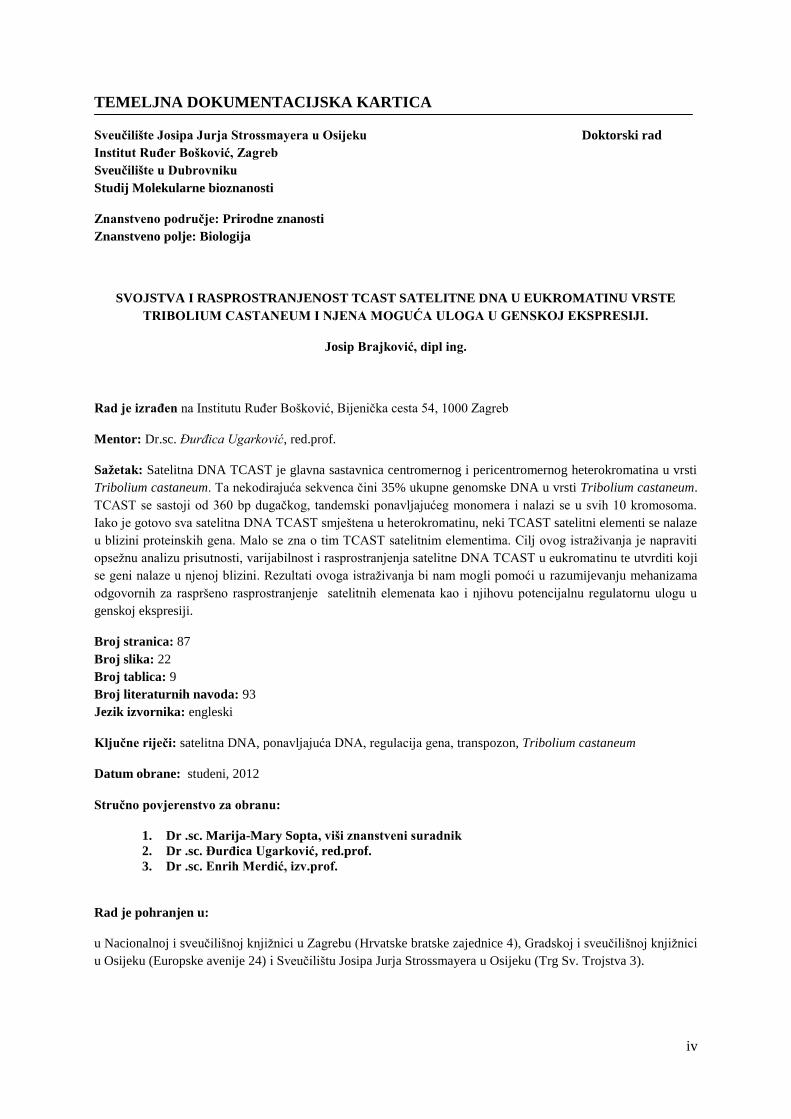
Sažetak: Satelitna DNA TCAST je glavna sastavnica centromernog i pericentromernog heterokromatina u vrsti
Tribolium castaneum. Ta nekodirajuća sekvenca čini 35% ukupne genomske DNA u vrsti Tribolium castaneum.
TCAST se sastoji od 360 bp dugačkog, tandemski ponavljajućeg monomera i nalazi se u svih 10 kromosoma.
Iako je gotovo sva satelitna DNA TCAST smještena u heterokromatinu, neki TCAST satelitni elementi se nalaze
u blizini proteinskih gena. Malo se zna o tim TCAST satelitnim elementima. Cilj ovog istraživanja je napraviti
opsežnu analizu prisutnosti, varijabilnost i rasprostranjenja satelitne DNA TCAST u eukromatinu te utvrditi koji
se geni nalaze u njenoj blizini. Rezultati ovoga istraživanja bi nam mogli pomoći u razumijevanju mehanizama
odgovornih za raspršeno rasprostranjenje satelitnih elemenata kao i njihovu potencijalnu regulatornu ulogu u
genskoj ekspresiji.
Broj stranica: 87
Broj slika: 22
Broj tablica: 9
Broj literaturnih navoda: 93
Jezik izvornika: engleski
Ključne riječi: satelitna DNA, ponavljajuća DNA, regulacija gena, transpozon, Tribolium castaneum
Datum obrane: studeni, 2012
Stručno povjerenstvo za obranu:
1. Dr .sc. Marija-Mary Sopta, viši znanstveni suradnik
2. Dr .sc. Đurđica Ugarković, red.prof.
3. Dr .sc. Enrih Merdić, izv.prof.
Rad je pohranjen u:
u Nacionalnoj i sveučilišnoj knjižnici u Zagrebu (Hrvatske bratske zajednice 4), Gradskoj i sveučilišnoj knjižnici
u Osijeku (Europske avenije 24) i Sveučilištu Josipa Jurja Strossmayera u Osijeku (Trg Sv. Trojstva 3).
v
BASIC DOCUMENTATION CARD
University Josip Juraj Strossmayer Osijek PhD thesis
Institute Ruđer Bošković, Zagreb
University of Dubrovnik
Doctoral Study Molecular biosciences
Scientific Area: Natural sciences
Scientific Field: Biology
CHARACTERISTICS AND DISTRIBUTION OF TCAST SATELLITE DNA IN TRIBOLIUM
CASTANEUM EUCHROMATIN AND ITS POSSIBLE ROLE IN GENE EXPRESSION.
Josip Brajković, dipl ing.
Thesis performed at Ruđer Bošković Institute, Bijenička cesta 54, 1000 Zagreb
Supervisor: Professor Đurđica Ugarković, PhD
Abstract: TCAST satellite DNA is major constituent of pericentromeric and centromeric heterochromatin in
Tribolium castaneum. This non-coding sequence constitutes 35% of whole genomic DNA in Tribolium
castaneum. TCAST is composed of 360 bp long tandemly arranged monomers on all 10 chromosomes.
Although almost all TCAST satellite DNA is in heterochromatin, some TCAST satellite elements are in the
vicinity of protein genes. Little is known about these TCAST satellite elements. The outcome of this study is a
comprehensive analysis of presence, variability and distribution of TCAST satellite DNA in euchromatin and to
define which genes are in their vicinity. This can help to understand mechanisms responsible for the dispersed
mode of distribution of TCAST satellite elements as well as their potential regulatory role in gene expression.
Number of pages: 87
Number of figures: 22
Number of tables: 9
Number of references: 93
Original in: English
Key words: satellite DNA, repetitive DNA, gene regulation, transposone, Tribolium castaneum
Date of the thesis defence: november, 2012
Reviewers:
1. Marija-Mary Sopta, PhD
2. Professor Đurđica Ugarković, PhD
3. Associate professor Enrih Merdić, PhD
Thesis deposited in:
National and University Library (Hrvatske bratske zajednice 4), City and University Library in Osijek (Europske
avenije 24) and in Josip Juraj Strossmayer University of Osijek (Trg Sv. Trojstva 3).

vi
My dedication...
To my parents and sister for giving me love and support through
my whole life.
To my wife and kids for making me feel alive.
To my friends for making me smile.
To my mentor making my work worthwhile.
vii
Study for this PhD thesis was performed in Laboratory of Evolutionary Genetics, Division of
Molecular Biology, Ruđer Bošković Institute under supervision dr. sc. Đurđica Ugarković.
This work was supported by Croatian Ministry of Science, Education and Sport [grant number
098-0982913-2832], European Union FP6 Marie Curie Transfer of Knowledge [grant MTKD-
CT-2006-042248] and COST Action TD0905 “Epigenetics: Bench to Bedside”.
1
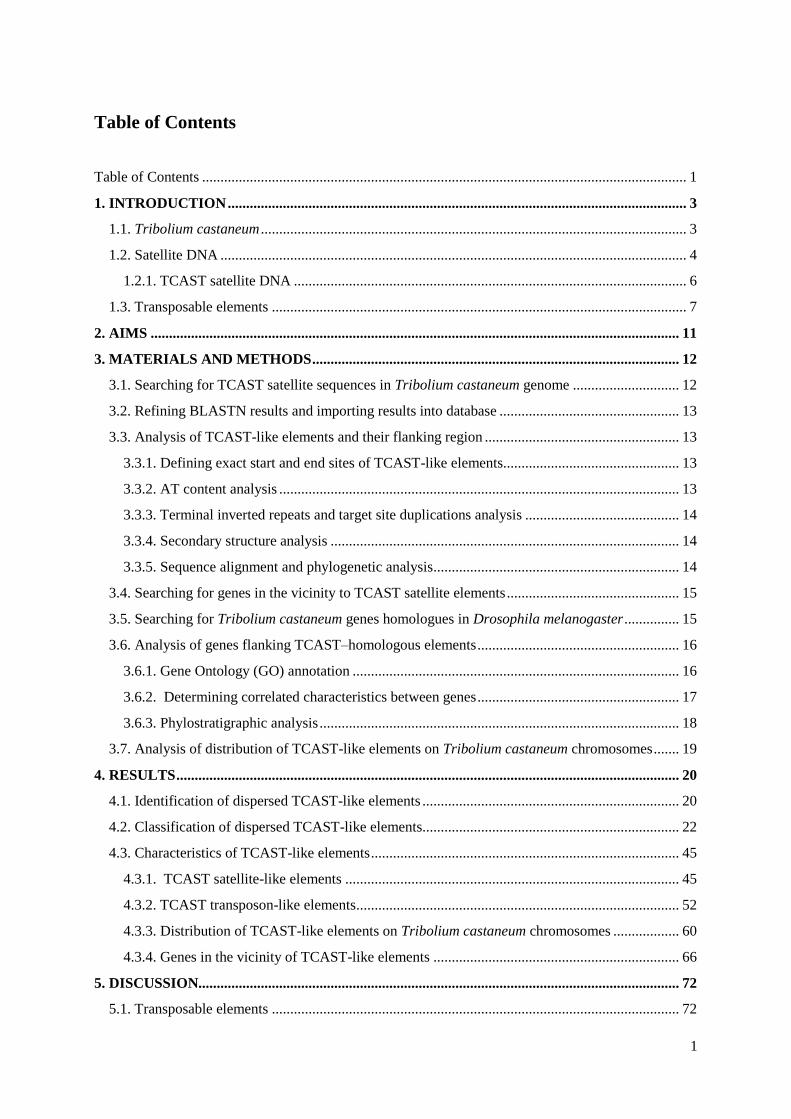
Table of Contents
Table of Contents .................................................................................................................................... 1
1. INTRODUCTION ............................................................................................................................. 3
1.1. Tribolium castaneum .................................................................................................................... 3
1.2. Satellite DNA ............................................................................................................................... 4
1.2.1. TCAST satellite DNA ........................................................................................................... 6
1.3. Transposable elements ................................................................................................................. 7
2. AIMS ................................................................................................................................................ 11
3. MATERIALS AND METHODS .................................................................................................... 12
3.1. Searching for TCAST satellite sequences in Tribolium castaneum genome ............................. 12
3.2. Refining BLASTN results and importing results into database ................................................. 13
3.3. Analysis of TCAST-like elements and their flanking region ..................................................... 13
3.3.1. Defining exact start and end sites of TCAST-like elements................................................ 13
3.3.2. AT content analysis ............................................................................................................. 13
3.3.3. Terminal inverted repeats and target site duplications analysis .......................................... 14
3.3.4. Secondary structure analysis ............................................................................................... 14
3.3.5. Sequence alignment and phylogenetic analysis ................................................................... 14
3.4. Searching for genes in the vicinity to TCAST satellite elements ............................................... 15
3.5. Searching for Tribolium castaneum genes homologues in Drosophila melanogaster ............... 15
3.6. Analysis of genes flanking TCAST–homologous elements ....................................................... 16
3.6.1. Gene Ontology (GO) annotation ......................................................................................... 16
3.6.2. Determining correlated characteristics between genes ....................................................... 17
3.6.3. Phylostratigraphic analysis .................................................................................................. 18
3.7. Analysis of distribution of TCAST-like elements on Tribolium castaneum chromosomes ....... 19
4. RESULTS ......................................................................................................................................... 20
4.1. Identification of dispersed TCAST-like elements ...................................................................... 20
4.2. Classification of dispersed TCAST-like elements...................................................................... 22
4.3. Characteristics of TCAST-like elements .................................................................................... 45
4.3.1. TCAST satellite-like elements ........................................................................................... 45
4.3.2. TCAST transposon-like elements ........................................................................................ 52
4.3.3. Distribution of TCAST-like elements on Tribolium castaneum chromosomes .................. 60
4.3.4. Genes in the vicinity of TCAST-like elements ................................................................... 66
5. DISCUSSION................................................................................................................................... 72
5.1. Transposable elements ............................................................................................................... 72
2
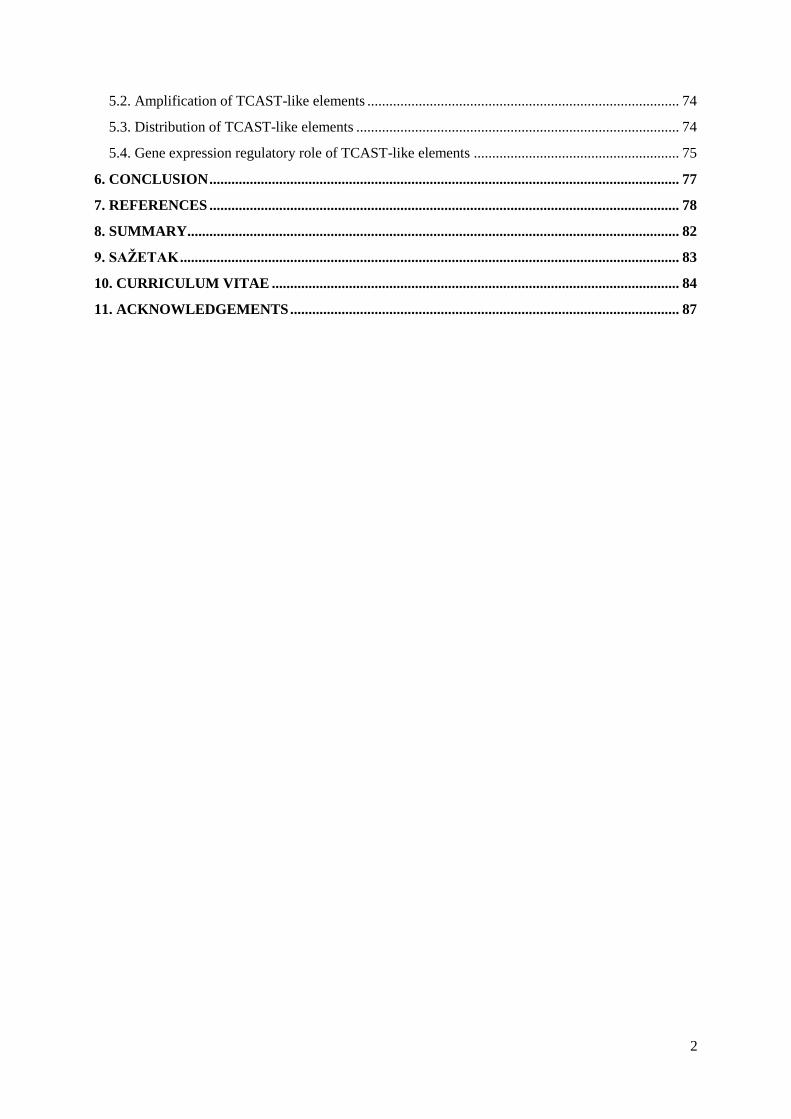
5.2. Amplification of TCAST-like elements ..................................................................................... 74
5.3. Distribution of TCAST-like elements ........................................................................................ 74
5.4. Gene expression regulatory role of TCAST-like elements ........................................................ 75
6. CONCLUSION ................................................................................................................................ 77
7. REFERENCES ................................................................................................................................ 78
8. SUMMARY ...................................................................................................................................... 82
9. SAŽETAK ........................................................................................................................................ 83
10. CURRICULUM VITAE ............................................................................................................... 84
11. ACKNOWLEDGEMENTS .......................................................................................................... 87
3
1. INTRODUCTION
1.1. Tribolium castaneum
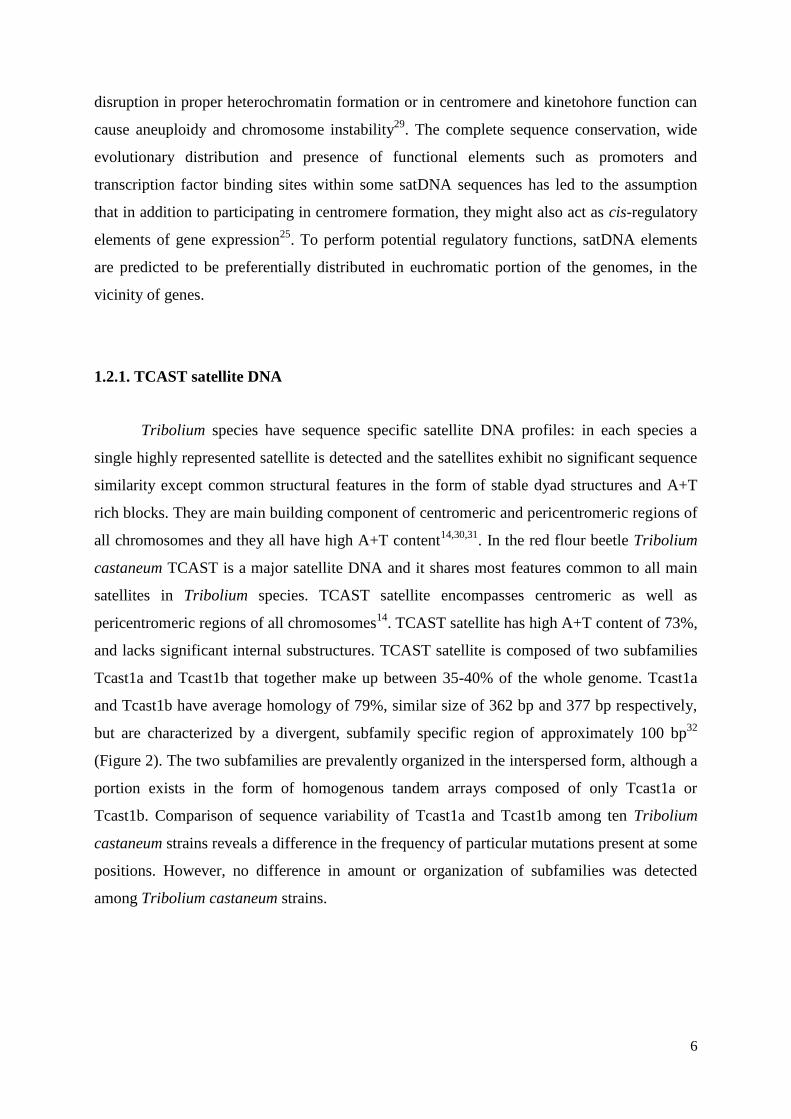
Tribolium castaneum, also known as the red flour beetle, originate from India but it
has been widely scattered by man1, so today is considered cosmopolitan species. Tribolium
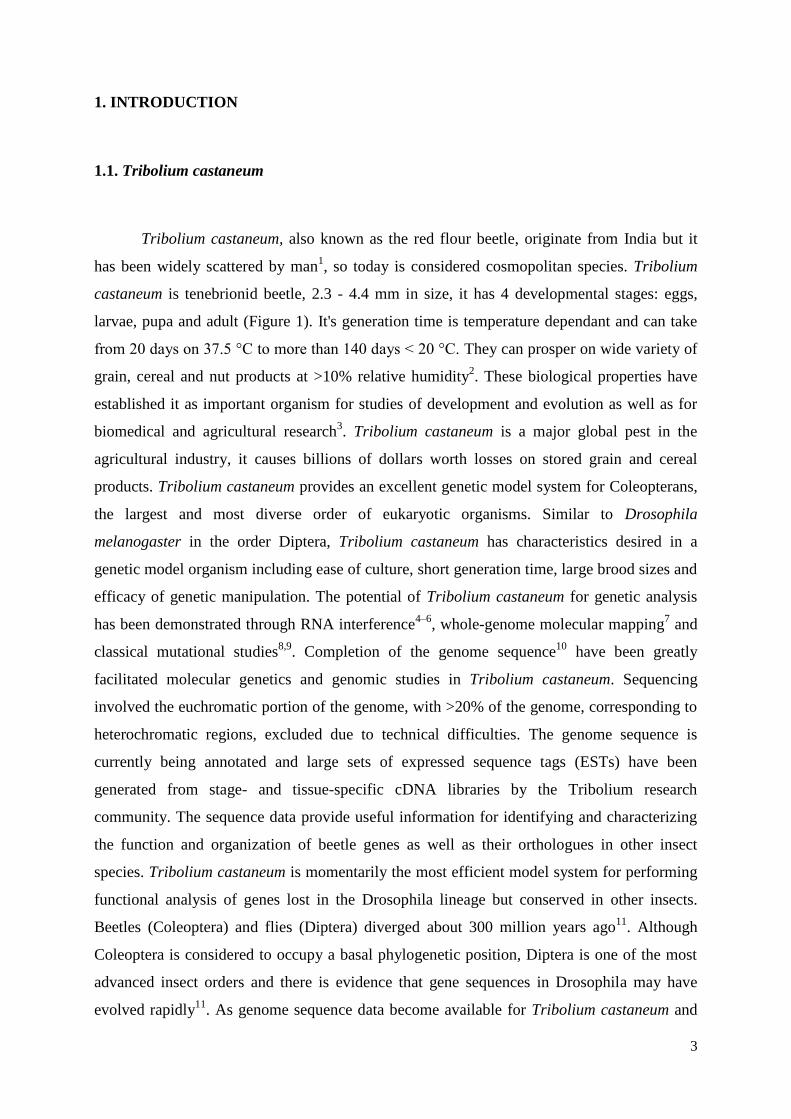
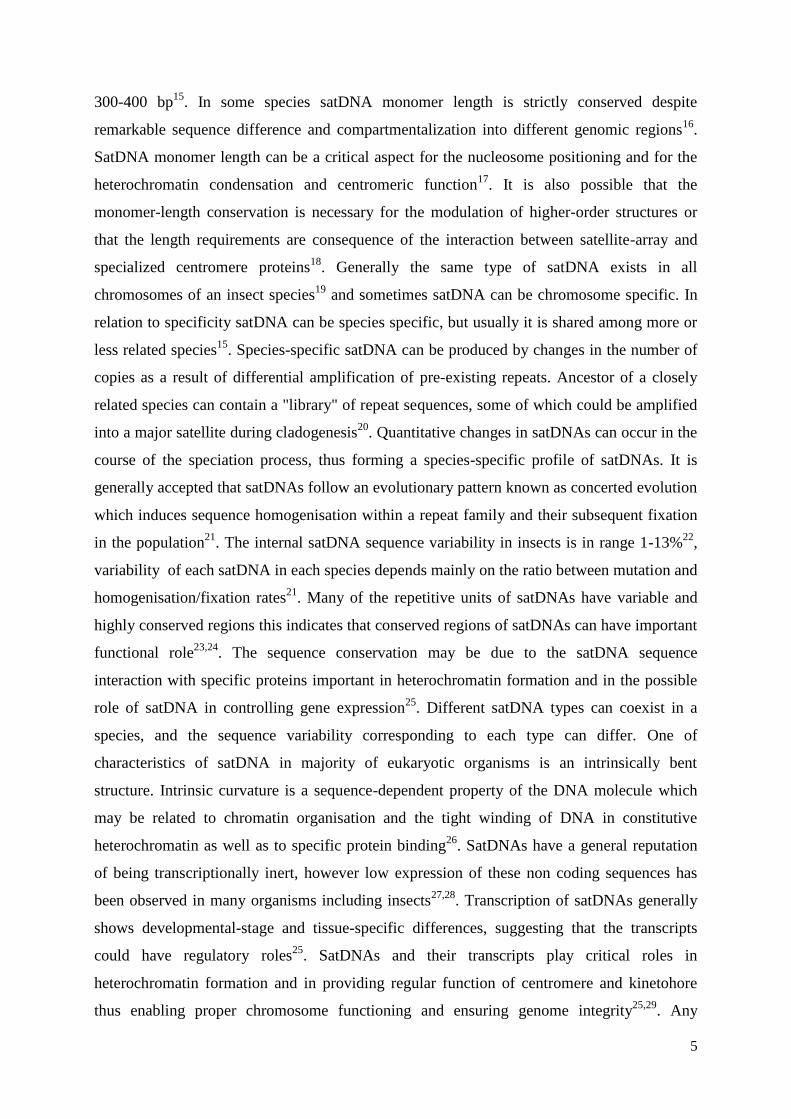
castaneum is tenebrionid beetle, 2.3 - 4.4 mm in size, it has 4 developmental stages: eggs,
larvae, pupa and adult (Figure 1). It's generation time is temperature dependant and can take
from 20 days on 37.5 °C to more than 140 days < 20 °C. They can prosper on wide variety of
grain, cereal and nut products at >10% relative humidity2. These biological properties have
established it as important organism for studies of development and evolution as well as for
biomedical and agricultural research3. Tribolium castaneum is a major global pest in the
agricultural industry, it causes billions of dollars worth losses on stored grain and cereal
products. Tribolium castaneum provides an excellent genetic model system for Coleopterans,
the largest and most diverse order of eukaryotic organisms. Similar to Drosophila
melanogaster in the order Diptera, Tribolium castaneum has characteristics desired in a
genetic model organism including ease of culture, short generation time, large brood sizes and
efficacy of genetic manipulation. The potential of Tribolium castaneum for genetic analysis
has been demonstrated through RNA interference4–6
, whole-genome molecular mapping7 and
classical mutational studies8,9
. Completion of the genome sequence10
have been greatly
facilitated molecular genetics and genomic studies in Tribolium castaneum. Sequencing
involved the euchromatic portion of the genome, with >20% of the genome, corresponding to
heterochromatic regions, excluded due to technical difficulties. The genome sequence is
currently being annotated and large sets of expressed sequence tags (ESTs) have been
generated from stage- and tissue-specific cDNA libraries by the Tribolium research
community. The sequence data provide useful information for identifying and characterizing
the function and organization of beetle genes as well as their orthologues in other insect
species. Tribolium castaneum is momentarily the most efficient model system for performing
functional analysis of genes lost in the Drosophila lineage but conserved in other insects.
Beetles (Coleoptera) and flies (Diptera) diverged about 300 million years ago11
. Although
Coleoptera is considered to occupy a basal phylogenetic position, Diptera is one of the most
advanced insect orders and there is evidence that gene sequences in Drosophila may have
evolved rapidly11
. As genome sequence data become available for Tribolium castaneum and
4
other insect species, comparative genomics may reveal the genetic innovations that
accompanied the evolution of higher insects.
1.2. Satellite DNA
Satellite DNA (satDNA) is generally formed of large arrays of tandemly repeating
DNA in which the monomers are repeated in a head to tail fashion, although seldom satDNAs
can have complex repeat organisation resulting in higher-order repeats (HORs). SatDNA is
located mainly in the centromeric, pericentromeric and telomeric regions of chromosomes12
.
In eukaryotic organisms satDNA constitutes a considerable part of the genomic DNA, as in
beetles from the coleopteran family Tenebrionidae13
, e.g. in Tribolium castaneum its major
satellite (TCAST), comprise 35% of the whole genome14
. SatDNA is major building element
of heterochromatin and it is important in the establishment and maintenance of centromeric,
telomeric and subtelomeric regions, which are essential for proper chromosome segregation.
In insects satDNA repetitive units (monomers) usually falls in two size classes, although with
numerous exceptions, one in the range of about 140-190 bp and the other in the range of about
D
Figure 1 Developemental stages of Tribolium castaneum. A) larvae, B) pupa, C)
adult and D) eggs.
5
300-400 bp15
. In some species satDNA monomer length is strictly conserved despite
remarkable sequence difference and compartmentalization into different genomic regions16
.
SatDNA monomer length can be a critical aspect for the nucleosome positioning and for the
heterochromatin condensation and centromeric function17
. It is also possible that the
monomer-length conservation is necessary for the modulation of higher-order structures or
that the length requirements are consequence of the interaction between satellite-array and
specialized centromere proteins18
. Generally the same type of satDNA exists in all
chromosomes of an insect species19
and sometimes satDNA can be chromosome specific. In
relation to specificity satDNA can be species specific, but usually it is shared among more or
less related species15
. Species-specific satDNA can be produced by changes in the number of
copies as a result of differential amplification of pre-existing repeats. Ancestor of a closely
related species can contain a "library" of repeat sequences, some of which could be amplified
into a major satellite during cladogenesis20
. Quantitative changes in satDNAs can occur in the
course of the speciation process, thus forming a species-specific profile of satDNAs. It is
generally accepted that satDNAs follow an evolutionary pattern known as concerted evolution
which induces sequence homogenisation within a repeat family and their subsequent fixation
in the population21
. The internal satDNA sequence variability in insects is in range 1-13%22
,
variability of each satDNA in each species depends mainly on the ratio between mutation and
homogenisation/fixation rates21
. Many of the repetitive units of satDNAs have variable and
highly conserved regions this indicates that conserved regions of satDNAs can have important
functional role23,24
. The sequence conservation may be due to the satDNA sequence
interaction with specific proteins important in heterochromatin formation and in the possible
role of satDNA in controlling gene expression25
. Different satDNA types can coexist in a
species, and the sequence variability corresponding to each type can differ. One of
characteristics of satDNA in majority of eukaryotic organisms is an intrinsically bent
structure. Intrinsic curvature is a sequence-dependent property of the DNA molecule which
may be related to chromatin organisation and the tight winding of DNA in constitutive
heterochromatin as well as to specific protein binding26
. SatDNAs have a general reputation
of being transcriptionally inert, however low expression of these non coding sequences has
been observed in many organisms including insects27,28
. Transcription of satDNAs generally
shows developmental-stage and tissue-specific differences, suggesting that the transcripts
could have regulatory roles25
. SatDNAs and their transcripts play critical roles in
heterochromatin formation and in providing regular function of centromere and kinetohore
thus enabling proper chromosome functioning and ensuring genome integrity25,29
. Any
6
disruption in proper heterochromatin formation or in centromere and kinetohore function can
cause aneuploidy and chromosome instability29
. The complete sequence conservation, wide
evolutionary distribution and presence of functional elements such as promoters and
transcription factor binding sites within some satDNA sequences has led to the assumption
that in addition to participating in centromere formation, they might also act as cis-regulatory
elements of gene expression25
. To perform potential regulatory functions, satDNA elements
are predicted to be preferentially distributed in euchromatic portion of the genomes, in the
vicinity of genes.
1.2.1. TCAST satellite DNA
Tribolium species have sequence specific satellite DNA profiles: in each species a
single highly represented satellite is detected and the satellites exhibit no significant sequence
similarity except common structural features in the form of stable dyad structures and A+T
rich blocks. They are main building component of centromeric and pericentromeric regions of
all chromosomes and they all have high A+T content14,30,31
. In the red flour beetle Tribolium
castaneum TCAST is a major satellite DNA and it shares most features common to all main
satellites in Tribolium species. TCAST satellite encompasses centromeric as well as
pericentromeric regions of all chromosomes14
. TCAST satellite has high A+T content of 73%,
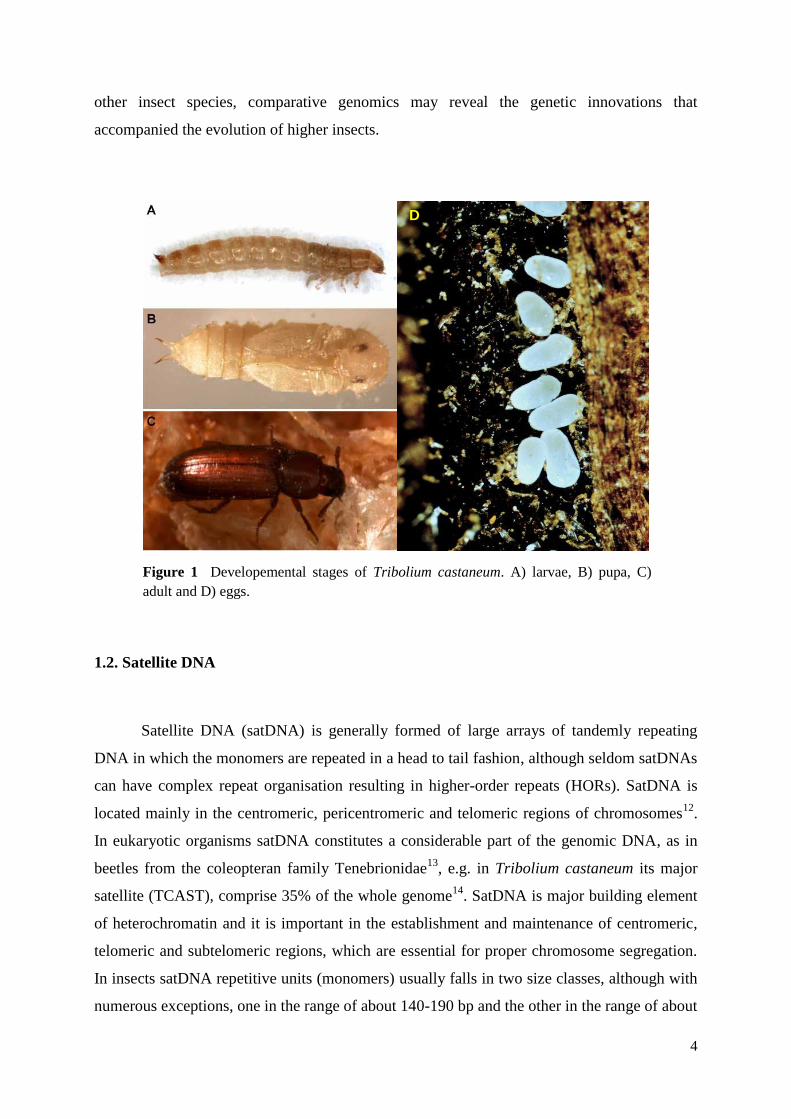
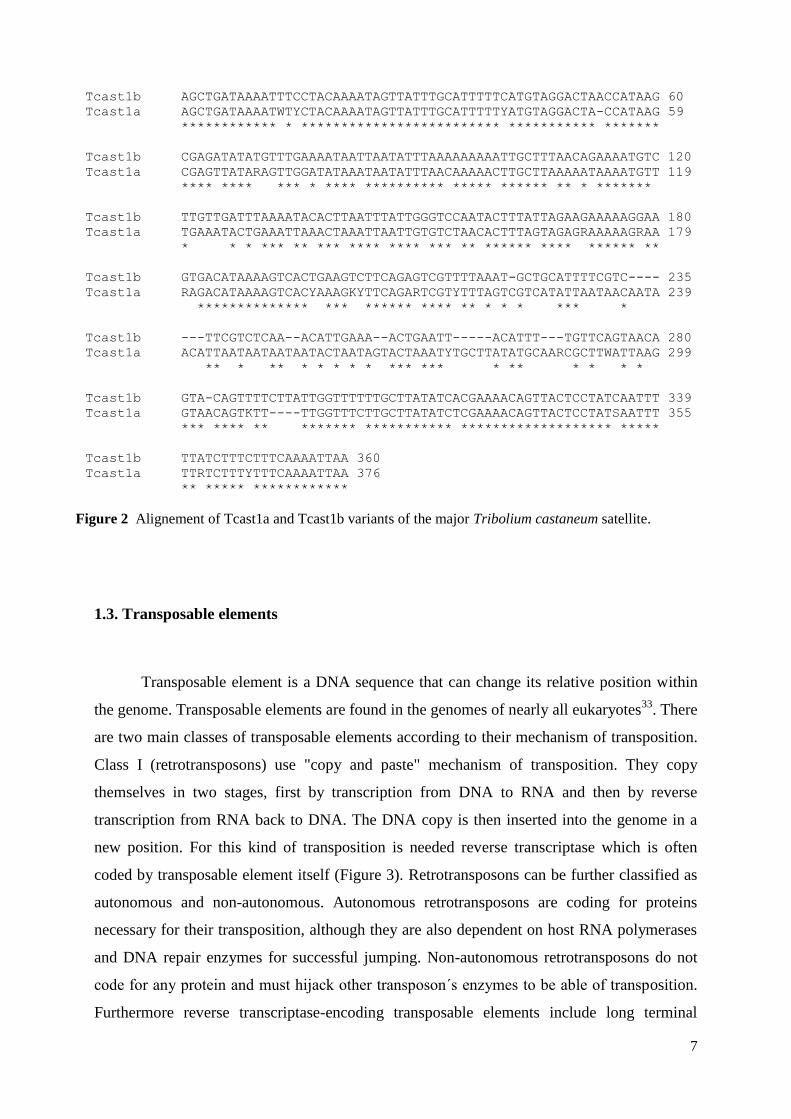
and lacks significant internal substructures. TCAST satellite is composed of two subfamilies
Tcast1a and Tcast1b that together make up between 35-40% of the whole genome. Tcast1a
and Tcast1b have average homology of 79%, similar size of 362 bp and 377 bp respectively,
but are characterized by a divergent, subfamily specific region of approximately 100 bp32
(Figure 2). The two subfamilies are prevalently organized in the interspersed form, although a
portion exists in the form of homogenous tandem arrays composed of only Tcast1a or
Tcast1b. Comparison of sequence variability of Tcast1a and Tcast1b among ten Tribolium
castaneum strains reveals a difference in the frequency of particular mutations present at some
positions. However, no difference in amount or organization of subfamilies was detected
among Tribolium castaneum strains.
7
1.3. Transposable elements
Transposable element is a DNA sequence that can change its relative position within
the genome. Transposable elements are found in the genomes of nearly all eukaryotes33
. There
are two main classes of transposable elements according to their mechanism of transposition.
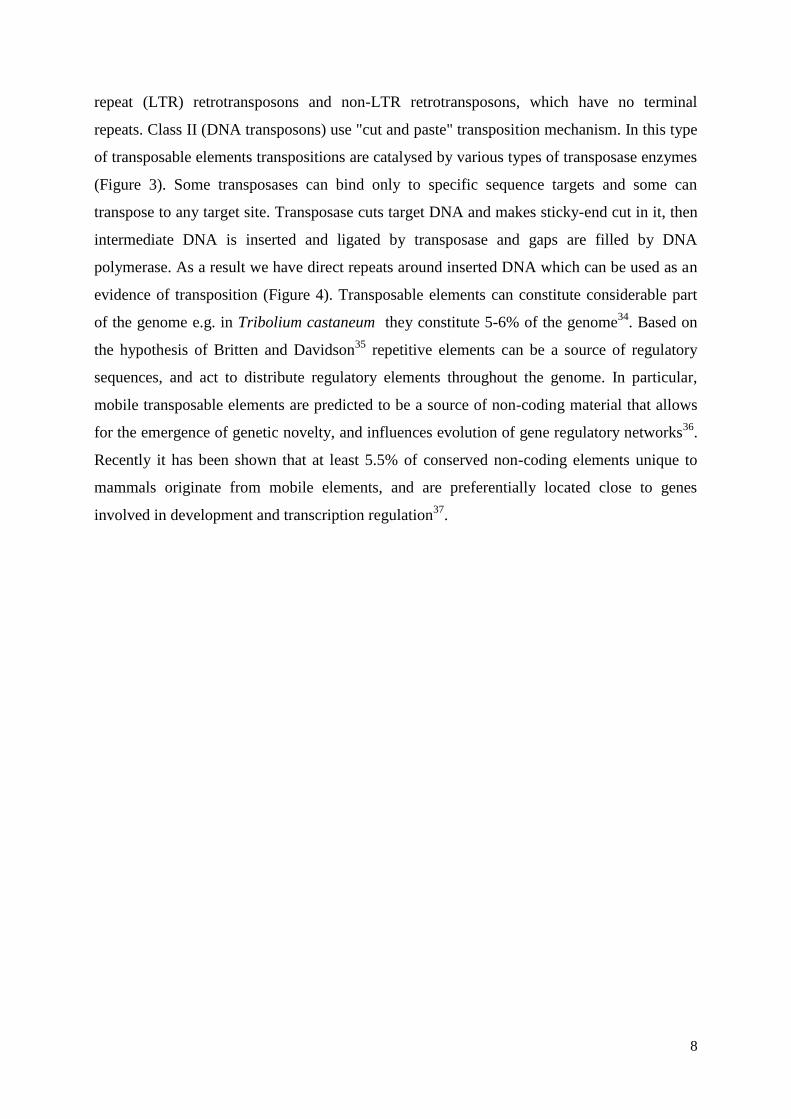
Class I (retrotransposons) use "copy and paste" mechanism of transposition. They copy
themselves in two stages, first by transcription from DNA to RNA and then by reverse
transcription from RNA back to DNA. The DNA copy is then inserted into the genome in a
new position. For this kind of transposition is needed reverse transcriptase which is often
coded by transposable element itself (Figure 3). Retrotransposons can be further classified as
autonomous and non-autonomous. Autonomous retrotransposons are coding for proteins
necessary for their transposition, although they are also dependent on host RNA polymerases
and DNA repair enzymes for successful jumping. Non-autonomous retrotransposons do not
code for any protein and must hijack other transposon´s enzymes to be able of transposition.
Furthermore reverse transcriptase-encoding transposable elements include long terminal
Tcast1b AGCTGATAAAATTTCCTACAAAATAGTTATTTGCATTTTTCATGTAGGACTAACCATAAG 60
Tcast1a AGCTGATAAAATWTYCTACAAAATAGTTATTTGCATTTTTYATGTAGGACTA-CCATAAG 59
************ * ************************* *********** *******
Tcast1b CGAGATATATGTTTGAAAATAATTAATATTTAAAAAAAAATTGCTTTAACAGAAAATGTC 120
Tcast1a CGAGTTATARAGTTGGATATAAATAATATTTAACAAAAACTTGCTTAAAAATAAAATGTT 119
**** **** *** * **** ********** ***** ****** ** * *******
Tcast1b TTGTTGATTTAAAATACACTTAATTTATTGGGTCCAATACTTTATTAGAAGAAAAAGGAA 180
Tcast1a TGAAATACTGAAATTAAACTAAATTAATTGTGTCTAACACTTTAGTAGAGRAAAAAGRAA 179
* * * *** ** *** **** **** *** ** ****** **** ****** **
Tcast1b GTGACATAAAAGTCACTGAAGTCTTCAGAGTCGTTTTAAAT-GCTGCATTTTCGTC---- 235
Tcast1a RAGACATAAAAGTCACYAAAGKYTTCAGARTCGTYTTTAGTCGTCATATTAATAACAATA 239
************** *** ****** **** ** * * * *** *
Tcast1b ---TTCGTCTCAA--ACATTGAAA--ACTGAATT-----ACATTT---TGTTCAGTAACA 280
Tcast1a ACATTAATAATAATAATACTAATAGTACTAAATYTGCTTATATGCAARCGCTTWATTAAG 299
** * ** * * * * * *** *** * ** * * * *
Tcast1b GTA-CAGTTTTCTTATTGGTTTTTTGCTTATATCACGAAAACAGTTACTCCTATCAATTT 339
Tcast1a GTAACAGTKTT----TTGGTTTCTTGCTTATATCTCGAAAACAGTTACTCCTATSAATTT 355
*** **** ** ******* *********** ******************* *****
Tcast1b TTATCTTTCTTTCAAAATTAA 360
Tcast1a TTRTCTTTYTTTCAAAATTAA 376
** ***** ************
Figure 2. Alignement of Tcast1a and Tcast1b variants of the major Tribolium castaneum satellite. Figure 2 Alignement of Tcast1a and Tcast1b variants of the major Tribolium castaneum satellite.
8
repeat (LTR) retrotransposons and non-LTR retrotransposons, which have no terminal
repeats. Class II (DNA transposons) use "cut and paste" transposition mechanism. In this type
of transposable elements transpositions are catalysed by various types of transposase enzymes
(Figure 3). Some transposases can bind only to specific sequence targets and some can
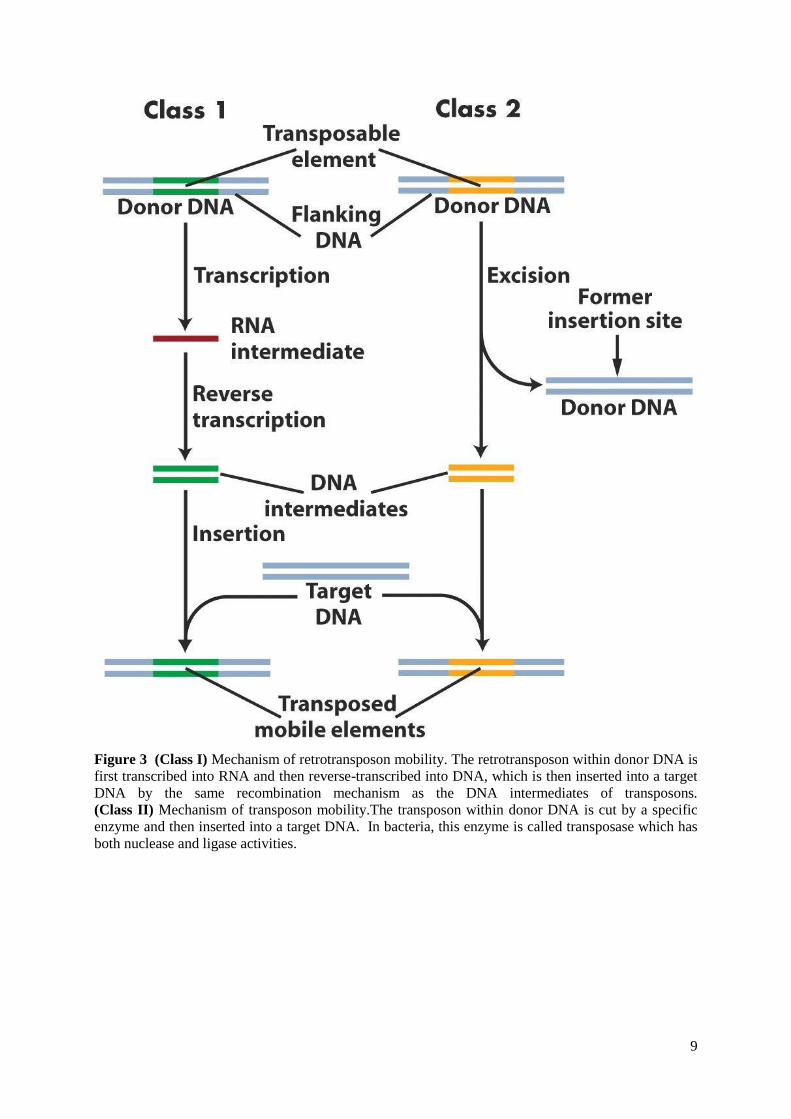
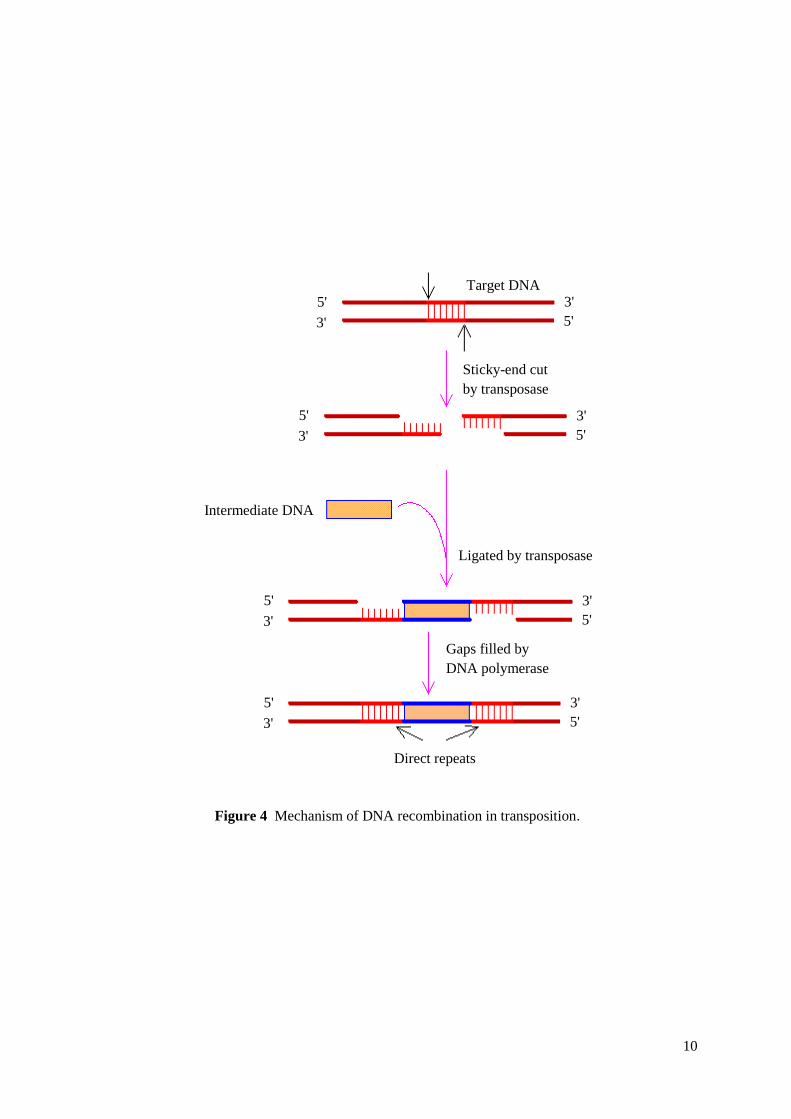
transpose to any target site. Transposase cuts target DNA and makes sticky-end cut in it, then
intermediate DNA is inserted and ligated by transposase and gaps are filled by DNA
polymerase. As a result we have direct repeats around inserted DNA which can be used as an
evidence of transposition (Figure 4). Transposable elements can constitute considerable part
of the genome e.g. in Tribolium castaneum they constitute 5-6% of the genome34
. Based on
the hypothesis of Britten and Davidson35
repetitive elements can be a source of regulatory
sequences, and act to distribute regulatory elements throughout the genome. In particular,
mobile transposable elements are predicted to be a source of non-coding material that allows
for the emergence of genetic novelty, and influences evolution of gene regulatory networks36
.
Recently it has been shown that at least 5.5% of conserved non-coding elements unique to
mammals originate from mobile elements, and are preferentially located close to genes
involved in development and transcription regulation37
.
9
Figure 3 (Class I) Mechanism of retrotransposon mobility. The retrotransposon within donor DNA is
first transcribed into RNA and then reverse-transcribed into DNA, which is then inserted into a target
DNA by the same recombination mechanism as the DNA intermediates of transposons.
(Class II) Mechanism of transposon mobility.The transposon within donor DNA is cut by a specific
enzyme and then inserted into a target DNA. In bacteria, this enzyme is called transposase which has
both nuclease and ligase activities.
10
Figure 4 Mechanism of DNA recombination in transposition.
Target DNA
Sticky-end cut
by transposase
Intermediate DNA
Ligated by transposase
Gaps filled by
DNA polymerase
Direct repeats
5'
3'
5'
3'
3'
5'
3'
5'
3'
5'
3'
5'
5'
3'
5'
3'
11
2. AIMS
Much is known about TCAST satellite DNA structure and organization in
heterochromatic regions of Tribolium castaneum chromosomes14,32
. However, there are many
unanswered questions about presence of TCAST satellite repeats within euchromatic region
of Tribolium castaneum genome. Whole genome sequencing projects enable the presence and
distribution of satellite DNA repeats in the euchromatic portion of the genome to be
determined. The goal of this research is to analyse distribution, organisation, sequence
features and phylogenetic relationships of TCAST repeats within euchromatin as well to
describe genes in their vicinity. Such analysis could give us some insights into possible gene-
regulatory role of satellite DNA elements. In addition, comparison of satellite DNA-like
elements dispersed within euchromatin, with homologous elements present within
heterochromatin, may also reveal insights into the origin of satellite DNAs and their
subsequent evolution38
.
12
3. MATERIALS AND METHODS
3.1. Searching for TCAST satellite sequences in Tribolium castaneum genome
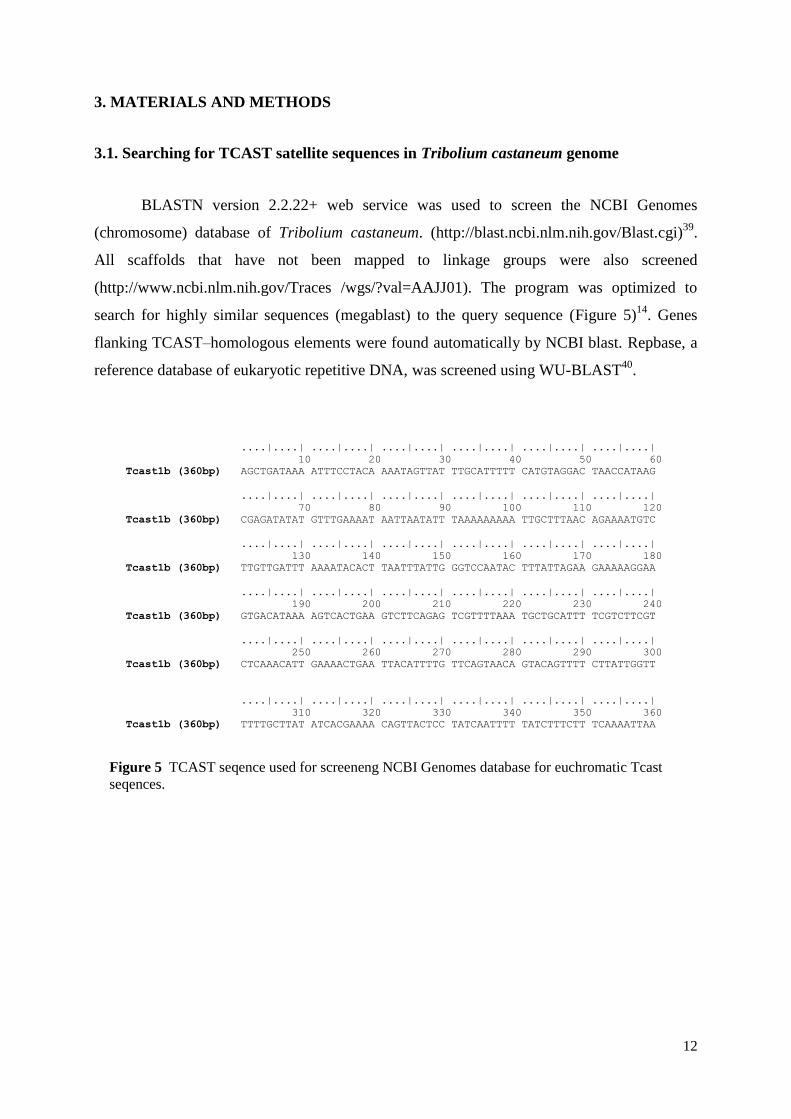
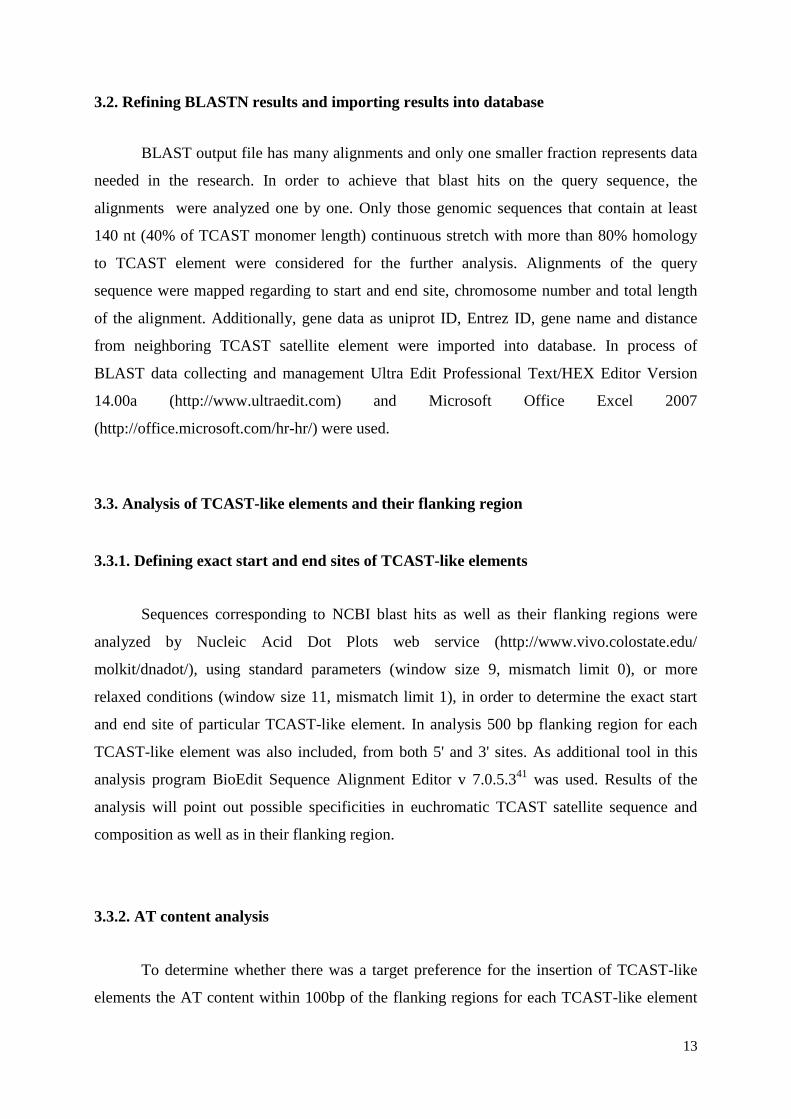
BLASTN version 2.2.22+ web service was used to screen the NCBI Genomes
(chromosome) database of Tribolium castaneum. (http://blast.ncbi.nlm.nih.gov/Blast.cgi)39
.
All scaffolds that have not been mapped to linkage groups were also screened
(http://www.ncbi.nlm.nih.gov/Traces /wgs/?val=AAJJ01). The program was optimized to
search for highly similar sequences (megablast) to the query sequence (Figure 5)14
. Genes
flanking TCAST–homologous elements were found automatically by NCBI blast. Repbase, a
reference database of eukaryotic repetitive DNA, was screened using WU-BLAST40
.
....|....| ....|....| ....|....| ....|....| ....|....| ....|....|
10 20 30 40 50 60
Tcast1b (360bp) AGCTGATAAA ATTTCCTACA AAATAGTTAT TTGCATTTTT CATGTAGGAC TAACCATAAG
....|....| ....|....| ....|....| ....|....| ....|....| ....|....|
70 80 90 100 110 120
Tcast1b (360bp) CGAGATATAT GTTTGAAAAT AATTAATATT TAAAAAAAAA TTGCTTTAAC AGAAAATGTC
....|....| ....|....| ....|....| ....|....| ....|....| ....|....|
130 140 150 160 170 180
Tcast1b (360bp) TTGTTGATTT AAAATACACT TAATTTATTG GGTCCAATAC TTTATTAGAA GAAAAAGGAA
....|....| ....|....| ....|....| ....|....| ....|....| ....|....|
190 200 210 220 230 240
Tcast1b (360bp) GTGACATAAA AGTCACTGAA GTCTTCAGAG TCGTTTTAAA TGCTGCATTT TCGTCTTCGT
....|....| ....|....| ....|....| ....|....| ....|....| ....|....|
250 260 270 280 290 300
Tcast1b (360bp) CTCAAACATT GAAAACTGAA TTACATTTTG TTCAGTAACA GTACAGTTTT CTTATTGGTT
....|....| ....|....| ....|....| ....|....| ....|....| ....|....|
310 320 330 340 350 360
Tcast1b (360bp) TTTTGCTTAT ATCACGAAAA CAGTTACTCC TATCAATTTT TATCTTTCTT TCAAAATTAA
Figure 5 TCAST seqence used for screeneng NCBI Genomes database for euchromatic Tcast
seqences.
13
3.2. Refining BLASTN results and importing results into database
BLAST output file has many alignments and only one smaller fraction represents data
needed in the research. In order to achieve that blast hits on the query sequence, the
alignments were analyzed one by one. Only those genomic sequences that contain at least
140 nt (40% of TCAST monomer length) continuous stretch with more than 80% homology
to TCAST element were considered for the further analysis. Alignments of the query
sequence were mapped regarding to start and end site, chromosome number and total length
of the alignment. Additionally, gene data as uniprot ID, Entrez ID, gene name and distance
from neighboring TCAST satellite element were imported into database. In process of
BLAST data collecting and management Ultra Edit Professional Text/HEX Editor Version
14.00a (http://www.ultraedit.com) and Microsoft Office Excel 2007
(http://office.microsoft.com/hr-hr/) were used.
3.3. Analysis of TCAST-like elements and their flanking region
3.3.1. Defining exact start and end sites of TCAST-like elements
Sequences corresponding to NCBI blast hits as well as their flanking regions were
analyzed by Nucleic Acid Dot Plots web service (http://www.vivo.colostate.edu/
molkit/dnadot/), using standard parameters (window size 9, mismatch limit 0), or more
relaxed conditions (window size 11, mismatch limit 1), in order to determine the exact start
and end site of particular TCAST-like element. In analysis 500 bp flanking region for each
TCAST-like element was also included, from both 5' and 3' sites. As additional tool in this
analysis program BioEdit Sequence Alignment Editor v 7.0.5.341
was used. Results of the
analysis will point out possible specificities in euchromatic TCAST satellite sequence and
composition as well as in their flanking region.
3.3.2. AT content analysis
To determine whether there was a target preference for the insertion of TCAST-like
elements the AT content within 100bp of the flanking regions for each TCAST-like element
14
was analyzed, from both 5' and 3' sites. AT content was analyzed using BioEdit Sequence
Alignment Editor41
.
3.3.3. Terminal inverted repeats and target site duplications analysis
The TCAST transposon-like elements were analyzed in detail for the presence of
hallmarks, such as terminal inverted repeats (TIRs) and target site duplications (TDs) with the
aid of the Gene Jockey sequence analysis program (Apple Macintosh).
3.3.4. Secondary structure analysis
Secondary structure analysis was performed to detect if there were present any
secondary structure motifs specific for TCAST-like elements. Secondary structures were
determined using the default parameters of the MFOLD web server
(http://mfold.rna.albany.edu/ ?q=mfold)42
. MFOLD web server algorithm predicts a minimum
free energy for a given single stranded nucleotide sequence needed to predict nucleic acid
folding as well as hybridization and melting temperatures.
3.3.5. Sequence alignment and phylogenetic analysis
To see whether there is any clustering of sequences of TCAST satellite-like elements
due to the difference in the homogenization at the level of local array, chromosome, or among
different chromosomes, sequence alignment and phylogenetic analysis were performed.
Tcast1a and Tcast1b subunits were analyzed separately. Sequence alignment was performed
using MUSCLE algorithm43
combined with manual adjustment. All sequences were included
in the alignment, with the exception of the ones that did not at least partially overlap with
other sequences. Gblocks was used to eliminate poorly aligned positions and divergent
regions of the alignments44
. jModelTest 0.1.1 software45
was used to inferre best-fit models of
DNA evolution - TPM3uf+G for transposon-like and A type elements, and TPM1uf for B
type elements. Maximum likelihood (ML) trees were estimated with the PhyML 3.0
software46
using best-fit models. Markov chain Monte Carlo (MCMC) Bayesian searches
15
were performed in MrBayes v. 3.1.2.47
under the best-fit models (2 simultaneous runs, each
with 4 chains; 3x10⁶ generations; sampling frequency 1 in every 100 generations; majority
rule consensus trees constructed based on trees sampled after burn-in). Branch support was
evaluated by bootstrap analysis (1000 replicates) in ML and by posterior probabilities in
Bayesian analyses. Pairwise sequence diversity (uncorrected p) was calculated using the
MEGA 5.05 software48
.
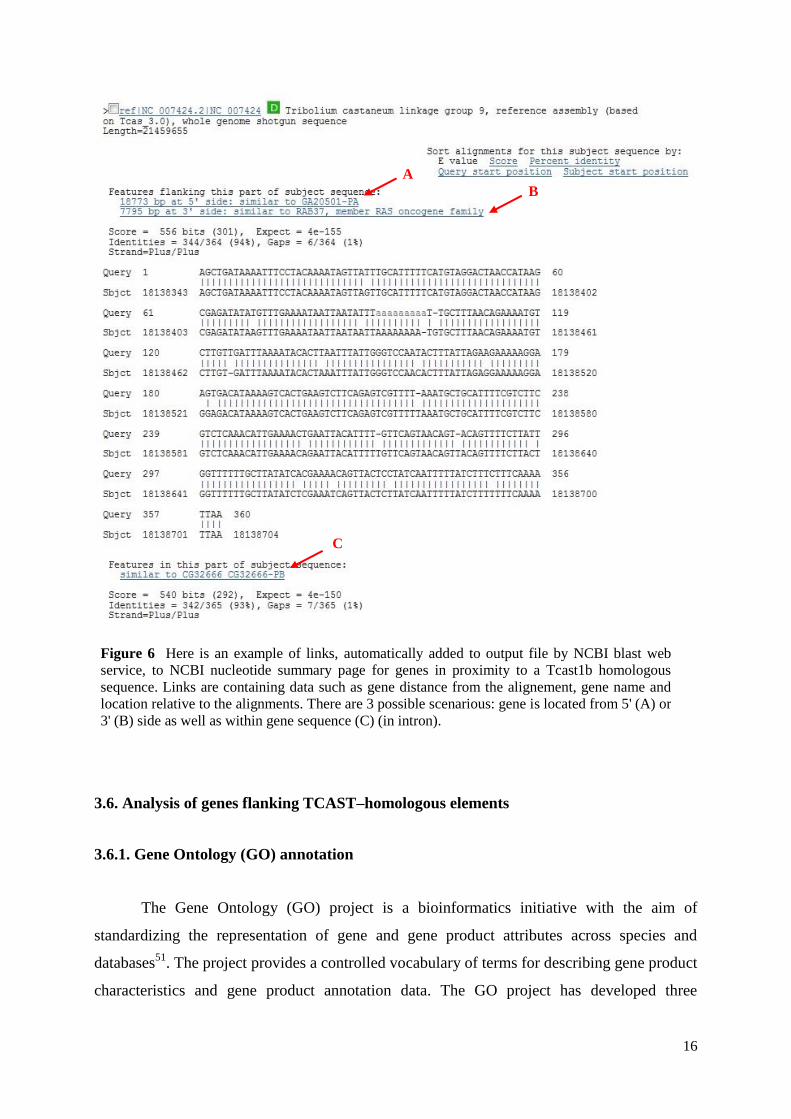
3.4. Searching for genes in the vicinity to TCAST satellite elements
Genes flanking TCAST-homologous elements were found automatically by NCBI
blast (Figure 6). All genes automatically found by NCBI blast web service were included in
the analysis. TCAST satellite homologous elements were mapped to 5' or 3' ends, as well as
within introns of protein coding genes. Link in the NCBI blast output file for the
corresponding neighbouring gene enables redirection to selected NCBI nucleotide region
summary page where, among many other data, ENTREZ gene id for corresponding gene can
be found. Through this gene id uniprot ID can be obtained and it is used in the further gene
identification.
3.5. Searching for Tribolium castaneum genes homologues in Drosophila melanogaster
Tribolium castaneum genes homologues in Drosophila melanogaster were searched
by using OrthoDB Phylogenomic database (http://cegg.unige.ch/orthodb4)49
. Each gene has
OrthoDB identifier under Uniprot data (http://www.uniprot.org/)50
which is linked to
OrthoDB. OrthoDB identifier is a link between orthologous genes in different species. Each
Drosophila melanogaster gene is represented by unique FlyBase number while each
Tribolium castaneum gene is represented by unique Uniprot ID.
16
3.6. Analysis of genes flanking TCAST–homologous elements
3.6.1. Gene Ontology (GO) annotation
The Gene Ontology (GO) project is a bioinformatics initiative with the aim of
standardizing the representation of gene and gene product attributes across species and
databases51
. The project provides a controlled vocabulary of terms for describing gene product
characteristics and gene product annotation data. The GO project has developed three
A
B
C
Figure 6 Here is an example of links, automatically added to output file by NCBI blast web
service, to NCBI nucleotide summary page for genes in proximity to a Tcast1b homologous
sequence. Links are containing data such as gene distance from the alignement, gene name and
location relative to the alignments. There are 3 possible scenarious: gene is located from 5' (A) or
3' (B) side as well as within gene sequence (C) (in intron).
17
structured controlled vocabularies (ontologies) that describe gene products in terms of their
associated biological processes, cellular components and molecular functions in a species-
independent manner. The controlled vocabularies are structured so that they can be queried at
different levels: for example, GO can be used to find all the gene products in the Tribolium
castaneum genome that are involved in signal transduction, or can be used to zoom in on all
the receptor tyrosine kinases. This structure also allows annotators to assign properties to
genes or gene products at different levels, depending on the depth of knowledge about that
entity. On uniprot protein summary page there is a link to EBI Quick GO database
(http://www.ebi.ac.uk/QuickGO/) where a list of assigned GO terms for each gene of interest
was obtained. Acquired data was used to create table with detailed description of the genes,
including molecular function of their protein products, biological processes in which these
proteins are involved, and their cellular localization (cellular component). Table with detailed
description of the genes was created using data for Tribolium castaneum genes. In cases
where ortholog gene in Drosophila melanogaster had more GO information than the one from
Tribolium castaneum these additional GO annotations were added too.
3.6.2. Determining correlated characteristics between genes
In order to determine biological features (annotations) that frequently co-occur in a set
of genes and rank them by statistical significance web service GeneCodis 2.0
(http://genecodis.dacya.ucm.es/)52
and Fatigo (http://babelomics.bioinfo.cipf.es/)53
were used.
GeneCodis and Fatigo generate statistical rank scores for single annotations and their
combinations. To find all the possible combinations of annotations, GeneCodis uses the
apriori algorithm54
and Fatigo uses Fisher's exact test for 2*2 contingency tables55
to carry
out enrichment test. Once the annotations were extracted, a statistical analysis based on the
hypergeometric distribution or the Chi2 test of independence was executed to calculate the
statistical significance (p values) for each individual annotation or co-annotations.
Determination of biological annotations or combinations of annotations that are significantly
associated to a list of genes under study with respect to a reference list will emphasize
possible gene regulatory role of TCAST satellite. One problem in this analysis is that
GeneCodis still doesn't have Tribolium castaneum gene annotations database, and therefore in
order to perform this kind of analysis Drosophila melanogaster gene annotations database
needs to be used. The results acquired for Drosophila melanogaster can be used to draw
18
conclusions about Tribolium castaneum because usually orthologs have the same function56
.
Annotations tracked were three GO (biological process, molecular function and cellular
component), KEGG pathways and InterPro Motifs anotations.
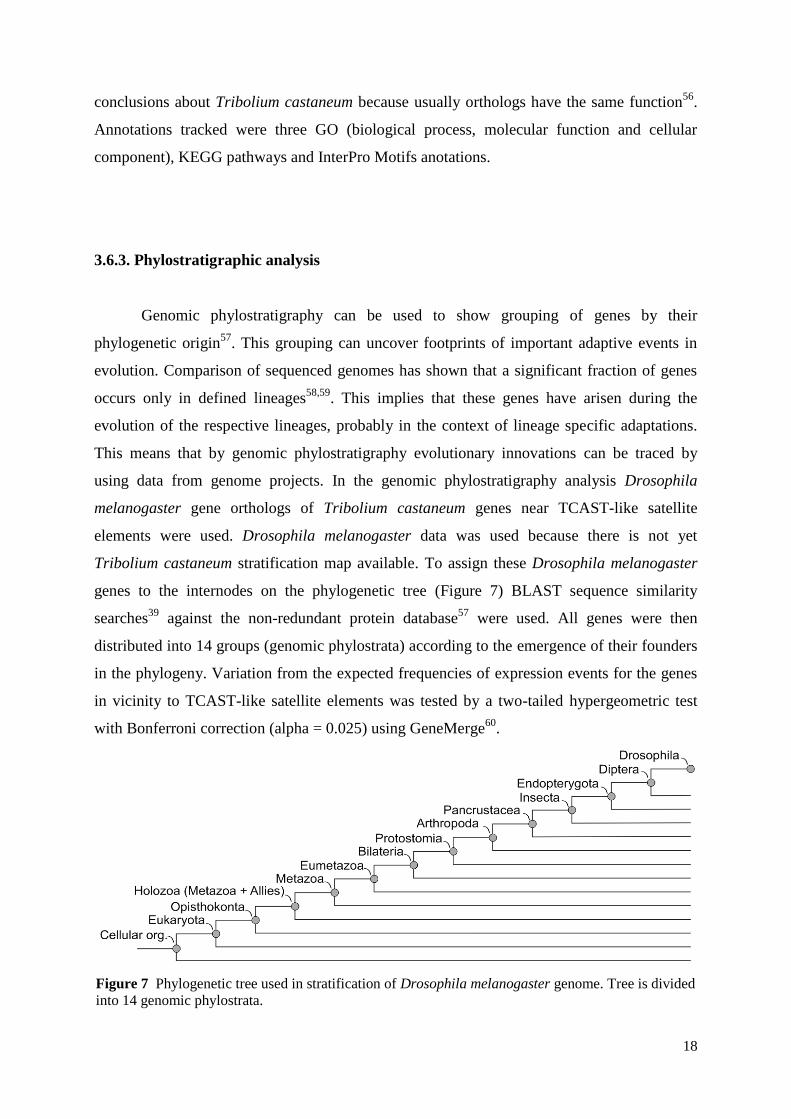
3.6.3. Phylostratigraphic analysis
Genomic phylostratigraphy can be used to show grouping of genes by their
phylogenetic origin57
. This grouping can uncover footprints of important adaptive events in
evolution. Comparison of sequenced genomes has shown that a significant fraction of genes
occurs only in defined lineages58,59
. This implies that these genes have arisen during the
evolution of the respective lineages, probably in the context of lineage specific adaptations.
This means that by genomic phylostratigraphy evolutionary innovations can be traced by
using data from genome projects. In the genomic phylostratigraphy analysis Drosophila
melanogaster gene orthologs of Tribolium castaneum genes near TCAST-like satellite
elements were used. Drosophila melanogaster data was used because there is not yet
Tribolium castaneum stratification map available. To assign these Drosophila melanogaster
genes to the internodes on the phylogenetic tree (Figure 7) BLAST sequence similarity
searches39
against the non-redundant protein database57
were used. All genes were then
distributed into 14 groups (genomic phylostrata) according to the emergence of their founders
in the phylogeny. Variation from the expected frequencies of expression events for the genes
in vicinity to TCAST-like satellite elements was tested by a two-tailed hypergeometric test
with Bonferroni correction (alpha = 0.025) using GeneMerge60
.
Figure 7 Phylogenetic tree used in stratification of Drosophila melanogaster genome. Tree is divided
into 14 genomic phylostrata.
19
3.7. Analysis of distribution of TCAST-like elements on Tribolium castaneum
chromosomes
Two-tailed hypergeometric test with Bonferroni correction (alpha = 0.025) was used to
analyse the distribution of TCAST-like elements among Tribolium castaneum chromosomes
in order to detect whether TCAST-like elements were distributed randomly among the
Tribolium castaneum chromosomes or whether there was a significant over or
underrepresentation of the elements on some chromosomes. In each chromosome the
frequency of TCAST-like elements was compared with the frequency in the complete sample
and the significance of deviations was calculated. Furthermore, positions of constitutive
heterochromatin and euchromatin were assigned on the haploid set of Tribolium castaneum
chromosomes, based on C-banding data61
and Tribolium castaneum 3.0 Assembly data
(http://www.beetlebase.org). Within euchromatic segments, the position of each TCAST-like
element is specifically indicated based on the position within the genomic sequence.
20
4. RESULTS
4.1. Identification of dispersed TCAST-like elements
Using the consensus sequence of TCAST satellite DNA (Figure 5) as a query
sequence, the NCBI Genomes database of Tribolium castaneum was screened, employing the
alignment program BLASTN version 2.2.22+. The program was optimized to search for
highly similar sequences (megablast) and blast hits on the query sequence were analyzed
individually. Alignments were mapped regarding start and end site, chromosome number,
alignment orientation and total length. When the distance between two alignments on the
same chromosome was short, the genomic sequence was further analyzed by dot plot and
BioEdit Sequence Alignment editor to identify any potential continuity between the two
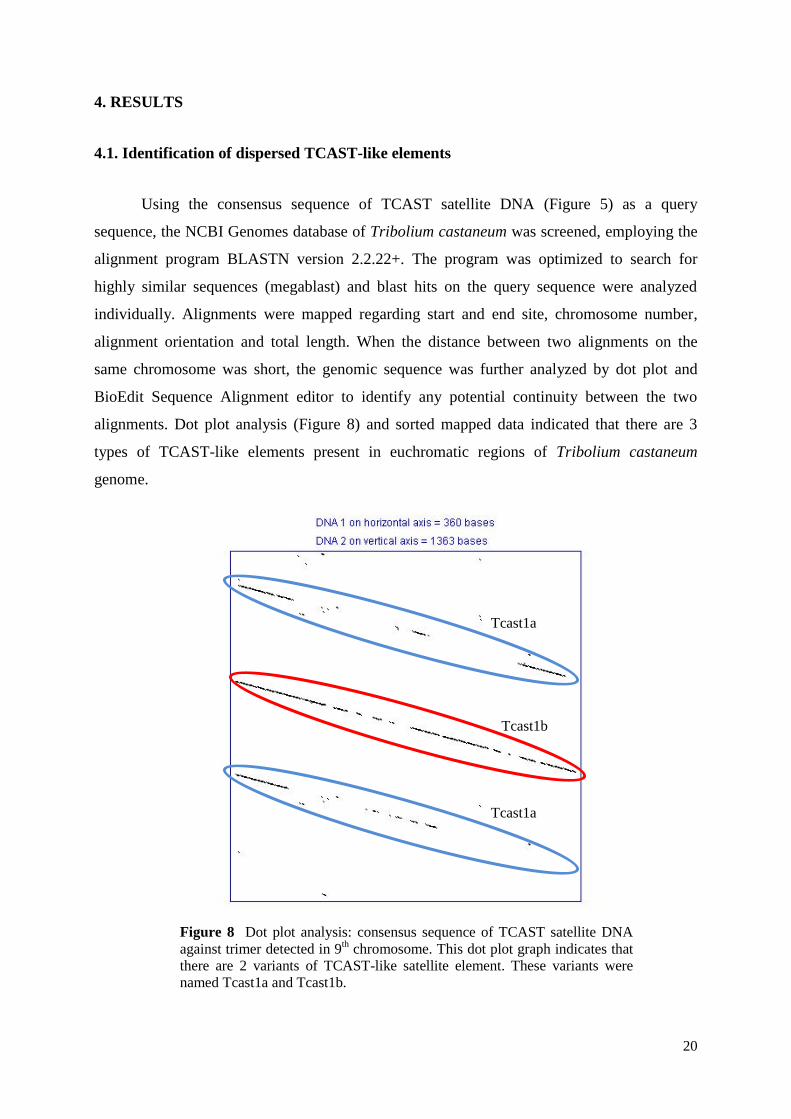
alignments. Dot plot analysis (Figure 8) and sorted mapped data indicated that there are 3
types of TCAST-like elements present in euchromatic regions of Tribolium castaneum
genome.
Figure 8 Dot plot analysis: consensus sequence of TCAST satellite DNA
against trimer detected in 9th chromosome. This dot plot graph indicates that
there are 2 variants of TCAST-like satellite element. These variants were
named Tcast1a and Tcast1b.
Tcast1a
Tcast1a
Tcast1b
21
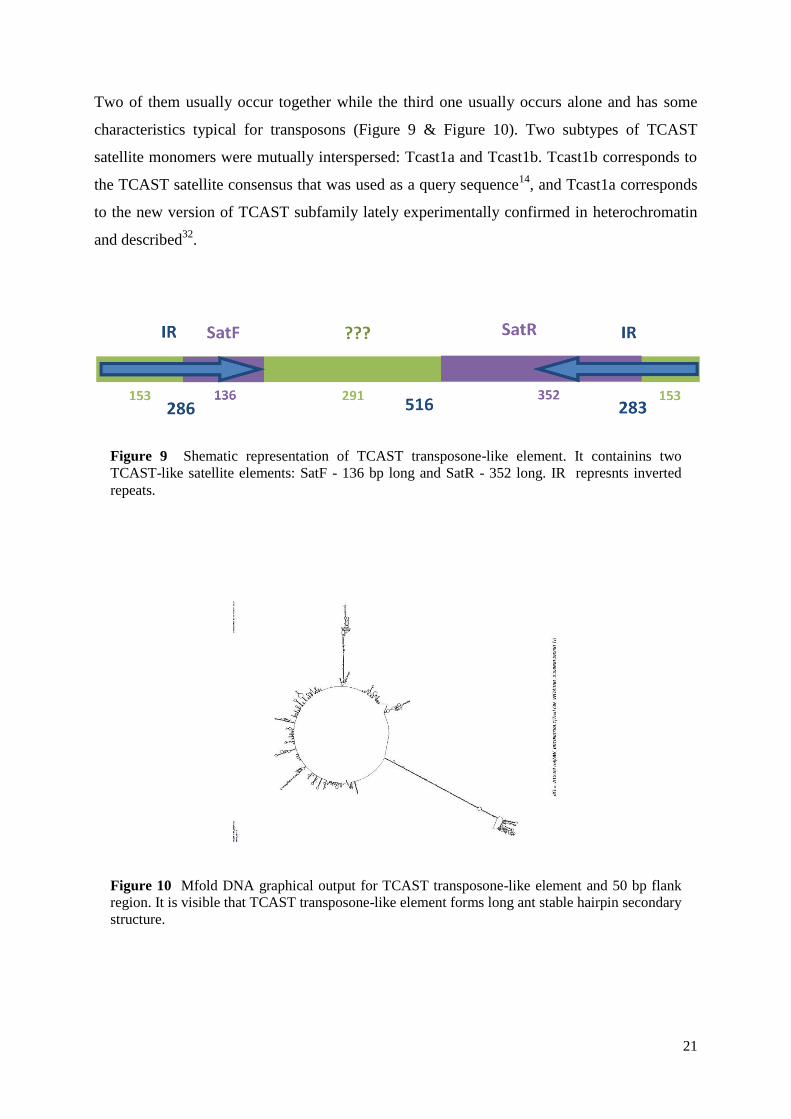
Two of them usually occur together while the third one usually occurs alone and has some
characteristics typical for transposons (Figure 9 & Figure 10). Two subtypes of TCAST
satellite monomers were mutually interspersed: Tcast1a and Tcast1b. Tcast1b corresponds to
the TCAST satellite consensus that was used as a query sequence14
, and Tcast1a corresponds
to the new version of TCAST subfamily lately experimentally confirmed in heterochromatin
and described32
.
Figure 9 Shematic representation of TCAST transposone-like element. It containins two
TCAST-like satellite elements: SatF - 136 bp long and SatR - 352 long. IR represnts inverted
repeats.
Figure 10 Mfold DNA graphical output for TCAST transposone-like element and 50 bp flank
region. It is visible that TCAST transposone-like element forms long ant stable hairpin secondary
structure.
22
4.2. Classification of dispersed TCAST-like elements
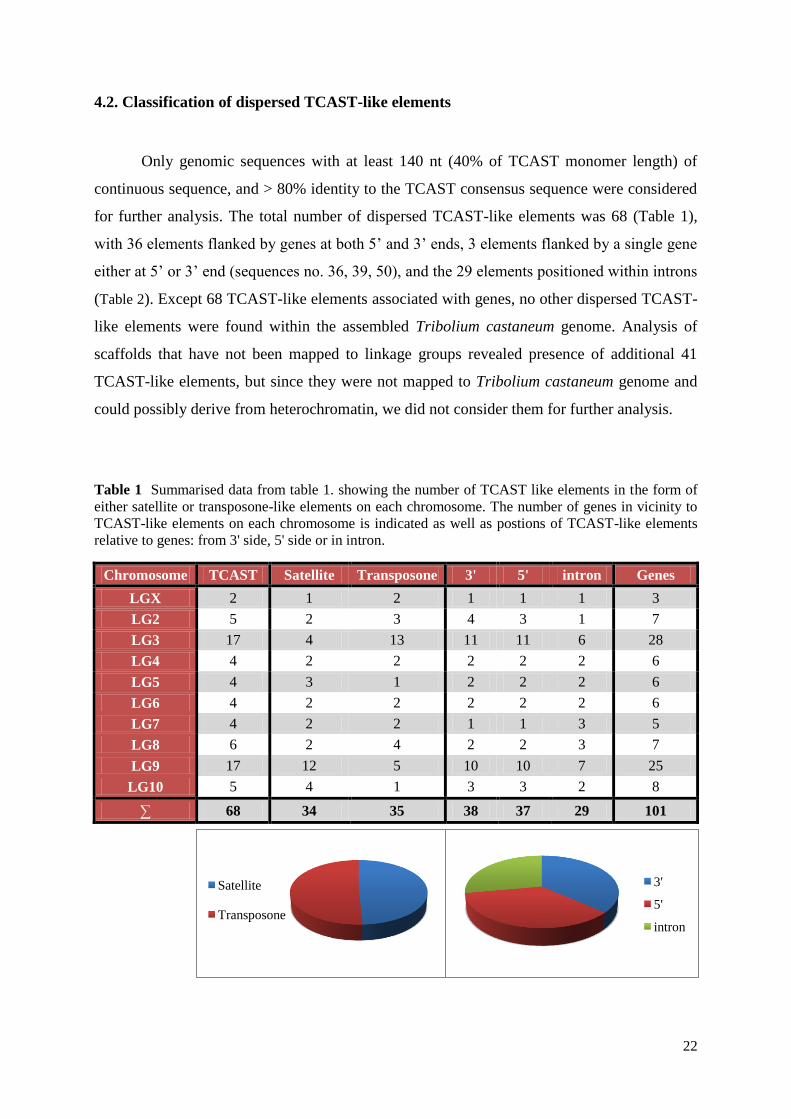
Only genomic sequences with at least 140 nt (40% of TCAST monomer length) of
continuous sequence, and > 80% identity to the TCAST consensus sequence were considered
for further analysis. The total number of dispersed TCAST-like elements was 68 (Table 1),
with 36 elements flanked by genes at both 5’ and 3’ ends, 3 elements flanked by a single gene
either at 5’ or 3’ end (sequences no. 36, 39, 50), and the 29 elements positioned within introns
(Table 2). Except 68 TCAST-like elements associated with genes, no other dispersed TCAST-
like elements were found within the assembled Tribolium castaneum genome. Analysis of
scaffolds that have not been mapped to linkage groups revealed presence of additional 41
TCAST-like elements, but since they were not mapped to Tribolium castaneum genome and
could possibly derive from heterochromatin, we did not consider them for further analysis.
Table 1 Summarised data from table 1. showing the number of TCAST like elements in the form of
either satellite or transposone-like elements on each chromosome. The number of genes in vicinity to
TCAST-like elements on each chromosome is indicated as well as postions of TCAST-like elements
relative to genes: from 3' side, 5' side or in intron.
Chromosome TCAST Satellite Transposone 3' 5' intron Genes
LGX 2 1 2 1 1 1 3
LG2 5 2 3 4 3 1 7
LG3 17 4 13 11 11 6 28
LG4 4 2 2 2 2 2 6
LG5 4 3 1 2 2 2 6
LG6 4 2 2 2 2 2 6
LG7 4 2 2 1 1 3 5
LG8 6 2 4 2 2 3 7
LG9 17 12 5 10 10 7 25
LG10 5 4 1 3 3 2 8
∑ 68 34 35 38 37 29 101
Satellite
Transposone
3'
5'
intron
23
There were only three cases in which two different TCAST-like elements were associated
with the same gene: gene D6X2C4 contains TCAST-like sequences no. 6 and 13 within
introns, gene D6X2U7 is flanked at 5’ and 3’ end by sequences no. 5 and 7, respectively,
while gene D6WB29 is located at 3’ end of the sequence no. 53 and has sequence no. 52
within an intron. All other TCAST-like elements were positioned near or within different
genes. Thus in total, there were 101 genes found in the vicinity of TCAST-like elements.
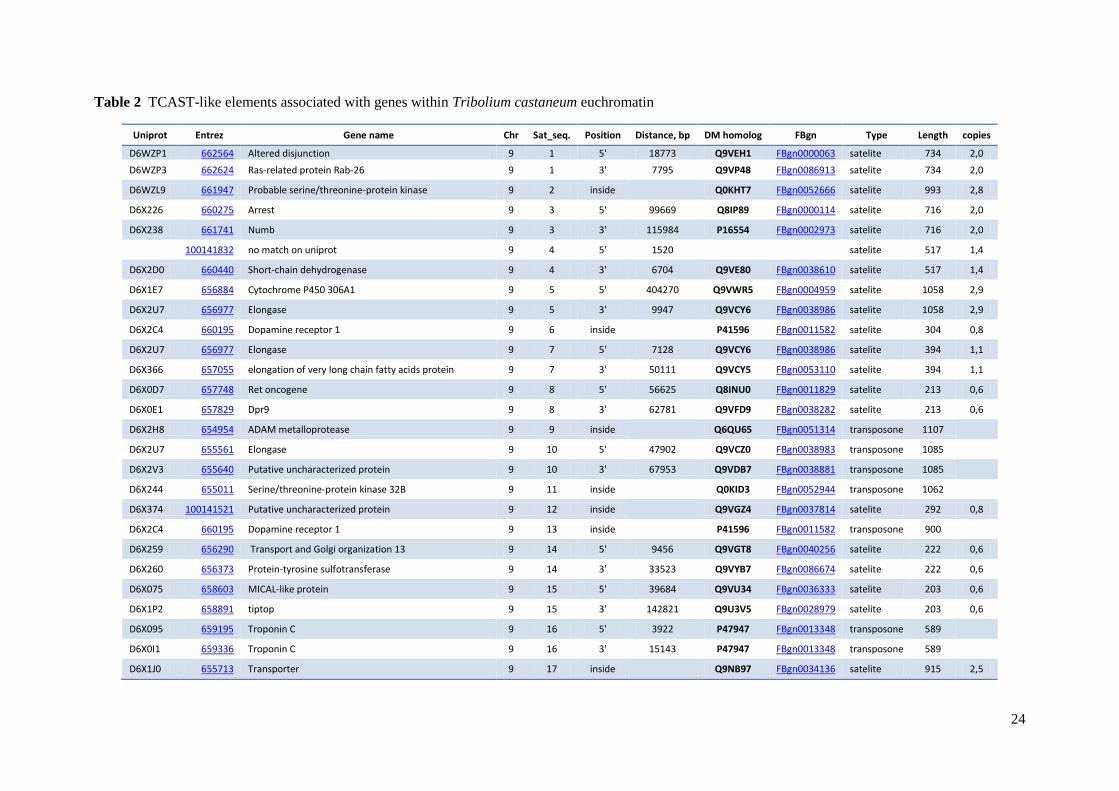
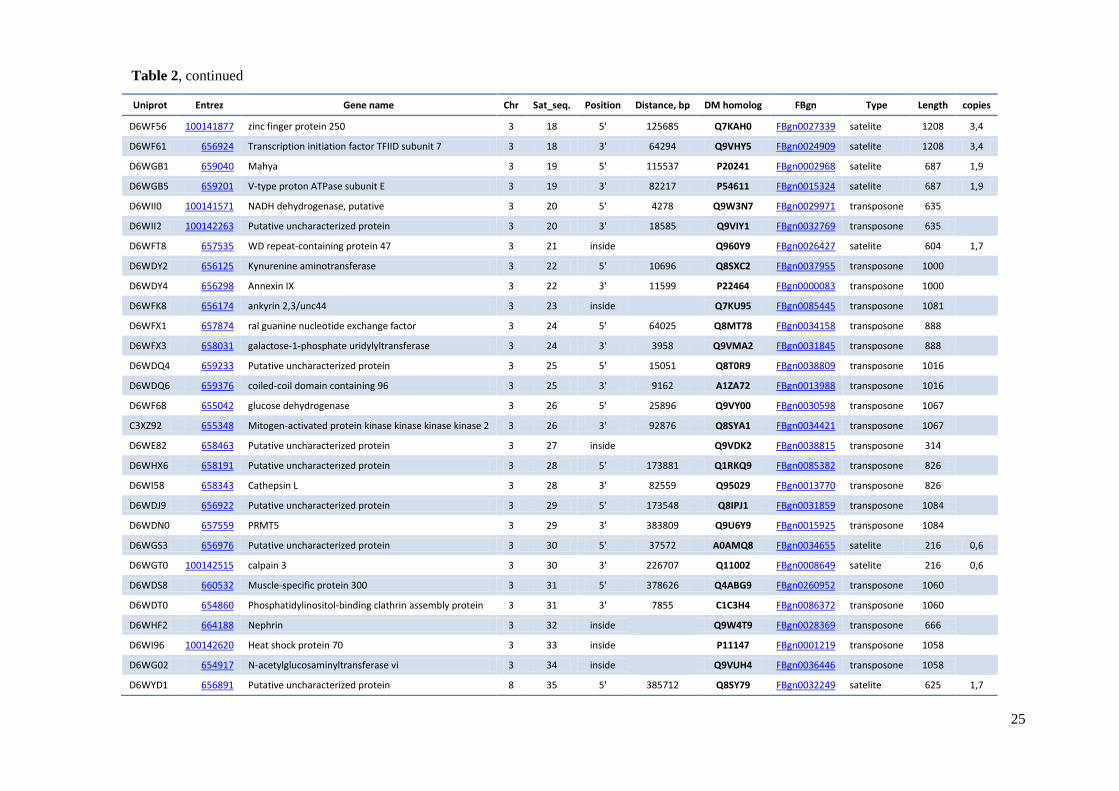
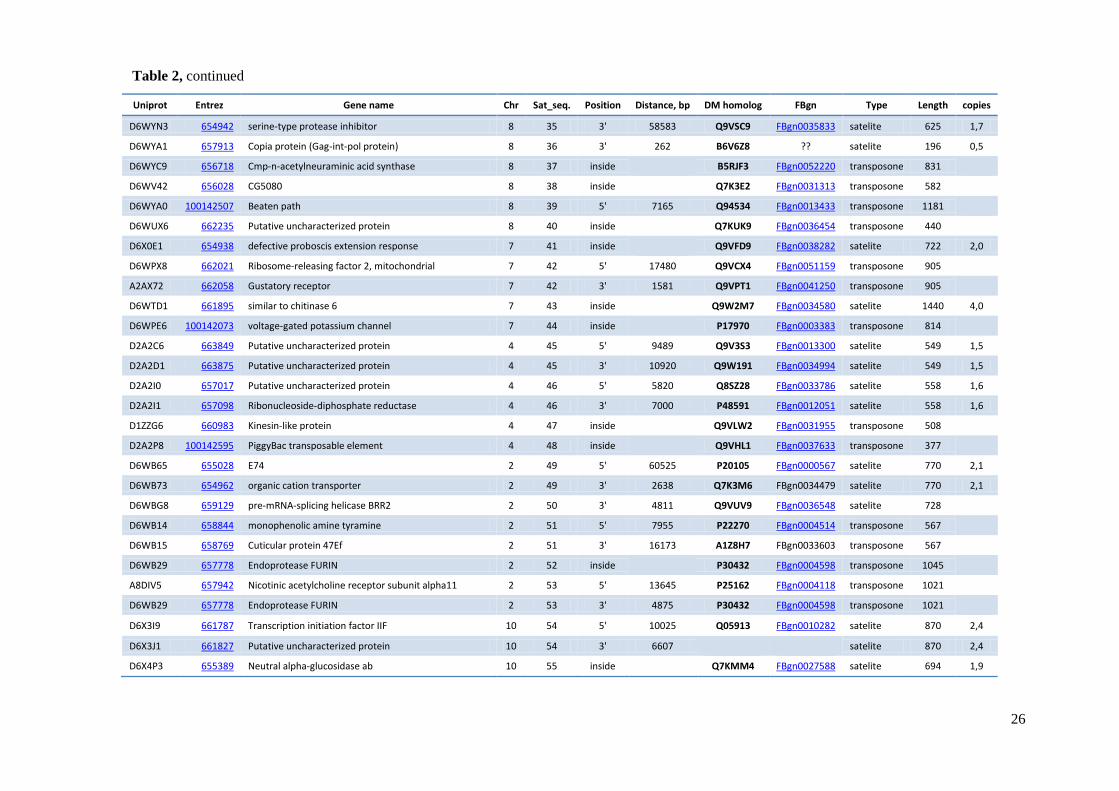
Characteristics of the genes associated with TCAST-like elements, including gene identity
number, gene name and chromosomal location, position relative to the associated TCAST-like
element and distances between TCAST-like elements and genes are shown in Table 2.
Distances between TCAST-like elements and genes range from 262 nt (gene positioned at 3’
site of the sequence no. 36 ), to a maximal distance of 404 270 nt (gene positioned at 5’ site of
the sequence no. 5 ).
24
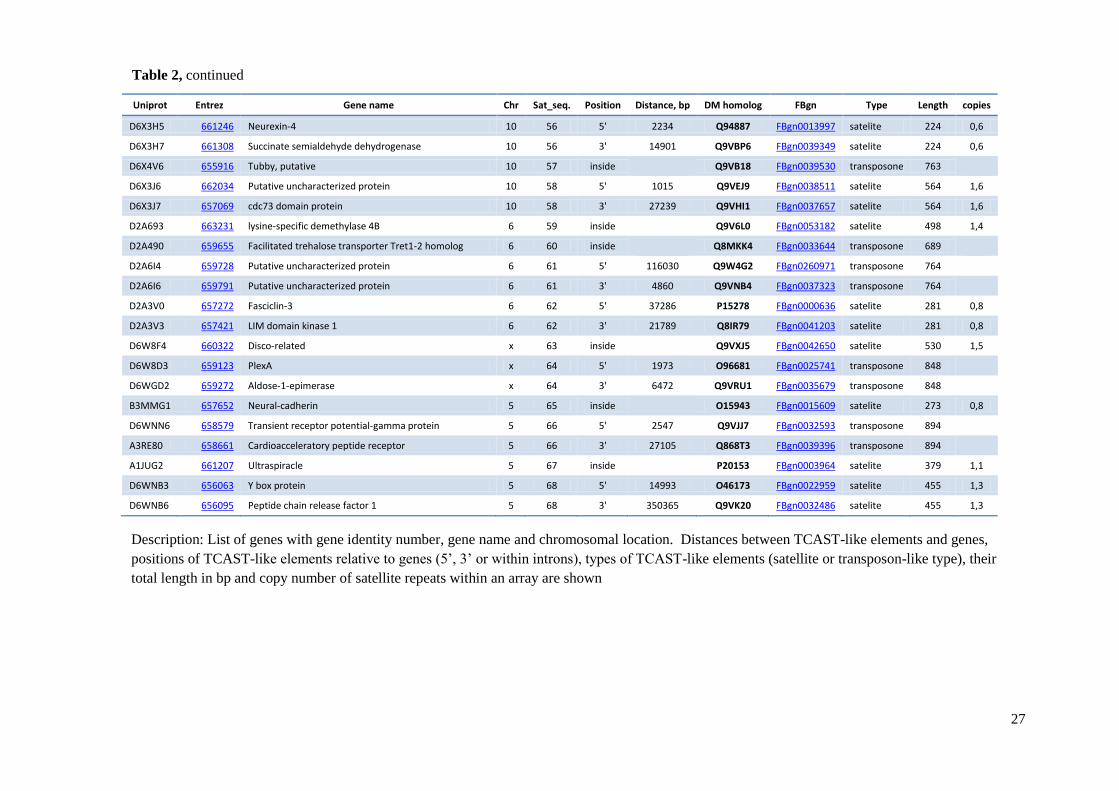
Table 2 TCAST-like elements associated with genes within Tribolium castaneum euchromatin
Uniprot Entrez Gene name Chr Sat_seq. Position Distance, bp DM homolog FBgn Type Length copies
D6WZP1 662564 Altered disjunction 9 1 5' 18773 Q9VEH1 FBgn0000063 satelite 734 2,0
D6WZP3 662624 Ras-related protein Rab-26 9 1 3' 7795 Q9VP48 FBgn0086913 satelite 734 2,0
D6WZL9 661947 Probable serine/threonine-protein kinase 9 2 inside
Q0KHT7 FBgn0052666 satelite 993 2,8
D6X226 660275 Arrest 9 3 5' 99669 Q8IP89 FBgn0000114 satelite 716 2,0
D6X238 661741 Numb 9 3 3' 115984 P16554 FBgn0002973 satelite 716 2,0
100141832 no match on uniprot 9 4 5' 1520
satelite 517 1,4
D6X2D0 660440 Short-chain dehydrogenase 9 4 3' 6704 Q9VE80 FBgn0038610 satelite 517 1,4
D6X1E7 656884 Cytochrome P450 306A1 9 5 5' 404270 Q9VWR5 FBgn0004959 satelite 1058 2,9
D6X2U7 656977 Elongase 9 5 3' 9947 Q9VCY6 FBgn0038986 satelite 1058 2,9
D6X2C4 660195 Dopamine receptor 1 9 6 inside
P41596 FBgn0011582 satelite 304 0,8
D6X2U7 656977 Elongase 9 7 5' 7128 Q9VCY6 FBgn0038986 satelite 394 1,1
D6X366 657055 elongation of very long chain fatty acids protein 9 7 3' 50111 Q9VCY5 FBgn0053110 satelite 394 1,1
D6X0D7 657748 Ret oncogene 9 8 5' 56625 Q8INU0 FBgn0011829 satelite 213 0,6
D6X0E1 657829 Dpr9 9 8 3' 62781 Q9VFD9 FBgn0038282 satelite 213 0,6
D6X2H8 654954 ADAM metalloprotease 9 9 inside
Q6QU65 FBgn0051314 transposone 1107
D6X2U7 655561 Elongase 9 10 5' 47902 Q9VCZ0 FBgn0038983 transposone 1085
D6X2V3 655640 Putative uncharacterized protein 9 10 3' 67953 Q9VDB7 FBgn0038881 transposone 1085
D6X244 655011 Serine/threonine-protein kinase 32B 9 11 inside
Q0KID3 FBgn0052944 transposone 1062
D6X374 100141521 Putative uncharacterized protein 9 12 inside
Q9VGZ4 FBgn0037814 satelite 292 0,8
D6X2C4 660195 Dopamine receptor 1 9 13 inside
P41596 FBgn0011582 transposone 900
D6X259 656290 Transport and Golgi organization 13 9 14 5' 9456 Q9VGT8 FBgn0040256 satelite 222 0,6
D6X260 656373 Protein-tyrosine sulfotransferase 9 14 3' 33523 Q9VYB7 FBgn0086674 satelite 222 0,6
D6X075 658603 MICAL-like protein 9 15 5' 39684 Q9VU34 FBgn0036333 satelite 203 0,6
D6X1P2 658891 tiptop 9 15 3' 142821 Q9U3V5 FBgn0028979 satelite 203 0,6
D6X095 659195 Troponin C 9 16 5' 3922 P47947 FBgn0013348 transposone 589
D6X0I1 659336 Troponin C 9 16 3' 15143 P47947 FBgn0013348 transposone 589
D6X1J0 655713 Transporter 9 17 inside
Q9NB97 FBgn0034136 satelite 915 2,5
25
Uniprot Entrez Gene name Chr Sat_seq. Position Distance, bp DM homolog FBgn Type Length copies
D6WF56 100141877 zinc finger protein 250 3 18 5' 125685 Q7KAH0 FBgn0027339 satelite 1208 3,4
D6WF61 656924 Transcription initiation factor TFIID subunit 7 3 18 3' 64294 Q9VHY5 FBgn0024909 satelite 1208 3,4
D6WGB1 659040 Mahya 3 19 5' 115537 P20241 FBgn0002968 satelite 687 1,9
D6WGB5 659201 V-type proton ATPase subunit E 3 19 3' 82217 P54611 FBgn0015324 satelite 687 1,9
D6WII0 100141571 NADH dehydrogenase, putative 3 20 5' 4278 Q9W3N7 FBgn0029971 transposone 635
D6WII2 100142263 Putative uncharacterized protein 3 20 3' 18585 Q9VIY1 FBgn0032769 transposone 635
D6WFT8 657535 WD repeat-containing protein 47 3 21 inside
Q960Y9 FBgn0026427 satelite 604 1,7
D6WDY2 656125 Kynurenine aminotransferase 3 22 5' 10696 Q8SXC2 FBgn0037955 transposone 1000
D6WDY4 656298 Annexin IX 3 22 3' 11599 P22464 FBgn0000083 transposone 1000
D6WFK8 656174 ankyrin 2,3/unc44 3 23 inside
Q7KU95 FBgn0085445 transposone 1081
D6WFX1 657874 ral guanine nucleotide exchange factor 3 24 5' 64025 Q8MT78 FBgn0034158 transposone 888
D6WFX3 658031 galactose-1-phosphate uridylyltransferase 3 24 3' 3958 Q9VMA2 FBgn0031845 transposone 888
D6WDQ4 659233 Putative uncharacterized protein 3 25 5' 15051 Q8T0R9 FBgn0038809 transposone 1016
D6WDQ6 659376 coiled-coil domain containing 96 3 25 3' 9162 A1ZA72 FBgn0013988 transposone 1016
D6WF68 655042 glucose dehydrogenase 3 26 5' 25896 Q9VY00 FBgn0030598 transposone 1067
C3XZ92 655348 Mitogen-activated protein kinase kinase kinase kinase 2 3 26 3' 92876 Q8SYA1 FBgn0034421 transposone 1067
D6WE82 658463 Putative uncharacterized protein 3 27 inside
Q9VDK2 FBgn0038815 transposone 314
D6WHX6 658191 Putative uncharacterized protein 3 28 5' 173881 Q1RKQ9 FBgn0085382 transposone 826
D6WI58 658343 Cathepsin L 3 28 3' 82559 Q95029 FBgn0013770 transposone 826
D6WDJ9 656922 Putative uncharacterized protein 3 29 5' 173548 Q8IPJ1 FBgn0031859 transposone 1084
D6WDN0 657559 PRMT5 3 29 3' 383809 Q9U6Y9 FBgn0015925 transposone 1084
D6WGS3 656976 Putative uncharacterized protein 3 30 5' 37572 A0AMQ8 FBgn0034655 satelite 216 0,6
D6WGT0 100142515 calpain 3 3 30 3' 226707 Q11002 FBgn0008649 satelite 216 0,6
D6WDS8 660532 Muscle-specific protein 300 3 31 5' 378626 Q4ABG9 FBgn0260952 transposone 1060
D6WDT0 654860 Phosphatidylinositol-binding clathrin assembly protein 3 31 3' 7855 C1C3H4 FBgn0086372 transposone 1060
D6WHF2 664188 Nephrin 3 32 inside
Q9W4T9 FBgn0028369 transposone 666
D6WI96 100142620 Heat shock protein 70 3 33 inside
P11147 FBgn0001219 transposone 1058
D6WG02 654917 N-acetylglucosaminyltransferase vi 3 34 inside
Q9VUH4 FBgn0036446 transposone 1058
D6WYD1 656891 Putative uncharacterized protein 8 35 5' 385712 Q8SY79 FBgn0032249 satelite 625 1,7
Table 2, continued
26
Uniprot Entrez Gene name Chr Sat_seq. Position Distance, bp DM homolog FBgn Type Length copies
D6WYN3 654942 serine-type protease inhibitor 8 35 3' 58583 Q9VSC9 FBgn0035833 satelite 625 1,7
D6WYA1 657913 Copia protein (Gag-int-pol protein) 8 36 3' 262 B6V6Z8 ?? satelite 196 0,5
D6WYC9 656718 Cmp-n-acetylneuraminic acid synthase 8 37 inside
B5RJF3 FBgn0052220 transposone 831
D6WV42 656028 CG5080 8 38 inside
Q7K3E2 FBgn0031313 transposone 582
D6WYA0 100142507 Beaten path 8 39 5' 7165 Q94534 FBgn0013433 transposone 1181
D6WUX6 662235 Putative uncharacterized protein 8 40 inside
Q7KUK9 FBgn0036454 transposone 440
D6X0E1 654938 defective proboscis extension response 7 41 inside
Q9VFD9 FBgn0038282 satelite 722 2,0
D6WPX8 662021 Ribosome-releasing factor 2, mitochondrial 7 42 5' 17480 Q9VCX4 FBgn0051159 transposone 905
A2AX72 662058 Gustatory receptor 7 42 3' 1581 Q9VPT1 FBgn0041250 transposone 905
D6WTD1 661895 similar to chitinase 6 7 43 inside
Q9W2M7 FBgn0034580 satelite 1440 4,0
D6WPE6 100142073 voltage-gated potassium channel 7 44 inside
P17970 FBgn0003383 transposone 814
D2A2C6 663849 Putative uncharacterized protein 4 45 5' 9489 Q9V3S3 FBgn0013300 satelite 549 1,5
D2A2D1 663875 Putative uncharacterized protein 4 45 3' 10920 Q9W191 FBgn0034994 satelite 549 1,5
D2A2I0 657017 Putative uncharacterized protein 4 46 5' 5820 Q8SZ28 FBgn0033786 satelite 558 1,6
D2A2I1 657098 Ribonucleoside-diphosphate reductase 4 46 3' 7000 P48591 FBgn0012051 satelite 558 1,6
D1ZZG6 660983 Kinesin-like protein 4 47 inside
Q9VLW2 FBgn0031955 transposone 508
D2A2P8 100142595 PiggyBac transposable element 4 48 inside
Q9VHL1 FBgn0037633 transposone 377
D6WB65 655028 E74 2 49 5' 60525 P20105 FBgn0000567 satelite 770 2,1
D6WB73 654962 organic cation transporter 2 49 3' 2638 Q7K3M6 FBgn0034479 satelite 770 2,1
D6WBG8 659129 pre-mRNA-splicing helicase BRR2 2 50 3' 4811 Q9VUV9 FBgn0036548 satelite 728
D6WB14 658844 monophenolic amine tyramine 2 51 5' 7955 P22270 FBgn0004514 transposone 567
D6WB15 658769 Cuticular protein 47Ef 2 51 3' 16173 A1Z8H7 FBgn0033603 transposone 567
D6WB29 657778 Endoprotease FURIN 2 52 inside
P30432 FBgn0004598 transposone 1045
A8DIV5 657942 Nicotinic acetylcholine receptor subunit alpha11 2 53 5' 13645 P25162 FBgn0004118 transposone 1021
D6WB29 657778 Endoprotease FURIN 2 53 3' 4875 P30432 FBgn0004598 transposone 1021
D6X3I9 661787 Transcription initiation factor IIF 10 54 5' 10025 Q05913 FBgn0010282 satelite 870 2,4
D6X3J1 661827 Putative uncharacterized protein 10 54 3' 6607
satelite 870 2,4
D6X4P3 655389 Neutral alpha-glucosidase ab 10 55 inside
Q7KMM4 FBgn0027588 satelite 694 1,9
Table 2, continued
27
Uniprot Entrez Gene name Chr Sat_seq. Position Distance, bp DM homolog FBgn Type Length copies
D6X3H5 661246 Neurexin-4 10 56 5' 2234 Q94887 FBgn0013997 satelite 224 0,6
D6X3H7 661308 Succinate semialdehyde dehydrogenase 10 56 3' 14901 Q9VBP6 FBgn0039349 satelite 224 0,6
D6X4V6 655916 Tubby, putative 10 57 inside
Q9VB18 FBgn0039530 transposone 763
D6X3J6 662034 Putative uncharacterized protein 10 58 5' 1015 Q9VEJ9 FBgn0038511 satelite 564 1,6
D6X3J7 657069 cdc73 domain protein 10 58 3' 27239 Q9VHI1 FBgn0037657 satelite 564 1,6
D2A693 663231 lysine-specific demethylase 4B 6 59 inside
Q9V6L0 FBgn0053182 satelite 498 1,4
D2A490 659655 Facilitated trehalose transporter Tret1-2 homolog 6 60 inside
Q8MKK4 FBgn0033644 transposone 689
D2A6I4 659728 Putative uncharacterized protein 6 61 5' 116030 Q9W4G2 FBgn0260971 transposone 764
D2A6I6 659791 Putative uncharacterized protein 6 61 3' 4860 Q9VNB4 FBgn0037323 transposone 764
D2A3V0 657272 Fasciclin-3 6 62 5' 37286 P15278 FBgn0000636 satelite 281 0,8
D2A3V3 657421 LIM domain kinase 1 6 62 3' 21789 Q8IR79 FBgn0041203 satelite 281 0,8
D6W8F4 660322 Disco-related x 63 inside
Q9VXJ5 FBgn0042650 satelite 530 1,5
D6W8D3 659123 PlexA x 64 5' 1973 O96681 FBgn0025741 transposone 848
D6WGD2 659272 Aldose-1-epimerase x 64 3' 6472 Q9VRU1 FBgn0035679 transposone 848
B3MMG1 657652 Neural-cadherin 5 65 inside
O15943 FBgn0015609 satelite 273 0,8
D6WNN6 658579 Transient receptor potential-gamma protein 5 66 5' 2547 Q9VJJ7 FBgn0032593 transposone 894
A3RE80 658661 Cardioacceleratory peptide receptor 5 66 3' 27105 Q868T3 FBgn0039396 transposone 894
A1JUG2 661207 Ultraspiracle 5 67 inside
P20153 FBgn0003964 satelite 379 1,1
D6WNB3 656063 Y box protein 5 68 5' 14993 O46173 FBgn0022959 satelite 455 1,3
D6WNB6 656095 Peptide chain release factor 1 5 68 3' 350365 Q9VK20 FBgn0032486 satelite 455 1,3
Table 2, continued
Description: List of genes with gene identity number, gene name and chromosomal location. Distances between TCAST-like elements and genes,
positions of TCAST-like elements relative to genes (5’, 3’ or within introns), types of TCAST-like elements (satellite or transposon-like type), their
total length in bp and copy number of satellite repeats within an array are shown
28
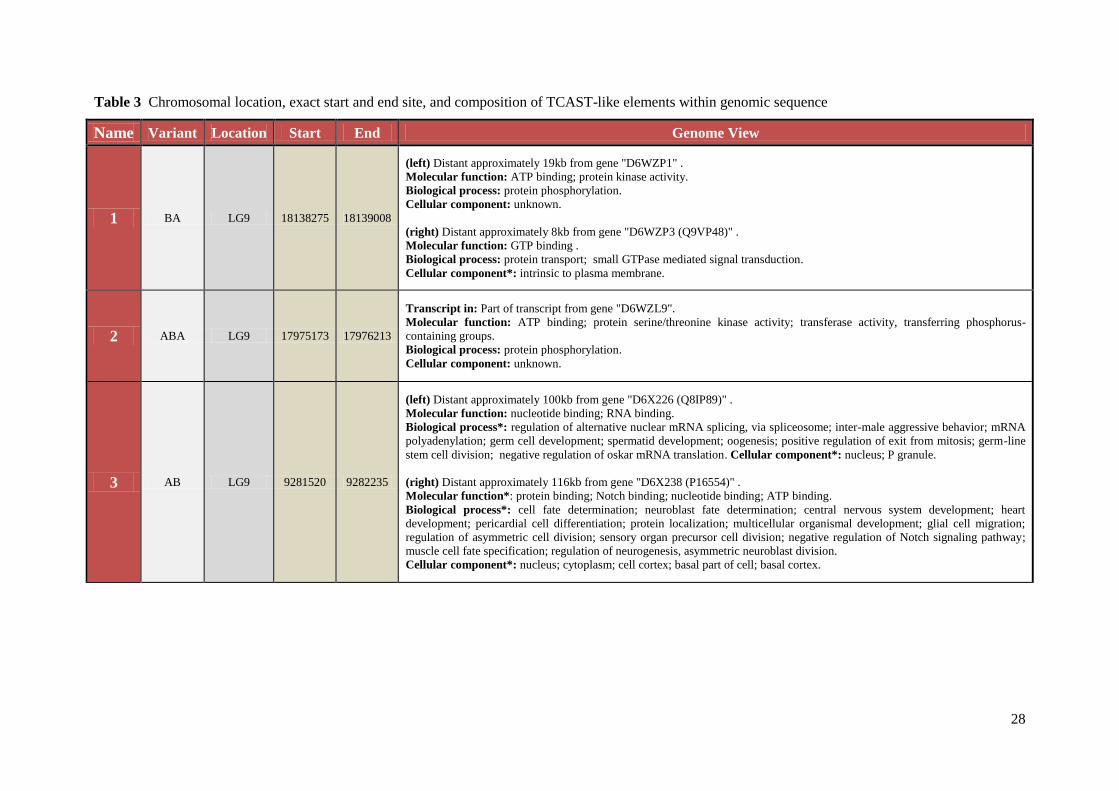
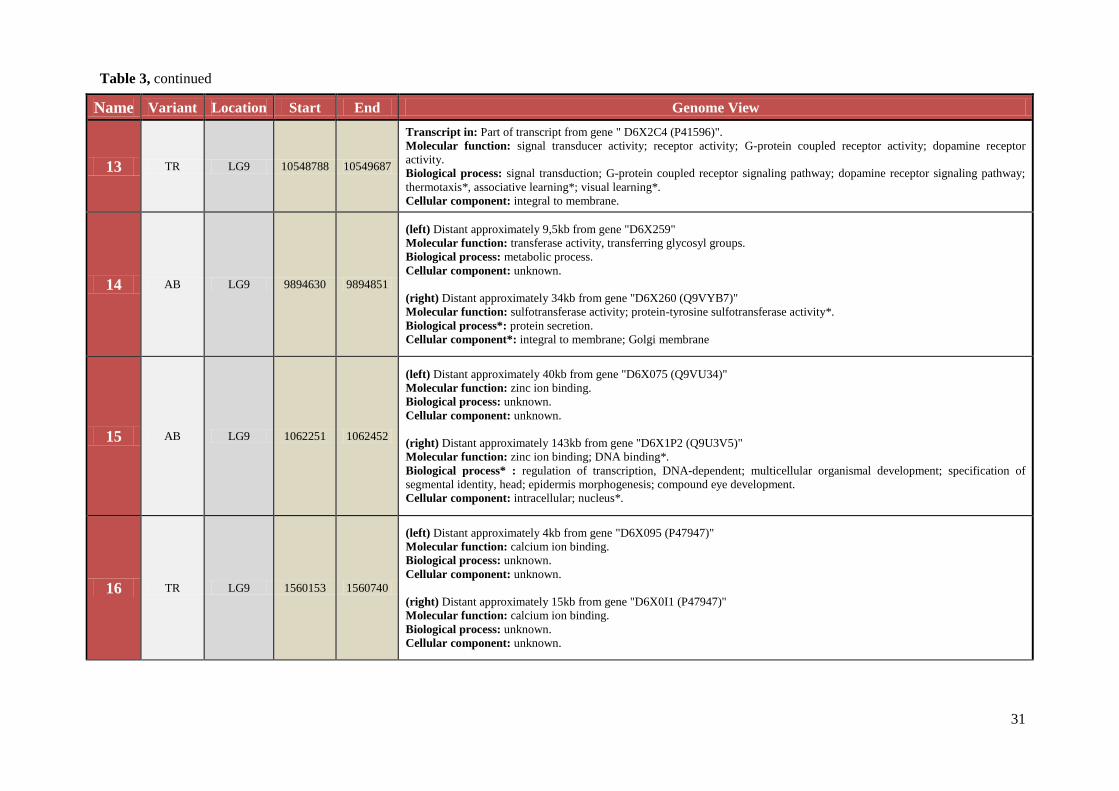
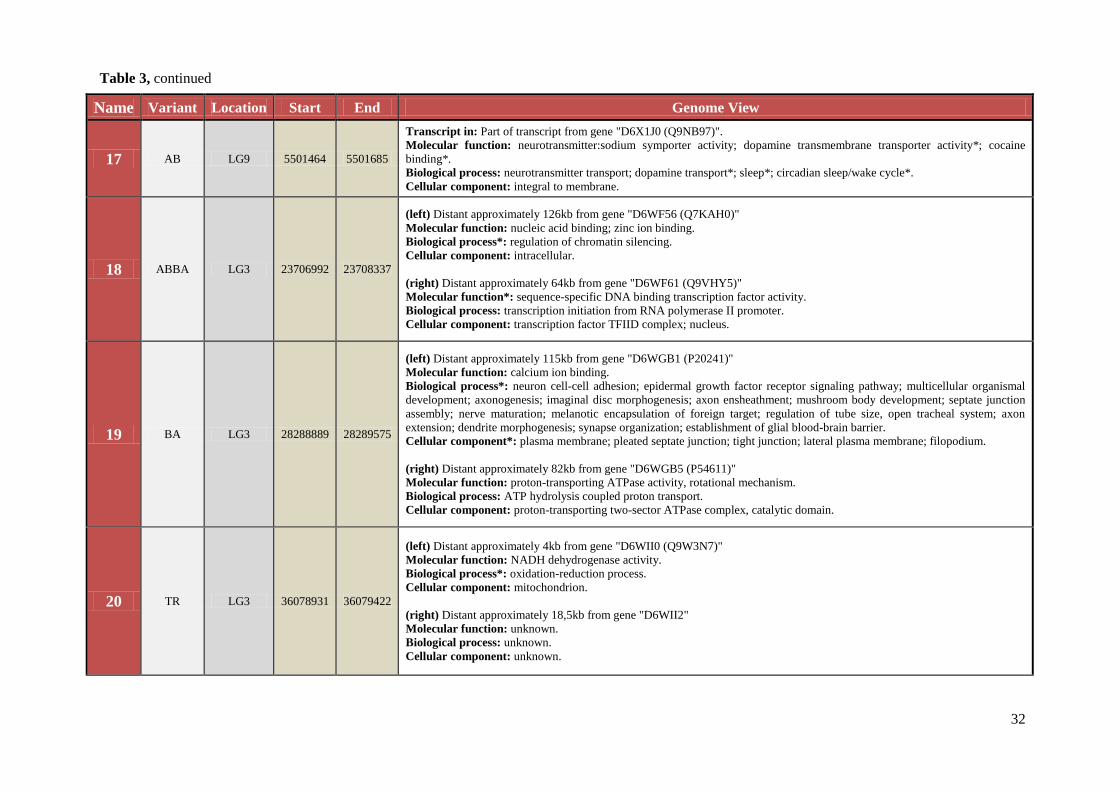
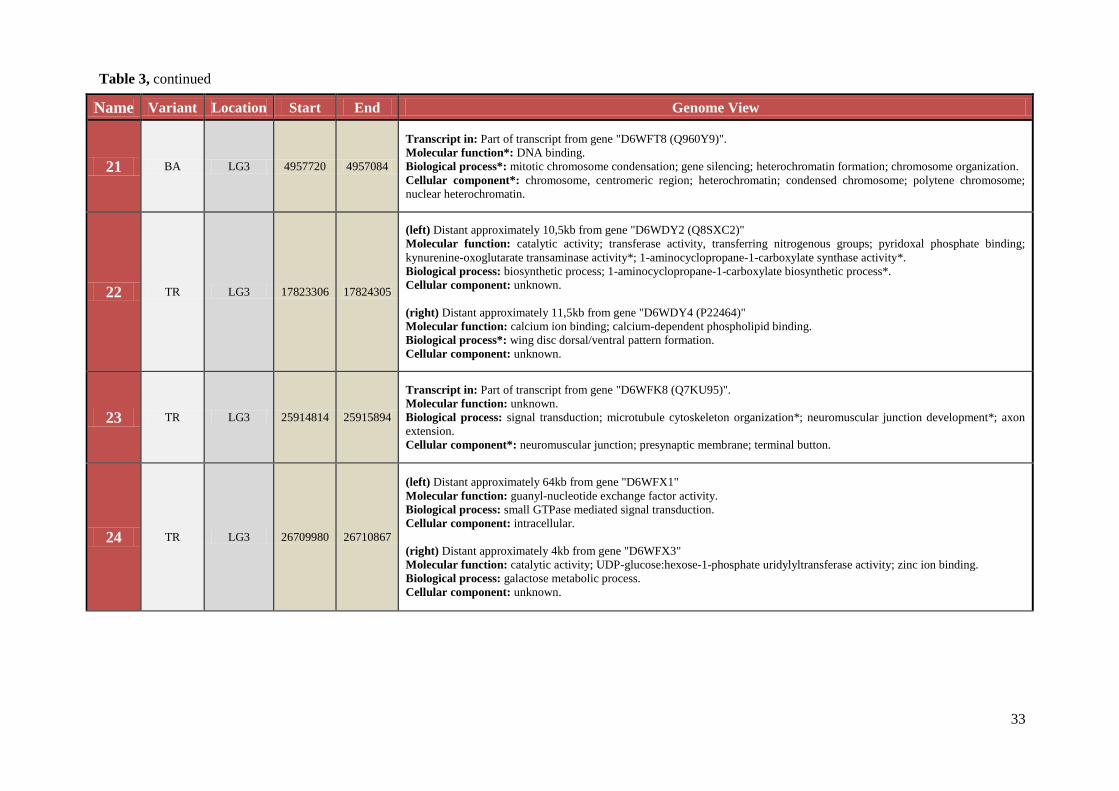
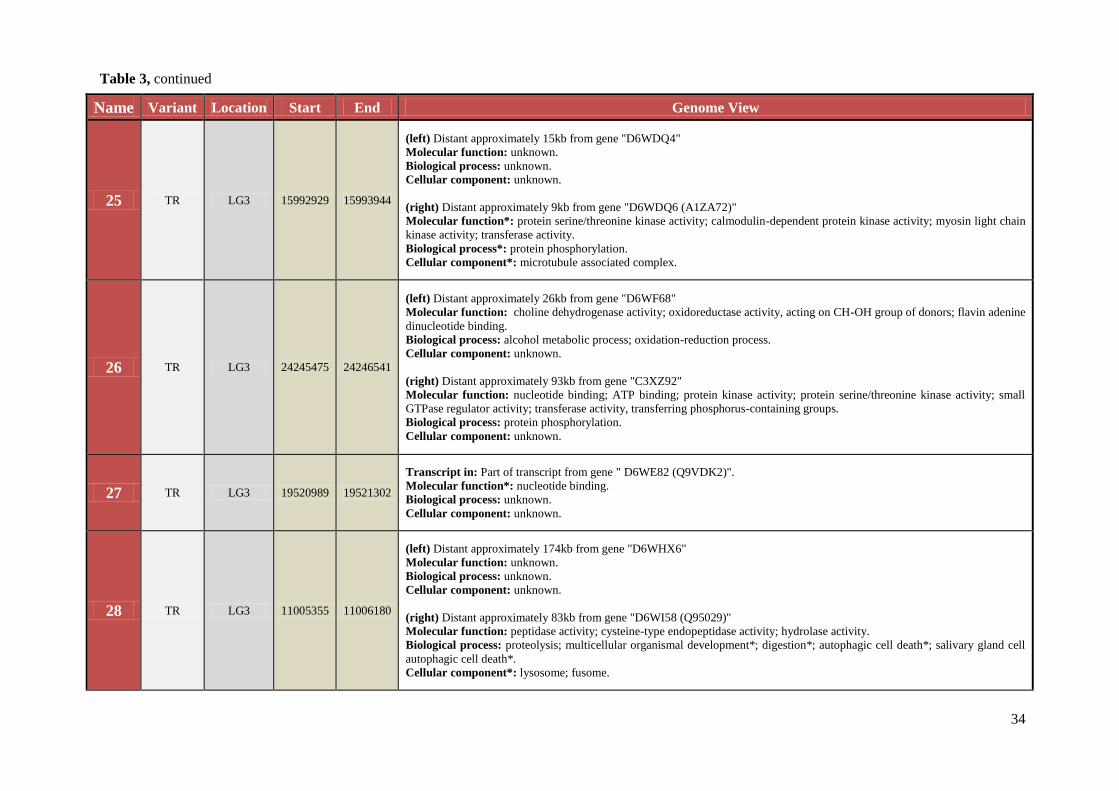
Table 3 Chromosomal location, exact start and end site, and composition of TCAST-like elements within genomic sequence
Name Variant Location Start End Genome View
1 BA LG9 18138275 18139008
(left) Distant approximately 19kb from gene "D6WZP1" .
Molecular function: ATP binding; protein kinase activity.
Biological process: protein phosphorylation.
Cellular component: unknown.
(right) Distant approximately 8kb from gene "D6WZP3 (Q9VP48)" .
Molecular function: GTP binding .
Biological process: protein transport; small GTPase mediated signal transduction.
Cellular component*: intrinsic to plasma membrane.
2 ABA LG9 17975173 17976213
Transcript in: Part of transcript from gene "D6WZL9".
Molecular function: ATP binding; protein serine/threonine kinase activity; transferase activity, transferring phosphorus-
containing groups.
Biological process: protein phosphorylation.
Cellular component: unknown.
3 AB LG9 9281520 9282235
(left) Distant approximately 100kb from gene "D6X226 (Q8IP89)" .
Molecular function: nucleotide binding; RNA binding.
Biological process*: regulation of alternative nuclear mRNA splicing, via spliceosome; inter-male aggressive behavior; mRNA
polyadenylation; germ cell development; spermatid development; oogenesis; positive regulation of exit from mitosis; germ-line
stem cell division; negative regulation of oskar mRNA translation. Cellular component*: nucleus; P granule.
(right) Distant approximately 116kb from gene "D6X238 (P16554)" .
Molecular function*: protein binding; Notch binding; nucleotide binding; ATP binding.
Biological process*: cell fate determination; neuroblast fate determination; central nervous system development; heart
development; pericardial cell differentiation; protein localization; multicellular organismal development; glial cell migration;
regulation of asymmetric cell division; sensory organ precursor cell division; negative regulation of Notch signaling pathway;
muscle cell fate specification; regulation of neurogenesis, asymmetric neuroblast division.
Cellular component*: nucleus; cytoplasm; cell cortex; basal part of cell; basal cortex.
29
Name Variant Location Start End Genome View
4 AB LG9 10699909 10700425
(left) Distant approximately 1,5kb from gene "hypotetical protein" .
Molecular function: unknown.
Biological process: unknown .
Cellular component: unknown.
(right) Distant approximately 6,5kb from gene "D6X2D0".
Molecular function: oxidoreductase activity; nucleotide binding.
Biological process:oxidation-reduction process .
Cellular component: unknown.
5 AgBA LG9 4568301 4569358
(left) Distant approximately 404kb from gene "D6X1E7 (Q9VWR5)" .
Molecular function: monooxygenase activity; iron ion binding; electron carrier activity; oxidoreductase activity, acting on
paired donors, with incorporation or reduction of molecular oxygen; heme binding. Biological process: oxidation-reduction
process.
Cellular component*: microsome; endoplasmic reticulum membrane.
(right) Distant approximately 10kb from gene "D6X2U7".
Molecular function: unknown.
Biological process: unknown.
Cellular component: integral to membrane.
6 B LG9 10553279 10553582
Transcript in: Part of transcript from gene "D6X2C4".
Molecular function: signal transducer activity; dopamine receptor activity; G-protein coupled receptor activity.
Biological process: signal transduction; G-protein coupled receptor protein signaling pathway; dopamine receptor signaling
pathway.
Cellular component: integral to membrane.
7 B LG9 4587153 4587546
(left) Distant approximately 7kb from gene "D6X2U7".
Molecular function: unknown.
Biological process: unknown.
Cellular component: integral to membrane.
(right) Distant approximately 50kb from gene "D6X366".
Molecular function: unknown.
Biological process: unknown.
Cellular component: integral to membrane.
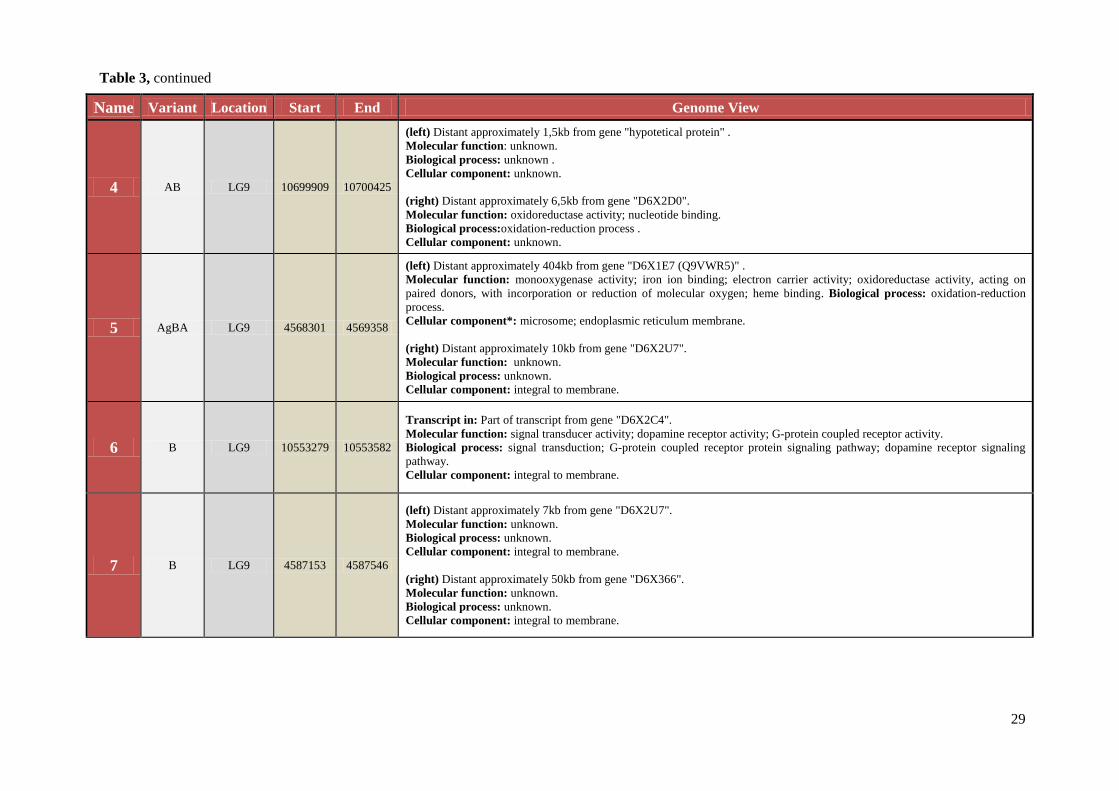
Table 3, continued
30
Name Variant Location Start End Genome View
8 B LG9 19746866 19747078
(left) Distant approximately 57kb from gene "D6X0D7".
Molecular function: nucleotide binding; ATP binding; protein tyrosine kinase activity; calcium ion binding.
Biological process: protein phosphorylation; homophilic cell adhesion.
Cellular component: membrane.
(right) Distant approximately 63kb from gene "D6X0E1 (Q9VFD9)".
Molecular function: unknown.
Biological process*: behavioral response to ethanol.
Cellular component: unknown.
9 TR LG9 11855262 11856368
Transcript in: Part of transcript from gene "D6X2H8".
Molecular function: metalloendopeptidase activity; zinc ion binding.
Biological process: proteolysis.
Cellular component: unknown.
10 TR LG9 13938275 13939359
(left) Distant approximately 48kb from gene "D6X2U7".
Molecular function: unknown.
Biological process: unknown.
Cellular component: integral to membrane.
(right) Distant approximately 68kb from gene "D6X2V3 (Q9VDB7)".
Molecular function: unknown.
Biological process*: phagocytosis, engulfment.
Cellular component: unknown.
11 TR LG9 9763147 9764208
Transcript in: Part of transcript from gene "D6X244 (Q0KID3)".
Molecular function: ATP binding; protein serine/threonine kinase activity; transferase activity, transferring phosphorus-
containing groups.
Biological process*: protein phosphorylation; actin filament organization; regulation of cell shape.
Cellular component: unknown.
12 BA LG9 15894092 15894383
Transcript in: Part of transcript from gene "D6X374".
Molecular function: unknown.
Biological process: unknown.
Cellular component: unknown.
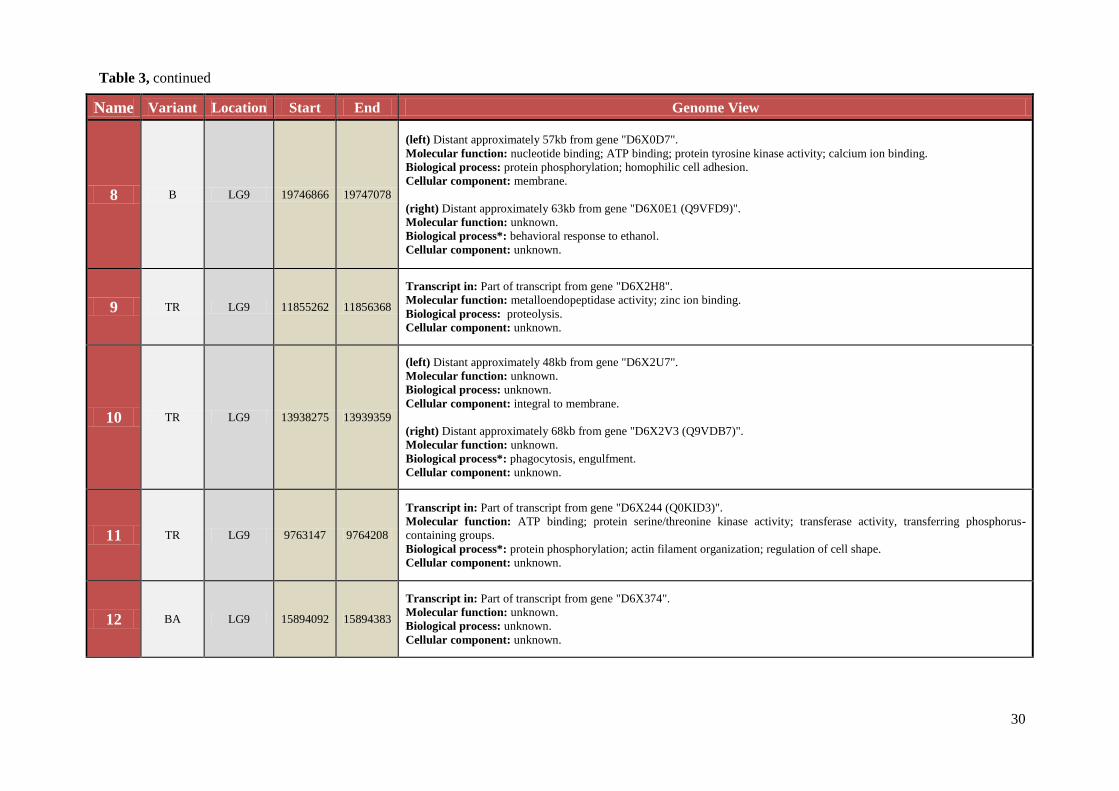
Table 3, continued
31
Name Variant Location Start End Genome View
13 TR LG9 10548788 10549687
Transcript in: Part of transcript from gene " D6X2C4 (P41596)".
Molecular function: signal transducer activity; receptor activity; G-protein coupled receptor activity; dopamine receptor
activity.
Biological process: signal transduction; G-protein coupled receptor signaling pathway; dopamine receptor signaling pathway;
thermotaxis*, associative learning*; visual learning*.
Cellular component: integral to membrane.
14 AB LG9 9894630 9894851
(left) Distant approximately 9,5kb from gene "D6X259"
Molecular function: transferase activity, transferring glycosyl groups.
Biological process: metabolic process.
Cellular component: unknown.
(right) Distant approximately 34kb from gene "D6X260 (Q9VYB7)"
Molecular function: sulfotransferase activity; protein-tyrosine sulfotransferase activity*.
Biological process*: protein secretion.
Cellular component*: integral to membrane; Golgi membrane
15 AB LG9 1062251 1062452
(left) Distant approximately 40kb from gene "D6X075 (Q9VU34)"
Molecular function: zinc ion binding.
Biological process: unknown.
Cellular component: unknown.
(right) Distant approximately 143kb from gene "D6X1P2 (Q9U3V5)"
Molecular function: zinc ion binding; DNA binding*.
Biological process* : regulation of transcription, DNA-dependent; multicellular organismal development; specification of
segmental identity, head; epidermis morphogenesis; compound eye development.
Cellular component: intracellular; nucleus*.
16 TR LG9 1560153 1560740
(left) Distant approximately 4kb from gene "D6X095 (P47947)"
Molecular function: calcium ion binding.
Biological process: unknown.
Cellular component: unknown.
(right) Distant approximately 15kb from gene "D6X0I1 (P47947)"
Molecular function: calcium ion binding.
Biological process: unknown.
Cellular component: unknown.
Table 3, continued
32
Name Variant Location Start End Genome View
17 AB LG9 5501464 5501685
Transcript in: Part of transcript from gene "D6X1J0 (Q9NB97)".
Molecular function: neurotransmitter:sodium symporter activity; dopamine transmembrane transporter activity*; cocaine
binding*.
Biological process: neurotransmitter transport; dopamine transport*; sleep*; circadian sleep/wake cycle*.
Cellular component: integral to membrane.
18 ABBA LG3 23706992 23708337
(left) Distant approximately 126kb from gene "D6WF56 (Q7KAH0)"
Molecular function: nucleic acid binding; zinc ion binding.
Biological process*: regulation of chromatin silencing.
Cellular component: intracellular.
(right) Distant approximately 64kb from gene "D6WF61 (Q9VHY5)"
Molecular function*: sequence-specific DNA binding transcription factor activity.
Biological process: transcription initiation from RNA polymerase II promoter.
Cellular component: transcription factor TFIID complex; nucleus.
19 BA LG3 28288889 28289575
(left) Distant approximately 115kb from gene "D6WGB1 (P20241)"
Molecular function: calcium ion binding.
Biological process*: neuron cell-cell adhesion; epidermal growth factor receptor signaling pathway; multicellular organismal
development; axonogenesis; imaginal disc morphogenesis; axon ensheathment; mushroom body development; septate junction
assembly; nerve maturation; melanotic encapsulation of foreign target; regulation of tube size, open tracheal system; axon
extension; dendrite morphogenesis; synapse organization; establishment of glial blood-brain barrier.
Cellular component*: plasma membrane; pleated septate junction; tight junction; lateral plasma membrane; filopodium.
(right) Distant approximately 82kb from gene "D6WGB5 (P54611)"
Molecular function: proton-transporting ATPase activity, rotational mechanism.
Biological process: ATP hydrolysis coupled proton transport.
Cellular component: proton-transporting two-sector ATPase complex, catalytic domain.
20 TR LG3 36078931 36079422
(left) Distant approximately 4kb from gene "D6WII0 (Q9W3N7)"
Molecular function: NADH dehydrogenase activity.
Biological process*: oxidation-reduction process.
Cellular component: mitochondrion.
(right) Distant approximately 18,5kb from gene "D6WII2"
Molecular function: unknown.
Biological process: unknown.
Cellular component: unknown.
Table 3, continued
33
Name Variant Location Start End Genome View
21 BA LG3 4957720 4957084
Transcript in: Part of transcript from gene "D6WFT8 (Q960Y9)".
Molecular function*: DNA binding.
Biological process*: mitotic chromosome condensation; gene silencing; heterochromatin formation; chromosome organization.
Cellular component*: chromosome, centromeric region; heterochromatin; condensed chromosome; polytene chromosome;
nuclear heterochromatin.
22 TR LG3 17823306 17824305
(left) Distant approximately 10,5kb from gene "D6WDY2 (Q8SXC2)"
Molecular function: catalytic activity; transferase activity, transferring nitrogenous groups; pyridoxal phosphate binding;
kynurenine-oxoglutarate transaminase activity*; 1-aminocyclopropane-1-carboxylate synthase activity*.
Biological process: biosynthetic process; 1-aminocyclopropane-1-carboxylate biosynthetic process*.
Cellular component: unknown.
(right) Distant approximately 11,5kb from gene "D6WDY4 (P22464)"
Molecular function: calcium ion binding; calcium-dependent phospholipid binding.
Biological process*: wing disc dorsal/ventral pattern formation.
Cellular component: unknown.
23 TR LG3 25914814 25915894
Transcript in: Part of transcript from gene "D6WFK8 (Q7KU95)".
Molecular function: unknown.
Biological process: signal transduction; microtubule cytoskeleton organization*; neuromuscular junction development*; axon
extension.
Cellular component*: neuromuscular junction; presynaptic membrane; terminal button.
24 TR LG3 26709980 26710867
(left) Distant approximately 64kb from gene "D6WFX1"
Molecular function: guanyl-nucleotide exchange factor activity.
Biological process: small GTPase mediated signal transduction.
Cellular component: intracellular.
(right) Distant approximately 4kb from gene "D6WFX3"
Molecular function: catalytic activity; UDP-glucose:hexose-1-phosphate uridylyltransferase activity; zinc ion binding.
Biological process: galactose metabolic process.
Cellular component: unknown.
Table 3, continued
34
Name Variant Location Start End Genome View
25 TR LG3 15992929 15993944
(left) Distant approximately 15kb from gene "D6WDQ4"
Molecular function: unknown.
Biological process: unknown.
Cellular component: unknown.
(right) Distant approximately 9kb from gene "D6WDQ6 (A1ZA72)"
Molecular function*: protein serine/threonine kinase activity; calmodulin-dependent protein kinase activity; myosin light chain
kinase activity; transferase activity.
Biological process*: protein phosphorylation.
Cellular component*: microtubule associated complex.
26 TR LG3 24245475 24246541
(left) Distant approximately 26kb from gene "D6WF68"
Molecular function: choline dehydrogenase activity; oxidoreductase activity, acting on CH-OH group of donors; flavin adenine
dinucleotide binding.
Biological process: alcohol metabolic process; oxidation-reduction process.
Cellular component: unknown.
(right) Distant approximately 93kb from gene "C3XZ92"
Molecular function: nucleotide binding; ATP binding; protein kinase activity; protein serine/threonine kinase activity; small
GTPase regulator activity; transferase activity, transferring phosphorus-containing groups.
Biological process: protein phosphorylation.
Cellular component: unknown.
27 TR LG3 19520989 19521302
Transcript in: Part of transcript from gene " D6WE82 (Q9VDK2)".
Molecular function*: nucleotide binding.
Biological process: unknown.
Cellular component: unknown.
28 TR LG3 11005355 11006180
(left) Distant approximately 174kb from gene "D6WHX6"
Molecular function: unknown.
Biological process: unknown.
Cellular component: unknown.
(right) Distant approximately 83kb from gene "D6WI58 (Q95029)"
Molecular function: peptidase activity; cysteine-type endopeptidase activity; hydrolase activity.
Biological process: proteolysis; multicellular organismal development*; digestion*; autophagic cell death*; salivary gland cell
autophagic cell death*.
Cellular component*: lysosome; fusome.
Table 3, continued
35
Name Variant Location Start End Genome View
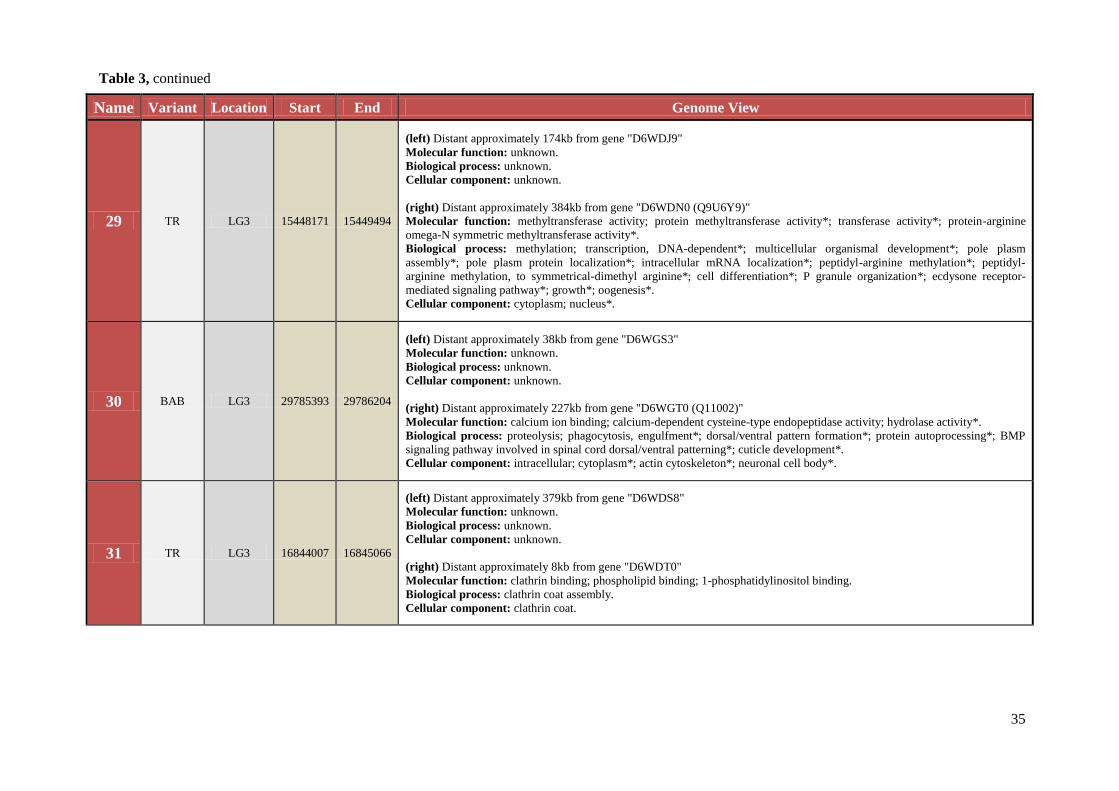
29 TR LG3 15448171 15449494
(left) Distant approximately 174kb from gene "D6WDJ9"
Molecular function: unknown.
Biological process: unknown.
Cellular component: unknown.
(right) Distant approximately 384kb from gene "D6WDN0 (Q9U6Y9)"
Molecular function: methyltransferase activity; protein methyltransferase activity*; transferase activity*; protein-arginine
omega-N symmetric methyltransferase activity*.
Biological process: methylation; transcription, DNA-dependent*; multicellular organismal development*; pole plasm
assembly*; pole plasm protein localization*; intracellular mRNA localization*; peptidyl-arginine methylation*; peptidyl-
arginine methylation, to symmetrical-dimethyl arginine*; cell differentiation*; P granule organization*; ecdysone receptor-
mediated signaling pathway*; growth*; oogenesis*.
Cellular component: cytoplasm; nucleus*.
30 BAB LG3 29785393 29786204
(left) Distant approximately 38kb from gene "D6WGS3"
Molecular function: unknown.
Biological process: unknown.
Cellular component: unknown.
(right) Distant approximately 227kb from gene "D6WGT0 (Q11002)"
Molecular function: calcium ion binding; calcium-dependent cysteine-type endopeptidase activity; hydrolase activity*.
Biological process: proteolysis; phagocytosis, engulfment*; dorsal/ventral pattern formation*; protein autoprocessing*; BMP
signaling pathway involved in spinal cord dorsal/ventral patterning*; cuticle development*.
Cellular component: intracellular; cytoplasm*; actin cytoskeleton*; neuronal cell body*.
31 TR LG3 16844007 16845066
(left) Distant approximately 379kb from gene "D6WDS8"
Molecular function: unknown.
Biological process: unknown.
Cellular component: unknown.
(right) Distant approximately 8kb from gene "D6WDT0"
Molecular function: clathrin binding; phospholipid binding; 1-phosphatidylinositol binding.
Biological process: clathrin coat assembly.
Cellular component: clathrin coat.
Table 3, continued
36
Name Variant Location Start End Genome View
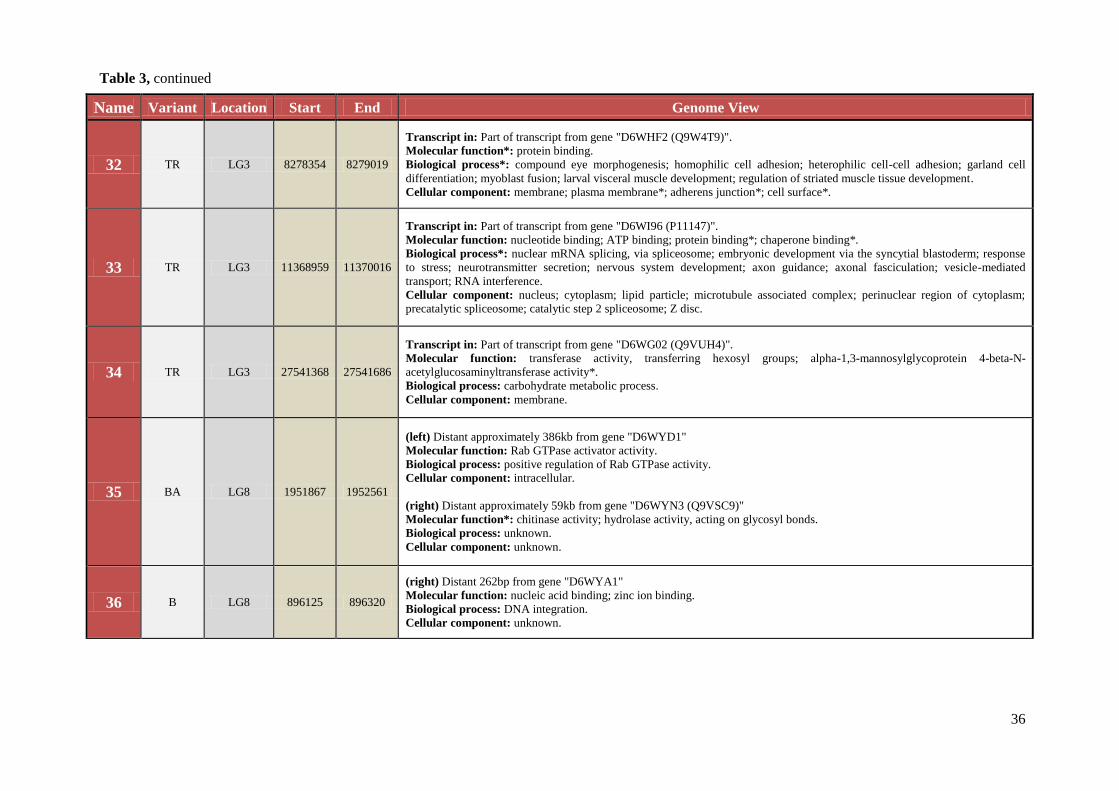
32 TR LG3 8278354 8279019
Transcript in: Part of transcript from gene "D6WHF2 (Q9W4T9)".
Molecular function*: protein binding.
Biological process*: compound eye morphogenesis; homophilic cell adhesion; heterophilic cell-cell adhesion; garland cell
differentiation; myoblast fusion; larval visceral muscle development; regulation of striated muscle tissue development.
Cellular component: membrane; plasma membrane*; adherens junction*; cell surface*.
33 TR LG3 11368959 11370016
Transcript in: Part of transcript from gene "D6WI96 (P11147)".
Molecular function: nucleotide binding; ATP binding; protein binding*; chaperone binding*.
Biological process*: nuclear mRNA splicing, via spliceosome; embryonic development via the syncytial blastoderm; response
to stress; neurotransmitter secretion; nervous system development; axon guidance; axonal fasciculation; vesicle-mediated
transport; RNA interference.
Cellular component: nucleus; cytoplasm; lipid particle; microtubule associated complex; perinuclear region of cytoplasm;
precatalytic spliceosome; catalytic step 2 spliceosome; Z disc.
34 TR LG3 27541368 27541686
Transcript in: Part of transcript from gene "D6WG02 (Q9VUH4)".
Molecular function: transferase activity, transferring hexosyl groups; alpha-1,3-mannosylglycoprotein 4-beta-N-
acetylglucosaminyltransferase activity*.
Biological process: carbohydrate metabolic process.
Cellular component: membrane.
35 BA LG8 1951867 1952561
(left) Distant approximately 386kb from gene "D6WYD1"
Molecular function: Rab GTPase activator activity.
Biological process: positive regulation of Rab GTPase activity.
Cellular component: intracellular.
(right) Distant approximately 59kb from gene "D6WYN3 (Q9VSC9)"
Molecular function*: chitinase activity; hydrolase activity, acting on glycosyl bonds.
Biological process: unknown.
Cellular component: unknown.
36 B LG8 896125 896320
(right) Distant 262bp from gene "D6WYA1"
Molecular function: nucleic acid binding; zinc ion binding.
Biological process: DNA integration.
Cellular component: unknown.
Table 3, continued

37
Name Variant Location Start End Genome View
37 TR LG8 1528414 1529244
Transcript in: Part of transcript from gene "D6WYC9".
Molecular function: unknown.
Biological process: lipopolysaccharide biosynthetic process.
Cellular component: unknown.
38 TR LG8 5308401 5308982
Transcript in: Part of transcript from gene "D6WV42".
Molecular function: unknown.
Biological process: unknown.
Cellular component: unknown.
39 TR LG8 774647 775827
(left) Distant approximately 7kb from gene "D6WYA0 (Q94534)"
Molecular function: unknown.
Biological process*: axon guidance; defasciculation of motor neuron axon; axon choice point recognition; Bolwig's organ
morphogenesis.
Cellular component: membrane.
40 TR LG8 3944782 3945221
Transcript in: Part of transcript from gene "D6WUX6".
Molecular function: unknown.
Biological process: unknown.
Cellular component: unknown.
41 ABA LG7 2265910 2266834
Transcript in: Part of transcript from gene "D6X0E1 (Q9VFD9)".
Molecular function: unknown.
Biological process*: behavioral response to ethanol.
Cellular component: unknown.
42 TR LG7 12042178 12043082
(left) Distant approximately 17kb from gene "D6WPX8 (Q9VCX4)"
Molecular function: nucleotide binding; GTP binding; GTPase activity.
Biological process: GTP catabolic process; mitochondrial translation*; ribosome disassembly*.
Cellular component*: mitochondrion.
(right) Distant approximately 1,5kb from gene "A2AX72 (Q9VPT1)"
Molecular function: signal transducer activity; receptor activity; G-protein coupled receptor activity; taste receptor activity*.
Biological process: signal transduction; G-protein coupled receptor signaling pathway; sensory perception of taste; behavior*;
detection of carbon dioxide*; sensory perception of smell*; response to carbon dioxide*; response to stimulus*; detection of
chemical stimulus involved in sensory perception of taste*.
Cellular component: membrane; integral to membrane; plasma membrane; dendrite*; neuronal cell body*.
Table 3, continued
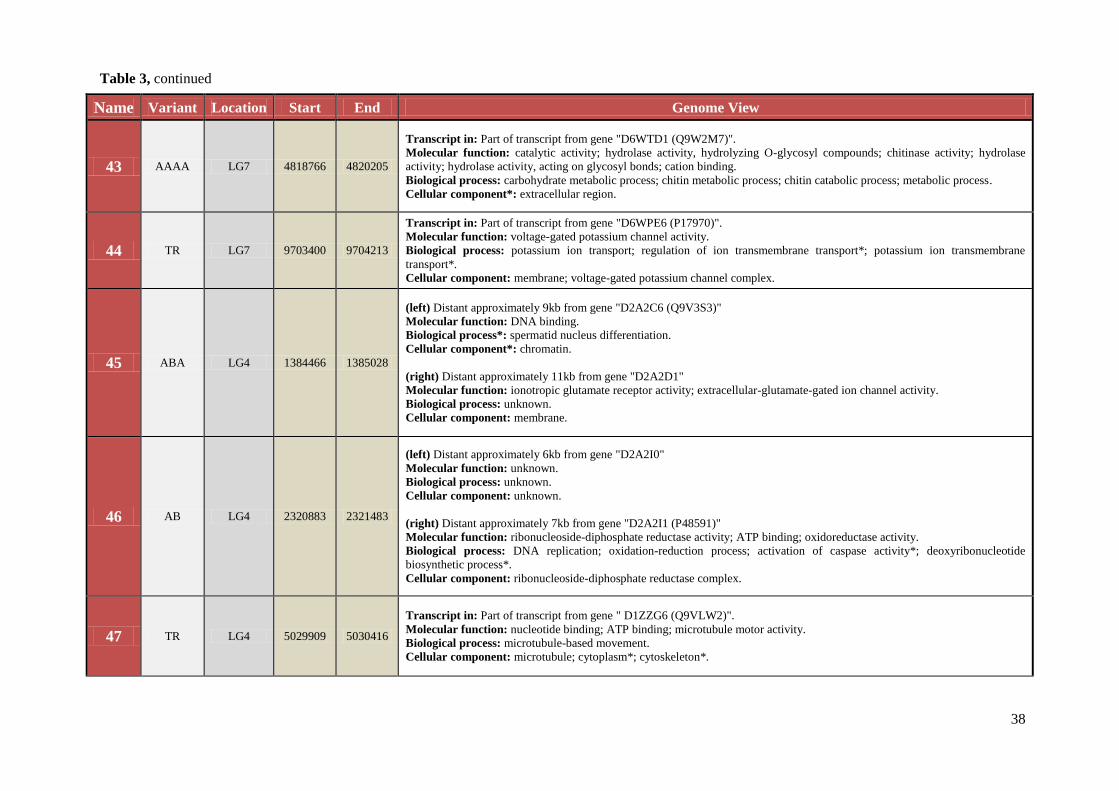
38
Name Variant Location Start End Genome View
43 AAAA LG7 4818766 4820205
Transcript in: Part of transcript from gene "D6WTD1 (Q9W2M7)".
Molecular function: catalytic activity; hydrolase activity, hydrolyzing O-glycosyl compounds; chitinase activity; hydrolase
activity; hydrolase activity, acting on glycosyl bonds; cation binding.
Biological process: carbohydrate metabolic process; chitin metabolic process; chitin catabolic process; metabolic process.
Cellular component*: extracellular region.
44 TR LG7 9703400 9704213
Transcript in: Part of transcript from gene "D6WPE6 (P17970)".
Molecular function: voltage-gated potassium channel activity.
Biological process: potassium ion transport; regulation of ion transmembrane transport*; potassium ion transmembrane
transport*.
Cellular component: membrane; voltage-gated potassium channel complex.
45 ABA LG4 1384466 1385028
(left) Distant approximately 9kb from gene "D2A2C6 (Q9V3S3)"
Molecular function: DNA binding.
Biological process*: spermatid nucleus differentiation.
Cellular component*: chromatin.
(right) Distant approximately 11kb from gene "D2A2D1"
Molecular function: ionotropic glutamate receptor activity; extracellular-glutamate-gated ion channel activity.
Biological process: unknown.
Cellular component: membrane.
46 AB LG4 2320883 2321483
(left) Distant approximately 6kb from gene "D2A2I0"
Molecular function: unknown.
Biological process: unknown.
Cellular component: unknown.
(right) Distant approximately 7kb from gene "D2A2I1 (P48591)"
Molecular function: ribonucleoside-diphosphate reductase activity; ATP binding; oxidoreductase activity.
Biological process: DNA replication; oxidation-reduction process; activation of caspase activity*; deoxyribonucleotide
biosynthetic process*.
Cellular component: ribonucleoside-diphosphate reductase complex.
47 TR LG4 5029909 5030416
Transcript in: Part of transcript from gene " D1ZZG6 (Q9VLW2)".
Molecular function: nucleotide binding; ATP binding; microtubule motor activity.
Biological process: microtubule-based movement.
Cellular component: microtubule; cytoplasm*; cytoskeleton*.
Table 3, continued
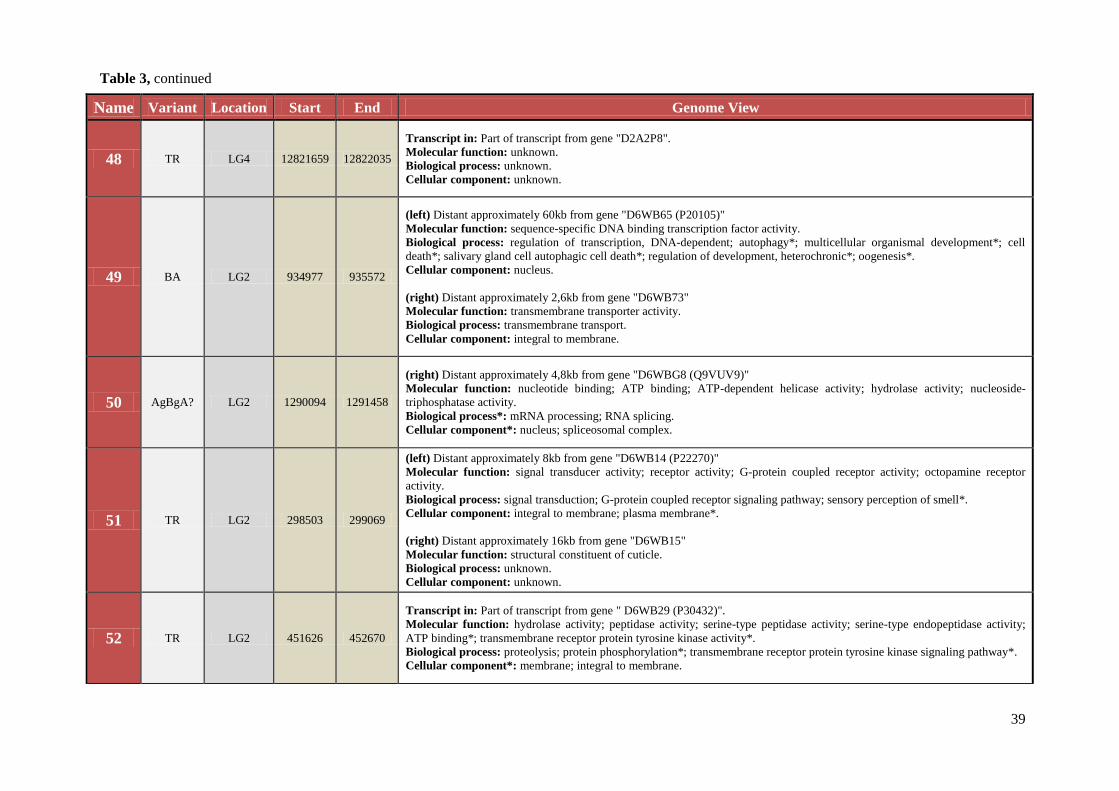
39
Name Variant Location Start End Genome View
48 TR LG4 12821659 12822035
Transcript in: Part of transcript from gene "D2A2P8".
Molecular function: unknown.
Biological process: unknown.
Cellular component: unknown.
49 BA LG2 934977 935572
(left) Distant approximately 60kb from gene "D6WB65 (P20105)"
Molecular function: sequence-specific DNA binding transcription factor activity.
Biological process: regulation of transcription, DNA-dependent; autophagy*; multicellular organismal development*; cell
death*; salivary gland cell autophagic cell death*; regulation of development, heterochronic*; oogenesis*.
Cellular component: nucleus.
(right) Distant approximately 2,6kb from gene "D6WB73"
Molecular function: transmembrane transporter activity.
Biological process: transmembrane transport.
Cellular component: integral to membrane.
50 AgBgA? LG2 1290094 1291458
(right) Distant approximately 4,8kb from gene "D6WBG8 (Q9VUV9)"
Molecular function: nucleotide binding; ATP binding; ATP-dependent helicase activity; hydrolase activity; nucleoside-
triphosphatase activity.
Biological process*: mRNA processing; RNA splicing.
Cellular component*: nucleus; spliceosomal complex.
51 TR LG2 298503 299069
(left) Distant approximately 8kb from gene "D6WB14 (P22270)"
Molecular function: signal transducer activity; receptor activity; G-protein coupled receptor activity; octopamine receptor
activity.
Biological process: signal transduction; G-protein coupled receptor signaling pathway; sensory perception of smell*.
Cellular component: integral to membrane; plasma membrane*.
(right) Distant approximately 16kb from gene "D6WB15"
Molecular function: structural constituent of cuticle.
Biological process: unknown.
Cellular component: unknown.
52 TR LG2 451626 452670
Transcript in: Part of transcript from gene " D6WB29 (P30432)".
Molecular function: hydrolase activity; peptidase activity; serine-type peptidase activity; serine-type endopeptidase activity;
ATP binding*; transmembrane receptor protein tyrosine kinase activity*.
Biological process: proteolysis; protein phosphorylation*; transmembrane receptor protein tyrosine kinase signaling pathway*.
Cellular component*: membrane; integral to membrane.
Table 3, continued
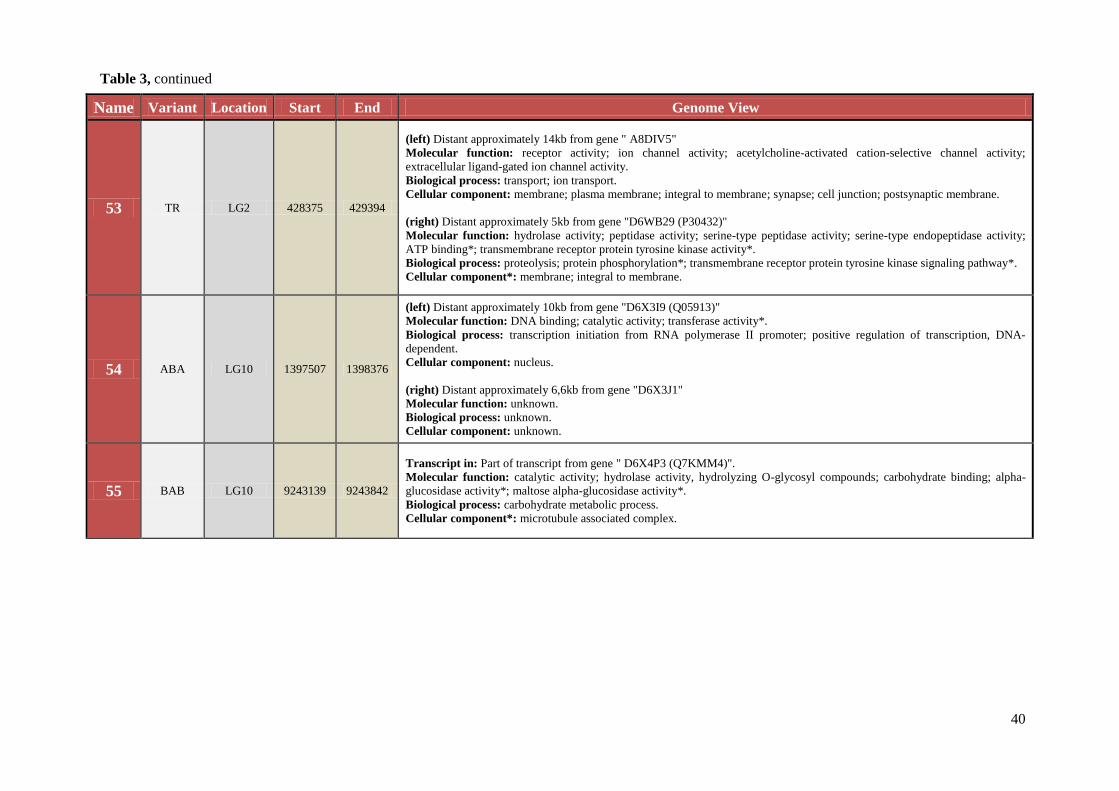
40
Name Variant Location Start End Genome View
53 TR LG2 428375 429394
(left) Distant approximately 14kb from gene " A8DIV5"
Molecular function: receptor activity; ion channel activity; acetylcholine-activated cation-selective channel activity;
extracellular ligand-gated ion channel activity.
Biological process: transport; ion transport.
Cellular component: membrane; plasma membrane; integral to membrane; synapse; cell junction; postsynaptic membrane.
(right) Distant approximately 5kb from gene "D6WB29 (P30432)"
Molecular function: hydrolase activity; peptidase activity; serine-type peptidase activity; serine-type endopeptidase activity;
ATP binding*; transmembrane receptor protein tyrosine kinase activity*.
Biological process: proteolysis; protein phosphorylation*; transmembrane receptor protein tyrosine kinase signaling pathway*.
Cellular component*: membrane; integral to membrane.
54 ABA LG10 1397507 1398376
(left) Distant approximately 10kb from gene "D6X3I9 (Q05913)"
Molecular function: DNA binding; catalytic activity; transferase activity*.
Biological process: transcription initiation from RNA polymerase II promoter; positive regulation of transcription, DNA-
dependent.
Cellular component: nucleus.
(right) Distant approximately 6,6kb from gene "D6X3J1"
Molecular function: unknown.
Biological process: unknown.
Cellular component: unknown.
55 BAB LG10 9243139 9243842
Transcript in: Part of transcript from gene " D6X4P3 (Q7KMM4)".
Molecular function: catalytic activity; hydrolase activity, hydrolyzing O-glycosyl compounds; carbohydrate binding; alpha-
glucosidase activity*; maltose alpha-glucosidase activity*.
Biological process: carbohydrate metabolic process.
Cellular component*: microtubule associated complex.
Table 3, continued
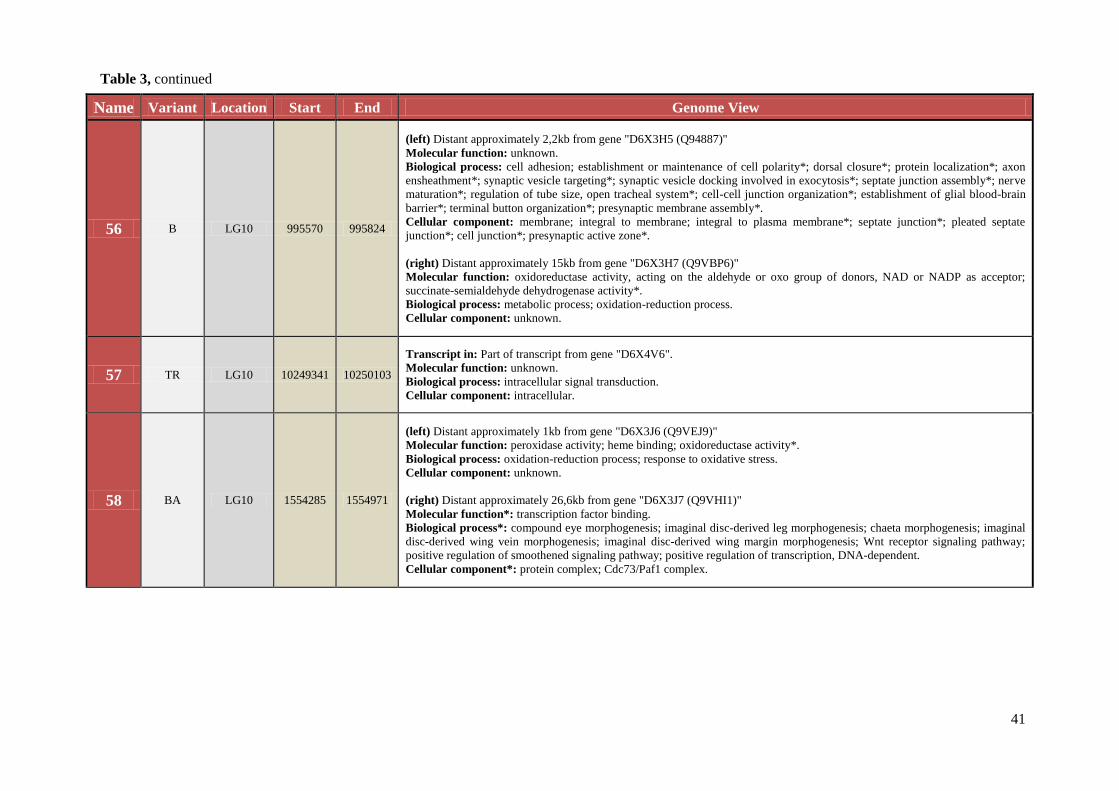
41
Name Variant Location Start End Genome View
56 B LG10 995570 995824
(left) Distant approximately 2,2kb from gene "D6X3H5 (Q94887)"
Molecular function: unknown.
Biological process: cell adhesion; establishment or maintenance of cell polarity*; dorsal closure*; protein localization*; axon
ensheathment*; synaptic vesicle targeting*; synaptic vesicle docking involved in exocytosis*; septate junction assembly*; nerve
maturation*; regulation of tube size, open tracheal system*; cell-cell junction organization*; establishment of glial blood-brain
barrier*; terminal button organization*; presynaptic membrane assembly*.
Cellular component: membrane; integral to membrane; integral to plasma membrane*; septate junction*; pleated septate
junction*; cell junction*; presynaptic active zone*.
(right) Distant approximately 15kb from gene "D6X3H7 (Q9VBP6)"
Molecular function: oxidoreductase activity, acting on the aldehyde or oxo group of donors, NAD or NADP as acceptor;
succinate-semialdehyde dehydrogenase activity*.
Biological process: metabolic process; oxidation-reduction process.
Cellular component: unknown.
57 TR LG10 10249341 10250103
Transcript in: Part of transcript from gene "D6X4V6".
Molecular function: unknown.
Biological process: intracellular signal transduction.
Cellular component: intracellular.
58 BA LG10 1554285 1554971
(left) Distant approximately 1kb from gene "D6X3J6 (Q9VEJ9)"
Molecular function: peroxidase activity; heme binding; oxidoreductase activity*.
Biological process: oxidation-reduction process; response to oxidative stress.
Cellular component: unknown.
(right) Distant approximately 26,6kb from gene "D6X3J7 (Q9VHI1)"
Molecular function*: transcription factor binding.
Biological process*: compound eye morphogenesis; imaginal disc-derived leg morphogenesis; chaeta morphogenesis; imaginal
disc-derived wing vein morphogenesis; imaginal disc-derived wing margin morphogenesis; Wnt receptor signaling pathway;
positive regulation of smoothened signaling pathway; positive regulation of transcription, DNA-dependent.
Cellular component*: protein complex; Cdc73/Paf1 complex.
Table 3, continued
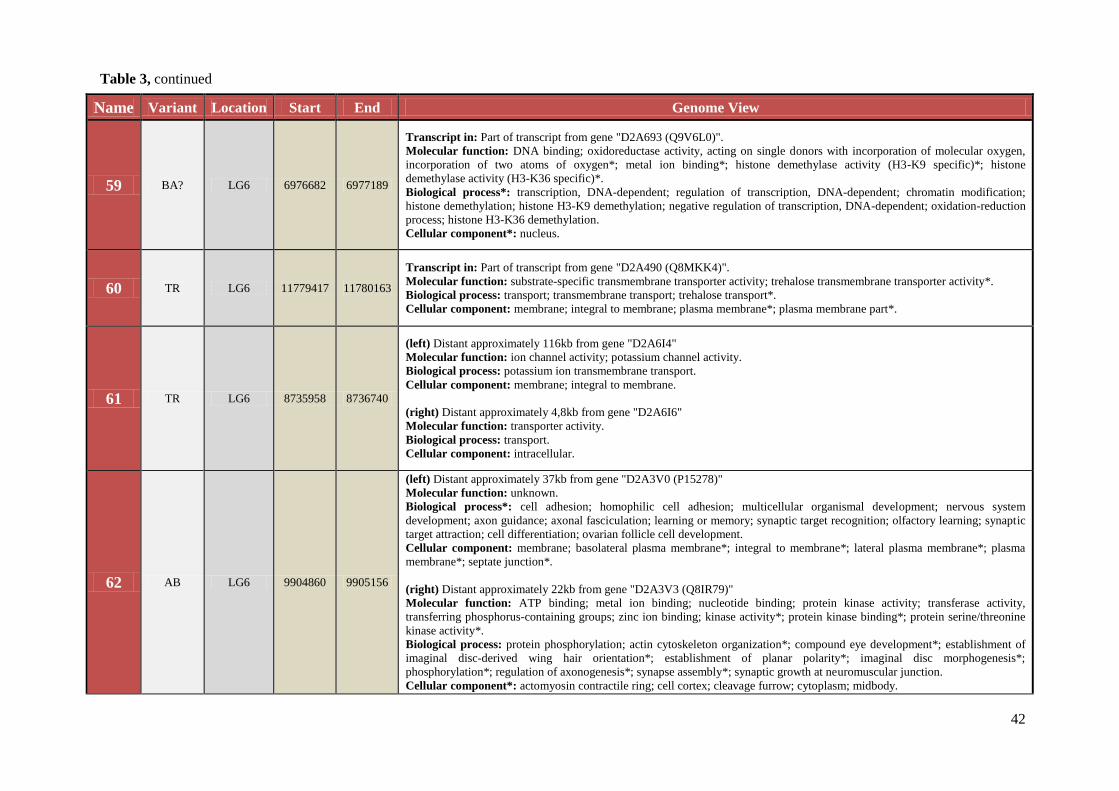
42
Name Variant Location Start End Genome View
59 BA? LG6 6976682 6977189
Transcript in: Part of transcript from gene "D2A693 (Q9V6L0)".
Molecular function: DNA binding; oxidoreductase activity, acting on single donors with incorporation of molecular oxygen,
incorporation of two atoms of oxygen*; metal ion binding*; histone demethylase activity (H3-K9 specific)*; histone
demethylase activity (H3-K36 specific)*.
Biological process*: transcription, DNA-dependent; regulation of transcription, DNA-dependent; chromatin modification;
histone demethylation; histone H3-K9 demethylation; negative regulation of transcription, DNA-dependent; oxidation-reduction
process; histone H3-K36 demethylation.
Cellular component*: nucleus.
60 TR LG6 11779417 11780163
Transcript in: Part of transcript from gene "D2A490 (Q8MKK4)".
Molecular function: substrate-specific transmembrane transporter activity; trehalose transmembrane transporter activity*.
Biological process: transport; transmembrane transport; trehalose transport*.
Cellular component: membrane; integral to membrane; plasma membrane*; plasma membrane part*.
61 TR LG6 8735958 8736740
(left) Distant approximately 116kb from gene "D2A6I4"
Molecular function: ion channel activity; potassium channel activity.
Biological process: potassium ion transmembrane transport.
Cellular component: membrane; integral to membrane.
(right) Distant approximately 4,8kb from gene "D2A6I6"
Molecular function: transporter activity.
Biological process: transport.
Cellular component: intracellular.
62 AB LG6 9904860 9905156
(left) Distant approximately 37kb from gene "D2A3V0 (P15278)"
Molecular function: unknown.
Biological process*: cell adhesion; homophilic cell adhesion; multicellular organismal development; nervous system
development; axon guidance; axonal fasciculation; learning or memory; synaptic target recognition; olfactory learning; synaptic
target attraction; cell differentiation; ovarian follicle cell development.
Cellular component: membrane; basolateral plasma membrane*; integral to membrane*; lateral plasma membrane*; plasma
membrane*; septate junction*.
(right) Distant approximately 22kb from gene "D2A3V3 (Q8IR79)"
Molecular function: ATP binding; metal ion binding; nucleotide binding; protein kinase activity; transferase activity,
transferring phosphorus-containing groups; zinc ion binding; kinase activity*; protein kinase binding*; protein serine/threonine
kinase activity*.
Biological process: protein phosphorylation; actin cytoskeleton organization*; compound eye development*; establishment of
imaginal disc-derived wing hair orientation*; establishment of planar polarity*; imaginal disc morphogenesis*;
phosphorylation*; regulation of axonogenesis*; synapse assembly*; synaptic growth at neuromuscular junction.
Cellular component*: actomyosin contractile ring; cell cortex; cleavage furrow; cytoplasm; midbody.
Table 3, continued
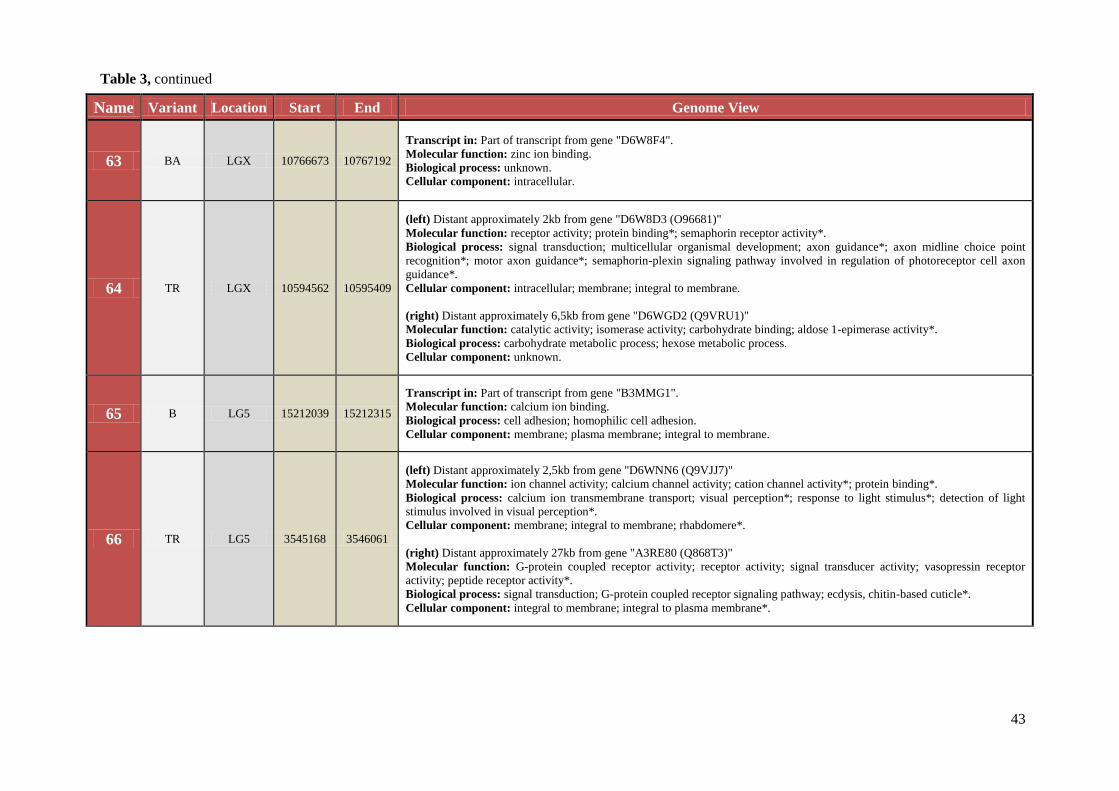
43
Name Variant Location Start End Genome View
63 BA LGX 10766673 10767192
Transcript in: Part of transcript from gene "D6W8F4".
Molecular function: zinc ion binding.
Biological process: unknown.
Cellular component: intracellular.
64 TR LGX 10594562 10595409
(left) Distant approximately 2kb from gene "D6W8D3 (O96681)"
Molecular function: receptor activity; protein binding*; semaphorin receptor activity*.
Biological process: signal transduction; multicellular organismal development; axon guidance*; axon midline choice point
recognition*; motor axon guidance*; semaphorin-plexin signaling pathway involved in regulation of photoreceptor cell axon
guidance*.
Cellular component: intracellular; membrane; integral to membrane.
(right) Distant approximately 6,5kb from gene "D6WGD2 (Q9VRU1)"
Molecular function: catalytic activity; isomerase activity; carbohydrate binding; aldose 1-epimerase activity*.
Biological process: carbohydrate metabolic process; hexose metabolic process.
Cellular component: unknown.
65 B LG5 15212039 15212315
Transcript in: Part of transcript from gene "B3MMG1".
Molecular function: calcium ion binding.
Biological process: cell adhesion; homophilic cell adhesion.
Cellular component: membrane; plasma membrane; integral to membrane.
66 TR LG5 3545168 3546061
(left) Distant approximately 2,5kb from gene "D6WNN6 (Q9VJJ7)"
Molecular function: ion channel activity; calcium channel activity; cation channel activity*; protein binding*.
Biological process: calcium ion transmembrane transport; visual perception*; response to light stimulus*; detection of light
stimulus involved in visual perception*.
Cellular component: membrane; integral to membrane; rhabdomere*.
(right) Distant approximately 27kb from gene "A3RE80 (Q868T3)"
Molecular function: G-protein coupled receptor activity; receptor activity; signal transducer activity; vasopressin receptor
activity; peptide receptor activity*.
Biological process: signal transduction; G-protein coupled receptor signaling pathway; ecdysis, chitin-based cuticle*.
Cellular component: integral to membrane; integral to plasma membrane*.
Table 3, continued
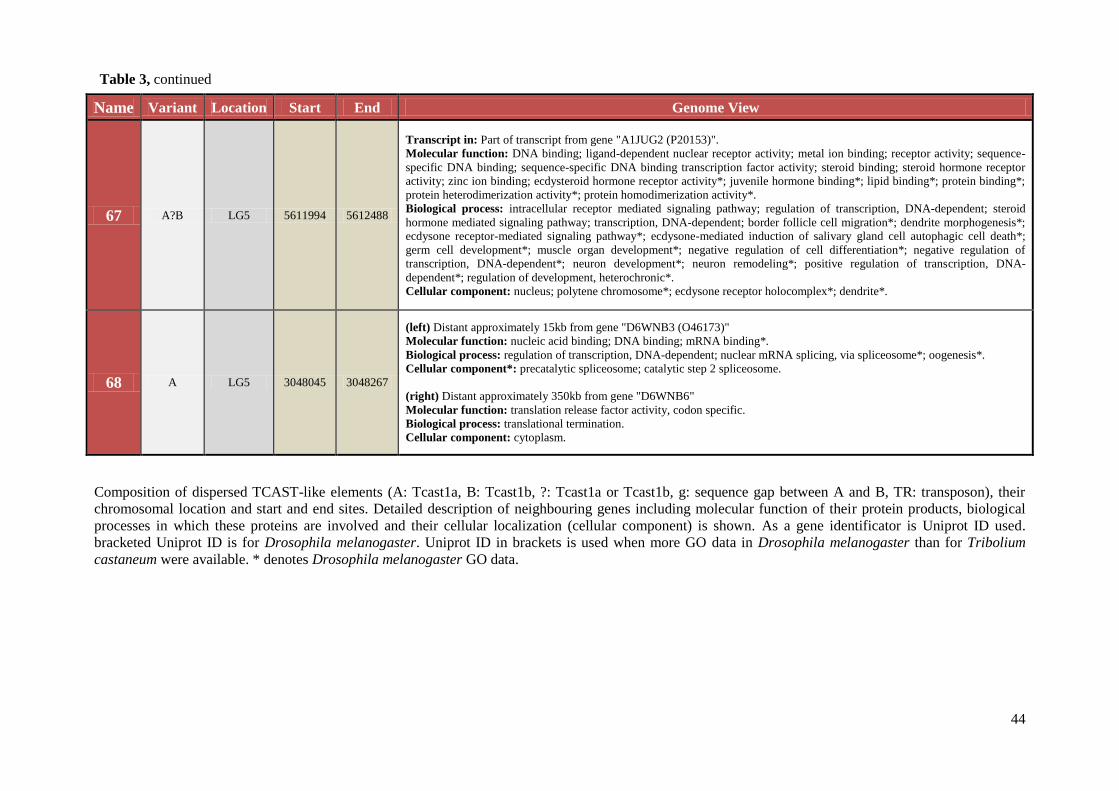
44
Name Variant Location Start End Genome View
67 A?B LG5 5611994 5612488
Transcript in: Part of transcript from gene "A1JUG2 (P20153)".
Molecular function: DNA binding; ligand-dependent nuclear receptor activity; metal ion binding; receptor activity; sequence-
specific DNA binding; sequence-specific DNA binding transcription factor activity; steroid binding; steroid hormone receptor
activity; zinc ion binding; ecdysteroid hormone receptor activity*; juvenile hormone binding*; lipid binding*; protein binding*;
protein heterodimerization activity*; protein homodimerization activity*.
Biological process: intracellular receptor mediated signaling pathway; regulation of transcription, DNA-dependent; steroid
hormone mediated signaling pathway; transcription, DNA-dependent; border follicle cell migration*; dendrite morphogenesis*;
ecdysone receptor-mediated signaling pathway*; ecdysone-mediated induction of salivary gland cell autophagic cell death*;
germ cell development*; muscle organ development*; negative regulation of cell differentiation*; negative regulation of
transcription, DNA-dependent*; neuron development*; neuron remodeling*; positive regulation of transcription, DNA-
dependent*; regulation of development, heterochronic*.
Cellular component: nucleus; polytene chromosome*; ecdysone receptor holocomplex*; dendrite*.
68 A LG5 3048045 3048267
(left) Distant approximately 15kb from gene "D6WNB3 (O46173)"
Molecular function: nucleic acid binding; DNA binding; mRNA binding*.
Biological process: regulation of transcription, DNA-dependent; nuclear mRNA splicing, via spliceosome*; oogenesis*.
Cellular component*: precatalytic spliceosome; catalytic step 2 spliceosome.
(right) Distant approximately 350kb from gene "D6WNB6"
Molecular function: translation release factor activity, codon specific.
Biological process: translational termination.
Cellular component: cytoplasm.
Composition of dispersed TCAST-like elements (A: Tcast1a, B: Tcast1b, ?: Tcast1a or Tcast1b, g: sequence gap between A and B, TR: transposon), their
chromosomal location and start and end sites. Detailed description of neighbouring genes including molecular function of their protein products, biological
processes in which these proteins are involved and their cellular localization (cellular component) is shown. As a gene identificator is Uniprot ID used.
bracketed Uniprot ID is for Drosophila melanogaster. Uniprot ID in brackets is used when more GO data in Drosophila melanogaster than for Tribolium
castaneum were available. * denotes Drosophila melanogaster GO data.
Table 3, continued
45
4.3. Characteristics of TCAST-like elements
4.3.1. TCAST satellite-like elements
Sequence analysis of the 68 TCAST-like elements identified within the vicinity of
genes enabled their classification into two groups. The first group contains partial TCAST
satellite monomers or tandemly arranged elements, either complete or partial dimers, trimers
or tetramers (Table 2). The minimal size of satellite repeat is 203 nt (0.6 of complete TCAST
monomer; sequence no. 15), while the maximal size is 1 440 nt (4 complete TCAST
monomers; sequence no. 43) (Table 2). In many sequences, two subtypes of TCAST satellite
monomers were mutually interspersed: Tcast1a and Tcast1b. Tcast1b corresponds to the
TCAST satellite consensus that was used as a query sequence14
, and Tcast1a corresponds to
the lately discovered TCAST subfamily32
. Tcast1a and Tcast1b have an average homology of
79%, and are of similar sizes, 362 bp and 377 bp respectively, but are characterized by a
divergent, subfamily specific region of approximately 100 bp32
(Figure 2). There were 34
TCAST satellite-like elements found within or in the region of 53 genes. Lengths of TCAST
satellite-like elements (Table 2), their exact start and end sites within genomic sequence and
composition (Table 3) are provided.
In order to see if there is any clustering of sequences of TCAST satellite-like elements
due to the difference in the homogenization at the level of local array, chromosome, or among
different chromosomes, sequence alignment and phylogenetic analysis were performed.
Tcast1a and Tcast1b subunits were extracted from TCAST satellite-like sequences and
analyzed separately. Alignment was performed on 24 Tcast1a subunits, ranging in size from
136 and 377 bp (Figure 11). The average pairwise distances between Tcast1a subunits of
TCAST satellite-like sequences was 5.8%. (Table 4) Alignment adjustment using Gblocks62
which eliminates poorly aligned positions and divergent regions resulted in few changes,
therefore the original, unadjusted alignment was used for the construction of phylogenetic
trees. Since the sequences differ in lengths and comprise regions of divergent variability,
methods that take into account specific models of DNA evolution were considered as the most
suitable for the construction of phylogenetic trees, maximum likelihood (ML) and Bayesian
(MCMC). The ML tree showed weak resolution with no significant support for clustering of
sequences derived from the same satellite-like array or from the same chromosome. Similarly,
Bayesian tree demonstrated no significant sequence clustering (Figure 12A). Alignment of 28
46
Tcast1b subunits, ranging from 159 bp to 363 bp (Figure 13) was also not significantly
affected by Gblocks adjustment, therefore the unadjusted alignment was used for the
construction of phylogenetic trees (Figure 12B). The average pairwise divergence between
Tcast1b subunits, of TCAST satellite-like sequences, was 4.7% (Table 5). With the ML
phylogenetic tree, four groups composed of two or three sequences, were resolved by
relatively low bootstrap values. However, the majority of Tcast1b subunit sequences remained
unresolved. There was no clustering of subunits derived from the same array or the same
chromosome (Figure 12B). Bayesian tree analysis produced one significantly supported
cluster composed of 10 sequences derived from 7 chromosomes (Figure 12B).
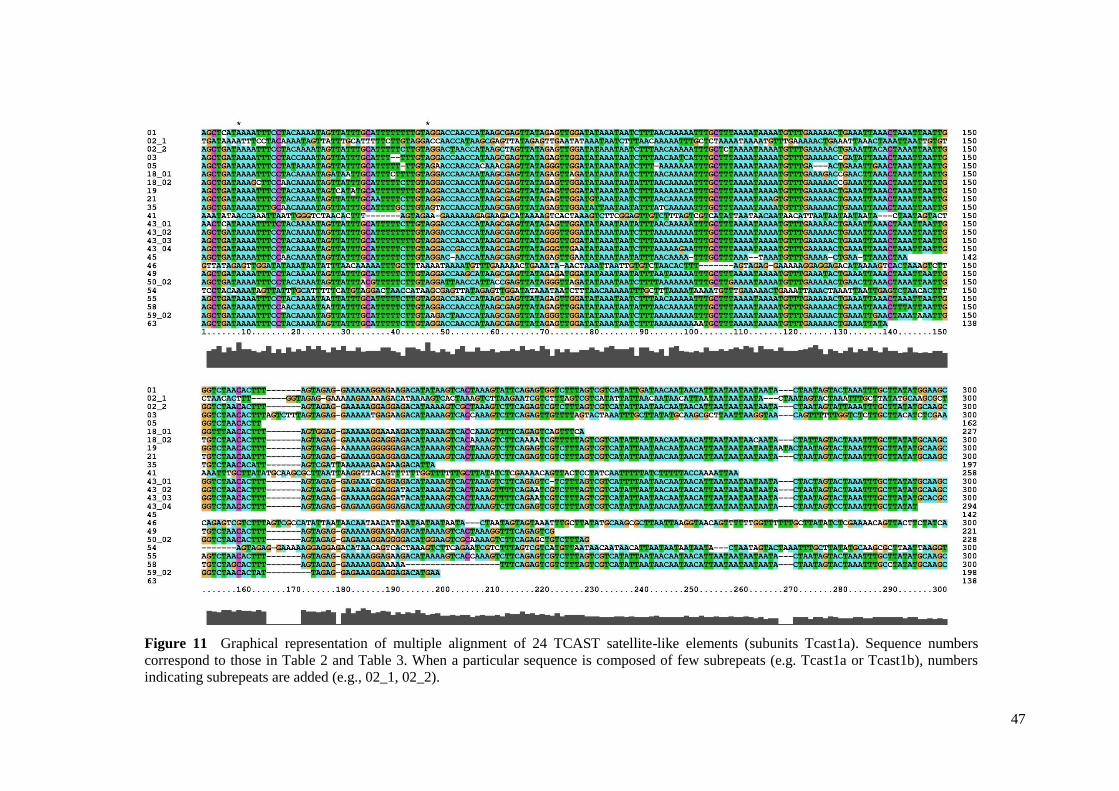
47
Figure 11 Graphical representation of multiple alignment of 24 TCAST satellite-like elements (subunits Tcast1a). Sequence numbers
correspond to those in Table 2 and Table 3. When a particular sequence is composed of few subrepeats (e.g. Tcast1a or Tcast1b), numbers
indicating subrepeats are added (e.g., 02_1, 02_2).
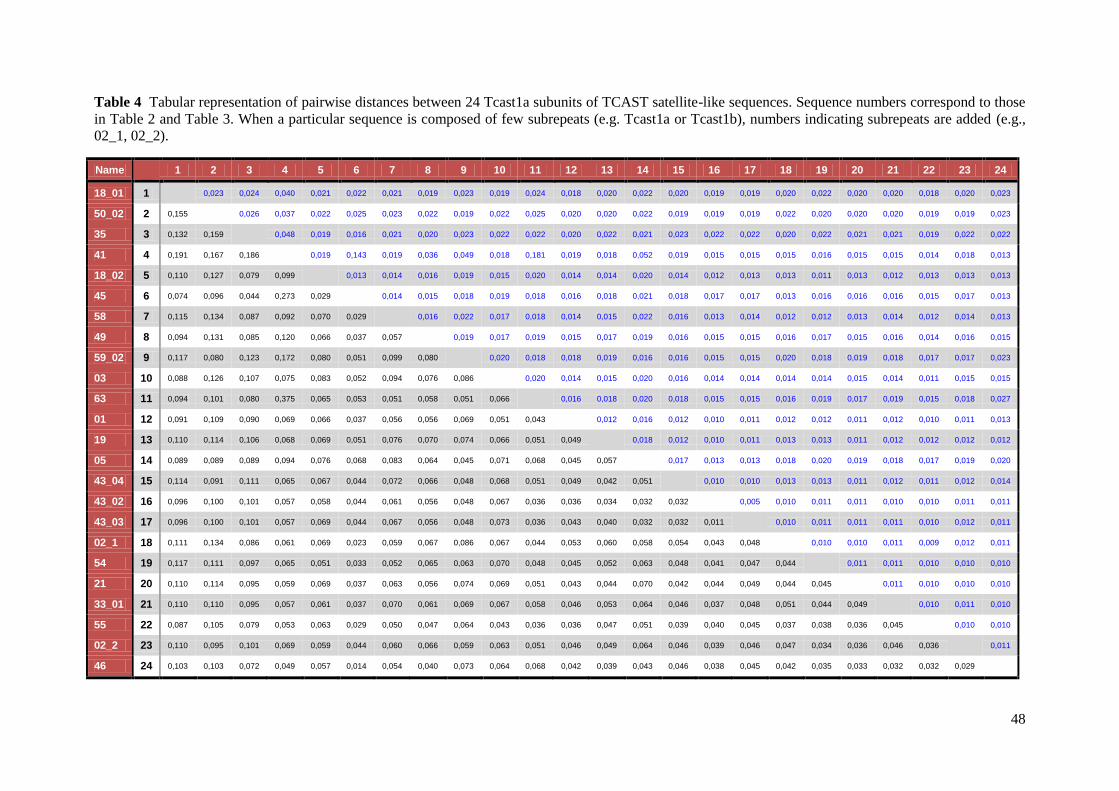
48
Table 4 Tabular representation of pairwise distances between 24 Tcast1a subunits of TCAST satellite-like sequences. Sequence numbers correspond to those
in Table 2 and Table 3. When a particular sequence is composed of few subrepeats (e.g. Tcast1a or Tcast1b), numbers indicating subrepeats are added (e.g.,
02_1, 02_2).
Name
1 2 3 4 5 6 7 8 9 10 11 12 13 14 15 16 17 18 19 20 21 22 23 24
18_01 1
0,023 0,024 0,040 0,021 0,022 0,021 0,019 0,023 0,019 0,024 0,018 0,020 0,022 0,020 0,019 0,019 0,020 0,022 0,020 0,020 0,018 0,020 0,023
50_02 2 0,155
0,026 0,037 0,022 0,025 0,023 0,022 0,019 0,022 0,025 0,020 0,020 0,022 0,019 0,019 0,019 0,022 0,020 0,020 0,020 0,019 0,019 0,023
35 3 0,132 0,159
0,048 0,019 0,016 0,021 0,020 0,023 0,022 0,022 0,020 0,022 0,021 0,023 0,022 0,022 0,020 0,022 0,021 0,021 0,019 0,022 0,022
41 4 0,191 0,167 0,186
0,019 0,143 0,019 0,036 0,049 0,018 0,181 0,019 0,018 0,052 0,019 0,015 0,015 0,015 0,016 0,015 0,015 0,014 0,018 0,013
18_02 5 0,110 0,127 0,079 0,099
0,013 0,014 0,016 0,019 0,015 0,020 0,014 0,014 0,020 0,014 0,012 0,013 0,013 0,011 0,013 0,012 0,013 0,013 0,013
45 6 0,074 0,096 0,044 0,273 0,029
0,014 0,015 0,018 0,019 0,018 0,016 0,018 0,021 0,018 0,017 0,017 0,013 0,016 0,016 0,016 0,015 0,017 0,013
58 7 0,115 0,134 0,087 0,092 0,070 0,029
0,016 0,022 0,017 0,018 0,014 0,015 0,022 0,016 0,013 0,014 0,012 0,012 0,013 0,014 0,012 0,014 0,013
49 8 0,094 0,131 0,085 0,120 0,066 0,037 0,057
0,019 0,017 0,019 0,015 0,017 0,019 0,016 0,015 0,015 0,016 0,017 0,015 0,016 0,014 0,016 0,015
59_02 9 0,117 0,080 0,123 0,172 0,080 0,051 0,099 0,080
0,020 0,018 0,018 0,019 0,016 0,016 0,015 0,015 0,020 0,018 0,019 0,018 0,017 0,017 0,023
03 10 0,088 0,126 0,107 0,075 0,083 0,052 0,094 0,076 0,086
0,020 0,014 0,015 0,020 0,016 0,014 0,014 0,014 0,014 0,015 0,014 0,011 0,015 0,015
63 11 0,094 0,101 0,080 0,375 0,065 0,053 0,051 0,058 0,051 0,066
0,016 0,018 0,020 0,018 0,015 0,015 0,016 0,019 0,017 0,019 0,015 0,018 0,027
01 12 0,091 0,109 0,090 0,069 0,066 0,037 0,056 0,056 0,069 0,051 0,043
0,012 0,016 0,012 0,010 0,011 0,012 0,012 0,011 0,012 0,010 0,011 0,013
19 13 0,110 0,114 0,106 0,068 0,069 0,051 0,076 0,070 0,074 0,066 0,051 0,049
0,018 0,012 0,010 0,011 0,013 0,013 0,011 0,012 0,012 0,012 0,012
05 14 0,089 0,089 0,089 0,094 0,076 0,068 0,083 0,064 0,045 0,071 0,068 0,045 0,057
0,017 0,013 0,013 0,018 0,020 0,019 0,018 0,017 0,019 0,020
43_04 15 0,114 0,091 0,111 0,065 0,067 0,044 0,072 0,066 0,048 0,068 0,051 0,049 0,042 0,051
0,010 0,010 0,013 0,013 0,011 0,012 0,011 0,012 0,014
43_02 16 0,096 0,100 0,101 0,057 0,058 0,044 0,061 0,056 0,048 0,067 0,036 0,036 0,034 0,032 0,032
0,005 0,010 0,011 0,011 0,010 0,010 0,011 0,011
43_03 17 0,096 0,100 0,101 0,057 0,069 0,044 0,067 0,056 0,048 0,073 0,036 0,043 0,040 0,032 0,032 0,011
0,010 0,011 0,011 0,011 0,010 0,012 0,011
02_1 18 0,111 0,134 0,086 0,061 0,069 0,023 0,059 0,067 0,086 0,067 0,044 0,053 0,060 0,058 0,054 0,043 0,048
0,010 0,010 0,011 0,009 0,012 0,011
54 19 0,117 0,111 0,097 0,065 0,051 0,033 0,052 0,065 0,063 0,070 0,048 0,045 0,052 0,063 0,048 0,041 0,047 0,044
0,011 0,011 0,010 0,010 0,010
21 20 0,110 0,114 0,095 0,059 0,069 0,037 0,063 0,056 0,074 0,069 0,051 0,043 0,044 0,070 0,042 0,044 0,049 0,044 0,045
0,011 0,010 0,010 0,010
33_01 21 0,110 0,110 0,095 0,057 0,061 0,037 0,070 0,061 0,069 0,067 0,058 0,046 0,053 0,064 0,046 0,037 0,048 0,051 0,044 0,049
0,010 0,011 0,010
55 22 0,087 0,105 0,079 0,053 0,063 0,029 0,050 0,047 0,064 0,043 0,036 0,036 0,047 0,051 0,039 0,040 0,045 0,037 0,038 0,036 0,045
0,010 0,010
02_2 23 0,110 0,095 0,101 0,069 0,059 0,044 0,060 0,066 0,059 0,063 0,051 0,046 0,049 0,064 0,046 0,039 0,046 0,047 0,034 0,036 0,046 0,036
0,011
46 24 0,103 0,103 0,072 0,049 0,057 0,014 0,054 0,040 0,073 0,064 0,068 0,042 0,039 0,043 0,046 0,038 0,045 0,042 0,035 0,033 0,032 0,032 0,029
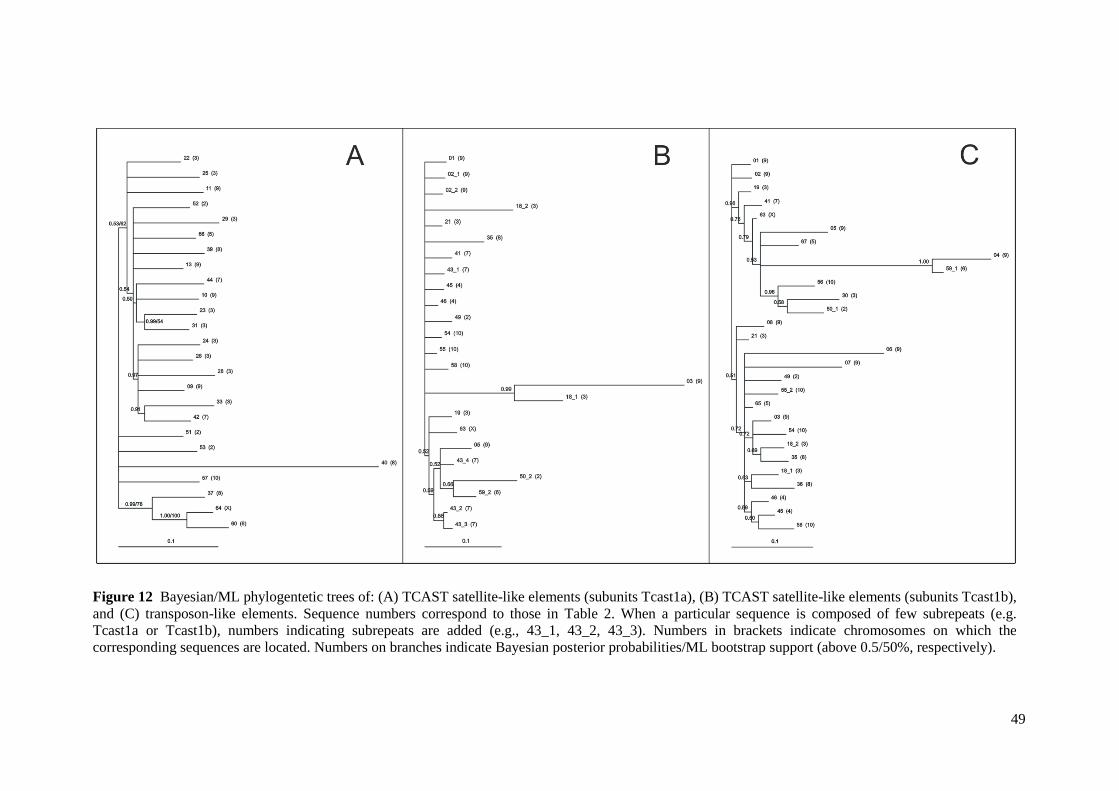
49
Figure 12 Bayesian/ML phylogentetic trees of: (A) TCAST satellite-like elements (subunits Tcast1a), (B) TCAST satellite-like elements (subunits Tcast1b),
and (C) transposon-like elements. Sequence numbers correspond to those in Table 2. When a particular sequence is composed of few subrepeats (e.g.
Tcast1a or Tcast1b), numbers indicating subrepeats are added (e.g., 43_1, 43_2, 43_3). Numbers in brackets indicate chromosomes on which the
corresponding sequences are located. Numbers on branches indicate Bayesian posterior probabilities/ML bootstrap support (above 0.5/50%, respectively).
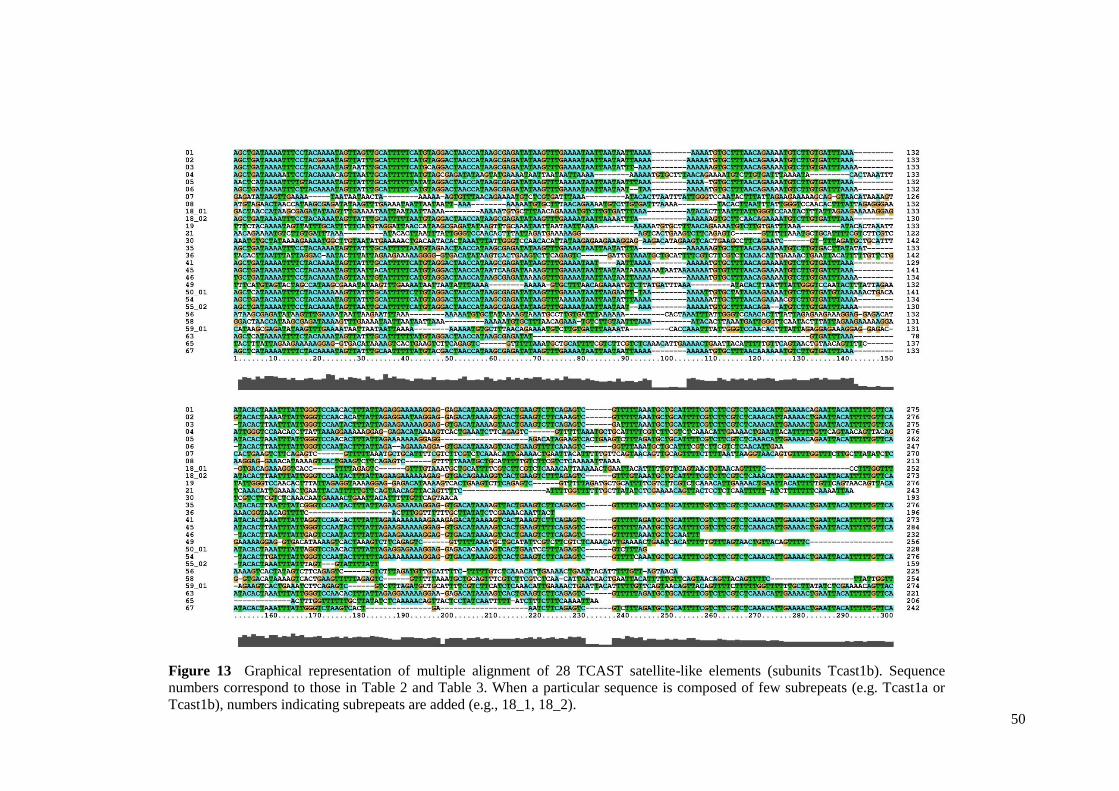
50
Figure 13 Graphical representation of multiple alignment of 28 TCAST satellite-like elements (subunits Tcast1b). Sequence
numbers correspond to those in Table 2 and Table 3. When a particular sequence is composed of few subrepeats (e.g. Tcast1a or
Tcast1b), numbers indicating subrepeats are added (e.g., 18_1, 18_2).
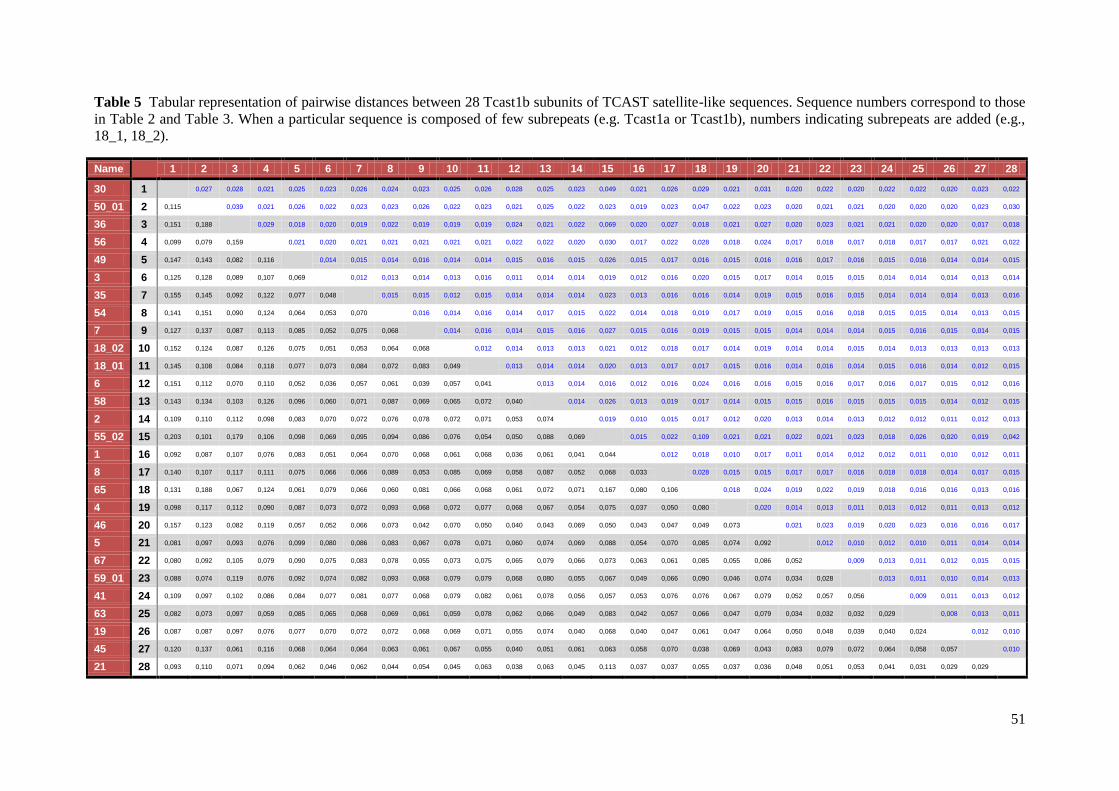
51
Table 5 Tabular representation of pairwise distances between 28 Tcast1b subunits of TCAST satellite-like sequences. Sequence numbers correspond to those
in Table 2 and Table 3. When a particular sequence is composed of few subrepeats (e.g. Tcast1a or Tcast1b), numbers indicating subrepeats are added (e.g.,
18_1, 18_2).
Name
1 2 3 4 5 6 7 8 9 10 11 12 13 14 15 16 17 18 19 20 21 22 23 24 25 26 27 28
30 1 0,027 0,028 0,021 0,025 0,023 0,026 0,024 0,023 0,025 0,026 0,028 0,025 0,023 0,049 0,021 0,026 0,029 0,021 0,031 0,020 0,022 0,020 0,022 0,022 0,020 0,023 0,022
50_01 2 0,115
0,039 0,021 0,026 0,022 0,023 0,023 0,026 0,022 0,023 0,021 0,025 0,022 0,023 0,019 0,023 0,047 0,022 0,023 0,020 0,021 0,021 0,020 0,020 0,020 0,023 0,030
36 3 0,151 0,188
0,029 0,018 0,020 0,019 0,022 0,019 0,019 0,019 0,024 0,021 0,022 0,069 0,020 0,027 0,018 0,021 0,027 0,020 0,023 0,021 0,021 0,020 0,020 0,017 0,018
56 4 0,099 0,079 0,159
0,021 0,020 0,021 0,021 0,021 0,021 0,021 0,022 0,022 0,020 0,030 0,017 0,022 0,028 0,018 0,024 0,017 0,018 0,017 0,018 0,017 0,017 0,021 0,022
49 5 0,147 0,143 0,082 0,116
0,014 0,015 0,014 0,016 0,014 0,014 0,015 0,016 0,015 0,026 0,015 0,017 0,016 0,015 0,016 0,016 0,017 0,016 0,015 0,016 0,014 0,014 0,015
3 6 0,125 0,128 0,089 0,107 0,069
0,012 0,013 0,014 0,013 0,016 0,011 0,014 0,014 0,019 0,012 0,016 0,020 0,015 0,017 0,014 0,015 0,015 0,014 0,014 0,014 0,013 0,014
35 7 0,155 0,145 0,092 0,122 0,077 0,048
0,015 0,015 0,012 0,015 0,014 0,014 0,014 0,023 0,013 0,016 0,016 0,014 0,019 0,015 0,016 0,015 0,014 0,014 0,014 0,013 0,016
54 8 0,141 0,151 0,090 0,124 0,064 0,053 0,070
0,016 0,014 0,016 0,014 0,017 0,015 0,022 0,014 0,018 0,019 0,017 0,019 0,015 0,016 0,018 0,015 0,015 0,014 0,013 0,015
7 9 0,127 0,137 0,087 0,113 0,085 0,052 0,075 0,068
0,014 0,016 0,014 0,015 0,016 0,027 0,015 0,016 0,019 0,015 0,015 0,014 0,014 0,014 0,015 0,016 0,015 0,014 0,015
18_02 10 0,152 0,124 0,087 0,126 0,075 0,051 0,053 0,064 0,068
0,012 0,014 0,013 0,013 0,021 0,012 0,018 0,017 0,014 0,019 0,014 0,014 0,015 0,014 0,013 0,013 0,013 0,013
18_01 11 0,145 0,108 0,084 0,118 0,077 0,073 0,084 0,072 0,083 0,049
0,013 0,014 0,014 0,020 0,013 0,017 0,017 0,015 0,016 0,014 0,016 0,014 0,015 0,016 0,014 0,012 0,015
6 12 0,151 0,112 0,070 0,110 0,052 0,036 0,057 0,061 0,039 0,057 0,041
0,013 0,014 0,016 0,012 0,016 0,024 0,016 0,016 0,015 0,016 0,017 0,016 0,017 0,015 0,012 0,016
58 13 0,143 0,134 0,103 0,126 0,096 0,060 0,071 0,087 0,069 0,065 0,072 0,040
0,014 0,026 0,013 0,019 0,017 0,014 0,015 0,015 0,016 0,015 0,015 0,015 0,014 0,012 0,015
2 14 0,109 0,110 0,112 0,098 0,083 0,070 0,072 0,076 0,078 0,072 0,071 0,053 0,074
0,019 0,010 0,015 0,017 0,012 0,020 0,013 0,014 0,013 0,012 0,012 0,011 0,012 0,013
55_02 15 0,203 0,101 0,179 0,106 0,098 0,069 0,095 0,094 0,086 0,076 0,054 0,050 0,088 0,069
0,015 0,022 0,109 0,021 0,021 0,022 0,021 0,023 0,018 0,026 0,020 0,019 0,042
1 16 0,092 0,087 0,107 0,076 0,083 0,051 0,064 0,070 0,068 0,061 0,068 0,036 0,061 0,041 0,044
0,012 0,018 0,010 0,017 0,011 0,014 0,012 0,012 0,011 0,010 0,012 0,011
8 17 0,140 0,107 0,117 0,111 0,075 0,066 0,066 0,089 0,053 0,085 0,069 0,058 0,087 0,052 0,068 0,033
0,028 0,015 0,015 0,017 0,017 0,016 0,018 0,018 0,014 0,017 0,015
65 18 0,131 0,188 0,067 0,124 0,061 0,079 0,066 0,060 0,081 0,066 0,068 0,061 0,072 0,071 0,167 0,080 0,106
0,018 0,024 0,019 0,022 0,019 0,018 0,016 0,016 0,013 0,016
4 19 0,098 0,117 0,112 0,090 0,087 0,073 0,072 0,093 0,068 0,072 0,077 0,068 0,067 0,054 0,075 0,037 0,050 0,080
0,020 0,014 0,013 0,011 0,013 0,012 0,011 0,013 0,012
46 20 0,157 0,123 0,082 0,119 0,057 0,052 0,066 0,073 0,042 0,070 0,050 0,040 0,043 0,069 0,050 0,043 0,047 0,049 0,073
0,021 0,023 0,019 0,020 0,023 0,016 0,016 0,017
5 21 0,081 0,097 0,093 0,076 0,099 0,080 0,086 0,083 0,067 0,078 0,071 0,060 0,074 0,069 0,088 0,054 0,070 0,085 0,074 0,092
0,012 0,010 0,012 0,010 0,011 0,014 0,014
67 22 0,080 0,092 0,105 0,079 0,090 0,075 0,083 0,078 0,055 0,073 0,075 0,065 0,079 0,066 0,073 0,063 0,061 0,085 0,055 0,086 0,052
0,009 0,013 0,011 0,012 0,015 0,015
59_01 23 0,088 0,074 0,119 0,076 0,092 0,074 0,082 0,093 0,068 0,079 0,079 0,068 0,080 0,055 0,067 0,049 0,066 0,090 0,046 0,074 0,034 0,028
0,013 0,011 0,010 0,014 0,013
41 24 0,109 0,097 0,102 0,086 0,084 0,077 0,081 0,077 0,068 0,079 0,082 0,061 0,078 0,056 0,057 0,053 0,076 0,076 0,067 0,079 0,052 0,057 0,056
0,009 0,011 0,013 0,012
63 25 0,082 0,073 0,097 0,059 0,085 0,065 0,068 0,069 0,061 0,059 0,078 0,062 0,066 0,049 0,083 0,042 0,057 0,066 0,047 0,079 0,034 0,032 0,032 0,029
0,008 0,013 0,011
19 26 0,087 0,087 0,097 0,076 0,077 0,070 0,072 0,072 0,068 0,069 0,071 0,055 0,074 0,040 0,068 0,040 0,047 0,061 0,047 0,064 0,050 0,048 0,039 0,040 0,024
0,012 0,010
45 27 0,120 0,137 0,061 0,116 0,068 0,064 0,064 0,063 0,061 0,067 0,055 0,040 0,051 0,061 0,063 0,058 0,070 0,038 0,069 0,043 0,083 0,079 0,072 0,064 0,058 0,057
0,010
21 28 0,093 0,110 0,071 0,094 0,062 0,046 0,062 0,044 0,054 0,045 0,063 0,038 0,063 0,045 0,113 0,037 0,037 0,055 0,037 0,036 0,048 0,051 0,053 0,041 0,031 0,029 0,029
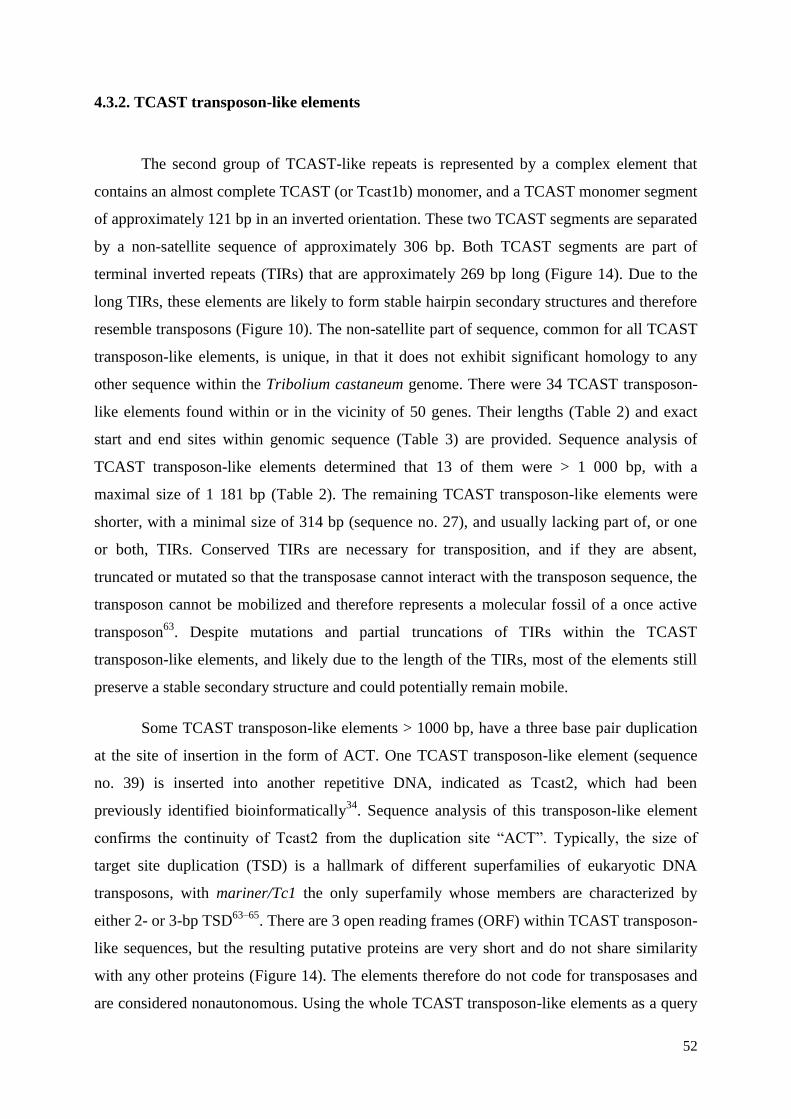
52
4.3.2. TCAST transposon-like elements
The second group of TCAST-like repeats is represented by a complex element that
contains an almost complete TCAST (or Tcast1b) monomer, and a TCAST monomer segment
of approximately 121 bp in an inverted orientation. These two TCAST segments are separated
by a non-satellite sequence of approximately 306 bp. Both TCAST segments are part of
terminal inverted repeats (TIRs) that are approximately 269 bp long (Figure 14). Due to the
long TIRs, these elements are likely to form stable hairpin secondary structures and therefore
resemble transposons (Figure 10). The non-satellite part of sequence, common for all TCAST
transposon-like elements, is unique, in that it does not exhibit significant homology to any
other sequence within the Tribolium castaneum genome. There were 34 TCAST transposon-
like elements found within or in the vicinity of 50 genes. Their lengths (Table 2) and exact
start and end sites within genomic sequence (Table 3) are provided. Sequence analysis of
TCAST transposon-like elements determined that 13 of them were > 1 000 bp, with a
maximal size of 1 181 bp (Table 2). The remaining TCAST transposon-like elements were
shorter, with a minimal size of 314 bp (sequence no. 27), and usually lacking part of, or one
or both, TIRs. Conserved TIRs are necessary for transposition, and if they are absent,
truncated or mutated so that the transposase cannot interact with the transposon sequence, the
transposon cannot be mobilized and therefore represents a molecular fossil of a once active
transposon63
. Despite mutations and partial truncations of TIRs within the TCAST
transposon-like elements, and likely due to the length of the TIRs, most of the elements still
preserve a stable secondary structure and could potentially remain mobile.
Some TCAST transposon-like elements > 1000 bp, have a three base pair duplication
at the site of insertion in the form of ACT. One TCAST transposon-like element (sequence
no. 39) is inserted into another repetitive DNA, indicated as Tcast2, which had been
previously identified bioinformatically34
. Sequence analysis of this transposon-like element
confirms the continuity of Tcast2 from the duplication site “ACT”. Typically, the size of
target site duplication (TSD) is a hallmark of different superfamilies of eukaryotic DNA
transposons, with mariner/Tc1 the only superfamily whose members are characterized by
either 2- or 3-bp TSD63–65
. There are 3 open reading frames (ORF) within TCAST transposon-
like sequences, but the resulting putative proteins are very short and do not share similarity
with any other proteins (Figure 14). The elements therefore do not code for transposases and
are considered nonautonomous. Using the whole TCAST transposon-like elements as a query
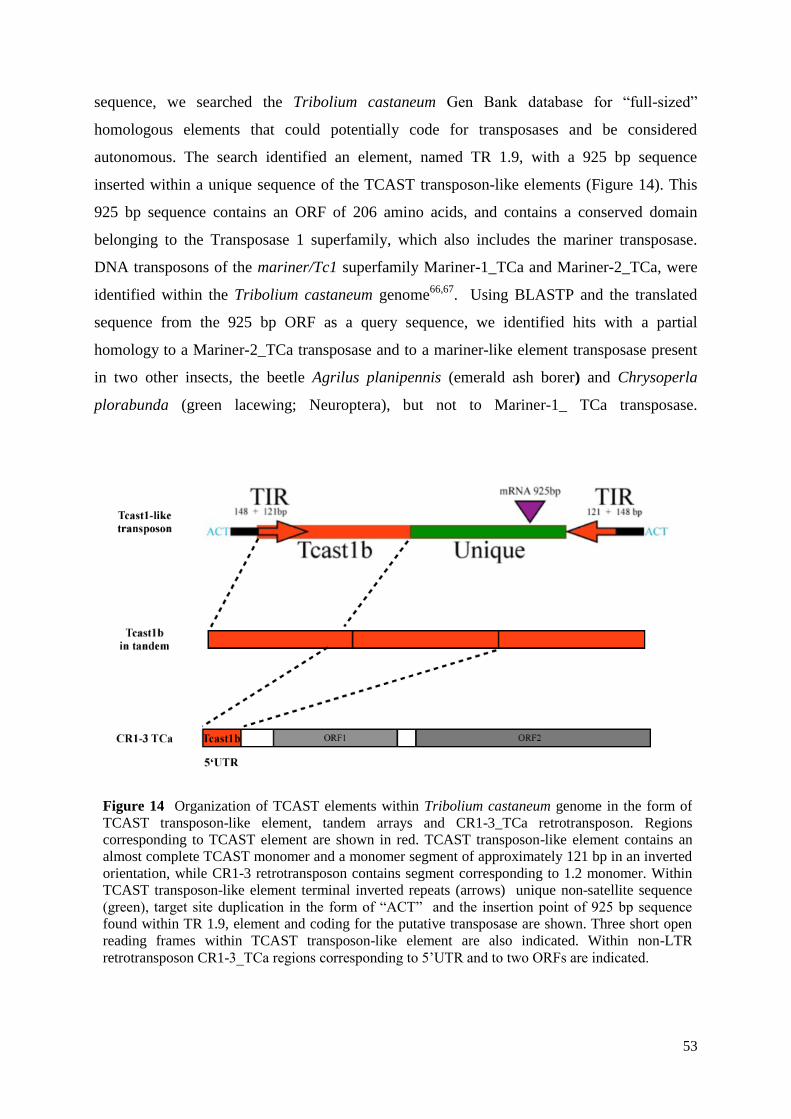
53
sequence, we searched the Tribolium castaneum Gen Bank database for “full-sized”
homologous elements that could potentially code for transposases and be considered
autonomous. The search identified an element, named TR 1.9, with a 925 bp sequence
inserted within a unique sequence of the TCAST transposon-like elements (Figure 14). This
925 bp sequence contains an ORF of 206 amino acids, and contains a conserved domain
belonging to the Transposase 1 superfamily, which also includes the mariner transposase.
DNA transposons of the mariner/Tc1 superfamily Mariner-1_TCa and Mariner-2_TCa, were
identified within the Tribolium castaneum genome66,67
. Using BLASTP and the translated
sequence from the 925 bp ORF as a query sequence, we identified hits with a partial
homology to a Mariner-2_TCa transposase and to a mariner-like element transposase present
in two other insects, the beetle Agrilus planipennis (emerald ash borer) and Chrysoperla
plorabunda (green lacewing; Neuroptera), but not to Mariner-1_ TCa transposase.
Figure 14 Organization of TCAST elements within Tribolium castaneum genome in the form of
TCAST transposon-like element, tandem arrays and CR1-3_TCa retrotransposon. Regions
corresponding to TCAST element are shown in red. TCAST transposon-like element contains an
almost complete TCAST monomer and a monomer segment of approximately 121 bp in an inverted
orientation, while CR1-3 retrotransposon contains segment corresponding to 1.2 monomer. Within
TCAST transposon-like element terminal inverted repeats (arrows) unique non-satellite sequence
(green), target site duplication in the form of “ACT” and the insertion point of 925 bp sequence
found within TR 1.9, element and coding for the putative transposase are shown. Three short open
reading frames within TCAST transposon-like element are also indicated. Within non-LTR
retrotransposon CR1-3_TCa regions corresponding to 5’UTR and to two ORFs are indicated.
54
To test if there is any chromosome-specific sequence clustering of TCAST
transposon-like sequences which could suggest difference in homogenization within
chromosome and among different chromosomes, the alignment and subsequent phylogenetic
analysis of TCAST transposon-like sequences was performed. Since TCAST transposon-like
elements differ significantly in size (314 to 1 181 nt), the alignment and phylogenetic analyses
was performed on 25 elements that mutually overlap in their sequences while other 9 TCAST
transposon-like elements were excluded from the analysis due to the very low overlapping
with other elements. Alignment was additionally adjusted using Gblocks (Figure 15). The
average pairwise divergence among TCAST transposon-like sequences was 7.1% (Table 6).
ML and Bayesian methods gave similar tree topologies (Figure 12C). The ML tree showed
very weak resolution of TCAST transposon-like sequences and a general absence of
subgroups with specific sequence characteristics (Figure 12C). Only two clusters were
formed while Bayesian tree identified three well supported groups, two of them were as for
ML tree (Figure 12C).
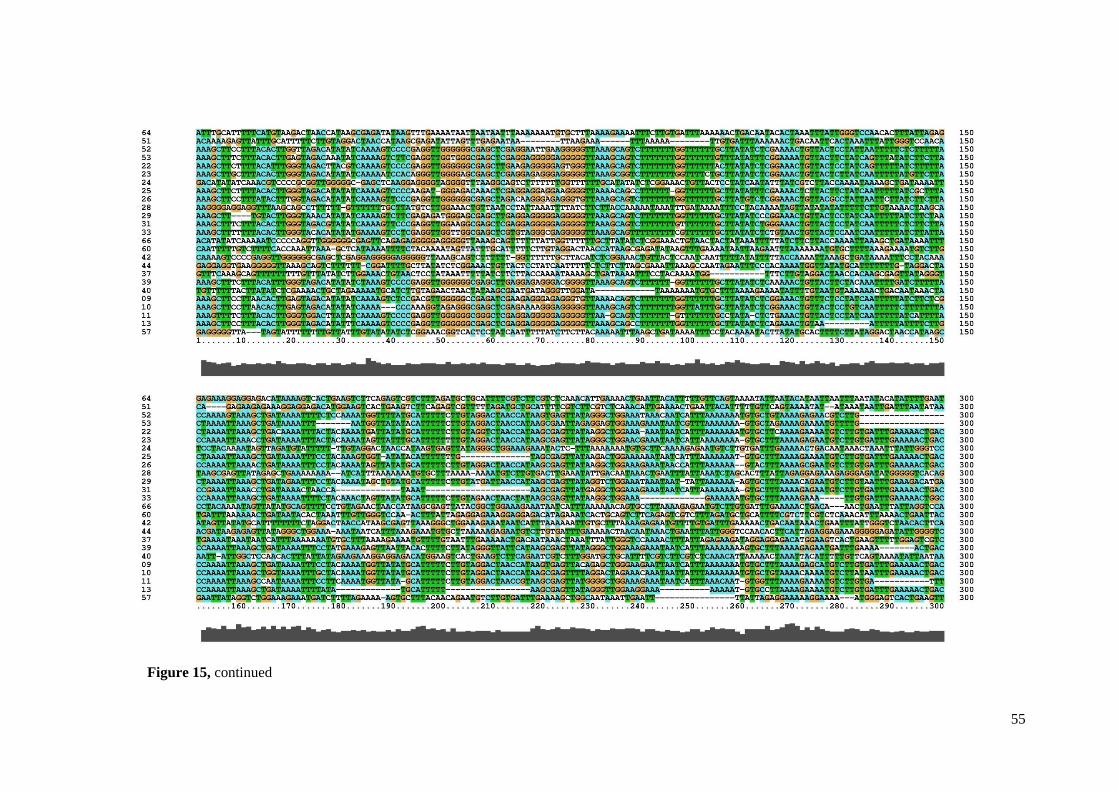
55
Figure 15, continued
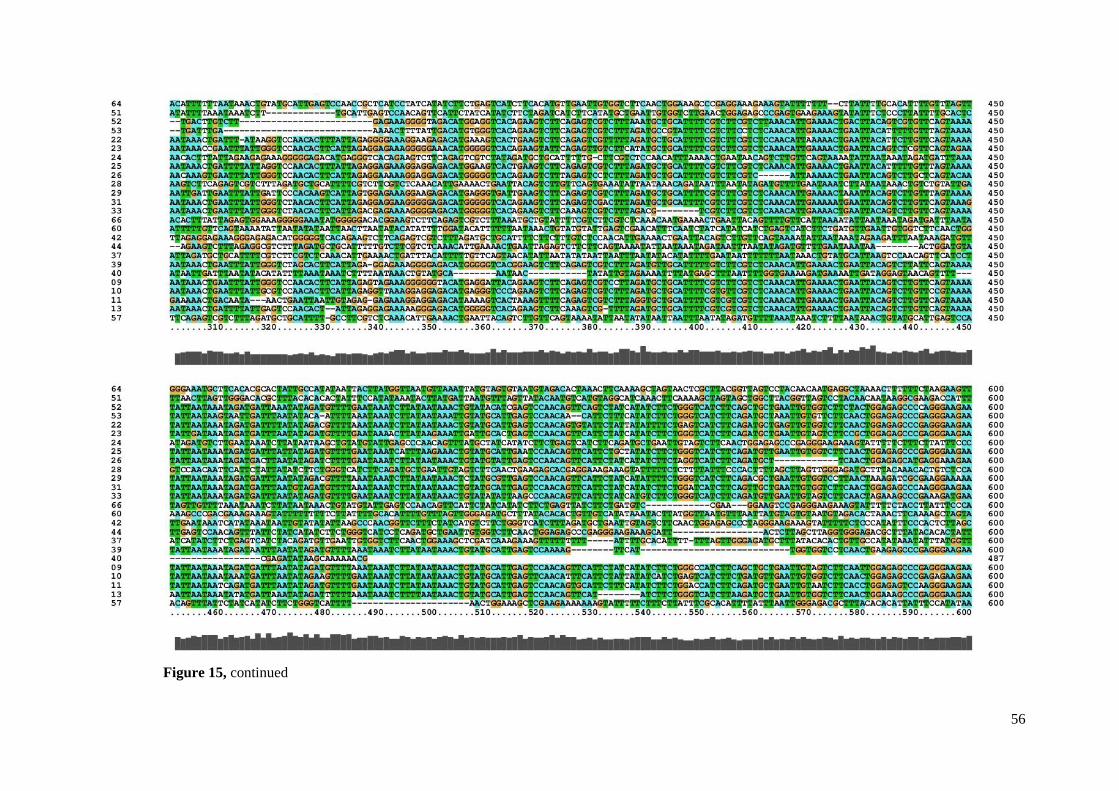
56
Figure 15, continued
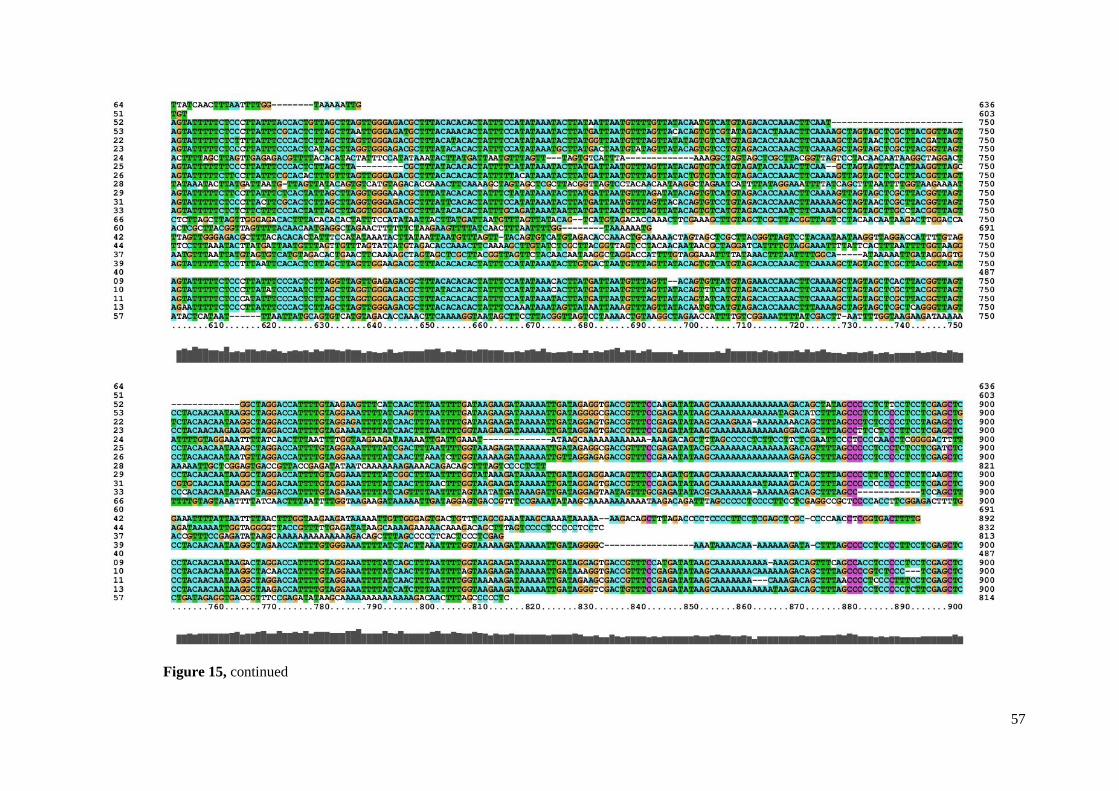
57
Figure 15, continued
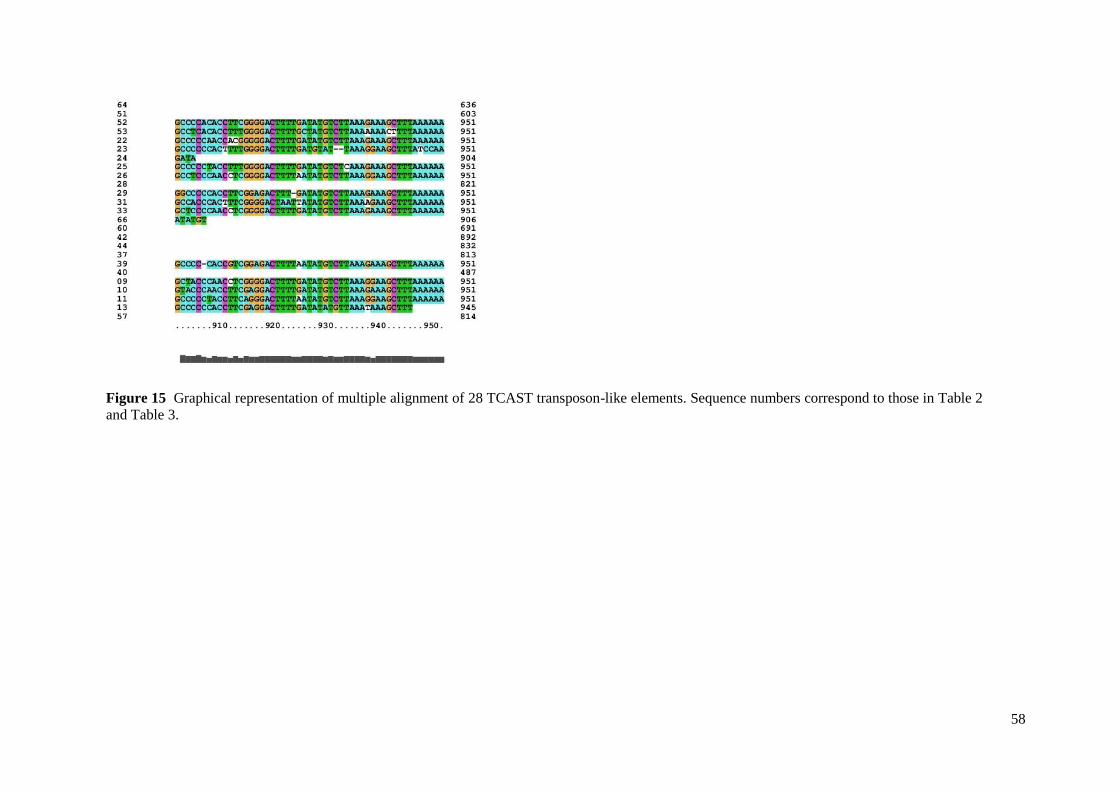
58
Figure 15 Graphical representation of multiple alignment of 28 TCAST transposon-like elements. Sequence numbers correspond to those in Table 2
and Table 3.
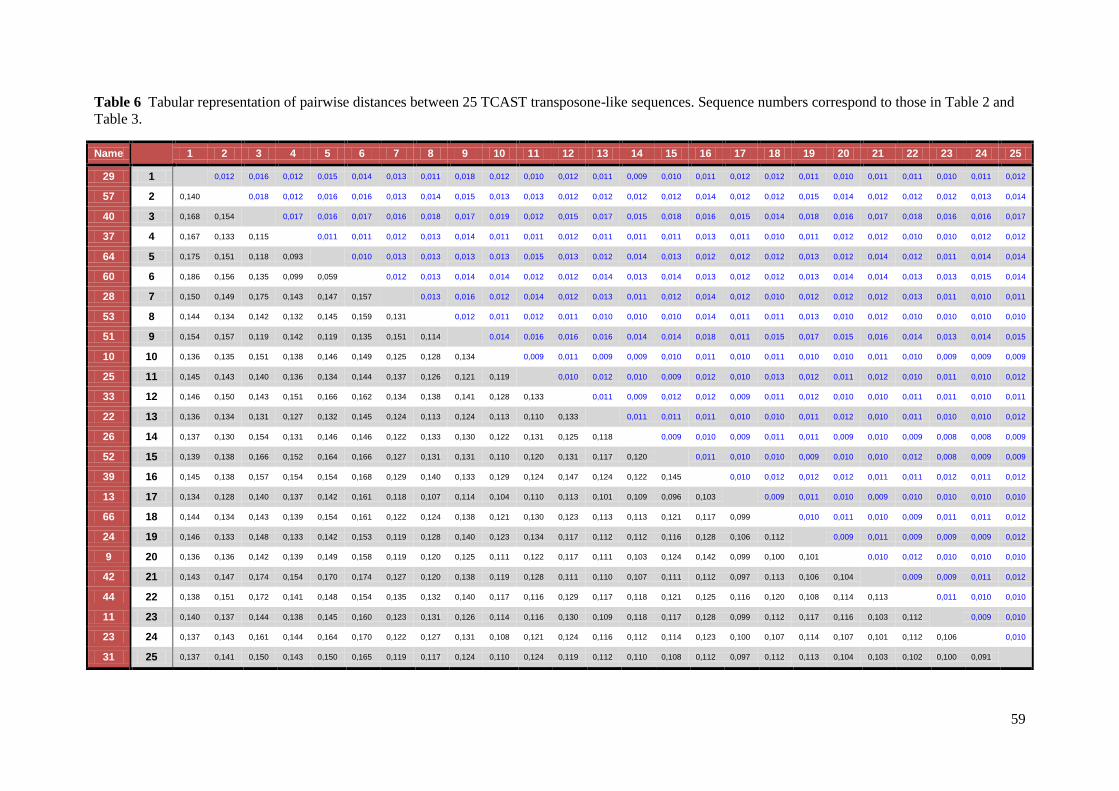
59
Table 6 Tabular representation of pairwise distances between 25 TCAST transposone-like sequences. Sequence numbers correspond to those in Table 2 and
Table 3.
Name
1 2 3 4 5 6 7 8 9 10 11 12 13 14 15 16 17 18 19 20 21 22 23 24 25
29 1
0,012 0,016 0,012 0,015 0,014 0,013 0,011 0,018 0,012 0,010 0,012 0,011 0,009 0,010 0,011 0,012 0,012 0,011 0,010 0,011 0,011 0,010 0,011 0,012
57 2 0,140
0,018 0,012 0,016 0,016 0,013 0,014 0,015 0,013 0,013 0,012 0,012 0,012 0,012 0,014 0,012 0,012 0,015 0,014 0,012 0,012 0,012 0,013 0,014
40 3 0,168 0,154
0,017 0,016 0,017 0,016 0,018 0,017 0,019 0,012 0,015 0,017 0,015 0,018 0,016 0,015 0,014 0,018 0,016 0,017 0,018 0,016 0,016 0,017
37 4 0,167 0,133 0,115
0,011 0,011 0,012 0,013 0,014 0,011 0,011 0,012 0,011 0,011 0,011 0,013 0,011 0,010 0,011 0,012 0,012 0,010 0,010 0,012 0,012
64 5 0,175 0,151 0,118 0,093
0,010 0,013 0,013 0,013 0,013 0,015 0,013 0,012 0,014 0,013 0,012 0,012 0,012 0,013 0,012 0,014 0,012 0,011 0,014 0,014
60 6 0,186 0,156 0,135 0,099 0,059
0,012 0,013 0,014 0,014 0,012 0,012 0,014 0,013 0,014 0,013 0,012 0,012 0,013 0,014 0,014 0,013 0,013 0,015 0,014
28 7 0,150 0,149 0,175 0,143 0,147 0,157
0,013 0,016 0,012 0,014 0,012 0,013 0,011 0,012 0,014 0,012 0,010 0,012 0,012 0,012 0,013 0,011 0,010 0,011
53 8 0,144 0,134 0,142 0,132 0,145 0,159 0,131
0,012 0,011 0,012 0,011 0,010 0,010 0,010 0,014 0,011 0,011 0,013 0,010 0,012 0,010 0,010 0,010 0,010
51 9 0,154 0,157 0,119 0,142 0,119 0,135 0,151 0,114
0,014 0,016 0,016 0,016 0,014 0,014 0,018 0,011 0,015 0,017 0,015 0,016 0,014 0,013 0,014 0,015
10 10 0,136 0,135 0,151 0,138 0,146 0,149 0,125 0,128 0,134
0,009 0,011 0,009 0,009 0,010 0,011 0,010 0,011 0,010 0,010 0,011 0,010 0,009 0,009 0,009
25 11 0,145 0,143 0,140 0,136 0,134 0,144 0,137 0,126 0,121 0,119
0,010 0,012 0,010 0,009 0,012 0,010 0,013 0,012 0,011 0,012 0,010 0,011 0,010 0,012
33 12 0,146 0,150 0,143 0,151 0,166 0,162 0,134 0,138 0,141 0,128 0,133
0,011 0,009 0,012 0,012 0,009 0,011 0,012 0,010 0,010 0,011 0,011 0,010 0,011
22 13 0,136 0,134 0,131 0,127 0,132 0,145 0,124 0,113 0,124 0,113 0,110 0,133
0,011 0,011 0,011 0,010 0,010 0,011 0,012 0,010 0,011 0,010 0,010 0,012
26 14 0,137 0,130 0,154 0,131 0,146 0,146 0,122 0,133 0,130 0,122 0,131 0,125 0,118
0,009 0,010 0,009 0,011 0,011 0,009 0,010 0,009 0,008 0,008 0,009
52 15 0,139 0,138 0,166 0,152 0,164 0,166 0,127 0,131 0,131 0,110 0,120 0,131 0,117 0,120
0,011 0,010 0,010 0,009 0,010 0,010 0,012 0,008 0,009 0,009
39 16 0,145 0,138 0,157 0,154 0,154 0,168 0,129 0,140 0,133 0,129 0,124 0,147 0,124 0,122 0,145
0,010 0,012 0,012 0,012 0,011 0,011 0,012 0,011 0,012
13 17 0,134 0,128 0,140 0,137 0,142 0,161 0,118 0,107 0,114 0,104 0,110 0,113 0,101 0,109 0,096 0,103
0,009 0,011 0,010 0,009 0,010 0,010 0,010 0,010
66 18 0,144 0,134 0,143 0,139 0,154 0,161 0,122 0,124 0,138 0,121 0,130 0,123 0,113 0,113 0,121 0,117 0,099
0,010 0,011 0,010 0,009 0,011 0,011 0,012
24 19 0,146 0,133 0,148 0,133 0,142 0,153 0,119 0,128 0,140 0,123 0,134 0,117 0,112 0,112 0,116 0,128 0,106 0,112
0,009 0,011 0,009 0,009 0,009 0,012
9 20 0,136 0,136 0,142 0,139 0,149 0,158 0,119 0,120 0,125 0,111 0,122 0,117 0,111 0,103 0,124 0,142 0,099 0,100 0,101
0,010 0,012 0,010 0,010 0,010
42 21 0,143 0,147 0,174 0,154 0,170 0,174 0,127 0,120 0,138 0,119 0,128 0,111 0,110 0,107 0,111 0,112 0,097 0,113 0,106 0,104
0,009 0,009 0,011 0,012
44 22 0,138 0,151 0,172 0,141 0,148 0,154 0,135 0,132 0,140 0,117 0,116 0,129 0,117 0,118 0,121 0,125 0,116 0,120 0,108 0,114 0,113
0,011 0,010 0,010
11 23 0,140 0,137 0,144 0,138 0,145 0,160 0,123 0,131 0,126 0,114 0,116 0,130 0,109 0,118 0,117 0,128 0,099 0,112 0,117 0,116 0,103 0,112
0,009 0,010
23 24 0,137 0,143 0,161 0,144 0,164 0,170 0,122 0,127 0,131 0,108 0,121 0,124 0,116 0,112 0,114 0,123 0,100 0,107 0,114 0,107 0,101 0,112 0,106
0,010
31 25 0,137 0,141 0,150 0,143 0,150 0,165 0,119 0,117 0,124 0,110 0,124 0,119 0,112 0,110 0,108 0,112 0,097 0,112 0,113 0,104 0,103 0,102 0,100 0,091
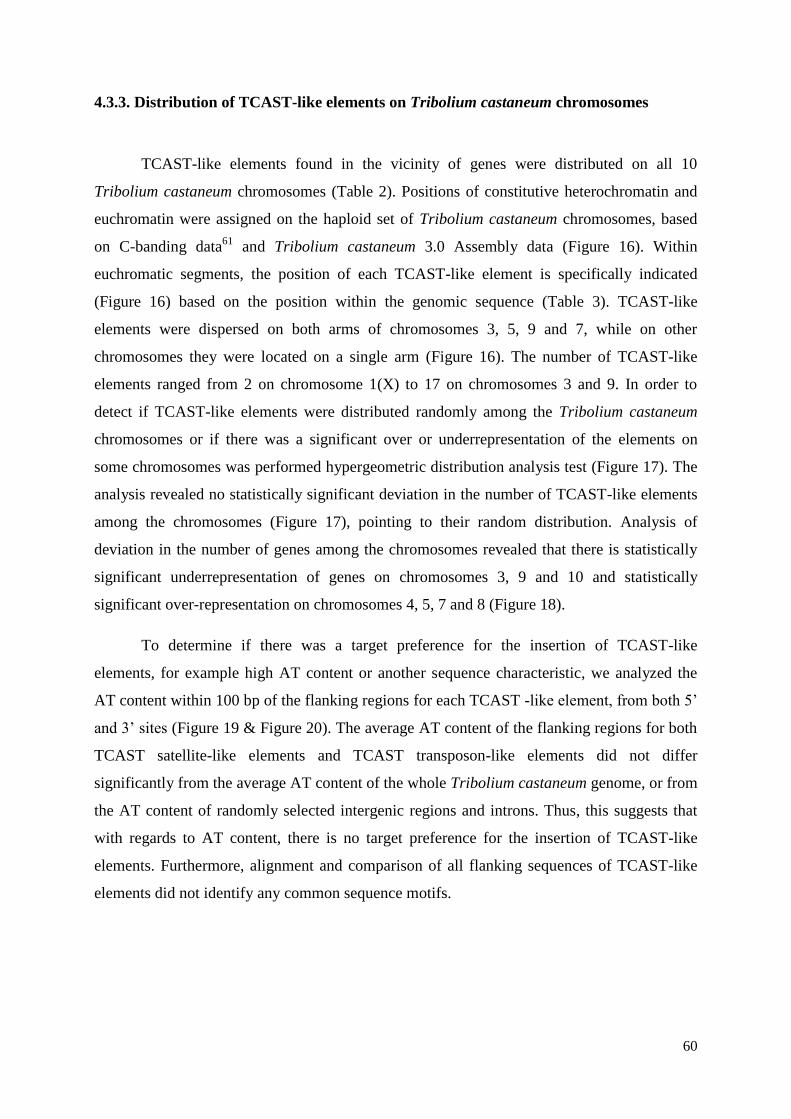
60
4.3.3. Distribution of TCAST-like elements on Tribolium castaneum chromosomes
TCAST-like elements found in the vicinity of genes were distributed on all 10
Tribolium castaneum chromosomes (Table 2). Positions of constitutive heterochromatin and
euchromatin were assigned on the haploid set of Tribolium castaneum chromosomes, based
on C-banding data61
and Tribolium castaneum 3.0 Assembly data (Figure 16). Within
euchromatic segments, the position of each TCAST-like element is specifically indicated
(Figure 16) based on the position within the genomic sequence (Table 3). TCAST-like
elements were dispersed on both arms of chromosomes 3, 5, 9 and 7, while on other
chromosomes they were located on a single arm (Figure 16). The number of TCAST-like
elements ranged from 2 on chromosome 1(X) to 17 on chromosomes 3 and 9. In order to
detect if TCAST-like elements were distributed randomly among the Tribolium castaneum
chromosomes or if there was a significant over or underrepresentation of the elements on
some chromosomes was performed hypergeometric distribution analysis test (Figure 17). The
analysis revealed no statistically significant deviation in the number of TCAST-like elements
among the chromosomes (Figure 17), pointing to their random distribution. Analysis of
deviation in the number of genes among the chromosomes revealed that there is statistically
significant underrepresentation of genes on chromosomes 3, 9 and 10 and statistically
significant over-representation on chromosomes 4, 5, 7 and 8 (Figure 18).
To determine if there was a target preference for the insertion of TCAST-like
elements, for example high AT content or another sequence characteristic, we analyzed the
AT content within 100 bp of the flanking regions for each TCAST -like element, from both 5’
and 3’ sites (Figure 19 & Figure 20). The average AT content of the flanking regions for both
TCAST satellite-like elements and TCAST transposon-like elements did not differ
significantly from the average AT content of the whole Tribolium castaneum genome, or from
the AT content of randomly selected intergenic regions and introns. Thus, this suggests that
with regards to AT content, there is no target preference for the insertion of TCAST-like
elements. Furthermore, alignment and comparison of all flanking sequences of TCAST-like
elements did not identify any common sequence motifs.
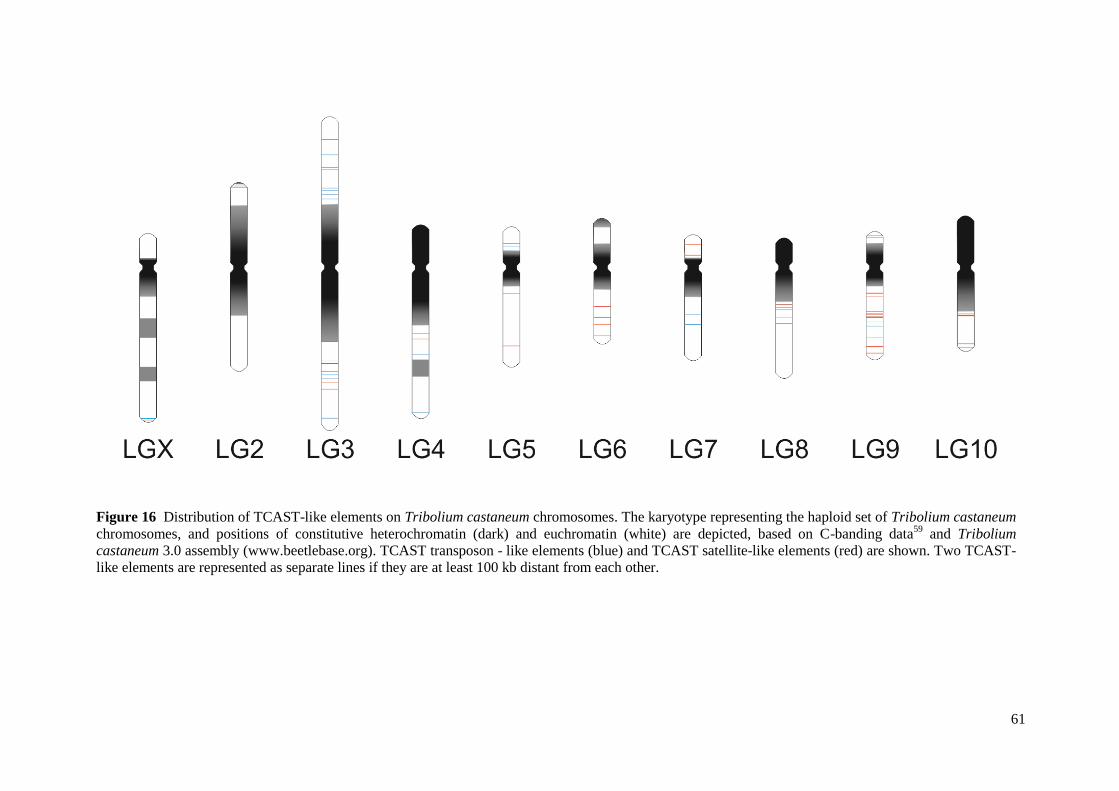
61
Figure 16 Distribution of TCAST-like elements on Tribolium castaneum chromosomes. The karyotype representing the haploid set of Tribolium castaneum
chromosomes, and positions of constitutive heterochromatin (dark) and euchromatin (white) are depicted, based on C-banding data59
and Tribolium
castaneum 3.0 assembly (www.beetlebase.org). TCAST transposon - like elements (blue) and TCAST satellite-like elements (red) are shown. Two TCAST-
like elements are represented as separate lines if they are at least 100 kb distant from each other.
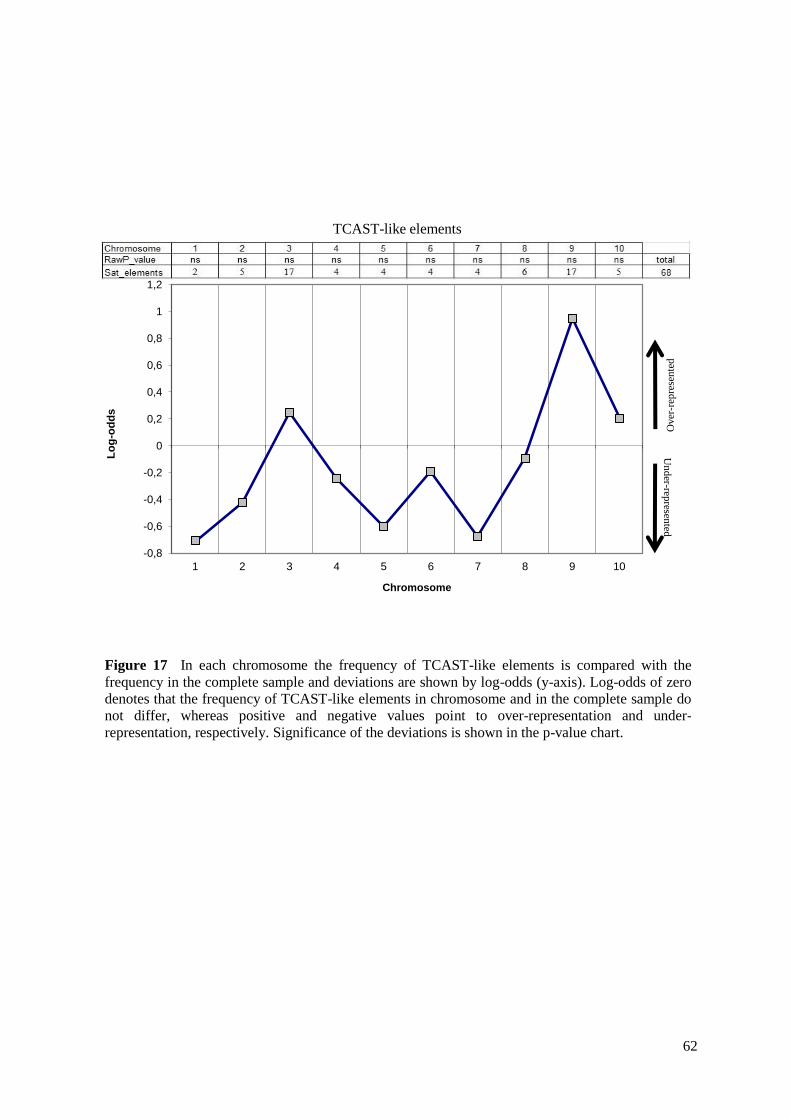
62
-0,8
-0,6
-0,4
-0,2
0
0,2
0,4
0,6
0,8
1
1,2
1 2 3 4 5 6 7 8 9 10
Lo
g-o
dd
s
Chromosome
TCAST-like elements
Over
-rep
rese
nte
d
Un
der-rep
resented
Figure 17 In each chromosome the frequency of TCAST-like elements is compared with the
frequency in the complete sample and deviations are shown by log-odds (y-axis). Log-odds of zero
denotes that the frequency of TCAST-like elements in chromosome and in the complete sample do
not differ, whereas positive and negative values point to over-representation and under-
representation, respectively. Significance of the deviations is shown in the p-value chart.
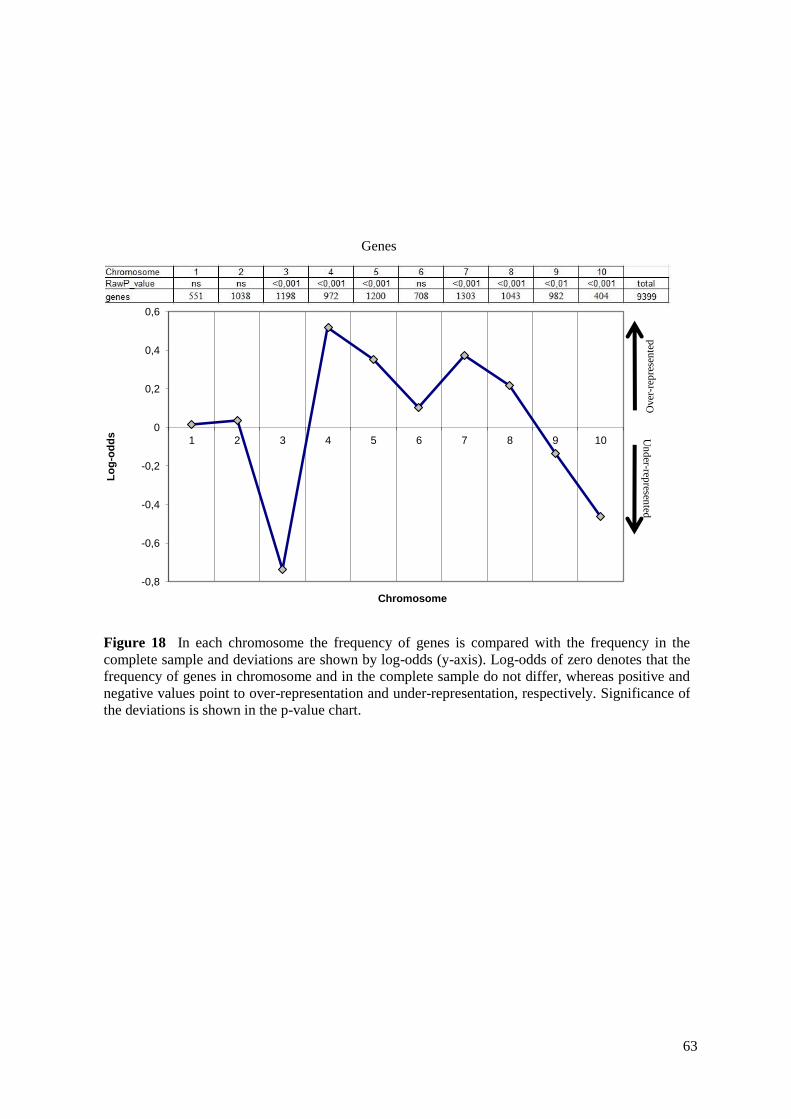
63
-0,8
-0,6
-0,4
-0,2
0
0,2
0,4
0,6
1 2 3 4 5 6 7 8 9 10
Lo
g-o
dd
s
Chromosome
Genes
Over
-rep
rese
nte
d
Un
der-rep
resented
Figure 18 In each chromosome the frequency of genes is compared with the frequency in the
complete sample and deviations are shown by log-odds (y-axis). Log-odds of zero denotes that the
frequency of genes in chromosome and in the complete sample do not differ, whereas positive and
negative values point to over-representation and under-representation, respectively. Significance of
the deviations is shown in the p-value chart.
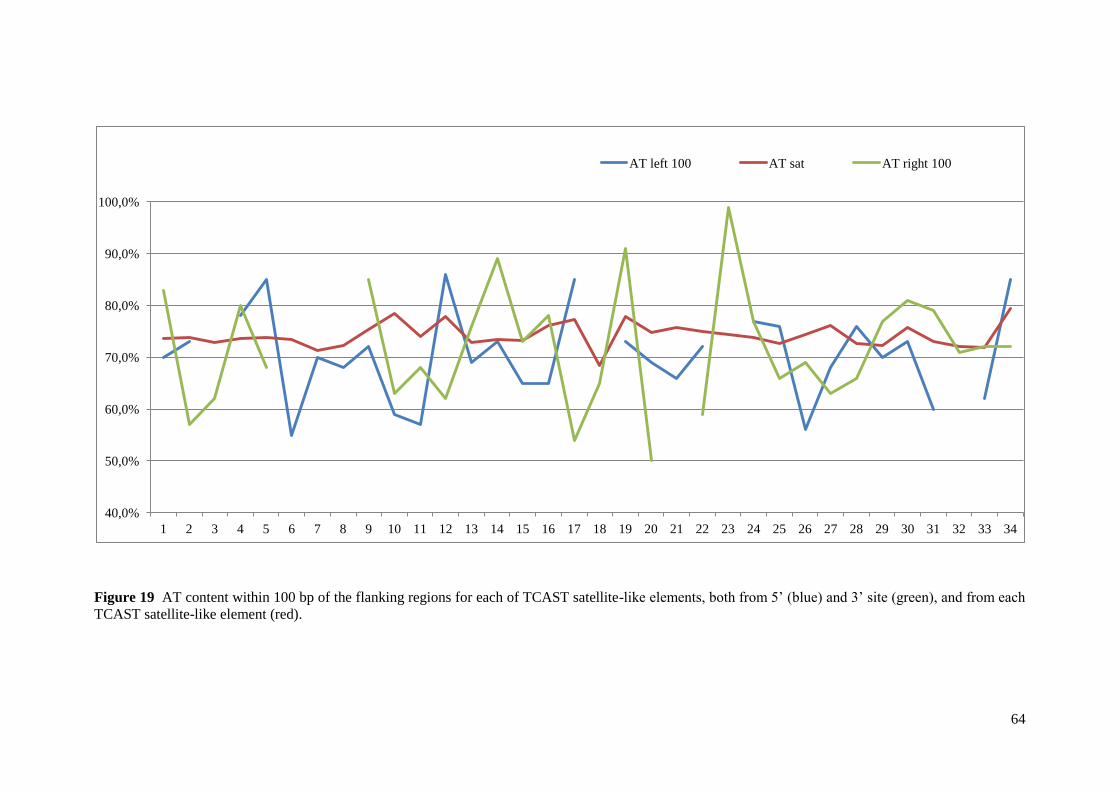
64
Figure 19 AT content within 100 bp of the flanking regions for each of TCAST satellite-like elements, both from 5’ (blue) and 3’ site (green), and from each
TCAST satellite-like element (red).
40,0%
50,0%
60,0%
70,0%
80,0%
90,0%
100,0%
1 2 3 4 5 6 7 8 9 10 11 12 13 14 15 16 17 18 19 20 21 22 23 24 25 26 27 28 29 30 31 32 33 34
AT left 100 AT sat AT right 100
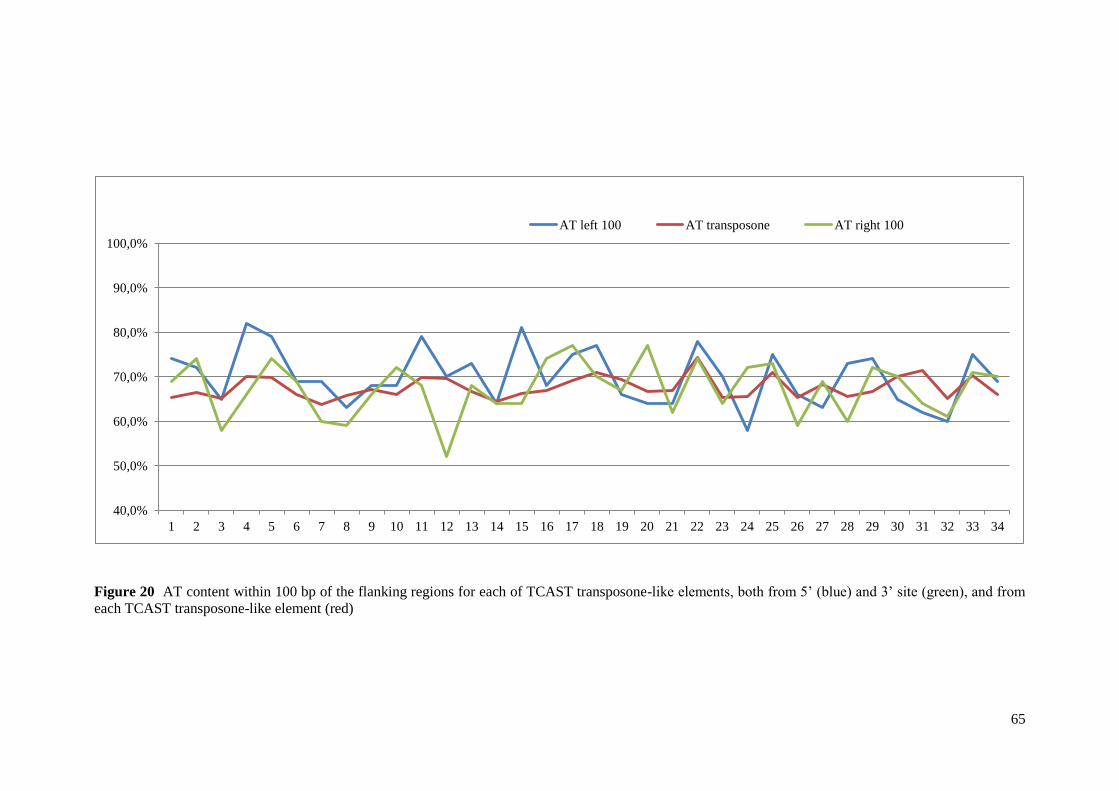
65
Figure 20 AT content within 100 bp of the flanking regions for each of TCAST transposone-like elements, both from 5’ (blue) and 3’ site (green), and from
each TCAST transposone-like element (red)
40,0%
50,0%
60,0%
70,0%
80,0%
90,0%
100,0%
1 2 3 4 5 6 7 8 9 10 11 12 13 14 15 16 17 18 19 20 21 22 23 24 25 26 27 28 29 30 31 32 33 34
AT left 100 AT transposone AT right 100
66
4.3.4. Genes in the vicinity of TCAST-like elements
Uniprot gene numbers were used as identifiers of genes located in the vicinity of
TCAST-like elements (gene names shown in Table 2). Uniprot gene numbers for homologous
genes found in Drosophila melanogaster are also indicated (Table 2). Detailed description of
the genes, including molecular function of their protein products, biological processes in
which these proteins are involved and their cellular localization (cellular component) are
shown (Table 3). Each identified gene is assigned to a particular TCAST-like element within
its vicinity, and the precise position of TCAST-like elements in genomic sequence (start and
end site) is indicated (Table 3). Functional analysis revealed that 17 out of 101 genes
correspond to putative uncharacterized proteins, while the remaining genes are involved in
different molecular functions and diverse biological processes. Among the proteins, a
proportion are characterized by ATP binding activity (13 proteins) and involvement in protein
phosphorylation and /or signal transduction (9 proteins) (Table 3).
To determine if TCAST-like elements are distributed randomly relative to genes, or if
they are overrepresented near specific groups of genes, we used GeneCodis 2.0 and Fatigo to
provide a statistical representation of the genes associated with TCAST-like elements52,53
. As
many genes are still not annotated in Tribolium castaneum and furthermore Tribolium
castaneum genomic data are not included in GeneCodis, we used gene numbers for
orthologous genes from Drosophila melanogaster for the analysis, and compared them with
the whole set of 14 869 genes annotated in Drosophila melanogaster. Genecodis analysis
revealed that TCAST-like elements are located near 9 genes characterized as members of the
immunoglobulin protein superfamily (Table 7 & Table 8). Since there are only 133
immunoglobulin-like genes present within the total set of Drosophila melanogaster genes,
random distribution of TCAST-like elements would result in their occurrence near
approximately a single immunoglobulin-like gene. Presence of TCAST-like elements in the
vicinity of 9 immunoglobulin-like genes therefore represents a statistically significant
overrepresentation (0,00000396). All nine genes exhibit structural features of
immunoglobulin-like, immunoglobulin subtype 1 and immunoglobulin subtype 2 proteins and
are associated with the following TCAST transposon-like elements: 25 –at 3’end, 28 and 39 –
at 5’ end, 32 and 40 – within introns, and TCAST satellite-like elements: 8 – at 3’ end, 19
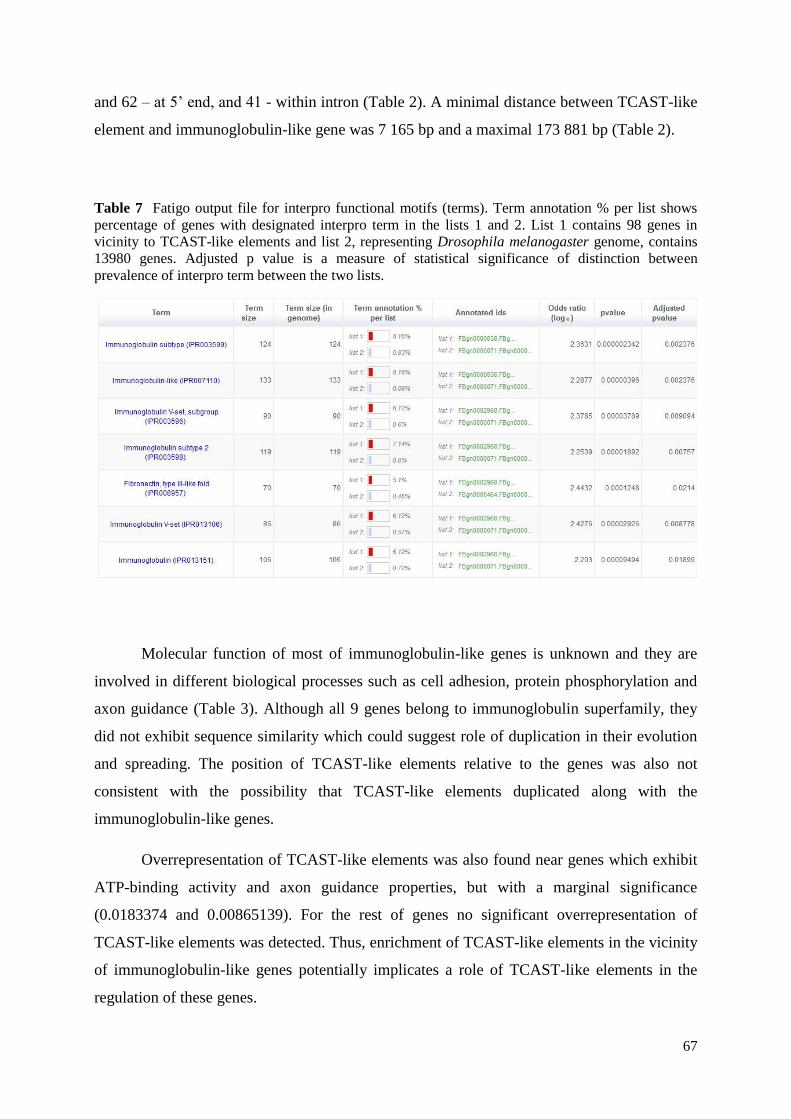
67
and 62 – at 5’ end, and 41 - within intron (Table 2). A minimal distance between TCAST-like
element and immunoglobulin-like gene was 7 165 bp and a maximal 173 881 bp (Table 2).
Table 7 Fatigo output file for interpro functional motifs (terms). Term annotation % per list shows
percentage of genes with designated interpro term in the lists 1 and 2. List 1 contains 98 genes in
vicinity to TCAST-like elements and list 2, representing Drosophila melanogaster genome, contains
13980 genes. Adjusted p value is a measure of statistical significance of distinction between
prevalence of interpro term between the two lists.
Molecular function of most of immunoglobulin-like genes is unknown and they are
involved in different biological processes such as cell adhesion, protein phosphorylation and
axon guidance (Table 3). Although all 9 genes belong to immunoglobulin superfamily, they
did not exhibit sequence similarity which could suggest role of duplication in their evolution
and spreading. The position of TCAST-like elements relative to the genes was also not
consistent with the possibility that TCAST-like elements duplicated along with the
immunoglobulin-like genes.
Overrepresentation of TCAST-like elements was also found near genes which exhibit
ATP-binding activity and axon guidance properties, but with a marginal significance
(0.0183374 and 0.00865139). For the rest of genes no significant overrepresentation of
TCAST-like elements was detected. Thus, enrichment of TCAST-like elements in the vicinity
of immunoglobulin-like genes potentially implicates a role of TCAST-like elements in the
regulation of these genes.
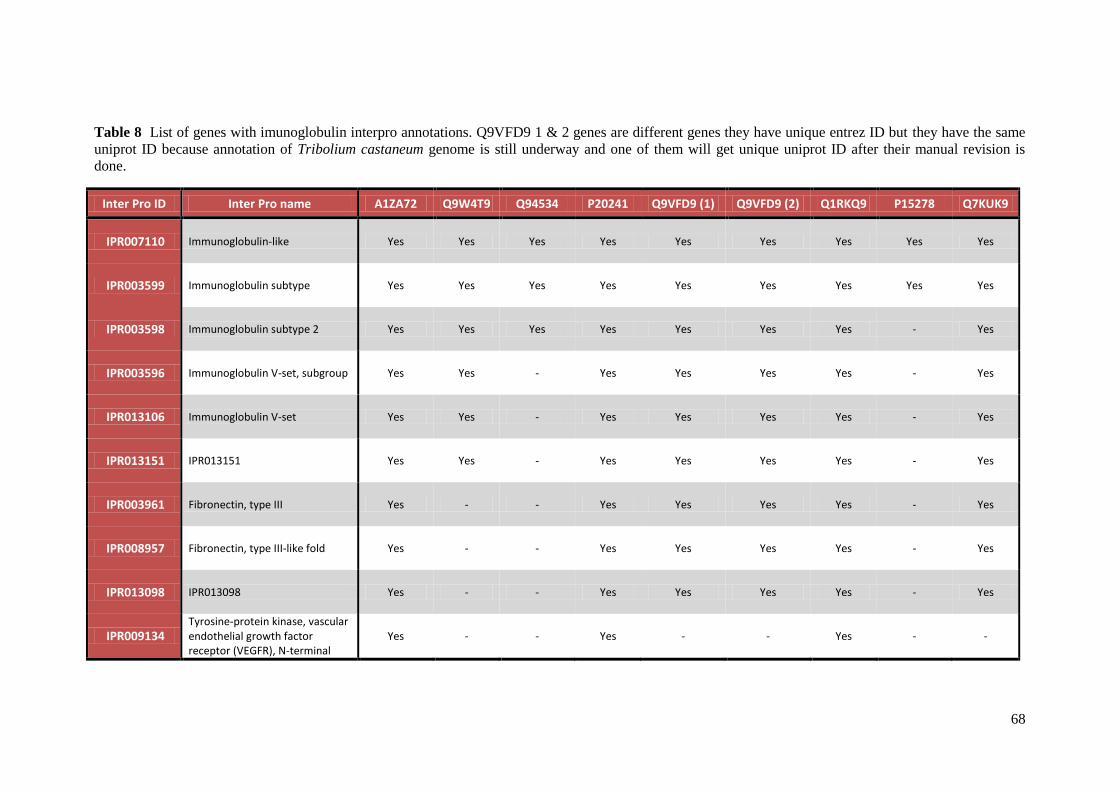
68
Table 8 List of genes with imunoglobulin interpro annotations. Q9VFD9 1 & 2 genes are different genes they have unique entrez ID but they have the same
uniprot ID because annotation of Tribolium castaneum genome is still underway and one of them will get unique uniprot ID after their manual revision is
done.
Inter Pro ID Inter Pro name A1ZA72 Q9W4T9 Q94534 P20241 Q9VFD9 (1) Q9VFD9 (2) Q1RKQ9 P15278 Q7KUK9
IPR007110 Immunoglobulin-like Yes Yes Yes Yes Yes Yes Yes Yes Yes
IPR003599 Immunoglobulin subtype Yes Yes Yes Yes Yes Yes Yes Yes Yes
IPR003598 Immunoglobulin subtype 2 Yes Yes Yes Yes Yes Yes Yes - Yes
IPR003596 Immunoglobulin V-set, subgroup Yes Yes - Yes Yes Yes Yes - Yes
IPR013106 Immunoglobulin V-set Yes Yes - Yes Yes Yes Yes - Yes
IPR013151 IPR013151 Yes Yes - Yes Yes Yes Yes - Yes
IPR003961 Fibronectin, type III Yes - - Yes Yes Yes Yes - Yes
IPR008957 Fibronectin, type III-like fold Yes - - Yes Yes Yes Yes - Yes
IPR013098 IPR013098 Yes - - Yes Yes Yes Yes - Yes
IPR009134
Tyrosine-protein kinase, vascular endothelial growth factor receptor (VEGFR), N-terminal
Yes - - Yes - - Yes - -
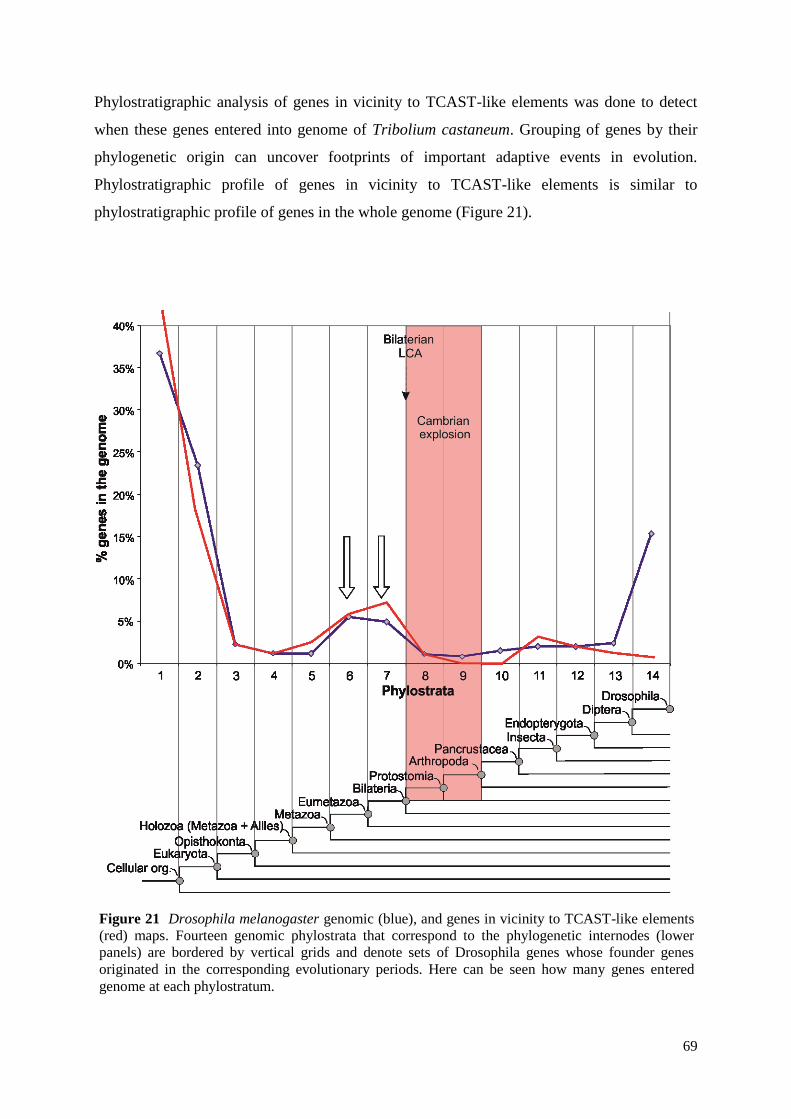
69
Phylostratigraphic analysis of genes in vicinity to TCAST-like elements was done to detect
when these genes entered into genome of Tribolium castaneum. Grouping of genes by their
phylogenetic origin can uncover footprints of important adaptive events in evolution.
Phylostratigraphic profile of genes in vicinity to TCAST-like elements is similar to
phylostratigraphic profile of genes in the whole genome (Figure 21).
Figure 21 Drosophila melanogaster genomic (blue), and genes in vicinity to TCAST-like elements
(red) maps. Fourteen genomic phylostrata that correspond to the phylogenetic internodes (lower
panels) are bordered by vertical grids and denote sets of Drosophila genes whose founder genes
originated in the corresponding evolutionary periods. Here can be seen how many genes entered
genome at each phylostratum.
70
These data point us to believe that there is no present lineage specific adaptation
whose regulation is directed by TCAST-like elements. Phylostratigraphic profile of genes in
vicinity to TCAST-like elements differs from Drosophila melanogaster genomic profile only
in the 14th
phylostratum. This difference is expected because genes in the 14th
phylostratum
are Drosophila melanogaster specific and there are no Tribolium castaneum orthologs in this
phylostratum present. If we assume that all non orthologous genes fall into 14th phylostratum
even this difference disappears and in both cases ≈ 15% of genes fall in the 14th phylostratum
(Table 9).
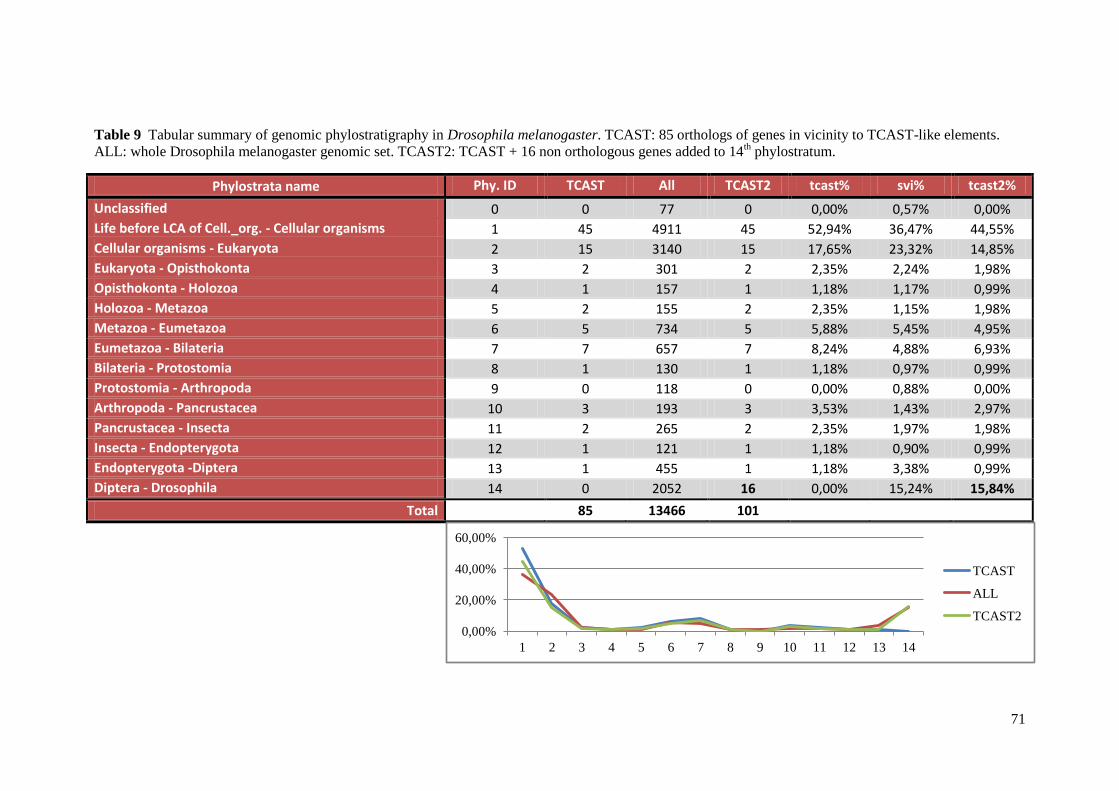
71
Table 9 Tabular summary of genomic phylostratigraphy in Drosophila melanogaster. TCAST: 85 orthologs of genes in vicinity to TCAST-like elements.
ALL: whole Drosophila melanogaster genomic set. TCAST2: TCAST + 16 non orthologous genes added to 14th phylostratum.
Phylostrata name Phy. ID TCAST All TCAST2 tcast% svi% tcast2%
Unclassified 0 0 77 0 0,00% 0,57% 0,00%
Life before LCA of Cell._org. - Cellular organisms 1 45 4911 45 52,94% 36,47% 44,55%
Cellular organisms - Eukaryota 2 15 3140 15 17,65% 23,32% 14,85%
Eukaryota - Opisthokonta 3 2 301 2 2,35% 2,24% 1,98%
Opisthokonta - Holozoa 4 1 157 1 1,18% 1,17% 0,99%
Holozoa - Metazoa 5 2 155 2 2,35% 1,15% 1,98%
Metazoa - Eumetazoa 6 5 734 5 5,88% 5,45% 4,95%
Eumetazoa - Bilateria 7 7 657 7 8,24% 4,88% 6,93%
Bilateria - Protostomia 8 1 130 1 1,18% 0,97% 0,99%
Protostomia - Arthropoda 9 0 118 0 0,00% 0,88% 0,00%
Arthropoda - Pancrustacea 10 3 193 3 3,53% 1,43% 2,97%
Pancrustacea - Insecta 11 2 265 2 2,35% 1,97% 1,98%
Insecta - Endopterygota 12 1 121 1 1,18% 0,90% 0,99%
Endopterygota -Diptera 13 1 455 1 1,18% 3,38% 0,99%
Diptera - Drosophila 14 0 2052 16 0,00% 15,24% 15,84%
Total
85 13466 101
0,00%
20,00%
40,00%
60,00%
1 2 3 4 5 6 7 8 9 10 11 12 13 14
TCAST
ALL
TCAST2
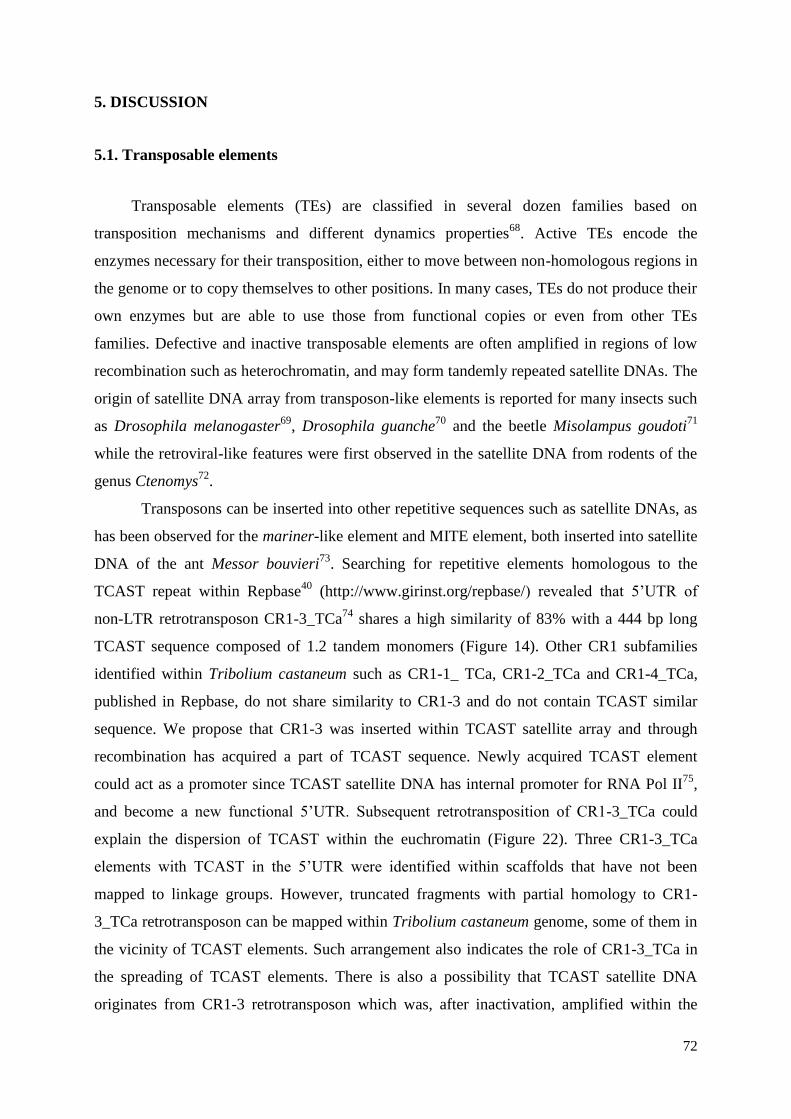
72
5. DISCUSSION
5.1. Transposable elements
Transposable elements (TEs) are classified in several dozen families based on
transposition mechanisms and different dynamics properties68
. Active TEs encode the
enzymes necessary for their transposition, either to move between non-homologous regions in
the genome or to copy themselves to other positions. In many cases, TEs do not produce their
own enzymes but are able to use those from functional copies or even from other TEs
families. Defective and inactive transposable elements are often amplified in regions of low
recombination such as heterochromatin, and may form tandemly repeated satellite DNAs. The
origin of satellite DNA array from transposon-like elements is reported for many insects such
as Drosophila melanogaster69
, Drosophila guanche70
and the beetle Misolampus goudoti71
while the retroviral-like features were first observed in the satellite DNA from rodents of the
genus Ctenomys72
.
Transposons can be inserted into other repetitive sequences such as satellite DNAs, as
has been observed for the mariner-like element and MITE element, both inserted into satellite
DNA of the ant Messor bouvieri73
. Searching for repetitive elements homologous to the
TCAST repeat within Repbase40
(http://www.girinst.org/repbase/) revealed that 5’UTR of
non-LTR retrotransposon CR1-3_TCa74
shares a high similarity of 83% with a 444 bp long
TCAST sequence composed of 1.2 tandem monomers (Figure 14). Other CR1 subfamilies
identified within Tribolium castaneum such as CR1-1_ TCa, CR1-2_TCa and CR1-4_TCa,
published in Repbase, do not share similarity to CR1-3 and do not contain TCAST similar
sequence. We propose that CR1-3 was inserted within TCAST satellite array and through
recombination has acquired a part of TCAST sequence. Newly acquired TCAST element
could act as a promoter since TCAST satellite DNA has internal promoter for RNA Pol II75
,
and become a new functional 5’UTR. Subsequent retrotransposition of CR1-3_TCa could
explain the dispersion of TCAST within the euchromatin (Figure 22). Three CR1-3_TCa
elements with TCAST in the 5’UTR were identified within scaffolds that have not been
mapped to linkage groups. However, truncated fragments with partial homology to CR1-
3_TCa retrotransposon can be mapped within Tribolium castaneum genome, some of them in
the vicinity of TCAST elements. Such arrangement also indicates the role of CR1-3_TCa in
the spreading of TCAST elements. There is also a possibility that TCAST satellite DNA
originates from CR1-3 retrotransposon which was, after inactivation, amplified within the
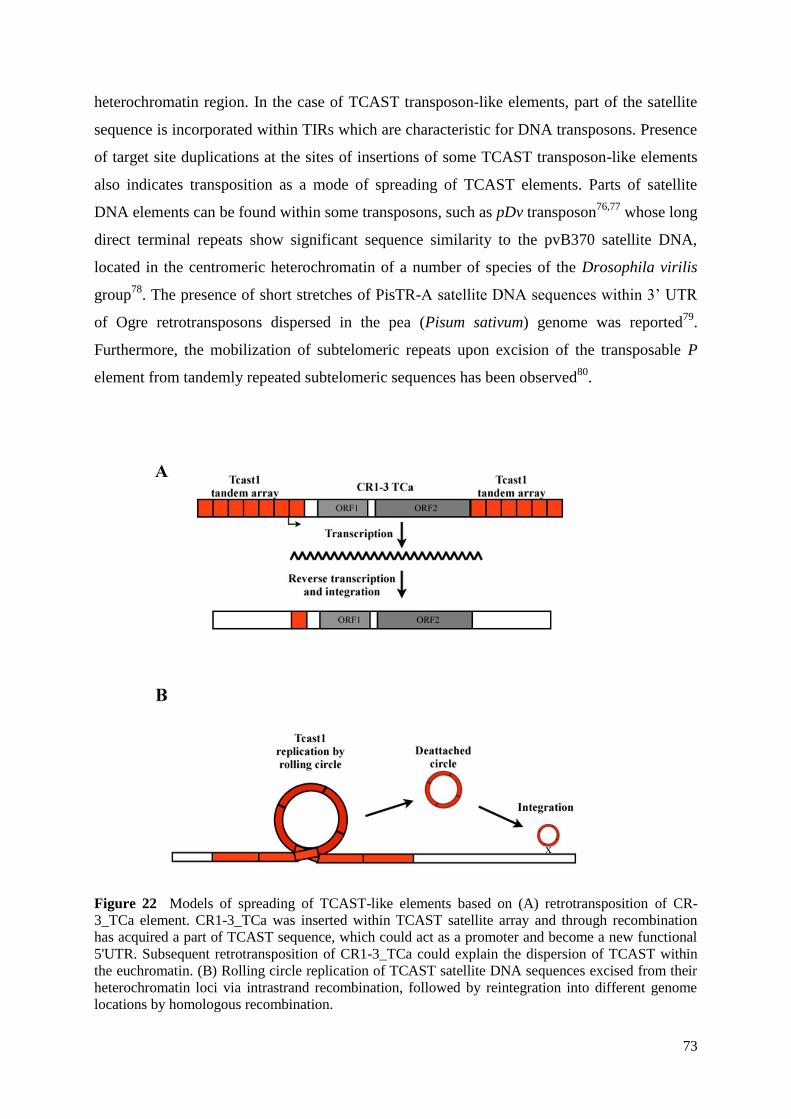
73
heterochromatin region. In the case of TCAST transposon-like elements, part of the satellite
sequence is incorporated within TIRs which are characteristic for DNA transposons. Presence
of target site duplications at the sites of insertions of some TCAST transposon-like elements
also indicates transposition as a mode of spreading of TCAST elements. Parts of satellite
DNA elements can be found within some transposons, such as pDv transposon76,77
whose long
direct terminal repeats show significant sequence similarity to the pvB370 satellite DNA,
located in the centromeric heterochromatin of a number of species of the Drosophila virilis
group78
. The presence of short stretches of PisTR-A satellite DNA sequences within 3’ UTR
of Ogre retrotransposons dispersed in the pea (Pisum sativum) genome was reported79
.
Furthermore, the mobilization of subtelomeric repeats upon excision of the transposable P
element from tandemly repeated subtelomeric sequences has been observed80
.
Figure 22 Models of spreading of TCAST-like elements based on (A) retrotransposition of CR-
3_TCa element. CR1-3_TCa was inserted within TCAST satellite array and through recombination
has acquired a part of TCAST sequence, which could act as a promoter and become a new functional
5'UTR. Subsequent retrotransposition of CR1-3_TCa could explain the dispersion of TCAST within
the euchromatin. (B) Rolling circle replication of TCAST satellite DNA sequences excised from their
heterochromatin loci via intrastrand recombination, followed by reintegration into different genome
locations by homologous recombination.
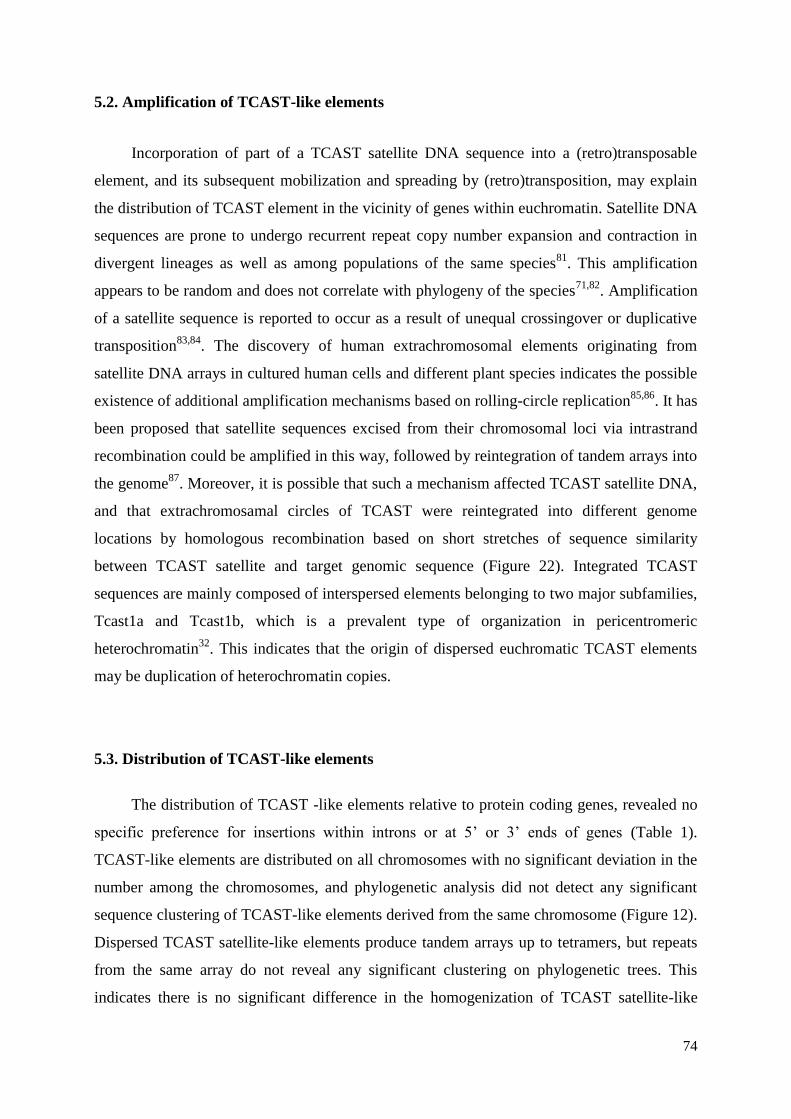
74
5.2. Amplification of TCAST-like elements
Incorporation of part of a TCAST satellite DNA sequence into a (retro)transposable
element, and its subsequent mobilization and spreading by (retro)transposition, may explain
the distribution of TCAST element in the vicinity of genes within euchromatin. Satellite DNA
sequences are prone to undergo recurrent repeat copy number expansion and contraction in
divergent lineages as well as among populations of the same species81
. This amplification
appears to be random and does not correlate with phylogeny of the species71,82
. Amplification
of a satellite sequence is reported to occur as a result of unequal crossingover or duplicative
transposition83,84
. The discovery of human extrachromosomal elements originating from
satellite DNA arrays in cultured human cells and different plant species indicates the possible
existence of additional amplification mechanisms based on rolling-circle replication85,86
. It has
been proposed that satellite sequences excised from their chromosomal loci via intrastrand
recombination could be amplified in this way, followed by reintegration of tandem arrays into
the genome87
. Moreover, it is possible that such a mechanism affected TCAST satellite DNA,
and that extrachromosamal circles of TCAST were reintegrated into different genome
locations by homologous recombination based on short stretches of sequence similarity
between TCAST satellite and target genomic sequence (Figure 22). Integrated TCAST
sequences are mainly composed of interspersed elements belonging to two major subfamilies,
Tcast1a and Tcast1b, which is a prevalent type of organization in pericentromeric
heterochromatin32
. This indicates that the origin of dispersed euchromatic TCAST elements
may be duplication of heterochromatin copies.
5.3. Distribution of TCAST-like elements
The distribution of TCAST -like elements relative to protein coding genes, revealed no
specific preference for insertions within introns or at 5’ or 3’ ends of genes (Table 1).
TCAST-like elements are distributed on all chromosomes with no significant deviation in the
number among the chromosomes, and phylogenetic analysis did not detect any significant
sequence clustering of TCAST-like elements derived from the same chromosome (Figure 12).
Dispersed TCAST satellite-like elements produce tandem arrays up to tetramers, but repeats
from the same array do not reveal any significant clustering on phylogenetic trees. This
indicates there is no significant difference in the homogenization of TCAST satellite-like
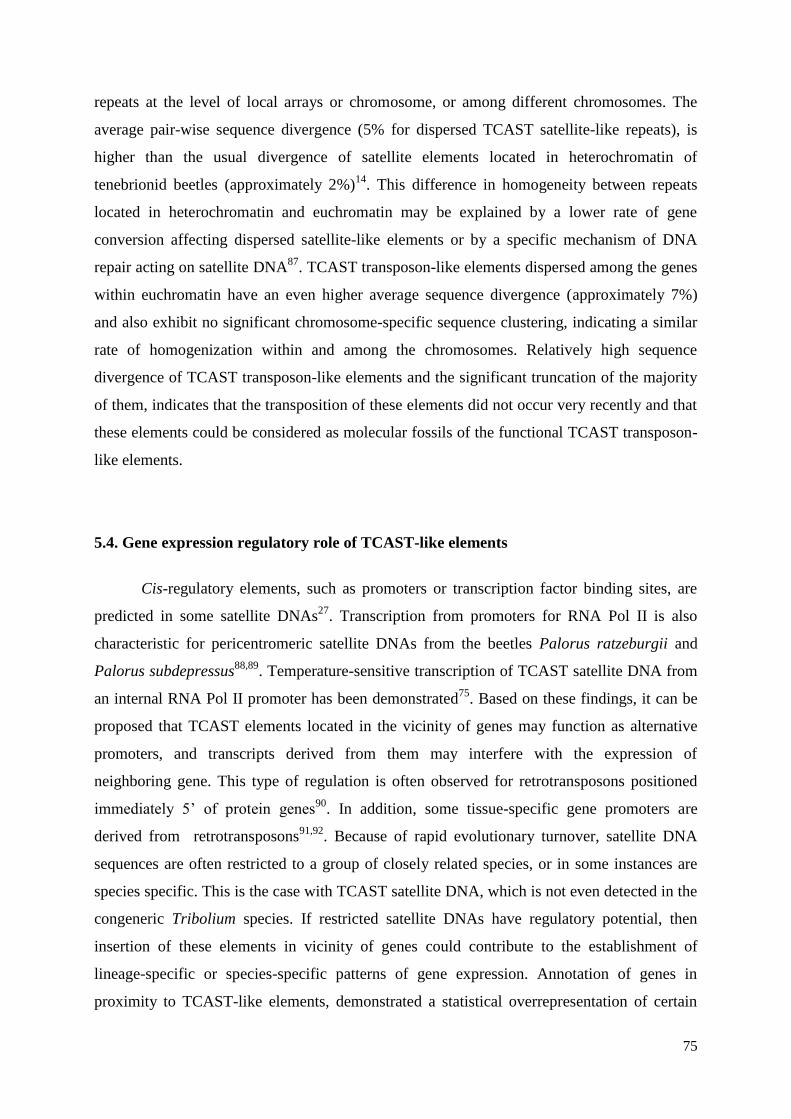
75
repeats at the level of local arrays or chromosome, or among different chromosomes. The
average pair-wise sequence divergence (5% for dispersed TCAST satellite-like repeats), is
higher than the usual divergence of satellite elements located in heterochromatin of
tenebrionid beetles (approximately 2%)14
. This difference in homogeneity between repeats
located in heterochromatin and euchromatin may be explained by a lower rate of gene
conversion affecting dispersed satellite-like elements or by a specific mechanism of DNA
repair acting on satellite DNA87
. TCAST transposon-like elements dispersed among the genes
within euchromatin have an even higher average sequence divergence (approximately 7%)
and also exhibit no significant chromosome-specific sequence clustering, indicating a similar
rate of homogenization within and among the chromosomes. Relatively high sequence
divergence of TCAST transposon-like elements and the significant truncation of the majority
of them, indicates that the transposition of these elements did not occur very recently and that
these elements could be considered as molecular fossils of the functional TCAST transposon-
like elements.
5.4. Gene expression regulatory role of TCAST-like elements
Cis-regulatory elements, such as promoters or transcription factor binding sites, are
predicted in some satellite DNAs27
. Transcription from promoters for RNA Pol II is also
characteristic for pericentromeric satellite DNAs from the beetles Palorus ratzeburgii and
Palorus subdepressus88,89
. Temperature-sensitive transcription of TCAST satellite DNA from
an internal RNA Pol II promoter has been demonstrated75
. Based on these findings, it can be
proposed that TCAST elements located in the vicinity of genes may function as alternative
promoters, and transcripts derived from them may interfere with the expression of
neighboring gene. This type of regulation is often observed for retrotransposons positioned
immediately 5’ of protein genes90
. In addition, some tissue-specific gene promoters are
derived from retrotransposons91,92
. Because of rapid evolutionary turnover, satellite DNA
sequences are often restricted to a group of closely related species, or in some instances are
species specific. This is the case with TCAST satellite DNA, which is not even detected in the
congeneric Tribolium species. If restricted satellite DNAs have regulatory potential, then
insertion of these elements in vicinity of genes could contribute to the establishment of
lineage-specific or species-specific patterns of gene expression. Annotation of genes in
proximity to TCAST-like elements, demonstrated a statistical overrepresentation of certain
76
groups of genes, for example, those with immunoglobulin-like domains. Recently, in the fish
Salvelinus fontinalis, a regulatory role of a 32 bp satellite repeat, located in an intron of the
major histocompatibility complex gene (MHIIβ), on MHIIβ gene expression was
demonstrated93
. The level of gene expression depends on temperature, as well as the number
of satellite repeats, and indicates a role for temperature-sensitive satellite DNA in gene
regulation of the adaptive immune response. Further studies are necessary to determine if
TCAST-like elements exhibit a potential regulatory role on nearby genes. The transcriptional
potential of satellite DNAs as well as their distribution close to protein-coding genes, as
shown in this study, provides strong support, that in addition to transposons, satellite DNAs
represent a rich source for the assembly of gene regulatory systems.
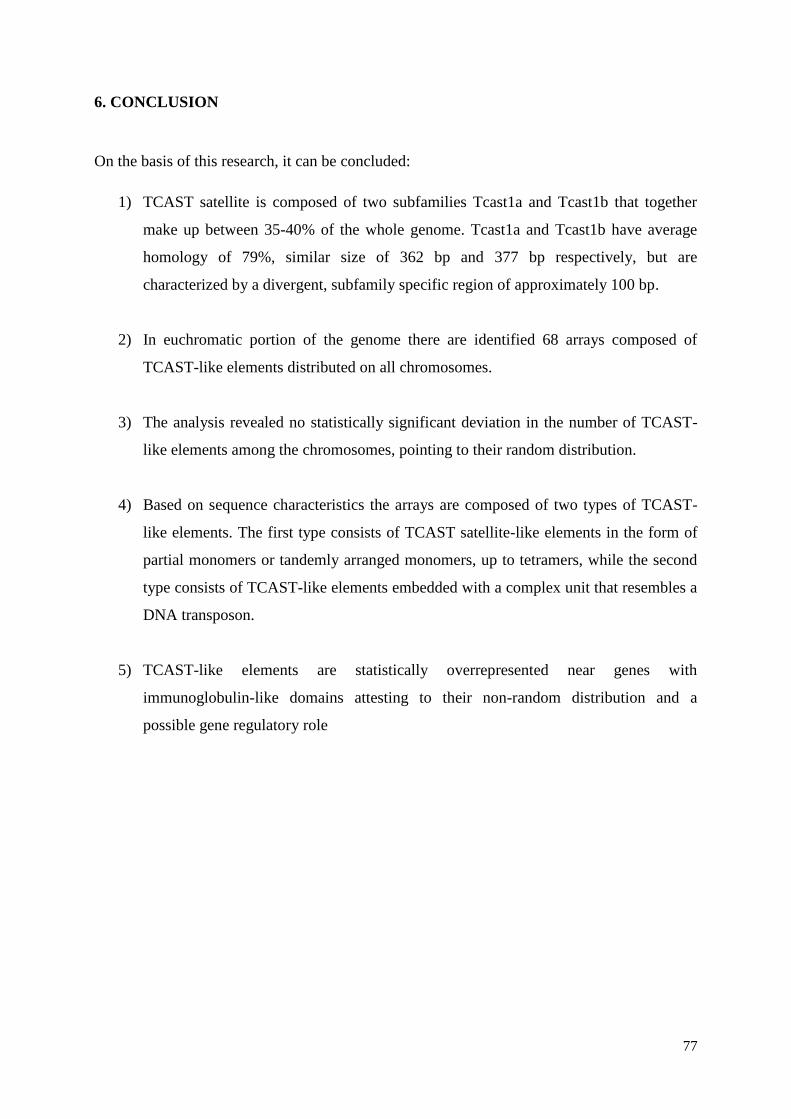
77
6. CONCLUSION
On the basis of this research, it can be concluded:
1) TCAST satellite is composed of two subfamilies Tcast1a and Tcast1b that together
make up between 35-40% of the whole genome. Tcast1a and Tcast1b have average
homology of 79%, similar size of 362 bp and 377 bp respectively, but are
characterized by a divergent, subfamily specific region of approximately 100 bp.
2) In euchromatic portion of the genome there are identified 68 arrays composed of
TCAST-like elements distributed on all chromosomes.
3) The analysis revealed no statistically significant deviation in the number of TCAST-
like elements among the chromosomes, pointing to their random distribution.
4) Based on sequence characteristics the arrays are composed of two types of TCAST-
like elements. The first type consists of TCAST satellite-like elements in the form of
partial monomers or tandemly arranged monomers, up to tetramers, while the second
type consists of TCAST-like elements embedded with a complex unit that resembles a
DNA transposon.
5) TCAST-like elements are statistically overrepresented near genes with
immunoglobulin-like domains attesting to their non-random distribution and a
possible gene regulatory role
78
7. REFERENCES
1. Hinton, H. E. A Synopsis of the Genus Tribolium Macleay, with some Remarks on the Evolution of
its Species-groups (Coleoptera, Tenebrionidae). Bulletin of Entomological Research 39, 13–55
(1948).
2. Howe, R. W. The effect of temperature and humidity on the rate of development and mortality of
Tribolium castaneum (Herbst) (coleoptera, tenebrionidae). Annals of Applied Biology 44, 356–368
(1956).
3. Brown, S. J., Denell, R. E. & Beeman, R. W. Beetling around the genome. Genet. Res. 82, 155–161
(2003).
4. Tomoyasu, Y. & Denell, R. E. Larval RNAi in Tribolium (Coleoptera) for analyzing adult
development. Dev. Genes Evol. 214, 575–578 (2004).
5. Bucher, G., Scholten, J. & Klingler, M. Parental RNAi in Tribolium (Coleoptera). Curr. Biol. 12,
R85–86 (2002).
6. Brown, S. J., Mahaffey, J. P., Lorenzen, M. D., Denell, R. E. & Mahaffey, J. W. Using RNAi to
investigate orthologous homeotic gene function during development of distantly related insects.
Evol. Dev. 1, 11–15 (1999).
7. Lorenzen, M. D. et al. Genetic Linkage Maps of the Red Flour Beetle, Tribolium castaneum, Based
on Bacterial Artificial Chromosomes and Expressed Sequence Tags. Genetics 170, 741–747
(2005).
8. Brown, S. et al. Implications of the Tribolium Deformed mutant phenotype for the evolution of
Hox gene function. PNAS 97, 4510–4514 (2000).
9. Lorenzen, M. D. et al. piggyBac-mediated germline transformation in the beetle Tribolium
castaneum. Insect Mol. Biol. 12, 433–440 (2003).
10. Richards, S. et al. The genome of the model beetle and pest Tribolium castaneum. Nature 452,
949–955 (2008).
11. Savard, J., Tautz, D. & Lercher, M. J. Genome-wide acceleration of protein evolution in flies
(Diptera). BMC Evolutionary Biology 6, 7 (2006).
12. Charlesworth, B., Sniegowski, P. & Stephan, W. The evolutionary dynamics of repetitive
DNA in eukaryotes. , Published online: 15 September 1994; | doi:10.1038/371215a0 371, 215–220
(1994).
13. Ugarković, D. & Plohl, M. Variation in satellite DNA profiles--causes and effects. EMBO J.
21, 5955–5959 (2002).
14. Ugarković, D., Podnar, M. & Plohl, M. Satellite DNA of the red flour beetle Tribolium
castaneum--comparative study of satellites from the genus Tribolium. Mol Biol Evol 13, 1059–1066
(1996).
15. Palomeque, T. & Lorite, P. Satellite DNA in insects: a review. Heredity (Edinb) 100, 564–573
(2008).
16. Krzywinski, J., Sangaré, D. & Besansky, N. J. Satellite DNA from the Y chromosome of the
malaria vector Anopheles gambiae. Genetics 169, 185–196 (2005).
17. Henikoff, S., Ahmad, K. & Malik, H. S. The Centromere Paradox: Stable Inheritance with
Rapidly Evolving DNA. Science 293, 1098–1102 (2001).
18. Talbert, P. B., Bryson, T. D. & Henikoff, S. Adaptive evolution of centromere proteins in
plants and animals. Journal of Biology 3, 18 (2004).
19. Plohl, Mestrovic, Bruvo & Ugarkovic Similarity of structural features and evolution of
satellite DNAs from palorus subdepressus (Coleoptera) and related species. J. Mol. Evol. 46, 234–
239 (1998).
20. Mestrović, N., Plohl, M., Mravinac, B. & Ugarković, D. Evolution of satellite DNAs from the
genus Palorus--experimental evidence for the ‘library’ hypothesis. Mol Biol Evol 15, 1062–1068
(1998).
21. Dover, G. Molecular drive. Trends Genet. 18, 587–589 (2002).
22. King, L. M. & Cummings, M. P. Satellite DNA repeat sequence variation is low in three
species of burying beetles in the genus Nicrophorus (Coleoptera: Silphidae). Mol. Biol. Evol. 14,
1088–1095 (1997).
79
23. Hall, S. E., Kettler, G. & Preuss, D. Centromere satellites from Arabidopsis populations:
maintenance of conserved and variable domains. Genome Res. 13, 195–205 (2003).
24. Mravinac, B., Plohl, M. & Ugarković, D. Preservation and high sequence conservation of
satellite DNAs suggest functional constraints. J. Mol. Evol. 61, 542–550 (2005).
25. Ugarkovic, D. Functional elements residing within satellite DNAs. EMBO Rep 6, 1035–1039
(2005).
26. Lobov, I. B., Tsutsui, K., Mitchell, A. R. & Podgornaya, O. I. Specificity of SAF-A and lamin
B binding in vitro correlates with the satellite DNA bending state. J. Cell. Biochem. 83, 218–229
(2001).
27. Pezer, Z., Brajković, J., Feliciello, I. & Ugarković, D. Transcription of Satellite DNAs in
Insects. Prog. Mol. Subcell. Biol. 51, 161–178 (2011).
28. Vourc’h, C. & Biamonti, G. Transcription of Satellite DNAs in Mammals. Long Non-Coding
RNAs 51, 95–118 (2011).
29. Pezer, Z. & Ugarković, D. Role of non-coding RNA and heterochromatin in aneuploidy and
cancer. Semin. Cancer Biol. 18, 123–130 (2008).
30. Plohl, M., Lucijanić-Justić, V., Ugarković, D., Petitpierre, E. & Juan, C. Satellite DNA and
heterochromatin of the flour beetle Tribolium confusum. Genome 36, 467–475 (1993).
31. Mravinac, B., Plohl, M. & Ugarković, D. Conserved patterns in the evolution of Tribolium
satellite DNAs. Gene 332, 169–177 (2004).
32. Feliciello, I., Chinali, G. & Ugarković, Đ. Structure and population dynamics of the major
satellite DNA in the red flour beetle Tribolium castaneum. Genetica 139, 999–1008 (2011).
33. Kaminker, J. S. et al. The transposable elements of the Drosophila melanogaster euchromatin:
a genomics perspective. Genome Biology 3, research0084 (2002).
34. Wang, S., Lorenzen, M. D., Beeman, R. W. & Brown, S. J. Analysis of repetitive DNA
distribution patterns in the Tribolium castaneum genome. Genome Biology 9, R61 (2008).
35. Britten, R. & Davidson, E. Repetitive and non-repetitive {DNA} sequences and a speculation
on the origins of evolutionary novelty. The Quarterly Review of Biology 46, 111–138 (1971).
36. Feschotte, C. Transposable elements and the evolution of regulatory networks. Nat. Rev.
Genet. 9, 397–405 (2008).
37. Lowe, C. B., Bejerano, G. & Haussler, D. Thousands of human mobile element fragments
undergo strong purifying selection near developmental genes. PNAS 104, 8005–8010 (2007).
38. Kuhn, G. C. S., Küttler, H., Moreira-Filho, O. & Heslop-Harrison, J. S. The 1.688 repetitive
DNA of Drosophila: Concerted evolution at different genomic scales and association with genes.
Molecular Biology and Evolution (2011).at
<http://mbe.oxfordjournals.org/content/early/2011/06/28/molbev.msr173.abstract>
39. Altschul, S. F. et al. Gapped BLAST and PSI-BLAST: a new generation of protein database
search programs. Nucleic Acids Res 25, 3389–3402 (1997).
40. Kohany, O., Gentles, A. J., Hankus, L. & Jurka, J. Annotation, submission and screening of
repetitive elements in Repbase: RepbaseSubmitter and Censor. BMC Bioinformatics 7, 474 (2006).
41. Hall, T. BioEdit: a user-friendly biological sequence alignment editor and analysis program
for Windows 95/98/NT. Nucleic Acids Symposium Series 41, 95–98 (1999).
42. Zuker, M. Mfold web server for nucleic acid folding and hybridization prediction. Nucleic
Acids Research 31, 3406 –3415 (2003).
43. Edgar, R. C. MUSCLE: multiple sequence alignment with high accuracy and high throughput.
Nucl. Acids Res. 32, 1792–1797 (2004).
44. Talavera, G. & Castresana, J. Improvement of phylogenies after removing divergent and
ambiguously aligned blocks from protein sequence alignments. Syst. Biol. 56, 564–577 (2007).
45. Posada, D. jModelTest: Phylogenetic Model Averaging. Mol Biol Evol 25, 1253–1256 (2008).
46. Guindon, S. & Gascuel, O. A simple, fast, and accurate algorithm to estimate large
phylogenies by maximum likelihood. Syst. Biol. 52, 696–704 (2003).
47. Huelsenbeck, J. P. & Ronquist, F. MRBAYES: Bayesian inference of phylogenetic trees.
Bioinformatics 17, 754–755 (2001).
48. Tamura, K. et al. MEGA5: molecular evolutionary genetics analysis using maximum
likelihood, evolutionary distance, and maximum parsimony methods. Mol. Biol. Evol. 28, 2731–
2739 (2011).
80
49. Waterhouse, R. M., Zdobnov, E. M., Tegenfeldt, F., Li, J. & Kriventseva, E. V. OrthoDB: the
hierarchical catalog of eukaryotic orthologs in 2011. Nucleic Acids Res. 39, D283–288 (2011).
50. The UniProt Consortium Reorganizing the protein space at the Universal Protein Resource
(UniProt). Nucleic Acids Research 40, D71–D75 (2011).
51. Ashburner, M. et al. Gene Ontology: tool for the unification of biology. Nature Genetics 25,
25–29 (2000).
52. Nogales-Cadenas, R. et al. GeneCodis: interpreting gene lists through enrichment analysis and
integration of diverse biological information. Nucleic Acids Res. 37, W317–322 (2009).
53. Al-Shahrour, F. et al. FatiGO +: a functional profiling tool for genomic data. Integration of
functional annotation, regulatory motifs and interaction data with microarray experiments. Nucleic
Acids Res 35, W91–W96 (2007).
54. Agrawal, R., Imieliński, T. & Swami, A. Mining association rules between sets of items in
large databases. SIGMOD Rec. 22, 207–216 (1993).
55. Belle, G. van & Fisher, L. D. Biostatistics: A Methodology for the Health Sciences. (Wiley-
Interscience: 1996).
56. Fang, G., Bhardwaj, N., Robilotto, R. & Gerstein, M. B. Getting Started in Gene Orthology
and Functional Analysis. PLoS Comput Biol 6, e1000703 (2010).
57. Domazet-Lošo, T., Brajković, J. & Tautz, D. A phylostratigraphy approach to uncover the
genomic history of major adaptations in metazoan lineages. Trends in Genetics 23, 533–539
(2007).
58. Altenberg, L. Genome Growth and the Evolution of the Genotype-Phenotype Map. Evolution
and Biocomputation, Computational Models of Evolution 205–259 (1995).at
<http://dl.acm.org/citation.cfm?id=647494.727799>
59. Domazet-Loso, T. & Tautz, D. An evolutionary analysis of orphan genes in Drosophila.
Genome Res. 13, 2213–2219 (2003).
60. Castillo-Davis, C. I. & Hartl, D. L. GeneMerge--post-genomic analysis, data mining, and
hypothesis testing. Bioinformatics 19, 891–892 (2003).
61. Stuart, J. J. & Mocelin, G. Cytogenetics of chromosome rearrangements in Tribolium
castaneum. Genome 38, 673–680 (1995).
62. Castresana, J. Selection of conserved blocks from multiple alignments for their use in
phylogenetic analysis. Mol. Biol. Evol. 17, 540–552 (2000).
63. Capy, P. Dynamics and evolution of transposable elements. (Landes Bioscience ; North
American distributor Chapman & Hall: Austin, Tex; New York, 1998).
64. Kapitonov, V. V. & Jurka, J. Molecular paleontology of transposable elements in the
Drosophila melanogaster genome. Proc. Natl. Acad. Sci. U.S.A. 100, 6569–6574 (2003).
65. Feschotte, C. & Pritham, E. J. DNA Transposons and the Evolution of Eukaryotic Genomes.
Annu Rev Genet 41, 331–368 (2007).
66. Jurka Mariner-1_TCa. Repbase Rep. 9, 674
67. Jurka Mariner-2_TCa. Repbase Rep. 9, 675
68. Hua-Van, A., Le Rouzic, A., Maisonhaute, C. & Capy, P. Abundance, distribution and
dynamics of retrotransposable elements and transposons: similarities and differences. Cytogenet.
Genome Res. 110, 426–440 (2005).
69. Agudo, M. et al. Centromeres from telomeres? The centromeric region of the Y chromosome
of Drosophila melanogaster contains a tandem array of telomeric HeT-A- and TART-related
sequences. Nucl. Acids Res. 27, 3318–3324 (1999).
70. Miller, W. J., Nagel, A., Bachmann, J. & Bachmann, L. Evolutionary dynamics of the SGM
transposon family in the Drosophila obscura species group. Mol. Biol. Evol. 17, 1597–1609 (2000).
71. Pons, J. et al. Complex structural features of satellite DNA sequences in the genus Pimelia
(Coleoptera: Tenebrionidae): random differential amplification from a common ‘satellite DNA
library’. Heredity (Edinb) 92, 418–427 (2004).
72. Rossi, M. S., Pesce, C. G., Reig, O. A., Kornblihtt, A. R. & Zorzópulos, J. Retroviral-like
features in the monomer of the major satellite DNA from the South American rodents of the genus
Ctenomys. DNA Seq. 3, 379–381 (1993).
73. Palomeque, T., Antonio Carrillo, J., Muñoz-López, M. & Lorite, P. Detection of a mariner-
like element and a miniature inverted-repeat transposable element (MITE) associated with the
81
heterochromatin from ants of the genus Messor and their possible involvement for satellite DNA
evolution. Gene 371, 194–205 (2006).
74. Jurka CR1-3TCa. Repbase Rep. 9, 737
75. Pezer, Z. & Ugarković, Đ. Satellite DNA-associated siRNAs as mediators of heat shock
response in insects. RNA Biology 9, 587–595 (2012).
76. Evgen’ev, M. B., Yenikolopov, G. N., Peunova, N. I. & Ilyin, Y. V. Transposition of mobile
genetic elements in interspecific hybrids of Drosophila. Chromosoma 85, 375–386 (1982).
77. Zelentsova, E. S., Vashakidze, R. P., Krayev, A. S. & Evgen’ev, M. B. Dispersed repeats in
<i>Drosophila virilis</i>: elements mobilized by interspecific hybridization.
Chromosoma 93, 469–476 (1986).
78. Heikkinen, E., Launonen, V., Müller, E. & Bachmann, L. The pvB370 BamHI satellite DNA
family of the Drosophila virilis group and its evolutionary relation to mobile dispersed genetic pDv
elements. J. Mol. Evol. 41, 604–614 (1995).
79. Macas, J., Koblízková, A., Navrátilová, A. & Neumann, P. Hypervariable 3’ UTR region of
plant LTR-retrotransposons as a source of novel satellite repeats. Gene 448, 198–206 (2009).
80. Thompson-Stewart, D., Karpen, G. H. & Spradling, A. C. A transposable element can drive
the concerted evolution of tandemly repetitious DNA. Proc. Natl. Acad. Sci. U.S.A. 91, 9042–9046
(1994).
81. Bosco, G., Campbell, P., Leiva-Neto, J. T. & Markow, T. A. Analysis of Drosophila Species
Genome Size and Satellite DNA Content Reveals Significant Differences Among Strains as Well as
Between Species. Genetics 177, 1277–1290 (2007).
82. Bulazel, K. V., Ferreri, G. C., Eldridge, M. D. B. & O’Neill, R. J. Species-specific shifts in
centromere sequence composition are coincident with breakpoint reuse in karyotypically divergent
lineages. Genome Biol. 8, R170 (2007).
83. Smith, G. P. Evolution of repeated DNA sequences by unequal crossover. Science 191, 528–
535 (1976).
84. Ma, J. & Jackson, S. A. Retrotransposon accumulation and satellite amplification mediated by
segmental duplication facilitate centromere expansion in rice. Genome Res 16, 251–259 (2006).
85. Assum, G., Fink, T., Steinbeisser, T. & Fisel, K. J. Analysis of human extrachromosomal
DNA elements originating from different beta-satellite subfamilies. Hum. Genet. 91, 489–495
(1993).
86. Navrátilová, A., Koblízková, A. & Macas, J. Survey of extrachromosomal circular DNA
derived from plant satellite repeats. BMC Plant Biol. 8, 90 (2008).
87. Feliciello, I., Picariello, O. & Chinali, G. Intra-specific variability and unusual organization of
the repetitive units in a satellite DNA from Rana dalmatina: molecular evidence of a new
mechanism of DNA repair acting on satellite DNA. Gene 383, 81–92 (2006).
88. Pezer, Ž. & Ugarković, Đ. RNA Pol II Promotes Transcription of Centromeric Satellite DNA
in Beetles. PLoS ONE 3, e1594 (2008).
89. Pezer, Z. & Ugarković, D. Transcription of pericentromeric heterochromatin in beetles--
satellite DNAs as active regulatory elements. Cytogenet. Genome Res. 124, 268–276 (2009).
90. Faulkner, G. J. et al. The regulated retrotransposon transcriptome of mammalian cells. Nature
Genetics 41, 563–571 (2009).
91. Ting, C. N., Rosenberg, M. P., Snow, C. M., Samuelson, L. C. & Meisler, M. H. Endogenous
retroviral sequences are required for tissue-specific expression of a human salivary amylase gene.
Genes Dev. 6, 1457–1465 (1992).
92. Samuelson, L. C., Phillips, R. S. & Swanberg, L. J. Amylase gene structures in primates:
retroposon insertions and promoter evolution. Mol. Biol. Evol. 13, 767–779 (1996).
93. Croisetière, S., Bernatchez, L. & Belhumeur, P. Temperature and length-dependent
modulation of the MH class IIβ gene expression in brook charr (Salvelinus fontinalis) by a cis-
acting minisatellite. Molecular Immunology 47, 1817–1829 (2010).
82
8. SUMMARY
In the red flour beetle Tribolium castaneum the major TCAST satellite DNA accounts
for 35% of the genome and encompasses the pericentromeric regions of all chromosomes.
Due to the presence of transcriptional regulatory elements and transcriptional activity in these
sequences, TCAST satellite DNAs have also been proposed to be modulators of gene
expression within euchromatin. Here is analyzed the distribution of TCAST homologous
repeats in T. castaneum euchromatin, and studied their association with genes as well as their
potential gene regulatory role. There are identified 68 arrays composed of TCAST-like
elements distributed on all chromosomes. Based on sequence characteristics the arrays were
composed of two types of TCAST-like elements. The first type consists of TCAST satellite-
like elements in the form of partial monomers or tandemly arranged monomers, up to
tetramers, while the second type consists of TCAST-like elements embedded with a complex
unit that resembles a DNA transposon. TCAST-like elements were also found in the 5' UTR
of the CR1-3_TCa retrotransposon, and therefore retrotransposition may have contributed to
their dispersion throughout the genome. No significant difference in the homogenization of
dispersed TCAST-like elements was found either at the level of local arrays or chromosomes,
nor among different chromosomes. Of 68 TCAST-like elements, 29 were located within
introns with the remaining elements flanked by genes within a 262 to 404 270 nt range.
TCAST-like elements are statistically overrepresented near genes with immunoglobulin-like
domains attesting to their non-random distribution and a possible gene regulatory role.
83
9. SAŽETAK
U vrsti Tribolium castaneum najzastupljenija satelitna DNA, TCAST, čini 35%
genoma i obuhvaća centromerne i pericentromerne regije svih kromosoma. Zbog prisutnosti
transkripcijskih regulatornih elemenata i transkripcijskee aktivnosti u tim sekvencama,
predpostavlja se da eukromatinska TCAST satelitska DNA može biti modulator ekspresije
gena. Ovdje se analizira raspodjela TCAST homolognih elemenata u eukromatinu vrste
Tribolium castaneum i proučava njihova povezanost s genima, kao i njihova potencijalna
uloga u regulaciji genske ekspresije. Identificirano je 68 TCAST elemenata raspoređenih na
svih 10 kromosoma. Na temelju obilježja njihovih sekvenci opisane su dvije vrste elemenata
sličnih TCAST satelitu. Prvi tip se sastoji od elemenata u obliku parcijalnih monomera ili
uzastopno ponavljajućih TCAST sekvenci do dužine tetramera, dok se drugi tip sastoji od
TCAST elemenata ugrađenih u složenu strukturu čija jedinica nalikuje DNA transpozonu.
TCAST elementi su također nađeni u 5' UTR CR1-3_TCa retrotransposona, što upućuje na to
da je retrotranspozicija mogla doprinijeli njihovoj raspršenosti diljem genoma. Nisu uočene
značajne razlike u homogenizaciji raspršenih TCAST elemenata niti na razini lokalnih polja
ili kromosoma, niti među različitim kromosomima. Od 68 TCAST elemenata, 29 je smješteno
unutar introna a ostali elementi se nalaze u blizini gena, unutar 262 - 404 270 NT raspona.
TCAST elementi su statistički over-reprezentirani u blizini gena s imunoglobulinskim
domenama što upućuje na njihovu ne-slučajnu distribuciju i moguću regulatornu ulogu u
ekspresiji gena.
84
10. CURRICULUM VITAE
Josip Brajković was born on May the 6th
1980 in Zagreb, Croatia. Primary school he
finished in Suhopolje and after primary education he moved to Zagreb where he continued his
education. He enrolled Archbishop Classic Gymnasium in 1994. In 1998, He enrolled in the
Molecular Biology studies at the Department of Biology, Faculty of Science, University of
Zagreb. For his Graduate Thesis, titled "The effect of relative prey mass on prey - handling
behaviour of the White - Lipped Tree Viper (Trimeresurus albolabris, Gray 1842)" he
undertook the research work in the Department of Animal Physiology at the Faculty of
Science, University of Zagreb, under the supervision of assistant professor Dr.sc. Zoran
Tadić. In 2006 he enrolled in the Doctoral Study of Molecular biosciences, University Josip
Juraj Strossmayer Osijek.
From December 2006 till now he is employee at the Ruđer Bošković Institute,
Laboratory of Evolutionary Genetics, Division of Molecular Biology on project "Fast
evolving portion of eukaryotic genome: evolutionary and functional studies" under
supervision Dr. sc. Đurđica Ugarković.
He is a member of the Croatian Genetic Society and Croatian Society for Theoretical
and Mathematical Biology (HDTMB). He is the representative of the scientific assistants
employed at the Division of Molecular Biology in the Molecualar Biology department
committee from 2010. He speeks Croatian and English.
Scientific articles :
1. Brajković, J., Feliciello, I., Bruvo-Mađarić, B. & Ugarković, Đ. Satellite DNA-Like
Elements Associated With Genes Within Euchromatin of the Beetle Tribolium castaneum.
G3 2, 931–941 (2012).
2. Domazet-Lošo, T., Brajković, J. & Tautz, D. A phylostratigraphy approach to uncover the
genomic history of major adaptations in metazoan lineages. Trends in Genetics 23, 533–
539 (2007).
85
Book Chapters:
1. Pezer, Z., Brajković, J., Feliciello, I. & Ugarković, D. Transcription of Satellite DNAs in
Insects. Prog. Mol. Subcell. Biol. 51, 161–178 (2011).
2. Pezer, Z., Brajković, J., Feliciello, I. & Ugarkovć, D. Satellite DNA-mediated effects on
genome regulation. Genome Dyn 7, 153–169 (2010).
Participation in Courses, Workshops & Scientific Meetings:
1. Brajković, Josip; Feliciello, Isidoro; Ugarković, Đurđica.Satellite DNA-like elements
dispersed within euchromatin of beetle Tribolium castaneum // Croatian genetic
society - 3rd congress of croatian geneticists / Krk, Hrvatska, 13-16.05.2012.
2. Feliciello, Isidoro; Brajković, Josip; Ugarković, Đurđica.First evidence of CpG
methylation in genomic DNA of Tribolium castaneum embryos // Croatian genetic
society - 3rd congress of croatian geneticists / Krk, Hrvatska, 13-16.05.2012. (poster)
3. Pezer, Željka; Brajković, Josip; Ugarković, Đurđica.Transcription of satellite DNAs
and genome regulation in Tribolium beetles // The Non-coding Genome. 2010. 258-
258 (poster)
4. "Sequence to Gene: Genome Informatics of Microorganisms" from 16th - 18th March
2009. in Hinxton, Great Britain
5. Interactions, Pathways and Networks from 15th - 18th June 2009 in Hinxton, Great
Britain.
86
6. Pezer, Željka; Brajković, Josip; Beer, Zsuzsanna, Ugarković, Đurđica RNA Pol II
promotes transcription of centromeric satellite DNA in beetles //4th Annual Meeting
EU 6th FP The Epigenome, Network of Excellence / Linderson, Ylva ; Bertrand, Sara
(ur.). - Madrid : Centro Nacional de Investigaciones Oncologicas , 2008. 85-85.
(poster)
7. Pezer, Ž.; Brajković, J.; Beer, Z.; Ugarković, Đ.RNA Pol II promotes transcription of
centromeric satellite DNA in beetles //50 Godina molekularne biologije u Hrvatskoj -
zbornik sažetaka / Zahradka, K. ; Plohl, M., Ambriović-Ristov, A. (ur.). - Zagreb :
Institut Ruđer Bošković , 2008. 21-21 (oral presentation)
8. 1st MedILS Summer School: "Structure and Evolution: from Bench to Terminal" 12-
22 July 2006. Split, Croatia.

87
11. ACKNOWLEDGEMENTS
I thank Isidoro Feliciello and Branka Bruvo-Mađarić for help with transposable elements
discussion and phylogenetic analysis respectively. I thank Đurđica Ugarković for support and
fruitful mentoring.


![Untitled-2 [rektorat.unios.hr]rektorat.unios.hr/.../upload/storage/2014/kalendar-14-15.pdf · 2014-09-11 · Title: Untitled-2 Author: Mario Dunić Created Date: 9/11/2014 9:39:06](https://img.pdfslide.net/doc/110x75/5f88603f820a9306936421d6/untitled-2-2014-09-11-title-untitled-2-author-mario-duni-created-date.jpg)


![TI-IE ]OSIP jURA] STROSSMAYER UNIVERSITY OF OSIJEK](https://img.pdfslide.net/doc/110x75/589833451a28abe1488b4be0/ti-ie-osip-jura-strossmayer-university-of-osijek-.jpg)

