Embed Size (px)
Citation preview
Corporate governance in the 2007–2008 financial crisis:Evidence from financial institutions worldwide
David H. Erkens a, Mingyi Hung a,⁎, Pedro Matos b
a Leventhal School of Accounting, Marshall School of Business, University of Southern California, Los Angeles, CA 90089, United Statesb Department of Finance, Darden School of Business, University of Virginia, Charlottesville, VA 22906, United States
a r t i c l e i n f o a b s t r a c t
Article history:Received 27 September 2011Received in revised form 15 January 2012Accepted 17 January 2012Available online 28 January 2012
This paper investigates the influence of corporate governance on financial firms' performanceduring the 2007–2008 financial crisis. Using a unique dataset of 296 financial firms from 30countries that were at the center of the crisis, we find that firms with more independentboards and higher institutional ownership experienced worse stock returns during the crisisperiod. Further exploration suggests that this is because (1) firms with higher institutionalownership took more risk prior to the crisis, which resulted in larger shareholder losses duringthe crisis period, and (2) firms with more independent boards raised more equity capitalduring the crisis, which led to a wealth transfer from existing shareholders to debtholders.Overall, our findings add to the literature by examining the corporate governance determi-nants of financial firms' performance during the 2007–2008 crisis.
© 2012 Elsevier B.V. All rights reserved.
JEL classification:G2G3N2
Keywords:Corporate governanceCredit crisisGlobal financial institutions
1. Introduction
An unprecedented large number of financial institutions collapsed or were bailed out by governments during the global finan-cial crisis of 2007–2008.1 The failure of these institutions resulted in a freeze of global credit markets and required governmentinterventions worldwide. While the macroeconomic factors (e.g., loose monetary policies) that are at the roots of the financialcrisis affected all firms (Taylor, 2009), some firms were affected much more than others. Recent studies argue that firms' riskmanagement and financing policies had a significant impact on the degree to which firms were impacted by the financial crisis(Brunnermeier, 2009). Because firms' risk management and financing policies are ultimately the result of cost–benefit trade-offs made by corporate boards and shareholders (Kashyap et al., 2008), an important implication from these studies is thatcorporate governance affected firm performance during the crisis period.
In this paper, we provide empirical evidence on whether, and how corporate governance influenced the performance of finan-cial firms during the crisis period. We examine in particular the role of independent directors and influential shareholders. Weperform our investigation using a unique dataset of 296 of the world's largest financial firms across 30 countries that were atthe center of the crisis. We examine the relation between firm performance and corporate governance by regressing stock returns
Journal of Corporate Finance 18 (2012) 389–411
⁎ Corresponding author. Tel.: +1 213 740 7377; fax: +1 213 747 2815.E-mail address: [email protected] (M. Hung).
1 The list of casualties includes Bear Stearns, Citigroup, Lehman Brothers, Merrill Lynch (in the U.S.), HBOS and RBS (in the U.K.), and Dexia, Fortis, Hypo RealEstate and UBS (in continental Europe).
0929-1199/$ – see front matter © 2012 Elsevier B.V. All rights reserved.doi:10.1016/j.jcorpfin.2012.01.005
Contents lists available at SciVerse ScienceDirect
Journal of Corporate Finance
j ourna l homepage: www.e lsev ie r .com/ locate / jcorpf in
during the crisis on measures of corporate governance and control variables. We capture stock returns during the crisis asbuy-and-hold returns from January 2007 to September 2008 or to the date on which the firm was delisted, whichever is earlier.We include three corporate governance factors: (1) board independence, (2) institutional ownership, and (3) the presence oflarge shareholders, measured as of December 2006. In addition, we control for a dummy indicating whether a firm is cross-listed on U.S. stock exchanges, leverage, firm size, and dummy variables indicating a firm's industry and country.2 Finally, wecontrol for stock return in 2006 because the performance during the crisis periodmay reflect a reversal of pre-crisis performance(Beltratti and Stulz, 2010).3
Our analysis shows that firms with more independent boards and greater institutional ownership experienced worse stockreturns during the crisis period. A potential explanation for this finding is that independent directors and institutional share-holders encouraged managers to increase shareholder returns through greater risk-taking prior to the crisis. Shareholders mayfind it optimal to increase risk because they do not internalize the social costs of financial institution failures and institutionalarrangements such as deposit insurance may weaken debtholder discipline. In addition, because of their firm-specific humancapital and private benefits of control, managers tend to seek a lower level of risk than shareholders (Laeven and Levine, 2009).Consistent with this view, DeYoung et al. (forthcoming) find that in the years leading up to the financial crisis (2000–2006), bankschanged CEO compensation packages to encourage executives to exploit new growth opportunities created by deregulation andthe explosion of debt securitization.
We test the risk-taking explanation by regressing expected default frequency (EDF) and stock return volatility on the gover-nance factors and the same set of control variables.4 We find mixed support for this explanation. In particular, while we find thatfirms with greater institutional ownership took more risk before the crisis, we do not find that firms with more independentboards did so. Thus, our findings are inconsistent with independent board members having encouraged managers to take greaterrisk in their investment policies before the onset of the crisis.
An alternative explanation for the negative relation between stock returns and board independence is that independent direc-tors pressured managers into raising equity capital during the crisis to ensure capital adequacy and reduce bankruptcy risk.Capital raisings at depressed stock prices may have led to a significant wealth transfer from shareholders to debtholders duringthe crisis period (Kashyap et al., 2008; Myers, 1977). Consistent with this wealth transfer, we find negative abnormal stockreturns and abnormal decreases in credit default swap (CDS) spreads in the 3-day window around the announcement of equityofferings.5 To test our alternative explanation for the relation between stock returns and board independence we regress theamount of equity capital raised during the crisis (scaled by total assets) on the corporate governance factors and control variables.Consistent with this alternative explanation, we find that firms with more independent boards raised more equity capital.Moreover, we find that the association between stock returns and board independence becomes insignificant once we excludefirms that raised equity capital during the crisis from our sample.
While equity capital raisings may have led to poor performance during the crisis, they also may have helped firms survive thecrisis and perform better after the crisis. We investigate this issue by performing additional analyses in which we examine wheth-er equity capital raisings had a positive impact on the likelihood that a firm survived the financial crisis and firm performance overthe long run. Consistent with equity capital raisings helping firms survive the crisis, we find that firms that raised more equitycapital were less likely to be delisted during the crisis than firms matched on pre-capital raising performance. However, inconsis-tent with equity capital raisings helping firms perform better over the long run, we find that equity capital raising firms performsimilarly to the matched firms in the period subsequent to equity capital raisings. One possible explanation is that regulatory in-terventions such as the Troubled Asset Relief Program (TARP) may have attenuated the positive effect of equity raisings on firmperformance in the long run.
Although we focus on firm-level governance mechanisms, we also examine how country-level governance mechanisms, suchas the quality of legal institutions and the extent of laws protecting shareholder rights, influenced firm performance during thecrisis. We find an insignificant relation between firm performance and the country-level governance variables. This evidence isconsistent with firm-level, but not country-level governance mechanisms being important in explaining why some financialfirms were much more affected by the financial crisis than others.
One concern for our analysis is that our corporate governance measures are correlated with some other firm characteristic thatis not included in our model, but that has an important influence on financial firms' performance during the crisis period. The
2 We do not control for a dummy variable indicating whether a firm has a Big N auditor as in Mitton (2002) because only five of our sample firms have non-BigFour auditors. As reported in Section 4, our result is not sensitive to excluding firms with non-Big Four auditors or including a dummy variable indicating a BigFour auditor.
3 We do not control for country-level regulatory and macroeconomic variables (as in Beltratti and Stulz, 2010) because this will introduce perfect multicolli-nearity with our country dummies. By controlling for country dummies in our regression model, our analysis essentially examines how the cross-sectionalwithin-country variation in firm performance is related to within-country variation in corporate governance characteristics. In addition, since our sample consistsof all financial institutions including not only banks, but also brokerage and insurance companies, we do not include the bank-specific financial statement vari-ables (such as deposits or loans) used in Beltratti and Stulz (2010). Instead, our model addresses differences in balance sheet characteristics and capital require-ments across global financial institutions by controlling for leverage, industry dummies (3-digit SIC), and country dummies.
4 EDF is computed by Moody's KMV CreditMonitor implementation of Merton's (1974) structural model and has been used in prior studies to capture creditrisk (Covitz and Downing, 2007).
5 CDS is an “insurance” contract against the risk of default, in which the buyer makes a series of payments in exchange for the right to receive a payoff in case ofdefault by the referenced entity. The more likely a firm is to default on its debt obligations, the higher a firm's CDS spread.
390 D.H. Erkens et al. / Journal of Corporate Finance 18 (2012) 389–411
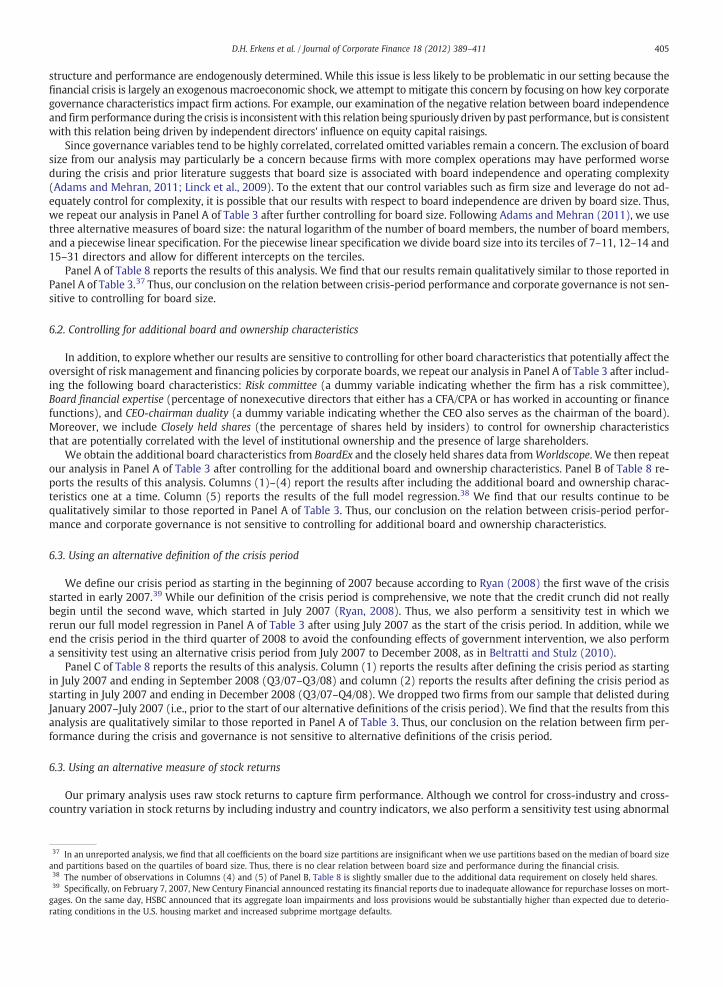
exclusion of board size from our analysis may particularly be a concern because firms with more complex operations may haveperformed worse during the crisis and prior literature suggests that board size is associated with board independence and oper-ating complexity (Adams and Mehran, 2011; Linck et al., 2009). Thus, we repeat our analysis after including various measures ofboard size (i.e., the natural logarithm of the number of board members, the number of board members, and a piecewise linearspecification). We find that our results remain qualitatively similar
In addition, we find that our results are also robust to controlling for other board characteristics (i.e., the existence of a riskcommittee, the financial expertise of the board, and CEO-chairman duality), controlling for additional ownership characteristics(i.e., percentage of shares held by insiders), using alternative definitions of the crisis period (i.e., July 2007–September 2008 orJuly 2007–December 2008), and using an alternative measure of stock returns (i.e., abnormal stock returns based on a marketmodel).
Our paper contributes to an emerging body of research that attempts to identify the mechanisms that influenced how severelyfinancial firms were impacted by the 2007–2008 crisis (Brunnermeier, 2009; Kashyap et al., 2008) in primarily two ways. First,concurrent studies on the financial crisis have mostly focused on the macroeconomic factors that are at the roots of the financialcrisis (Taylor, 2009), but have not examined why some firms were significantly more affected by the crisis than others. To ourknowledge, our study is among the first that examines the role of corporate boards, institutional investors, and large shareholdersin the 2007–2008 financial crisis using a global sample. Furthermore, we take a broader view of the role of corporate governancein the financial crisis than other concurrent papers by investigating various aspects of the crisis including risk-taking prior to thecrisis and capital raisings during the crisis.
Our paper is closely related to a concurrent paper by Beltratti and Stulz (2010), which examines how firm-level and country-level factors (e.g., bank characteristics, governance indices, bank regulation, and macroeconomic factors) relate to bank perfor-mance during the crisis. We complement their study by documenting why corporate governance is related to firm-performanceduring the financial crisis. Specifically, Beltratti and Stulz (2010) find that a shareholder-friendly board (as captured by theRiskMetrics governance index) is negatively associated with firm performance during the crisis, but do not find the source ofthis association. We find that firms with more independent boards performed worse during the crisis because independentboard members are associated with more equity capital raisings during the crisis, which led to a wealth transfer from share-holders to debtholders. Moreover, Beltratti and Stulz (2010) do not explore the role of institutional investors. We find thatfirms with higher institutional ownership performed worse during the crisis because they took more risk before the crisis.
Second, we contribute to the large literature on corporate governance (e.g., Bushman and Smith, 2001; Hermalin andWeisbach, 2003) by showing that corporate governance had an important impact on firm performance during the crisis throughinfluencing firms' risk-taking and financing policies. Hermalin and Weisbach (2003) point out that the absence of a significantrelation between board composition (such as board independence) and firm performance is a notable finding in the literature.They suggest that the absence of this relation is consistent with board independence not being important on a day to day basisand propose that board independence should only matter for certain board actions, ‘particularly those that occur infrequentlyor only in a crisis situation’ (Hermalin and Weisbach, 2003, p. 17). Our study adds to this literature by providing evidence consis-tent with the crisis period being a unique setting in which the actions of board members mattered.6
Our study also complements prior studies on the governance determinants of short-term stock return performance duringfinancial crises. Specifically, prior studies on the 1997–1998 Asian financial crisis find that greater external monitoring (e.g.,non-management block holdings) is associated with better performance during the crisis (Johnson et al., 2000; Mitton, 2002),and attribute this finding to worse economic prospects resulting in more expropriation by managers. In contrast, we find thatfirms with greater external monitoring (i.e., more independent boards and higher institutional ownership) performed worse,and that this relation is driven by the influence of corporate governance on firms' risk management and financing polices.Thus, our study suggests that the impact of corporate governance on firm performance during the crisis in developed marketssuch as the U.S. and most of the EU member countries differs from that in emerging markets.
An important caveat of our study is that our analysis neither considers the optimal level, nor addresses the net benefits, of risk-taking and equity capital raisings for financial firms. Rather, as in prior studies on bank governance such as Laeven and Levine(2009), we provide an empirical assessment of theoretical predictions concerning the influence of key corporate governancemechanisms on short-term firm performance and managerial actions during the crisis. We also caution that our study is notdesigned to be prescriptive to the debate on the regulatory reform of financial institutions (Kirkpatrick, 2009; Schapiro, 2009).Regulatory reform on corporate governance is a social welfare decision that involves an evaluation of numerous factors andextensive cost–benefit analyses that are beyond the scope of our study. Finally, since we focus on large financial institutions,we caution that our findings may not generalize to smaller financial firms.
The remainder of the study proceeds as follows. Section 2 provides the institutional background and motivation of this paper.Section 3 presents the sample and data and Section 4 shows the empirical results. Section 5 presents additional analyses andSection 6 reports sensitivity tests. Section 7 concludes our study.
6 One common problem for governance studies is that the relation between board characteristics and firm performance may be spurious because they are en-dogenously determined (Wintoki et al., forthcoming). We argue that this issue is less likely to be problematic in our setting because the financial crisis is largelyan exogenous macroeconomic shock (Baek et al., 2004). Moreover, our study also attempts to mitigate this concern by examining how board independence im-pacted firm actions, and not just firm performance.
391D.H. Erkens et al. / Journal of Corporate Finance 18 (2012) 389–411
2. Institutional background and motivation
The 2007–2008 financial crisis is commonly viewed as the worst financial crisis since the Great Depression of the 1930s.7 Thecrisis not only resulted in the collapse of well-known financial institutions such as Lehman Brothers, but also halted global creditmarkets and required unprecedented government intervention worldwide. For example, in October 2008, the U.S. governmentlaunched TARP to purchase or insure up to $700 billion of assets from financial institutions. In the same month, the Britishgovernment announced a bank rescue package totaling £500 ($740) billion in loans and guarantees.
Motivated by the significance of the 2007–2008 financial crisis, an emerging body of literature has attempted to identify andexamine the global roots of the crisis. This literature proposes that a combination of macroeconomic factors such as loose mon-etary policies and complex securitizations have contributed to the crisis (Taylor, 2009). While these studies are clearly important,they do not explain why some financial firms performed much worse during the crisis than others, despite that these firms wereexposed to the same macroeconomic factors. For example, while Citigroup in the U.S. and UBS in Switzerland experienced severesubprime mortgage related losses, JP Morgan Chase and Credit Suisse (also in the U.S. and Switzerland, respectively) sufferedmuch less damage.8 Since macroeconomic factors can only partially explain why some firms performed worse than others duringthe crisis (e.g., U.S. versus Swiss financial firms), it is important to examine how firm-level policies have influenced firm perfor-mance during the financial crisis.
Two firm-level policies that significantly affected the magnitude of shareholder losses during the crisis have received consid-erable attention from academics and investors: (1) risk management before the crisis and (2) equity capital raisings during thecrisis. As explained by Brunnermeier (2009), the interplay between banks' exposure to subprime mortgages and their relianceon short-term borrowing had a significant impact on the performance of financial firms during the crisis period. As the valueof risky assets deteriorated during the crisis period, financial institutions could no longer rely on rolling over short-term loansagainst these assets and were forced to raise capital. Raising equity capital was particularly costly to shareholders during the crisisbecause it led to a significant wealth transfer from shareholders to debtholders (Kashyap et al., 2008; Myers, 1977).
Financial firms' risk management before the crisis and capital raising activities during the crisis were ultimately the result ofcorporate boards and shareholders making a cost–benefit trade-off (Kashyap et al., 2008). Investing heavily in subprime mort-gage related assets and relying on short-term credit lines could have looked very lucrative before the crisis, but exposed firms toconsiderable risks that led to large losses during the crisis.9 Consistent with the notion that corporate boards and shareholdersencouraged risk-taking prior to the crisis, DeYoung et al. (forthcoming) find that, in the years leading up to the financial crisis(2000–2006), banks included stronger risk-taking incentives in CEO compensation packages to encourage executives to exploitnew growth opportunities created by deregulation and the explosion of debt securitization.10, 11 Similarly, while raising equitycapital helped reduce bankruptcy risk, it was very costly to existing shareholders during the crisis period.
Consequently, we examine whether board characteristics and ownership structure have affected firm performance during thecrisis period by influencing risk-taking before the crisis and equity capital raisings during the crisis. In particular, we focus ouranalysis on board independence, institutional ownership and the presence of controlling shareholders, because these are themost commonly examined corporate governance attributes in the literature (Denis and McConnell, 2003).
3. Sample and data description
3.1. Timeline
We conduct our empirical analysis using data from January 2007 to September 2008. We begin our investigation period at thestart of 2007 because this is generally regarded as the period when the market first realized the severity of the losses related tosubprime mortgages (Ryan, 2008). We end our investigation period in the third quarter of 2008 for three main reasons: (1) Themassive government bailouts, such as TARP in the U.S., were initiated from October 2008 onwards. (2) At the end of the thirdquarter of 2008, regulators in several countries imposed short-selling bans on the stocks of many financial institutions to curbsteep declines of their stock prices. (3) In October 2008, changes in the International Financial Reporting Standards (IFRS) allowedfinancial institutions to avoid recognizing asset writedowns.12, 13
7 See Brunnermeier (2009) and “Worst crisis since 30s, with no end yet in sight” (The Wall Street Journal, September 18, 2008).8 Based on company reports, by January 2008 the subprime losses for these firms were $18 billion for Citigroup, $13.5 billion for UBS, $1.3 billion for JP Morgan
Chase, and $1 billion for Credit Suisse (‘JP Morgan's 1.3 bn sub-prime hit,’ BBC news, January 16, 2008).9 Citigroup CEO Chuck Prince famously said “When the music stops, in terms of liquidity, things will be complicated. But as long as the music is playing, you've
got to get up and dance. We're still dancing.” (Financial Times, July 9, 2007).10 As discussed in DeYoung et al. (forthcoming), due to innovations and deregulation in financial markets the business model of large banks has switched fromthe traditional “originate-and-hold” lending model that relies on interest income to an “originate-and-securitize” lending model that relies heavily on the fee in-come from non-repeat, arms-length financial transactions in the past two decades.11 We thank our referee for pointing out that executive compensation arrangements could have been an important channel through which corporate boards andshareholders encouraged executives at global financial institutions to take greater risk before the crisis.12 The International Accounting Standards Board (IASB) issued amendments to the use of fair value accounting on financial instruments in October 2008 thatallow companies to reclassify financial assets from market value based to historical cost based valuation. Consequently, many European banks used the oppor-tunity to forgo substantial writedowns on financial assets whose market prices had substantially fallen during 2008 (Bischof et al., 2010).13 While the definition of the crisis period is more comprehensive by including early 2007 when the market first woke up to the substantial subprime mortgageproblems, we note that the credit crunch did not really begin until July 2007 (Ryan, 2008). Thus, we also perform sensitivity tests in which we use July 2007 as thestart of the crisis period. As reported in Section 6, our result is not sensitive to this alternative definition of the crisis period.
392 D.H. Erkens et al. / Journal of Corporate Finance 18 (2012) 389–411
3.2. Sample of financial firms
3.2.1. Sample selectionOur sample consists of 296 financial firms that were publicly listed at the end of December 2006 across 30 countries. Among
these firms, 28 firms (such as Bear Stearns, EuroHypo, and Lehman Brothers) were listed at the end of December 2006, but sub-sequently delisted during our sample period.
We use the following criteria to compile our sample. First, we restrict our sample to financial firms (banks, brokerages, andinsurance companies) that were publicly traded at the end of 2006 and covered by Compustat Global and North America data-bases. This results in 4766 financial firms. Second, we restrict our sample to firms with total assets greater than US $10 billionbecause large global financial institutions were at the center of public attention during the 2007–2008 crisis.14 In addition, thefocus on large financial institutions also helps minimize the cost of extensive manual data collection for the variables used inour analysis (such as governance characteristics, credit default swaps, and capital raisings). This restriction reduces our sampleto 771 firms. Third, we restrict our sample to firms that are covered by BoardEx, our data source on board composition. WhileBoardEx is the leading database on board composition of publicly listed firms and covers approximately 10,000 firms in nearly50 countries, only 347 of the 771 large financial firms are covered in the database. Fourth, we drop 47 firms without necessarydata on firm performance and ownership structure. Finally, we delete four Puerto Rican financial firms to ensure that our resultsare not confounded by the 2006 budget crisis in Puerto Rico. Panel A of Table 1 summarizes our sample selection process.Appendix A provides a list of our sample firms and their countries.
3.2.2. Representativeness of our sampleWhile the focus on large financial institutions is common in the literature (Adams and Mehran, 2003), we caution that our
findings may not generalize to smaller financial firms. Panels B and C of Table 1 provide descriptive statistics on how our samplefirms differ from the population of Compustat financial firms (4766 firms). Panel B reports the distribution of our sample firms andthe Compustat financial firms by industry, following the industry classification scheme in Fama and French (1997). The panelshows that compared to the Compustat financial firms, our sample includes more banks, fewer brokerages and more insurancecompanies. Moreover, Panel B shows that while our sample represents only a small fraction of the number of financial firmscovered by Compustat, it is economically important and represents 63% (65,128/103,615) of aggregate industry assets.
Panel C of Table 1 compares common firm characteristics (i.e., total assets, leverage, return on assets, and asset growth,measured prior to the crisis) between our sample firms and the Compustat financial firms with necessary data for each variable.Consistent with our sample selection criteria, the panel shows that the average of total assets for our sample firms is much largerthan that for the Compustat financial firms ($219.57 billion for our sample firms versus $21.74 billion for the Compustat financialfirms). In addition, the panel shows that compared to the Compustat financial firms, our sample firms are more highly leveraged,have lower return on assets, and have less asset growth. Overall, these results are consistent with prior studies that find size tobe associated with other firm characteristics (Rajan and Zingales, 1995).15
3.3. Main variables
3.3.1. Measuring firm performanceOur primary measure of firm performance is buy-and-hold stock returns, measured from the first quarter of 2007 until the end
of the third quarter of 2008 or the date on which the firm was delisted, whichever is earlier. We gather data on stock returns fromDatastream.
We supplement our analysis on firm performance with a measure capturing cumulative accounting writedowns during thecrisis. The writedown data is a unique feature of our setting because they directly relate to the impairment of assets due to invest-ments in subprime mortgage related assets. We obtain data on accounting writedowns from Bloomberg's WDCI database, whichcovers banks, brokerages, and insurance companies. Because financial firms' asset impairments and credit losses were of greatinterest to the investment community, Bloomberg collected this data from regulatory filings, news articles, and company pressreleases (such as quarterly earnings announcements). We measure writedowns as negative figures so that the regression coeffi-cients on writedowns can be compared to those on stock returns. An important caveat of the writedown measure, however, isthat it is subject to managerial discretion and does not capture the full extent of shareholder losses during the crisis.16
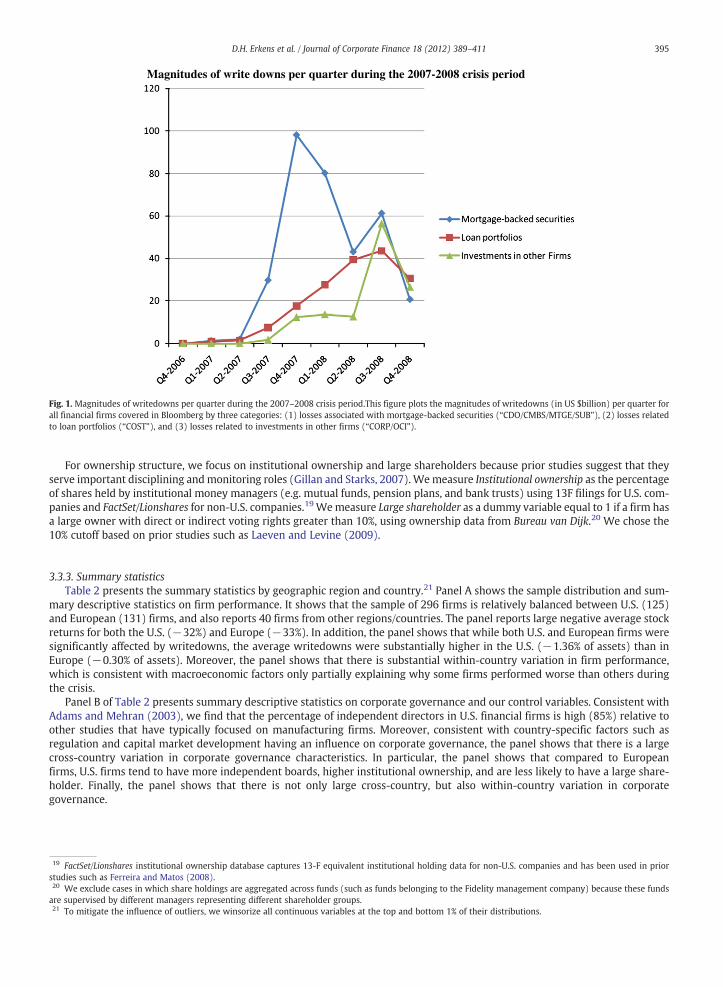
Fig. 1 plots the magnitude of writedowns (in US $billions) per quarter for all financial firms covered in Bloomberg. We classifywritedowns into three categories: (1) losses related to mortgage-backed securities (“Mortgage-backed securities”—Bloombergcodes CDO, CMBS, MTGE, and SUB), (2) losses related to loan portfolios (“Loan portfolios”—COST), and (3) losses related to
14 For example, see “Trying to rein in ‘Too Big to Fail’ Institutions” (The New York Times, October 25, 2009). Our size restriction is comparable to the concurrentstudy by Beltratti and Stulz (2010). Specifically, the sample in Beltratti and Stulz (2010) includes 165 banks with assets in excess of $50 billion and 386 banks withassets in excess of $10 billion. Moreover, by restricting our sample to large firms, we ensure that we do not miscode small firms with material writedowns as nothaving writedowns. This is because Bloomberg limits its coverage to firms with cumulative writedowns exceeding US $100 million.15 We also perform additional analyses in which we include return on assets and asset growth as additional control variables. The results (untabulated) remainqualitatively similar to those reported in Panel A of Table 3.16 For example, Lehman was criticized for not having taken adequate accounting writedowns on its mortgage portfolio in 2008 because it took only a 3% write-down on its portfolio in the first quarter of 2008 while an index of commercial mortgage-backed bonds fell 10% in the same quarter (Onaran, Bloomberg News,June 9, 2008).
393D.H. Erkens et al. / Journal of Corporate Finance 18 (2012) 389–411
investments in other firms (“Investment in other firms”—CORP and OCI).17 The figure shows a spike in writedowns related tomortgage-backed securities in the fourth quarter of 2007, followed later on by an increase in writedowns related to investmentsin other firms (such as in Lehman Brothers or Icelandic banks). It also shows a steady increase in credit losses related to loan port-folios from the second quarter of 2007 to the third quarter of 2008.
3.3.2. Measuring corporate governanceWe focus our analysis on firms' corporate boards and ownership structures, the two key firm-specific governance mechanisms
(Denis and McConnell, 2003). We measure these corporate governance mechanisms as of December 2006 (i.e., prior to the onsetof the crisis).
For boards of directors, we focus on board independence because this is one of the most extensively studied board character-istics (Weisbach, 1988).18 We define Board independence as the percentage of independent directors. Using BoardEx data, weclassify directors as “independent” if they are non-executive directors (i.e., not full-time employees).
17 The total magnitude of losses in all firms covered by Bloomberg is US $ 1073 billion for the period from the first quarter of 2007 to the fourth quarter of 2008.Bloomberg classifies writedowns into various groups based on company disclosure. The top thirteen groups (in terms of total magnitude of writedowns) are:ABS—Non-mortgage asset-backed securities, CDO—Collateralized debt obligations, CDS—Credit default swaps, CMBS—Commercial mortgage-backed securities,CORP—Corporate investment, COST—Credit costs/loan charge offs, LEV—leveraged loans,MTGE—Mortgage-related securities,MONO—Monolines, OCI—Revaluationreserve/other comprehensive income, RES—Uncategorized residential mortgage asset writedowns, SUB—Subprime residential mortgage backed securities, andTRA—Trading losses. In Fig. 1, under “Mortgage-backed Securities” we only include the four major groups that are likely to be most directly related tomortgage-backed securities (CDO, CMBS, MTGE, and SUB). However, Fig. 1 is a conservative estimate of losses related to mortgage-backed securities because oth-er groups (such as CDS, RES, and TRA) can also include writedowns related to mortgage-backed securities.18 Our focus on board independence is also consistent with Hermalin andWeisbach (2003), who state on page 15 ‘we tend to see independence as the true caus-al variable, with size, compensation, and board composition as correlates.’
Table 1Sample selection.
Panel A: Sample selection
N of firms dropped Remaining firms
Compustat financial firms 4766LessFirms with total assets less than US $10 billion 3995 771Firms without board characteristics data (i.e., not covered in BoardEx) 424 347Other data constraints (i.e., firms without stock returns, institutional ownership, large shareholders data) 47 300Firms from Puerto Rico (2006 budget crisis) 4Final sample 296
Panel B: Distribution of financial firms across industries, final sample versus Compustat financial firms
Final sample Compustat financial firms
Industry as in Fama and French (1997) 4-digit SIC N firms Total assets N firms Total assets
N % US $bln. % N % US $bln. %
Banking 6000–6099 177 60% 40,998 63% 2019 42% 72,510 70%6100–61996200–6299
Brokerage/Trading 6700–6799 19 6% 15,657 24% 2150 45% 19,254 19%6300–6399
Insurance 6400–6411 100 34% 8473 13% 597 13% 11,850 11%Total 296 100% 65,128 100% 4766 100% 103,615 100%
Panel C: Firm characteristics prior to the crisis (as of December 2006), final sample versus Compustat financial firms
N Mean Median Std. dev. p-value, diff.a
Total assets (US $bln.)Final sample 296 219.57 56.54 384.66 b0.01Compustat financial firms 4766 21.74 0.66 120.96LeverageFinal sample 296 0.91 0.93 0.07 b0.01Compustat financial firms 4764 0.74 0.75 0.16Return on assetsFinal sample 296 0.02 0.02 0.02 b0.01Compustat financial firms 4759 0.04 0.02 0.04Asset growthFinal sample 296 0.20 0.12 0.58 b0.01Compustat financial firms 4394 0.36 0.13 1.04
a p-value based on a t-statistic for difference in means.
394 D.H. Erkens et al. / Journal of Corporate Finance 18 (2012) 389–411
For ownership structure, we focus on institutional ownership and large shareholders because prior studies suggest that theyserve important disciplining andmonitoring roles (Gillan and Starks, 2007). Wemeasure Institutional ownership as the percentageof shares held by institutional money managers (e.g. mutual funds, pension plans, and bank trusts) using 13F filings for U.S. com-panies and FactSet/Lionshares for non-U.S. companies.19Wemeasure Large shareholder as a dummy variable equal to 1 if a firm hasa large owner with direct or indirect voting rights greater than 10%, using ownership data from Bureau van Dijk.20 We chose the10% cutoff based on prior studies such as Laeven and Levine (2009).
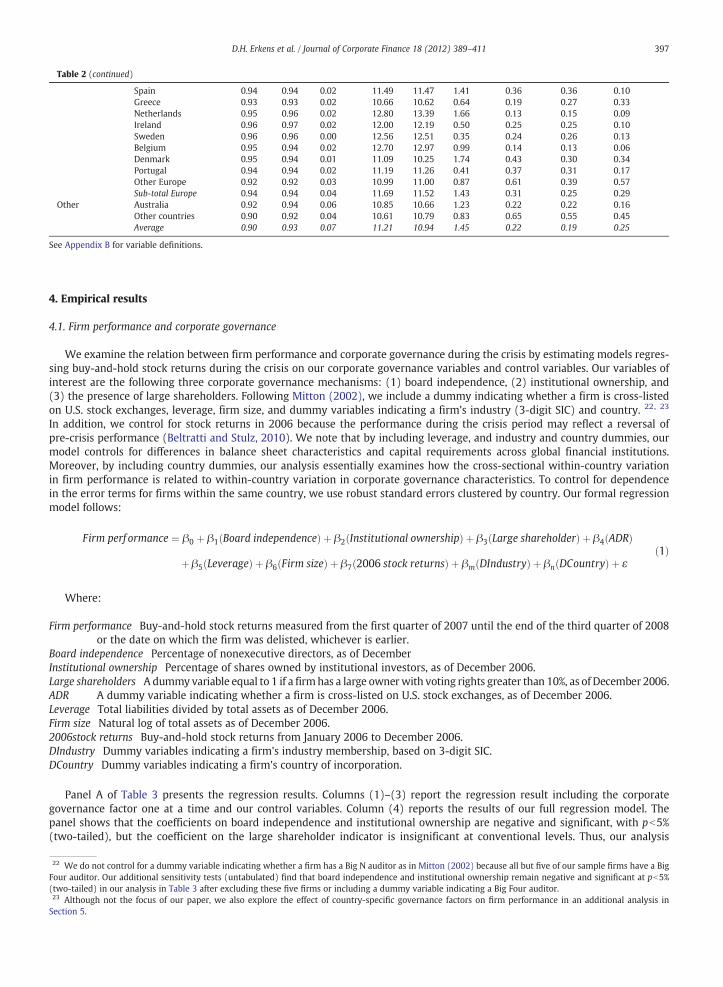
3.3.3. Summary statisticsTable 2 presents the summary statistics by geographic region and country.21 Panel A shows the sample distribution and sum-
mary descriptive statistics on firm performance. It shows that the sample of 296 firms is relatively balanced between U.S. (125)and European (131) firms, and also reports 40 firms from other regions/countries. The panel reports large negative average stockreturns for both the U.S. (−32%) and Europe (−33%). In addition, the panel shows that while both U.S. and European firms weresignificantly affected by writedowns, the average writedowns were substantially higher in the U.S. (−1.36% of assets) than inEurope (−0.30% of assets). Moreover, the panel shows that there is substantial within-country variation in firm performance,which is consistent with macroeconomic factors only partially explaining why some firms performed worse than others duringthe crisis.
Panel B of Table 2 presents summary descriptive statistics on corporate governance and our control variables. Consistent withAdams and Mehran (2003), we find that the percentage of independent directors in U.S. financial firms is high (85%) relative toother studies that have typically focused on manufacturing firms. Moreover, consistent with country-specific factors such asregulation and capital market development having an influence on corporate governance, the panel shows that there is a largecross-country variation in corporate governance characteristics. In particular, the panel shows that compared to Europeanfirms, U.S. firms tend to have more independent boards, higher institutional ownership, and are less likely to have a large share-holder. Finally, the panel shows that there is not only large cross-country, but also within-country variation in corporategovernance.
Magnitudes of write downs per quarter during the 2007-2008 crisis period
Fig. 1. Magnitudes of writedowns per quarter during the 2007–2008 crisis period.This figure plots the magnitudes of writedowns (in US $billion) per quarter forall financial firms covered in Bloomberg by three categories: (1) losses associated with mortgage-backed securities (“CDO/CMBS/MTGE/SUB”), (2) losses relatedto loan portfolios (“COST”), and (3) losses related to investments in other firms (“CORP/OCI”).
19 FactSet/Lionshares institutional ownership database captures 13-F equivalent institutional holding data for non-U.S. companies and has been used in priorstudies such as Ferreira and Matos (2008).20 We exclude cases in which share holdings are aggregated across funds (such as funds belonging to the Fidelity management company) because these fundsare supervised by different managers representing different shareholder groups.21 To mitigate the influence of outliers, we winsorize all continuous variables at the top and bottom 1% of their distributions.
395D.H. Erkens et al. / Journal of Corporate Finance 18 (2012) 389–411
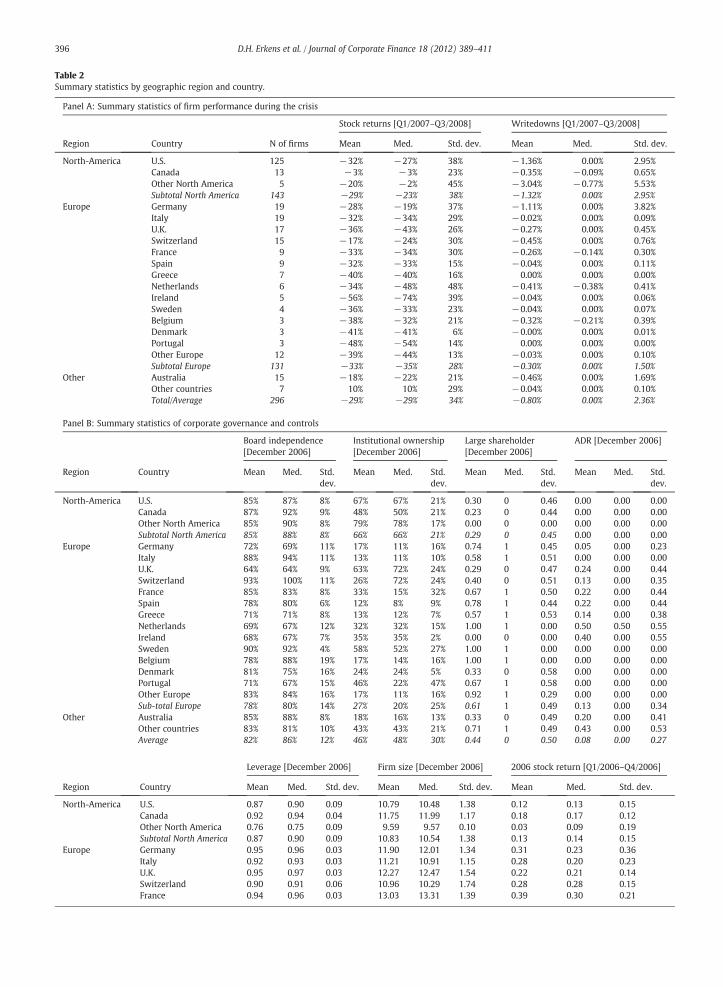
Table 2Summary statistics by geographic region and country.
Panel A: Summary statistics of firm performance during the crisis
Stock returns [Q1/2007–Q3/2008] Writedowns [Q1/2007–Q3/2008]
Region Country N of firms Mean Med. Std. dev. Mean Med. Std. dev.
North-America U.S. 125 −32% −27% 38% −1.36% 0.00% 2.95%Canada 13 −3% −3% 23% −0.35% −0.09% 0.65%Other North America 5 −20% −2% 45% −3.04% −0.77% 5.53%Subtotal North America 143 −29% −23% 38% −1.32% 0.00% 2.95%
Europe Germany 19 −28% −19% 37% −1.11% 0.00% 3.82%Italy 19 −32% −34% 29% −0.02% 0.00% 0.09%U.K. 17 −36% −43% 26% −0.27% 0.00% 0.45%Switzerland 15 −17% −24% 30% −0.45% 0.00% 0.76%France 9 −33% −34% 30% −0.26% −0.14% 0.30%Spain 9 −32% −33% 15% −0.04% 0.00% 0.11%Greece 7 −40% −40% 16% 0.00% 0.00% 0.00%Netherlands 6 −34% −48% 48% −0.41% −0.38% 0.41%Ireland 5 −56% −74% 39% −0.04% 0.00% 0.06%Sweden 4 −36% −33% 23% −0.04% 0.00% 0.07%Belgium 3 −38% −32% 21% −0.32% −0.21% 0.39%Denmark 3 −41% −41% 6% −0.00% 0.00% 0.01%Portugal 3 −48% −54% 14% 0.00% 0.00% 0.00%Other Europe 12 −39% −44% 13% −0.03% 0.00% 0.10%Subtotal Europe 131 −33% −35% 28% −0.30% 0.00% 1.50%
Other Australia 15 −18% −22% 21% −0.46% 0.00% 1.69%Other countries 7 10% 10% 29% −0.04% 0.00% 0.10%Total/Average 296 −29% −29% 34% −0.80% 0.00% 2.36%
Panel B: Summary statistics of corporate governance and controls
Board independence[December 2006]
Institutional ownership[December 2006]
Large shareholder[December 2006]
ADR [December 2006]
Region Country Mean Med. Std.dev.
Mean Med. Std.dev.
Mean Med. Std.dev.
Mean Med. Std.dev.
North-America U.S. 85% 87% 8% 67% 67% 21% 0.30 0 0.46 0.00 0.00 0.00Canada 87% 92% 9% 48% 50% 21% 0.23 0 0.44 0.00 0.00 0.00Other North America 85% 90% 8% 79% 78% 17% 0.00 0 0.00 0.00 0.00 0.00Subtotal North America 85% 88% 8% 66% 66% 21% 0.29 0 0.45 0.00 0.00 0.00
Europe Germany 72% 69% 11% 17% 11% 16% 0.74 1 0.45 0.05 0.00 0.23Italy 88% 94% 11% 13% 11% 10% 0.58 1 0.51 0.00 0.00 0.00U.K. 64% 64% 9% 63% 72% 24% 0.29 0 0.47 0.24 0.00 0.44Switzerland 93% 100% 11% 26% 72% 24% 0.40 0 0.51 0.13 0.00 0.35France 85% 83% 8% 33% 15% 32% 0.67 1 0.50 0.22 0.00 0.44Spain 78% 80% 6% 12% 8% 9% 0.78 1 0.44 0.22 0.00 0.44Greece 71% 71% 8% 13% 12% 7% 0.57 1 0.53 0.14 0.00 0.38Netherlands 69% 67% 12% 32% 32% 15% 1.00 1 0.00 0.50 0.50 0.55Ireland 68% 67% 7% 35% 35% 2% 0.00 0 0.00 0.40 0.00 0.55Sweden 90% 92% 4% 58% 52% 27% 1.00 1 0.00 0.00 0.00 0.00Belgium 78% 88% 19% 17% 14% 16% 1.00 1 0.00 0.00 0.00 0.00Denmark 81% 75% 16% 24% 24% 5% 0.33 0 0.58 0.00 0.00 0.00Portugal 71% 67% 15% 46% 22% 47% 0.67 1 0.58 0.00 0.00 0.00Other Europe 83% 84% 16% 17% 11% 16% 0.92 1 0.29 0.00 0.00 0.00Sub-total Europe 78% 80% 14% 27% 20% 25% 0.61 1 0.49 0.13 0.00 0.34
Other Australia 85% 88% 8% 18% 16% 13% 0.33 0 0.49 0.20 0.00 0.41Other countries 83% 81% 10% 43% 43% 21% 0.71 1 0.49 0.43 0.00 0.53Average 82% 86% 12% 46% 48% 30% 0.44 0 0.50 0.08 0.00 0.27
Leverage [December 2006] Firm size [December 2006] 2006 stock return [Q1/2006–Q4/2006]
Region Country Mean Med. Std. dev. Mean Med. Std. dev. Mean Med. Std. dev.
North-America U.S. 0.87 0.90 0.09 10.79 10.48 1.38 0.12 0.13 0.15Canada 0.92 0.94 0.04 11.75 11.99 1.17 0.18 0.17 0.12Other North America 0.76 0.75 0.09 9.59 9.57 0.10 0.03 0.09 0.19Subtotal North America 0.87 0.90 0.09 10.83 10.54 1.38 0.13 0.14 0.15
Europe Germany 0.95 0.96 0.03 11.90 12.01 1.34 0.31 0.23 0.36Italy 0.92 0.93 0.03 11.21 10.91 1.15 0.28 0.20 0.23U.K. 0.95 0.97 0.03 12.27 12.47 1.54 0.22 0.21 0.14Switzerland 0.90 0.91 0.06 10.96 10.29 1.74 0.28 0.28 0.15France 0.94 0.96 0.03 13.03 13.31 1.39 0.39 0.30 0.21
396 D.H. Erkens et al. / Journal of Corporate Finance 18 (2012) 389–411
4. Empirical results
4.1. Firm performance and corporate governance
We examine the relation between firm performance and corporate governance during the crisis by estimating models regres-sing buy-and-hold stock returns during the crisis on our corporate governance variables and control variables. Our variables ofinterest are the following three corporate governance mechanisms: (1) board independence, (2) institutional ownership, and(3) the presence of large shareholders. Following Mitton (2002), we include a dummy indicating whether a firm is cross-listedon U.S. stock exchanges, leverage, firm size, and dummy variables indicating a firm's industry (3-digit SIC) and country. 22, 23
In addition, we control for stock returns in 2006 because the performance during the crisis period may reflect a reversal ofpre-crisis performance (Beltratti and Stulz, 2010). We note that by including leverage, and industry and country dummies, ourmodel controls for differences in balance sheet characteristics and capital requirements across global financial institutions.Moreover, by including country dummies, our analysis essentially examines how the cross-sectional within-country variationin firm performance is related to within-country variation in corporate governance characteristics. To control for dependencein the error terms for firms within the same country, we use robust standard errors clustered by country. Our formal regressionmodel follows:
Firm perf ormance ¼ β0 þ β1 Board independenceð Þ þ β2 Institutional ownershipð Þ þ β3 Large shareholderð Þ þ β4 ADRð Þ
þ β5 Leverageð Þ þ β6 Firm sizeð Þ þ β7 2006 stock returnsð Þ þ βm DIndustryð Þ þ βn DCountryð Þ þ εð1Þ
Where:
Firm performance Buy-and-hold stock returns measured from the first quarter of 2007 until the end of the third quarter of 2008or the date on which the firm was delisted, whichever is earlier.
Board independence Percentage of nonexecutive directors, as of DecemberInstitutional ownership Percentage of shares owned by institutional investors, as of December 2006.Large shareholders A dummy variable equal to 1 if a firmhas a large ownerwith voting rights greater than 10%, as of December 2006.ADR A dummy variable indicating whether a firm is cross-listed on U.S. stock exchanges, as of December 2006.Leverage Total liabilities divided by total assets as of December 2006.Firm size Natural log of total assets as of December 2006.2006stock returns Buy-and-hold stock returns from January 2006 to December 2006.DIndustry Dummy variables indicating a firm's industry membership, based on 3-digit SIC.DCountry Dummy variables indicating a firm's country of incorporation.
Panel A of Table 3 presents the regression results. Columns (1)–(3) report the regression result including the corporategovernance factor one at a time and our control variables. Column (4) reports the results of our full regression model. Thepanel shows that the coefficients on board independence and institutional ownership are negative and significant, with pb5%(two-tailed), but the coefficient on the large shareholder indicator is insignificant at conventional levels. Thus, our analysis
Table 2 (continued)
Spain 0.94 0.94 0.02 11.49 11.47 1.41 0.36 0.36 0.10Greece 0.93 0.93 0.02 10.66 10.62 0.64 0.19 0.27 0.33Netherlands 0.95 0.96 0.02 12.80 13.39 1.66 0.13 0.15 0.09Ireland 0.96 0.97 0.02 12.00 12.19 0.50 0.25 0.25 0.10Sweden 0.96 0.96 0.00 12.56 12.51 0.35 0.24 0.26 0.13Belgium 0.95 0.94 0.02 12.70 12.97 0.99 0.14 0.13 0.06Denmark 0.95 0.94 0.01 11.09 10.25 1.74 0.43 0.30 0.34Portugal 0.94 0.94 0.02 11.19 11.26 0.41 0.37 0.31 0.17Other Europe 0.92 0.92 0.03 10.99 11.00 0.87 0.61 0.39 0.57Sub-total Europe 0.94 0.94 0.04 11.69 11.52 1.43 0.31 0.25 0.29
Other Australia 0.92 0.94 0.06 10.85 10.66 1.23 0.22 0.22 0.16Other countries 0.90 0.92 0.04 10.61 10.79 0.83 0.65 0.55 0.45Average 0.90 0.93 0.07 11.21 10.94 1.45 0.22 0.19 0.25
See Appendix B for variable definitions.
22 We do not control for a dummy variable indicating whether a firm has a Big N auditor as in Mitton (2002) because all but five of our sample firms have a BigFour auditor. Our additional sensitivity tests (untabulated) find that board independence and institutional ownership remain negative and significant at pb5%(two-tailed) in our analysis in Table 3 after excluding these five firms or including a dummy variable indicating a Big Four auditor.23 Although not the focus of our paper, we also explore the effect of country-specific governance factors on firm performance in an additional analysis inSection 5.
397D.H. Erkens et al. / Journal of Corporate Finance 18 (2012) 389–411
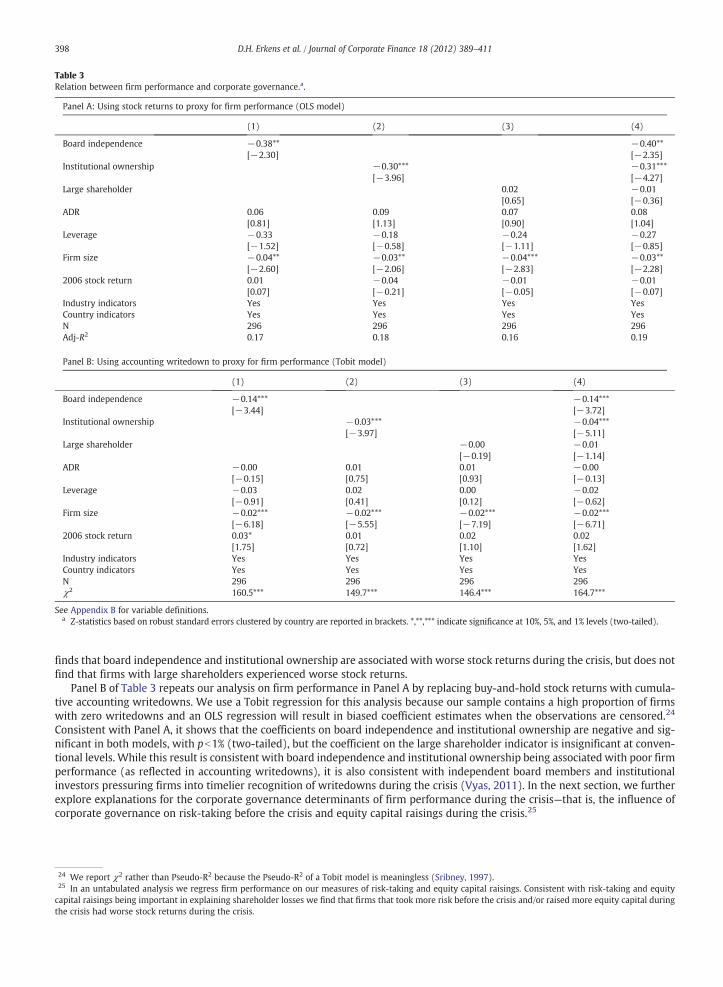
finds that board independence and institutional ownership are associated with worse stock returns during the crisis, but does notfind that firms with large shareholders experienced worse stock returns.
Panel B of Table 3 repeats our analysis on firm performance in Panel A by replacing buy-and-hold stock returns with cumula-tive accounting writedowns. We use a Tobit regression for this analysis because our sample contains a high proportion of firmswith zero writedowns and an OLS regression will result in biased coefficient estimates when the observations are censored.24
Consistent with Panel A, it shows that the coefficients on board independence and institutional ownership are negative and sig-nificant in both models, with pb1% (two-tailed), but the coefficient on the large shareholder indicator is insignificant at conven-tional levels. While this result is consistent with board independence and institutional ownership being associated with poor firmperformance (as reflected in accounting writedowns), it is also consistent with independent board members and institutionalinvestors pressuring firms into timelier recognition of writedowns during the crisis (Vyas, 2011). In the next section, we furtherexplore explanations for the corporate governance determinants of firm performance during the crisis—that is, the influence ofcorporate governance on risk-taking before the crisis and equity capital raisings during the crisis.25
24 We report χ2 rather than Pseudo-R2 because the Pseudo-R2 of a Tobit model is meaningless (Sribney, 1997).25 In an untabulated analysis we regress firm performance on our measures of risk-taking and equity capital raisings. Consistent with risk-taking and equitycapital raisings being important in explaining shareholder losses we find that firms that took more risk before the crisis and/or raised more equity capital duringthe crisis had worse stock returns during the crisis.
Table 3Relation between firm performance and corporate governance.a.
Panel A: Using stock returns to proxy for firm performance (OLS model)
(1) (2) (3) (4)
Board independence −0.38** −0.40**[−2.30] [−2.35]
Institutional ownership −0.30*** −0.31***[−3.96] [−4.27]
Large shareholder 0.02 −0.01[0.65] [−0.36]
ADR 0.06 0.09 0.07 0.08[0.81] [1.13] [0.90] [1.04]
Leverage −0.33 −0.18 −0.24 −0.27[−1.52] [−0.58] [−1.11] [−0.85]
Firm size −0.04** −0.03** −0.04*** −0.03**[−2.60] [−2.06] [−2.83] [−2.28]
2006 stock return 0.01 −0.04 −0.01 −0.01[0.07] [−0.21] [−0.05] [−0.07]
Industry indicators Yes Yes Yes YesCountry indicators Yes Yes Yes YesN 296 296 296 296Adj-R2 0.17 0.18 0.16 0.19
Panel B: Using accounting writedown to proxy for firm performance (Tobit model)
(1) (2) (3) (4)
Board independence −0.14*** −0.14***[−3.44] [−3.72]
Institutional ownership −0.03*** −0.04***[−3.97] [−5.11]
Large shareholder −0.00 −0.01[−0.19] [−1.14]
ADR −0.00 0.01 0.01 −0.00[−0.15] [0.75] [0.93] [−0.13]
Leverage −0.03 0.02 0.00 −0.02[−0.91] [0.41] [0.12] [−0.62]
Firm size −0.02*** −0.02*** −0.02*** −0.02***[−6.18] [−5.55] [−7.19] [−6.71]
2006 stock return 0.03* 0.01 0.02 0.02[1.75] [0.72] [1.10] [1.62]
Industry indicators Yes Yes Yes YesCountry indicators Yes Yes Yes YesN 296 296 296 296χ2 160.5*** 149.7*** 146.4*** 164.7***
See Appendix B for variable definitions.a Z-statistics based on robust standard errors clustered by country are reported in brackets. *,**,*** indicate significance at 10%, 5%, and 1% levels (two-tailed).
398 D.H. Erkens et al. / Journal of Corporate Finance 18 (2012) 389–411
4.2. The influence of corporate governance on pre-crisis risk-taking
One explanation for why firm performance is worse during the crisis for firms with more independent boards and institutionalownership is that boards and shareholders encouraged managers to increase shareholder returns by taking more risk prior tothe crisis. Prior literature argues that managers that have accumulated firm-specific human capital and enjoy private benefitsof control tend to seek a lower level of risk than shareholders that do not have those skills and privileges (Laeven and Levine,2009). One implication from this literature is that external monitoring by boards and shareholders will encourage risk-takingto increase shareholder returns.
We test the risk-taking explanation by regressing our proxies of risk-taking on the corporate governance factors and the sameset of control variables used in the previous analysis. We use two risk-taking proxies: expected default probability (EDF) andstock return volatility. We obtain EDF from Moody's KMV CreditMonitor. The EDF measure is an implementation of Merton's(1974) structural model and has been used in prior studies to capture credit risk (Covitz and Downing, 2007). It uses financialstatement data, equity market information, and proprietary data on the empirical distribution of defaults to estimate the proba-bility that a firm will default within one year, which in Moody's KMV scale ranges from 0.01% to 35%. Following Covitz andDowning (2007), we use the log of EDF (as of December 2006, prior to the crisis) as a measure of risk in our analysis. We measurestock return volatility as the standard deviation of weekly stock returns from January 2004 to December 2006. Our formal regres-sion model follows:
Risk−taking ¼ β0 þ β1 Board independenceð Þ þ β2 Institutional ownershipð Þ þ β3 Large shareholderð Þ þ β4 ADRð Þ
þ β5 Leverageð Þ þ β6 Firm sizeð Þ þ β7 2006 stock returnsð Þ þ βm DIndustryð Þ þ βn DCountryð Þ þ εð1Þ
Where:
Two proxies for risk taking as follows:LogEDF Natural logarithm of EDF, as of December 2006.Stock return volatility Standard deviation of weekly stock returns, measured from January 2004 to December 2006.
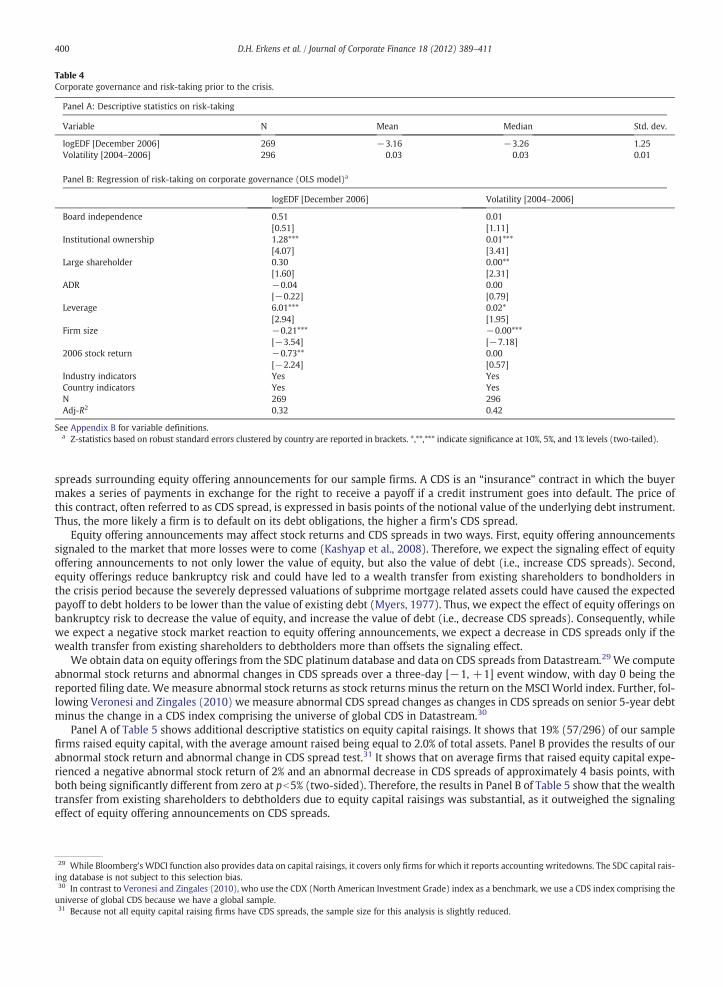
See Eq. (1) for definitions of other variables.Panel A of Table 4 presents the descriptive statistics of our risk-taking measures: logEDF and volatility.26 Panel B of Table 4
reports the results of regressing pre-crisis risk-taking on corporate governance. The panel shows that the coefficient on institutionalownership is positive and significant in both models, with pb1% (two-tailed). Thus, our results are consistent with institutionalinvestors having encouraged managers to increase shareholder returns through greater risk-taking.
The analysis in Panel B of Table 4, however, shows that the coefficient on board independence is insignificant in bothmodels.27
Therefore, while pre-crisis risk-taking can explain why firms with larger institutional ownership experienced worse stock returnsduring the crisis period, it does not explain why firms with more independent boards performed worse. To provide further insightinto the factors that drive the inverse relation between firm performance during the crisis and board independence, we nextexplore the influence of corporate governance on equity capital raisings during the crisis.
4.3. The influence of corporate governance on equity capital raisings during the crisis
An alternative explanation for why firms with more independent boards experienced worse stock returns during the crisis isthat independent board members encouraged managers to raise equity capital during the crisis period to ensure capital adequacyand reduce bankruptcy risk. In addition, prior studies suggest that an important role of independent directorships is to ensuretransparent financial reporting (Anderson et al., 2004; Klein, 2002). During the crisis period transparent reporting implied thetimely recognition of losses related to subprime mortgages. Because the recognition of losses led to lower capital adequacy ratios,firms had to resort to raising equity capital to avoid regulatory intervention when they recognized losses related to subprimemortgage related assets. Raising equity capital, however, was very costly during the crisis period. It could have led to worsestock returns during the crisis because it caused a wealth transfer from existing equity holders to debtholders (Kashyap et al.,2008; Myers, 1977).28
To examine whether equity capital raisings led to a wealth transfer from existing shareholders to debtholders we perform anevent study in which we examine cumulative abnormal stock returns and abnormal changes in CDS (credit default swaps)
26 The number of observations for our EDF regressions is smaller because of the additional data requirement.27 We also perform a sensitivity test in which we use idiosyncratic volatility as a proxy for risk-taking. We compute this variable by measuring the standarddeviation of the residuals from a market model (using the MSCI World index as the market index) based on weekly stock returns from January 2004 to December2006. The results (untabulated) remain qualitatively the same as those reported in Panel B of Table 4. Specifically, the coefficient on institutional ownership con-tinues to be positive and significant at pb5% (two-tailed) and the coefficient on board independence continues to be insignificant.28 Consistent with equity capital raisings lowering shareholder returns during the crisis period, Kashyap et al. (2008, p. 3) state that capital raising tends to besluggish during the crisis because “not only is capital a relatively costly mode of funding at all times, it is particularly costly for a bank to raise new capital duringtimes of great uncertainty.”
399D.H. Erkens et al. / Journal of Corporate Finance 18 (2012) 389–411
spreads surrounding equity offering announcements for our sample firms. A CDS is an “insurance” contract in which the buyermakes a series of payments in exchange for the right to receive a payoff if a credit instrument goes into default. The price ofthis contract, often referred to as CDS spread, is expressed in basis points of the notional value of the underlying debt instrument.Thus, the more likely a firm is to default on its debt obligations, the higher a firm's CDS spread.
Equity offering announcements may affect stock returns and CDS spreads in two ways. First, equity offering announcementssignaled to the market that more losses were to come (Kashyap et al., 2008). Therefore, we expect the signaling effect of equityoffering announcements to not only lower the value of equity, but also the value of debt (i.e., increase CDS spreads). Second,equity offerings reduce bankruptcy risk and could have led to a wealth transfer from existing shareholders to bondholders inthe crisis period because the severely depressed valuations of subprime mortgage related assets could have caused the expectedpayoff to debt holders to be lower than the value of existing debt (Myers, 1977). Thus, we expect the effect of equity offerings onbankruptcy risk to decrease the value of equity, and increase the value of debt (i.e., decrease CDS spreads). Consequently, whilewe expect a negative stock market reaction to equity offering announcements, we expect a decrease in CDS spreads only if thewealth transfer from existing shareholders to debtholders more than offsets the signaling effect.
We obtain data on equity offerings from the SDC platinum database and data on CDS spreads from Datastream.29 We computeabnormal stock returns and abnormal changes in CDS spreads over a three-day [−1, +1] event window, with day 0 being thereported filing date. We measure abnormal stock returns as stock returns minus the return on the MSCI World index. Further, fol-lowing Veronesi and Zingales (2010) we measure abnormal CDS spread changes as changes in CDS spreads on senior 5-year debtminus the change in a CDS index comprising the universe of global CDS in Datastream.30
Panel A of Table 5 shows additional descriptive statistics on equity capital raisings. It shows that 19% (57/296) of our samplefirms raised equity capital, with the average amount raised being equal to 2.0% of total assets. Panel B provides the results of ourabnormal stock return and abnormal change in CDS spread test.31 It shows that on average firms that raised equity capital expe-rienced a negative abnormal stock return of 2% and an abnormal decrease in CDS spreads of approximately 4 basis points, withboth being significantly different from zero at pb5% (two-sided). Therefore, the results in Panel B of Table 5 show that the wealthtransfer from existing shareholders to debtholders due to equity capital raisings was substantial, as it outweighed the signalingeffect of equity offering announcements on CDS spreads.
29 While Bloomberg's WDCI function also provides data on capital raisings, it covers only firms for which it reports accounting writedowns. The SDC capital rais-ing database is not subject to this selection bias.30 In contrast to Veronesi and Zingales (2010), who use the CDX (North American Investment Grade) index as a benchmark, we use a CDS index comprising theuniverse of global CDS because we have a global sample.31 Because not all equity capital raising firms have CDS spreads, the sample size for this analysis is slightly reduced.
Table 4Corporate governance and risk-taking prior to the crisis.
Panel A: Descriptive statistics on risk-taking
Variable N Mean Median Std. dev.
logEDF [December 2006] 269 −3.16 −3.26 1.25Volatility [2004–2006] 296 0.03 0.03 0.01
Panel B: Regression of risk-taking on corporate governance (OLS model)a
logEDF [December 2006] Volatility [2004–2006]
Board independence 0.51 0.01[0.51] [1.11]
Institutional ownership 1.28*** 0.01***[4.07] [3.41]
Large shareholder 0.30 0.00**[1.60] [2.31]
ADR −0.04 0.00[−0.22] [0.79]
Leverage 6.01*** 0.02*[2.94] [1.95]
Firm size −0.21*** −0.00***[−3.54] [−7.18]
2006 stock return −0.73** 0.00[−2.24] [0.57]
Industry indicators Yes YesCountry indicators Yes YesN 269 296Adj-R2 0.32 0.42
See Appendix B for variable definitions.a Z-statistics based on robust standard errors clustered by country are reported in brackets. *,**,*** indicate significance at 10%, 5%, and 1% levels (two-tailed).
400 D.H. Erkens et al. / Journal of Corporate Finance 18 (2012) 389–411
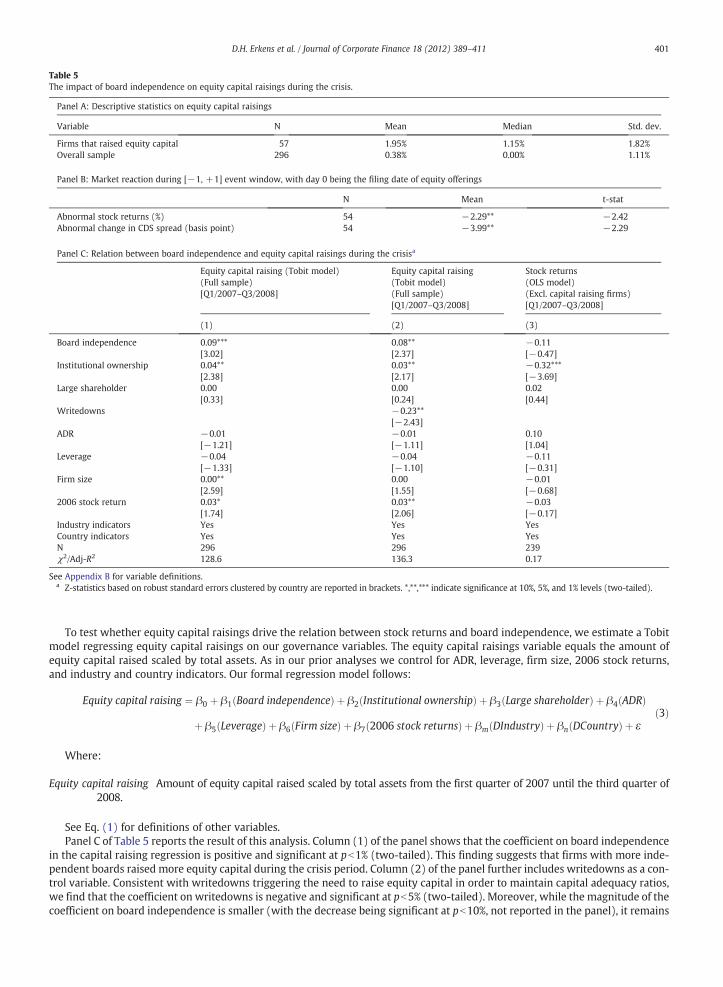
To test whether equity capital raisings drive the relation between stock returns and board independence, we estimate a Tobitmodel regressing equity capital raisings on our governance variables. The equity capital raisings variable equals the amount ofequity capital raised scaled by total assets. As in our prior analyses we control for ADR, leverage, firm size, 2006 stock returns,and industry and country indicators. Our formal regression model follows:
Equity capital raising ¼ β0 þ β1 Board independenceð Þ þ β2 Institutional ownershipð Þ þ β3 Large shareholderð Þ þ β4 ADRð Þ
þ β5 Leverageð Þ þ β6 Firm sizeð Þ þ β7 2006 stock returnsð Þ þ βm DIndustryð Þ þ βn DCountryð Þ þ εð3Þ
Where:
Equity capital raising Amount of equity capital raised scaled by total assets from the first quarter of 2007 until the third quarter of2008.
See Eq. (1) for definitions of other variables.Panel C of Table 5 reports the result of this analysis. Column (1) of the panel shows that the coefficient on board independence
in the capital raising regression is positive and significant at pb1% (two-tailed). This finding suggests that firms with more inde-pendent boards raised more equity capital during the crisis period. Column (2) of the panel further includes writedowns as a con-trol variable. Consistent with writedowns triggering the need to raise equity capital in order to maintain capital adequacy ratios,we find that the coefficient on writedowns is negative and significant at pb5% (two-tailed). Moreover, while the magnitude of thecoefficient on board independence is smaller (with the decrease being significant at pb10%, not reported in the panel), it remains
Table 5The impact of board independence on equity capital raisings during the crisis.
Panel A: Descriptive statistics on equity capital raisings
Variable N Mean Median Std. dev.
Firms that raised equity capital 57 1.95% 1.15% 1.82%Overall sample 296 0.38% 0.00% 1.11%
Panel B: Market reaction during [−1, +1] event window, with day 0 being the filing date of equity offerings
N Mean t-stat
Abnormal stock returns (%) 54 −2.29** −2.42Abnormal change in CDS spread (basis point) 54 −3.99** −2.29
Panel C: Relation between board independence and equity capital raisings during the crisisa
Equity capital raising (Tobit model)(Full sample)[Q1/2007–Q3/2008]
Equity capital raising(Tobit model)(Full sample)[Q1/2007–Q3/2008]
Stock returns(OLS model)(Excl. capital raising firms)[Q1/2007–Q3/2008]
(1) (2) (3)
Board independence 0.09*** 0.08** −0.11[3.02] [2.37] [−0.47]
Institutional ownership 0.04** 0.03** −0.32***[2.38] [2.17] [−3.69]
Large shareholder 0.00 0.00 0.02[0.33] [0.24] [0.44]
Writedowns −0.23**[−2.43]
ADR −0.01 −0.01 0.10[−1.21] [−1.11] [1.04]
Leverage −0.04 −0.04 −0.11[−1.33] [−1.10] [−0.31]
Firm size 0.00** 0.00 −0.01[2.59] [1.55] [−0.68]
2006 stock return 0.03* 0.03** −0.03[1.74] [2.06] [−0.17]
Industry indicators Yes Yes YesCountry indicators Yes Yes YesN 296 296 239χ2/Adj-R2 128.6 136.3 0.17
See Appendix B for variable definitions.a Z-statistics based on robust standard errors clustered by country are reported in brackets. *,**,*** indicate significance at 10%, 5%, and 1% levels (two-tailed).
401D.H. Erkens et al. / Journal of Corporate Finance 18 (2012) 389–411
positive and significant at pb5% (two-tailed). This finding is consistent with not only disclosure considerations, but also otherfactors such as the risk of bankruptcy explaining why independent board members pushed their firms into raising equity capitalduring the crisis.
Column (3) of Panel C excludes firms that raised equity capital during the crisis and repeats the analysis in Panel A of Table 3,in which we examine the relation between stock returns and corporate governance. If the inverse relation between firm perfor-mance and board independence is mainly driven by independent board members pressuring firms to raise equity capital duringthe crisis, we expect the coefficient on board independence to become insignificant. Consistent with this prediction, column(3) shows that once we eliminate firms that raised equity capital during the crisis period from our sample, the coefficient onboard independence becomes insignificant. Thus, the evidence in Panel C of Table 5 suggests that the inverse relation betweenstock returns during the crisis and board independence is driven by equity capital raisings.
5. Additional analyses
5.1. The effect of equity capital raisings on firm survival and long term performance
While equity capital raisings may have led to poor performance during the crisis, they also may have helped firms survive thecrisis and perform better after the crisis. We explore this issue by performing additional analyses in which we examine whetherequity capital raisings had a positive impact on the likelihood that a firm survived the financial crisis and firm performance overthe long run.
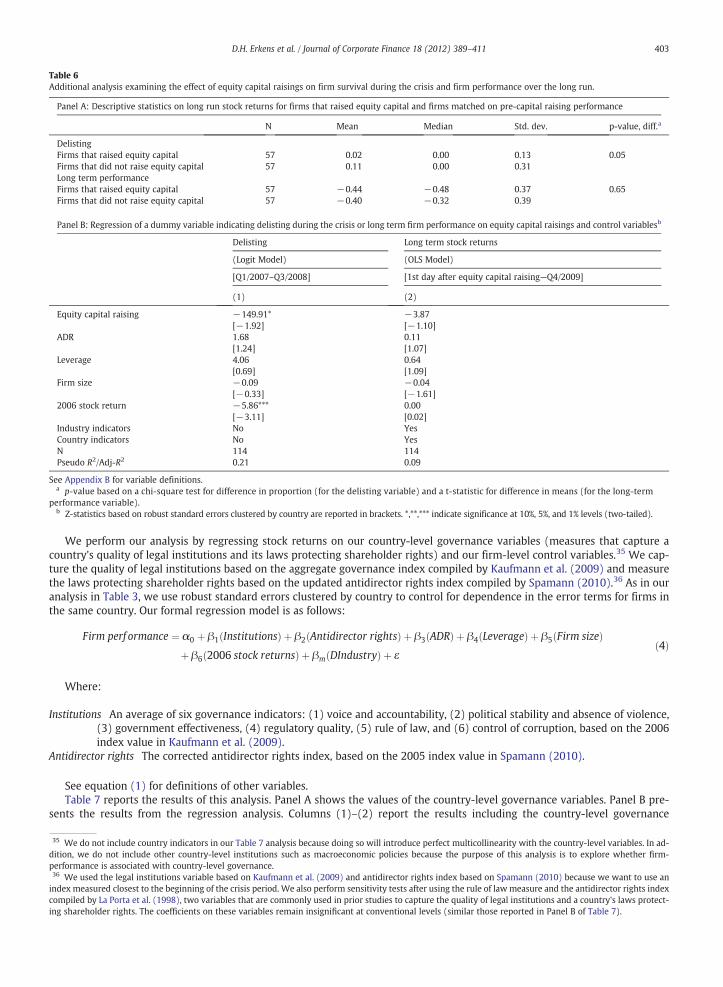
To ensure that our results are not driven by equity capital raising firms having worse performance than non-equity capital rais-ing firms, we perform our tests using amatched pair design. Specifically, wematch each capital raising firm to one non-capital rais-ing firm using buy-and-hold returns measured from the beginning of our sample period to the date on which the firm firstannounced equity capital raisings. We require each matched pair to have buy-and-hold returns that differ less than 10% in thesame time period. To capturewhether a firm survived the crisis, we use a dummy variable indicatingwhether the firmwas delistedduring the crisis period. To capture long-term performance subsequent to equity capital raisings, we measure buy-and-hold stockreturns from the first day after the first equity capital raising announcement until December 2009.32 We compute long term per-formance for control firms using the long term performancemeasurement period of the firm that they are matched to. We end theperformancemeasurement period 15 months after the crisis period (December 2009) because by then the stockmarket recoveredmost of the losses it suffered during the crisis, and the market has remained relatively flat since then.33
Table 6 reports the results of this analysis. Panel A of the table provides descriptive statistics on delisting and long term per-formance partitioned on whether a firm raised equity capital during our sample period. Consistent with equity capital raisingshelping firms survive during the crisis, the panel shows that equity capital raising firms are less likely to be delisted. However,inconsistent with equity capital raisings helping firms perform better, the panel shows that capital raising firms have similarlong term performance as non-capital raising firms.
Column (1) in Panel B of Table 6 reports the results of regressing a dummy variable that captures whether a firm was delistedduring our sample period on equity capital raisings and control variables.34 Consistent with equity capital raisings reducing bank-ruptcy risk, we find that the coefficient on equity capital raisings is negative and significant at pb10% (two-tailed). Column (2) ofthe panel reports the results of regressing equity capital raisings on long term performance and controls. Inconsistent with equitycapital raisings helping firms perform better after the crisis, we find that the coefficient on equity capital raisings is insignificant.Thus, although equity capital raisings helped firms survive the crisis, our results do not suggest that they helped firms performbetter in the long term.
We caution that the lack of evidence on the positive effect of equity capital raisings on long term firm performance may be dueto regulatory interventions such as the TARP. That is, the massive government bailout such as the TARP initiated in October 2008may have attenuated the positive effect of equity capital raisings on firms' long term performance.
5.2. Additional analysis on country-level governance
Our primary analysis focuses on the role of corporate boards and ownership structure, two key firm-level governance mech-anisms (Denis and McConnell, 2003). The international corporate governance literature suggests that another important dimen-sion of corporate governance is the external governance mechanism in a country, primarily the legal institutions that protectshareholder rights, both in terms of the quality of legal institutions and a country's laws protecting shareholder rights (LaPorta et al., 1998). Since our primary analysis includes country indicators to control for country-specific factors, it does notaddress how country-level legal institutions influenced the performance of global financial institutions during the crisis. In thissection, we explore the influence of country-level governance on firm performance.
32 We find similar results when we start the performance measurement period one month after the first equity capital raising announcement.33 Ending the measurement period in December 2009 also ensures that our results are not influenced by actions that boards took in response to the Europeansovereign debt crisis that erupted in 2010.34 We do not include country and industry indicators in the logit model in Column (1) because more than half of the observations in our matched sample wouldotherwise be dropped. This occurs because country and industry indicators that do not represent at least one delisted firm and one non-delisted firm perfectlyexplain the dependent measure in the logit model. In an untabulated analysis we find similar results when we include the country and industry indicators usingour full sample.
402 D.H. Erkens et al. / Journal of Corporate Finance 18 (2012) 389–411
We perform our analysis by regressing stock returns on our country-level governance variables (measures that capture acountry's quality of legal institutions and its laws protecting shareholder rights) and our firm-level control variables.35 We cap-ture the quality of legal institutions based on the aggregate governance index compiled by Kaufmann et al. (2009) and measurethe laws protecting shareholder rights based on the updated antidirector rights index compiled by Spamann (2010).36 As in ouranalysis in Table 3, we use robust standard errors clustered by country to control for dependence in the error terms for firms inthe same country. Our formal regression model is as follows:
Firm perf ormance ¼ α0 þ β1 Institutionsð Þ þ β2 Antidirector rightsð Þ þ β3 ADRð Þ þ β4 Leverageð Þ þ β5 Firm sizeð Þþ β6 2006 stock returnsð Þ þ βm DIndustryð Þ þ ε
ð4Þ
Where:
Institutions An average of six governance indicators: (1) voice and accountability, (2) political stability and absence of violence,(3) government effectiveness, (4) regulatory quality, (5) rule of law, and (6) control of corruption, based on the 2006index value in Kaufmann et al. (2009).
Antidirector rights The corrected antidirector rights index, based on the 2005 index value in Spamann (2010).
See equation (1) for definitions of other variables.Table 7 reports the results of this analysis. Panel A shows the values of the country-level governance variables. Panel B pre-
sents the results from the regression analysis. Columns (1)–(2) report the results including the country-level governance
35 We do not include country indicators in our Table 7 analysis because doing so will introduce perfect multicollinearity with the country-level variables. In ad-dition, we do not include other country-level institutions such as macroeconomic policies because the purpose of this analysis is to explore whether firm-performance is associated with country-level governance.36 We used the legal institutions variable based on Kaufmann et al. (2009) and antidirector rights index based on Spamann (2010) because we want to use anindex measured closest to the beginning of the crisis period. We also perform sensitivity tests after using the rule of law measure and the antidirector rights indexcompiled by La Porta et al. (1998), two variables that are commonly used in prior studies to capture the quality of legal institutions and a country's laws protect-ing shareholder rights. The coefficients on these variables remain insignificant at conventional levels (similar those reported in Panel B of Table 7).
Table 6Additional analysis examining the effect of equity capital raisings on firm survival during the crisis and firm performance over the long run.
Panel A: Descriptive statistics on long run stock returns for firms that raised equity capital and firms matched on pre-capital raising performance
N Mean Median Std. dev. p-value, diff.a
DelistingFirms that raised equity capital 57 0.02 0.00 0.13 0.05Firms that did not raise equity capital 57 0.11 0.00 0.31Long term performanceFirms that raised equity capital 57 −0.44 −0.48 0.37 0.65Firms that did not raise equity capital 57 −0.40 −0.32 0.39
Panel B: Regression of a dummy variable indicating delisting during the crisis or long term firm performance on equity capital raisings and control variablesb
Delisting Long term stock returns
(Logit Model) (OLS Model)
[Q1/2007–Q3/2008] [1st day after equity capital raising—Q4/2009]
(1) (2)
Equity capital raising −149.91* −3.87[−1.92] [−1.10]
ADR 1.68 0.11[1.24] [1.07]
Leverage 4.06 0.64[0.69] [1.09]
Firm size −0.09 −0.04[−0.33] [−1.61]
2006 stock return −5.86*** 0.00[−3.11] [0.02]
Industry indicators No YesCountry indicators No YesN 114 114Pseudo R2/Adj-R2 0.21 0.09
See Appendix B for variable definitions.a p-value based on a chi-square test for difference in proportion (for the delisting variable) and a t-statistic for difference in means (for the long-term
performance variable).b Z-statistics based on robust standard errors clustered by country are reported in brackets. *,**,*** indicate significance at 10%, 5%, and 1% levels (two-tailed).
403D.H. Erkens et al. / Journal of Corporate Finance 18 (2012) 389–411
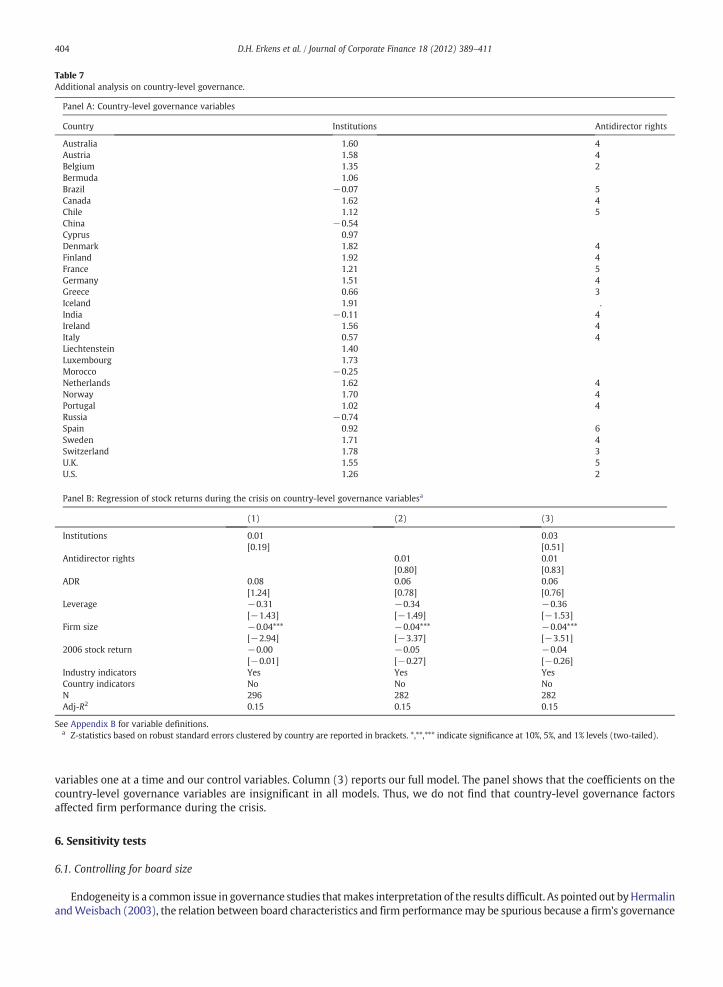
variables one at a time and our control variables. Column (3) reports our full model. The panel shows that the coefficients on thecountry-level governance variables are insignificant in all models. Thus, we do not find that country-level governance factorsaffected firm performance during the crisis.
6. Sensitivity tests
6.1. Controlling for board size
Endogeneity is a common issue in governance studies thatmakes interpretation of the results difficult. As pointed out byHermalinandWeisbach (2003), the relation between board characteristics and firm performancemay be spurious because a firm's governance
Table 7Additional analysis on country-level governance.
Panel A: Country-level governance variables
Country Institutions Antidirector rights
Australia 1.60 4Austria 1.58 4Belgium 1.35 2Bermuda 1.06Brazil −0.07 5Canada 1.62 4Chile 1.12 5China −0.54Cyprus 0.97Denmark 1.82 4Finland 1.92 4France 1.21 5Germany 1.51 4Greece 0.66 3Iceland 1.91 .India −0.11 4Ireland 1.56 4Italy 0.57 4Liechtenstein 1.40Luxembourg 1.73Morocco −0.25Netherlands 1.62 4Norway 1.70 4Portugal 1.02 4Russia −0.74Spain 0.92 6Sweden 1.71 4Switzerland 1.78 3U.K. 1.55 5U.S. 1.26 2
Panel B: Regression of stock returns during the crisis on country-level governance variablesa
(1) (2) (3)
Institutions 0.01 0.03[0.19] [0.51]
Antidirector rights 0.01 0.01[0.80] [0.83]
ADR 0.08 0.06 0.06[1.24] [0.78] [0.76]
Leverage −0.31 −0.34 −0.36[−1.43] [−1.49] [−1.53]
Firm size −0.04*** −0.04*** −0.04***[−2.94] [−3.37] [−3.51]
2006 stock return −0.00 −0.05 −0.04[−0.01] [−0.27] [−0.26]
Industry indicators Yes Yes YesCountry indicators No No NoN 296 282 282Adj-R2 0.15 0.15 0.15
See Appendix B for variable definitions.a Z-statistics based on robust standard errors clustered by country are reported in brackets. *,**,*** indicate significance at 10%, 5%, and 1% levels (two-tailed).
404 D.H. Erkens et al. / Journal of Corporate Finance 18 (2012) 389–411
structure and performance are endogenously determined. While this issue is less likely to be problematic in our setting because thefinancial crisis is largely an exogenous macroeconomic shock, we attempt to mitigate this concern by focusing on how key corporategovernance characteristics impact firm actions. For example, our examination of the negative relation between board independenceand firmperformance during the crisis is inconsistentwith this relation being spuriously driven by past performance, but is consistentwith this relation being driven by independent directors' influence on equity capital raisings.
Since governance variables tend to be highly correlated, correlated omitted variables remain a concern. The exclusion of boardsize from our analysis may particularly be a concern because firms with more complex operations may have performed worseduring the crisis and prior literature suggests that board size is associated with board independence and operating complexity(Adams and Mehran, 2011; Linck et al., 2009). To the extent that our control variables such as firm size and leverage do not ad-equately control for complexity, it is possible that our results with respect to board independence are driven by board size. Thus,we repeat our analysis in Panel A of Table 3 after further controlling for board size. Following Adams and Mehran (2011), we usethree alternative measures of board size: the natural logarithm of the number of board members, the number of board members,and a piecewise linear specification. For the piecewise linear specification we divide board size into its terciles of 7–11, 12–14 and15–31 directors and allow for different intercepts on the terciles.
Panel A of Table 8 reports the results of this analysis. We find that our results remain qualitatively similar to those reported inPanel A of Table 3.37 Thus, our conclusion on the relation between crisis-period performance and corporate governance is not sen-sitive to controlling for board size.
6.2. Controlling for additional board and ownership characteristics
In addition, to explore whether our results are sensitive to controlling for other board characteristics that potentially affect theoversight of risk management and financing policies by corporate boards, we repeat our analysis in Panel A of Table 3 after includ-ing the following board characteristics: Risk committee (a dummy variable indicating whether the firm has a risk committee),Board financial expertise (percentage of nonexecutive directors that either has a CFA/CPA or has worked in accounting or financefunctions), and CEO-chairman duality (a dummy variable indicating whether the CEO also serves as the chairman of the board).Moreover, we include Closely held shares (the percentage of shares held by insiders) to control for ownership characteristicsthat are potentially correlated with the level of institutional ownership and the presence of large shareholders.
We obtain the additional board characteristics from BoardEx and the closely held shares data fromWorldscope. We then repeatour analysis in Panel A of Table 3 after controlling for the additional board and ownership characteristics. Panel B of Table 8 re-ports the results of this analysis. Columns (1)–(4) report the results after including the additional board and ownership charac-teristics one at a time. Column (5) reports the results of the full model regression.38 We find that our results continue to bequalitatively similar to those reported in Panel A of Table 3. Thus, our conclusion on the relation between crisis-period perfor-mance and corporate governance is not sensitive to controlling for additional board and ownership characteristics.
6.3. Using an alternative definition of the crisis period
We define our crisis period as starting in the beginning of 2007 because according to Ryan (2008) the first wave of the crisisstarted in early 2007.39 While our definition of the crisis period is comprehensive, we note that the credit crunch did not reallybegin until the second wave, which started in July 2007 (Ryan, 2008). Thus, we also perform a sensitivity test in which wererun our full model regression in Panel A of Table 3 after using July 2007 as the start of the crisis period. In addition, while weend the crisis period in the third quarter of 2008 to avoid the confounding effects of government intervention, we also performa sensitivity test using an alternative crisis period from July 2007 to December 2008, as in Beltratti and Stulz (2010).
Panel C of Table 8 reports the results of this analysis. Column (1) reports the results after defining the crisis period as startingin July 2007 and ending in September 2008 (Q3/07–Q3/08) and column (2) reports the results after defining the crisis period asstarting in July 2007 and ending in December 2008 (Q3/07–Q4/08). We dropped two firms from our sample that delisted duringJanuary 2007–July 2007 (i.e., prior to the start of our alternative definitions of the crisis period). We find that the results from thisanalysis are qualitatively similar to those reported in Panel A of Table 3. Thus, our conclusion on the relation between firm per-formance during the crisis and governance is not sensitive to alternative definitions of the crisis period.
6.3. Using an alternative measure of stock returns
Our primary analysis uses raw stock returns to capture firm performance. Although we control for cross-industry and cross-country variation in stock returns by including industry and country indicators, we also perform a sensitivity test using abnormal
37 In an unreported analysis, we find that all coefficients on the board size partitions are insignificant when we use partitions based on the median of board sizeand partitions based on the quartiles of board size. Thus, there is no clear relation between board size and performance during the financial crisis.38 The number of observations in Columns (4) and (5) of Panel B, Table 8 is slightly smaller due to the additional data requirement on closely held shares.39 Specifically, on February 7, 2007, New Century Financial announced restating its financial reports due to inadequate allowance for repurchase losses on mort-gages. On the same day, HSBC announced that its aggregate loan impairments and loss provisions would be substantially higher than expected due to deterio-rating conditions in the U.S. housing market and increased subprime mortgage defaults.
405D.H. Erkens et al. / Journal of Corporate Finance 18 (2012) 389–411
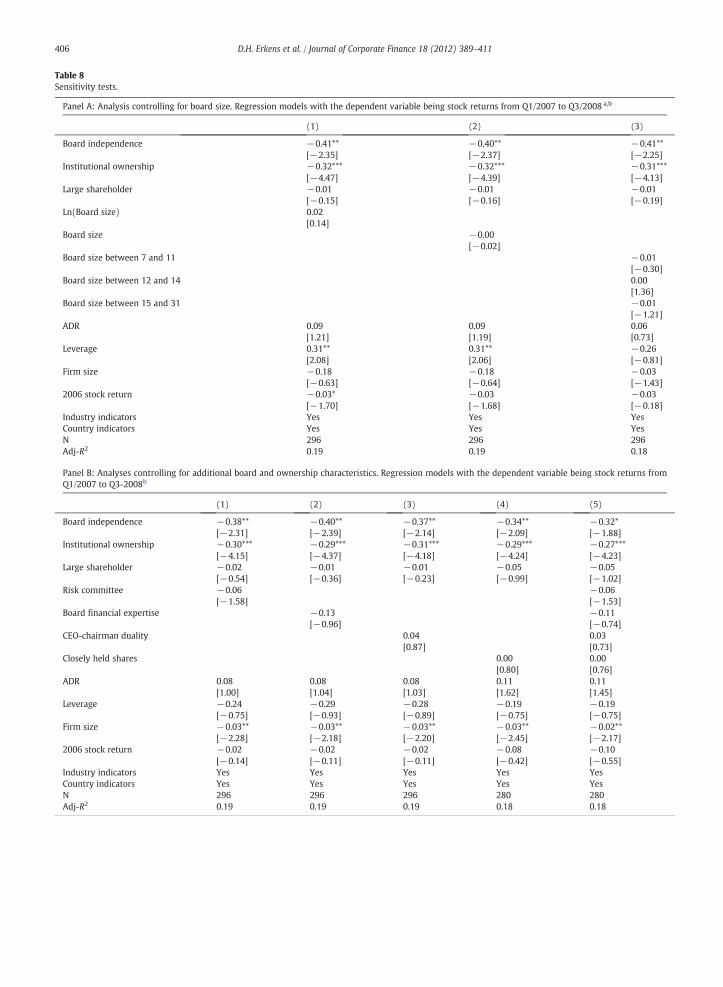
Table 8Sensitivity tests.
Panel A: Analysis controlling for board size. Regression models with the dependent variable being stock returns from Q1/2007 to Q3/2008 a,b
(1) (2) (3)
Board independence −0.41** −0.40** −0.41**[−2.35] [−2.37] [−2.25]
Institutional ownership −0.32*** −0.32*** −0.31***[−4.47] [−4.39] [−4.13]
Large shareholder −0.01 −0.01 −0.01[−0.15] [−0.16] [−0.19]
Ln(Board size) 0.02[0.14]
Board size −0.00[−0.02]
Board size between 7 and 11 −0.01[−0.30]
Board size between 12 and 14 0.00[1.36]
Board size between 15 and 31 −0.01[−1.21]
ADR 0.09 0.09 0.06[1.21] [1.19] [0.73]
Leverage 0.31** 0.31** −0.26[2.08] [2.06] [−0.81]
Firm size −0.18 −0.18 −0.03[−0.63] [−0.64] [−1.43]
2006 stock return −0.03* −0.03 −0.03[−1.70] [−1.68] [−0.18]
Industry indicators Yes Yes YesCountry indicators Yes Yes YesN 296 296 296Adj-R2 0.19 0.19 0.18
Panel B: Analyses controlling for additional board and ownership characteristics. Regression models with the dependent variable being stock returns fromQ1/2007 to Q3-2008b
(1) (2) (3) (4) (5)
Board independence −0.38** −0.40** −0.37** −0.34** −0.32*[−2.31] [−2.39] [−2.14] [−2.09] [−1.88]
Institutional ownership −0.30*** −0.29*** −0.31*** −0.29*** −0.27***[−4.15] [−4.37] [−4.18] [−4.24] [−4.23]
Large shareholder −0.02 −0.01 −0.01 −0.05 −0.05[−0.54] [−0.36] [−0.23] [−0.99] [−1.02]
Risk committee −0.06 −0.06[−1.58] [−1.53]
Board financial expertise −0.13 −0.11[−0.96] [−0.74]
CEO-chairman duality 0.04 0.03[0.87] [0.73]
Closely held shares 0.00 0.00[0.80] [0.76]
ADR 0.08 0.08 0.08 0.11 0.11[1.00] [1.04] [1.03] [1.62] [1.45]
Leverage −0.24 −0.29 −0.28 −0.19 −0.19[−0.75] [−0.93] [−0.89] [−0.75] [−0.75]
Firm size −0.03** −0.03** −0.03** −0.03** −0.02**[−2.28] [−2.18] [−2.20] [−2.45] [−2.17]
2006 stock return −0.02 −0.02 −0.02 −0.08 −0.10[−0.14] [−0.11] [−0.11] [−0.42] [−0.55]
Industry indicators Yes Yes Yes Yes YesCountry indicators Yes Yes Yes Yes YesN 296 296 296 280 280Adj-R2 0.19 0.19 0.19 0.18 0.18
406 D.H. Erkens et al. / Journal of Corporate Finance 18 (2012) 389–411
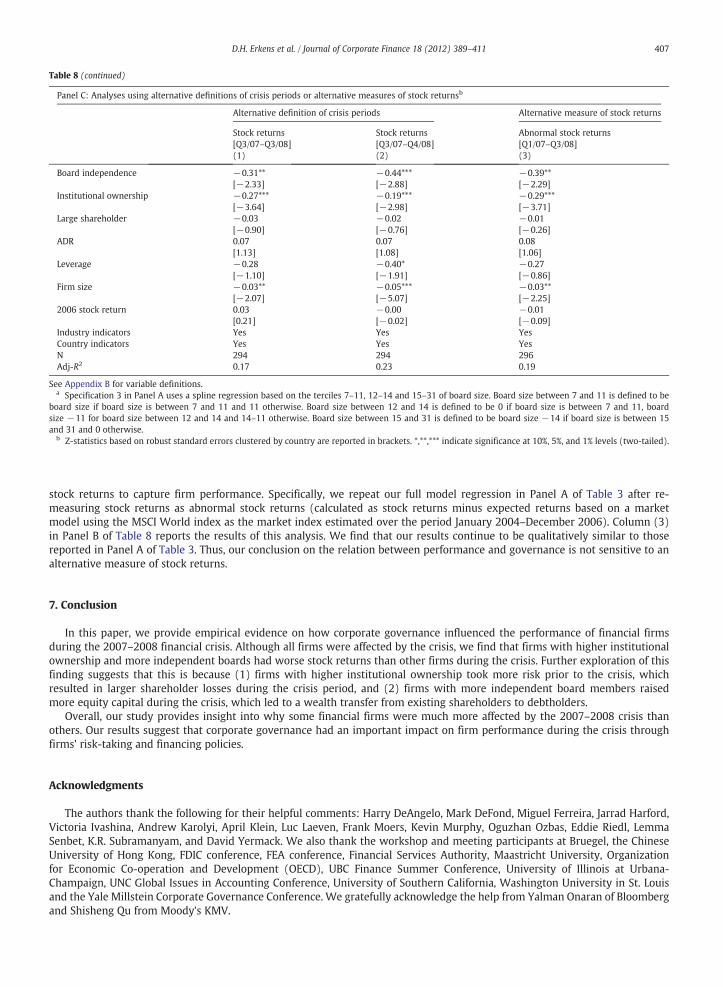
stock returns to capture firm performance. Specifically, we repeat our full model regression in Panel A of Table 3 after re-measuring stock returns as abnormal stock returns (calculated as stock returns minus expected returns based on a marketmodel using the MSCI World index as the market index estimated over the period January 2004–December 2006). Column (3)in Panel B of Table 8 reports the results of this analysis. We find that our results continue to be qualitatively similar to thosereported in Panel A of Table 3. Thus, our conclusion on the relation between performance and governance is not sensitive to analternative measure of stock returns.
7. Conclusion
In this paper, we provide empirical evidence on how corporate governance influenced the performance of financial firmsduring the 2007–2008 financial crisis. Although all firms were affected by the crisis, we find that firms with higher institutionalownership and more independent boards had worse stock returns than other firms during the crisis. Further exploration of thisfinding suggests that this is because (1) firms with higher institutional ownership took more risk prior to the crisis, whichresulted in larger shareholder losses during the crisis period, and (2) firms with more independent board members raisedmore equity capital during the crisis, which led to a wealth transfer from existing shareholders to debtholders.
Overall, our study provides insight into why some financial firms were much more affected by the 2007–2008 crisis thanothers. Our results suggest that corporate governance had an important impact on firm performance during the crisis throughfirms' risk-taking and financing policies.
Acknowledgments
The authors thank the following for their helpful comments: Harry DeAngelo, Mark DeFond, Miguel Ferreira, Jarrad Harford,Victoria Ivashina, Andrew Karolyi, April Klein, Luc Laeven, Frank Moers, Kevin Murphy, Oguzhan Ozbas, Eddie Riedl, LemmaSenbet, K.R. Subramanyam, and David Yermack. We also thank the workshop and meeting participants at Bruegel, the ChineseUniversity of Hong Kong, FDIC conference, FEA conference, Financial Services Authority, Maastricht University, Organizationfor Economic Co-operation and Development (OECD), UBC Finance Summer Conference, University of Illinois at Urbana-Champaign, UNC Global Issues in Accounting Conference, University of Southern California, Washington University in St. Louisand the Yale Millstein Corporate Governance Conference. We gratefully acknowledge the help from Yalman Onaran of Bloombergand Shisheng Qu from Moody's KMV.
Table 8 (continued)
Panel C: Analyses using alternative definitions of crisis periods or alternative measures of stock returnsb
Alternative definition of crisis periods Alternative measure of stock returns
Stock returns[Q3/07–Q3/08](1)
Stock returns[Q3/07–Q4/08](2)
Abnormal stock returns[Q1/07–Q3/08](3)
Board independence −0.31** −0.44*** −0.39**[−2.33] [−2.88] [−2.29]
Institutional ownership −0.27*** −0.19*** −0.29***[−3.64] [−2.98] [−3.71]
Large shareholder −0.03 −0.02 −0.01[−0.90] [−0.76] [−0.26]
ADR 0.07 0.07 0.08[1.13] [1.08] [1.06]
Leverage −0.28 −0.40* −0.27[−1.10] [−1.91] [−0.86]
Firm size −0.03** −0.05*** −0.03**[−2.07] [−5.07] [−2.25]
2006 stock return 0.03 −0.00 −0.01[0.21] [−0.02] [−0.09]
Industry indicators Yes Yes YesCountry indicators Yes Yes YesN 294 294 296Adj-R2 0.17 0.23 0.19
See Appendix B for variable definitions.a Specification 3 in Panel A uses a spline regression based on the terciles 7–11, 12–14 and 15–31 of board size. Board size between 7 and 11 is defined to be
board size if board size is between 7 and 11 and 11 otherwise. Board size between 12 and 14 is defined to be 0 if board size is between 7 and 11, boardsize −11 for board size between 12 and 14 and 14–11 otherwise. Board size between 15 and 31 is defined to be board size −14 if board size is between 15and 31 and 0 otherwise.
b Z-statistics based on robust standard errors clustered by country are reported in brackets. *,**,*** indicate significance at 10%, 5%, and 1% levels (two-tailed).
407D.H. Erkens et al. / Journal of Corporate Finance 18 (2012) 389–411
Appendix A. List of sample firms and countries
Company name Country Company name Country
1. Aareal Bank Ag Germany 51. Banco Santander Sa Spain2. ABN AMRO Hldgs Nv Netherlands 52. Bancorpsouth Inc U.S.3. Accredited Home Lenders Holding Co U.S. 53. Banesto–Banco Espanol De Credito Sa Spain4. ACE Ltd Switzerland 54. Bank of America Corp U.S.5. Adelaide Bank Ltd Australia 55. Bank of Cyprus Cyprus6. Aegon Nv Netherlands 56. Bank of Hawaii Corp U.S.7. Aetna Inc U.S. 57. Bank of Ireland Ireland8. Aflac Inc U.S. 58. Bank of Montreal Canada9. Alleanza Assicurazioni Spa Italy 59. Bank of Nova Scotia Canada10. Allianz Se Germany 60. Bank of Piraeus Sa Greece11. Allied Irish Banks Ireland 61. Bank of Queensland Australia12. Allstate Corp U.S. 62. Bankinter Sa Spain13. Alpha Bank A E Greece 63. Bankunited Financial Corp U.S.14. Ambac Financial Group Inc U.S. 64 Banque Cantonale De Geneve Switzerland15. American Equity Investment Life Holding U.S. 65. Banque Nationale De Belgique Belgium16. American Financial Group Inc U.S. 66. Barclays Plc U.K.17. American International Group (Aig) Inc U.S. 67. Bayerische Hypo-Und Vereinsbank Ag Germany18. American National Insurance Co U.S. 68. Bb&T Corp U.S.19. Ameriprise Financial Inc U.S. 69. BBVA Sa Spain20. AMP Ltd Australia 70. Bear Stearns Cos Inc U.S.21. Anglo Irish Bank Corp Plc Ireland 71. Bendigo & Adelaide Bank Ltd Australia22. Aon Corp U.S. 72. Berkshire Hathaway Inc U.S.23. Arch Capital Group Bermuda 73. BHW Holding Ag Germany24. Associated Banc-Corp U.S. 74. BNP Paribas France25. Assurances Generales De France-Agf France 75. BOK Financial Corp U.S.26. Assurant Inc U.S. 76. Canadian Imperial Bank of Commerce Canada27. Astoria Financial Corp U.S. 77. Capital One Financial Corp U.S.28. Atebank Greece 78. Capitalia Spa Italy29. Attijariwafa Bank Morocco 79. Capitalsource Inc U.S.30. ANZ Group Ltd Australia 80. Cattolica Assicurazioni Scarl Italy31. Aviva U.K. 81. Challenger Financial Services Group Australia32. AXA France 82. Charles Schwab Corp U.S.33. AXA Asia Pacific Hldgs Ltd Australia 83. China Life Insurance Co Ltd China34. Axis Bank Ltd India 84. Chubb Corp U.S.35. Axis Capital Holdings Ltd Bermuda 85. Cigna Corp U.S.36. Baloise-Holding Ag Switzerland 86. Cincinnati Financial Corp U.S.37. Banca Cr Firenze Spa Italy 87. CIT Group Inc U.S.38. Banca Italease Spa Italy 88. Citigroup Inc U.S.39. Banca Mps Italy 89. Citizens Republic Bancorp Inc U.S.40. Banca Popolare Dell'emilia Romagna Scarl Italy 90. City National Corp U.S.41. Banca Popolare Di Milano Italy 91. CNA Financial Corp U.S.42. Banca Popolare Di Sondrio Scarl Italy 92. CNP Assurances France43. Banco Bpi Sa Portugal 93. Colonial Bancgroup Inc U.S.44. Banco Comercial Portugues Sa Portugal 94. Comerica Inc U.S.45. Banco Espirito Santo Sa Portugal 95. Commerce Bancorp Inc U.S.46. Banco Guipuzcoano Sa Spain 96. Commerce Bancshares Inc U.S.47. Banco Pastor Sa Spain 97. Commerzbank Ag Germany48. Banco Popular Espanol Sa Spain 98. Commonwealth Bank of Australia Australia49. Banco Sabadell Sa Spain 99. Compass Bancshares Inc U.S.50. Banco Santander Chile Chile 100. Conseco Inc U.S.
101. Corus Bankshares Inc U.S. 151. Hudson City Bancorp Inc U.S.102. Countrywide Financial Corp U.S. 152. Humana Inc U.S.103. Credem–Credito Emiliano Spa Italy 153. Huntington Bancshares Inc U.S.104. Credit Agricole Sa France 154. Hypo Real Estate Holding Ag Germany105. Credit Industriel Et Commercial France 155. ICAP Plc U.K.106. Credit Suisse Group Switzerland 156. ICICI Bank India107. Credito Bergamasco Spa Italy 157. IKB Deutsche Industriebank Ag Germany108. Cullen Frost Bankers Inc U.S. 158. Ind. Alliance Ins. and Fin. Services Inc Canada109. Danske Bank A/S Denmark 159. Indymac Bancorp Inc U.S.110. Depfa Bank Plc Ireland 160. ING Groep Nv Netherlands111. Deutsche Bank Ag Germany 161. Insurance Australia Group Ltd Australia112. Deutsche Postbank Ag Germany 162. International Bancshares Corp U.S.113. Dexia Sa Belgium 163. Intesa Sanpaolo Spa Italy114. DnB Nor ASA Norway 164. Investec Plc U.K.115. Downey Financial Corp U.S. 165. Irish Life & Permanent Group Holdings Ireland116. E*Trade Financial Corp U.S. 166. Itau Unibanco Holding Sa Brazil117. East West Bancorp Inc U.S. 167. Jefferies Group Inc U.S.
408 D.H. Erkens et al. / Journal of Corporate Finance 18 (2012) 389–411
(continued)
Company name Country Company name Country
118. Efg Eurobank Ergasias Sa Greece 168. JPMorgan Chase & Co U.S.119. Efg International Switzerland 169. Jyske Bank A/S Denmark120. Emporiki Bank of Greece Sa Greece 170. Kaupthing Bank Hf Iceland121. Ergo Versicherungsgruppe Ag Germany 171. KBC Group Nv Belgium122. Erste Group Bank Ag Austria 172. Keycorp U.S.123. Espirito Santo Financial Group Sa Luxembourg 173. Kolnische Ruckversich. Gesellschaft Germany124. EuroHypo Germany 174. Landesbank Berlin Hldg Ag Germany125. Everest Re Group Ltd Bermuda 175. Landsbanki Islands Hf Iceland126. Fairfax Financial Holdings Ltd Canada 176. Laurentian Bank of Canada Canada127. FBL Financial Group Inc U.S. 177. Legal & General Group Plc U.K.128. Federal Home Loan Mortgage Corp U.S. 178. Lehman Brothers Holdings Inc U.S.129. Federal National Mortgage Association U.S. 179. Liechtenstein Landesbank Ag Liechtenstein130. Fifth Third Bancorp U.S. 180. Lincoln National Corp U.S.131. First Citizens Bancshares Inc U.S. 181. Lloyds Banking Group Plc U.K.132. First Horizon National Corp U.S. 182. Loews Corp U.S.133. Firstmerit Corp U.S. 183. M & T Bank Corp U.S.134. Flagstar Bancorp U.S. 184. Macquarie Bank Ltd Australia135. Fondiaria-Sai Italy 185. Maf Bancorp Inc U.S.136. Fortis Netherlands 186. Manulife Financial Corp Canada137. Fremont General Corp U.S. 187. Mapfre Sa Spain138. Friends Provident Group Plc U.K. 188. Marfin Popular Bank Public Co Ltd Cyprus139. Fulton Financial Corp U.S. 189. Markel Corp U.S.140. GAM Holding Ag Switzerland 190. Marsh & Mclennan Cos Inc U.S.141. Generali Assicurazioni Spa Italy 191. Marshall & Ilsley Corp U.S.142. Generali Deutschland Holding Ag Germany 192. MBIA Inc U.S.143. Genworth Financial Inc U.S. 193. Mediobanca Spa Italy144. Goldman Sachs Group Inc U.S. 194. Mediolanum Spa Italy145. Great American Financial Resources Inc U.S. 195. Mellon Financial Corp U.S.146. Hannover Rueckversicherungs Ag Germany 196. Mercantile Bankshares Corp U.S.147. Hartford Financial Services Group Inc U.S. 197. Merrill Lynch & Co Inc U.S.148. Helvetia Holding Ag Switzerland 198. Metlife Inc U.S.149. HSBC Hldgs U.K. 199. Morgan Stanley U.S.150. HSBC Trinkaus & Burkhardt Ag Germany 200. Munchener Ruckversicherungs Ag Germany
201. National Australia Bank Ltd Australia 251. Storebrand Asa Norway202. National Bank of Canada Canada 252. Sun Life Financial Inc Canada203. National Bank of Greece Sa Greece 253. Suncorp-Metway Ltd Australia204. National City Corp U.S. 254. Suntrust Banks Inc U.S.205. Nationwide Financial Services Inc U.S. 255. Svenska Handelsbanken Ab Sweden206. Natixis France 256. Swedbank Ab Sweden207. Neue Aargauer Bank Ag Switzerland 257. Swiss Life Holding Ag Switzerland208. New York Community Bancorp Inc U.S. 258. Swiss Reinsurance Co Switzerland209. Nordea Bank Ab Sweden 259. Sydbank Denmark210. Northern Trust Corp U.S. 260. Synovus Financial Corp U.S.211. Nurnberger Beteiligungs-Ag Germany 261. TCF Financial U.S.212. Old Mutual Plc U.K. 262. TD Ameritrade Holdings U.S.213. Old Republic International Corp U.S. 263. TD Banknorth Inc U.S.214. Paragon Group of Companies Plc U.K. 264. The Travelers Companies Inc U.S.215. Partnerre Ltd Bermuda 265. Torchmark Corp U.S.216. Phoenix Companies Inc U.S. 266. Toronto-Dominion Bank Canada217. Pnc Financial Services Group U.S. 267. Transatlantic Hldgs Inc U.S.218. Power Corp of Canada Canada 268. Tt Hellenic Postbank Sa Greece219. Power Financial Corp Canada 269. Tullett Prebon Plc U.K.220. Principal Financial Group Inc U.S. 270. UBS Ag Switzerland221. Progressive Corp U.S. 271. Ucbh Holdings Inc U.S.222. Protective Life Corp U.S. 272. Unibanco Union of Brazilian Banks Sa Brazil223. Prudential Financial Inc U.S. 273. Unicredit Spa Italy224. Prudential Plc U.K. 274. Union Bancal Corp U.S.225. QBE Insurance Group Australia 275. Unione Di Banche Italiane Scpa Italy226. Raiffeisen International Bank Holding Ag Austria 276. Unipol Gruppo Finanziario Spa Italy227. Raymond James Financial Inc U.S. 277. Unitedhealth Group Inc U.S.228. Regions Financial Corp U.S. 278. Unum Group U.S.229. Reinsurance Group of America U.S. 279. US Bancorp U.S.230. Royal Bank of Canada Canada 280. Valiant Holding Ag Switzerland231. Royal Bank of Scotland Group Plc U.K. 281. Valley National Bancorp U.S.232. Rsa Insurance Group Plc U.K. 282. Van Lanschot Nv Netherlands233. Safeco Corp U.S. 283. Vontobel Hldgs Ag Zurich Switzerland234. Sampo Oyj Finland 284. W.R. Berkley Corp U.S.235. Sberbank Russia 285. Wachovia Corp U.S.236. SCOR France 286. Washington Mutual Inc U.S.
Appendix A (continued)
(continued on next page )
409D.H. Erkens et al. / Journal of Corporate Finance 18 (2012) 389–411
(continued)
Company name Country Company name Country
237. SCOR Holding Switzerland Ag Switzerland 287. Webster Financial Corp U.S.238. Scottish Re Group Ltd Bermuda 288. Wellpoint Inc U.S.239. Skandinaviska Enskilda Banken Sweden 289. Wells Fargo & Co U.S.240. SLM Corp U.S. 290. Westpac Banking Corp Australia241. SNS Reaal Groep Nv Netherlands 291. White Mountains Insurance Group Ltd U.S.242. Societe Generale France 292. Whitney Hldg Corp U.S.243. South Financial Group Inc U.S. 293. Wilmington Trust Corp U.S.244. Sovereign Bancorp U.S. 294. Wustenrot & Wurttembergische Ag Germany245. St George Bank Ltd Australia 295. Zions Bancorp U.S.246. St. James's Place Plc U.K. 296. Zurich Financial Services Ltd Switzerland247. Stancorp Financial Group U.S.248. Standard Chartered Plc U.K.249. Standard Life Plc U.K.250. State Street Corp U.S.
Appendix B. Variable definitions
Variables Definitions Measurement period Data sources
Firm performanceStock returns Buy-and-hold stock returns January 2007 to September 2008 or the
date on which the firm was delisted,whichever is earlier
Datastream
Writedowns Cumulative accounting writedowns scaledby total assets
January 2007 to September 2008 Bloomberg/Compustat
GovernanceBoard independence Percentage of directors whose primary
affiliation is not with the firmDecember 2006 BoardEx
Institutional ownership Percentage of shares owned byinstitutional investors
December 2006 FacSet/Lionshares
Large shareholder A dummy variable equal to 1 if a firm has alarge owner with direct and indirect votingrights greater than 10%, and 0 otherwise
December 2006 Bureau van Dijk
Risk-taking and capital raisingEDF Expected Default Frequency December 2006 Moody's KMVVolatility Standard deviation of weekly stock returns January 2004 to December 2006 DatastreamEquity capital raising Equity capital raised scaled by total assets Q1/2007–Q3/2008 SDCAbnormal returns around equity offeringannouncements
Stock returns adjusted for the return onthe MSCI World index
[−1,+1] trading days with day 0 beingthe filing date reported in SDC
Datastream
Abnormal change in CDS spread aroundequity offering announcements
Change in credit default swaps (CDS)spread adjusted for the change in spreadon a CDS index comprising of globaluniverse of CDS
[−1,+1] trading days with day 0 beingthe filing date reported in SDC
Datastream
Country-level governanceInstitutions An average of six governance indicators:
(1) voice and accountability, (2) politicalstability and absence of violence, (3)government effectiveness, (4) regulatoryquality, (5) rule of law, and (6) control ofcorruption
2006 Kaufmann et al. (2009)
Antidirector rights The corrected antidirector rights index bySpamann
2005 Spamann (2010)
ControlsADR A dummy variable indicating whether a
firm is cross-listed on U.S. stock exchangesDecember 2006 CRSP
Leverage Total liabilities divided by total assets December 2006 CompustatFirm size Natural logarithm of total assets
(in US $million)December 2006 Compustat
2006 stock return Buy-and-hold stock returns January 2006–December 2006 DatastreamOthersReturn on assets Net income divided by total assets December 2006 CompustatAsset growth One-year growth in total assets 2005–2006 CompustatDelisting A dummy variable indicating whether a
firm delistedJanuary 2007 to September 2008 BoardEx
Board size The number of board members December 2006 BoardExRisk committee A dummy variable indicating whether the
firm has a risk committeeDecember 2006 BoardEx
Appendix A (continued)
410 D.H. Erkens et al. / Journal of Corporate Finance 18 (2012) 389–411
(continued)
Variables Definitions Measurement period Data sources
Board financial expertise Percentage of nonexecutive directors thateither has a CFA/CPA or has worked in anaccounting or finance function (e.g., CFO,fund manager, accountant, auditor)
December 2006 BoardEx
CEO–chairman duality A dummy variable indicating whether theCEO also serves as the chairman of the board
December 2006 BoardEx
Closely held shares Percentage of shares owned by insiders December 2006 WorldscopeAbnormal returns Stock returns minus expected returns based
on a market model using the MSCI Worldindex as the market index estimated overJanuary 2004 to December 2006.
Q1/2007–Q3/2008 Datastream
References
Adams, R., Mehran, H., 2003. Is corporate governance different for bank holding companies? FRBNY Econ. Policy Rev. 9, 123–142.Adams, R., Mehran, H., 2011. Corporate performance, board structure and its determinants in the banking industry. Federal Reserve Bank of New York Staff
Reports no. 330.Anderson, R.C., Mansi, S.A., Reeb, D.M., 2004. Board characteristics, accounting integrity, and the cost of debt. J. Account. Econ. 37, 315–342.Baek, J., Kang, J., Park, K., 2004. Corporate governance and firm value: evidence from the Korean financial crisis. J. Financ. Econ. 88, 499–533.Beltratti, A., Stulz, R., 2010. The credit crisis around the globe: why did some banks perform better? Working paper.Bischof, J., Bruggemann, U., Daske, H., 2010. Relaxation of fair value rules in times of crisis: an analysis of economic benefits and costs of the amendment to IAS 39.
Working paper.Brunnermeier, M., 2009. Deciphering the liquidity and credit crunch 2007–2008. J. Econ. Perspect. 23, 77–100.Bushman, R., Smith, A., 2001. Financial accounting information and corporate governance. J. Account. Econ. 32, 237–333.Covitz, D., Downing, C., 2007. Liquidity or credit risk? The determinants of very short-term corporate yield spreads. J. Financ. 62, 2303–2328.Denis, D., McConnell, J.J., 2003. International corporate governance: a survey. J. Financ. Quant. Anal. 38, 1–36.DeYoung, R., Peng, E., Yan, M., forthcoming. Executive compensation and business policy choices at U.S. commercial banks. J. Financ. Quant. Anal.Fama, E., French, K., 1997. Industry costs of equity. J. Financ. Econ. 43, 153–193.Ferreira, M., Matos, P., 2008. The colors of investors' money: the role of institutional investors around the world. J. Financ. Econ. 88, 499–533.Gillan, S., Starks, L., 2007. The evolution of shareholder activism in the United States. J. Appl. Corp. Financ. 19, 55–73.Hermalin, B., Weisbach, M., 2003. Boards of directors as an endogenously determined institution: a survey of the economic literature. FRBNY Econ. Policy Rev. 9, 7–26.Johnson, S., Boone, P., Breach, A., Friedman, E., 2000. Corporate governance in the Asian financial crisis, 1997–98. J. Financ. Econ. 58, 141–186.Kashyap, A., Rajan, R., Stein, J., 2008. Rethinking capital regulation. Working paper.Kaufmann, D., Kraay, A., Mastruzzi, M., 2009. Governance matters VIII: aggregate and individual governance indicators 1996–2008. Working paper.Kirkpatrick, G., 2009. The corporate governance lessons from the financial crisis. OECD J.: Financ. Mark. Trends 1, 61–87.Klein, A., 2002. Audit committee, board of director characteristics, and earnings management. J. Account. Econ. 33, 375–400.Laeven, L., Levine, R., 2009. Bank governance, regulation, and risk taking. J. Financ. Econ. 93, 259–275.La Porta, R., Lopez-de-Silanes, R., Shleifer, A., Vishny, R.W., 1998. Law and finance. J. Polit. Econ. 106, 1113–1155.Linck, J., Netter, J., Yang, T., 2009. Effects and unintended consequences of the Sarbanes–Oxley Act on corporate boards. Rev. Financ. Stud. 22, 3287–3328.Merton, R., 1974. On the pricing of corporate debt: the risk structure of interest rates. J. Financ. 29, 449–470.Mitton, T., 2002. A cross-firm analysis of the impact of corporate governance on the East Asian financial crisis. J. Financ. Econ. 64, 215–241.Myers, S.C., 1977. Determinants of corporate borrowing. J. Financ. Econ. 5, 147–175.Rajan, R., Zingales, L., 1995. What do we know about capital structure? Some evidence from international data. J. Financ. 50, 1421–1460.Ryan, S., 2008. Accounting in and for the subprime crisis. Account. Rev. 83, 1605–1638.Schapiro, M., 2009. Speech by SEC Chairman: Address to Transatlantic Corporate Governance Dialogue–2009 Conference. U.S. SEC. Washington D.C.Spamann, H., 2010. The antidirector rights index revisited. Rev. Financ. Stud. 23, 467–486.Sribney, W., 1997. Pseudo-R2 for Tobit. STATA.Taylor, J., 2009. The financial crisis and the policy responses: an empirical analysis of what went wrong. Crit. Rev. 21, 341–364.Veronesi, P., Zingales, L., 2010. Paulson's gift. J. Financ. Econ. 3, 339–368.Vyas, D., 2011. The timeliness of write-downs by U.S. financial institutions during the financial crisis of 2007–2008. J. Account. Res. 49, 823–860.Weisbach, M., 1988. Outside directors and CEO turnover. J. Financ. Econ. 20, 431–460.Wintoki, M.B., Linck, J., Netter, J., forthcoming. Endogeneity and the dynamics of internal corporate governance. J. Financ. Econ.
Appendix B (continued)
411D.H. Erkens et al. / Journal of Corporate Finance 18 (2012) 389–411