Embed Size (px)
Citation preview
Journal of Hydrology 409 (2011) 104–117
Contents lists available at SciVerse ScienceDirect
Journal of Hydrology
journal homepage: www.elsevier .com/locate / jhydrol
Modeling snowmelt-runoff under climate scenarios in the Hunza River basin,Karakoram Range, Northern Pakistan
Adnan Ahmad Tahir a,⇑, Pierre Chevallier a, Yves Arnaud b, Luc Neppel a, Bashir Ahmad c
a Laboratoire Hydrosciences, UMR 5569 – CNRS, IRD, Montpellier Universities 1 & 2, CC57, Université Montpellier 2, 34095 Montpellier Cedex 5, Franceb Laboratoire d’étude des Transferts en Hydrologie et Environnement, UMR 5564 – CNRS, IRD, Grenoble University 1, Grenoble INP, LGGE, 54 rue Molière, DomaineUniversitaire, BP 96, 38402 Saint Martin d’Hères Cedex, Francec Director (Environment), Natural Resources Division, Pakistan Agricultural Research Council, G1/5, Islamabad, Pakistan
a r t i c l e i n f o s u m m a r y
Article history:Received 24 January 2011Received in revised form 25 July 2011Accepted 1 August 2011Available online 23 August 2011This manuscript was handled byKonstantine P. Georgakakos, Editor-in-Chief,with the assistance of Ana P. Barros,Associate Editor
Keywords:Upper Indus River Basin (UIB)Hunza River basinMODISWater resources managementSnowmelt-Runoff ModelClimate change
0022-1694/$ - see front matter � 2011 Elsevier B.V. Adoi:10.1016/j.jhydrol.2011.08.035
⇑ Corresponding author. Tel.: +33 467 14 90 64; faxE-mail addresses: [email protected],
Tahir), [email protected] (P. Chevallier), [email protected] (L. Neppel), bashirad@
A major proportion of flow in the Indus River is contributed by its snow and glacier-fed river catchmentssituated in the Karakoram Range. It is therefore essential to estimate the snowmelt runoff from thesecatchments (with no or scarce precipitation records) for water resources management. The snowmeltrunoff model (SRM) integrated with MODIS remote-sensing snow cover products was selected to simu-late the daily discharges and to study the climate change impact on these discharges in the Hunza Riverbasin (the snow- and glacier-fed sub-catchment of the Indus River). The results obtained suggest that theSRM can be used efficiently in the snow- and glacier-fed sub-catchments of the Upper Indus River Basin(UIB). The application of the SRM under future climate (mean temperature, precipitation and snow cover)change scenarios indicates a doubling of summer runoff until the middle of this century. This analysissuggests that new reservoirs will be necessary for summer flow storage to meet with the needs of irriga-tion supply, increasing power generation demand, flood control and water supply.
� 2011 Elsevier B.V. All rights reserved.
1. Introduction
The economy of Pakistan, an agriculture-based country, ishighly dependent on the Indus irrigation system. The Indus Riveris one of the major water carriers of South Asia emerging fromthe Tibetan Plateau and the Himalayas. It has a controlling storageat Tarbela (Fig. 1) as the river leaves the mountains. Tarbela is thefirst major structure on the Indus River and supplies the flow to theIndus Irrigation System to irrigate the agricultural lands of Punjaband Sindh (provinces of Pakistan), the dominant producer of agri-cultural products in the country. Inflow to Tarbela is measured atBesham Qila (Indus basin area at Besham = 201,388 km2), situatedapproximately 80 km upstream of Tarbela (Fig. 1), with a mean an-nual flow of 2410 m3/s according to the SWHP (Surface WaterHydrology Project) flow records from 1969 to 2008. The catchment
ll rights reserved.
: +33 467 14 47 [email protected] ([email protected] (Y. Arnaud),
hotmail.com (B. Ahmad).
area upstream of Tarbela reservoir is called the Upper Indus Basin(UIB) (Fig. 1), which contributes the major part of inflow into theIndus River from high elevations as a result of snow and glaciermelt.
The active hydrological zone of the Upper Indus Basin lies in thehigh-altitude Himalaya and Karakoram Ranges. Several authors(Archer and Fowler, 2004; Hewitt et al., 1989; Wake, 1989; Youngand Hewitt, 1990; Bookhagen and Burbank, 2010) reported thatmore than 65% of the annual flow of the Upper Indus River is con-tributed by the seasonal and permanent snowfields and glacierizedareas above 3500 m in elevation. Liniger et al. (1998) stated thatsome 90% of the lowland flow of the Indus River System originatesfrom the Hindukush, Karakoram and western Himalaya mountainareas.
The management of Tarbela reservoir depends to a large extenton the summer inflow contributed by the snow- and glacier-fedtributaries situated in the Karakoram Range. The presence of snowin a basin strongly affects the moisture that is stored at the surfaceand is available for future runoff (Maurer et al., 2003). The summerrunoff is highly correlated with the summer mean temperature inthese high-altitude sub-catchments of the UIB, mostly coveredwith permanent snow pack and glaciers (Archer, 2003). The Hunza
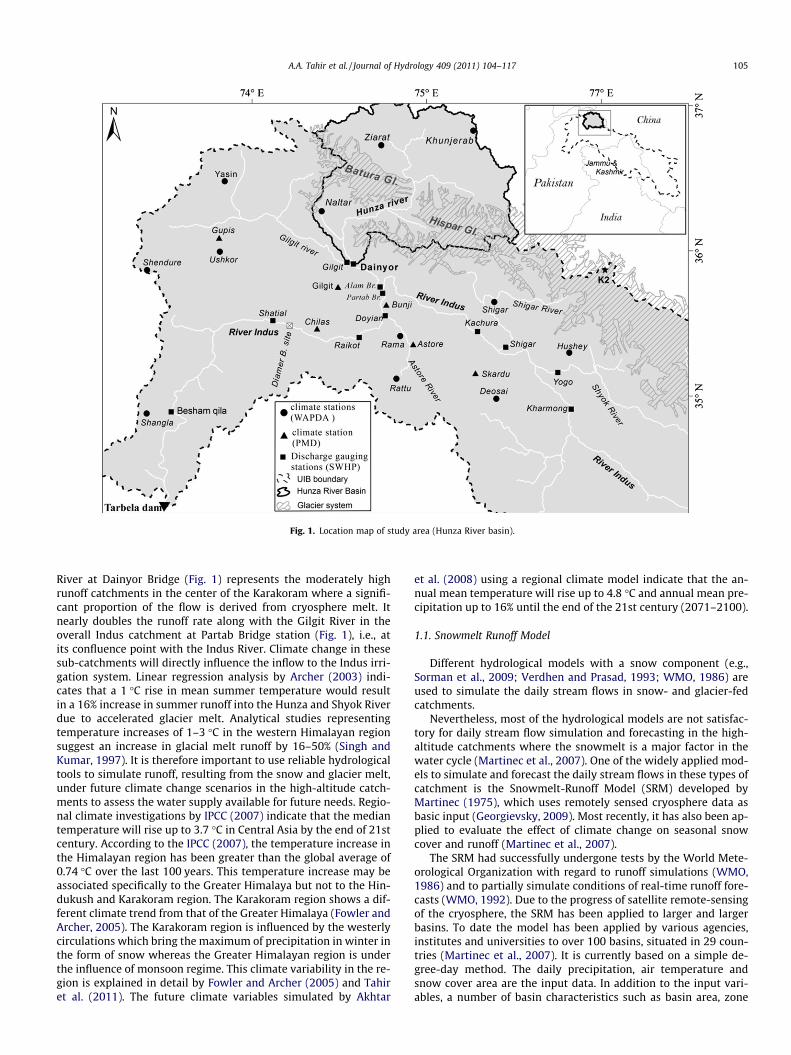
Fig. 1. Location map of study area (Hunza River basin).
A.A. Tahir et al. / Journal of Hydrology 409 (2011) 104–117 105
River at Dainyor Bridge (Fig. 1) represents the moderately highrunoff catchments in the center of the Karakoram where a signifi-cant proportion of the flow is derived from cryosphere melt. Itnearly doubles the runoff rate along with the Gilgit River in theoverall Indus catchment at Partab Bridge station (Fig. 1), i.e., atits confluence point with the Indus River. Climate change in thesesub-catchments will directly influence the inflow to the Indus irri-gation system. Linear regression analysis by Archer (2003) indi-cates that a 1 �C rise in mean summer temperature would resultin a 16% increase in summer runoff into the Hunza and Shyok Riverdue to accelerated glacier melt. Analytical studies representingtemperature increases of 1–3 �C in the western Himalayan regionsuggest an increase in glacial melt runoff by 16–50% (Singh andKumar, 1997). It is therefore important to use reliable hydrologicaltools to simulate runoff, resulting from the snow and glacier melt,under future climate change scenarios in the high-altitude catch-ments to assess the water supply available for future needs. Regio-nal climate investigations by IPCC (2007) indicate that the mediantemperature will rise up to 3.7 �C in Central Asia by the end of 21stcentury. According to the IPCC (2007), the temperature increase inthe Himalayan region has been greater than the global average of0.74 �C over the last 100 years. This temperature increase may beassociated specifically to the Greater Himalaya but not to the Hin-dukush and Karakoram region. The Karakoram region shows a dif-ferent climate trend from that of the Greater Himalaya (Fowler andArcher, 2005). The Karakoram region is influenced by the westerlycirculations which bring the maximum of precipitation in winter inthe form of snow whereas the Greater Himalayan region is underthe influence of monsoon regime. This climate variability in the re-gion is explained in detail by Fowler and Archer (2005) and Tahiret al. (2011). The future climate variables simulated by Akhtar
et al. (2008) using a regional climate model indicate that the an-nual mean temperature will rise up to 4.8 �C and annual mean pre-cipitation up to 16% until the end of the 21st century (2071–2100).
1.1. Snowmelt Runoff Model
Different hydrological models with a snow component (e.g.,Sorman et al., 2009; Verdhen and Prasad, 1993; WMO, 1986) areused to simulate the daily stream flows in snow- and glacier-fedcatchments.
Nevertheless, most of the hydrological models are not satisfac-tory for daily stream flow simulation and forecasting in the high-altitude catchments where the snowmelt is a major factor in thewater cycle (Martinec et al., 2007). One of the widely applied mod-els to simulate and forecast the daily stream flows in these types ofcatchment is the Snowmelt-Runoff Model (SRM) developed byMartinec (1975), which uses remotely sensed cryosphere data asbasic input (Georgievsky, 2009). Most recently, it has also been ap-plied to evaluate the effect of climate change on seasonal snowcover and runoff (Martinec et al., 2007).
The SRM had successfully undergone tests by the World Mete-orological Organization with regard to runoff simulations (WMO,1986) and to partially simulate conditions of real-time runoff fore-casts (WMO, 1992). Due to the progress of satellite remote-sensingof the cryosphere, the SRM has been applied to larger and largerbasins. To date the model has been applied by various agencies,institutes and universities to over 100 basins, situated in 29 coun-tries (Martinec et al., 2007). It is currently based on a simple de-gree-day method. The daily precipitation, air temperature andsnow cover area are the input data. In addition to the input vari-ables, a number of basin characteristics such as basin area, zone
106 A.A. Tahir et al. / Journal of Hydrology 409 (2011) 104–117
area (in zone-wise application) and the hypsometric (area-elevation) curve are also needed. The daily water produced fromthe snowmelt and rainfall is superimposed on the calculated reces-sion flow and transformed into daily discharge from the catchmentaccording to the following equation:
Q nþ1¼½Csn � � anðTn þ DTnÞSn þ Crn Pn�A:10; 00086;400
ð1� knþ1Þ
þ Q nknþ1 ð1Þ
where Q is the average daily discharge (m3/s), C, the runoff coeffi-cient, with Cs referring to snowmelt and Cr to rain, a, the degree-day factor, DDF (cm �C�1 d�1), T, the number of degree-days (�C d),S, the ratio of the snow covered area (SCA) to the total area, n, the se-quence of days, P, the precipitation contributing to runoff, A, the areaof the basin or zone, k is the recession coefficient (Xc and Yc).
The detailed description of the variables and parameters used inthis equation is given by Martinec et al. (2007).
In the Himalayas and its surroundings, Immerzeel et al. (2009,2010) investigated the effects of snow cover dynamics on the dis-charge of the Upper Indus River and concluded that stream flowscan be predicted with a high degree of accuracy using MODIS snowcover data in the SRM. Bookhagen and Burbank (2010) found thatthe SRM combined with MODIS snow cover and TRMM rainfalldata significantly improves regional runoff modeling for the Hima-layas. Prasad and Roy (2005) applied the SRM to the Beas River ba-sin and found that the observed and computed discharges werewell correlated. Hong and Guodong (2003) found a Nash–Sutcliffecoefficient value of 0.87 when simulating the stream flow in theGongnaisi River basin in the western Tianshan Mountains byapplying the SRM.
Fig. 2. Global Digital Elevation Model (GDEM) of the Hunza River ba
In other regions of the world where the impact of the snow cov-er is significant, Lee et al. (2005) reported that the SRM has suffi-cient accuracy for stream flow prediction using the MODIS snowcover products in the snowmelt-dominated basin of the UpperRio Grande basin. Georgievsky (2009) tested the SRM as a short-term forecasting model and concluded that the model can be usedfor short-term runoff forecasts in the mountain and foothill areasof the Krasnodar reservoir basin. Sirguey et al. (2009) applied theSRM to the Waitaki catchment, New Zealand, and found that thesimulation of daily stream flows is reliable and that the SRM hasthe potential to provide short- to medium-term forecasts of wateravailability in these catchments.
The previous studies of applying the SRM to mountainous rivercatchments of Himalaya and other regions of the world suggestthat the model can efficiently be applied in the snow- and gla-cier-fed Hunza River basin to simulate and forecast the dailystream flows as well as to study the effect of future climate changeon river runoff. The other factor that suggests the use of SRM is itsweak sensibility towards the precipitation forcing. Since, the pre-cipitation data available from the high altitude catchments is notof very good quality so we preferred to use the SRM which is moresensitive to the daily snow cover and temperature input. In thisstudy, the SRM (WinSRM version 1.12) was applied to the HunzaRiver basin using observed and APHRODITE (Yatagai et al., 2009)precipitation data (described in Section 3.3), which will show thereliability of APHRODITE precipitation products for hydrologicalmodeling in the remote regions of the UIB. This study will also helpmanage the water reservoirs (existing Tarbela and proposedDiamer Bhasha) (Fig. 1) of the UIB for irrigation, hydropowergeneration, flood control and water supply by providing a reliableestimation of the future snowmelt runoff in one of the main
sin indicating the six altitudinal zones extracted for this study.
A.A. Tahir et al. / Journal of Hydrology 409 (2011) 104–117 107
snow- and glacier-fed tributaries of the Indus River under differentfuture climate change scenarios.
The main objectives of this study were to:
(a) Evaluate the SRM’s ability to simulate the daily stream flowsin the snow- and glacier-fed Hunza River basin.
(b) Investigate the reliability of APHRODITE precipitation datafor modeling snowmelt runoff in the high-altitude rivercatchment.
(c) Simulate stream flow in the Hunza River basin under differ-ent future climate change scenarios for water resourcesmanagement in the UIB.
The study area is described in Section 2 of this manuscript fol-lowed by the description of the data sets and treatment of data inSection 3. The principle and method of the SRM is described in Sec-tion 4. The results obtained from this study and discussion on theseresults are described in Section 5 following by the conclusionsdrawn in Section 6.
2. Study area: Hunza River basin
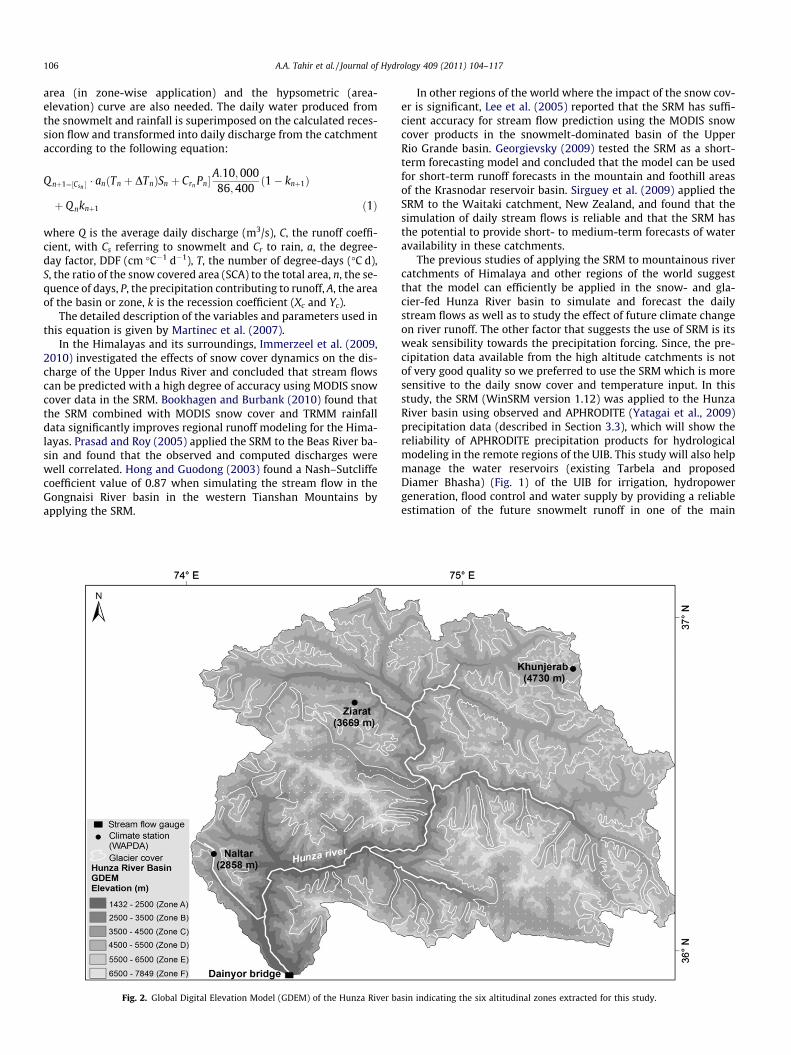
The present evaluation of the SRM is undertaken in the HunzaRiver basin (drainage area, 13,733 km2) (Fig. 1), situated in thehigh-altitude central Karakoram region, with a mean catchmentelevation of 4631 m. Approximately 4463 km2 of catchment areais at an elevation above 5000 m and almost the same area (33%)is glaciated (Akhtar et al., 2008), as shown in Fig. 2. Area distribu-tion for different altitudinal zones in the catchment is shown bythe hypsometric curve in Fig. 3 and given in Table 1.
A previous paper described the hydrological behaviors and re-gime of the Hunza River basin at Dainyor Bridge (Tahir et al.,2011). The main elements are summarized here.
The snow cover area in the Hunza River basin varies fromapproximately 80% in winter to 30% in summer. Three climate sta-
Cumula
0
1000
2000
3000
4000
5000
6000
Elev
atio
n (m
)
0
500
1000
1500
2000
2500
3000
3500
4000
4500
5000
5500
6000
6500
7000
7500
8000
Zone
A
Zone B
Zone C
Fig. 3. Hypsometric curve of the Hunza River basin showin
tions with precipitation gauges are installed by WAPDA at differentaltitudes within the catchment, as shown in Fig. 2. The mean totalannual precipitation is 170 mm at Khunjerab (4730 m), 225 mm atZiarat (3669 m) and 680 mm at Naltar (2858 m) according to the10-year record (1999–2008) of the three climate stations in thecatchment. The Hunza River has a mean annual flow of 323 m3/s(i.e., 742 mm of water depth equivalent) (standard deviation formean annual flow = 69 m3/s), gauged at Dainyor Bridge (Fig. 1),according to the SWHP-WAPDA 40-year (1966–2008) flow record.Obviously, present precipitation records are not representative ofthe runoff at the outlet because of the well-known gauging errorsat high altitudes, as explained in detail by Sevruk (1985, 1989) andFørland et al. (1996). The other factor participating in this contrastis the absence of precipitation gauging stations at high altitudesabove 4730 m where maximum snowfall and accumulation occurs,as confirmed by Young and Hewitt (1990).
3. Data sets
3.1. Topography
The Advanced Spaceborne Thermal Emission and ReflectionRadiometer (ASTER), Global Digital Elevation Model (GDEM) isused to delineate the catchment boundary studied. The ASTERGDEM is available for high-latitude and steep mountainous areasnot covered by SRTM3 (METI and NASA, 2009). Six different altitu-dinal zones were extracted from the GDEM of the study area fordetailed analysis of snow cover area (SCA) estimation. Some char-acteristics of these zones are given in Table 1.
3.2. Hydrometeorological data
Stream flow measurement in Pakistan is mostly carried out bythe Surface Water Hydrology Project of the Water and PowerDevelopment Authority (SWHP-WAPDA) with the earliest records
ted area (km²)
7000
8000
9000
1000
0
1100
0
1200
0
1300
0
1400
0
Hypsometric curve
Zone D
Zone E
Zone F
g the area distribution in six different elevation zones.
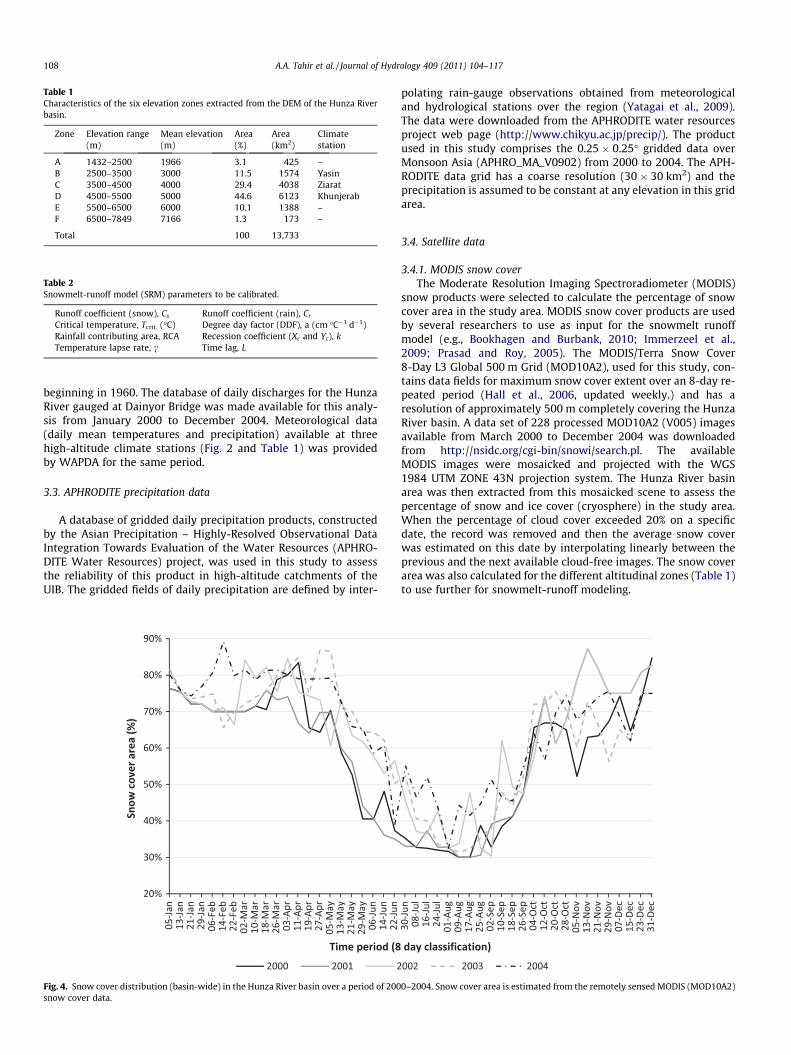
Table 1Characteristics of the six elevation zones extracted from the DEM of the Hunza Riverbasin.
Zone Elevation range(m)
Mean elevation(m)
Area(%)
Area(km2)
Climatestation
A 1432–2500 1966 3.1 425 –B 2500–3500 3000 11.5 1574 YasinC 3500–4500 4000 29.4 4038 ZiaratD 4500–5500 5000 44.6 6123 KhunjerabE 5500–6500 6000 10.1 1388 –F 6500–7849 7166 1.3 173 –
Total 100 13,733
Table 2Snowmelt-runoff model (SRM) parameters to be calibrated.
Runoff coefficient (snow), Cs Runoff coefficient (rain), Cr
Critical temperature, Tcrit. (�C) Degree day factor (DDF), a (cm �C�1 d�1)Rainfall contributing area, RCA Recession coefficient (Xc and Yc), kTemperature lapse rate, c Time lag, L
108 A.A. Tahir et al. / Journal of Hydrology 409 (2011) 104–117
beginning in 1960. The database of daily discharges for the HunzaRiver gauged at Dainyor Bridge was made available for this analy-sis from January 2000 to December 2004. Meteorological data(daily mean temperatures and precipitation) available at threehigh-altitude climate stations (Fig. 2 and Table 1) was providedby WAPDA for the same period.
3.3. APHRODITE precipitation data
A database of gridded daily precipitation products, constructedby the Asian Precipitation – Highly-Resolved Observational DataIntegration Towards Evaluation of the Water Resources (APHRO-DITE Water Resources) project, was used in this study to assessthe reliability of this product in high-altitude catchments of theUIB. The gridded fields of daily precipitation are defined by inter-
Fig. 4. Snow cover distribution (basin-wide) in the Hunza River basin over a period of 200snow cover data.
polating rain-gauge observations obtained from meteorologicaland hydrological stations over the region (Yatagai et al., 2009).The data were downloaded from the APHRODITE water resourcesproject web page (http://www.chikyu.ac.jp/precip/). The productused in this study comprises the 0.25 � 0.25� gridded data overMonsoon Asia (APHRO_MA_V0902) from 2000 to 2004. The APH-RODITE data grid has a coarse resolution (30 � 30 km2) and theprecipitation is assumed to be constant at any elevation in this gridarea.
3.4. Satellite data
3.4.1. MODIS snow coverThe Moderate Resolution Imaging Spectroradiometer (MODIS)
snow products were selected to calculate the percentage of snowcover area in the study area. MODIS snow cover products are usedby several researchers to use as input for the snowmelt runoffmodel (e.g., Bookhagen and Burbank, 2010; Immerzeel et al.,2009; Prasad and Roy, 2005). The MODIS/Terra Snow Cover8-Day L3 Global 500 m Grid (MOD10A2), used for this study, con-tains data fields for maximum snow cover extent over an 8-day re-peated period (Hall et al., 2006, updated weekly.) and has aresolution of approximately 500 m completely covering the HunzaRiver basin. A data set of 228 processed MOD10A2 (V005) imagesavailable from March 2000 to December 2004 was downloadedfrom http://nsidc.org/cgi-bin/snowi/search.pl. The availableMODIS images were mosaicked and projected with the WGS1984 UTM ZONE 43N projection system. The Hunza River basinarea was then extracted from this mosaicked scene to assess thepercentage of snow and ice cover (cryosphere) in the study area.When the percentage of cloud cover exceeded 20% on a specificdate, the record was removed and then the average snow coverwas estimated on this date by interpolating linearly between theprevious and the next available cloud-free images. The snow coverarea was also calculated for the different altitudinal zones (Table 1)to use further for snowmelt-runoff modeling.
0–2004. Snow cover area is estimated from the remotely sensed MODIS (MOD10A2)
A.A. Tahir et al. / Journal of Hydrology 409 (2011) 104–117 109
4. Principle and method
The snowmelt-runoff model (SRM) was used to simulate the dailydischarges in the Hunza River at Dainyor Bridge. It uses the remotesensing snow cover data as basic input. The basic parameters to becalibrated for the SRM are given in Table 2. The model was run forfour hydrological years (April 2000 to March 2004) to simulate thedaily discharges in the Hunza River basin. The SRM parametric val-ues were estimated during the calibration of the model and ex-tracted from the studies (e.g., Dey et al., 1989; Hock, 2003;Immerzeel et al., 2010; Prasad and Roy, 2005; Zhang et al., 2006) con-ducted previously on other Himalayan basins. It was applied byusing both proposed options: ‘‘basin-wide’’ and ‘‘zone-wise’’.
4.1. Basin-wide application
The average daily precipitation and daily mean temperaturesobserved at the three climate stations in the Hunza River basin,as well as the daily snow cover area percentage were used as inputvariables. The total catchment area and the hypsometric (area-elevation) curve (Fig. 3) for the basin were calculated using theGDEM. The daily basin-wide snow cover area (Fig. 4) for the HunzaRiver basin was estimated by the linear interpolation of the snowcover area percentage calculated from 8-day composite MOD10A2satellite images. The SRM was also run by replacing the dailyobserved precipitation with the APHRODITE precipitation data(described in Section 3.3) to determine the reliability ofAPHRODITE precipitation products for runoff modeling in thehigh-altitude catchments. The values for different parameters usedin the basin-wide simulations are given in Table 3.
4.2. Zone-wise application
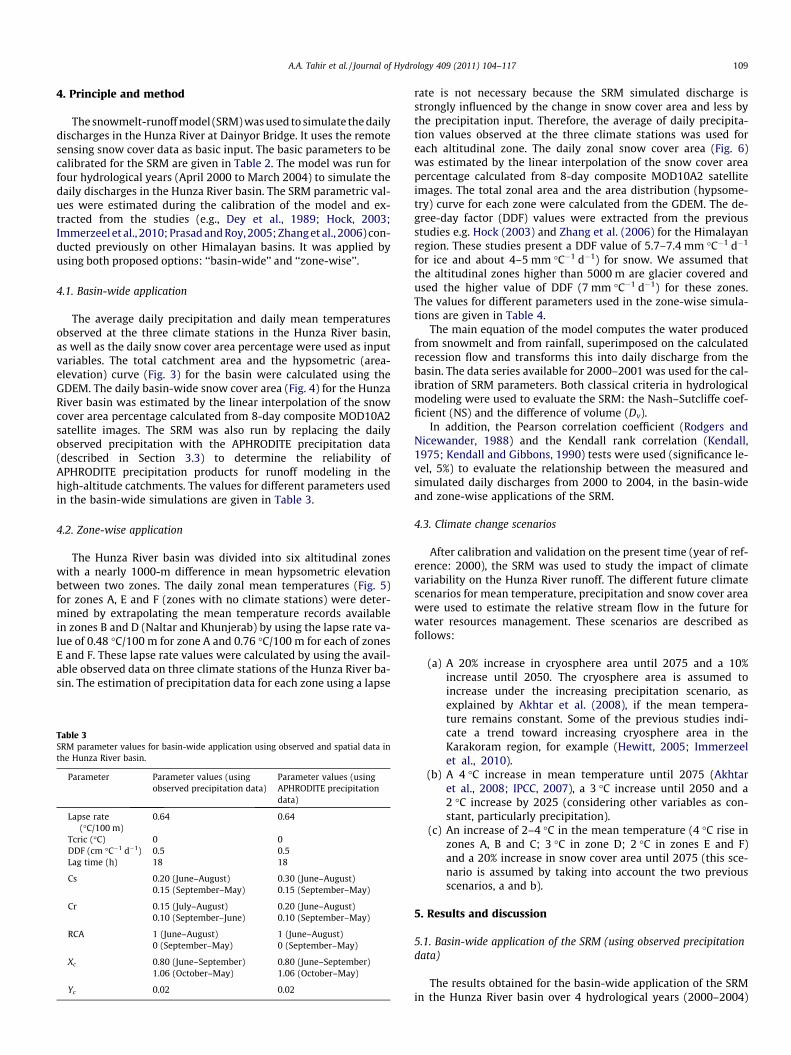
The Hunza River basin was divided into six altitudinal zoneswith a nearly 1000-m difference in mean hypsometric elevationbetween two zones. The daily zonal mean temperatures (Fig. 5)for zones A, E and F (zones with no climate stations) were deter-mined by extrapolating the mean temperature records availablein zones B and D (Naltar and Khunjerab) by using the lapse rate va-lue of 0.48 �C/100 m for zone A and 0.76 �C/100 m for each of zonesE and F. These lapse rate values were calculated by using the avail-able observed data on three climate stations of the Hunza River ba-sin. The estimation of precipitation data for each zone using a lapse
Table 3SRM parameter values for basin-wide application using observed and spatial data inthe Hunza River basin.
Parameter Parameter values (usingobserved precipitation data)
Parameter values (usingAPHRODITE precipitationdata)
Lapse rate(�C/100 m)
0.64 0.64
Tcric (�C) 0 0DDF (cm �C�1 d�1) 0.5 0.5Lag time (h) 18 18
Cs 0.20 (June–August) 0.30 (June–August)0.15 (September–May) 0.15 (September–May)
Cr 0.15 (July–August) 0.20 (June–August)0.10 (September–June) 0.10 (September–May)
RCA 1 (June–August) 1 (June–August)0 (September–May) 0 (September–May)
Xc 0.80 (June–September) 0.80 (June–September)1.06 (October–May) 1.06 (October–May)
Yc 0.02 0.02
rate is not necessary because the SRM simulated discharge isstrongly influenced by the change in snow cover area and less bythe precipitation input. Therefore, the average of daily precipita-tion values observed at the three climate stations was used foreach altitudinal zone. The daily zonal snow cover area (Fig. 6)was estimated by the linear interpolation of the snow cover areapercentage calculated from 8-day composite MOD10A2 satelliteimages. The total zonal area and the area distribution (hypsome-try) curve for each zone were calculated from the GDEM. The de-gree-day factor (DDF) values were extracted from the previousstudies e.g. Hock (2003) and Zhang et al. (2006) for the Himalayanregion. These studies present a DDF value of 5.7–7.4 mm �C�1 d�1
for ice and about 4–5 mm �C�1 d�1) for snow. We assumed thatthe altitudinal zones higher than 5000 m are glacier covered andused the higher value of DDF (7 mm �C�1 d�1) for these zones.The values for different parameters used in the zone-wise simula-tions are given in Table 4.
The main equation of the model computes the water producedfrom snowmelt and from rainfall, superimposed on the calculatedrecession flow and transforms this into daily discharge from thebasin. The data series available for 2000–2001 was used for the cal-ibration of SRM parameters. Both classical criteria in hydrologicalmodeling were used to evaluate the SRM: the Nash–Sutcliffe coef-ficient (NS) and the difference of volume (Dv).
In addition, the Pearson correlation coefficient (Rodgers andNicewander, 1988) and the Kendall rank correlation (Kendall,1975; Kendall and Gibbons, 1990) tests were used (significance le-vel, 5%) to evaluate the relationship between the measured andsimulated daily discharges from 2000 to 2004, in the basin-wideand zone-wise applications of the SRM.
4.3. Climate change scenarios
After calibration and validation on the present time (year of ref-erence: 2000), the SRM was used to study the impact of climatevariability on the Hunza River runoff. The different future climatescenarios for mean temperature, precipitation and snow cover areawere used to estimate the relative stream flow in the future forwater resources management. These scenarios are described asfollows:
(a) A 20% increase in cryosphere area until 2075 and a 10%increase until 2050. The cryosphere area is assumed toincrease under the increasing precipitation scenario, asexplained by Akhtar et al. (2008), if the mean tempera-ture remains constant. Some of the previous studies indi-cate a trend toward increasing cryosphere area in theKarakoram region, for example (Hewitt, 2005; Immerzeelet al., 2010).
(b) A 4 �C increase in mean temperature until 2075 (Akhtaret al., 2008; IPCC, 2007), a 3 �C increase until 2050 and a2 �C increase by 2025 (considering other variables as con-stant, particularly precipitation).
(c) An increase of 2–4 �C in the mean temperature (4 �C rise inzones A, B and C; 3 �C in zone D; 2 �C in zones E and F)and a 20% increase in snow cover area until 2075 (this sce-nario is assumed by taking into account the two previousscenarios, a and b).
5. Results and discussion
5.1. Basin-wide application of the SRM (using observed precipitationdata)
The results obtained for the basin-wide application of the SRMin the Hunza River basin over 4 hydrological years (2000–2004)
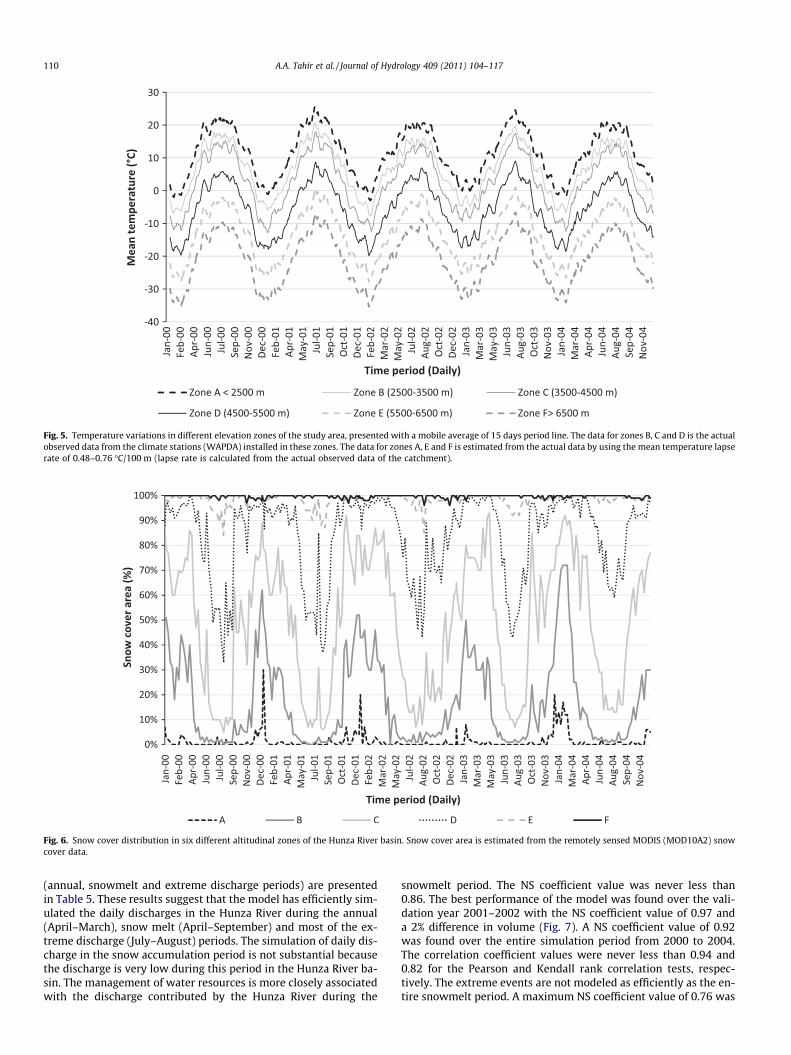
Fig. 5. Temperature variations in different elevation zones of the study area, presented with a mobile average of 15 days period line. The data for zones B, C and D is the actualobserved data from the climate stations (WAPDA) installed in these zones. The data for zones A, E and F is estimated from the actual data by using the mean temperature lapserate of 0.48–0.76 �C/100 m (lapse rate is calculated from the actual observed data of the catchment).
Fig. 6. Snow cover distribution in six different altitudinal zones of the Hunza River basin. Snow cover area is estimated from the remotely sensed MODIS (MOD10A2) snowcover data.
110 A.A. Tahir et al. / Journal of Hydrology 409 (2011) 104–117
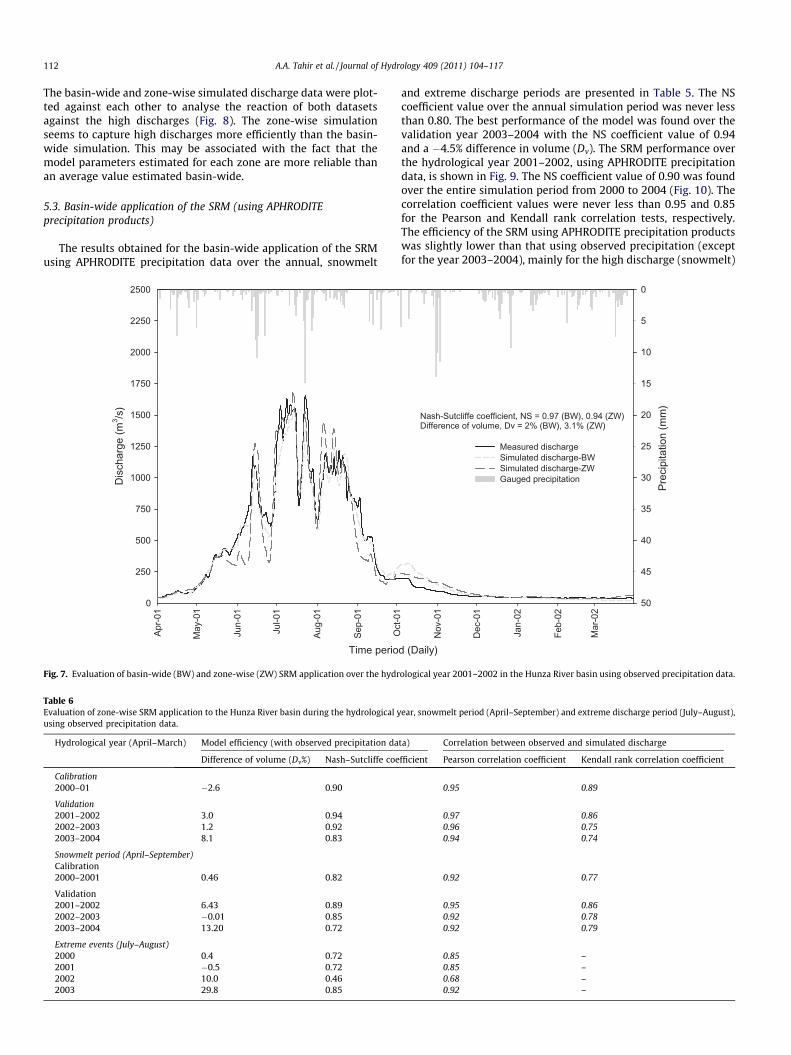
(annual, snowmelt and extreme discharge periods) are presentedin Table 5. These results suggest that the model has efficiently sim-ulated the daily discharges in the Hunza River during the annual(April–March), snow melt (April–September) and most of the ex-treme discharge (July–August) periods. The simulation of daily dis-charge in the snow accumulation period is not substantial becausethe discharge is very low during this period in the Hunza River ba-sin. The management of water resources is more closely associatedwith the discharge contributed by the Hunza River during the
snowmelt period. The NS coefficient value was never less than0.86. The best performance of the model was found over the vali-dation year 2001–2002 with the NS coefficient value of 0.97 anda 2% difference in volume (Fig. 7). A NS coefficient value of 0.92was found over the entire simulation period from 2000 to 2004.The correlation coefficient values were never less than 0.94 and0.82 for the Pearson and Kendall rank correlation tests, respec-tively. The extreme events are not modeled as efficiently as the en-tire snowmelt period. A maximum NS coefficient value of 0.76 was
Table 4SRM parameter values for zone-wise SRM application to the Hunza River basin.
Parameter Parametric values for each altitudinal zone
A (1450–2500 m) B (2500–3500 m) C (3500–4500 m) D (4500–5500 m) E (5500–6500 m) F (6500–7800 m)
Lapse rate (�C/100 m)
0.48 0.48 0.64 0.76 0.76 0.76
Tcric (�C) 0 0 0 0 0 0DDF (cm �C�1 d�1) 0.5 0.5 0.5 0.6 0.7 0.7Lag time (h) 6 6 12 12 18 18
Cs 0 June–August = 0.25 June–August = 0.35 June–August = 0.35 June–August = 0.50 June–August = 0.50September–May = 0.20
Sep–May = 0.3 September–May = 0.3 September–May = 0.4
September–May = 0.4
Cr June–August = 0.50 June–August = 0.35 June–August = 0.35 June–August = 0.35 0 0September–May = 0.40
September–May = 0.30
September–May = 0.3
September–May = 0.3
RCA 1 1 1 Jun–Sep = 1 Oct–May = 0
0 0
Xc June–September = 0.80
June–September = 0.80
June–September = 0.80
June–September = 0.80 June–September = 0.8
June–September = 0.80
October–May = 1.06 October–May = 1.06 October–May = 1.06 October–May = 1.06 October–May = 1.06 October–May = 1.06
Yc 0.2 0.2 0.2 0.2 0.2 0.2
June–August Snow melt and monsoon periodSeptember/October–May Snow accumulation and dry periodZone E and F Zones with almost 100% glacierized areaZone D Almost 50% glacierized areaCs and Cr Zone A has a small snowmelt runoff contribution and Zones E and F have a small rainfall runoff contributionRCA Rainfall contributing area is small in Zone E and F because at this altitude the precipitation is in solid formDDF Degree day factor for snow is less and for ice/glacier is greater in Karakoram Range (Hock, 2003; Zhang et al., 2006)
A.A. Tahir et al. / Journal of Hydrology 409 (2011) 104–117 111
found over the year 2001 (Table 5). This may be associated to theglacial contribution during this period from the catchment whichis not captured efficiently by the model.
5.2. Zone-wise application of SRM
The results obtained for the zone-wise application of the SRM inthe Hunza River basin over 4 hydrological years (2000–2004) (an-nual, snowmelt and extreme discharge periods) are presented inTable 6. The NS coefficient value was never less than 0.83 and
Table 5Evaluation of basin-wide SRM application to the Hunza River basin during the hydrologicalusing observed and spatial precipitation data.
Hydrologicalyear (April–March)
Model efficiency (withobserved precipitation data)
Correlation between observed asimulated discharge (with obseprecipitation data)
Difference ofvolume (Dv%)
Nash–Sutcliffecoefficient
Pearsoncorrelationcoefficient
Kendall rankcorrelationcoefficient
Calibration2000–2001 �0.7 0.93 0.97 0.90
Validation2001–2002 2.0 0.97 0.99 0.922002–2003 �4.8 0.90 0.95 0.892003–2004 12 0.86 0.94 0.82
Snowmelt period (April–September)Calibration2000 2.5 0.88 0.94 0.82
Validation2001 �0.3 0.95 0.98 0.912002 �0.7 0.82 0.92 0.772003 9.0 0.78 0.90 0.76
Extreme events (July–August)2000 4.5 0.50 0.70 –2001 5.3 0.76 0.87 –2002 3.9 0.19 0.44 –2003 22.2 0.74 0.86 –
0.72 over the annual and snowmelt simulation periods, respec-tively. The best performance of the model was found over the val-idation year 2001–2002 with the NS coefficient value of 0.94 and a3% difference in volume (Fig. 7). A NS coefficient value of 0.90 wasfound for the entire simulation period from 2000 to 2004. The cor-relation coefficient values were never less than 0.94 and 0.74 forthe Pearson and Kendall rank correlation tests over the annual sim-ulation periods, respectively. The extreme events are also modeledmore efficiently than for basin-wide application. A maximum NScoefficient value of 0.85 was found over the year 2003 (Table 6).
year, snowmelt period (April–September) and extreme discharge period (July–August),
ndrved
Model efficiency (withAPHRODITE precipitation data)
Correlation between observed andsimulated discharge (withAPHRODITE precipitation data)
Difference ofvolume (Dv%)
Nash–Sutcliffecoefficient
Pearsoncorrelationcoefficient
Kendall rankcorrelationcoefficient
�7.4 0.89 0.95 0.89
9 0.93 0.98 0.91�21 0.80 0.98 0.91�4.5 0.94 0.98 0.85
�6.7 0.79 0.91 0.80
11.7 0.87 0.96 0.87�25 0.64 0.96 0.87�9.6 0.90 0.96 0.85
�11.4 0.25 0.51 –13.2 0.62 0.79 –�30.8 0.40 0.64 –�9.0 0.83 0.91 –
112 A.A. Tahir et al. / Journal of Hydrology 409 (2011) 104–117
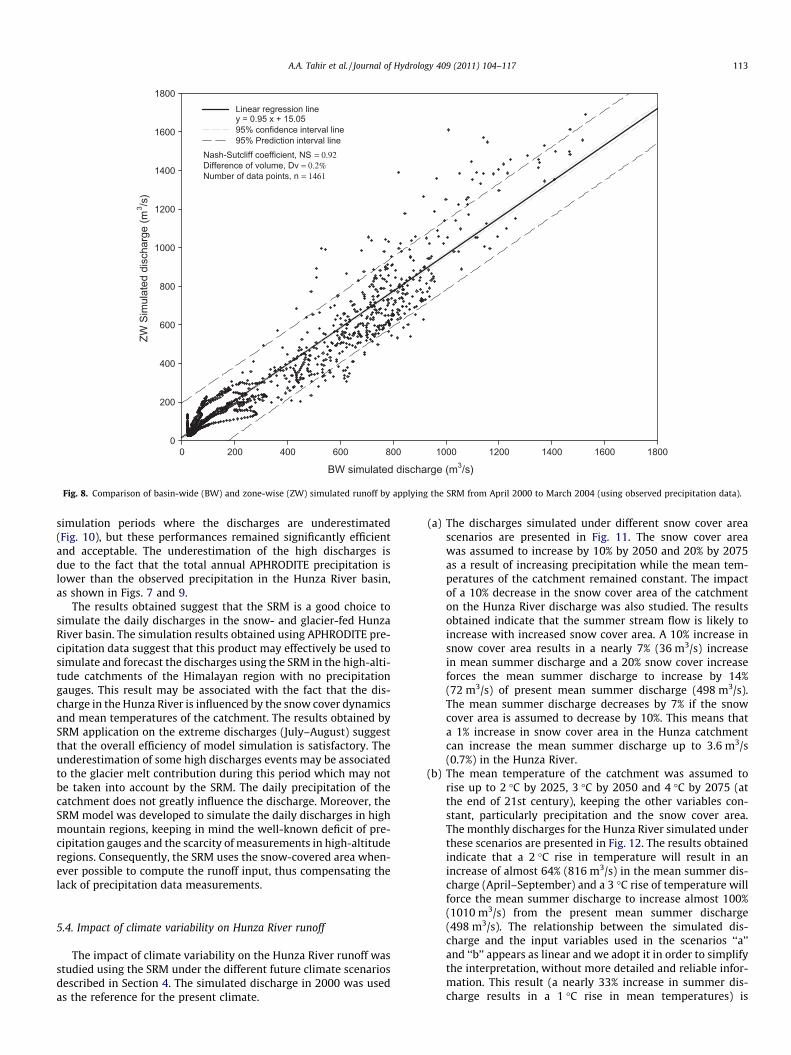
The basin-wide and zone-wise simulated discharge data were plot-ted against each other to analyse the reaction of both datasetsagainst the high discharges (Fig. 8). The zone-wise simulationseems to capture high discharges more efficiently than the basin-wide simulation. This may be associated with the fact that themodel parameters estimated for each zone are more reliable thanan average value estimated basin-wide.
5.3. Basin-wide application of the SRM (using APHRODITEprecipitation products)
The results obtained for the basin-wide application of the SRMusing APHRODITE precipitation data over the annual, snowmelt
Time perio
Apr-0
1
May
-01
Jun-
01
Jul-0
1
Aug-
01
Sep-
01
Dis
char
ge (m
3 /s)
0
250
500
750
1000
1250
1500
1750
2000
2250
2500
Fig. 7. Evaluation of basin-wide (BW) and zone-wise (ZW) SRM application over the hydr
Table 6Evaluation of zone-wise SRM application to the Hunza River basin during the hydrological yusing observed precipitation data.
Hydrological year (April–March) Model efficiency (with observed precipitation da
Difference of volume (Dv%) Nash–Sutcliffe coe
Calibration2000–01 �2.6 0.90
Validation2001–2002 3.0 0.942002–2003 1.2 0.922003–2004 8.1 0.83
Snowmelt period (April–September)Calibration2000–2001 0.46 0.82
Validation2001–2002 6.43 0.892002–2003 �0.01 0.852003–2004 13.20 0.72
Extreme events (July–August)2000 0.4 0.722001 �0.5 0.722002 10.0 0.462003 29.8 0.85
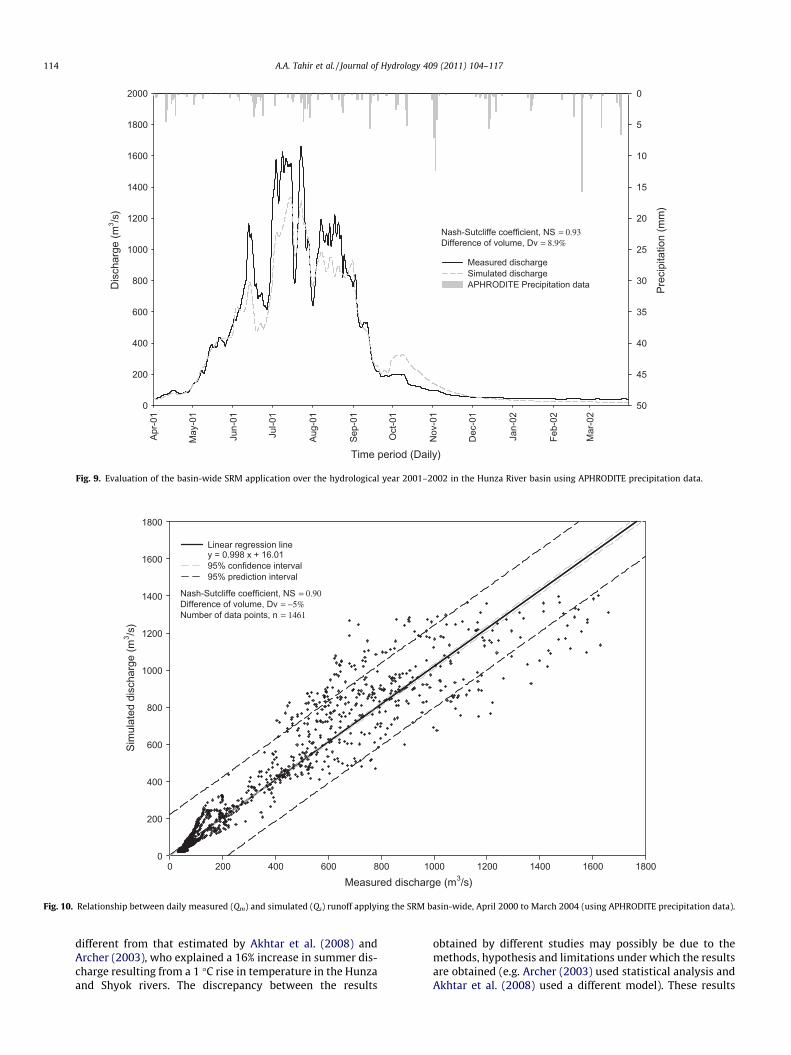
and extreme discharge periods are presented in Table 5. The NScoefficient value over the annual simulation period was never lessthan 0.80. The best performance of the model was found over thevalidation year 2003–2004 with the NS coefficient value of 0.94and a �4.5% difference in volume (Dv). The SRM performance overthe hydrological year 2001–2002, using APHRODITE precipitationdata, is shown in Fig. 9. The NS coefficient value of 0.90 was foundover the entire simulation period from 2000 to 2004 (Fig. 10). Thecorrelation coefficient values were never less than 0.95 and 0.85for the Pearson and Kendall rank correlation tests, respectively.The efficiency of the SRM using APHRODITE precipitation productswas slightly lower than that using observed precipitation (exceptfor the year 2003–2004), mainly for the high discharge (snowmelt)
d (Daily)
Oct
-01
Nov
-01
Dec
-01
Jan-
02
Feb-
02
Mar
-02
Prec
ipita
tion
(mm
)
5
15
25
35
45
0
10
20
30
40
50
Measured dischargeSimulated discharge-BW Simulated discharge-ZW Gauged precipitation
Nash-Sutcliffe coefficient, NS = 0.97 (BW), 0.94 (ZW)Difference of volume, Dv = 2% (BW), 3.1% (ZW)
ological year 2001–2002 in the Hunza River basin using observed precipitation data.
ear, snowmelt period (April–September) and extreme discharge period (July–August),
ta) Correlation between observed and simulated discharge
fficient Pearson correlation coefficient Kendall rank correlation coefficient
0.95 0.89
0.97 0.860.96 0.750.94 0.74
0.92 0.77
0.95 0.860.92 0.780.92 0.79
0.85 –0.85 –0.68 –0.92 –
BW simulated discharge (m3/s)0 200 400 600 800 1000 1200 1400 1600 1800
ZW S
imul
ated
dis
char
ge (m
3 /s)
0
200
400
600
800
1000
1200
1400
1600
1800Linear regression liney = 0.95 x + 15.0595% confidence interval line95% Prediction interval line
Nash-Sutcliff coefficient, NS = 0.92Difference of volume, Dv = 0.2%Number of data points, n = 1461
Fig. 8. Comparison of basin-wide (BW) and zone-wise (ZW) simulated runoff by applying the SRM from April 2000 to March 2004 (using observed precipitation data).
A.A. Tahir et al. / Journal of Hydrology 409 (2011) 104–117 113
simulation periods where the discharges are underestimated(Fig. 10), but these performances remained significantly efficientand acceptable. The underestimation of the high discharges isdue to the fact that the total annual APHRODITE precipitation islower than the observed precipitation in the Hunza River basin,as shown in Figs. 7 and 9.
The results obtained suggest that the SRM is a good choice tosimulate the daily discharges in the snow- and glacier-fed HunzaRiver basin. The simulation results obtained using APHRODITE pre-cipitation data suggest that this product may effectively be used tosimulate and forecast the discharges using the SRM in the high-alti-tude catchments of the Himalayan region with no precipitationgauges. This result may be associated with the fact that the dis-charge in the Hunza River is influenced by the snow cover dynamicsand mean temperatures of the catchment. The results obtained bySRM application on the extreme discharges (July–August) suggestthat the overall efficiency of model simulation is satisfactory. Theunderestimation of some high discharges events may be associatedto the glacier melt contribution during this period which may notbe taken into account by the SRM. The daily precipitation of thecatchment does not greatly influence the discharge. Moreover, theSRM model was developed to simulate the daily discharges in highmountain regions, keeping in mind the well-known deficit of pre-cipitation gauges and the scarcity of measurements in high-altituderegions. Consequently, the SRM uses the snow-covered area when-ever possible to compute the runoff input, thus compensating thelack of precipitation data measurements.
5.4. Impact of climate variability on Hunza River runoff
The impact of climate variability on the Hunza River runoff wasstudied using the SRM under the different future climate scenariosdescribed in Section 4. The simulated discharge in 2000 was usedas the reference for the present climate.
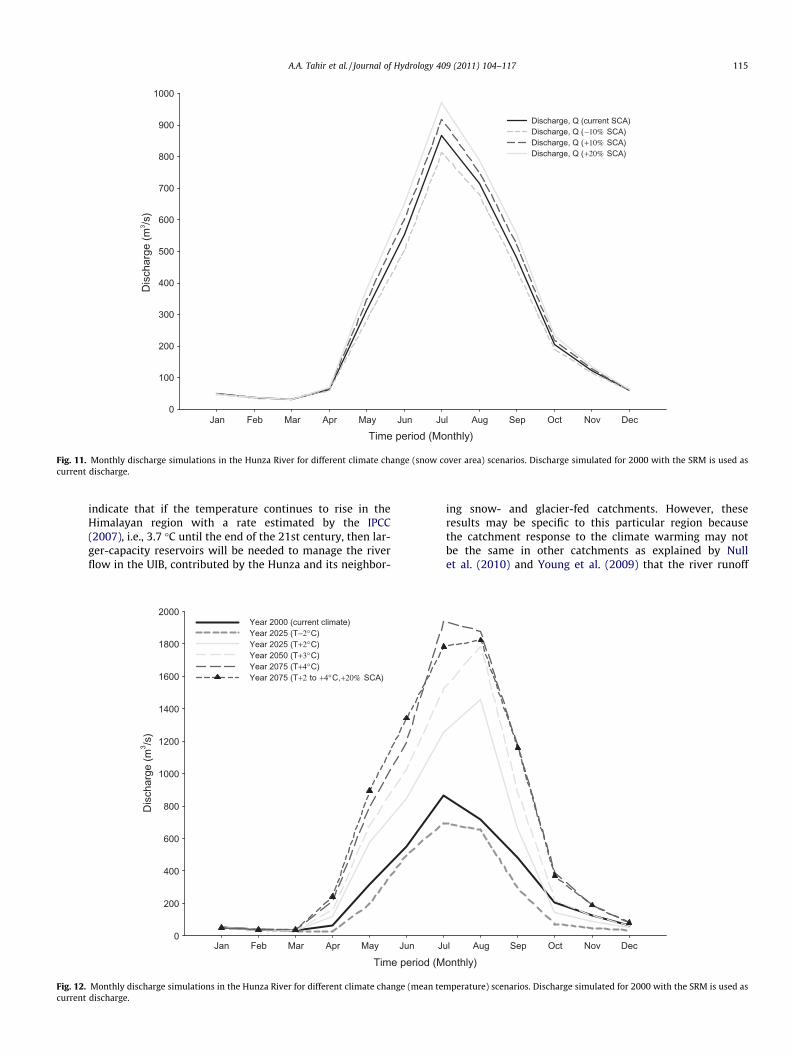
(a) The discharges simulated under different snow cover areascenarios are presented in Fig. 11. The snow cover areawas assumed to increase by 10% by 2050 and 20% by 2075as a result of increasing precipitation while the mean tem-peratures of the catchment remained constant. The impactof a 10% decrease in the snow cover area of the catchmenton the Hunza River discharge was also studied. The resultsobtained indicate that the summer stream flow is likely toincrease with increased snow cover area. A 10% increase insnow cover area results in a nearly 7% (36 m3/s) increasein mean summer discharge and a 20% snow cover increaseforces the mean summer discharge to increase by 14%(72 m3/s) of present mean summer discharge (498 m3/s).The mean summer discharge decreases by 7% if the snowcover area is assumed to decrease by 10%. This means thata 1% increase in snow cover area in the Hunza catchmentcan increase the mean summer discharge up to 3.6 m3/s(0.7%) in the Hunza River.
(b) The mean temperature of the catchment was assumed torise up to 2 �C by 2025, 3 �C by 2050 and 4 �C by 2075 (atthe end of 21st century), keeping the other variables con-stant, particularly precipitation and the snow cover area.The monthly discharges for the Hunza River simulated underthese scenarios are presented in Fig. 12. The results obtainedindicate that a 2 �C rise in temperature will result in anincrease of almost 64% (816 m3/s) in the mean summer dis-charge (April–September) and a 3 �C rise of temperature willforce the mean summer discharge to increase almost 100%(1010 m3/s) from the present mean summer discharge(498 m3/s). The relationship between the simulated dis-charge and the input variables used in the scenarios ‘‘a’’and ‘‘b’’ appears as linear and we adopt it in order to simplifythe interpretation, without more detailed and reliable infor-mation. This result (a nearly 33% increase in summer dis-charge results in a 1 �C rise in mean temperatures) is
Time period (Daily)
Apr-0
1
May
-01
Jun-
01
Jul-0
1
Aug-
01
Sep-
01
Oct
-01
Nov
-01
Dec
-01
Jan-
02
Feb-
02
Mar
-02
Dis
char
ge (m
3 /s)
0
200
400
600
800
1000
1200
1400
1600
1800
2000
Prec
ipita
tion
(mm
)
0
5
10
15
20
25
30
35
40
45
50
Measured dischargeSimulated discharge APHRODITE Precipitation data
Nash-Sutcliffe coefficient, NS = 0.93Difference of volume, Dv = 8.9%
Fig. 9. Evaluation of the basin-wide SRM application over the hydrological year 2001–2002 in the Hunza River basin using APHRODITE precipitation data.
Measured discharge (m3/s)0 200 400 600 800 1000 1200 1400 1600 1800
Sim
ulat
ed d
isch
arge
(m3 /s
)
0
200
400
600
800
1000
1200
1400
1600
1800
Linear regression liney = 0.998 x + 16.0195% confidence interval95% prediction interval
Nash-Sutcliffe coefficient, NS = 0.90Difference of volume, Dv = −5%Number of data points, n = 1461
Fig. 10. Relationship between daily measured (Qm) and simulated (Qs) runoff applying the SRM basin-wide, April 2000 to March 2004 (using APHRODITE precipitation data).
114 A.A. Tahir et al. / Journal of Hydrology 409 (2011) 104–117
different from that estimated by Akhtar et al. (2008) andArcher (2003), who explained a 16% increase in summer dis-charge resulting from a 1 �C rise in temperature in the Hunzaand Shyok rivers. The discrepancy between the results
obtained by different studies may possibly be due to themethods, hypothesis and limitations under which the resultsare obtained (e.g. Archer (2003) used statistical analysis andAkhtar et al. (2008) used a different model). These results
Time period (Monthly)Jan Feb Mar Apr May Jun Jul Aug Sep Oct Nov Dec
Dis
char
ge (m
3 /s)
0
100
200
300
400
500
600
700
800
900
1000
Discharge, Q (current SCA) Discharge, Q (−10% SCA) Discharge, Q (+10% SCA) Discharge, Q (+20% SCA)
Fig. 11. Monthly discharge simulations in the Hunza River for different climate change (snow cover area) scenarios. Discharge simulated for 2000 with the SRM is used ascurrent discharge.
A.A. Tahir et al. / Journal of Hydrology 409 (2011) 104–117 115
indicate that if the temperature continues to rise in theHimalayan region with a rate estimated by the IPCC(2007), i.e., 3.7 �C until the end of the 21st century, then lar-ger-capacity reservoirs will be needed to manage the riverflow in the UIB, contributed by the Hunza and its neighbor-
Time peJan Feb Mar Apr May Jun
Dis
char
ge (m
3 /s)
0
200
400
600
800
1000
1200
1400
1600
1800
2000Year 2000 (current climate) Year 2025 (T−2°C) Year 2025 (T+2°C) Year 2050 (T+3°C) Year 2075 (T+4°C) Year 2075 (T+2 to +4°C,+20% SCA)
Fig. 12. Monthly discharge simulations in the Hunza River for different climate change (mcurrent discharge.
ing snow- and glacier-fed catchments. However, theseresults may be specific to this particular region becausethe catchment response to the climate warming may notbe the same in other catchments as explained by Nullet al. (2010) and Young et al. (2009) that the river runoff
riod (Monthly)Jul Aug Sep Oct Nov Dec
ean temperature) scenarios. Discharge simulated for 2000 with the SRM is used as
116 A.A. Tahir et al. / Journal of Hydrology 409 (2011) 104–117
decreases with increasing temperature scenarios. This sce-nario will also result in a shift of runoff period as presentedin Fig. 12, where the discharge increase is shifted by 1 month(from April to March). This fact is also explained by Nullet al. (2010) and Young et al. (2009) that the high elevationwatersheds in the southern-central region of Sierra Nevadaare most susceptible to earlier runoff timing. On the otherhand, if this scenario plays itself out, then the glaciers mayretreat extensively or even disappear after a certain periodof producing a high discharge, as a result of rapid melting.The rapid melting of glaciers is also reported by Cannoneet al. (2008) who explained that many of the small glaciers(80% of total glacial coverage and an important contributionto water resources) in the Alps could disappear in the nextdecades under current climate warming trend. These shrink-ing glaciers, surface-albedo change, and modifications to thesoil–water storage capacities may result in a different long-term hydrograph in the high elevation catchments.
(c) The monthly discharge simulating a 20% increase in snowcover and a 2–4 �C rise in mean temperature is presentedin Fig. 12. The simulation indicates a 100% increase in thefuture stream flow. This result suggests that the Hunza Riverdischarges are highly influenced by the snow cover meltcaused by the mean temperature input in summer and notby the catchment precipitation, as explained by Archer(2003). However, the Hunza River discharge has a positivecorrelation with winter precipitation that falls in the formof snow and starts melting as the mean temperatureincreases in the catchment (Tahir et al., 2011). Moreover,33% of the area of the Hunza River basin is glacier-coveredand contributes actively to the snowmelt-produced runoff.This is the area that is considered to receive an increasingamount of precipitation in the future and no significantincrease in the mean temperatures (Tahir et al., 2011),resulting in an increased snow cover area. This increasedsnow cover area will produce a large amount of runoff onmelting if the mean temperature tends to rise in the futureas presented in Fig. 12. Moreover, if the mean temperatureand winter precipitation tend to increase until the end ofcentury, this may result in a balance of cryosphere area inthe Karakoram region.
6. Conclusion
This study concludes that the snowmelt runoff model (SRM)based on a degree day factor can efficiently simulate the daily dis-charge in the snow- and glacier-fed catchments of the Upper IndusRiver Basin (UIB). The SRM’s efficiency in high-altitude catchmentscan be attributed to the use of the MOD10A2 remotely sensed cry-osphere data as input to the model for water-equivalent produc-tion. This is why the model is not likely to be affected by thewell-known precipitation gauging errors in mountainous river ba-sins, which contribute a considerable proportion of river runoff inthe form of snowmelt. Moreover, the use of 0.25 � 0.25� griddedAPHRODITE precipitation data (APHRO_MA_V0902) in the SRMindicates that the model is not sensitive to precipitation forcingand this product can be used for runoff simulations in the Himala-yan and Karakoram catchments, where the hydrometeorologicalmeasurements are scarce or not available. The SRM overcomesthe problem of precipitation catch deficit by using the snow coverarea whenever possible for computing the runoff input (Martinecet al., 2007). In fact, SRM counts the precipitation input twice dur-ing the simulation: once in the form of snow cover input and thenin the form of precipitation data input. This is why the problem ofunderestimated APHRODITE precipitation data can be efficiently
overcome by using the SRM on the snow- and glacier-fedcatchments.
The analysis of the climate change impact indicated that thebasin’s hydrology will alter under different climate change scenar-ios. This change apparently results from the increasing tempera-ture, which will increase the volume of summer stream flow inthe region. The availability of the snowmelt runoff seems to shiftaccordingly with the mean temperature rise in the spring. Thisanalysis suggests that new reservoirs (such as the projected DiamerBhasha Dam that is planned on the Indus River about 315 km up-stream from Tarbela Dam) (Fig. 1) are required for the summer flowstorage to meet the needs for supplementary irrigation suppliesduring the low-flow period in the downstream regions, increasingpower-generation demand, flood control and water supply. Thoughthe climate scenarios used in this study were assumed or derivedfrom previous studies, they provide useful information to managewater resources for the country’s future needs.
The application of the SRM to the other snowmelt runoff-dominated sub-catchments of the UIB may help manage the inte-grated water resources of the Indus River irrigation system. Thenext step of the study is to apply the SRM to the neighboring snow-and glacier-fed catchments – Shigar, Shyok, Astore, Gilgit andKharmong (Fig. 1) – to simulate and forecast the summer streamflow as well as to evaluate the impact of future climate scenariosin these Himalayan regions.
Acknowledgements
Adnan Ahmad Tahir was financially supported by the HigherEducation Commission of Pakistan within the framework of aFrance-Pakistan collaboration program for overseas studies. Thisfinancial support is gratefully acknowledged and appreciated.The authors extend their thanks to the Water and Power Develop-ment Authority (WAPDA) for contributing their hydrological andmeteorological data. The authors also wish to thank NASA andJapan’s Ministry of the Economy, Trade and Industry (METI) forproviding ASTER GDEM.
Ralph Roberts, Computer Specialist at the USDA-ARS Hydrologyand Remote-sensing Lab, provided valuable information to solvethe SRM installation problems.
References
Akhtar, M., Ahmad, N., Booij, M.J., 2008. The impact of climate change on the waterresources of Hindukush–Karakorum–Himalaya region under different glaciercoverage scenarios. J. Hydrol. 355, 148–163.
Archer, D., 2003. Contrasting hydrological regimes in the Upper Indus Basin. J.Hydrol. 274, 198–210.
Archer, D.R., Fowler, H.J., 2004. Spatial and temporal variations in precipitation inthe Upper Indus Basin, global teleconnections and hydrological implications.Hydrol. Earth Syst. Sci. 8 (1), 47–61.
Bookhagen, B., Burbank, D.W., 2010. Toward a complete Himalayan hydrologicalbudget: spatiotemporal distribution of snowmelt and rainfall and their impacton river discharge. J. Geophys. Res. 115, F03019.
Cannone, N., Diolaiuti, G., Guglielmin, M., Smiraglia, C., 2008. Accelerating climatechange impacts on alpine glacier forefield ecosystems in the European Alps.Ecol. Appl. 18 (3), 637–648.
Dey, B., Sharma, V.K., Rango, A., 1989. A test of Snowmelt-Runoff Model for a majorriver basin in Western Himalayas. Nord. Hydrol. 20, 167–178.
Førland, E.J., et al., 1996. Manual for Operational Correction of Nordic PrecipitationData. 24/96, DNMI, P.O. Box 43, Blindern, Oslo, Norway.
Fowler, H.J., Archer, D.R., 2005. Conflicting signals of climatic change in the UpperIndus Basin. J. Clim. 19, 4276–4293.
Georgievsky, M.V., 2009. Application of the Snowmelt Runoff Model in the KubanRiver basin using MODIS satellite images. Environ. Res. Lett. 4, 1–5.
Hall, D., Riggs, G., Salomonson, V., 2006, updated weekly. MODIS/Terra Snow Cover8-Day L3 Global 500 m Grid V005, [March 2000 to December 2009]. Boulder,Colorado USA: National Snow and Ice Data Center. Digital Media.
Hewitt, K., 2005. The Karakoram Anomaly? Glacier expansion and the ‘ElevationEffect’, Karakoram Himalaya. Mountain Res. Dev. 25 (04), 332–340.
Hewitt, K., Wake, C.P., Young, G.J., David, C., 1989. Hydrological Investigation atBiafo Glacier, Karakoram Range, Himalaya; an important source of water for theIndus River. Ann. Glaciol. 13, 103–108.
A.A. Tahir et al. / Journal of Hydrology 409 (2011) 104–117 117
Hock, R., 2003. Temperature index melt modeling in mountain areas. J. Hydrol. 282(1–4), 104–115.
Hong, M., Guodong, C., 2003. A test of Snowmelt Runoff Model (SRM) for theGongnaisi River basin in the western Tianshan Mountains, China. Chin. Sci. Bull.48, 2253–2259.
Immerzeel, W.W., Droogers, P., de Jong, S.M., Bierkens, M.F.P., 2009. Large-scalemonitoring of snow cover and runoff simulation in Himalayan river basinsusing remote sensing. Remote Sens. Environ. 113, 40–49.
Immerzeel, W.W., van Beek, L.P.H., Bierkens, M.F.P., 2010. Climate change will affectthe Asian water towers. Science 328 (5984), 1382–1385.
IPCC, 2007. Climate Change 2007: Synthesis report. Contribution of working groupsI, II and III to the fourth assessment report of the intergovernmental panel onclimate change. Core Writing Team, Pachauri, R.K., Reisinger, A. (Eds.),Intergovernmental Panel on Climate Change (IPCC), Geneva, Switzerland.
Kendall, M.G., 1975. Rank Correlation Measures, fourth ed. Charles Griffin, London,202 pp.
Kendall, M.G., Gibbons, J.D., 1990. Rank Correlation Methods, fifth ed. EdwardArnold, London.
Lee, S., Klein, A.G., Over, T.M., 2005. A comparison of MODIS and NOHRSC snow-cover products for simulating streamflow using the Snowmelt Runoff Model.Hydrol. Process. 19 (15), 2951–2972.
Liniger, H., Weingartner, R., Grosjean, M. (Eds.), 1998. Mountains of the World:Water Towers for the 21st Century. Mountain Agenda for the Commission onSustainable Development (CSD), BO12, Berne, 32 pp.
Martinec, J., 1975. Snowmelt-Runoff Model for stream flow forecasts. Nord. Hydrol.6, 145–154.
Martinec, J., Rango, A., Roberts, R., 2007. Snowmelt-Runoff Model (SRM) user’smanual. USDA Jornada Experimental Range, New Mexico State University, LasCruces, NM 88003, USA.
Maurer, E.P., Rhoads, J.D., Dubayah, R.O., Lettenmaier, D.P., 2003. Evaluation of thesnow-covered area data product from MODIS. Hydrol. Process. 17 (1), 59–71.
Null, S.E., Viers, J.H., Mount, J.F., 2010. Hydrologic response and watershedsensitivity to climate warming in California’s Sierra Nevada. PLoS One 5 (4),e9932.
Prasad, V.H., Roy, P.S., 2005. Estimation of Snowmelt runoff in Beas basin, India.Geocarto Int. 20 (2), 41–47.
Rodgers, J.L., Nicewander, W.A., 1988. Thirteen ways to look at the correlationcoefficient. Am. Stat. 42 (1), 59–66.
Sevruk, B., 1985. Correction of Precipitation Measurements, Workshop on theCorrection of Precipitation Measurements. WMO/IAHS/ETH, Zurich,Switzerland, pp. 13–23.
Sevruk, B., 1989. Reliability of Precipitation Measurement, International Workshopon Precipitation Measurement. WMO Tech. Document, pp. 13–19.
Singh, P., Kumar, N., 1997. Impact assessment of climate change on the hydrologicalresponse of a snow and glacier melt runoff dominated Himalayan river. J.Hydrol. 193 (1–4), 316–350.
Sirguey, P., Mathieu, R., Arnaud, Y., Fitzharris, B.B., 2009. Seven years of snow covermonitoring with MODIS to model catchment discharge in New Zealand. In: IEEEInternational Geoscience and Remote Sensing Symposium (IGARSS), 2009, CapeTown, pp. II-863–II-866.
Sorman, A.A., Sensoy, A., Tekeli, A.E., Sorman, A.U., Akyurek, Z., 2009. Modelling andforecasting snowmelt runoff process using the HBV model in the eastern part ofTurkey. Hydrol. Process. 23 (7), 1031–1040.
Tahir, A.A., Chevallier, P., Arnaud, Y., Ahmad, B., 2011. Snow cover dynamics andhydrological regime of the Hunza River basin, Karakoram Range, NorthernPakistan. Hydrol. Earth Syst. Sci. (HESS) 15 (7), 2275–2290.
Verdhen, A., Prasad, T., 1993. Snowmelt Runoff Simulation Models and theirSuitability in Himalayan Conditions, Snow and Glacier Hydrology. IAHS Publ.No. 218, Kathmandu.
Wake, C.P., 1989. Glaciochemical investigations as a tool to determine the spatialvariation of snow accumulation in the Central Karakoram, Northern Pakistan.Ann. Glaciol. 13, 279–284.
WMO, 1986. Intercomparison of Models of Snowmelt Runoff, Geneva, Switzerland.WMO, 1992. Simulated Real-time Intercomparison of Hydrological Models, Geneva,
Switzerland.Yatagai et al., 2009. A 44-year daily gridded precipitation dataset for Asia based on a
dense network of rain gauges. SOLA 5, 137–140.Young, G.J., Hewitt, K., 1990. Hydrology Research in the Upper Indus Basin,
Karakoram Himalaya, Pakistan. Hydrology of Mountanous Areas. InternationalAssociation Hydrological Sciences, Czechoslovakia, pp. 139–152.
Young, C.A. et al., 2009. Modeling the Hydrology of Climate Change in California’sSierra Nevada for Subwatershed Scale Adaptation. J. Am. Water Resour. Assoc.(JAWRA) 45 (6), 1409–1423.
Zhang, Y., Liu, S., Ding, Y., 2006. Observed degree-day factors and their spatialvariation on glaciers in western China. Ann. Glaciol. 43, 301–306.


![OrgChart[5] - UTSA](https://img.pdfslide.net/doc/110x75/61a13a59f7bc0a75204ef211/orgchart5-utsa.jpg)