Embed Size (px)
Citation preview
Page 1
Kajaria Ceramics CMP
Rs. 1,250
Target
Rs.1,390
Rating
BUY
GIRISH CHOUDHARY [email protected] +91 44 4344 0021
GAURAV NAGORI CFA [email protected] +91 44 4344 0072 Find Spark Research on Bloomberg (SPAK <go>),
Thomson First Call, Reuters Knowledge and Factset
Rating: ◄► Target price: ▲ EPS: ▲
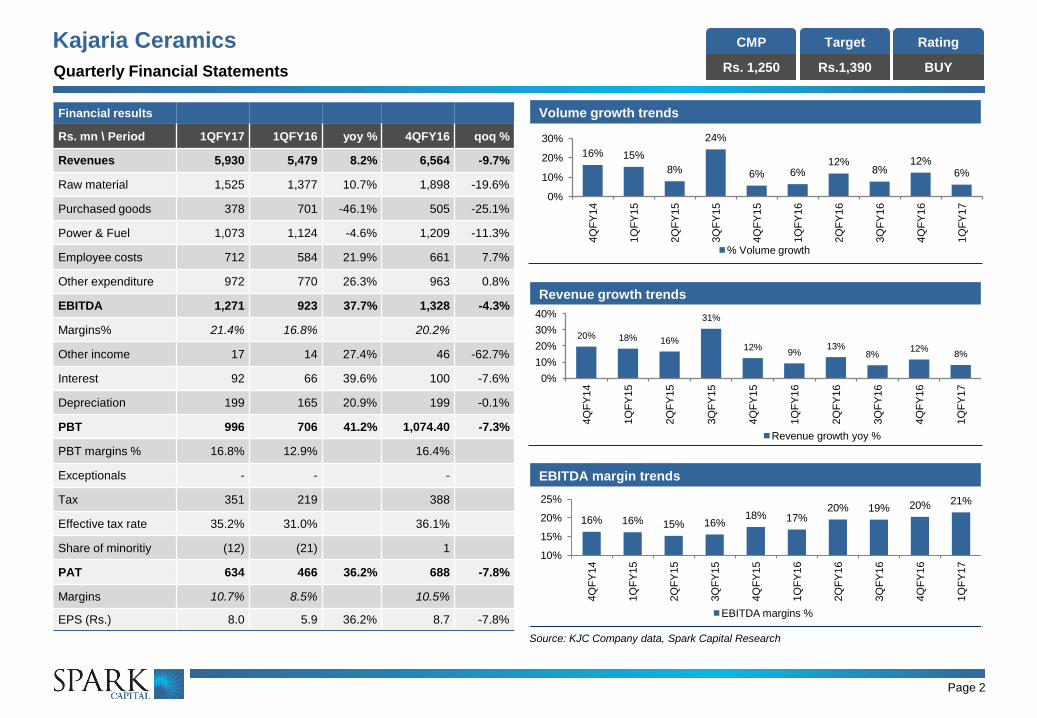
How does our one year outlook change? Kajaria Ceramics (KJC) reported a revenue growth of 8% led by volume
growth of 6%. Higher than industry volume growth, re-iterates our view of
organised players gaining market share.
EBITDA margins came in at 21.4% vs. 16.8% last year. Combination of
higher proportion of polished/glazed vitrified tiles, lower outsourcing sales
and power & fuel costs aided gross margin expansion to the tune of 800
basis points. We expect KJC to deliver margins of 20-21% heading into
FY17-18 on improving product mix and lower outsourcing sales.
Imposition of Anti-dumping duty on Chinese vitrified tiles will aid market
share gains and stable pricing regime. Management expects ~40msm or
5% of industry volume to shift back to domestic producers.
KJC has incurred cumulative capex of ~Rs. 7bn in F14-FY16, increasing
its capacity by ~67% to ~69msm. Heading into FY17, KJC has planned
expansions to the tune of 5.7msm, as a result expect company to
generate free cash flows of Rs. 2.5bn over FY17-FY18E.
Kajaria Ceramics is India’s largest tile manufacturer in terms of installed
capacity and enjoys a strong brand image resulting in premium pricing
across most markets/products. We expect KJC to post a revenue and PAT
CAGR of 15% and 21% respectively over FY16E-FY18E. Given
impressive track record of market share gains, expansion in margins and
return ratios and healthy balance sheet, we ascribe valuation of 30x
FY18E EPS(three year average of 27x). Maintain BUY with a target price
of Rs. 1,390/share.
How does our 3 year Outlook change?
We remain positive on the demand prospects of tiles industry over a three
year outlook. Demand will be led by continued increase in urbanization,
nuclear families, and replacement demand. Increase in penetration,
especially in Rural India (~currently only 3.7% of rural households have
tiles as a flooring material) will further drive demand.
We see a structural shift in market share gain to organized players led by
(a) increasing brand awareness/perception; (b) strong distribution
network; and (c) better range of designs/sizes. As a result, we expect KJC
to be one of the biggest beneficiaries of this trend. We remain positive on
KJC’s long term prospects due to (1) strong brand image; (2) industry
leading growth will result in consistent market share gains; and (3) strong
balance sheet/return metrics.
Financial summary
Year Revenues
(Rs. mn)
EBITDA
(Rs. mn)
PAT
(Rs. mn) EPS P/E (X) RoE%
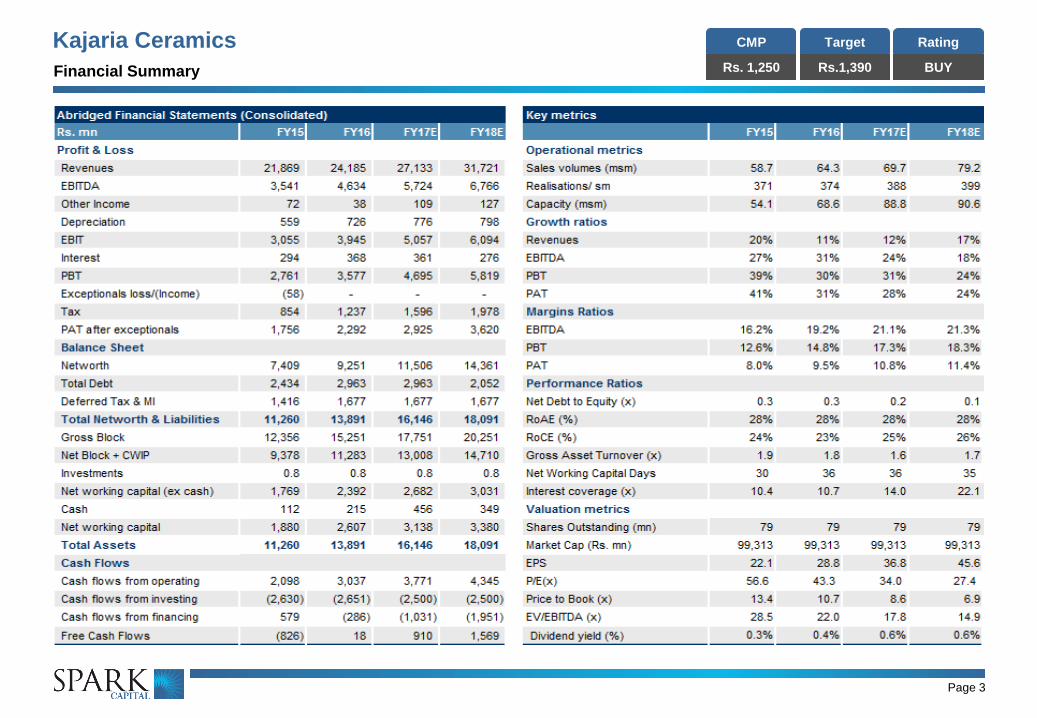
FY15 21,869 3,541 1,756 22.1 56.6 27.6%
FY16E 24,185 4,634 2,292 28.8 43.3 27.5%
FY17E 27,133 5,724 2,925 36.8 34.0 28.2%
FY18E 31,721 6,766 3,620 45.6 27.4 28.0%
Key estimate revision
FY17E FY18E
Old New Change Old New Change
Revenues 27,766 27,133 -2.3% 32,675 31,721 -2.9%
EBITDA 5,779 5,724 -1.0% 6,658 6,766 1.6%
Margin % 20.8% 21.1% 20.4% 21.3%
PAT 2,977 2,925 -1.8% 3,491 3,620 3.7%
PAT margin % 10.7% 10.8% 10.7% 11.4%
EPS 37.5 36.8 -1.8% 43.9 45.6 3.8%
All figures in Rs. mn, except EPS, which is in Rs.
05th Aug, 2016
Bloomberg KJC IN
Shares o/s 79mn
Market Cap Rs. 99bn
52-wk High-Low Rs. 1280-607
3m Avg. Daily Vol Rs. 123mn
Index BSE 500
1QFY17 Update
Promoters 47.2
Institutions 33.0
Public 20.8
(%) 1m 3m 12m
KJC 4 18 67
Sensex 2 11 -1
Page 2
Kajaria Ceramics CMP
Rs. 1,250
Target
Rs.1,390
Rating
BUY Quarterly Financial Statements
Volume growth trends
Revenue growth trends
EBITDA margin trends
Source: KJC Company data, Spark Capital Research
16% 16% 15% 16% 18% 17%
20% 19% 20% 21%
10%
15%
20%
25%
4Q
FY
14
1Q
FY
15
2Q
FY
15
3Q
FY
15
4Q
FY
15
1Q
FY
16
2Q
FY
16
3Q
FY
16
4Q
FY
16
1Q
FY
17
EBITDA margins %
20% 18% 16%
31%
12% 9%
13% 8%
12% 8%
0%
10%
20%
30%
40%
4Q
FY
14
1Q
FY
15
2Q
FY
15
3Q
FY
15
4Q
FY
15
1Q
FY
16
2Q
FY
16
3Q
FY
16
4Q
FY
16
1Q
FY
17
Revenue growth yoy %
16% 15%
8%
24%
6% 6% 12%
8% 12%
6%
0%
10%
20%
30%
4Q
FY
14
1Q
FY
15
2Q
FY
15
3Q
FY
15
4Q
FY
15
1Q
FY
16
2Q
FY
16
3Q
FY
16
4Q
FY
16
1Q
FY
17
% Volume growth
Financial results
Rs. mn \ Period 1QFY17 1QFY16 yoy % 4QFY16 qoq %
Revenues 5,930 5,479 8.2% 6,564 -9.7%
Raw material 1,525 1,377 10.7% 1,898 -19.6%
Purchased goods 378 701 -46.1% 505 -25.1%
Power & Fuel 1,073 1,124 -4.6% 1,209 -11.3%
Employee costs 712 584 21.9% 661 7.7%
Other expenditure 972 770 26.3% 963 0.8%
EBITDA 1,271 923 37.7% 1,328 -4.3%
Margins% 21.4% 16.8% 20.2%
Other income 17 14 27.4% 46 -62.7%
Interest 92 66 39.6% 100 -7.6%
Depreciation 199 165 20.9% 199 -0.1%
PBT 996 706 41.2% 1,074.40 -7.3%
PBT margins % 16.8% 12.9% 16.4%
Exceptionals - - -
Tax 351 219 388
Effective tax rate 35.2% 31.0% 36.1%
Share of minoritiy (12) (21) 1
PAT 634 466 36.2% 688 -7.8%
Margins 10.7% 8.5% 10.5%
EPS (Rs.) 8.0 5.9 36.2% 8.7 -7.8%
Page 3
Kajaria Ceramics CMP
Rs. 1,250
Target
Rs.1,390
Rating
BUY Financial Summary
Page 4
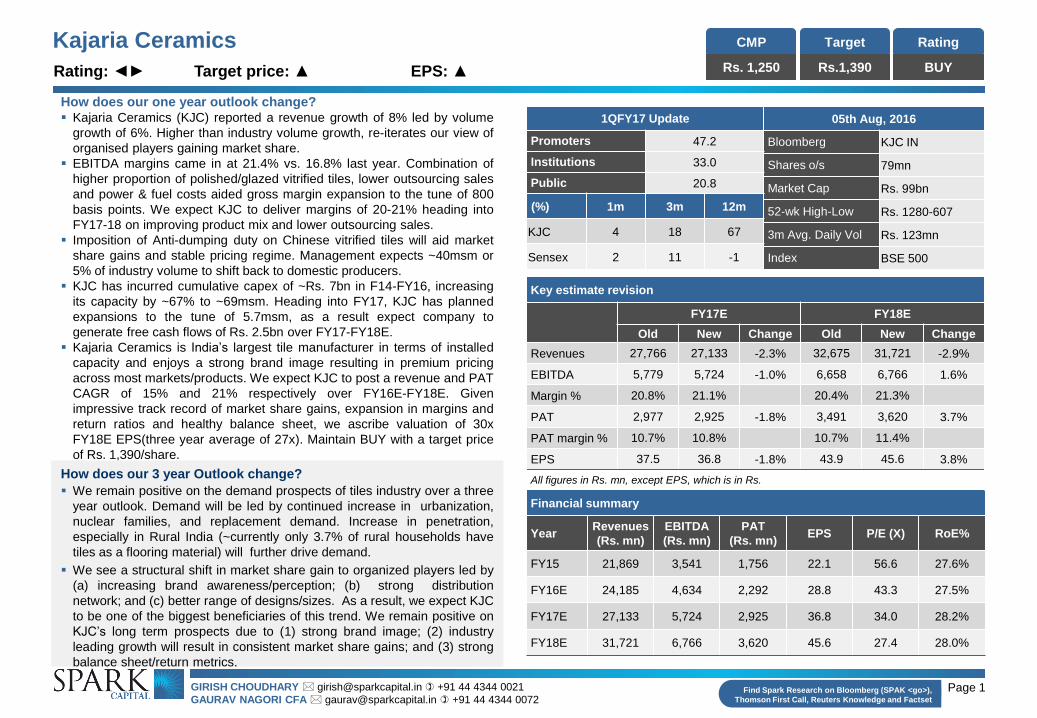
Kajaria Ceramics – Crystal Gazing
Expect KJC to
continue to outpace
industry growth.
This will be driven
by aggressive
capacity additions,
new product
launches, and
better product mix.
Further, we expect
KJC’s foray in to
new verticals
(Faucets,
Sanitaryware) will
succeed driven by
brand image and
dealer network.
Market share gain to
continue. Expect the
current peak margins
to sustain led by
product mix and
anti-dumping duty
Consistent
revenue
growth of 17%
Increasing
operational
efficiency
result in
Consistent
growth in
business to be
rewarded by
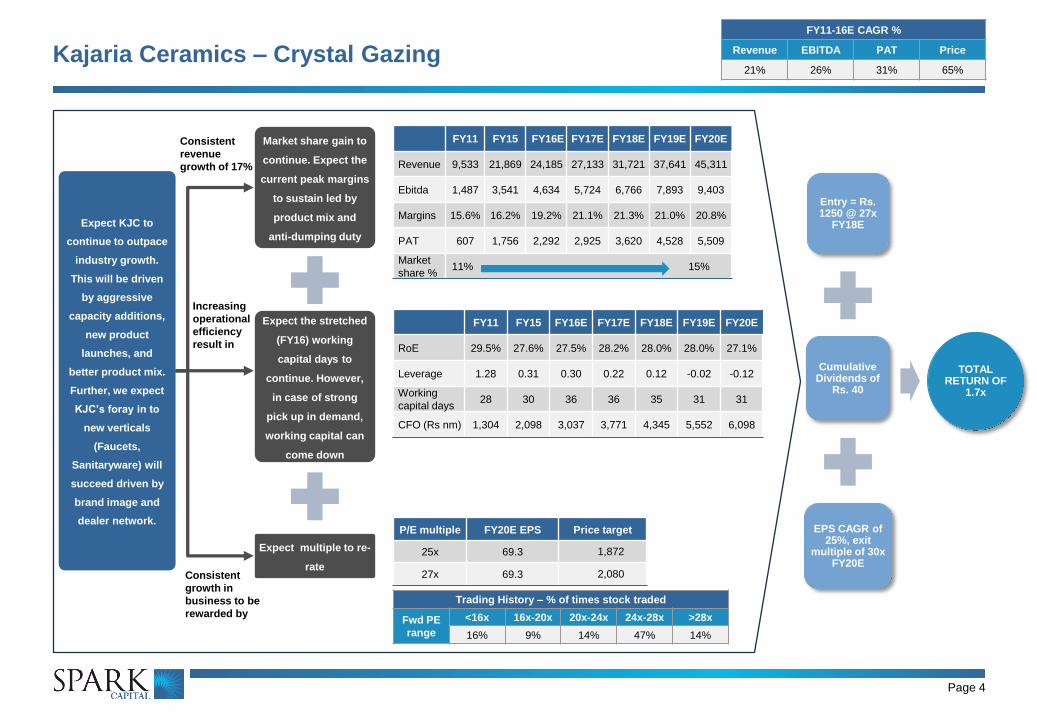
P/E multiple FY20E EPS Price target
25x 69.3 1,872
27x 69.3 2,080
Entry = Rs. 1250 @ 27x
FY18E
Cumulative Dividends of
Rs. 40
EPS CAGR of 25%, exit
multiple of 30x FY20E
TOTAL RETURN OF
1.7x
FY11 FY15 FY16E FY17E FY18E FY19E FY20E
Revenue 9,533 21,869 24,185 27,133 31,721 37,641 45,311
Ebitda 1,487 3,541 4,634 5,724 6,766 7,893 9,403
Margins 15.6% 16.2% 19.2% 21.1% 21.3% 21.0% 20.8%
PAT 607 1,756 2,292 2,925 3,620 4,528 5,509
Market
share % 11% 15%
FY11 FY15 FY16E FY17E FY18E FY19E FY20E
RoE 29.5% 27.6% 27.5% 28.2% 28.0% 28.0% 27.1%
Leverage 1.28 0.31 0.30 0.22 0.12 -0.02 -0.12
Working
capital days 28 30 36 36 35 31 31
CFO (Rs nm) 1,304 2,098 3,037 3,771 4,345 5,552 6,098
Expect the stretched
(FY16) working
capital days to
continue. However,
in case of strong
pick up in demand,
working capital can
come down
Expect multiple to re-
rate
FY11-16E CAGR %
Revenue EBITDA PAT Price
21% 26% 31% 65%
Trading History – % of times stock traded
Fwd PE
range
<16x 16x-20x 20x-24x 24x-28x >28x
16% 9% 14% 47% 14%
Page 5
Kajaria Ceramics CMP
Rs. 1,250
Target
Rs.1,390
Rating
BUY Spark Disclaimer
Spark Capital Advisors (India) Private Limited (Spark Capital) and its affiliates are engaged in
investment banking, investment advisory and institutional equities and infrastructure advisory
services. Spark Capital is registered with SEBI as a Stock Broker and Category 1 Merchant Banker.
We hereby declare that our activities were neither suspended nor we have defaulted with any stock
exchange authority with whom we are registered in the last five years. We have not been debarred
from doing business by any Stock Exchange/SEBI or any other authorities, nor has our certificate of
registration been cancelled by SEBI at any point of time.
Absolute Rating Interpretation
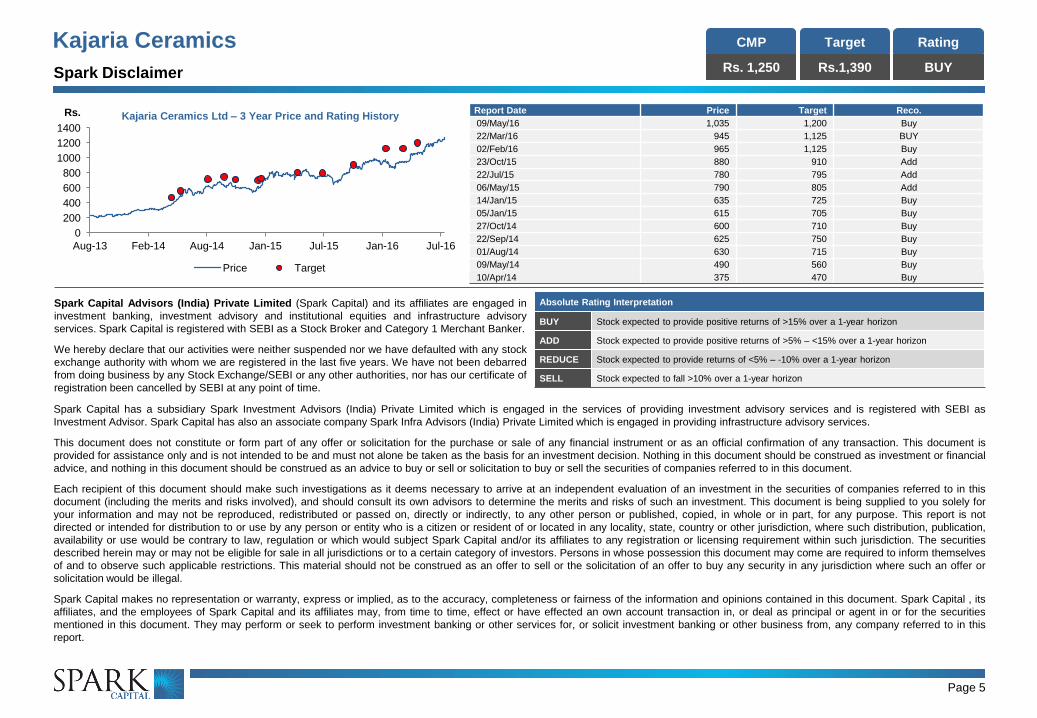
BUY Stock expected to provide positive returns of >15% over a 1-year horizon
ADD Stock expected to provide positive returns of >5% – <15% over a 1-year horizon
REDUCE Stock expected to provide returns of <5% – -10% over a 1-year horizon
SELL Stock expected to fall >10% over a 1-year horizon
Spark Capital has a subsidiary Spark Investment Advisors (India) Private Limited which is engaged in the services of providing investment advisory services and is registered with SEBI as
Investment Advisor. Spark Capital has also an associate company Spark Infra Advisors (India) Private Limited which is engaged in providing infrastructure advisory services.
This document does not constitute or form part of any offer or solicitation for the purchase or sale of any financial instrument or as an official confirmation of any transaction. This document is
provided for assistance only and is not intended to be and must not alone be taken as the basis for an investment decision. Nothing in this document should be construed as investment or financial
advice, and nothing in this document should be construed as an advice to buy or sell or solicitation to buy or sell the securities of companies referred to in this document.
Each recipient of this document should make such investigations as it deems necessary to arrive at an independent evaluation of an investment in the securities of companies referred to in this
document (including the merits and risks involved), and should consult its own advisors to determine the merits and risks of such an investment. This document is being supplied to you solely for
your information and may not be reproduced, redistributed or passed on, directly or indirectly, to any other person or published, copied, in whole or in part, for any purpose. This report is not
directed or intended for distribution to or use by any person or entity who is a citizen or resident of or located in any locality, state, country or other jurisdiction, where such distribution, publication,
availability or use would be contrary to law, regulation or which would subject Spark Capital and/or its affiliates to any registration or licensing requirement within such jurisdiction. The securities
described herein may or may not be eligible for sale in all jurisdictions or to a certain category of investors. Persons in whose possession this document may come are required to inform themselves
of and to observe such applicable restrictions. This material should not be construed as an offer to sell or the solicitation of an offer to buy any security in any jurisdiction where such an offer or
solicitation would be illegal.
Spark Capital makes no representation or warranty, express or implied, as to the accuracy, completeness or fairness of the information and opinions contained in this document. Spark Capital , its
affiliates, and the employees of Spark Capital and its affiliates may, from time to time, effect or have effected an own account transaction in, or deal as principal or agent in or for the securities
mentioned in this document. They may perform or seek to perform investment banking or other services for, or solicit investment banking or other business from, any company referred to in this
report.
0
200
400
600
800
1000
1200
1400
Aug-13 Feb-14 Aug-14 Jan-15 Jul-15 Jan-16 Jul-16
Rs.
Price Target
Kajaria Ceramics Ltd – 3 Year Price and Rating History Report Date Price Target Reco.
09/May/16 1,035 1,200 Buy
22/Mar/16 945 1,125 BUY
02/Feb/16 965 1,125 Buy
23/Oct/15 880 910 Add
22/Jul/15 780 795 Add
06/May/15 790 805 Add
14/Jan/15 635 725 Buy
05/Jan/15 615 705 Buy
27/Oct/14 600 710 Buy
22/Sep/14 625 750 Buy
01/Aug/14 630 715 Buy
09/May/14 490 560 Buy
10/Apr/14 375 470 Buy
Page 6
Kajaria Ceramics CMP
Rs. 1,250
Target
Rs.1,390
Rating
BUY Disclaimer (Cont’d)
This report has been prepared on the basis of information, which is already available in publicly accessible media or developed through an independent analysis by Spark Capital. While we would
endeavour to update the information herein on a reasonable basis, Spark Capital and its affiliates are under no obligation to update the information. Also, there may be regulatory, compliance or
other reasons that prevent Spark Capital and its affiliates from doing so. Neither Spark Capital nor its affiliates or their respective directors, employees, agents or representatives shall be
responsible or liable in any manner, directly or indirectly, for views or opinions expressed in this report or the contents or any errors or discrepancies herein or for any decisions or actions taken in
reliance on the report or the inability to use or access our service in this report or for any loss or damages whether direct or indirect, incidental, special or consequential including without limitation
loss of revenue or profits that may arise from or in connection with the use of or reliance on this report.
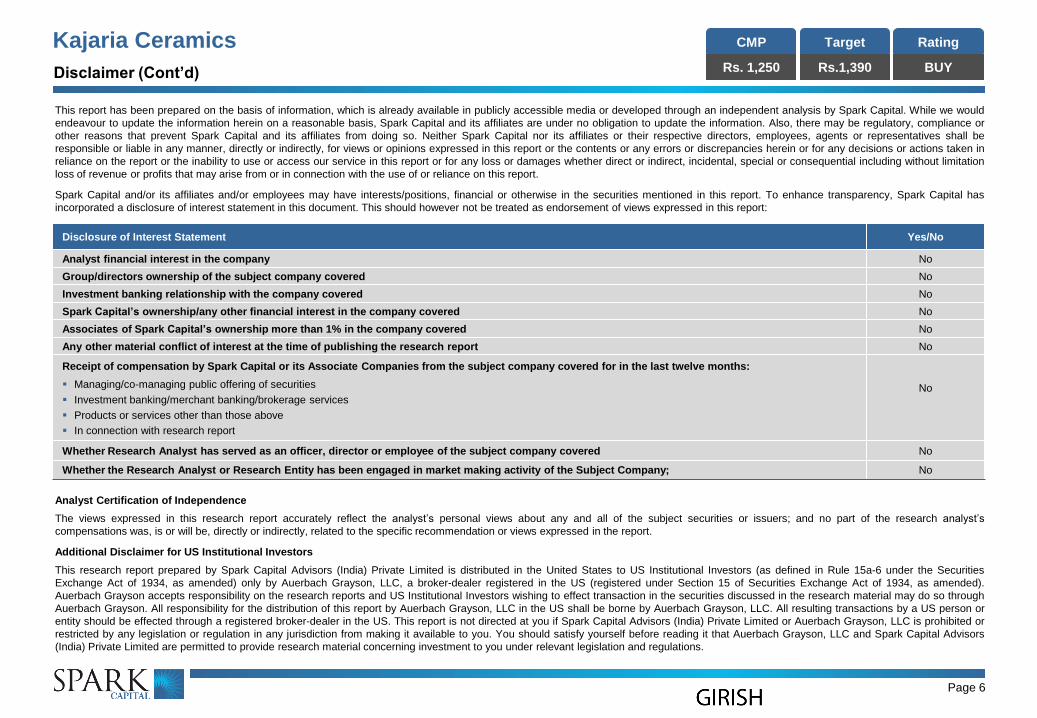
Spark Capital and/or its affiliates and/or employees may have interests/positions, financial or otherwise in the securities mentioned in this report. To enhance transparency, Spark Capital has
incorporated a disclosure of interest statement in this document. This should however not be treated as endorsement of views expressed in this report:
Disclosure of Interest Statement Yes/No
Analyst financial interest in the company No
Group/directors ownership of the subject company covered No
Investment banking relationship with the company covered No
Spark Capital’s ownership/any other financial interest in the company covered No
Associates of Spark Capital’s ownership more than 1% in the company covered No
Any other material conflict of interest at the time of publishing the research report No
Receipt of compensation by Spark Capital or its Associate Companies from the subject company covered for in the last twelve months:
Managing/co-managing public offering of securities
Investment banking/merchant banking/brokerage services
Products or services other than those above
In connection with research report
No
Whether Research Analyst has served as an officer, director or employee of the subject company covered No
Whether the Research Analyst or Research Entity has been engaged in market making activity of the Subject Company; No
Analyst Certification of Independence
The views expressed in this research report accurately reflect the analyst’s personal views about any and all of the subject securities or issuers; and no part of the research analyst’s
compensations was, is or will be, directly or indirectly, related to the specific recommendation or views expressed in the report.
Additional Disclaimer for US Institutional Investors
This research report prepared by Spark Capital Advisors (India) Private Limited is distributed in the United States to US Institutional Investors (as defined in Rule 15a-6 under the Securities
Exchange Act of 1934, as amended) only by Auerbach Grayson, LLC, a broker-dealer registered in the US (registered under Section 15 of Securities Exchange Act of 1934, as amended).
Auerbach Grayson accepts responsibility on the research reports and US Institutional Investors wishing to effect transaction in the securities discussed in the research material may do so through
Auerbach Grayson. All responsibility for the distribution of this report by Auerbach Grayson, LLC in the US shall be borne by Auerbach Grayson, LLC. All resulting transactions by a US person or
entity should be effected through a registered broker-dealer in the US. This report is not directed at you if Spark Capital Advisors (India) Private Limited or Auerbach Grayson, LLC is prohibited or
restricted by any legislation or regulation in any jurisdiction from making it available to you. You should satisfy yourself before reading it that Auerbach Grayson, LLC and Spark Capital Advisors
(India) Private Limited are permitted to provide research material concerning investment to you under relevant legislation and regulations.