Embed Size (px)
Citation preview
1
Integrated Nutrition, Mortality, WASH, and Food Security SMART Survey
Final Report
Kandahar Province, Afghanistan
21st November to 2nd December 2018
Survey Lead by: Dr. Baidar Bakht Habib
Authors: Mohammad Nazir Sajid, Dr. Baidar Bakht Habib and Sayed Rahim
Funded by:
Action Against Hunger | Action Contre La Faim A non-governmental, non-political, and non-religious organization
ECHO AND MCC/GAC
AF
GH
AN
IST
AN
2
ACKNOWLEDGMENTS
The authors would like to extend their sincere appreciation to the Action Against Hunger/Action Contre la
Faim (AAH) team in Kabul and in Paris Headquarter.
Special appreciation goes to the MEDAIR team in Kabul (Zinaw Asfaw) and Kandahar Province (Rachel
Mander, Asadullah Obaidy, Anthony Joel Bakisuula and Samiullah). Finally, tremendous appreciation goes to
the following stakeholders:
• Ministry of Public Health (MoPH), especially Public Nutrition Department (PND), AIM-Working
Group and Nutrition Cluster for their support and validation of survey protocol.
• Kandahar Provincial Public Health Directorate (PPHD) and the Provincial Nutrition Officer (PNO) for
their support and authorization.
• EUROPEAN COMMISION Humanitarian Aid (ECHO) and Mennonite Central Committee/Global
Affairs Canada (MCC/GAC) for their financial support in the survey.
• All community members for welcoming and supporting the survey teams during the data collection
process.
• Special appreciation to the survey teams for making the survey a reality.
Statement on Copyright
© Action Against Hunger
Action Against Hunger is a non-governmental, non-political, and non-religious organization.
Unless otherwise indicated, reproduction is authorized on the condition that the source is credited. If
reproduction or use of texts and visual materials (sound, images, software, etc.) is subject to prior
authorization, such authorization was render null and void the above-mentioned general authorization
and will clearly indicate any restrictions on use.
The content of this document is the responsibility of the authors and does not necessarily reflect the
views of Action Against Hunger, Medair or ECHO.
3
Acronyms and Abbreviations
AAH Action Against Hunger
ANC Antenatal Care
AfDHs Afghanistan Demographic Health Survey
AIM-WG Assessment Information Management Working Group
ARI Acute Respiratory Infection
BARAN Bu Ali Rehabilitation and Aid Network
BHC Basic Health Center
BPHS Basic Package of Health Services
BSU Basic Sample Unite
CBHC Community Basic Health Care
CBNP Community Basic Nutrition Package
CDR Crude Death Rate
CHC Comprehensive Health Center
CSO Central Statistics Organization
CI Confidential Interval
CHW Community Health Worker
DH District Hospital
DOPH Directorate of Public Health
ECHO EUROPEAN COMMISION Humanitarian Aid
ENA Emergency Nutrition Assessment
EPHS Essential Package of Health Services
EPI Expanded Program on Immunization
FCS Food Consumption Score
FSL Food Security and Livelihoods
GAM Global Acute Malnutrition

4
GCMU Grand Contract Management Unite
HH Household
HCS Health Sub centre
HAZ Height per Age Z score
IMAM Integrated Management of Acute Malnutrition
IP Implementer
IPC Integrated Phase Classification
IPD Inpatient Department
IYCF Infant and Young Child Feeding
MAM Moderate Acute Malnutrition
MCC/GAC Mennonite Central Committee/Global Affairs Canada
MoPH Ministry of Public Health
MUAC Mid Upper Arm Circumference
NCA Nutrition Causal Analysis
OPD Outpatient Department
OW Observed Weight
PH Provincial Hospital
PLW Pregnant and Lactating Women
PND Public Nutrition Department
PNO Provincial Nutrition Officer
PPHD Provincial Public Health Directorate
PPS Probability Proportional to Size
RC Reserve Cluster
rCSI reduced Coping Strategy Index
SAM Severe Acute Malnutrition
SCI Save the Children International
5
SD Standard Deviation
SMART Standardized Monitoring and Assessment of Relief and Transition
TSFP Target Supplementary Food Program
UNICEF United Nation Children’s Fund
U5DR Under Five Death Rate
WASH Water, Sanitation, and Hygiene
WFP World Food Program
WHO World Health Organization
WHZ Weight for Height Z score
6
Table of Contents
Acknowledgments ............................................................................................................................................................... 2
1. Executive summary ...................................................................................................................................................... 11
2. Introduction ................................................................................................................................................................... 14
2.1 Economy and Demography ................................................................................................................................. 14
2.2. Agriculture and Food Practices ......................................................................................................................... 14
2.3. Humanitarian Assistance..................................................................................................................................... 14
3. Survey Objectives ........................................................................................................................................................ 15
3.1 Primary Objective .................................................................................................................................................. 15
3.2 Specific Objectives ................................................................................................................................................ 15
3.3 Survey Justification ............................................................................................................................................... 15
4. Methodology ................................................................................................................................................................. 16
4.1 Sample Size ............................................................................................................................................................. 16
4.2 Sampling Methodology ........................................................................................................................................ 18
4.3 Training, Team composition, and Supervision ................................................................................................. 19
4.4 Data Analysis .......................................................................................................................................................... 20
4. Indicators: Definition, Calculation and Interpretation .......................................................................................... 20
4.1. Overview of Indicators ........................................................................................................................................ 20
4.2 Anthropometric Indicators .................................................................................................................................. 21
4.3 Mortality ............................................................................................................................................................ 24
4.4 Infant and Young Child Feeding ......................................................................................................................... 25
4.5 Immunization .......................................................................................................................................................... 26
4.6. Maternal Nutrition ............................................................................................................................................... 26
4.7. Water, Sanitation and Hygiene .......................................................................................................................... 26
5. Food Security ................................................................................................................................................................ 26
5.1. Food Consumption Score ................................................................................................................................... 26
7
5.2. Reduced Coping Strategies Index ..................................................................................................................... 27
6. Limitations .................................................................................................................................................................... 28
7. Survey findings ............................................................................................................................................................. 29
7.1. Survey Sample ....................................................................................................................................................... 29
7.2. Data Quality .......................................................................................................................................................... 31
7.3. Prevalence of Acute Malnutrition ..................................................................................................................... 32
7.4. Prevalence of Chronic Malnutrition ................................................................................................................. 38
7.5. Prevalence of Underweight ................................................................................................................................ 39
7.6. Low MUAC among Women ............................................................................................................................... 40
7.7. Retrospective Mortality ...................................................................................................................................... 41
7.8. Infant and Young Child Feeding ........................................................................................................................ 41
7.9. Child Immunization Status .................................................................................................................................. 42
7.10. Water, Sanitation, and Hygiene ...................................................................................................................... 43
7.11. Food Security ...................................................................................................................................................... 45
8. Discussion ...................................................................................................................................................................... 48
8.1. Nutritional Status of the Province .................................................................................................................... 48
8.2. Additional Indicators ............................................................................................................................................ 51
9. Recommendations ....................................................................................................................................................... 52
List of Tables
Table 1. Summary of Findings ........................................................................................................................................ 11
Table 2: Sample size calculation of anthropometry ................................................................................................... 16
Table 3: Sample size calculation of mortality .............................................................................................................. 17
Table 4: Standardized Integrated SMART Indicators Updated 2018 .................................................................... 20
Table 5: MUAC cut-offs points for children aged 6-59 months ............................................................................. 22
8
Table 6: Definition of acute malnutrition according to weight-for-height index (W/H), expressed as a Z-
score based on WHO standards .................................................................................................................................... 22
Table 7: Cut offs points of the Height for Age index (HAZ) expressed in Z-score, WHO standards.............. 23
Table 8: Cut offs points of the Weight for Age index (WAZ) expressed in Z-score, WHO standards ........... 24
Table 9: Food Consumption Score Categories ........................................................................................................... 27
Table 10: Reduced Coping Strategies Index Categories by Score .......................................................................... 27
Table 11: Food Security Classification as Assessed by FCS and rCSI .................................................................... 28
Table 12: Proportion of Household and Child Sample Achieved ........................................................................... 29
Table 13: Demographic Summary ................................................................................................................................. 29
Table 14: Household Residential Status by Proportion ............................................................................................ 30
Table 15: Distribution of Age and Sex of among Children 6-59 months .............................................................. 31
Table 16: Mean Z-scores, Design Effects, Missing and Out-of-Range Data of Anthropometric Indicators
among Children 6-59 Months ........................................................................................................................................ 31
Table 17: Prevalence of Acute Malnutrition by WHZ (and/or oedema) by Severity and Sex among Children
6-59 months, WHO 2006 Reference ........................................................................................................................... 33
Table 18: Prevalence of Acute Malnutrition by WHZ (and/or oedema) by Severity and Sex among Children
0-59 months, WHO 2006 Reference ........................................................................................................................... 33
Table 19: Prevalence of Acute Malnutrition per WHZ and/or Oedema by Severity and Age Group ............ 34
Table 20: Prevalence of Acute Malnutrition by MUAC (and/or oedema) by Severity and Sex among children
6-59 months ...................................................................................................................................................................... 35
Table 21: Prevalence of Acute Malnutrition per MUAC and/or Oedema by Severity and Age Group .......... 36
Table 22: Distribution of Severe Acute Malnutrition per Oedema among Children 6-59 Months ................. 36
Table 23: Prevalence of Acute Malnutrition by WHZ and/or MUAC and/or oedema by Severity and Sex
among Children 6-59 months ........................................................................................................................................ 37
Table 24: Proportion of Acutely Malnourished Children 6-59 Months Enrolled in a Treatment Programme
.............................................................................................................................................................................................. 37
9
Table 25: Prevalence of Chronic Malnutrition by HAZ by Severity and Sex among Children 6-59 months,
WHO 2006 Reference .................................................................................................................................................... 38
Table 26: Prevalence of Chronic Malnutrition per HAZ by Severity and Age Group......................................... 38
Table 27: Prevalence of Underweight by WAZ by Severity and Sex among Children 6-59 months, WHO
2006 Reference ................................................................................................................................................................ 39
Table 28: Prevalence of Underweight per WAZ by Severity and Age Group ...................................................... 40
Table 29: Prevalence of Acute Malnutrition among Women per MUAC ............................................................. 40
Table 30: Death Rate by Age and Sex with Reported Design Effect ..................................................................... 41
Table 31: Infant and Young Child Feeding Practices ................................................................................................ 42
Table 32: Second Dose Measles Immunization Coverages among Children 18-59 Months ............................ 43
Table 33: Household Main Drinking Water Source .................................................................................................. 43
Table 34: Household Use of Improved and Unimproved Drinking Water Sources ............................................ 44
Table 35: Hand Washing Practices (Use of Soap or Ash) among Caregivers ....................................................... 44
Table 36: Hand Washing Practices by Caregivers at Critical Moments ................................................................ 45
Table 37: Reduce Coping Strategy Index Categories ................................................................................................ 47
Table 38: Prevalence of GAM by WHZ Comparing the 0-59 Month to the 6-59 Month Sample .................. 50
Table 39: Among Stunted Children 6-59 Months, those Simultaneous Wasted (WHZ) ................................... 50
List of Figures
Figure 1: AAH/ACF Afghanistan SMART Team Structure ...................................................................................... 20
Figure 2: Kandahar Province Population Pyramid ..................................................................................................... 30
Figure 4: Means WHZ by age groups ........................................................................................................................... 35
Figure 3: Distribution of WHZ Sample Compared to the WHO 2006 WHZ Reference Curve ....................... 35
Figure 4: Mean HAZ by Age Group .............................................................................................................................. 39
Figure 5: Distribution of HAZ Sample Compared to the WHO 2006 HAZ Reference Curve .......................... 39
Figure 6: Liquids or Food Consumed by Infants 0-5 Months .................................................................................. 42
10
Figure 7: Household Food Consumption Score ......................................................................................................... 46
Figure 8: Frequency of Food Groups Consumed by Households .......................................................................... 46
Figure 9: Household Reduced Coping Strategies Index ........................................................................................... 47
Figure 10: Food Security Classification Assessed by FCS & rSCI ........................................................................... 48
Figure 11: Children Captured by GAM by WHZ, MUAC, and Combined............................................................. 49
11
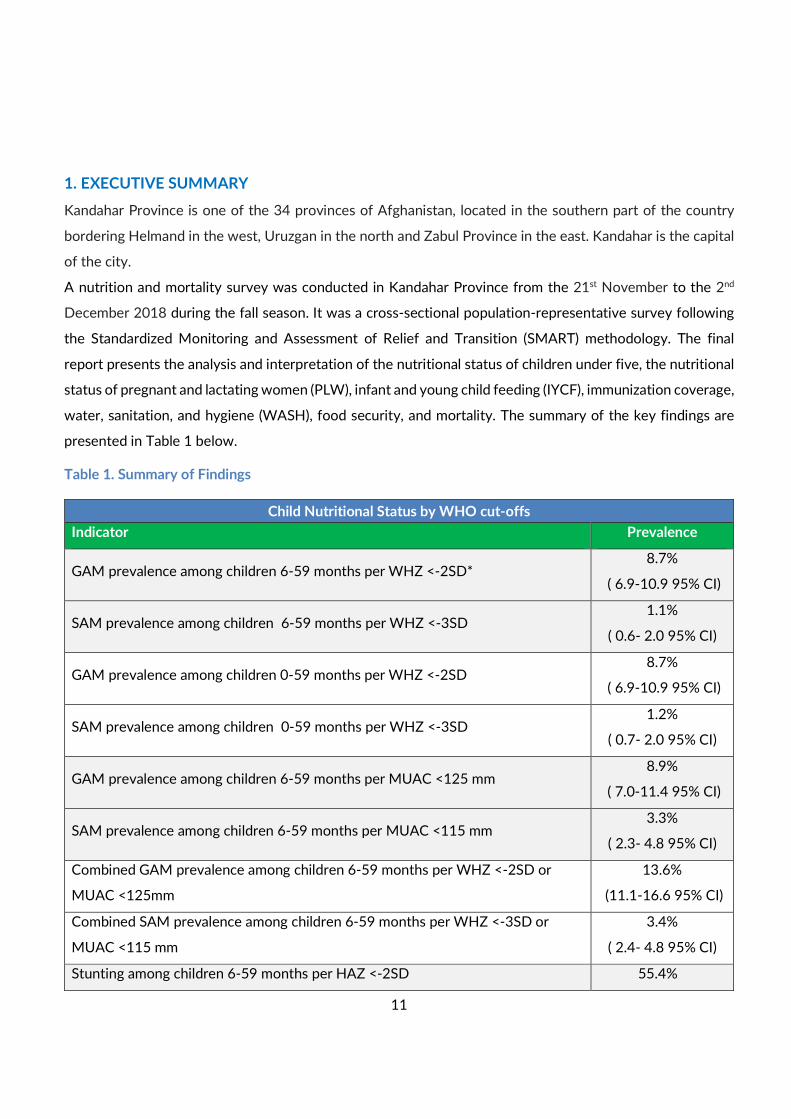
1. EXECUTIVE SUMMARY
Kandahar Province is one of the 34 provinces of Afghanistan, located in the southern part of the country
bordering Helmand in the west, Uruzgan in the north and Zabul Province in the east. Kandahar is the capital
of the city.
A nutrition and mortality survey was conducted in Kandahar Province from the 21st November to the 2nd
December 2018 during the fall season. It was a cross-sectional population-representative survey following
the Standardized Monitoring and Assessment of Relief and Transition (SMART) methodology. The final
report presents the analysis and interpretation of the nutritional status of children under five, the nutritional
status of pregnant and lactating women (PLW), infant and young child feeding (IYCF), immunization coverage,
water, sanitation, and hygiene (WASH), food security, and mortality. The summary of the key findings are
presented in Table 1 below.
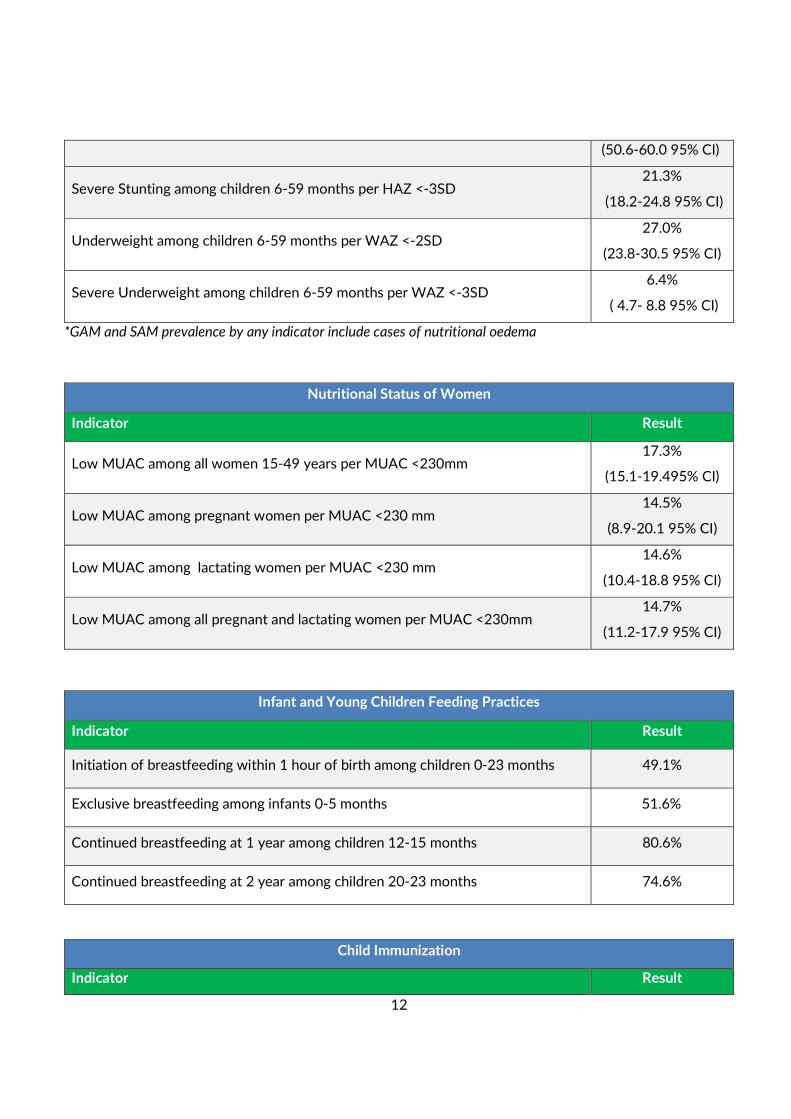
Table 1. Summary of Findings
Child Nutritional Status by WHO cut-offs
Indicator Prevalence
GAM prevalence among children 6-59 months per WHZ <-2SD* 8.7%
( 6.9-10.9 95% CI)
SAM prevalence among children 6-59 months per WHZ <-3SD 1.1%
( 0.6- 2.0 95% CI)
GAM prevalence among children 0-59 months per WHZ <-2SD 8.7%
( 6.9-10.9 95% CI)
SAM prevalence among children 0-59 months per WHZ <-3SD 1.2%
( 0.7- 2.0 95% CI)
GAM prevalence among children 6-59 months per MUAC <125 mm 8.9%
( 7.0-11.4 95% CI)
SAM prevalence among children 6-59 months per MUAC <115 mm 3.3%
( 2.3- 4.8 95% CI)
Combined GAM prevalence among children 6-59 months per WHZ <-2SD or
MUAC <125mm
13.6%
(11.1-16.6 95% CI)
Combined SAM prevalence among children 6-59 months per WHZ <-3SD or
MUAC <115 mm
3.4%
( 2.4- 4.8 95% CI)
Stunting among children 6-59 months per HAZ <-2SD 55.4%
12
*GAM and SAM prevalence by any indicator include cases of nutritional oedema
(50.6-60.0 95% CI)
Severe Stunting among children 6-59 months per HAZ <-3SD 21.3%
(18.2-24.8 95% CI)
Underweight among children 6-59 months per WAZ <-2SD 27.0%
(23.8-30.5 95% CI)
Severe Underweight among children 6-59 months per WAZ <-3SD 6.4%
( 4.7- 8.8 95% CI)
Nutritional Status of Women
Indicator Result
Low MUAC among all women 15-49 years per MUAC <230mm 17.3%
(15.1-19.495% CI)
Low MUAC among pregnant women per MUAC <230 mm 14.5%
(8.9-20.1 95% CI)
Low MUAC among lactating women per MUAC <230 mm 14.6%
(10.4-18.8 95% CI)
Low MUAC among all pregnant and lactating women per MUAC <230mm 14.7%
(11.2-17.9 95% CI)
Infant and Young Children Feeding Practices
Indicator Result
Initiation of breastfeeding within 1 hour of birth among children 0-23 months 49.1%
Exclusive breastfeeding among infants 0-5 months 51.6%
Continued breastfeeding at 1 year among children 12-15 months 80.6%
Continued breastfeeding at 2 year among children 20-23 months 74.6%
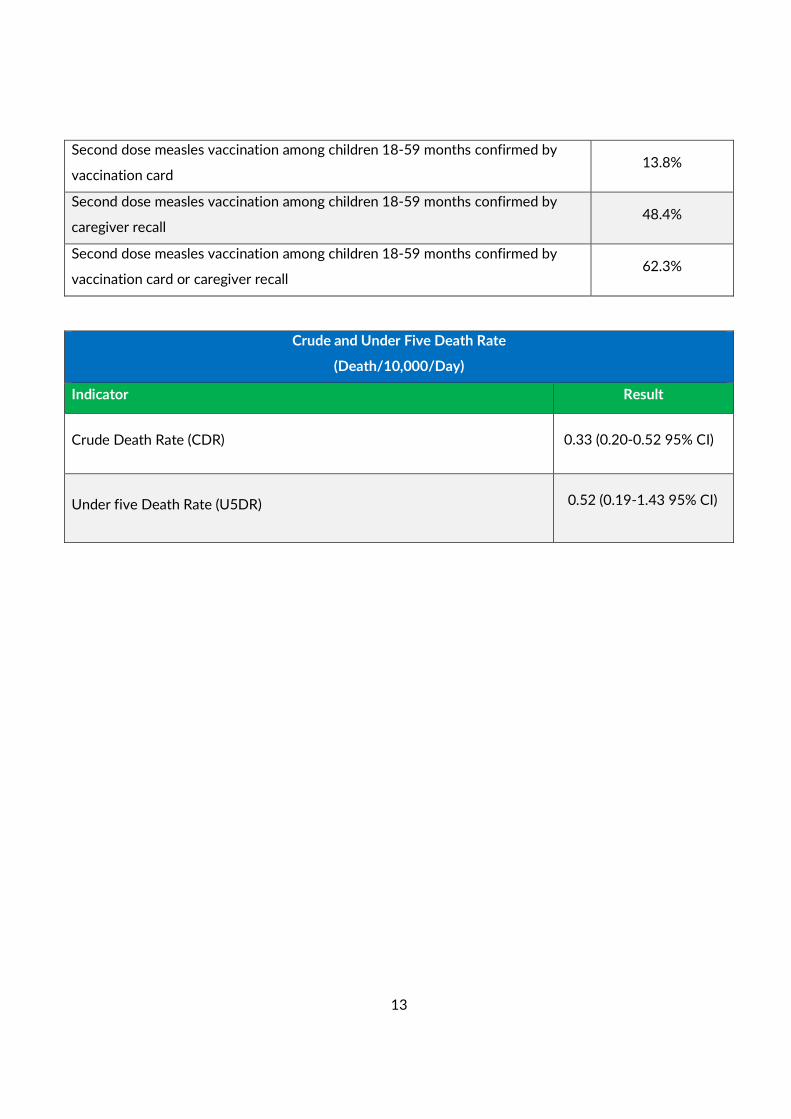
Child Immunization
Indicator Result
13
Second dose measles vaccination among children 18-59 months confirmed by
vaccination card 13.8%
Second dose measles vaccination among children 18-59 months confirmed by
caregiver recall 48.4%
Second dose measles vaccination among children 18-59 months confirmed by
vaccination card or caregiver recall 62.3%
Crude and Under Five Death Rate
(Death/10,000/Day)
Indicator Result
Crude Death Rate (CDR)
0.33 (0.20-0.52 95% CI)
Under five Death Rate (U5DR)
0.52 (0.19-1.43 95% CI)
14
2. INTRODUCTION
Kandahar is the second largest of the thirty-four provinces of Afghanistan., located in the southern part of
the country bordering Pakistan. It is surrounded by Helmand in the west, Uruzgan in the north and Zabul
Province in the east. Kandahar city is the capital the province located on the Arghandab River. The greater
region surrounding the province is called Loy Kandahar.
The province contains 18 districts : Arghandab, Arghistan, Daman, Ghorak, Khakrez, Maruf, Maiwand,
Myanashin, Nesh, Panjwayee, Reg, Shahwali kot, Shorabak, Spin Boladak, Zherai, Shaga, Dand and Kandahar
city (capital).
2.1 Economy and Demography
Kandahar International airport is located east of Kandahar city. It is designed for military and civilian use. It
serves the population of the entire southern Afghanistan by providing domestic and international flights to
Dubai, Pakistan, Iran and other regional countries. It serves as the nation's second main international
airport and as one of the largest military base, capable of housing up to 250 aircrafts of all types. Although,
some of the villages are highly unsecure in the districts.
Most of the households rely on agriculture and earn incomes from non-farm labor, livestock, trade and
services.
The estimated population of the Kandahar Province is 13,371,183 (Central Statistics Organization (CSO)
1397), which is a multi-ethnics and mostly rural (63.3%) and urban (36.7%) society. The majority of the
population are Pashtuns, although smaller communities of Tajiks, Hazeras, Uzbeks, Bloch and nomadic
population. The main language spoken in the province is Pashto but speakers of Dari and Balochi can also be
found. The inhabitants of the province are mostly Sunni Muslims, although there are also Shia Muslims.
2.2. Agriculture and Food Practices
The main agricultural crops of the province are grains (wheat and maize), vegetables (onions and tomatoes),
and fruits (grapes, pomegranates, mulberry and peaches). Much of the pomegranates and grapes crops are
sold locally and exported. The main types of livestock raised in the province are sheep and goats. The most
famous agricultural seasons are summer ( Jun, Jul and Aug) and fall (Sep, Oct and Nov) , when the grapes and
pomegranates are plentiful in the markets. The lean season is considered to last from late November (Qaws
in solar in date) until mid early March (Hamal in solar date). Meats, cereals, pulses and vegetables are
commonly consumed in the households.
2.3. Humanitarian Assistance
Ten national and international organizations (BARAN, INTERSOUS, SCI and MEDAIR, AHDS, ACTD, ARCS,
HNTPO, ICRC, Mercy Malaysia, Wadan, Handicap and MOPH) for Health services and four national and
international NGOs ( BARAN,MEDAIR, SCI and INTERSOUS) are working for health and nutrition services
15
in the province. BARAN and MOPH are providing health services as BPHS and EPHS implementer in the
province. In Kandahar province, there are a total of 84 health facilities, including 1 Regional Hospital, 1
district hospitals (DHs), 27 comprehensive health centres (CHCs), 16 basic health centres (BHCs), 1 BHC+, 8
health sub-centres (HSCs), 2 Drug Abuse Treatment Center (DATC), and 1 Trauma Center. It is notable that
17 others health facilities and 10 health mobile teams providing health services are managed by different
organizations outside of BPHS/EPHS framework. Among these, Kandahar provincial hospital is providing
the essential package of health services (EPHS), which is implemented by ICRC under the MoPH. The basic
package of health services (BPHS) is implemented by BARAN.
3. SURVEY OBJECTIVES
3.1 Primary Objective
• To investigate the nutritional status of vulnerable population, mainly children under five years and
pregnant and lactating women living in the province.
3.2 Specific Objectives
• To estimate the prevalence of undernutrition (stunting, wasting, underweight) among children aged
0-59 months.
• To determine the nutritional status of pregnant and lactating women based on MUAC assessment.
• To estimate Crude Death Rate (CDR) and under five Death Rate (U5DR).
• To assess core Infant and Young Child Feeding (IYCF) practices among children aged <24 months.
• To estimate the second dose measles vaccination coverage among children 18-59 months.
• To assess Water, Sanitation and Hygiene (WASH) proxy indicators: household level main drinking
water sources and caregiver hand washing practices.
• To assess the food security situation through the Food Consumption Score (FCS) and the Reduced
Coping Strategies Index (rCSI).
3.3 Survey Justification
• Kandahar province is categorized as “critical” based on OCHA analysis for recent drought in
Afghanistan.
• There is a possible deterioration of health and nutrition situation due to drought and conflict related
issues causing food insecurity in the area that require updated information.
• The area was selected by nutrition cluster and Assessment Information Management Working Group
16
(AIM-WG) to know the nutrition situation in the districts.
• There was a need to investigate the current prevalence of under-nutrition in the province, as the last
province level nutrition survey was conducted in Kandahar in early 2017 but was not validated by
the AIM-WG. The survey findings will be used to inform future programming in the province.
• It was an opportunity of building the technical capacity of the agency MEDAIR in conducting SMART
survey.
4. METHODOLOGY
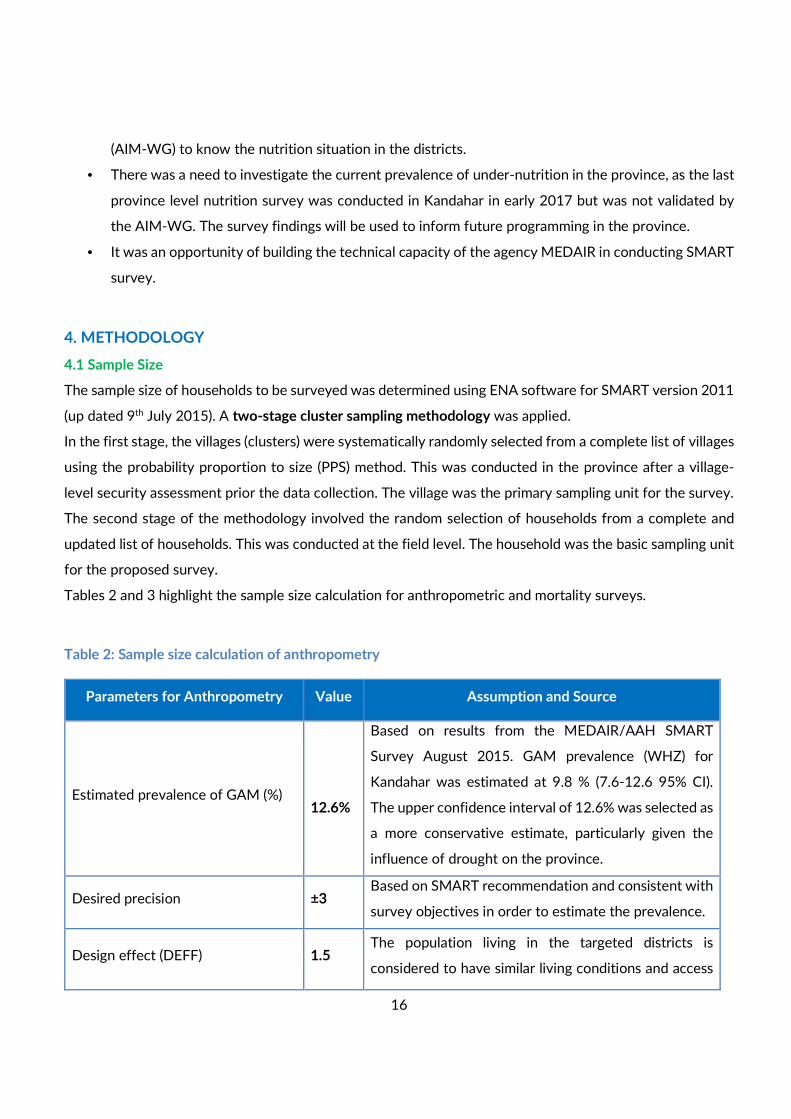
4.1 Sample Size
The sample size of households to be surveyed was determined using ENA software for SMART version 2011
(up dated 9th July 2015). A two-stage cluster sampling methodology was applied.
In the first stage, the villages (clusters) were systematically randomly selected from a complete list of villages
using the probability proportion to size (PPS) method. This was conducted in the province after a village-
level security assessment prior the data collection. The village was the primary sampling unit for the survey.
The second stage of the methodology involved the random selection of households from a complete and
updated list of households. This was conducted at the field level. The household was the basic sampling unit
for the proposed survey.
Tables 2 and 3 highlight the sample size calculation for anthropometric and mortality surveys.
Table 2: Sample size calculation of anthropometry
Parameters for Anthropometry Value Assumption and Source
Estimated prevalence of GAM (%)
12.6%
Based on results from the MEDAIR/AAH SMART
Survey August 2015. GAM prevalence (WHZ) for
Kandahar was estimated at 9.8 % (7.6-12.6 95% CI).
The upper confidence interval of 12.6% was selected as
a more conservative estimate, particularly given the
influence of drought on the province.
Desired precision ±3 Based on SMART recommendation and consistent with
survey objectives in order to estimate the prevalence.
Design effect (DEFF) 1.5 The population living in the targeted districts is
considered to have similar living conditions and access
17
to resources. Nevertheless, access to health facilities
cannot be estimated as similar within the targeted
population as some remote areas are not well served by
health facilities. Hence the design effect was estimated
at 1.5.
Children to be included 768 Minimum sample size-children aged 6-59 months.
Average household (HH) size 8.0 Based on AfDHs 2015
% Children 6–59 months 17.3% Based on CSO updated population 1397 (2018)
% Non-response rate 5% Based on the MEDAIR/ACF SMART Survey August
2015.
Households to be included 649 Minimum sample size-Households to be surveyed.
*However all children 0-59 months in each household was measured for additional analyses and indicators
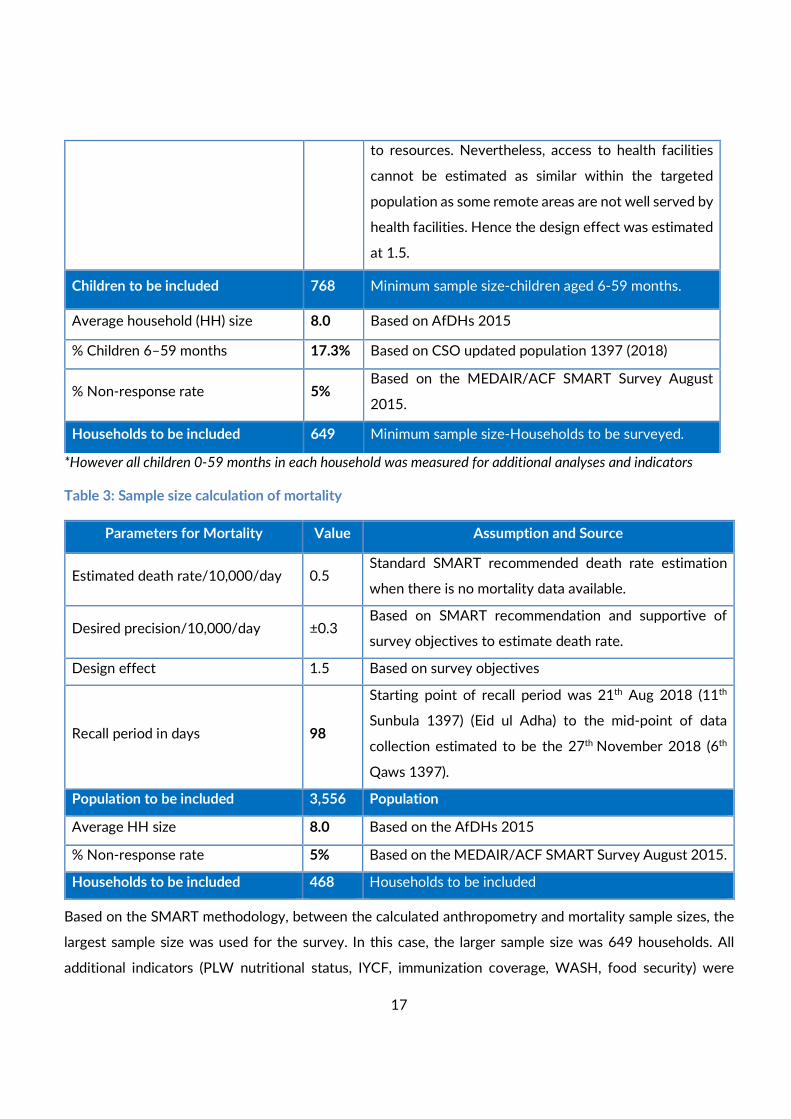
Table 3: Sample size calculation of mortality
Parameters for Mortality Value Assumption and Source
Estimated death rate/10,000/day 0.5 Standard SMART recommended death rate estimation
when there is no mortality data available.
Desired precision/10,000/day ±0.3 Based on SMART recommendation and supportive of
survey objectives to estimate death rate.
Design effect 1.5 Based on survey objectives
Recall period in days 98
Starting point of recall period was 21th Aug 2018 (11th
Sunbula 1397) (Eid ul Adha) to the mid-point of data
collection estimated to be the 27th November 2018 (6th
Qaws 1397).
Population to be included 3,556 Population
Average HH size 8.0 Based on the AfDHs 2015
% Non-response rate 5% Based on the MEDAIR/ACF SMART Survey August 2015.
Households to be included 468 Households to be included
Based on the SMART methodology, between the calculated anthropometry and mortality sample sizes, the
largest sample size was used for the survey. In this case, the larger sample size was 649 households. All
additional indicators (PLW nutritional status, IYCF, immunization coverage, WASH, food security) were
18
collected based on this sample size.
4.2 Sampling Methodology
Stage 1: The clusters were systematically randomly selected by applying PPS using ENA software for
SMART. A complete and updated list of all accessible villages were added into the ENA software for SMART.
Following the principles of PPS, the villages with a large population had a greater chance of being selected
than the villages with a small population and vice versa. (6) Reserve Clusters (RCs) were also selected by ENA
software for SMART during the same step. Based on the estimated time to travel to the survey area, select
and survey the households, it was estimated that each team could effectively survey 13 HHs per day. Based
on the selected HH sample size, the number of clusters to survey was rounded up to 50 clusters
(649/13=49.9) . Unfortunately, only 48 clusters were surveyed out of the 50 selected ; 2 clusters were not
surveyed, representing 4.0% so less than 10% of sample size), one cluster was unaccessable due to ongoing
fighting and one cluster was rejected by village elder). RCs were not used because the number of inaccessible
clusters was less than 10%, as per the SMART methodology. The selected clusters are highlighted in Annex
1.
In each selected village, one or more key informants from the community (i.e. village elder, mullah, community
health worker) were asked to provide information about the village such as geographic layout and the number
of households. In clusters made up of large villages or semi-urban zones, the cluster was divided into smaller
segments if they contained more than 150 households or if households were very geographically dispersed.
This division was based on existing administrative units (neighbourhood, zone, street) or natural landmarks
(river, road, or public places like a market, school, or mosque). If the segments had a similar number of
households then a segment was selected randomly to represent the cluster. If the segments had very
different numbers of households, a segment was selected using the PPS.
Stage 2: The household was defined as “all people eating from the same pot and living together” (World Food
Programme (WFP) definition). The household was the BSU. In Afghanistan, the term household is often used
synonymously with a compound, which potentially represents more than one household. Hence, the
household definition was explained to key informants before updating the household list to identify
compounds composed of multiple households in advance.
This survey was planned to survey 650 (50*13) households and each team can cover effectively 13
households in a day. In this assessment households were chosen within each cluster using systematic random
sampling. 6 teams were engaged during the assessments, while data collection was conducted over 10 days.
19
All households were listed and numbered by the survey team. The 13 households were identified from this
enumerated household list using systematic random sampling. The teams were trained on both methods of
sampling (simple random sampling and systematic random sampling) and carried materials to assist in
selecting the households during data collection. For the semi-urban areas in Kandahar province, the teams
took into account multi-storeyed buildings as multiple HHs depending on the HH definition. In the case of a
multi-storeyed building containing multiple households was accidentally counted as one HH during the initial
listing process, the enumerators did another round of randomization to select one HH.
Every household was asked to consent before any data is collected. All children 0 to 59 months living in the
selected house were included for anthropometric measurements, including twins and orphans or unrelated
children living with the household. Children aged <24 months were included for IYCF assessment. If a child
of a surveyed household was absent due to enrolment in an IPD treatment centre at the time the household
was surveyed, teams visited the treatment centre to measure the child if possible. Households without
children were still assessed for household level questions (PLW nutritional status, WASH, food security,
mortality).
Any absent households, or households with missing or absent women or children were revisited at the end
of the day before leaving the cluster. Missing or absent child that were not found after multiple visits were
not included in the survey. A cluster control form was used to record all household visits and note any missed
and absent households. Abandoned HHs were ideally excluded from the total HHs list before surveying
began.
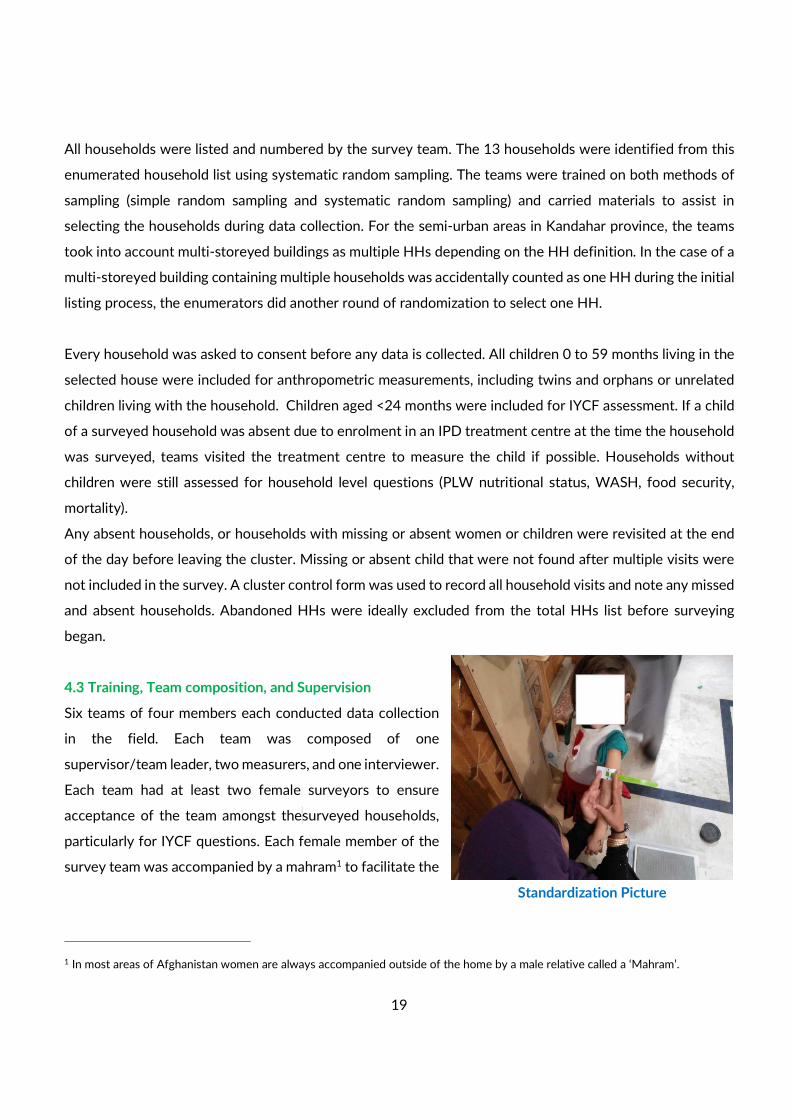
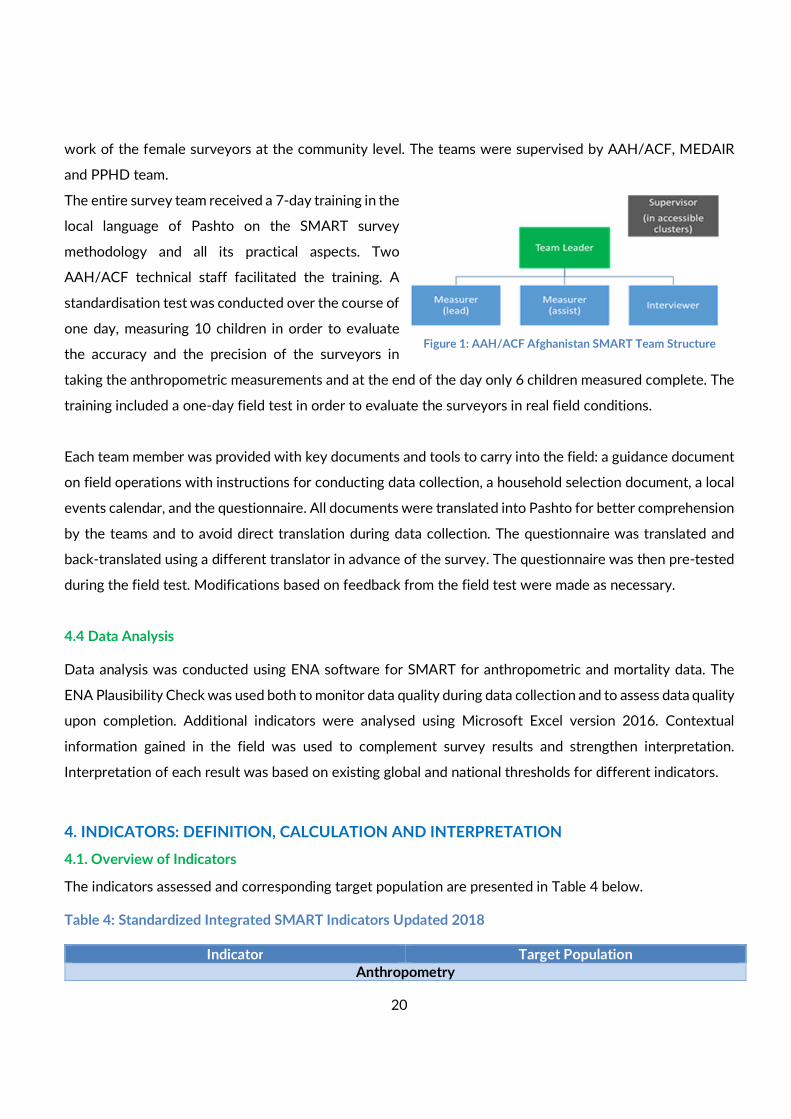
4.3 Training, Team composition, and Supervision
Six teams of four members each conducted data collection
in the field. Each team was composed of one
supervisor/team leader, two measurers, and one interviewer.
Each team had at least two female surveyors to ensure
acceptance of the team amongst the surveyed households,
particularly for IYCF questions. Each female member of the
survey team was accompanied by a mahram1 to facilitate the
1 In most areas of Afghanistan women are always accompanied outside of the home by a male relative called a ‘Mahram’.
Standardization Picture
20
work of the female surveyors at the community level. The teams were supervised by AAH/ACF, MEDAIR
and PPHD team.
The entire survey team received a 7-day training in the
local language of Pashto on the SMART survey
methodology and all its practical aspects. Two
AAH/ACF technical staff facilitated the training. A
standardisation test was conducted over the course of
one day, measuring 10 children in order to evaluate
the accuracy and the precision of the surveyors in
taking the anthropometric measurements and at the end of the day only 6 children measured complete. The
training included a one-day field test in order to evaluate the surveyors in real field conditions.
Each team member was provided with key documents and tools to carry into the field: a guidance document
on field operations with instructions for conducting data collection, a household selection document, a local
events calendar, and the questionnaire. All documents were translated into Pashto for better comprehension
by the teams and to avoid direct translation during data collection. The questionnaire was translated and
back-translated using a different translator in advance of the survey. The questionnaire was then pre-tested
during the field test. Modifications based on feedback from the field test were made as necessary.
4.4 Data Analysis
Data analysis was conducted using ENA software for SMART for anthropometric and mortality data. The
ENA Plausibility Check was used both to monitor data quality during data collection and to assess data quality
upon completion. Additional indicators were analysed using Microsoft Excel version 2016. Contextual
information gained in the field was used to complement survey results and strengthen interpretation.
Interpretation of each result was based on existing global and national thresholds for different indicators.
4. INDICATORS: DEFINITION, CALCULATION AND INTERPRETATION
4.1. Overview of Indicators
The indicators assessed and corresponding target population are presented in Table 4 below.
Table 4: Standardized Integrated SMART Indicators Updated 2018
Indicator Target Population
Anthropometry
Figure 1: AAH/ACF Afghanistan SMART Team Structure
21
Acute Malnutrition by WHZ Children 0-59 and 6-59 months
Acute Malnutrition by MUAC
Children 6-59 months
Acute Malnutrition by Combined (WHZ and/or MUAC)
Chronic Malnutrition by HAZ
Underweight by WAZ
Mortality
Crude Mortality Rate (CDR) Entire population
Under Five Mortality Rate (U5MR) Children under five
IYCF
Early Initiation of Breastfeeding Children <24 months
Exclusive Breastfeeding (EBF) Infants 0-5 months
Continued Breastfeeding at 1 Year Children 12-15 months
Continued Breastfeeding at 2 Years Children 20-23 months
Health
Measles Vaccination (2 doses) Children 18-59 months
WASH
Access to improved and unimproved drinking water Household
Hand washing practices among caregivers (use of soap or ash)
Caregivers of children under five Proportion of caregivers washing their hands during
critical times
FSL
Food Consumption Score (FCS)
Household
Reduced Coping Strategy Index (rCSI)
Food Security Situation (FCS & rCSI)
Mean consumption of food groups per 7 day recall (from FCS data)
Women of Reproductive Age & PLW
MUAC Women 15-49 years and PLW
4.2 Anthropometric Indicators
Acute Malnutrition
Acute malnutrition in children 6-59 months can be expressed by using three indicators. Weight for Height
(W/H) and Mid Upper Arm Circumference (MUAC) are described below. Nutritional edema is the third
indicator of severe acute malnutrition. Additionally, the prevalence of GAM amongst 0-59 was reported.
Weight-for-height index (W/H)
A child’s nutritional status is estimated by comparing it to the weight-for-height distribution curves of the
2006 WHO growth standards reference population. The expression of the weight-for-height index as a Z-
score (WHZ) compares the observed weight (OW) of the surveyed child to the mean weight (MW) of the
reference population, for a child of the same height. The Z-score represents the number of standard
22
deviations (SD) separating the observed weight from the mean weight of the reference population: WHZ =
(OW - MW) / SD.
During data collection, the weight-for-height index in Z-score was calculated in the field for each child in
order to refer malnourished cases to appropriate center if needed. Moreover, the results was presented in
Z-score using WHO reference in the final report. The classification of acute malnutrition based on WHZ is
well illustrated in Table 6.
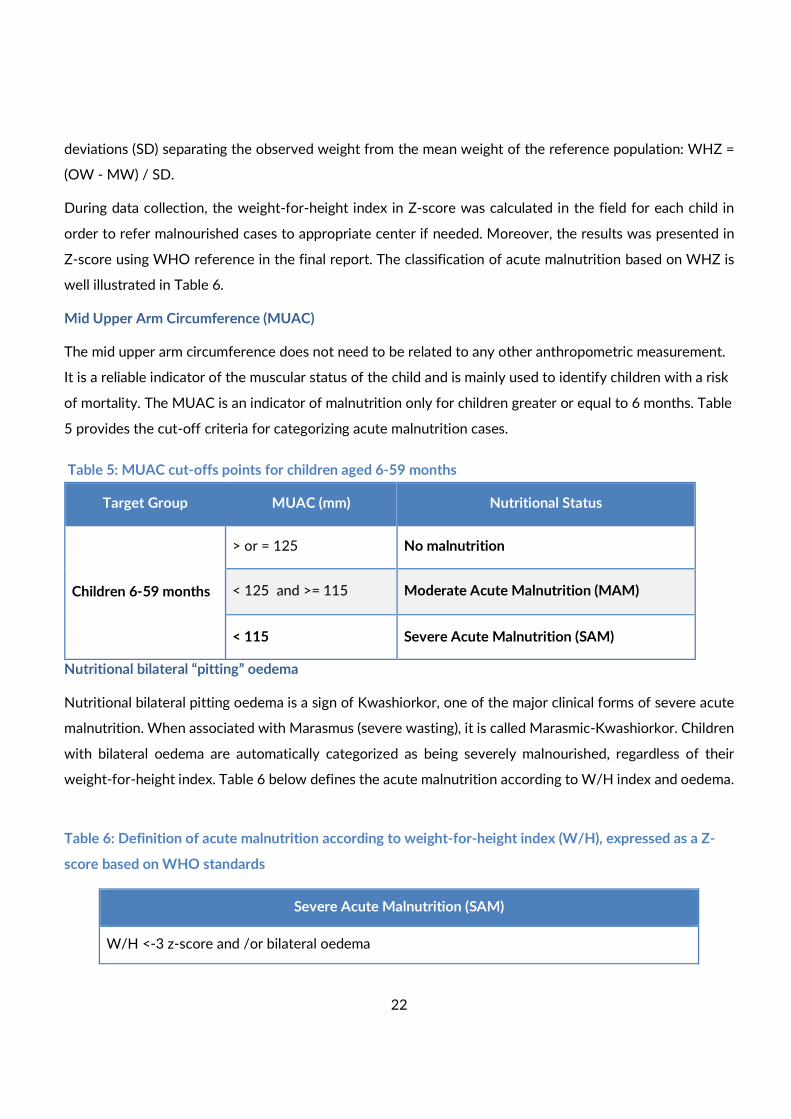
Mid Upper Arm Circumference (MUAC)
The mid upper arm circumference does not need to be related to any other anthropometric measurement.
It is a reliable indicator of the muscular status of the child and is mainly used to identify children with a risk
of mortality. The MUAC is an indicator of malnutrition only for children greater or equal to 6 months. Table
5 provides the cut-off criteria for categorizing acute malnutrition cases.
Table 5: MUAC cut-offs points for children aged 6-59 months
Nutritional bilateral “pitting” oedema
Nutritional bilateral pitting oedema is a sign of Kwashiorkor, one of the major clinical forms of severe acute
malnutrition. When associated with Marasmus (severe wasting), it is called Marasmic-Kwashiorkor. Children
with bilateral oedema are automatically categorized as being severely malnourished, regardless of their
weight-for-height index. Table 6 below defines the acute malnutrition according to W/H index and oedema.
Table 6: Definition of acute malnutrition according to weight-for-height index (W/H), expressed as a Z-
score based on WHO standards
Severe Acute Malnutrition (SAM)
W/H <-3 z-score and /or bilateral oedema
Target Group MUAC (mm) Nutritional Status
Children 6-59 months
> or = 125 No malnutrition
< 125 and >= 115 Moderate Acute Malnutrition (MAM)
< 115 Severe Acute Malnutrition (SAM)
23
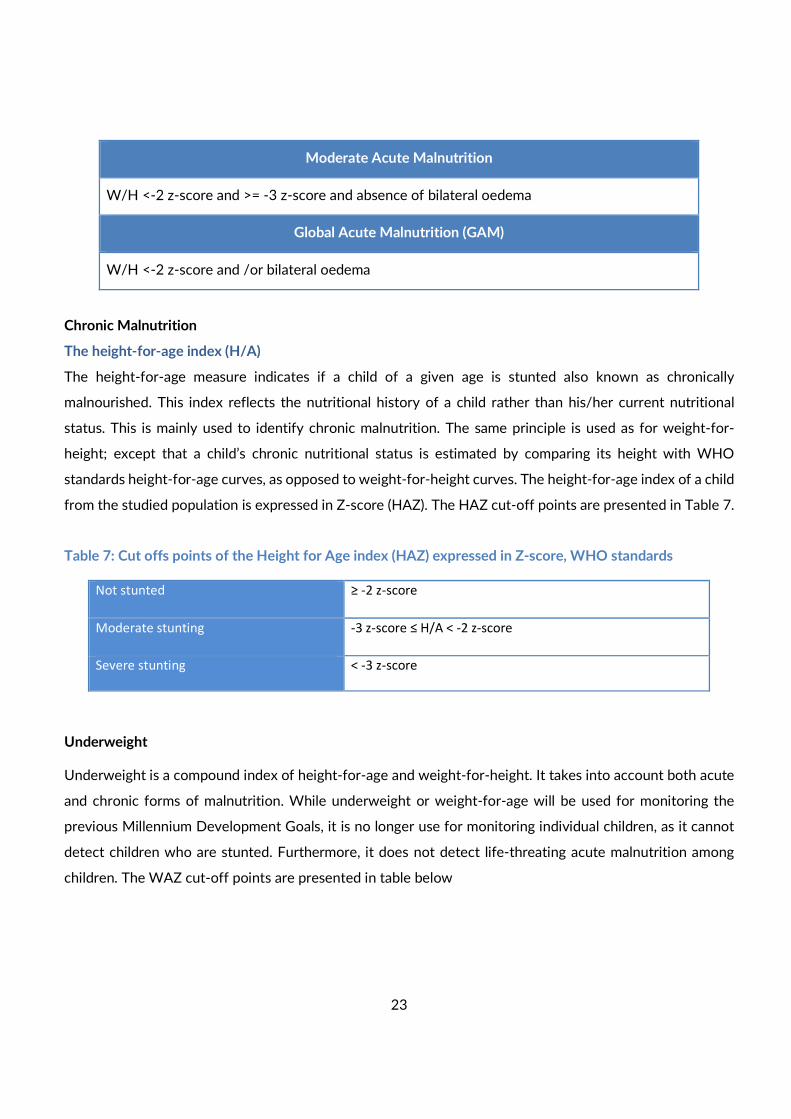
Moderate Acute Malnutrition
W/H <-2 z-score and >= -3 z-score and absence of bilateral oedema
Global Acute Malnutrition (GAM)
W/H <-2 z-score and /or bilateral oedema
Chronic Malnutrition
The height-for-age index (H/A)
The height-for-age measure indicates if a child of a given age is stunted also known as chronically
malnourished. This index reflects the nutritional history of a child rather than his/her current nutritional
status. This is mainly used to identify chronic malnutrition. The same principle is used as for weight-for-
height; except that a child’s chronic nutritional status is estimated by comparing its height with WHO
standards height-for-age curves, as opposed to weight-for-height curves. The height-for-age index of a child
from the studied population is expressed in Z-score (HAZ). The HAZ cut-off points are presented in Table 7.
Table 7: Cut offs points of the Height for Age index (HAZ) expressed in Z-score, WHO standards
Not stunted ≥ -2 z-score
Moderate stunting -3 z-score ≤ H/A < -2 z-score
Severe stunting < -3 z-score
Underweight
Underweight is a compound index of height-for-age and weight-for-height. It takes into account both acute
and chronic forms of malnutrition. While underweight or weight-for-age will be used for monitoring the
previous Millennium Development Goals, it is no longer use for monitoring individual children, as it cannot
detect children who are stunted. Furthermore, it does not detect life-threating acute malnutrition among
children. The WAZ cut-off points are presented in table below
24
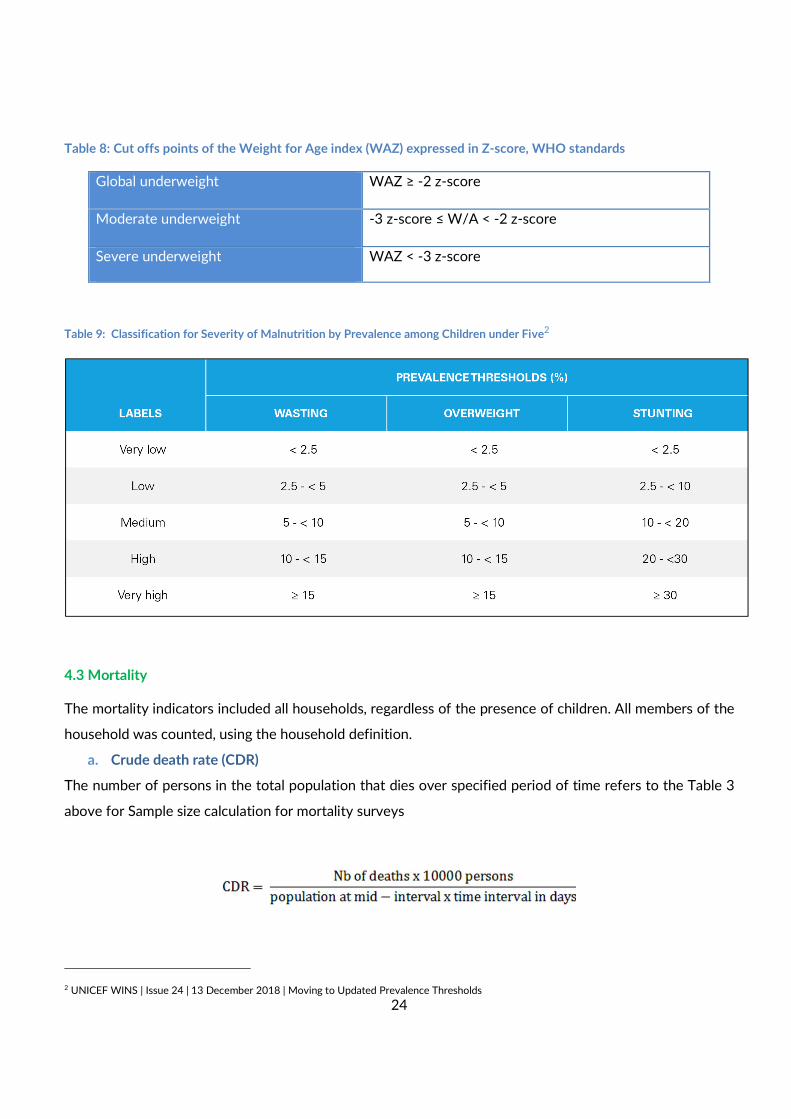
Table 8: Cut offs points of the Weight for Age index (WAZ) expressed in Z-score, WHO standards
Global underweight WAZ ≥ -2 z-score
Moderate underweight -3 z-score ≤ W/A < -2 z-score
Severe underweight
WAZ < -3 z-score
Table 9: Classification for Severity of Malnutrition by Prevalence among Children under Five2
4.3 Mortality
The mortality indicators included all households, regardless of the presence of children. All members of the
household was counted, using the household definition.
a. Crude death rate (CDR)
The number of persons in the total population that dies over specified period of time refers to the Table 3
above for Sample size calculation for mortality surveys
2 UNICEF WINS | Issue 24 | 13 December 2018 | Moving to Updated Prevalence Thresholds
25
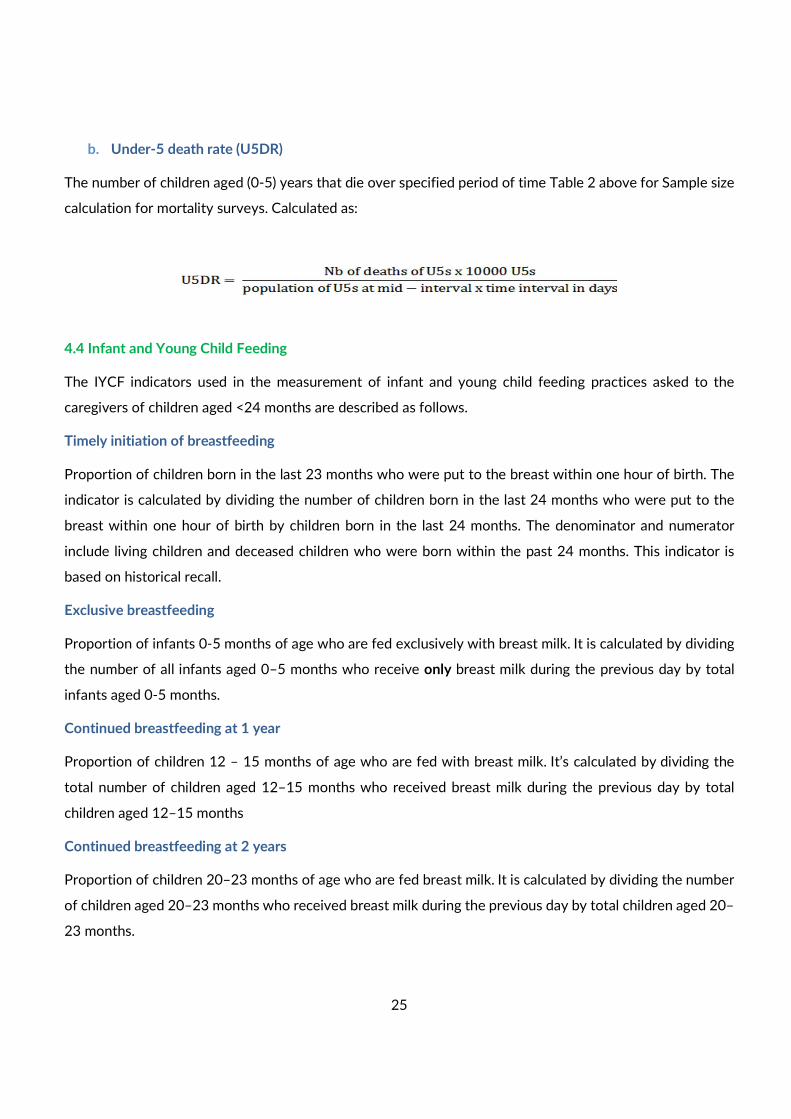
b. Under-5 death rate (U5DR)
The number of children aged (0-5) years that die over specified period of time Table 2 above for Sample size
calculation for mortality surveys. Calculated as:
4.4 Infant and Young Child Feeding
The IYCF indicators used in the measurement of infant and young child feeding practices asked to the
caregivers of children aged <24 months are described as follows.
Timely initiation of breastfeeding
Proportion of children born in the last 23 months who were put to the breast within one hour of birth. The
indicator is calculated by dividing the number of children born in the last 24 months who were put to the
breast within one hour of birth by children born in the last 24 months. The denominator and numerator
include living children and deceased children who were born within the past 24 months. This indicator is
based on historical recall.
Exclusive breastfeeding
Proportion of infants 0-5 months of age who are fed exclusively with breast milk. It is calculated by dividing
the number of all infants aged 0–5 months who receive only breast milk during the previous day by total
infants aged 0-5 months.
Continued breastfeeding at 1 year
Proportion of children 12 – 15 months of age who are fed with breast milk. It’s calculated by dividing the
total number of children aged 12–15 months who received breast milk during the previous day by total
children aged 12–15 months
Continued breastfeeding at 2 years
Proportion of children 20–23 months of age who are fed breast milk. It is calculated by dividing the number
of children aged 20–23 months who received breast milk during the previous day by total children aged 20–
23 months.

26
4.5 Immunization
Measles Immunization Coverage
Caregivers of all children 18-59 months was asked if the child received a second dose of measles
vaccinations, which was subsequently verified by reviewing the vaccination card, if available. If the
vaccination card was not available, then recall of the caregiver option was considered.
4.6. Maternal Nutrition
Women in childbearing age was assessed for their nutritional status based on MUAC measurements. The
nutritional status of pregnant and lactating mothers was derived using the MUAC cut-off of 230 mm.
4.7. Water, Sanitation and Hygiene
Water Quality
Household heads was asked, what their current main source of drinking water is. To assess if households are
relying on improved or unimproved water sources.
Hand washing practices
Caregivers was asked to demonstrate how they wash their hands to assess the use of soap or ash and water
when washing hands.
Caregivers was asked on what occasions they wash their hands to assess hand washing practices at 5 critical
moments.
5. FOOD SECURITY
5.1. Food Consumption Score
The FCS is proxy indicator to assess caloric intake and diet quality at the household level. It also provides an
indication of short-term household food security. It is calculated as the weighted sum of the frequency of
consumption of eight designated food groups consumed in the seven days prior to the survey based on
household recall. Each food group is weighted for nutritional value, with the following weightings: protein 4,
cereals 2, pulses 3, vegetables and fruits 1, while sugars and oils are weighted 0.5. The resulting scores are
categorized by FCS score as presented in Table 9 below:
27
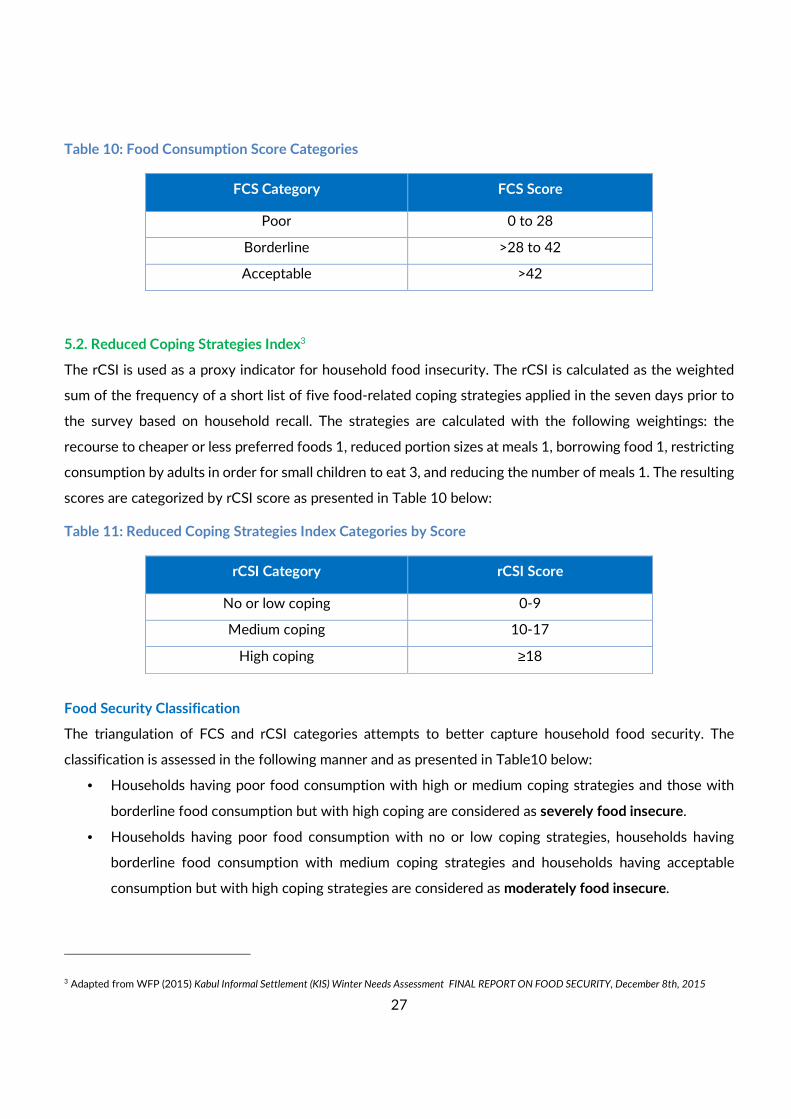
Table 10: Food Consumption Score Categories
FCS Category FCS Score
Poor 0 to 28
Borderline >28 to 42
Acceptable >42
5.2. Reduced Coping Strategies Index3
The rCSI is used as a proxy indicator for household food insecurity. The rCSI is calculated as the weighted
sum of the frequency of a short list of five food-related coping strategies applied in the seven days prior to
the survey based on household recall. The strategies are calculated with the following weightings: the
recourse to cheaper or less preferred foods 1, reduced portion sizes at meals 1, borrowing food 1, restricting
consumption by adults in order for small children to eat 3, and reducing the number of meals 1. The resulting
scores are categorized by rCSI score as presented in Table 10 below:
Table 11: Reduced Coping Strategies Index Categories by Score
rCSI Category rCSI Score
No or low coping 0-9
Medium coping 10-17
High coping ≥18
Food Security Classification
The triangulation of FCS and rCSI categories attempts to better capture household food security. The
classification is assessed in the following manner and as presented in Table10 below:
• Households having poor food consumption with high or medium coping strategies and those with
borderline food consumption but with high coping are considered as severely food insecure.
• Households having poor food consumption with no or low coping strategies, households having
borderline food consumption with medium coping strategies and households having acceptable
consumption but with high coping strategies are considered as moderately food insecure.
3 Adapted from WFP (2015) Kabul Informal Settlement (KIS) Winter Needs Assessment FINAL REPORT ON FOOD SECURITY, December 8th, 2015
28
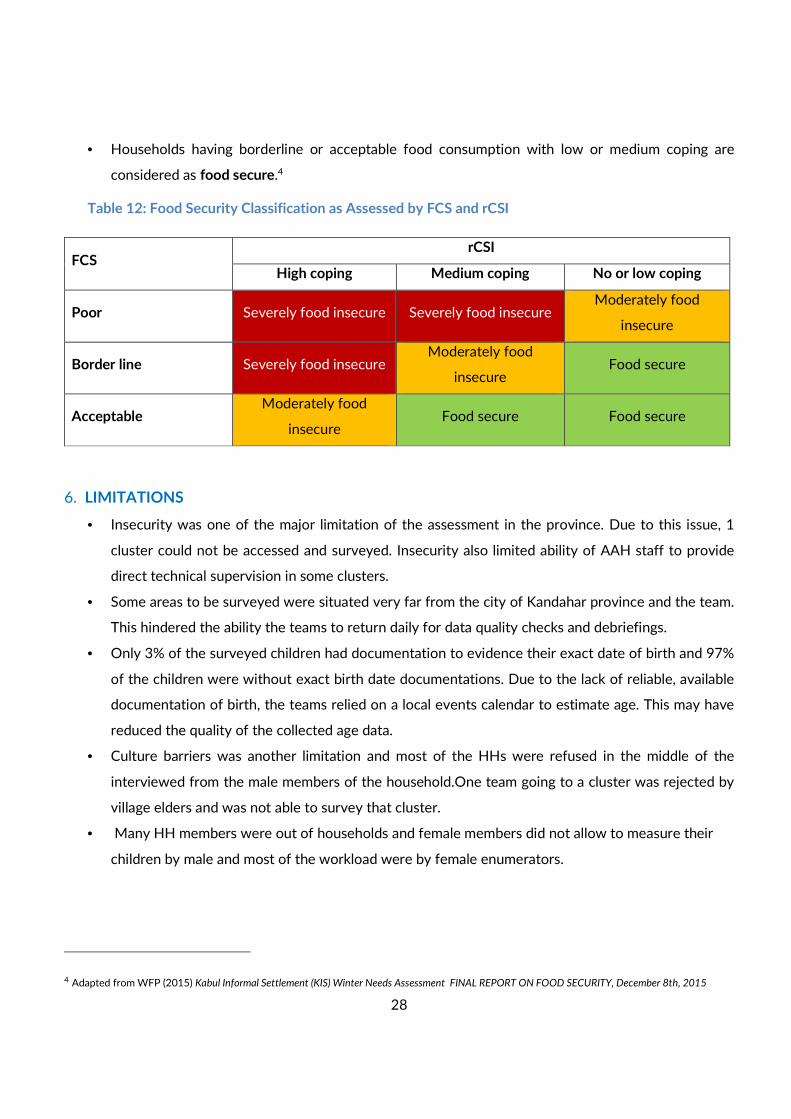
• Households having borderline or acceptable food consumption with low or medium coping are
considered as food secure.4
Table 12: Food Security Classification as Assessed by FCS and rCSI
6. LIMITATIONS
• Insecurity was one of the major limitation of the assessment in the province. Due to this issue, 1
cluster could not be accessed and surveyed. Insecurity also limited ability of AAH staff to provide
direct technical supervision in some clusters.
• Some areas to be surveyed were situated very far from the city of Kandahar province and the team.
This hindered the ability the teams to return daily for data quality checks and debriefings.
• Only 3% of the surveyed children had documentation to evidence their exact date of birth and 97%
of the children were without exact birth date documentations. Due to the lack of reliable, available
documentation of birth, the teams relied on a local events calendar to estimate age. This may have
reduced the quality of the collected age data.
• Culture barriers was another limitation and most of the HHs were refused in the middle of the
interviewed from the male members of the household.One team going to a cluster was rejected by
village elders and was not able to survey that cluster.
• Many HH members were out of households and female members did not allow to measure their
children by male and most of the workload were by female enumerators.
4 Adapted from WFP (2015) Kabul Informal Settlement (KIS) Winter Needs Assessment FINAL REPORT ON FOOD SECURITY, December 8th, 2015
FCS rCSI
High coping Medium coping No or low coping
Poor Severely food insecure Severely food insecure Moderately food
insecure
Border line Severely food insecure Moderately food
insecure Food secure
Acceptable Moderately food
insecure Food secure Food secure
29
7. SURVEY FINDINGS
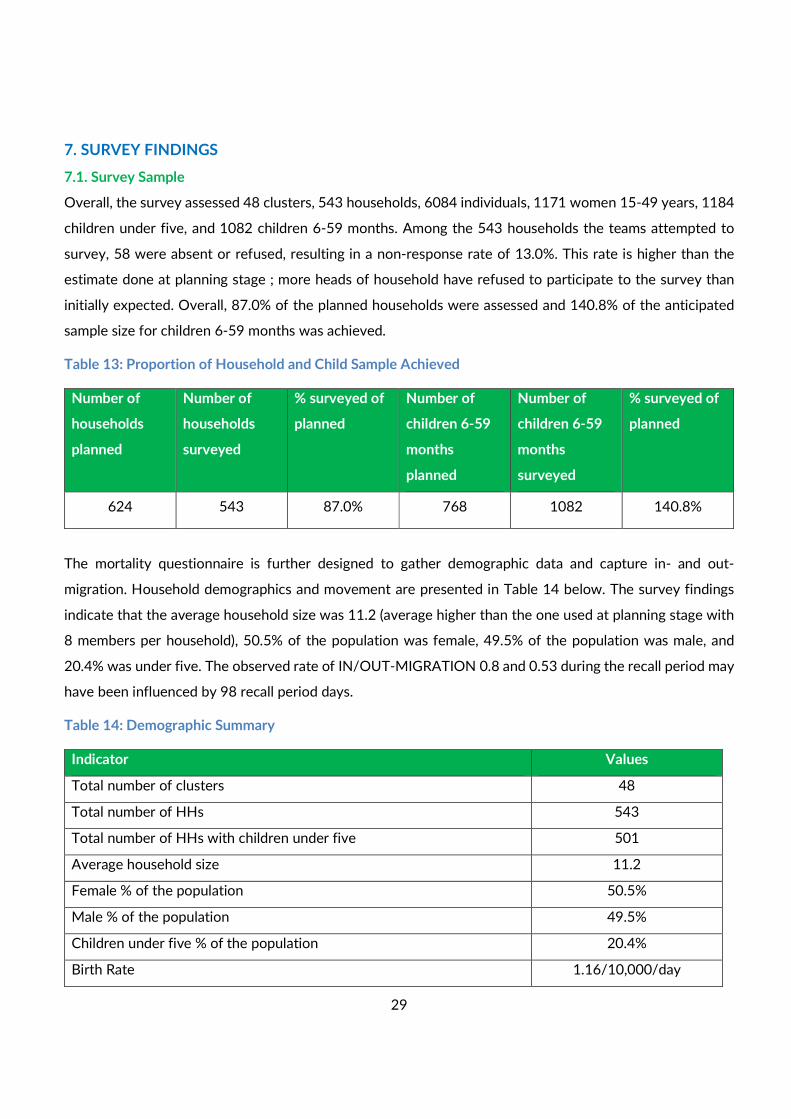
7.1. Survey Sample
Overall, the survey assessed 48 clusters, 543 households, 6084 individuals, 1171 women 15-49 years, 1184
children under five, and 1082 children 6-59 months. Among the 543 households the teams attempted to
survey, 58 were absent or refused, resulting in a non-response rate of 13.0%. This rate is higher than the
estimate done at planning stage ; more heads of household have refused to participate to the survey than
initially expected. Overall, 87.0% of the planned households were assessed and 140.8% of the anticipated
sample size for children 6-59 months was achieved.
Table 13: Proportion of Household and Child Sample Achieved
Number of
households
planned
Number of
households
surveyed
% surveyed of
planned
Number of
children 6-59
months
planned
Number of
children 6-59
months
surveyed
% surveyed of
planned
624 543 87.0% 768 1082 140.8%
The mortality questionnaire is further designed to gather demographic data and capture in- and out-
migration. Household demographics and movement are presented in Table 14 below. The survey findings
indicate that the average household size was 11.2 (average higher than the one used at planning stage with
8 members per household), 50.5% of the population was female, 49.5% of the population was male, and
20.4% was under five. The observed rate of IN/OUT-MIGRATION 0.8 and 0.53 during the recall period may
have been influenced by 98 recall period days.
Table 14: Demographic Summary
Indicator Values
Total number of clusters 48
Total number of HHs 543
Total number of HHs with children under five 501
Average household size 11.2
Female % of the population 50.5%
Male % of the population 49.5%
Children under five % of the population 20.4%
Birth Rate 1.16/10,000/day
30
In-migration Rate (Joined) 0.8/10,000/day
Out-migration Rate (Left) 0.53/10,000/day
Households were also assessed for residential status. Among the 543 surveyed households, 87.8% were
residents of the area, 9.9% were internally displaced, and 1.1% were Refugee.
Table 15: Household Residential Status by Proportion
Residential Status of Households
N= 543
Resident 477 87.8%
IDP 54 9.9%
Refugee 6 1.1%
Nomad 6 1.1%
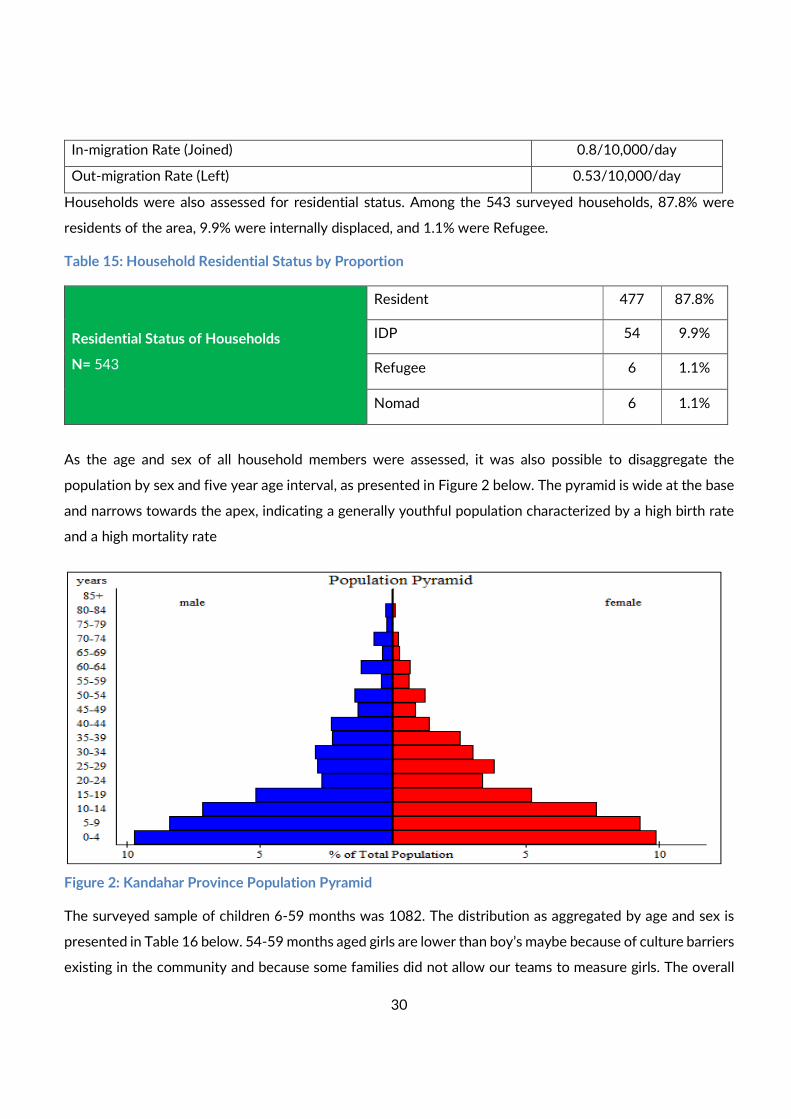
As the age and sex of all household members were assessed, it was also possible to disaggregate the
population by sex and five year age interval, as presented in Figure 2 below. The pyramid is wide at the base
and narrows towards the apex, indicating a generally youthful population characterized by a high birth rate
and a high mortality rate
Figure 2: Kandahar Province Population Pyramid
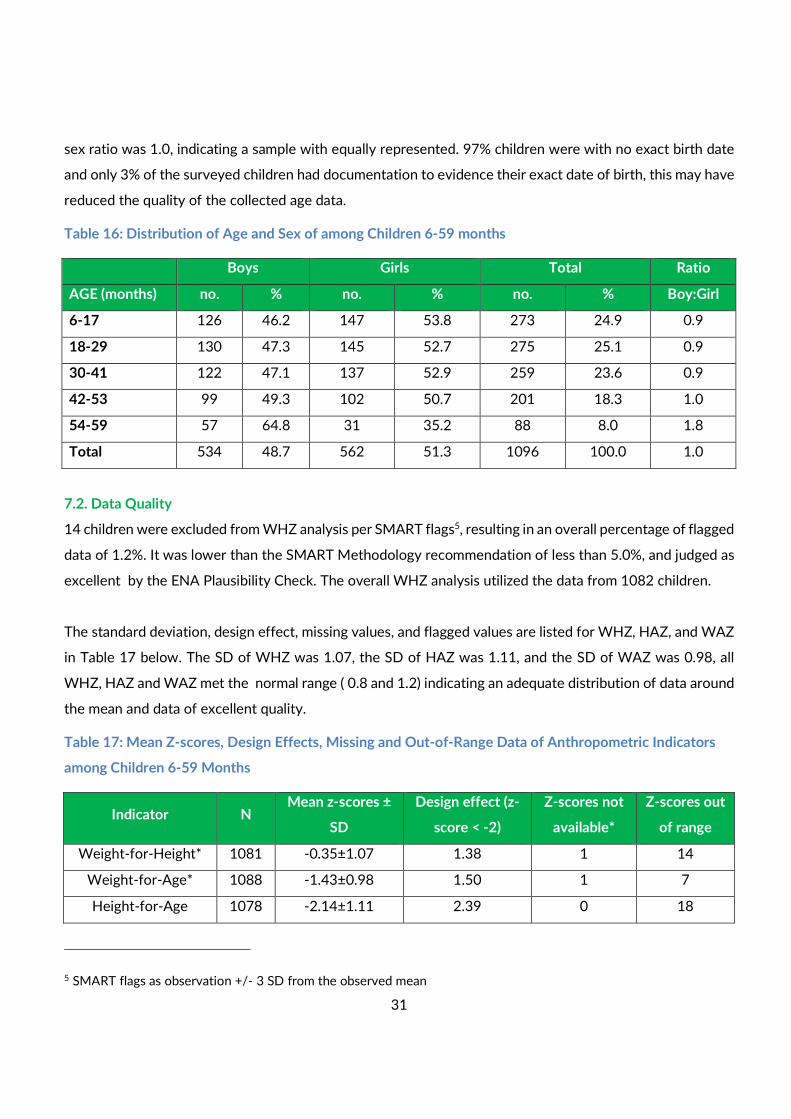
The surveyed sample of children 6-59 months was 1082. The distribution as aggregated by age and sex is
presented in Table 16 below. 54-59 months aged girls are lower than boy’s maybe because of culture barriers
existing in the community and because some families did not allow our teams to measure girls. The overall
31
sex ratio was 1.0, indicating a sample with equally represented. 97% children were with no exact birth date
and only 3% of the surveyed children had documentation to evidence their exact date of birth, this may have
reduced the quality of the collected age data.
Table 16: Distribution of Age and Sex of among Children 6-59 months
Boys Girls Total Ratio
AGE (months) no. % no. % no. % Boy:Girl
6-17 126 46.2 147 53.8 273 24.9 0.9
18-29 130 47.3 145 52.7 275 25.1 0.9
30-41 122 47.1 137 52.9 259 23.6 0.9
42-53 99 49.3 102 50.7 201 18.3 1.0
54-59 57 64.8 31 35.2 88 8.0 1.8
Total 534 48.7 562 51.3 1096 100.0 1.0
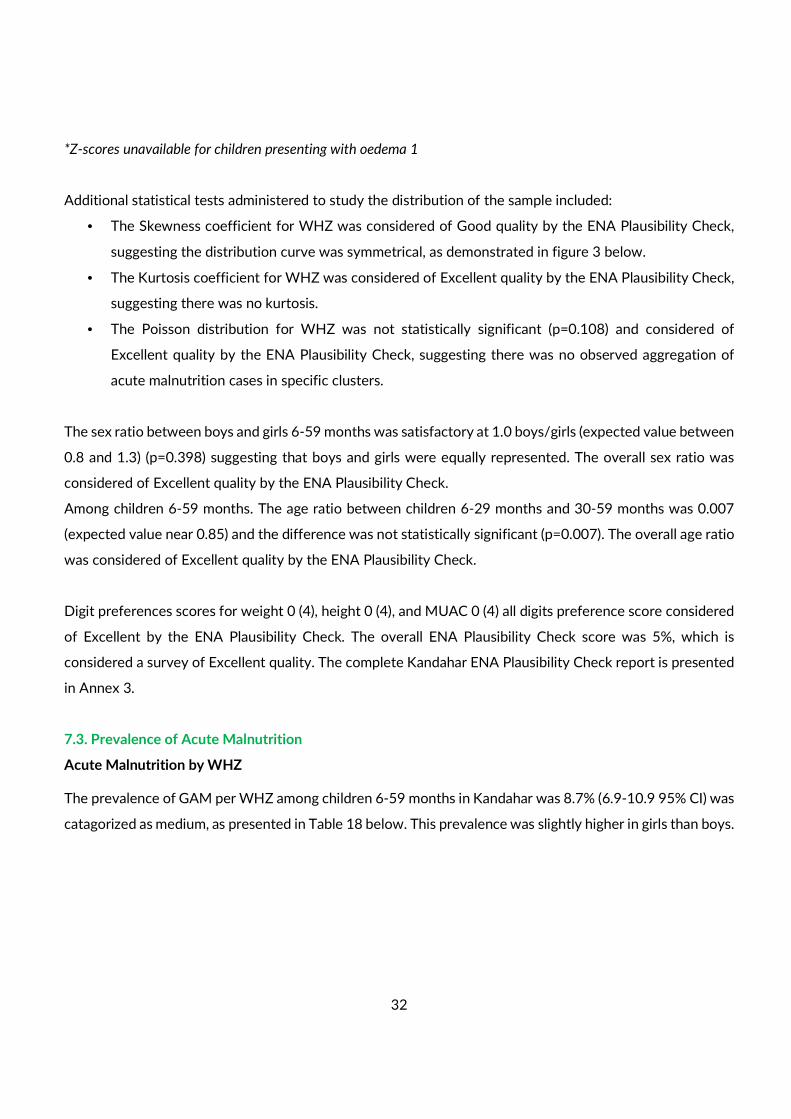
7.2. Data Quality
14 children were excluded from WHZ analysis per SMART flags5, resulting in an overall percentage of flagged
data of 1.2%. It was lower than the SMART Methodology recommendation of less than 5.0%, and judged as
excellent by the ENA Plausibility Check. The overall WHZ analysis utilized the data from 1082 children.
The standard deviation, design effect, missing values, and flagged values are listed for WHZ, HAZ, and WAZ
in Table 17 below. The SD of WHZ was 1.07, the SD of HAZ was 1.11, and the SD of WAZ was 0.98, all
WHZ, HAZ and WAZ met the normal range ( 0.8 and 1.2) indicating an adequate distribution of data around
the mean and data of excellent quality.
Table 17: Mean Z-scores, Design Effects, Missing and Out-of-Range Data of Anthropometric Indicators
among Children 6-59 Months
Indicator N Mean z-scores ±
SD
Design effect (z-
score < -2)
Z-scores not
available*
Z-scores out
of range
Weight-for-Height* 1081 -0.35±1.07 1.38 1 14
Weight-for-Age* 1088 -1.43±0.98 1.50 1 7
Height-for-Age 1078 -2.14±1.11 2.39 0 18
5 SMART flags as observation +/- 3 SD from the observed mean
32
*Z-scores unavailable for children presenting with oedema 1
Additional statistical tests administered to study the distribution of the sample included:
• The Skewness coefficient for WHZ was considered of Good quality by the ENA Plausibility Check,
suggesting the distribution curve was symmetrical, as demonstrated in figure 3 below.
• The Kurtosis coefficient for WHZ was considered of Excellent quality by the ENA Plausibility Check,
suggesting there was no kurtosis.
• The Poisson distribution for WHZ was not statistically significant (p=0.108) and considered of
Excellent quality by the ENA Plausibility Check, suggesting there was no observed aggregation of
acute malnutrition cases in specific clusters.
The sex ratio between boys and girls 6-59 months was satisfactory at 1.0 boys/girls (expected value between
0.8 and 1.3) (p=0.398) suggesting that boys and girls were equally represented. The overall sex ratio was
considered of Excellent quality by the ENA Plausibility Check.
Among children 6-59 months. The age ratio between children 6-29 months and 30-59 months was 0.007
(expected value near 0.85) and the difference was not statistically significant (p=0.007). The overall age ratio
was considered of Excellent quality by the ENA Plausibility Check.
Digit preferences scores for weight 0 (4), height 0 (4), and MUAC 0 (4) all digits preference score considered
of Excellent by the ENA Plausibility Check. The overall ENA Plausibility Check score was 5%, which is
considered a survey of Excellent quality. The complete Kandahar ENA Plausibility Check report is presented
in Annex 3.
7.3. Prevalence of Acute Malnutrition
Acute Malnutrition by WHZ
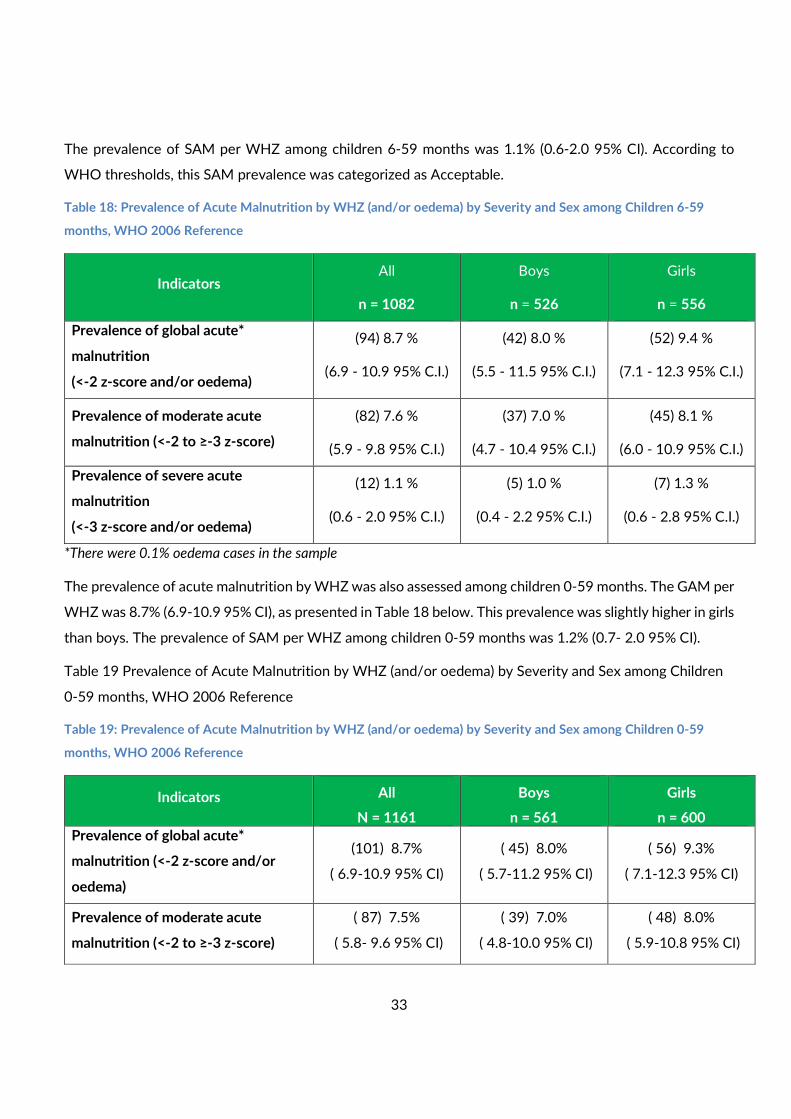
The prevalence of GAM per WHZ among children 6-59 months in Kandahar was 8.7% (6.9-10.9 95% CI) was
catagorized as medium, as presented in Table 18 below. This prevalence was slightly higher in girls than boys.
33
The prevalence of SAM per WHZ among children 6-59 months was 1.1% (0.6-2.0 95% CI). According to
WHO thresholds, this SAM prevalence was categorized as Acceptable.
Table 18: Prevalence of Acute Malnutrition by WHZ (and/or oedema) by Severity and Sex among Children 6-59
months, WHO 2006 Reference
Indicators All
n = 1082
Boys
n = 526
Girls
n = 556
Prevalence of global acute*
malnutrition
(<-2 z-score and/or oedema)
(94) 8.7 %
(6.9 - 10.9 95% C.I.)
(42) 8.0 %
(5.5 - 11.5 95% C.I.)
(52) 9.4 %
(7.1 - 12.3 95% C.I.)
Prevalence of moderate acute
malnutrition (<-2 to ≥-3 z-score)
(82) 7.6 %
(5.9 - 9.8 95% C.I.)
(37) 7.0 %
(4.7 - 10.4 95% C.I.)
(45) 8.1 %
(6.0 - 10.9 95% C.I.)
Prevalence of severe acute
malnutrition
(<-3 z-score and/or oedema)
(12) 1.1 %
(0.6 - 2.0 95% C.I.)
(5) 1.0 %
(0.4 - 2.2 95% C.I.)
(7) 1.3 %
(0.6 - 2.8 95% C.I.)
*There were 0.1% oedema cases in the sample
The prevalence of acute malnutrition by WHZ was also assessed among children 0-59 months. The GAM per
WHZ was 8.7% (6.9-10.9 95% CI), as presented in Table 18 below. This prevalence was slightly higher in girls
than boys. The prevalence of SAM per WHZ among children 0-59 months was 1.2% (0.7- 2.0 95% CI).
Table 19 Prevalence of Acute Malnutrition by WHZ (and/or oedema) by Severity and Sex among Children
0-59 months, WHO 2006 Reference
Table 19: Prevalence of Acute Malnutrition by WHZ (and/or oedema) by Severity and Sex among Children 0-59
months, WHO 2006 Reference
Indicators All
N = 1161
Boys
n = 561
Girls
n = 600
Prevalence of global acute*
malnutrition (<-2 z-score and/or
oedema)
(101) 8.7%
( 6.9-10.9 95% CI)
( 45) 8.0%
( 5.7-11.2 95% CI)
( 56) 9.3%
( 7.1-12.3 95% CI)
Prevalence of moderate acute
malnutrition (<-2 to ≥-3 z-score)
( 87) 7.5%
( 5.8- 9.6 95% CI)
( 39) 7.0%
( 4.8-10.0 95% CI)
( 48) 8.0%
( 5.9-10.8 95% CI)
34
Prevalence of severe acute
malnutrition (<-3 z-score and/or
oedema)
( 14) 1.2%
( 0.7- 2.0 95% CI)
( 6) 1.1%
( 0.5- 2.2 95% CI)
( 8) 1.3%
( 0.6- 2.8 95% CI)
*There were 0.1% oedema cases in the sample
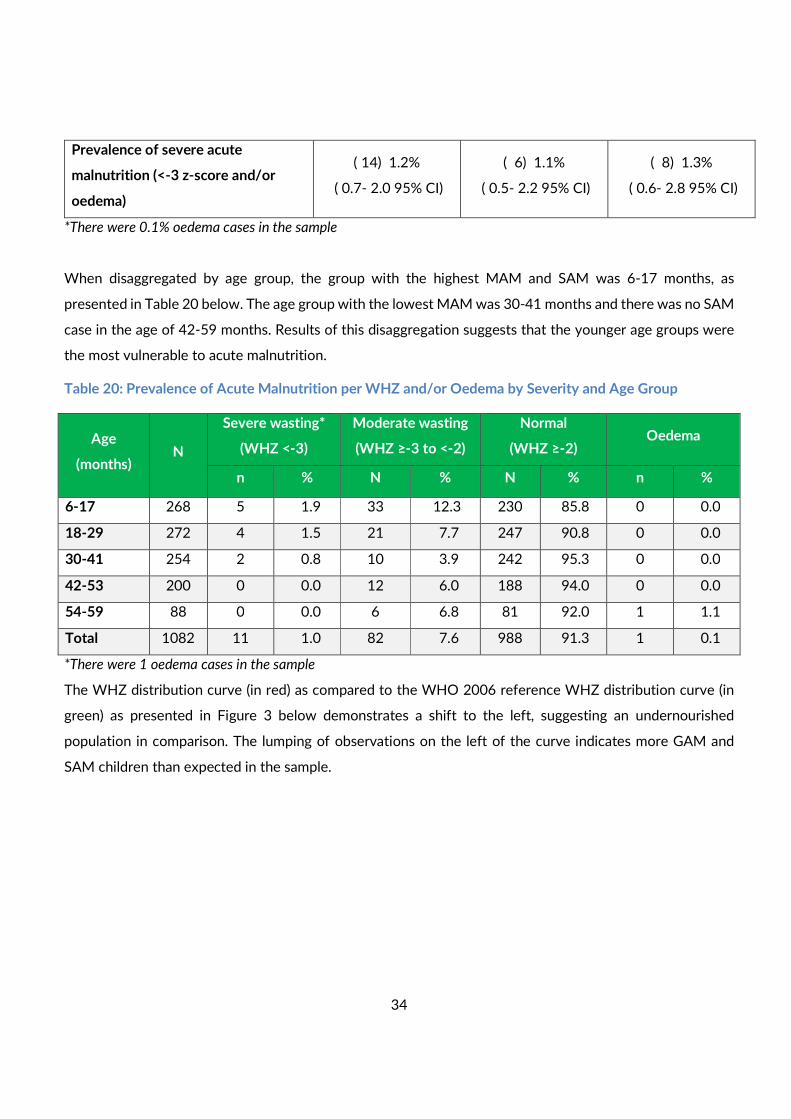
When disaggregated by age group, the group with the highest MAM and SAM was 6-17 months, as
presented in Table 20 below. The age group with the lowest MAM was 30-41 months and there was no SAM
case in the age of 42-59 months. Results of this disaggregation suggests that the younger age groups were
the most vulnerable to acute malnutrition.
Table 20: Prevalence of Acute Malnutrition per WHZ and/or Oedema by Severity and Age Group
Age
(months) N
Severe wasting*
(WHZ <-3)
Moderate wasting
(WHZ ≥-3 to <-2)
Normal
(WHZ ≥-2) Oedema
n % N % N % n %
6-17 268 5 1.9 33 12.3 230 85.8 0 0.0
18-29 272 4 1.5 21 7.7 247 90.8 0 0.0
30-41 254 2 0.8 10 3.9 242 95.3 0 0.0
42-53 200 0 0.0 12 6.0 188 94.0 0 0.0
54-59 88 0 0.0 6 6.8 81 92.0 1 1.1
Total 1082 11 1.0 82 7.6 988 91.3 1 0.1
*There were 1 oedema cases in the sample
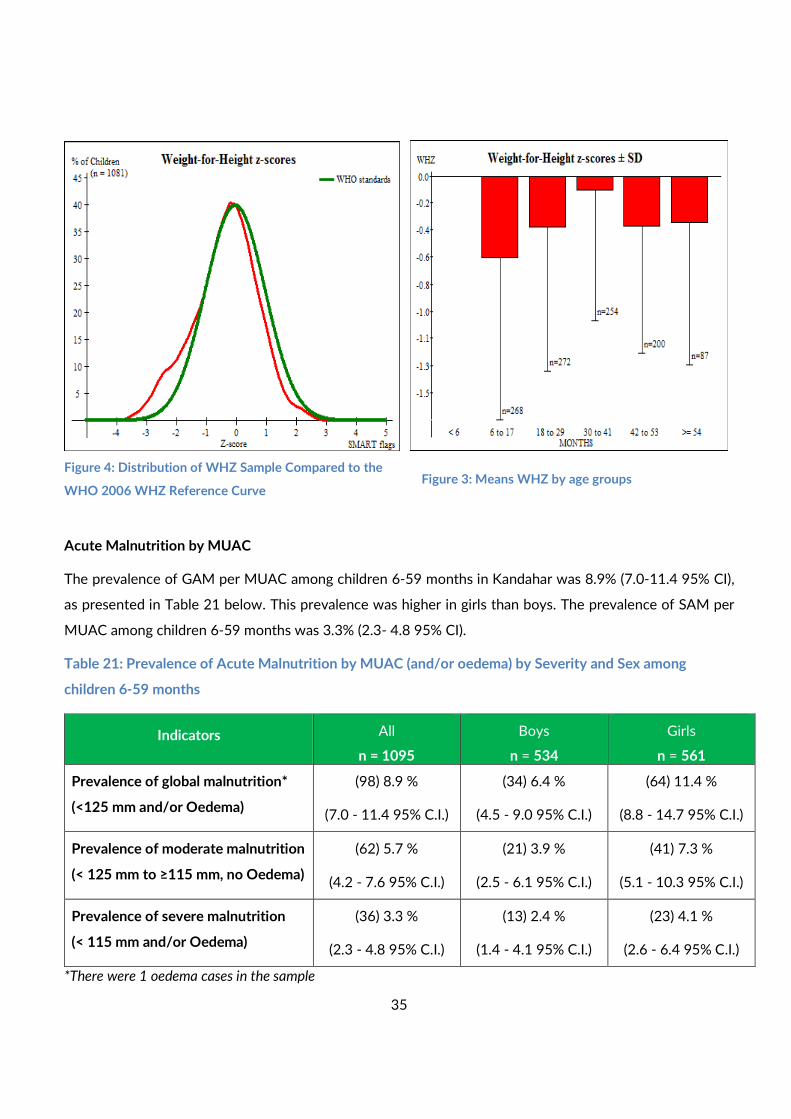
The WHZ distribution curve (in red) as compared to the WHO 2006 reference WHZ distribution curve (in
green) as presented in Figure 3 below demonstrates a shift to the left, suggesting an undernourished
population in comparison. The lumping of observations on the left of the curve indicates more GAM and
SAM children than expected in the sample.
35
Acute Malnutrition by MUAC
The prevalence of GAM per MUAC among children 6-59 months in Kandahar was 8.9% (7.0-11.4 95% CI),
as presented in Table 21 below. This prevalence was higher in girls than boys. The prevalence of SAM per
MUAC among children 6-59 months was 3.3% (2.3- 4.8 95% CI).
Table 21: Prevalence of Acute Malnutrition by MUAC (and/or oedema) by Severity and Sex among
children 6-59 months
Indicators All
n = 1095
Boys
n = 534
Girls
n = 561
Prevalence of global malnutrition*
(<125 mm and/or Oedema)
(98) 8.9 %
(7.0 - 11.4 95% C.I.)
(34) 6.4 %
(4.5 - 9.0 95% C.I.)
(64) 11.4 %
(8.8 - 14.7 95% C.I.)
Prevalence of moderate malnutrition
(< 125 mm to ≥115 mm, no Oedema)
(62) 5.7 %
(4.2 - 7.6 95% C.I.)
(21) 3.9 %
(2.5 - 6.1 95% C.I.)
(41) 7.3 %
(5.1 - 10.3 95% C.I.)
Prevalence of severe malnutrition
(< 115 mm and/or Oedema)
(36) 3.3 %
(2.3 - 4.8 95% C.I.)
(13) 2.4 %
(1.4 - 4.1 95% C.I.)
(23) 4.1 %
(2.6 - 6.4 95% C.I.)
*There were 1 oedema cases in the sample
Figure 4: Distribution of WHZ Sample Compared to the
WHO 2006 WHZ Reference Curve Figure 3: Means WHZ by age groups
36
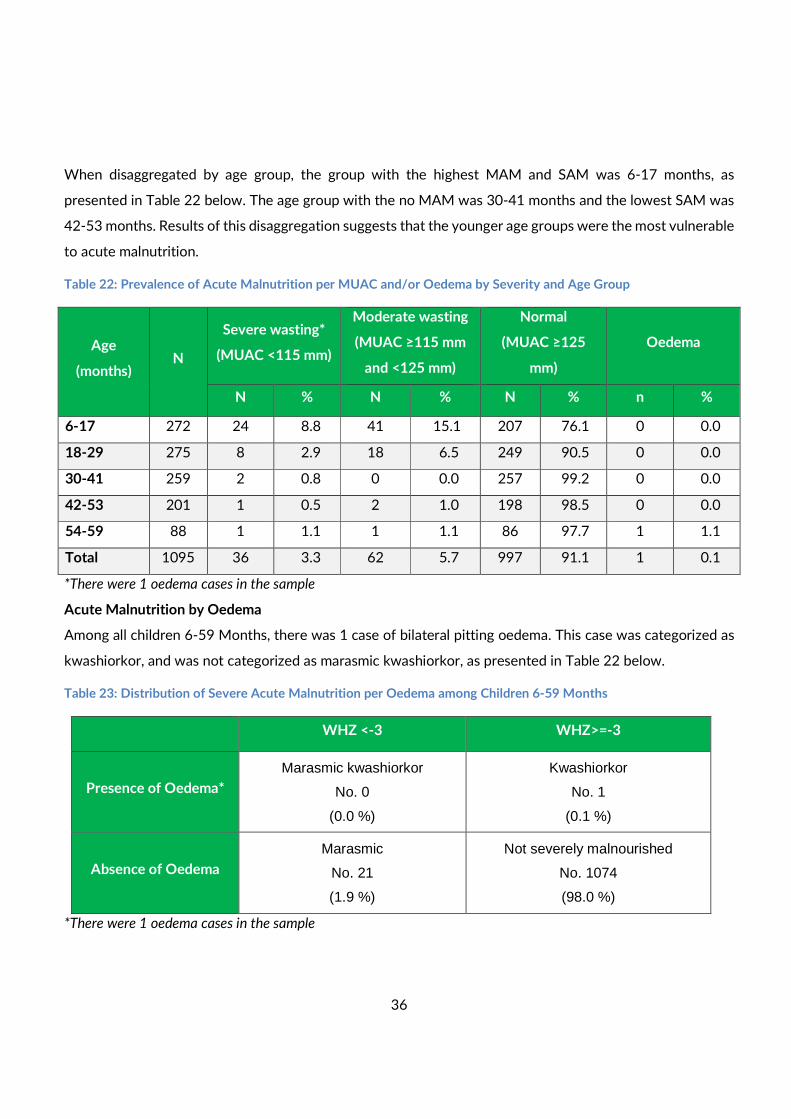
When disaggregated by age group, the group with the highest MAM and SAM was 6-17 months, as
presented in Table 22 below. The age group with the no MAM was 30-41 months and the lowest SAM was
42-53 months. Results of this disaggregation suggests that the younger age groups were the most vulnerable
to acute malnutrition.
Table 22: Prevalence of Acute Malnutrition per MUAC and/or Oedema by Severity and Age Group
Age
(months) N
Severe wasting*
(MUAC <115 mm)
Moderate wasting
(MUAC ≥115 mm
and <125 mm)
Normal
(MUAC ≥125
mm)
Oedema
N % N % N % n %
6-17 272 24 8.8 41 15.1 207 76.1 0 0.0
18-29 275 8 2.9 18 6.5 249 90.5 0 0.0
30-41 259 2 0.8 0 0.0 257 99.2 0 0.0
42-53 201 1 0.5 2 1.0 198 98.5 0 0.0
54-59 88 1 1.1 1 1.1 86 97.7 1 1.1
Total 1095 36 3.3 62 5.7 997 91.1 1 0.1
*There were 1 oedema cases in the sample
Acute Malnutrition by Oedema
Among all children 6-59 Months, there was 1 case of bilateral pitting oedema. This case was categorized as
kwashiorkor, and was not categorized as marasmic kwashiorkor, as presented in Table 22 below.
Table 23: Distribution of Severe Acute Malnutrition per Oedema among Children 6-59 Months
WHZ <-3 WHZ>=-3
Presence of Oedema*
Marasmic kwashiorkor
No. 0
(0.0 %)
Kwashiorkor
No. 1
(0.1 %)
Absence of Oedema
Marasmic
No. 21
(1.9 %)
Not severely malnourished
No. 1074
(98.0 %)
*There were 1 oedema cases in the sample
37
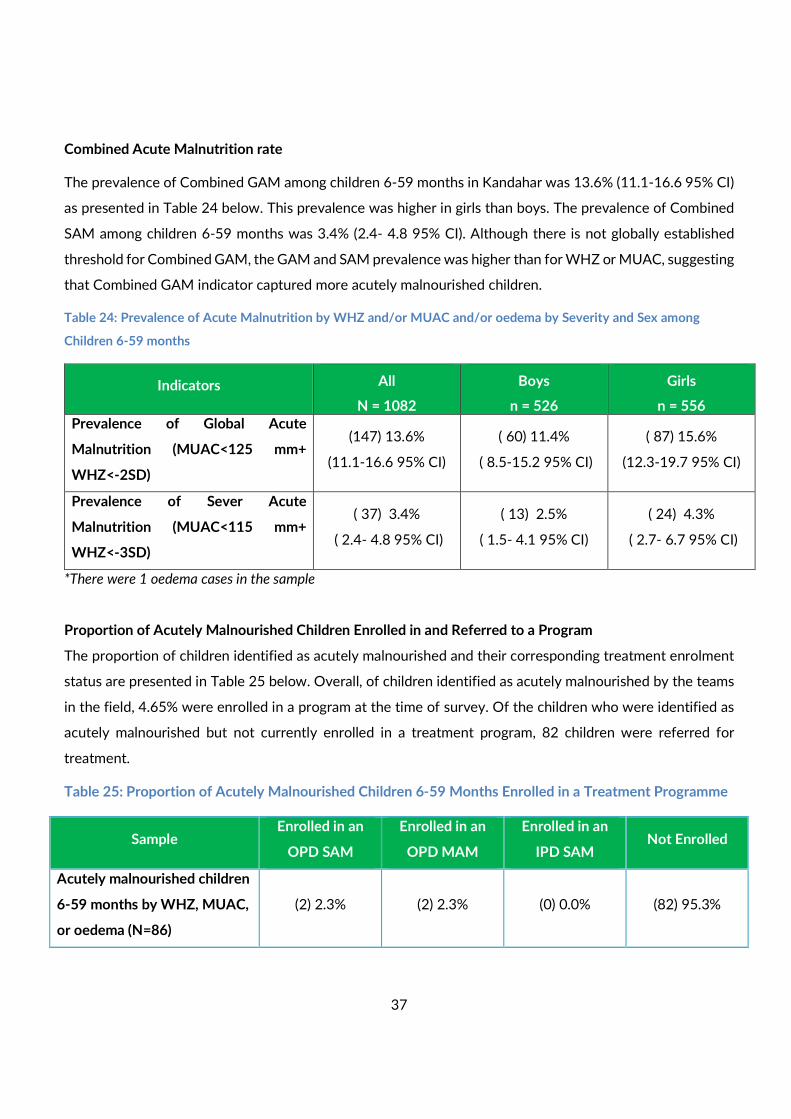
Combined Acute Malnutrition rate
The prevalence of Combined GAM among children 6-59 months in Kandahar was 13.6% (11.1-16.6 95% CI)
as presented in Table 24 below. This prevalence was higher in girls than boys. The prevalence of Combined
SAM among children 6-59 months was 3.4% (2.4- 4.8 95% CI). Although there is not globally established
threshold for Combined GAM, the GAM and SAM prevalence was higher than for WHZ or MUAC, suggesting
that Combined GAM indicator captured more acutely malnourished children.
Table 24: Prevalence of Acute Malnutrition by WHZ and/or MUAC and/or oedema by Severity and Sex among
Children 6-59 months
Indicators All
N = 1082
Boys
n = 526
Girls
n = 556
Prevalence of Global Acute
Malnutrition (MUAC<125 mm+
WHZ<-2SD)
(147) 13.6%
(11.1-16.6 95% CI)
( 60) 11.4%
( 8.5-15.2 95% CI)
( 87) 15.6%
(12.3-19.7 95% CI)
Prevalence of Sever Acute
Malnutrition (MUAC<115 mm+
WHZ<-3SD)
( 37) 3.4%
( 2.4- 4.8 95% CI)
( 13) 2.5%
( 1.5- 4.1 95% CI)
( 24) 4.3%
( 2.7- 6.7 95% CI)
*There were 1 oedema cases in the sample
Proportion of Acutely Malnourished Children Enrolled in and Referred to a Program
The proportion of children identified as acutely malnourished and their corresponding treatment enrolment
status are presented in Table 25 below. Overall, of children identified as acutely malnourished by the teams
in the field, 4.65% were enrolled in a program at the time of survey. Of the children who were identified as
acutely malnourished but not currently enrolled in a treatment program, 82 children were referred for
treatment.
Table 25: Proportion of Acutely Malnourished Children 6-59 Months Enrolled in a Treatment Programme
Sample Enrolled in an
OPD SAM
Enrolled in an
OPD MAM
Enrolled in an
IPD SAM Not Enrolled
Acutely malnourished children
6-59 months by WHZ, MUAC,
or oedema (N=86)
(2) 2.3% (2) 2.3% (0) 0.0% (82) 95.3%
38
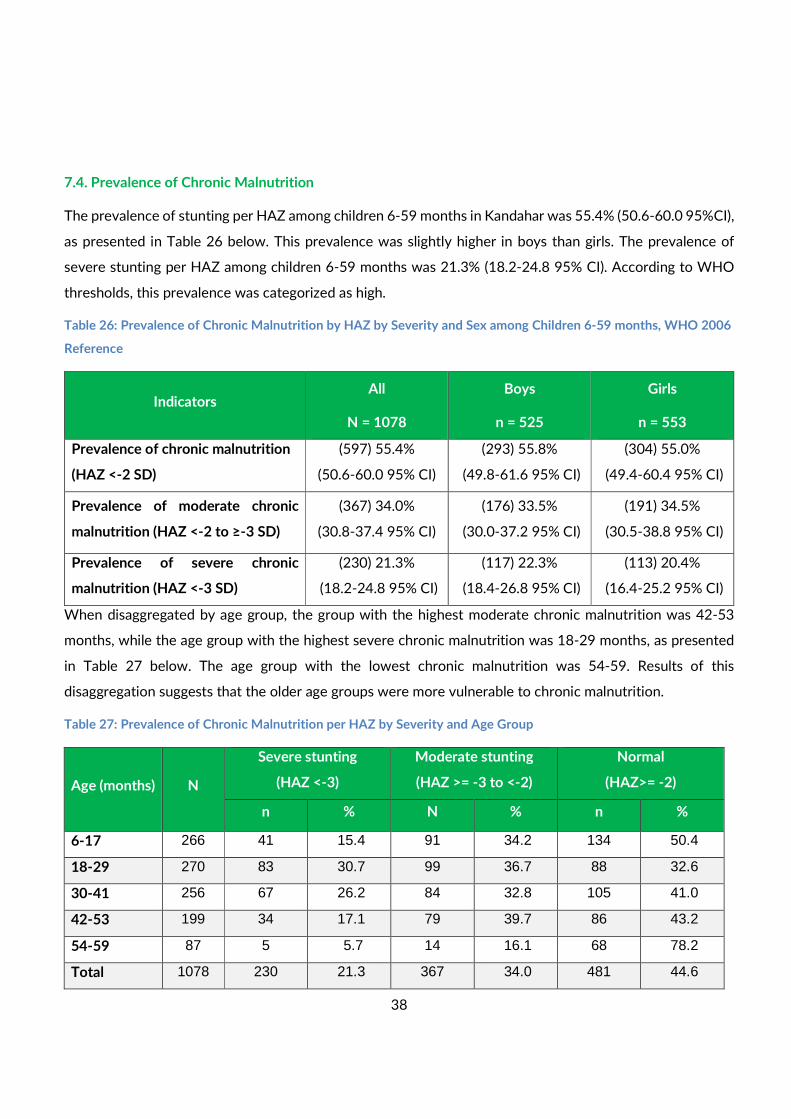
7.4. Prevalence of Chronic Malnutrition
The prevalence of stunting per HAZ among children 6-59 months in Kandahar was 55.4% (50.6-60.0 95%CI),
as presented in Table 26 below. This prevalence was slightly higher in boys than girls. The prevalence of
severe stunting per HAZ among children 6-59 months was 21.3% (18.2-24.8 95% CI). According to WHO
thresholds, this prevalence was categorized as high.
Table 26: Prevalence of Chronic Malnutrition by HAZ by Severity and Sex among Children 6-59 months, WHO 2006
Reference
Indicators All
N = 1078
Boys
n = 525
Girls
n = 553
Prevalence of chronic malnutrition
(HAZ <-2 SD)
(597) 55.4%
(50.6-60.0 95% CI)
(293) 55.8%
(49.8-61.6 95% CI)
(304) 55.0%
(49.4-60.4 95% CI)
Prevalence of moderate chronic
malnutrition (HAZ <-2 to ≥-3 SD)
(367) 34.0%
(30.8-37.4 95% CI)
(176) 33.5%
(30.0-37.2 95% CI)
(191) 34.5%
(30.5-38.8 95% CI)
Prevalence of severe chronic
malnutrition (HAZ <-3 SD)
(230) 21.3%
(18.2-24.8 95% CI)
(117) 22.3%
(18.4-26.8 95% CI)
(113) 20.4%
(16.4-25.2 95% CI)
When disaggregated by age group, the group with the highest moderate chronic malnutrition was 42-53
months, while the age group with the highest severe chronic malnutrition was 18-29 months, as presented
in Table 27 below. The age group with the lowest chronic malnutrition was 54-59. Results of this
disaggregation suggests that the older age groups were more vulnerable to chronic malnutrition.
Table 27: Prevalence of Chronic Malnutrition per HAZ by Severity and Age Group
Age (months) N
Severe stunting
(HAZ <-3)
Moderate stunting
(HAZ >= -3 to <-2)
Normal
(HAZ>= -2)
n % N % n %
6-17 266 41 15.4 91 34.2 134 50.4
18-29 270 83 30.7 99 36.7 88 32.6
30-41 256 67 26.2 84 32.8 105 41.0
42-53 199 34 17.1 79 39.7 86 43.2
54-59 87 5 5.7 14 16.1 68 78.2
Total 1078 230 21.3 367 34.0 481 44.6
39
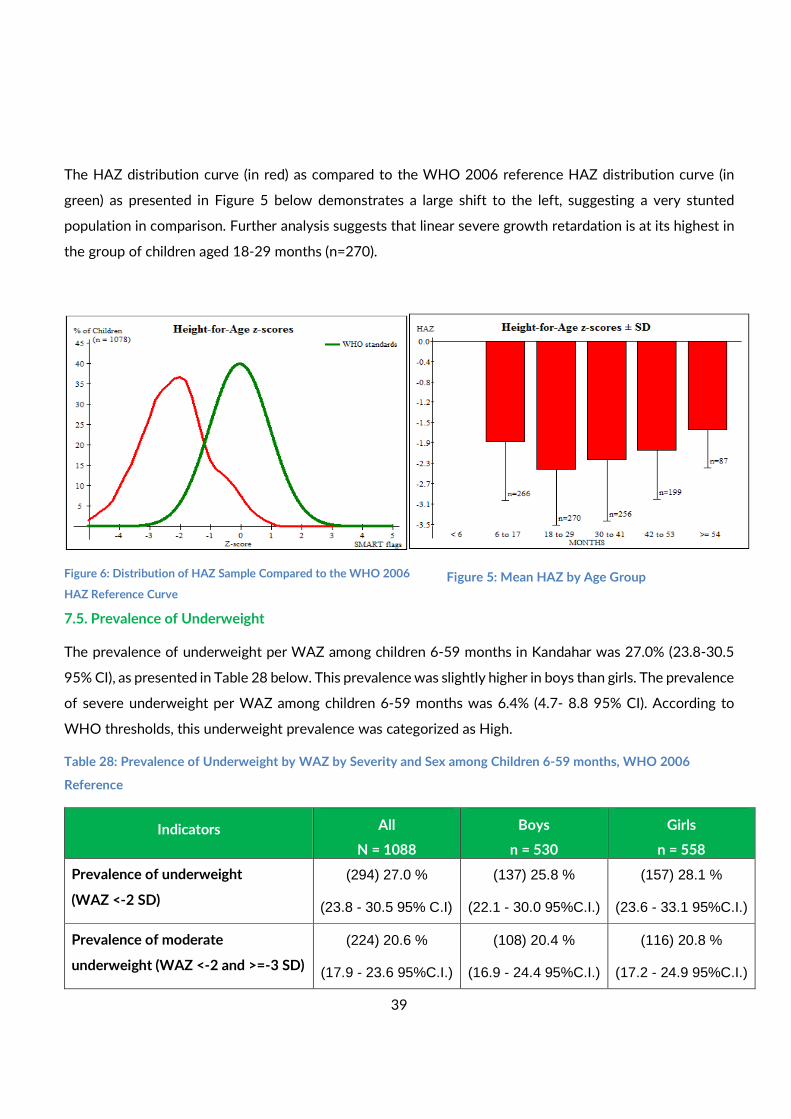
The HAZ distribution curve (in red) as compared to the WHO 2006 reference HAZ distribution curve (in
green) as presented in Figure 5 below demonstrates a large shift to the left, suggesting a very stunted
population in comparison. Further analysis suggests that linear severe growth retardation is at its highest in
the group of children aged 18-29 months (n=270).
7.5. Prevalence of Underweight
The prevalence of underweight per WAZ among children 6-59 months in Kandahar was 27.0% (23.8-30.5
95% CI), as presented in Table 28 below. This prevalence was slightly higher in boys than girls. The prevalence
of severe underweight per WAZ among children 6-59 months was 6.4% (4.7- 8.8 95% CI). According to
WHO thresholds, this underweight prevalence was categorized as High.
Table 28: Prevalence of Underweight by WAZ by Severity and Sex among Children 6-59 months, WHO 2006
Reference
Indicators All
N = 1088
Boys
n = 530
Girls
n = 558
Prevalence of underweight
(WAZ <-2 SD)
(294) 27.0 %
(23.8 - 30.5 95% C.I)
(137) 25.8 %
(22.1 - 30.0 95%C.I.)
(157) 28.1 %
(23.6 - 33.1 95%C.I.)
Prevalence of moderate
underweight (WAZ <-2 and >=-3 SD)
(224) 20.6 %
(17.9 - 23.6 95%C.I.)
(108) 20.4 %
(16.9 - 24.4 95%C.I.)
(116) 20.8 %
(17.2 - 24.9 95%C.I.)
Figure 5: Mean HAZ by Age Group Figure 6: Distribution of HAZ Sample Compared to the WHO 2006
HAZ Reference Curve
40
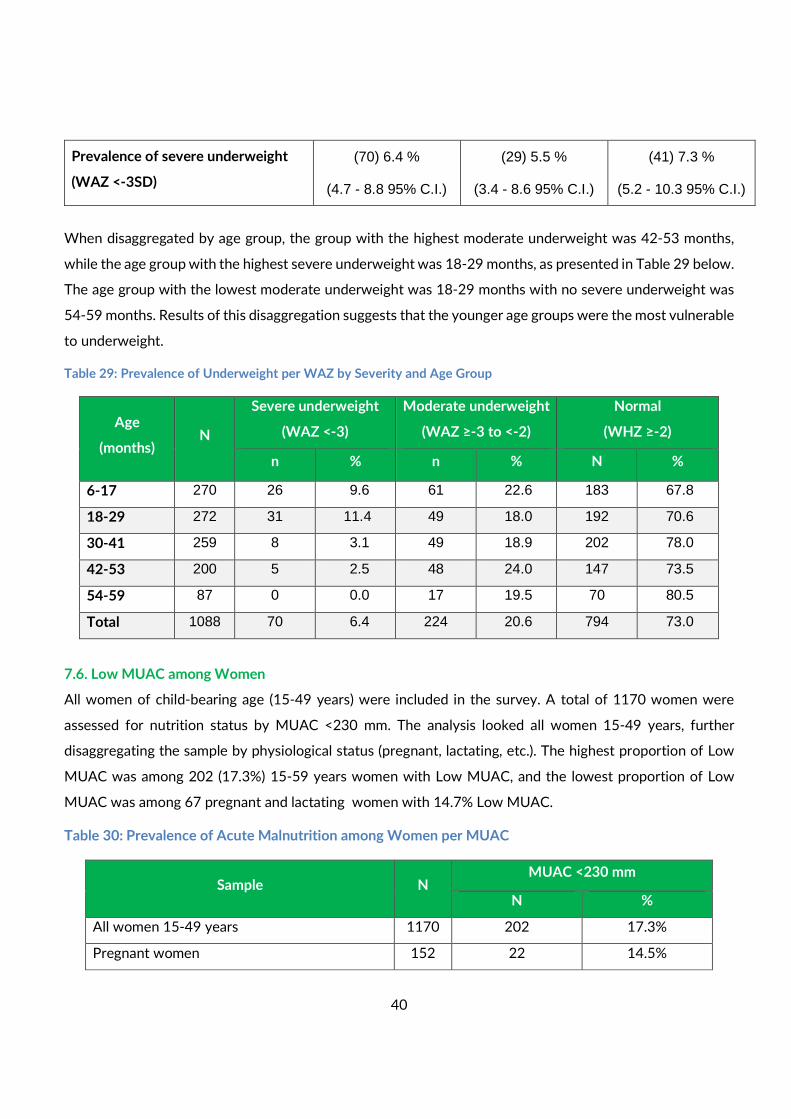
Prevalence of severe underweight
(WAZ <-3SD)
(70) 6.4 %
(4.7 - 8.8 95% C.I.)
(29) 5.5 %
(3.4 - 8.6 95% C.I.)
(41) 7.3 %
(5.2 - 10.3 95% C.I.)
When disaggregated by age group, the group with the highest moderate underweight was 42-53 months,
while the age group with the highest severe underweight was 18-29 months, as presented in Table 29 below.
The age group with the lowest moderate underweight was 18-29 months with no severe underweight was
54-59 months. Results of this disaggregation suggests that the younger age groups were the most vulnerable
to underweight.
Table 29: Prevalence of Underweight per WAZ by Severity and Age Group
Age
(months) N
Severe underweight
(WAZ <-3)
Moderate underweight
(WAZ ≥-3 to <-2)
Normal
(WHZ ≥-2)
n % n % N %
6-17 270 26 9.6 61 22.6 183 67.8
18-29 272 31 11.4 49 18.0 192 70.6
30-41 259 8 3.1 49 18.9 202 78.0
42-53 200 5 2.5 48 24.0 147 73.5
54-59 87 0 0.0 17 19.5 70 80.5
Total 1088 70 6.4 224 20.6 794 73.0
7.6. Low MUAC among Women
All women of child-bearing age (15-49 years) were included in the survey. A total of 1170 women were
assessed for nutrition status by MUAC <230 mm. The analysis looked all women 15-49 years, further
disaggregating the sample by physiological status (pregnant, lactating, etc.). The highest proportion of Low
MUAC was among 202 (17.3%) 15-59 years women with Low MUAC, and the lowest proportion of Low
MUAC was among 67 pregnant and lactating women with 14.7% Low MUAC.
Table 30: Prevalence of Acute Malnutrition among Women per MUAC
Sample N MUAC <230 mm
N %
All women 15-49 years 1170 202 17.3%
Pregnant women 152 22 14.5%
41
Lactating women 274 40 14.6%
Pregnant and lactating women* 29 5 17.2%
Non-pregnant and non-lactating women 715 135 18.9%
All PLWs 455 67 14.7%
*Women that were simultaneously pregnant and lactating
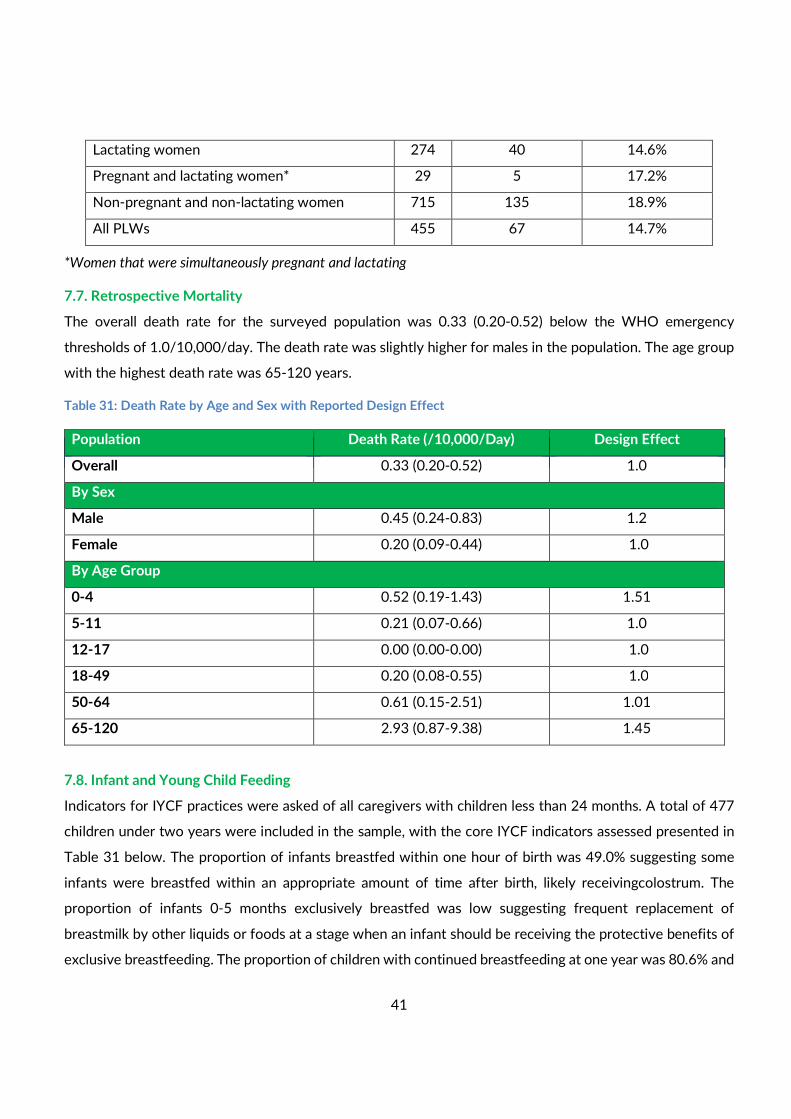
7.7. Retrospective Mortality
The overall death rate for the surveyed population was 0.33 (0.20-0.52) below the WHO emergency
thresholds of 1.0/10,000/day. The death rate was slightly higher for males in the population. The age group
with the highest death rate was 65-120 years.
Table 31: Death Rate by Age and Sex with Reported Design Effect
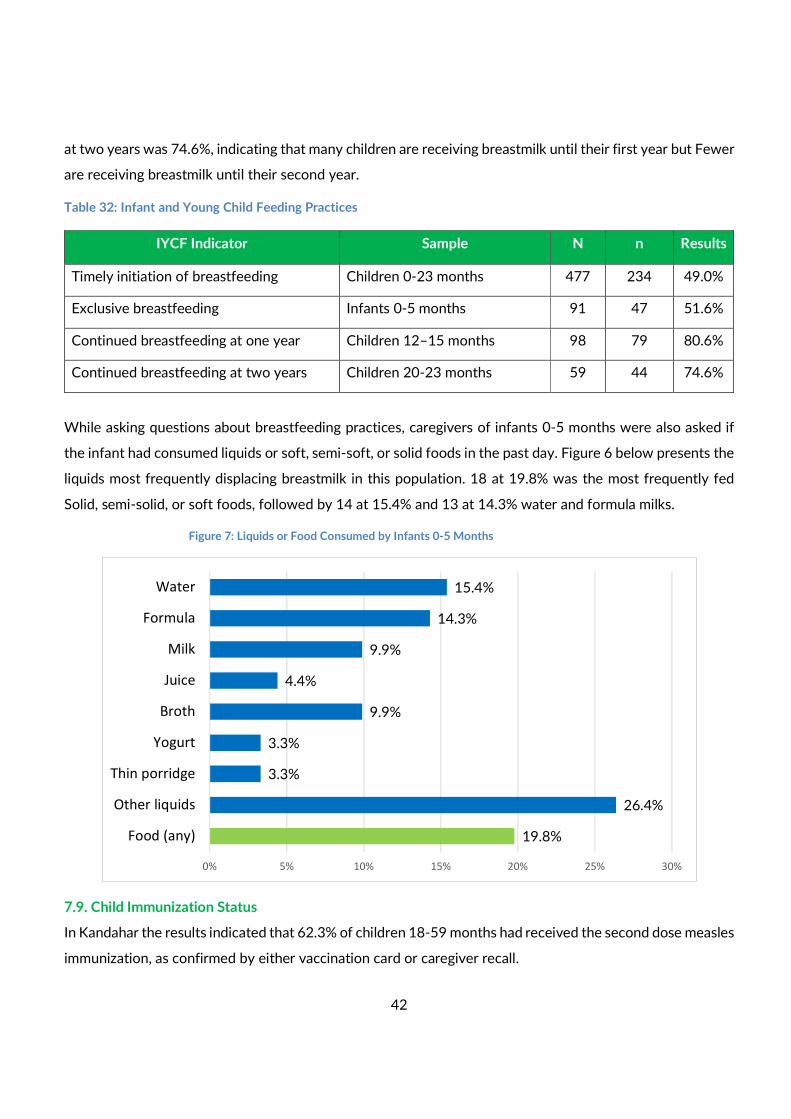
7.8. Infant and Young Child Feeding
Indicators for IYCF practices were asked of all caregivers with children less than 24 months. A total of 477
children under two years were included in the sample, with the core IYCF indicators assessed presented in
Table 31 below. The proportion of infants breastfed within one hour of birth was 49.0% suggesting some
infants were breastfed within an appropriate amount of time after birth, likely receivingcolostrum. The
proportion of infants 0-5 months exclusively breastfed was low suggesting frequent replacement of
breastmilk by other liquids or foods at a stage when an infant should be receiving the protective benefits of
exclusive breastfeeding. The proportion of children with continued breastfeeding at one year was 80.6% and
Crude Death Rate (95% CI) Design Effect Population Death Rate (/10,000/Day) Design Effect
Overall 0.33 (0.20-0.52) 1.0
By Sex
Male 0.45 (0.24-0.83) 1.2
Female 0.20 (0.09-0.44) 1.0
By Age Group
0-4 0.52 (0.19-1.43) 1.51
5-11 0.21 (0.07-0.66) 1.0
12-17 0.00 (0.00-0.00) 1.0
18-49 0.20 (0.08-0.55) 1.0
50-64 0.61 (0.15-2.51) 1.01
65-120 2.93 (0.87-9.38) 1.45
42
at two years was 74.6%, indicating that many children are receiving breastmilk until their first year but Fewer
are receiving breastmilk until their second year.
Table 32: Infant and Young Child Feeding Practices
IYCF Indicator Sample N n Results
Timely initiation of breastfeeding Children 0-23 months 477 234 49.0%
Exclusive breastfeeding Infants 0-5 months 91 47 51.6%
Continued breastfeeding at one year Children 12–15 months 98 79 80.6%
Continued breastfeeding at two years Children 20-23 months 59 44 74.6%
While asking questions about breastfeeding practices, caregivers of infants 0-5 months were also asked if
the infant had consumed liquids or soft, semi-soft, or solid foods in the past day. Figure 6 below presents the
liquids most frequently displacing breastmilk in this population. 18 at 19.8% was the most frequently fed
Solid, semi-solid, or soft foods, followed by 14 at 15.4% and 13 at 14.3% water and formula milks.
Figure 7: Liquids or Food Consumed by Infants 0-5 Months
7.9. Child Immunization Status
In Kandahar the results indicated that 62.3% of children 18-59 months had received the second dose measles
immunization, as confirmed by either vaccination card or caregiver recall.
15.4%
14.3%
9.9%
4.4%
9.9%
3.3%
3.3%
26.4%
19.8%
0% 5% 10% 15% 20% 25% 30%
Water
Formula
Milk
Juice
Broth
Yogurt
Thin porridge
Other liquids
Food (any)
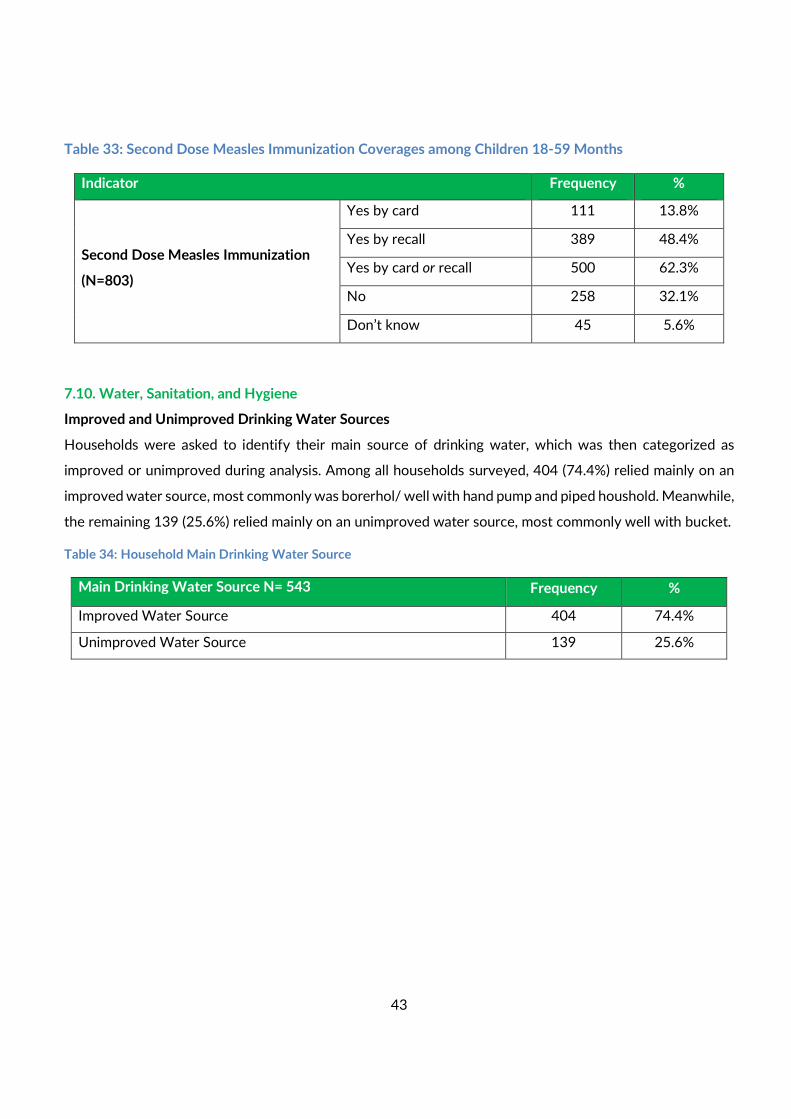
43
Table 33: Second Dose Measles Immunization Coverages among Children 18-59 Months
Indicator Frequency %
Second Dose Measles Immunization
(N=803)
Yes by card 111 13.8%
Yes by recall 389 48.4%
Yes by card or recall 500 62.3%
No 258 32.1%
Don’t know 45 5.6%
7.10. Water, Sanitation, and Hygiene
Improved and Unimproved Drinking Water Sources
Households were asked to identify their main source of drinking water, which was then categorized as
improved or unimproved during analysis. Among all households surveyed, 404 (74.4%) relied mainly on an
improved water source, most commonly was borerhol/ well with hand pump and piped houshold. Meanwhile,
the remaining 139 (25.6%) relied mainly on an unimproved water source, most commonly well with bucket.
Table 34: Household Main Drinking Water Source
Main Drinking Water Source N= 543 Frequency %
Improved Water Source 404 74.4%
Unimproved Water Source 139 25.6%
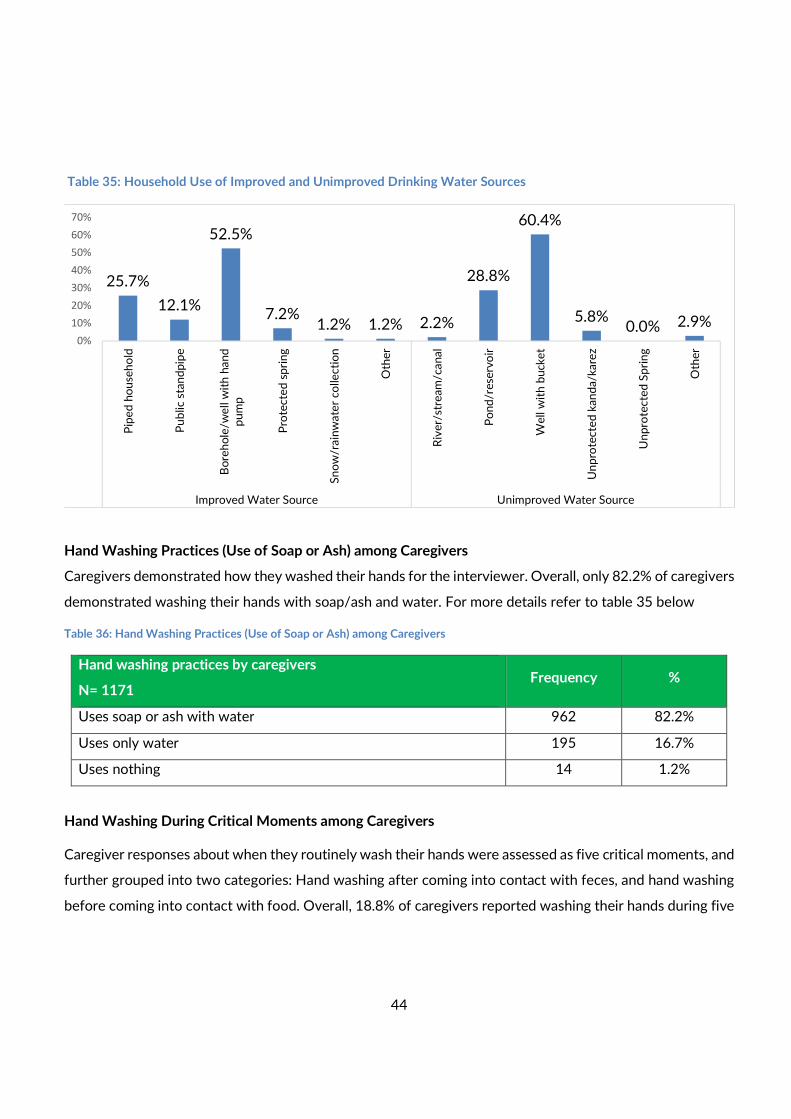
44
Table 35: Household Use of Improved and Unimproved Drinking Water Sources
Hand Washing Practices (Use of Soap or Ash) among Caregivers
Caregivers demonstrated how they washed their hands for the interviewer. Overall, only 82.2% of caregivers
demonstrated washing their hands with soap/ash and water. For more details refer to table 35 below
Table 36: Hand Washing Practices (Use of Soap or Ash) among Caregivers
Hand washing practices by caregivers
N= 1171 Frequency %
Uses soap or ash with water 962 82.2%
Uses only water 195 16.7%
Uses nothing 14 1.2%
Hand Washing During Critical Moments among Caregivers
Caregiver responses about when they routinely wash their hands were assessed as five critical moments, and
further grouped into two categories: Hand washing after coming into contact with feces, and hand washing
before coming into contact with food. Overall, 18.8% of caregivers reported washing their hands during five
25.7%
12.1%
52.5%
7.2%1.2% 1.2% 2.2%
28.8%
60.4%
5.8%0.0% 2.9%
0%
10%
20%
30%
40%
50%
60%
70%
Pip
ed
ho
use
ho
ld
Pu
blic
stan
dp
ipe
Bo
reh
ole
/we
ll w
ith
han
d
pu
mp
Pro
tecte
d s
pri
ng
Sn
ow
/rain
wate
r co
llecti
on
Oth
er
Riv
er/
stre
am
/can
al
Po
nd
/re
serv
oir
We
ll w
ith
bu
cke
t
Un
pro
tecte
d k
an
da/k
are
z
Un
pro
tecte
d S
pri
ng
Oth
er
Improved Water Source Unimproved Water Source
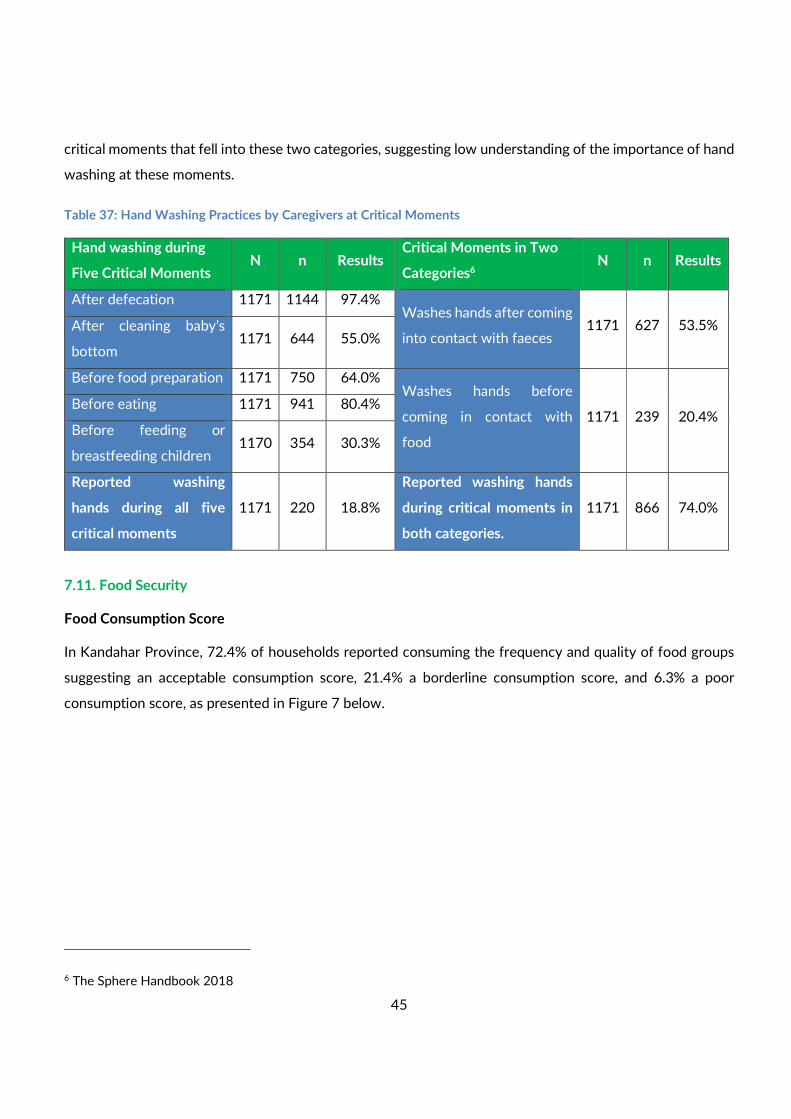
45
critical moments that fell into these two categories, suggesting low understanding of the importance of hand
washing at these moments.
Table 37: Hand Washing Practices by Caregivers at Critical Moments
Hand washing during
Five Critical Moments N n Results
Critical Moments in Two
Categories6 N n Results
After defecation 1171 1144 97.4% Washes hands after coming
into contact with faeces 1171 627 53.5% After cleaning baby’s
bottom 1171 644 55.0%
Before food preparation 1171 750 64.0% Washes hands before
coming in contact with
food
1171 239 20.4% Before eating 1171 941 80.4%
Before feeding or
breastfeeding children 1170 354 30.3%
Reported washing
hands during all five
critical moments
1171 220 18.8%
Reported washing hands
during critical moments in
both categories.
1171 866 74.0%
7.11. Food Security
Food Consumption Score
In Kandahar Province, 72.4% of households reported consuming the frequency and quality of food groups
suggesting an acceptable consumption score, 21.4% a borderline consumption score, and 6.3% a poor
consumption score, as presented in Figure 7 below.
6 The Sphere Handbook 2018
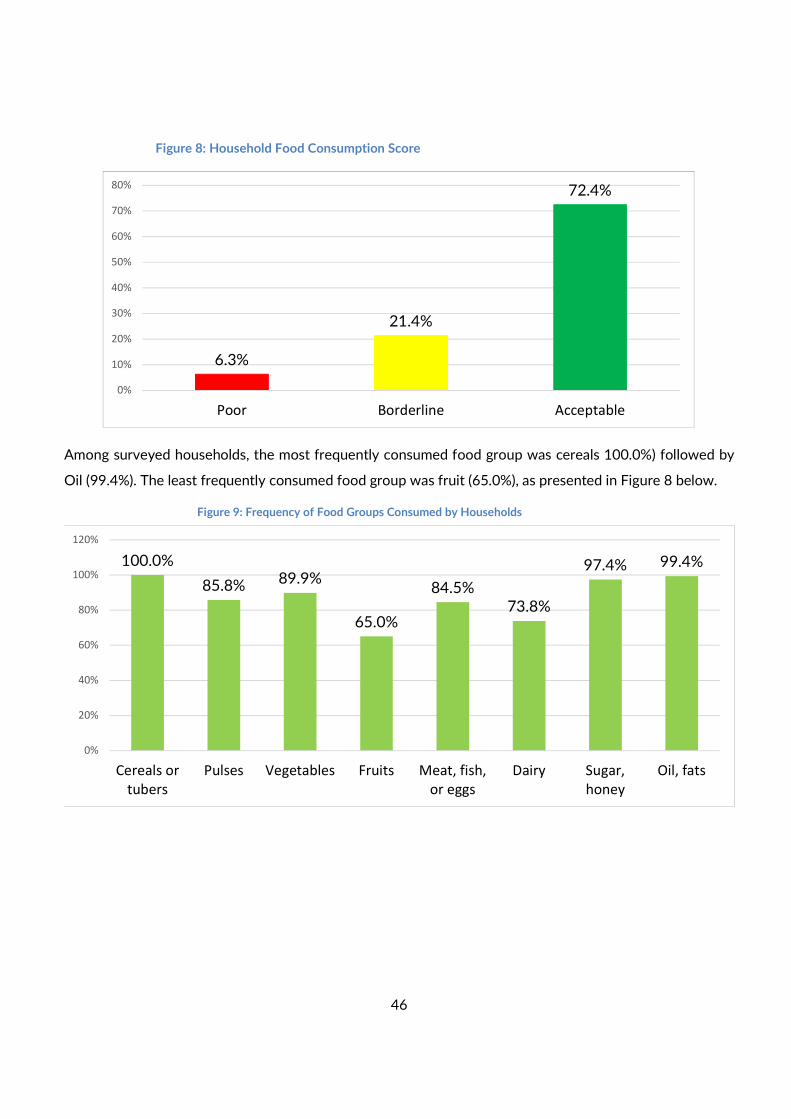
46
Figure 8: Household Food Consumption Score
Among surveyed households, the most frequently consumed food group was cereals 100.0%) followed by
Oil (99.4%). The least frequently consumed food group was fruit (65.0%), as presented in Figure 8 below.
Figure 9: Frequency of Food Groups Consumed by Households
6.3%
21.4%
72.4%
0%
10%
20%
30%
40%
50%
60%
70%
80%
Poor Borderline Acceptable
100.0%
85.8% 89.9%
65.0%
84.5%
73.8%
97.4% 99.4%
0%
20%
40%
60%
80%
100%
120%
Cereals or
tubers
Pulses Vegetables Fruits Meat, fish,
or eggs
Dairy Sugar,
honey
Oil, fats
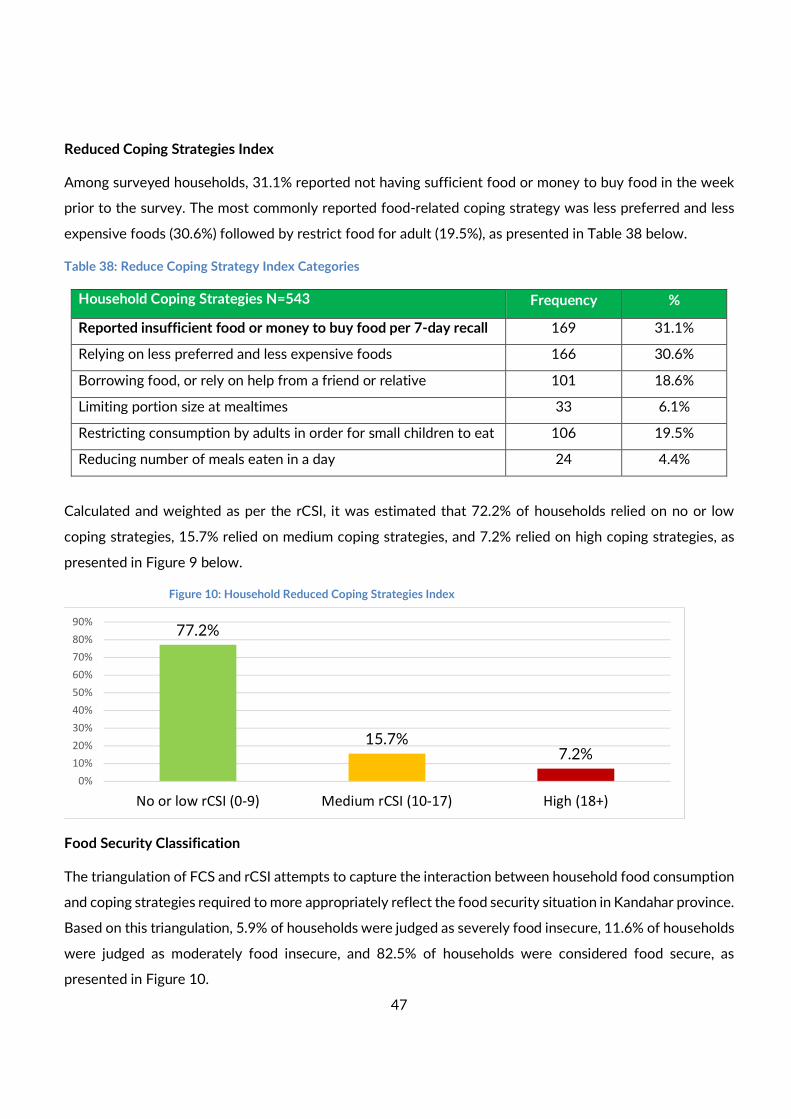
47
Reduced Coping Strategies Index
Among surveyed households, 31.1% reported not having sufficient food or money to buy food in the week
prior to the survey. The most commonly reported food-related coping strategy was less preferred and less
expensive foods (30.6%) followed by restrict food for adult (19.5%), as presented in Table 38 below.
Table 38: Reduce Coping Strategy Index Categories
Household Coping Strategies N=543 Frequency %
Reported insufficient food or money to buy food per 7-day recall 169 31.1%
Relying on less preferred and less expensive foods 166 30.6%
Borrowing food, or rely on help from a friend or relative 101 18.6%
Limiting portion size at mealtimes 33 6.1%
Restricting consumption by adults in order for small children to eat 106 19.5%
Reducing number of meals eaten in a day 24 4.4%
Calculated and weighted as per the rCSI, it was estimated that 72.2% of households relied on no or low
coping strategies, 15.7% relied on medium coping strategies, and 7.2% relied on high coping strategies, as
presented in Figure 9 below.
Figure 10: Household Reduced Coping Strategies Index
Food Security Classification
The triangulation of FCS and rCSI attempts to capture the interaction between household food consumption
and coping strategies required to more appropriately reflect the food security situation in Kandahar province.
Based on this triangulation, 5.9% of households were judged as severely food insecure, 11.6% of households
were judged as moderately food insecure, and 82.5% of households were considered food secure, as
presented in Figure 10.
77.2%
15.7%7.2%
0%
10%
20%
30%
40%
50%
60%
70%
80%
90%
No or low rCSI (0-9) Medium rCSI (10-17) High (18+)
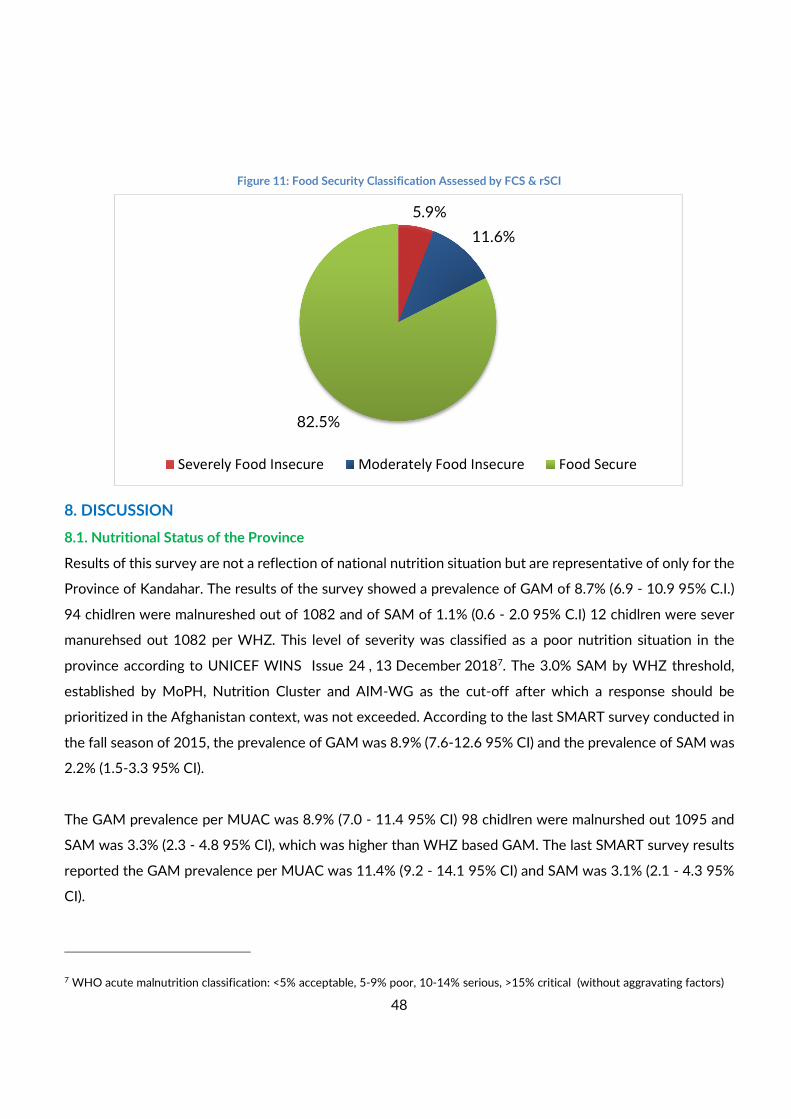
48
Figure 11: Food Security Classification Assessed by FCS & rSCI
8. DISCUSSION
8.1. Nutritional Status of the Province
Results of this survey are not a reflection of national nutrition situation but are representative of only for the
Province of Kandahar. The results of the survey showed a prevalence of GAM of 8.7% (6.9 - 10.9 95% C.I.)
94 chidlren were malnureshed out of 1082 and of SAM of 1.1% (0.6 - 2.0 95% C.I) 12 chidlren were sever
manurehsed out 1082 per WHZ. This level of severity was classified as a poor nutrition situation in the
province according to UNICEF WINS Issue 24 , 13 December 20187. The 3.0% SAM by WHZ threshold,
established by MoPH, Nutrition Cluster and AIM-WG as the cut-off after which a response should be
prioritized in the Afghanistan context, was not exceeded. According to the last SMART survey conducted in
the fall season of 2015, the prevalence of GAM was 8.9% (7.6-12.6 95% CI) and the prevalence of SAM was
2.2% (1.5-3.3 95% CI).
The GAM prevalence per MUAC was 8.9% (7.0 - 11.4 95% CI) 98 chidlren were malnurshed out 1095 and
SAM was 3.3% (2.3 - 4.8 95% CI), which was higher than WHZ based GAM. The last SMART survey results
reported the GAM prevalence per MUAC was 11.4% (9.2 - 14.1 95% CI) and SAM was 3.1% (2.1 - 4.3 95%
CI).
7 WHO acute malnutrition classification: <5% acceptable, 5-9% poor, 10-14% serious, >15% critical (without aggravating factors)
5.9%
11.6%
82.5%
Severely Food Insecure Moderately Food Insecure Food Secure
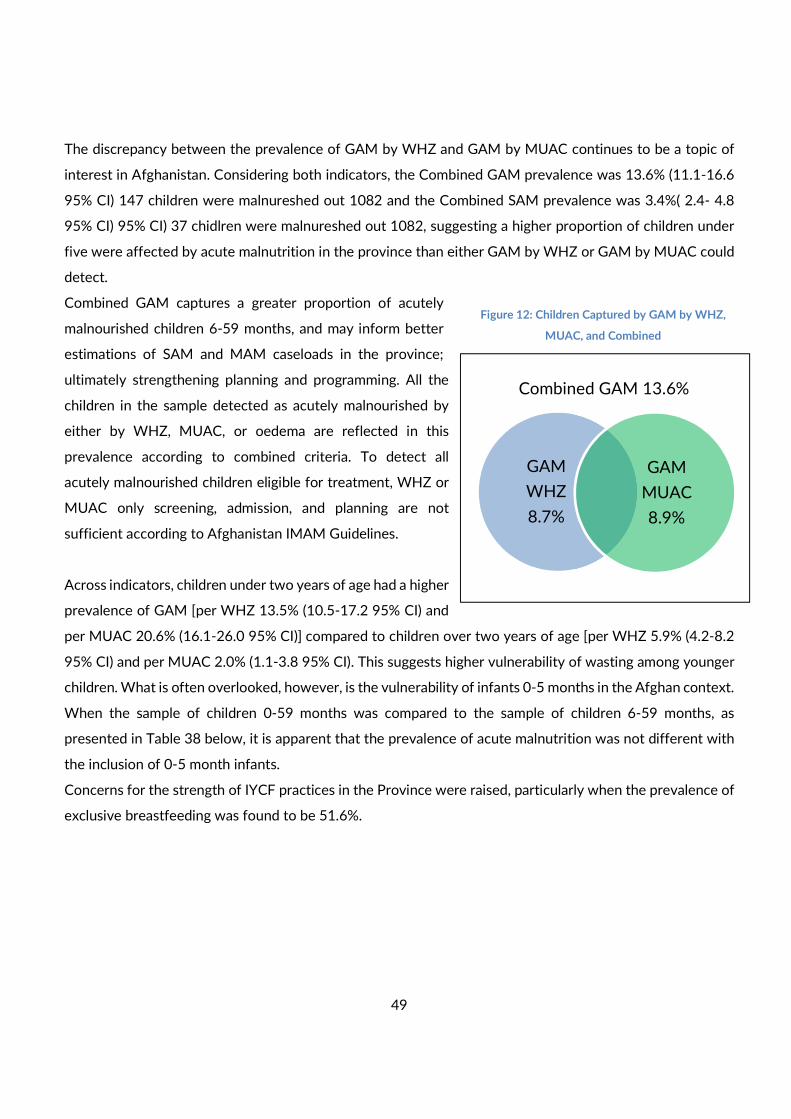
49
The discrepancy between the prevalence of GAM by WHZ and GAM by MUAC continues to be a topic of
interest in Afghanistan. Considering both indicators, the Combined GAM prevalence was 13.6% (11.1-16.6
95% CI) 147 children were malnureshed out 1082 and the Combined SAM prevalence was 3.4%( 2.4- 4.8
95% CI) 95% CI) 37 chidlren were malnureshed out 1082, suggesting a higher proportion of children under
five were affected by acute malnutrition in the province than either GAM by WHZ or GAM by MUAC could
detect.
Combined GAM captures a greater proportion of acutely
malnourished children 6-59 months, and may inform better
estimations of SAM and MAM caseloads in the province;
ultimately strengthening planning and programming. All the
children in the sample detected as acutely malnourished by
either by WHZ, MUAC, or oedema are reflected in this
prevalence according to combined criteria. To detect all
acutely malnourished children eligible for treatment, WHZ or
MUAC only screening, admission, and planning are not
sufficient according to Afghanistan IMAM Guidelines.
Across indicators, children under two years of age had a higher
prevalence of GAM [per WHZ 13.5% (10.5-17.2 95% CI) and
per MUAC 20.6% (16.1-26.0 95% CI)] compared to children over two years of age [per WHZ 5.9% (4.2-8.2
95% CI) and per MUAC 2.0% (1.1-3.8 95% CI). This suggests higher vulnerability of wasting among younger
children. What is often overlooked, however, is the vulnerability of infants 0-5 months in the Afghan context.
When the sample of children 0-59 months was compared to the sample of children 6-59 months, as
presented in Table 38 below, it is apparent that the prevalence of acute malnutrition was not different with
the inclusion of 0-5 month infants.
Concerns for the strength of IYCF practices in the Province were raised, particularly when the prevalence of
exclusive breastfeeding was found to be 51.6%.
GAM
WHZ
8.7%
GAM
MUAC
8.9%
Combined GAM 13.6%
Figure 12: Children Captured by GAM by WHZ,
MUAC, and Combined
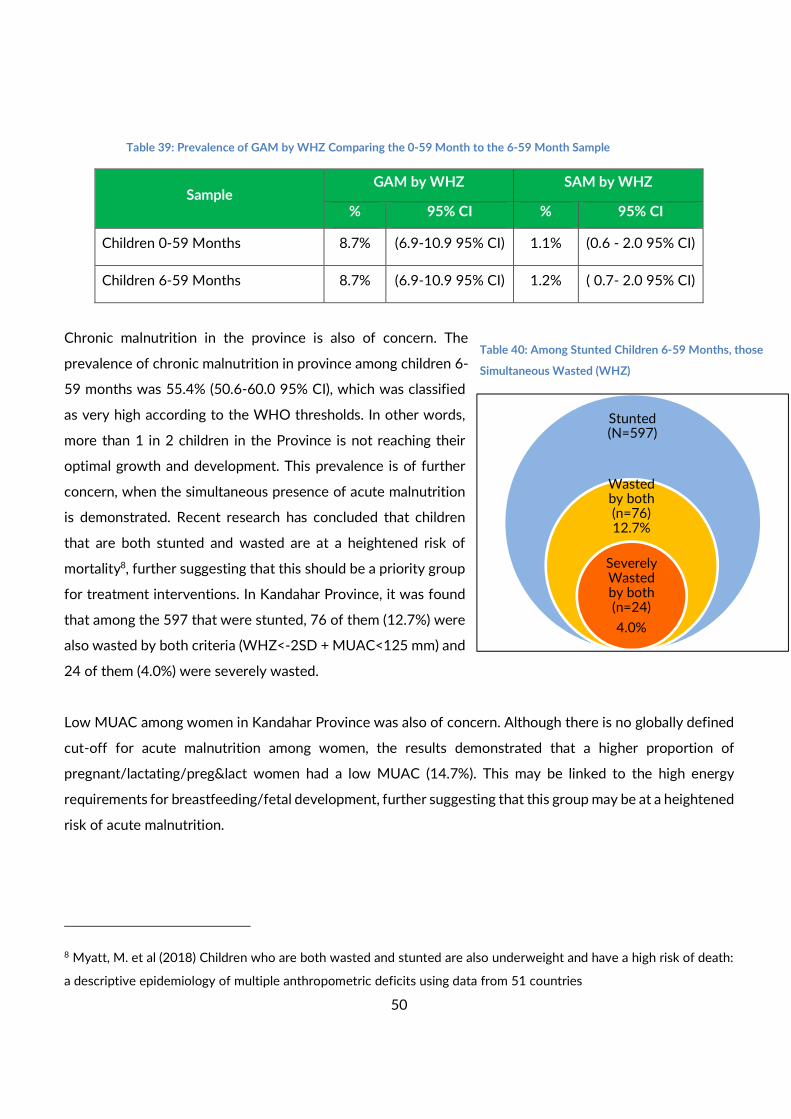
50
Table 39: Prevalence of GAM by WHZ Comparing the 0-59 Month to the 6-59 Month Sample
Sample GAM by WHZ SAM by WHZ
% 95% CI % 95% CI
Children 0-59 Months 8.7% (6.9-10.9 95% CI) 1.1% (0.6 - 2.0 95% CI)
Children 6-59 Months 8.7% (6.9-10.9 95% CI) 1.2% ( 0.7- 2.0 95% CI)
Chronic malnutrition in the province is also of concern. The
prevalence of chronic malnutrition in province among children 6-
59 months was 55.4% (50.6-60.0 95% CI), which was classified
as very high according to the WHO thresholds. In other words,
more than 1 in 2 children in the Province is not reaching their
optimal growth and development. This prevalence is of further
concern, when the simultaneous presence of acute malnutrition
is demonstrated. Recent research has concluded that children
that are both stunted and wasted are at a heightened risk of
mortality8, further suggesting that this should be a priority group
for treatment interventions. In Kandahar Province, it was found
that among the 597 that were stunted, 76 of them (12.7%) were
also wasted by both criteria (WHZ<-2SD + MUAC<125 mm) and
24 of them (4.0%) were severely wasted.
Low MUAC among women in Kandahar Province was also of concern. Although there is no globally defined
cut-off for acute malnutrition among women, the results demonstrated that a higher proportion of
pregnant/lactating/preg&lact women had a low MUAC (14.7%). This may be linked to the high energy
requirements for breastfeeding/fetal development, further suggesting that this group may be at a heightened
risk of acute malnutrition.
8 Myatt, M. et al (2018) Children who are both wasted and stunted are also underweight and have a high risk of death:
a descriptive epidemiology of multiple anthropometric deficits using data from 51 countries
Stunted (N=597)
Wasted by both (n=76) 12.7%
Severely Wasted by both (n=24)
4.0%
Table 40: Among Stunted Children 6-59 Months, those
Simultaneous Wasted (WHZ)
51
8.2. Additional Indicators
Food security exists when all people, at all times have physical, social and economic access to sufficient, safe
and nutritious food for a healthy and active life. In Kandahar Province, the FCS and rCSI were triangulated
to provide an indication of food security at the household level. The results indicated that 95 out of 543
households were moderately or severely food insecure. Further, based on household level assessment of
water source, 404 out of 543 households were accessing an unimproved water source as their main source
of drinking water. Considering second dose measles immunization as a proxy for immunisation status and
access to healthcare, it was found that only 500 in 803 children 18-59 months had received this service.
Although these serve only as proxy indicators for child nutrition and health, these findings indicate a
challenging environment for child growth and development.
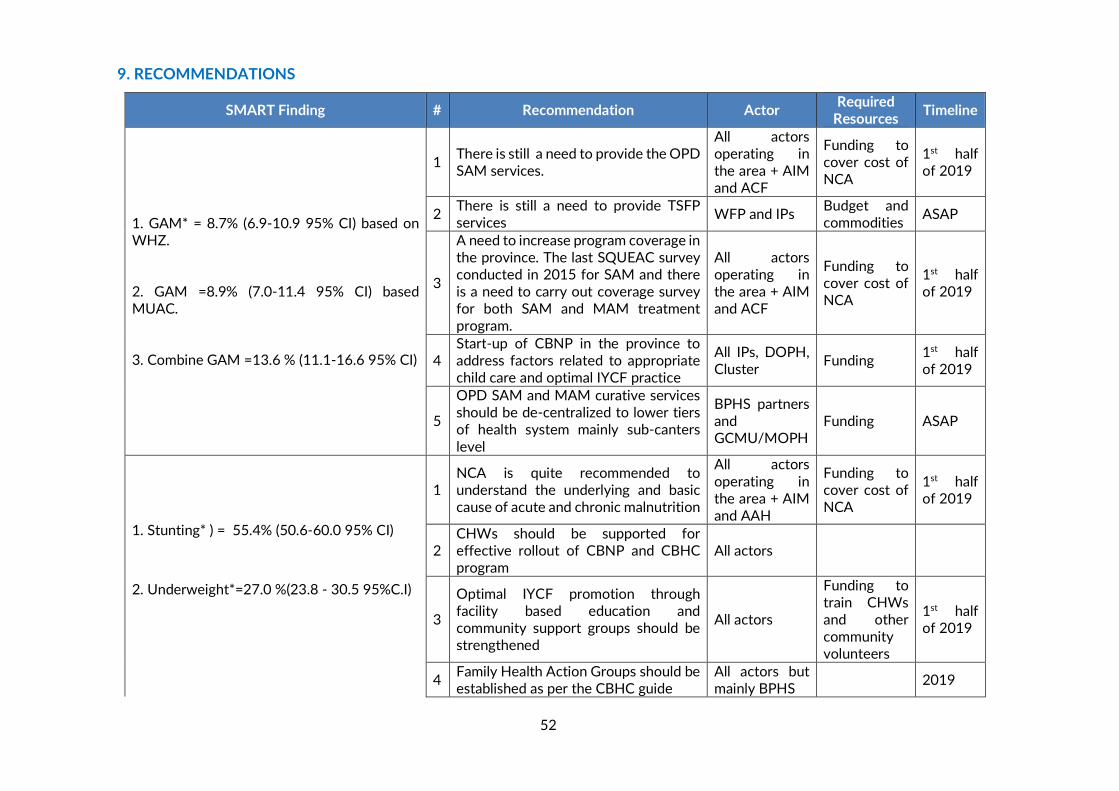
52
9. RECOMMENDATIONS
SMART Finding # Recommendation Actor Required
Resources Timeline
1. GAM* = 8.7% (6.9-10.9 95% CI) based on WHZ. 2. GAM =8.9% (7.0-11.4 95% CI) based MUAC. 3. Combine GAM =13.6 % (11.1-16.6 95% CI)
1 There is still a need to provide the OPD SAM services.
All actors operating in the area + AIM and ACF
Funding to cover cost of NCA
1st half of 2019
2 There is still a need to provide TSFP services
WFP and IPs Budget and commodities
ASAP
3
A need to increase program coverage in the province. The last SQUEAC survey conducted in 2015 for SAM and there is a need to carry out coverage survey for both SAM and MAM treatment program.
All actors operating in the area + AIM and ACF
Funding to cover cost of NCA
1st half of 2019
4 Start-up of CBNP in the province to address factors related to appropriate child care and optimal IYCF practice
All IPs, DOPH, Cluster
Funding 1st half of 2019
5
OPD SAM and MAM curative services should be de-centralized to lower tiers of health system mainly sub-canters
level
BPHS partners and GCMU/MOPH
Funding ASAP
1. Stunting* ) = 55.4% (50.6-60.0 95% CI)
2. Underweight*=27.0 %(23.8 - 30.5 95%C.I)
1 NCA is quite recommended to understand the underlying and basic cause of acute and chronic malnutrition
All actors
operating in the area + AIM and AAH
Funding to cover cost of NCA
1st half of 2019
2 CHWs should be supported for effective rollout of CBNP and CBHC program
All actors
3
Optimal IYCF promotion through facility based education and community support groups should be strengthened
All actors
Funding to train CHWs and other community volunteers
1st half of 2019
4 Family Health Action Groups should be established as per the CBHC guide
All actors but mainly BPHS
2019
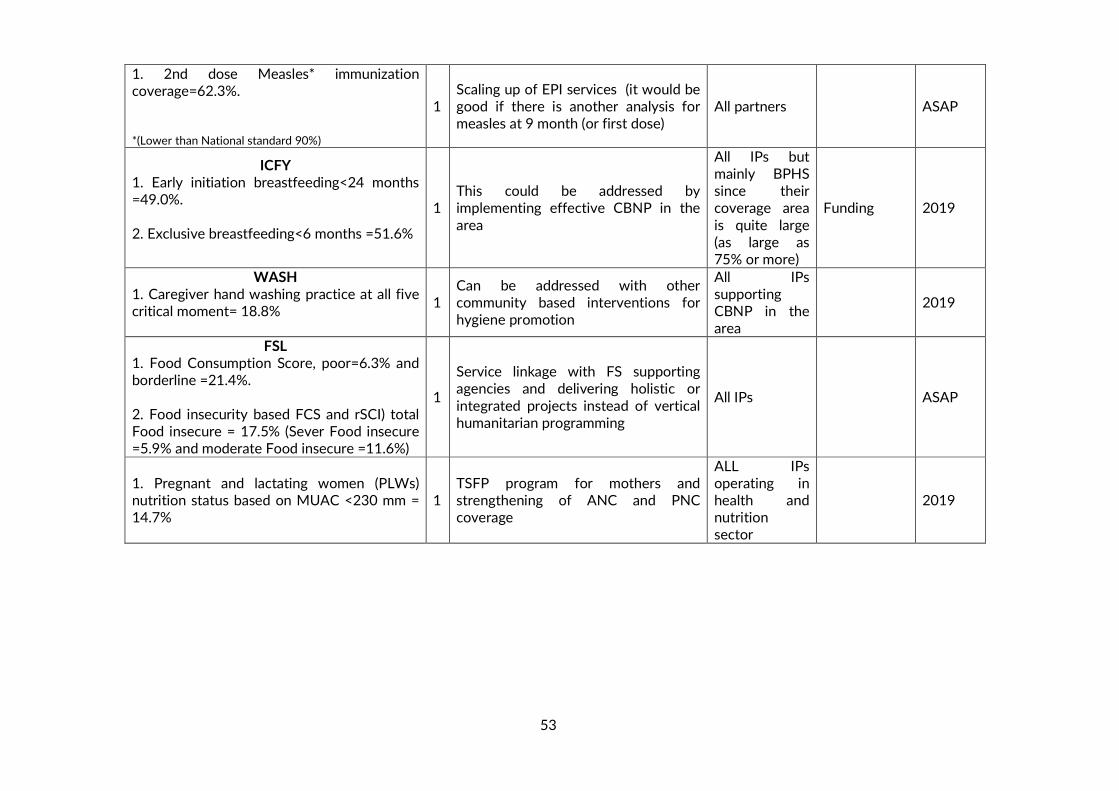
53
1. 2nd dose Measles* immunization coverage=62.3%. *(Lower than National standard 90%)
1 Scaling up of EPI services (it would be good if there is another analysis for measles at 9 month (or first dose)
All partners ASAP
ICFY 1. Early initiation breastfeeding<24 months =49.0%. 2. Exclusive breastfeeding<6 months =51.6%
1 This could be addressed by implementing effective CBNP in the
area
All IPs but mainly BPHS since their coverage area
is quite large (as large as 75% or more)
Funding 2019
WASH 1. Caregiver hand washing practice at all five critical moment= 18.8%
1 Can be addressed with other community based interventions for hygiene promotion
All IPs supporting CBNP in the area
2019
FSL 1. Food Consumption Score, poor=6.3% and borderline =21.4%. 2. Food insecurity based FCS and rSCI) total Food insecure = 17.5% (Sever Food insecure =5.9% and moderate Food insecure =11.6%)
1
Service linkage with FS supporting agencies and delivering holistic or
integrated projects instead of vertical humanitarian programming
All IPs ASAP
1. Pregnant and lactating women (PLWs) nutrition status based on MUAC <230 mm = 14.7%
1 TSFP program for mothers and strengthening of ANC and PNC coverage
ALL IPs operating in health and nutrition sector
2019
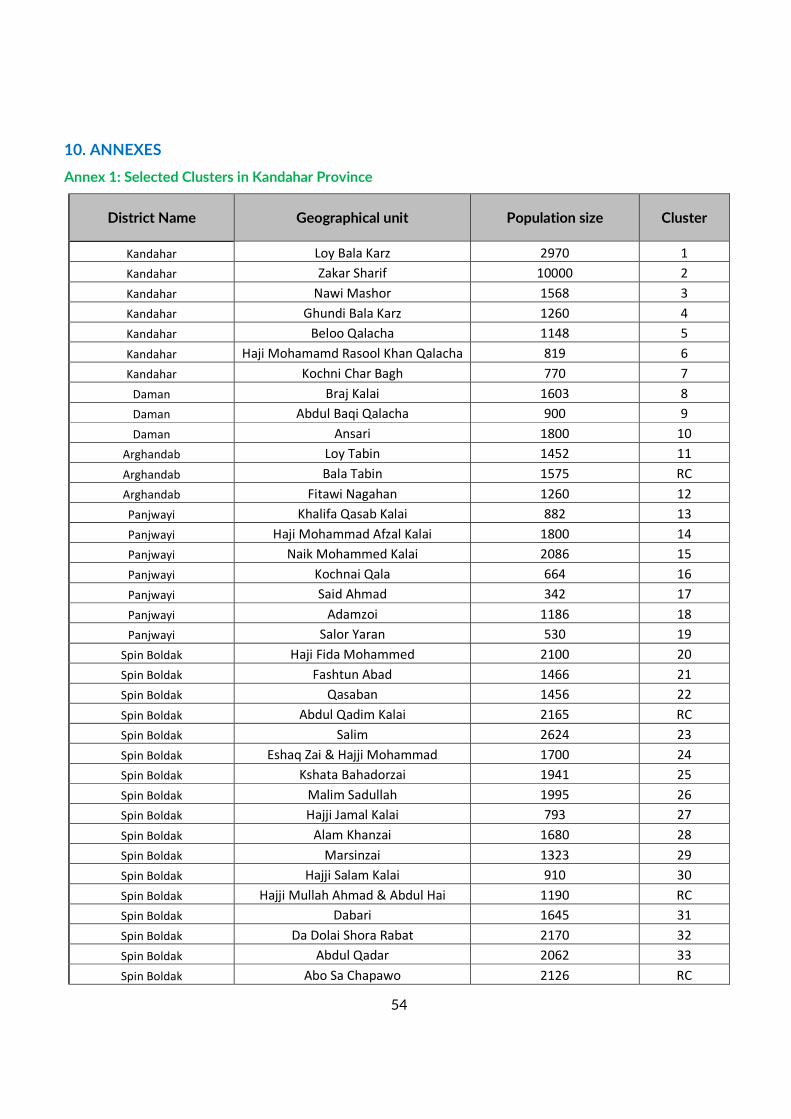
54
10. ANNEXES
Annex 1: Selected Clusters in Kandahar Province
District Name Geographical unit Population size Cluster
Kandahar Loy Bala Karz 2970 1
Kandahar Zakar Sharif 10000 2
Kandahar Nawi Mashor 1568 3
Kandahar Ghundi Bala Karz 1260 4
Kandahar Beloo Qalacha 1148 5
Kandahar Haji Mohamamd Rasool Khan Qalacha 819 6
Kandahar Kochni Char Bagh 770 7
Daman Braj Kalai 1603 8
Daman Abdul Baqi Qalacha 900 9
Daman Ansari 1800 10
Arghandab Loy Tabin 1452 11
Arghandab Bala Tabin 1575 RC
Arghandab Fitawi Nagahan 1260 12
Panjwayi Khalifa Qasab Kalai 882 13
Panjwayi Haji Mohammad Afzal Kalai 1800 14
Panjwayi Naik Mohammed Kalai 2086 15
Panjwayi Kochnai Qala 664 16
Panjwayi Said Ahmad 342 17
Panjwayi Adamzoi 1186 18
Panjwayi Salor Yaran 530 19
Spin Boldak Haji Fida Mohammed 2100 20
Spin Boldak Fashtun Abad 1466 21
Spin Boldak Qasaban 1456 22
Spin Boldak Abdul Qadim Kalai 2165 RC
Spin Boldak Salim 2624 23
Spin Boldak Eshaq Zai & Hajji Mohammad 1700 24
Spin Boldak Kshata Bahadorzai 1941 25
Spin Boldak Malim Sadullah 1995 26
Spin Boldak Hajji Jamal Kalai 793 27
Spin Boldak Alam Khanzai 1680 28
Spin Boldak Marsinzai 1323 29
Spin Boldak Hajji Salam Kalai 910 30
Spin Boldak Hajji Mullah Ahmad & Abdul Hai 1190 RC
Spin Boldak Dabari 1645 31
Spin Boldak Da Dolai Shora Rabat 2170 32
Spin Boldak Abdul Qadar 2062 33
Spin Boldak Abo Sa Chapawo 2126 RC
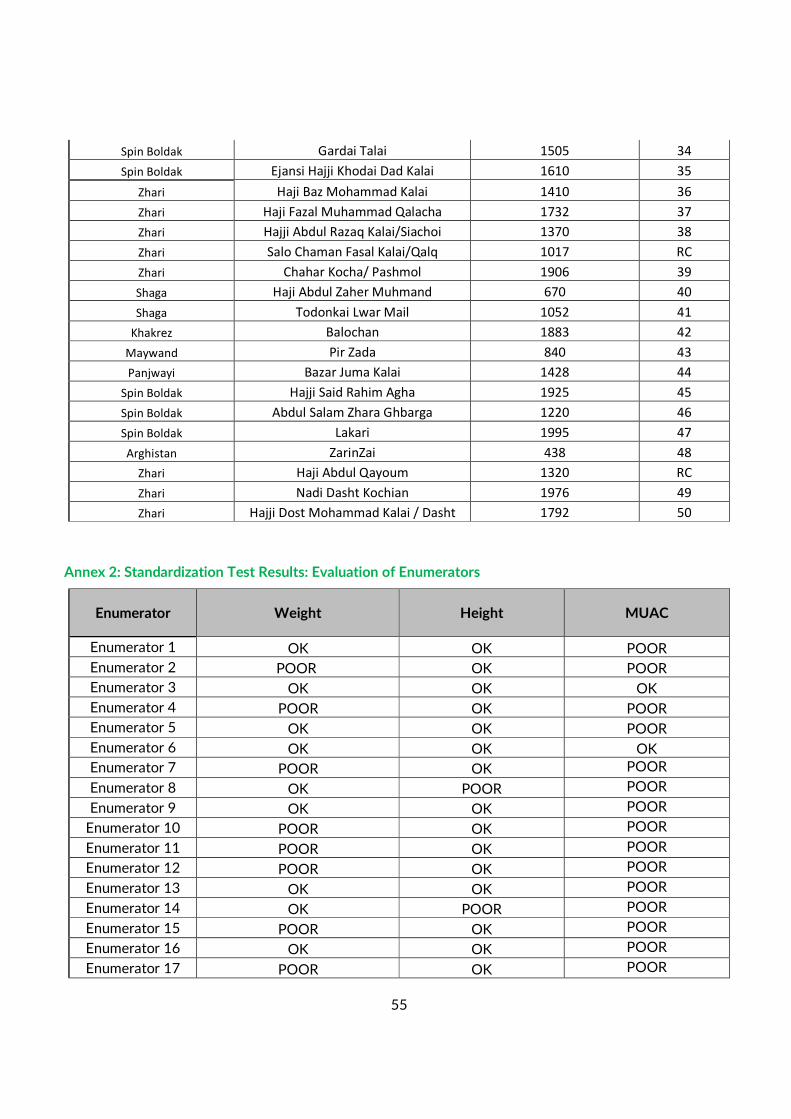
55
Spin Boldak Gardai Talai 1505 34
Spin Boldak Ejansi Hajji Khodai Dad Kalai 1610 35
Zhari Haji Baz Mohammad Kalai 1410 36
Zhari Haji Fazal Muhammad Qalacha 1732 37
Zhari Hajji Abdul Razaq Kalai/Siachoi 1370 38
Zhari Salo Chaman Fasal Kalai/Qalq 1017 RC
Zhari Chahar Kocha/ Pashmol 1906 39
Shaga Haji Abdul Zaher Muhmand 670 40
Shaga Todonkai Lwar Mail 1052 41
Khakrez Balochan 1883 42
Maywand Pir Zada 840 43
Panjwayi Bazar Juma Kalai 1428 44
Spin Boldak Hajji Said Rahim Agha 1925 45
Spin Boldak Abdul Salam Zhara Ghbarga 1220 46
Spin Boldak Lakari 1995 47
Arghistan ZarinZai 438 48
Zhari Haji Abdul Qayoum 1320 RC
Zhari Nadi Dasht Kochian 1976 49
Zhari Hajji Dost Mohammad Kalai / Dasht 1792 50
Annex 2: Standardization Test Results: Evaluation of Enumerators
Enumerator Weight Height MUAC
Enumerator 1 OK OK POOR
Enumerator 2 POOR OK POOR
Enumerator 3 OK OK OK
Enumerator 4 POOR OK POOR
Enumerator 5 OK OK POOR
Enumerator 6 OK OK OK
Enumerator 7 POOR OK POOR
Enumerator 8 OK POOR POOR
Enumerator 9 OK OK POOR
Enumerator 10 POOR OK POOR
Enumerator 11 POOR OK POOR
Enumerator 12 POOR OK POOR
Enumerator 13 OK OK POOR
Enumerator 14 OK POOR POOR
Enumerator 15 POOR OK POOR
Enumerator 16 OK OK POOR
Enumerator 17 POOR OK POOR
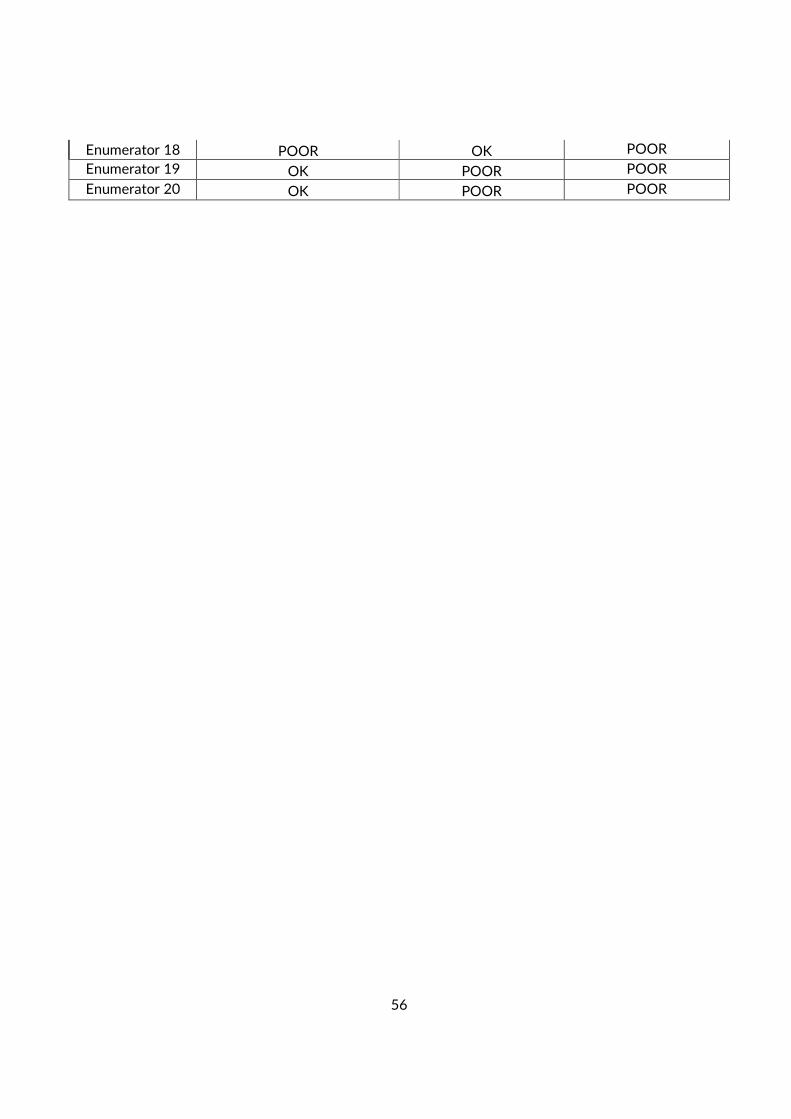
56
Enumerator 18 POOR OK POOR
Enumerator 19 OK POOR POOR
Enumerator 20 OK POOR POOR
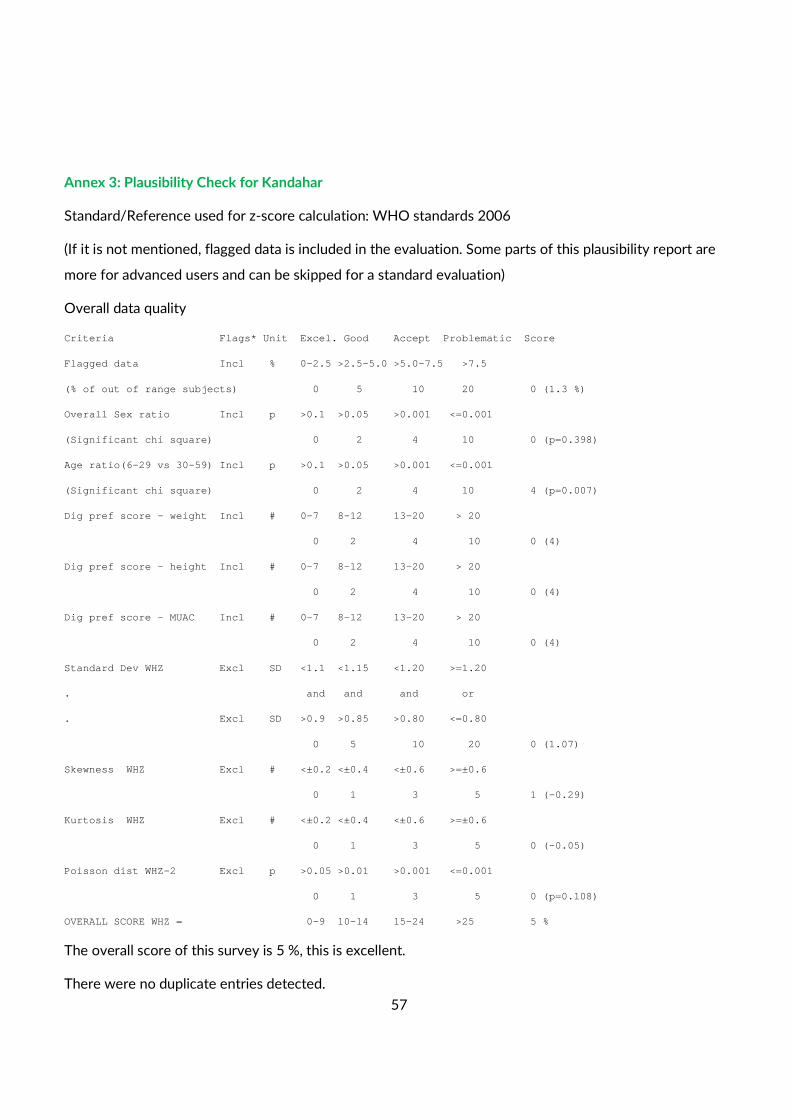
57
Annex 3: Plausibility Check for Kandahar
Standard/Reference used for z-score calculation: WHO standards 2006
(If it is not mentioned, flagged data is included in the evaluation. Some parts of this plausibility report are
more for advanced users and can be skipped for a standard evaluation)
Overall data quality
Criteria Flags* Unit Excel. Good Accept Problematic Score
Flagged data Incl % 0-2.5 >2.5-5. 0 >5.0-7.5 >7.5
(% of out of range subjects) 0 5 10 20 0 (1.3 %)
Overall Sex ratio Incl p >0.1 >0.05 >0.001 <=0.001
(Significant chi square) 0 2 4 10 0 (p=0.398)
Age ratio(6-29 vs 30-59) Incl p >0.1 >0.05 >0.001 <=0.001
(Significant chi square) 0 2 4 10 4 (p=0.007)
Dig pref score - weight Incl # 0-7 8-12 13-20 > 20
0 2 4 10 0 (4)
Dig pref score - height Incl # 0-7 8-12 13-20 > 20
0 2 4 10 0 (4)
Dig pref score - MUAC Incl # 0-7 8-12 13-20 > 20
0 2 4 10 0 (4)
Standard Dev WHZ Excl SD <1.1 <1.15 <1.20 >=1.20
. and and and or
. Excl SD >0.9 >0.85 >0.80 <=0.80
0 5 10 20 0 (1.07)
Skewness WHZ Excl # <±0.2 <±0.4 <±0.6 >=±0.6
0 1 3 5 1 (-0.29)
Kurtosis WHZ Excl # <±0.2 <±0.4 <±0.6 >=±0.6
0 1 3 5 0 (-0.05)
Poisson dist WHZ-2 Excl p >0.05 >0.01 >0.001 <=0.001
0 1 3 5 0 (p=0.108)
OVERALL SCORE WHZ = 0-9 10-14 15-24 >25 5 %
The overall score of this survey is 5 %, this is excellent.
There were no duplicate entries detected.

58
Percentage of children with no exact birthday: 97 %
Anthropometric Indices likely to be in error (-3 to 3 for WHZ, -3 to 3 for HAZ, -3 to 3 for WAZ, from
observed mean - chosen in Options panel - these values will be flagged and should be excluded from
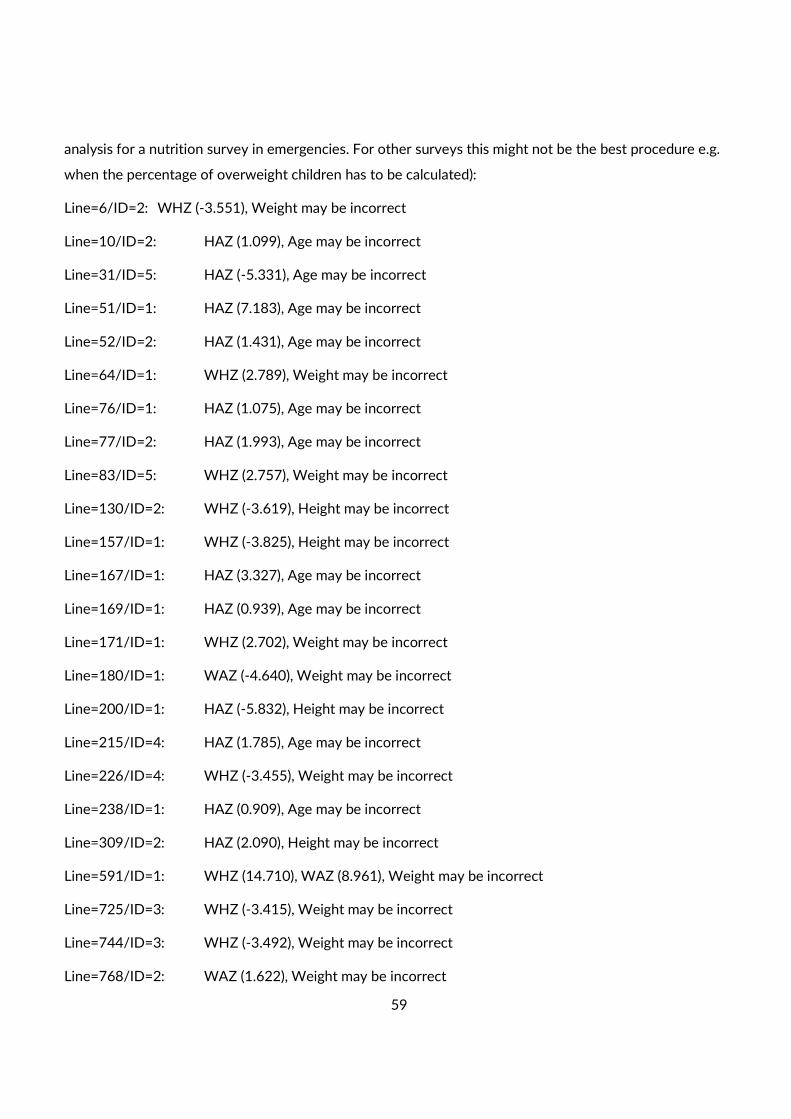
59
analysis for a nutrition survey in emergencies. For other surveys this might not be the best procedure e.g.
when the percentage of overweight children has to be calculated):
Line=6/ID=2: WHZ (-3.551), Weight may be incorrect
Line=10/ID=2: HAZ (1.099), Age may be incorrect
Line=31/ID=5: HAZ (-5.331), Age may be incorrect
Line=51/ID=1: HAZ (7.183), Age may be incorrect
Line=52/ID=2: HAZ (1.431), Age may be incorrect
Line=64/ID=1: WHZ (2.789), Weight may be incorrect
Line=76/ID=1: HAZ (1.075), Age may be incorrect
Line=77/ID=2: HAZ (1.993), Age may be incorrect
Line=83/ID=5: WHZ (2.757), Weight may be incorrect
Line=130/ID=2: WHZ (-3.619), Height may be incorrect
Line=157/ID=1: WHZ (-3.825), Height may be incorrect
Line=167/ID=1: HAZ (3.327), Age may be incorrect
Line=169/ID=1: HAZ (0.939), Age may be incorrect
Line=171/ID=1: WHZ (2.702), Weight may be incorrect
Line=180/ID=1: WAZ (-4.640), Weight may be incorrect
Line=200/ID=1: HAZ (-5.832), Height may be incorrect
Line=215/ID=4: HAZ (1.785), Age may be incorrect
Line=226/ID=4: WHZ (-3.455), Weight may be incorrect
Line=238/ID=1: HAZ (0.909), Age may be incorrect
Line=309/ID=2: HAZ (2.090), Height may be incorrect
Line=591/ID=1: WHZ (14.710), WAZ (8.961), Weight may be incorrect
Line=725/ID=3: WHZ (-3.415), Weight may be incorrect
Line=744/ID=3: WHZ (-3.492), Weight may be incorrect
Line=768/ID=2: WAZ (1.622), Weight may be incorrect
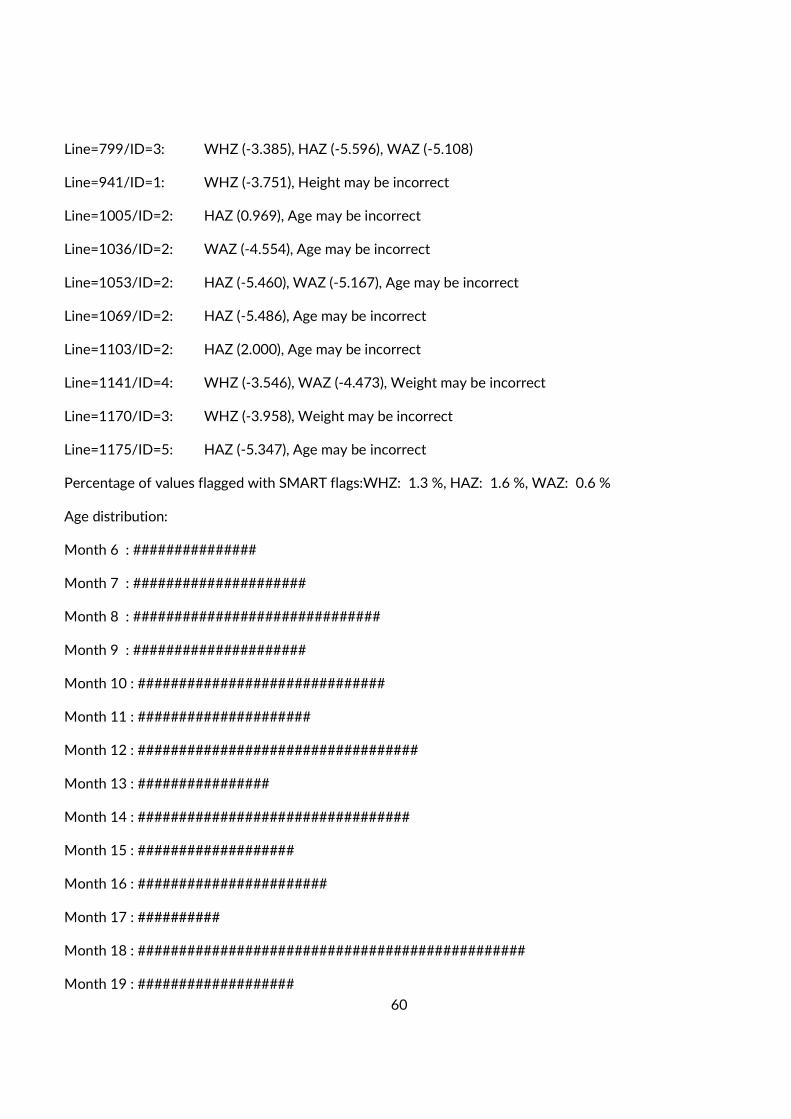
60
Line=799/ID=3: WHZ (-3.385), HAZ (-5.596), WAZ (-5.108)
Line=941/ID=1: WHZ (-3.751), Height may be incorrect
Line=1005/ID=2: HAZ (0.969), Age may be incorrect
Line=1036/ID=2: WAZ (-4.554), Age may be incorrect
Line=1053/ID=2: HAZ (-5.460), WAZ (-5.167), Age may be incorrect
Line=1069/ID=2: HAZ (-5.486), Age may be incorrect
Line=1103/ID=2: HAZ (2.000), Age may be incorrect
Line=1141/ID=4: WHZ (-3.546), WAZ (-4.473), Weight may be incorrect
Line=1170/ID=3: WHZ (-3.958), Weight may be incorrect
Line=1175/ID=5: HAZ (-5.347), Age may be incorrect
Percentage of values flagged with SMART flags:WHZ: 1.3 %, HAZ: 1.6 %, WAZ: 0.6 %
Age distribution:
Month 6 : ###############
Month 7 : #####################
Month 8 : ##############################
Month 9 : #####################
Month 10 : ##############################
Month 11 : #####################
Month 12 : ##################################
Month 13 : ################
Month 14 : #################################
Month 15 : ###################
Month 16 : #######################
Month 17 : ##########
Month 18 : ###############################################
Month 19 : ###################
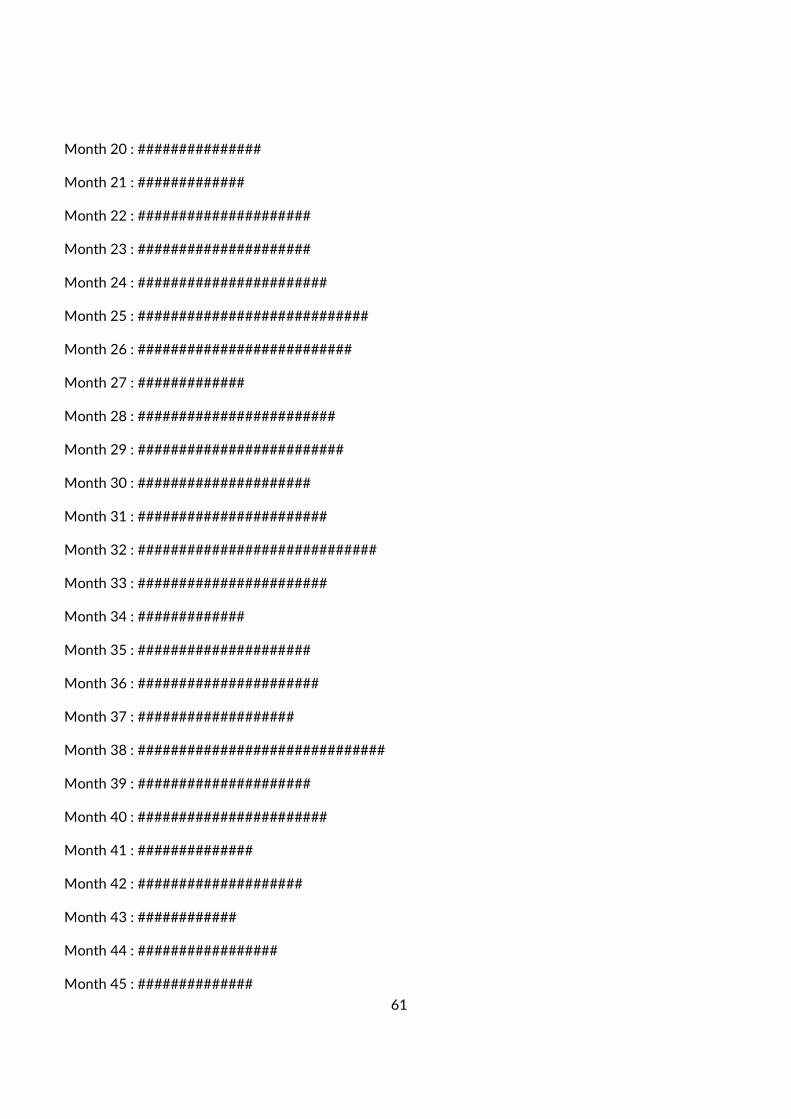
61
Month 20 : ###############
Month 21 : #############
Month 22 : #####################
Month 23 : #####################
Month 24 : #######################
Month 25 : ############################
Month 26 : ##########################
Month 27 : #############
Month 28 : ########################
Month 29 : #########################
Month 30 : #####################
Month 31 : #######################
Month 32 : #############################
Month 33 : #######################
Month 34 : #############
Month 35 : #####################
Month 36 : ######################
Month 37 : ###################
Month 38 : ##############################
Month 39 : #####################
Month 40 : #######################
Month 41 : ##############
Month 42 : ####################
Month 43 : ############
Month 44 : #################
Month 45 : ##############
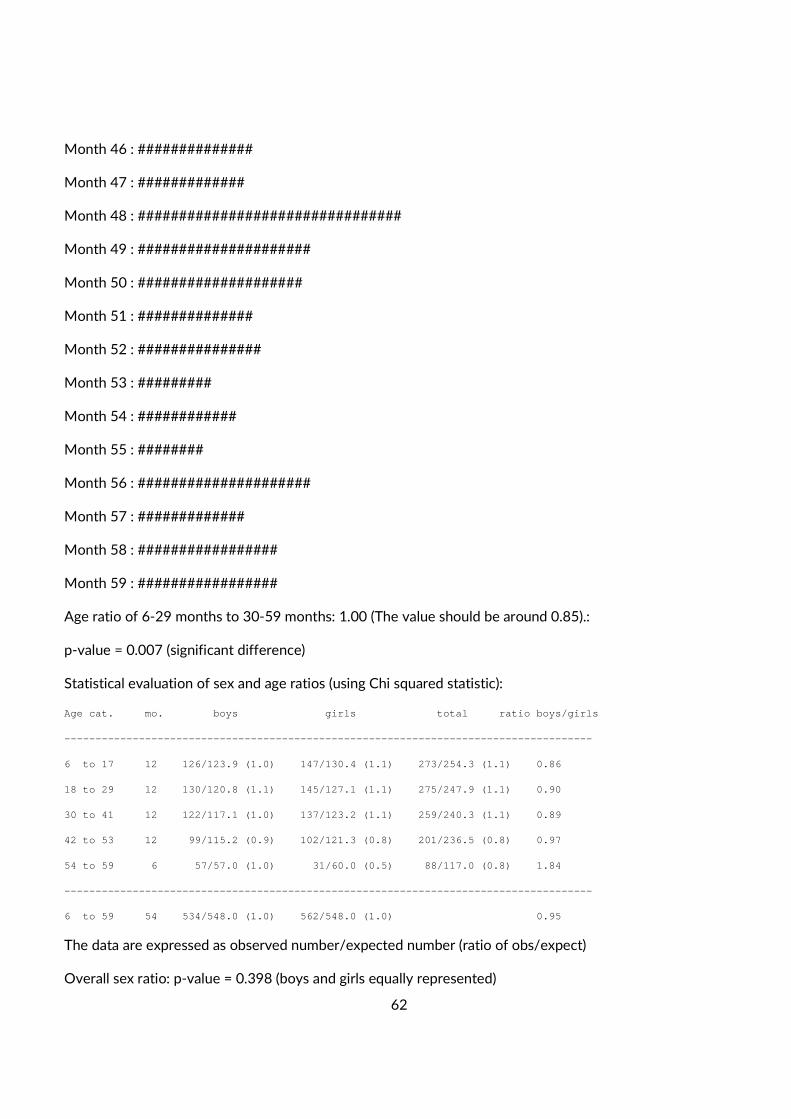
62
Month 46 : ##############
Month 47 : #############
Month 48 : ################################
Month 49 : #####################
Month 50 : ####################
Month 51 : ##############
Month 52 : ###############
Month 53 : #########
Month 54 : ############
Month 55 : ########
Month 56 : #####################
Month 57 : #############
Month 58 : #################
Month 59 : #################
Age ratio of 6-29 months to 30-59 months: 1.00 (The value should be around 0.85).:
p-value = 0.007 (significant difference)
Statistical evaluation of sex and age ratios (using Chi squared statistic):
Age cat. mo. boys girls total ratio boys/girls
--------------------------------------------------- ----------------------------------
6 to 17 12 126/123.9 (1.0) 147/130.4 (1. 1) 273/254.3 (1.1) 0.86
18 to 29 12 130/120.8 (1.1) 145/127.1 (1. 1) 275/247.9 (1.1) 0.90
30 to 41 12 122/117.1 (1.0) 137/123.2 (1. 1) 259/240.3 (1.1) 0.89
42 to 53 12 99/115.2 (0.9) 102/121.3 (0. 8) 201/236.5 (0.8) 0.97
54 to 59 6 57/57.0 (1.0) 31/60.0 (0. 5) 88/117.0 (0.8) 1.84
--------------------------------------------------- ----------------------------------
6 to 59 54 534/548.0 (1.0) 562/548.0 (1. 0) 0.95
The data are expressed as observed number/expected number (ratio of obs/expect)
Overall sex ratio: p-value = 0.398 (boys and girls equally represented)
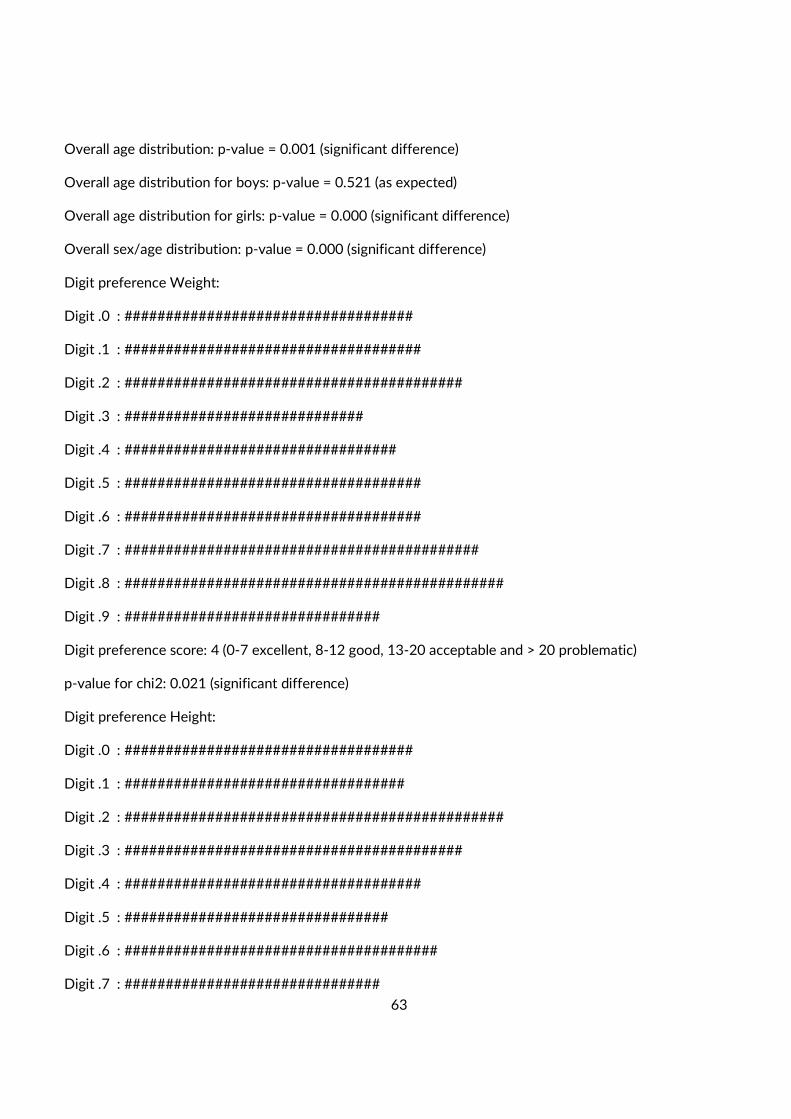
63
Overall age distribution: p-value = 0.001 (significant difference)
Overall age distribution for boys: p-value = 0.521 (as expected)
Overall age distribution for girls: p-value = 0.000 (significant difference)
Overall sex/age distribution: p-value = 0.000 (significant difference)
Digit preference Weight:
Digit .0 : ###################################
Digit .1 : ####################################
Digit .2 : #########################################
Digit .3 : #############################
Digit .4 : #################################
Digit .5 : ####################################
Digit .6 : ####################################
Digit .7 : ###########################################
Digit .8 : ##############################################
Digit .9 : ###############################
Digit preference score: 4 (0-7 excellent, 8-12 good, 13-20 acceptable and > 20 problematic)
p-value for chi2: 0.021 (significant difference)
Digit preference Height:
Digit .0 : ###################################
Digit .1 : ##################################
Digit .2 : ##############################################
Digit .3 : #########################################
Digit .4 : ####################################
Digit .5 : ################################
Digit .6 : ######################################
Digit .7 : ###############################
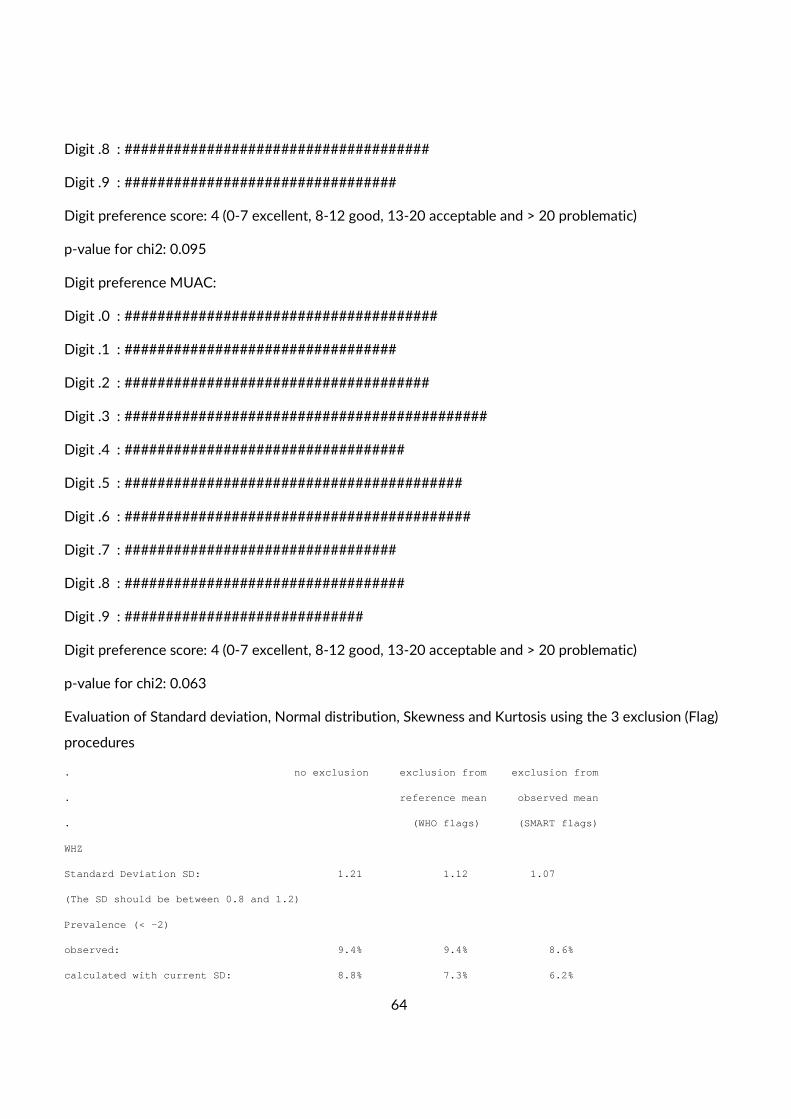
64
Digit .8 : #####################################
Digit .9 : #################################
Digit preference score: 4 (0-7 excellent, 8-12 good, 13-20 acceptable and > 20 problematic)
p-value for chi2: 0.095
Digit preference MUAC:
Digit .0 : ######################################
Digit .1 : #################################
Digit .2 : #####################################
Digit .3 : ############################################
Digit .4 : ##################################
Digit .5 : #########################################
Digit .6 : ##########################################
Digit .7 : #################################
Digit .8 : ##################################
Digit .9 : #############################
Digit preference score: 4 (0-7 excellent, 8-12 good, 13-20 acceptable and > 20 problematic)
p-value for chi2: 0.063
Evaluation of Standard deviation, Normal distribution, Skewness and Kurtosis using the 3 exclusion (Flag)
procedures
. no exclusion exclusion from exclusion from
. reference mean observed mean
. (WHO flags) (SMART flags)
WHZ
Standard Deviation SD: 1.21 1.12 1.07
(The SD should be between 0.8 and 1.2)
Prevalence (< -2)
observed: 9.4% 9.4% 8.6%
calculated with current SD: 8.8% 7.3% 6.2%
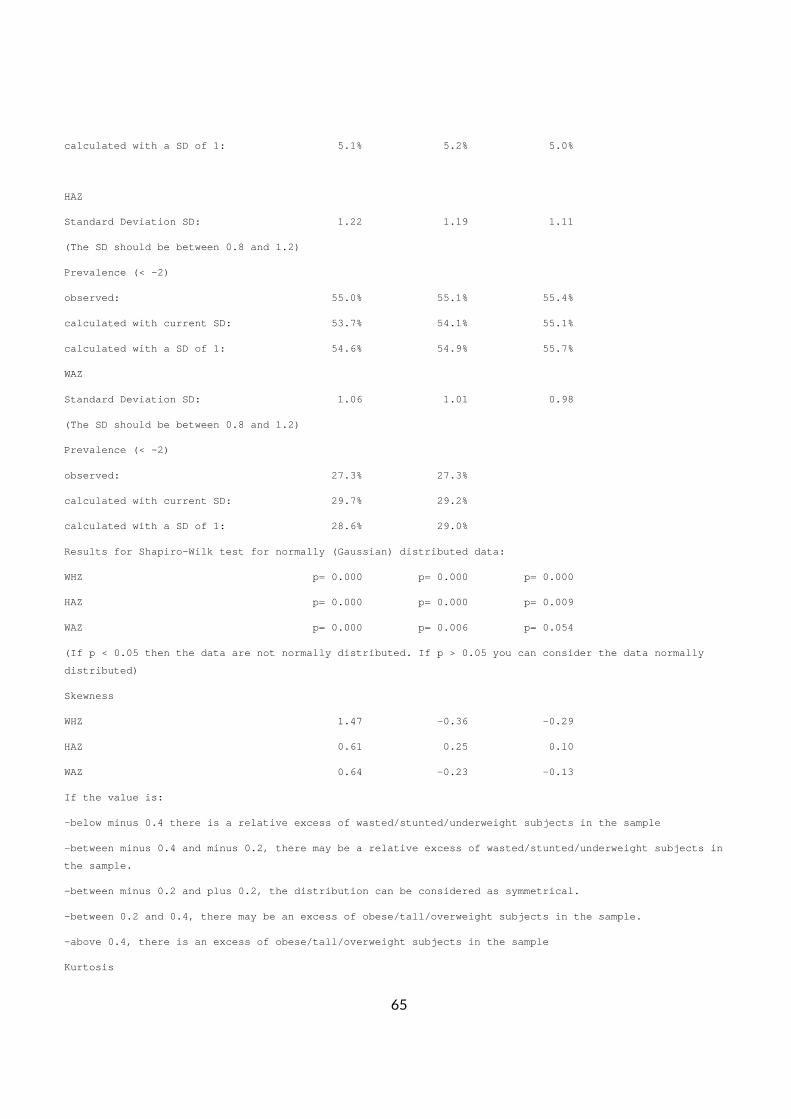
65
calculated with a SD of 1: 5.1% 5.2% 5.0%
HAZ
Standard Deviation SD: 1.22 1.19 1.11
(The SD should be between 0.8 and 1.2)
Prevalence (< -2)
observed: 55.0% 55.1% 55.4%
calculated with current SD: 53.7% 54.1% 55.1%
calculated with a SD of 1: 54.6% 54.9% 55.7%
WAZ
Standard Deviation SD: 1.06 1.01 0.98
(The SD should be between 0.8 and 1.2)
Prevalence (< -2)
observed: 27.3% 27.3%
calculated with current SD: 29.7% 29.2%
calculated with a SD of 1: 28.6% 29.0%
Results for Shapiro-Wilk test for normally (Gaussia n) distributed data:
WHZ p= 0.000 p= 0.000 p= 0.000
HAZ p= 0.000 p= 0.000 p= 0.009
WAZ p= 0.000 p= 0.006 p= 0.054
(If p < 0.05 then the data are not normally distrib uted. If p > 0.05 you can consider the data normall y
distributed)
Skewness
WHZ 1.47 -0.36 -0.29
HAZ 0.61 0.25 0.10
WAZ 0.64 -0.23 -0.13
If the value is:
-below minus 0.4 there is a relative excess of wast ed/stunted/underweight subjects in the sample
-between minus 0.4 and minus 0.2, there may be a re lative excess of wasted/stunted/underweight subject s in
the sample.
-between minus 0.2 and plus 0.2, the distribution c an be considered as symmetrical.
-between 0.2 and 0.4, there may be an excess of obe se/tall/overweight subjects in the sample.
-above 0.4, there is an excess of obese/tall/overwe ight subjects in the sample
Kurtosis
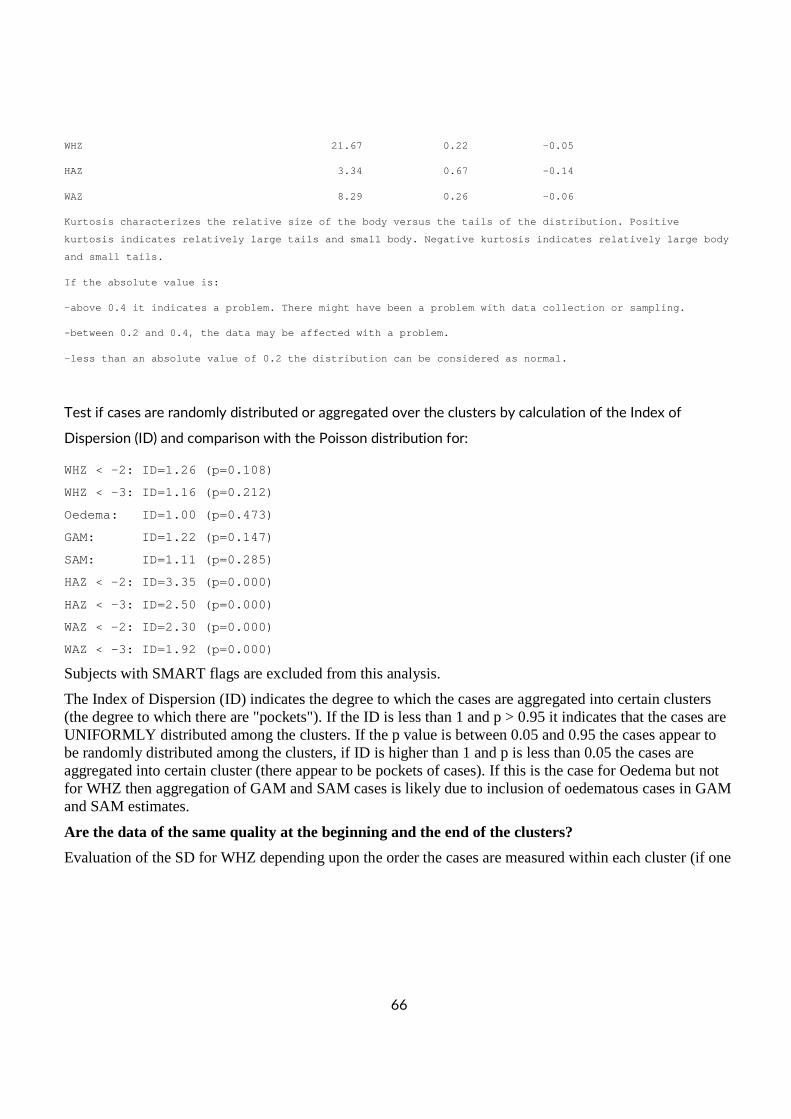
66
WHZ 21.67 0.22 -0.05
HAZ 3.34 0.67 -0.14
WAZ 8.29 0.26 -0.06
Kurtosis characterizes the relative size of the bod y versus the tails of the distribution. Positive
kurtosis indicates relatively large tails and small body. Negative kurtosis indicates relatively large body
and small tails.
If the absolute value is:
-above 0.4 it indicates a problem. There might have been a problem with data collection or sampling.
-between 0.2 and 0.4, the data may be affected with a problem.
-less than an absolute value of 0.2 the distributio n can be considered as normal.
Test if cases are randomly distributed or aggregated over the clusters by calculation of the Index of
Dispersion (ID) and comparison with the Poisson distribution for:
WHZ < -2: ID=1.26 (p=0.108)
WHZ < -3: ID=1.16 (p=0.212)
Oedema: ID=1.00 (p=0.473)
GAM: ID=1.22 (p=0.147)
SAM: ID=1.11 (p=0.285)
HAZ < -2: ID=3.35 (p=0.000)
HAZ < -3: ID=2.50 (p=0.000)
WAZ < -2: ID=2.30 (p=0.000)
WAZ < -3: ID=1.92 (p=0.000)
Subjects with SMART flags are excluded from this analysis.
The Index of Dispersion (ID) indicates the degree to which the cases are aggregated into certain clusters (the degree to which there are "pockets"). If the ID is less than 1 and p > 0.95 it indicates that the cases are UNIFORMLY distributed among the clusters. If the p value is between 0.05 and 0.95 the cases appear to be randomly distributed among the clusters, if ID is higher than 1 and p is less than 0.05 the cases are aggregated into certain cluster (there appear to be pockets of cases). If this is the case for Oedema but not for WHZ then aggregation of GAM and SAM cases is likely due to inclusion of oedematous cases in GAM and SAM estimates.
Are the data of the same quality at the beginning and the end of the clusters?
Evaluation of the SD for WHZ depending upon the order the cases are measured within each cluster (if one
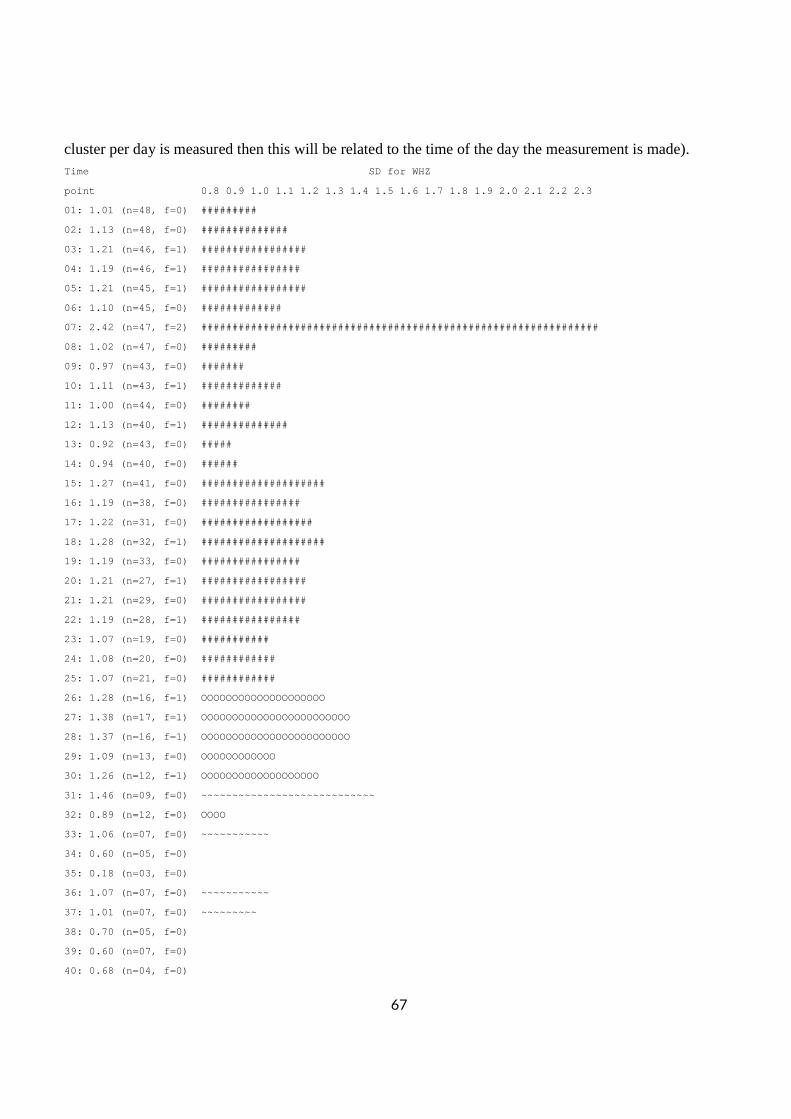
67
cluster per day is measured then this will be related to the time of the day the measurement is made). Time SD for WHZ
point 0.8 0.9 1.0 1.1 1.2 1.3 1.4 1 .5 1.6 1.7 1.8 1.9 2.0 2.1 2.2 2.3
01: 1.01 (n=48, f=0) #########
02: 1.13 (n=48, f=0) ##############
03: 1.21 (n=46, f=1) #################
04: 1.19 (n=46, f=1) ################
05: 1.21 (n=45, f=1) #################
06: 1.10 (n=45, f=0) #############
07: 2.42 (n=47, f=2) ############################# ###################################
08: 1.02 (n=47, f=0) #########
09: 0.97 (n=43, f=0) #######
10: 1.11 (n=43, f=1) #############
11: 1.00 (n=44, f=0) ########
12: 1.13 (n=40, f=1) ##############
13: 0.92 (n=43, f=0) #####
14: 0.94 (n=40, f=0) ######
15: 1.27 (n=41, f=0) ####################
16: 1.19 (n=38, f=0) ################
17: 1.22 (n=31, f=0) ##################
18: 1.28 (n=32, f=1) ####################
19: 1.19 (n=33, f=0) ################
20: 1.21 (n=27, f=1) #################
21: 1.21 (n=29, f=0) #################
22: 1.19 (n=28, f=1) ################
23: 1.07 (n=19, f=0) ###########
24: 1.08 (n=20, f=0) ############
25: 1.07 (n=21, f=0) ############
26: 1.28 (n=16, f=1) OOOOOOOOOOOOOOOOOOOO
27: 1.38 (n=17, f=1) OOOOOOOOOOOOOOOOOOOOOOOO
28: 1.37 (n=16, f=1) OOOOOOOOOOOOOOOOOOOOOOOO
29: 1.09 (n=13, f=0) OOOOOOOOOOOO
30: 1.26 (n=12, f=1) OOOOOOOOOOOOOOOOOOO
31: 1.46 (n=09, f=0) ~~~~~~~~~~~~~~~~~~~~~~~~~~~~
32: 0.89 (n=12, f=0) OOOO
33: 1.06 (n=07, f=0) ~~~~~~~~~~~
34: 0.60 (n=05, f=0)
35: 0.18 (n=03, f=0)
36: 1.07 (n=07, f=0) ~~~~~~~~~~~
37: 1.01 (n=07, f=0) ~~~~~~~~~
38: 0.70 (n=05, f=0)
39: 0.60 (n=07, f=0)
40: 0.68 (n=04, f=0)
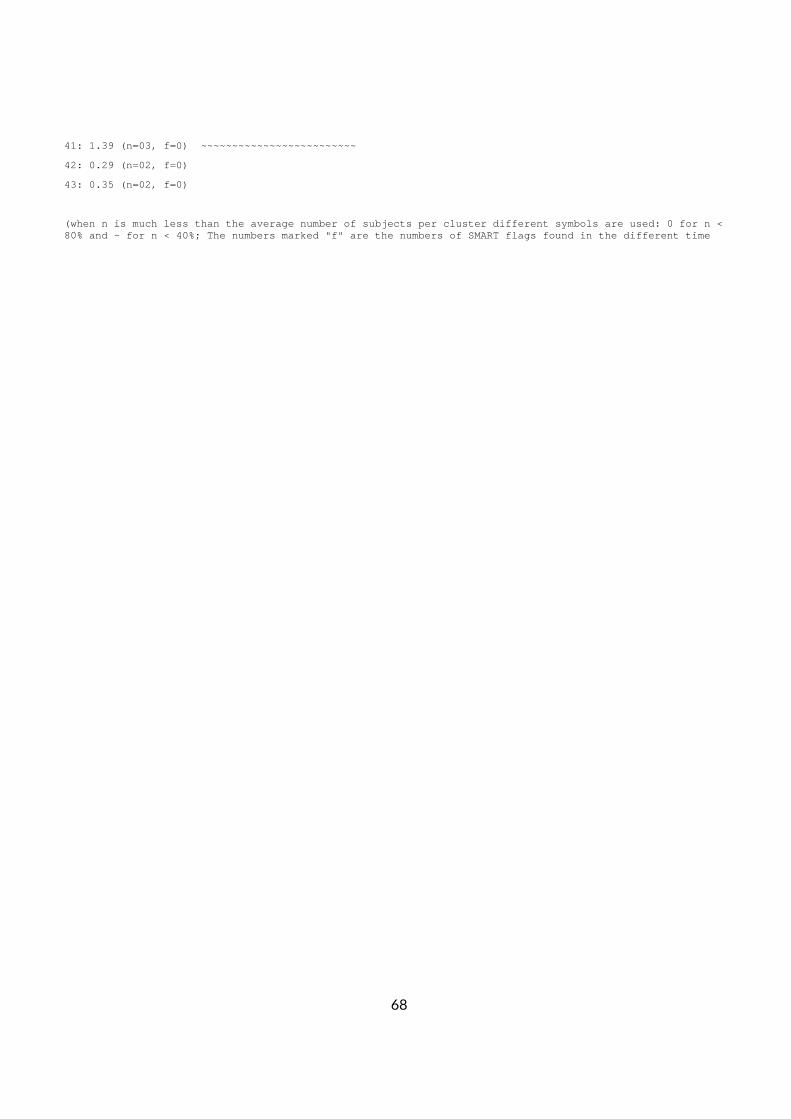
68
41: 1.39 (n=03, f=0) ~~~~~~~~~~~~~~~~~~~~~~~~~
42: 0.29 (n=02, f=0)
43: 0.35 (n=02, f=0)
(when n is much less than the average number of sub jects per cluster different symbols are used: 0 for n < 80% and ~ for n < 40%; The numbers marked "f" are t he numbers of SMART flags found in the different ti me
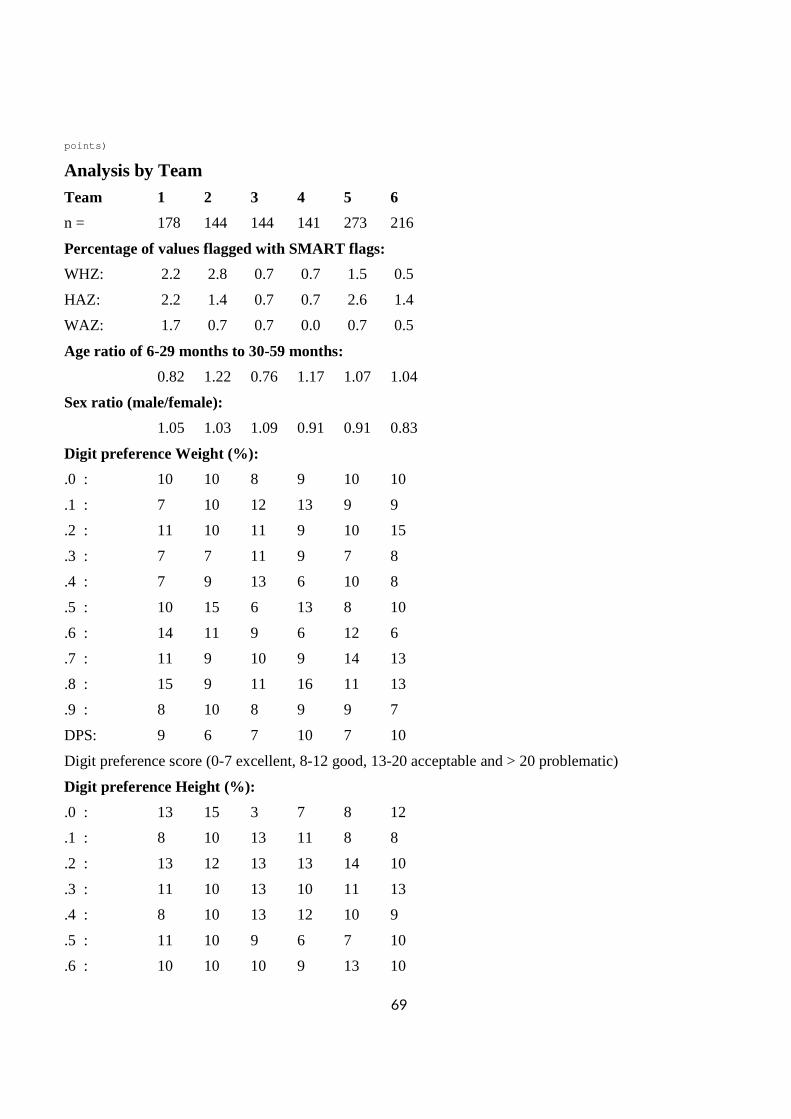
69
points)
Analysis by Team Team 1 2 3 4 5 6
n = 178 144 144 141 273 216
Percentage of values flagged with SMART flags:
WHZ: 2.2 2.8 0.7 0.7 1.5 0.5
HAZ: 2.2 1.4 0.7 0.7 2.6 1.4
WAZ: 1.7 0.7 0.7 0.0 0.7 0.5
Age ratio of 6-29 months to 30-59 months:
0.82 1.22 0.76 1.17 1.07 1.04
Sex ratio (male/female):
1.05 1.03 1.09 0.91 0.91 0.83
Digit preference Weight (%):
.0 : 10 10 8 9 10 10
.1 : 7 10 12 13 9 9
.2 : 11 10 11 9 10 15
.3 : 7 7 11 9 7 8
.4 : 7 9 13 6 10 8
.5 : 10 15 6 13 8 10
.6 : 14 11 9 6 12 6
.7 : 11 9 10 9 14 13
.8 : 15 9 11 16 11 13
.9 : 8 10 8 9 9 7
DPS: 9 6 7 10 7 10
Digit preference score (0-7 excellent, 8-12 good, 13-20 acceptable and > 20 problematic)
Digit preference Height (%):
.0 : 13 15 3 7 8 12
.1 : 8 10 13 11 8 8
.2 : 13 12 13 13 14 10
.3 : 11 10 13 10 11 13
.4 : 8 10 13 12 10 9
.5 : 11 10 9 6 7 10
.6 : 10 10 10 9 13 10
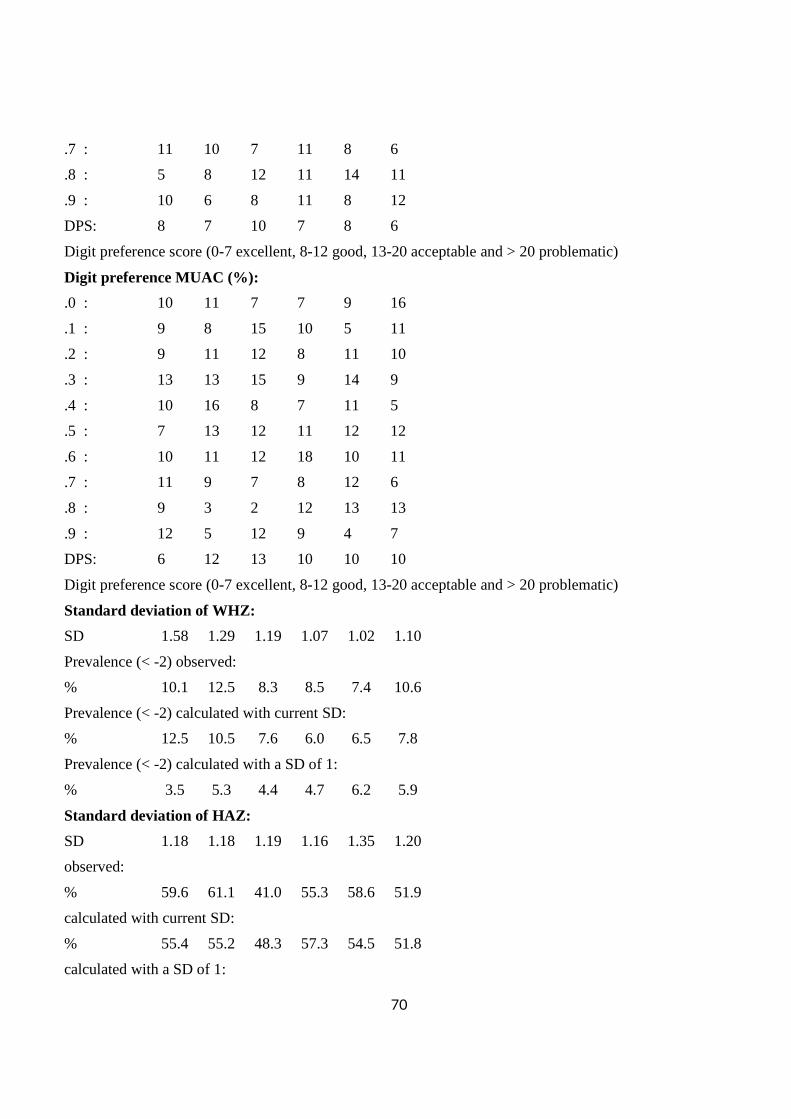
70
.7 : 11 10 7 11 8 6
.8 : 5 8 12 11 14 11
.9 : 10 6 8 11 8 12
DPS: 8 7 10 7 8 6
Digit preference score (0-7 excellent, 8-12 good, 13-20 acceptable and > 20 problematic)
Digit preference MUAC (%):
.0 : 10 11 7 7 9 16
.1 : 9 8 15 10 5 11
.2 : 9 11 12 8 11 10
.3 : 13 13 15 9 14 9
.4 : 10 16 8 7 11 5
.5 : 7 13 12 11 12 12
.6 : 10 11 12 18 10 11
.7 : 11 9 7 8 12 6
.8 : 9 3 2 12 13 13
.9 : 12 5 12 9 4 7
DPS: 6 12 13 10 10 10
Digit preference score (0-7 excellent, 8-12 good, 13-20 acceptable and > 20 problematic)
Standard deviation of WHZ:
SD 1.58 1.29 1.19 1.07 1.02 1.10
Prevalence (< -2) observed:
% 10.1 12.5 8.3 8.5 7.4 10.6
Prevalence (< -2) calculated with current SD:
% 12.5 10.5 7.6 6.0 6.5 7.8
Prevalence (< -2) calculated with a SD of 1:
% 3.5 5.3 4.4 4.7 6.2 5.9
Standard deviation of HAZ:
SD 1.18 1.18 1.19 1.16 1.35 1.20
observed:
% 59.6 61.1 41.0 55.3 58.6 51.9
calculated with current SD:
% 55.4 55.2 48.3 57.3 54.5 51.8
calculated with a SD of 1:
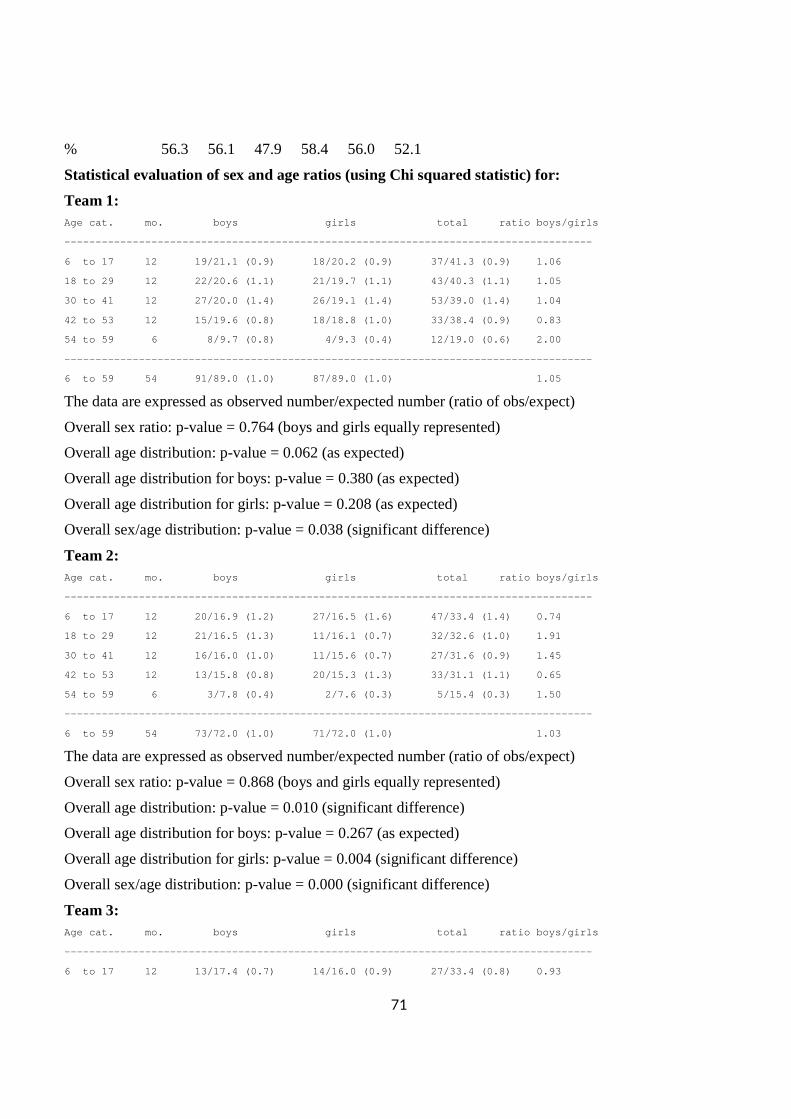
71
% 56.3 56.1 47.9 58.4 56.0 52.1
Statistical evaluation of sex and age ratios (using Chi squared statistic) for:
Team 1: Age cat. mo. boys girls total ratio boys/girls
--------------------------------------------------- ----------------------------------
6 to 17 12 19/21.1 (0.9) 18/20.2 (0. 9) 37/41.3 (0.9) 1.06
18 to 29 12 22/20.6 (1.1) 21/19.7 (1. 1) 43/40.3 (1.1) 1.05
30 to 41 12 27/20.0 (1.4) 26/19.1 (1. 4) 53/39.0 (1.4) 1.04
42 to 53 12 15/19.6 (0.8) 18/18.8 (1. 0) 33/38.4 (0.9) 0.83
54 to 59 6 8/9.7 (0.8) 4/9.3 (0. 4) 12/19.0 (0.6) 2.00
--------------------------------------------------- ----------------------------------
6 to 59 54 91/89.0 (1.0) 87/89.0 (1. 0) 1.05
The data are expressed as observed number/expected number (ratio of obs/expect)
Overall sex ratio: p-value = 0.764 (boys and girls equally represented)
Overall age distribution: p-value = 0.062 (as expected)
Overall age distribution for boys: p-value = 0.380 (as expected)
Overall age distribution for girls: p-value = 0.208 (as expected)
Overall sex/age distribution: p-value = 0.038 (significant difference)
Team 2: Age cat. mo. boys girls total ratio boys/girls
--------------------------------------------------- ----------------------------------
6 to 17 12 20/16.9 (1.2) 27/16.5 (1. 6) 47/33.4 (1.4) 0.74
18 to 29 12 21/16.5 (1.3) 11/16.1 (0. 7) 32/32.6 (1.0) 1.91
30 to 41 12 16/16.0 (1.0) 11/15.6 (0. 7) 27/31.6 (0.9) 1.45
42 to 53 12 13/15.8 (0.8) 20/15.3 (1. 3) 33/31.1 (1.1) 0.65
54 to 59 6 3/7.8 (0.4) 2/7.6 (0. 3) 5/15.4 (0.3) 1.50
--------------------------------------------------- ----------------------------------
6 to 59 54 73/72.0 (1.0) 71/72.0 (1. 0) 1.03
The data are expressed as observed number/expected number (ratio of obs/expect)
Overall sex ratio: p-value = 0.868 (boys and girls equally represented)
Overall age distribution: p-value = 0.010 (significant difference)
Overall age distribution for boys: p-value = 0.267 (as expected)
Overall age distribution for girls: p-value = 0.004 (significant difference)
Overall sex/age distribution: p-value = 0.000 (significant difference)
Team 3: Age cat. mo. boys girls total ratio boys/girls
--------------------------------------------------- ----------------------------------
6 to 17 12 13/17.4 (0.7) 14/16.0 (0. 9) 27/33.4 (0.8) 0.93
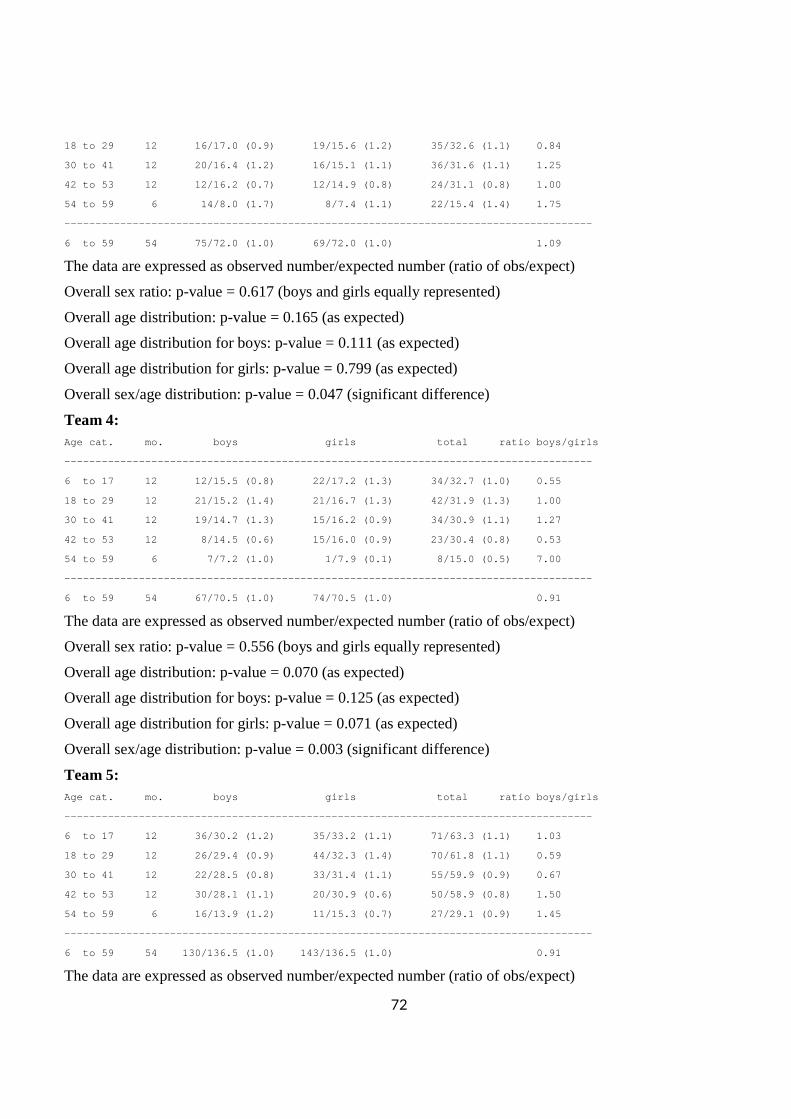
72
18 to 29 12 16/17.0 (0.9) 19/15.6 (1. 2) 35/32.6 (1.1) 0.84
30 to 41 12 20/16.4 (1.2) 16/15.1 (1. 1) 36/31.6 (1.1) 1.25
42 to 53 12 12/16.2 (0.7) 12/14.9 (0. 8) 24/31.1 (0.8) 1.00
54 to 59 6 14/8.0 (1.7) 8/7.4 (1. 1) 22/15.4 (1.4) 1.75
--------------------------------------------------- ----------------------------------
6 to 59 54 75/72.0 (1.0) 69/72.0 (1. 0) 1.09
The data are expressed as observed number/expected number (ratio of obs/expect)
Overall sex ratio: p-value = 0.617 (boys and girls equally represented)
Overall age distribution: p-value = 0.165 (as expected)
Overall age distribution for boys: p-value = 0.111 (as expected)
Overall age distribution for girls: p-value = 0.799 (as expected)
Overall sex/age distribution: p-value = 0.047 (significant difference)
Team 4: Age cat. mo. boys girls total ratio boys/girls
--------------------------------------------------- ----------------------------------
6 to 17 12 12/15.5 (0.8) 22/17.2 (1. 3) 34/32.7 (1.0) 0.55
18 to 29 12 21/15.2 (1.4) 21/16.7 (1. 3) 42/31.9 (1.3) 1.00
30 to 41 12 19/14.7 (1.3) 15/16.2 (0. 9) 34/30.9 (1.1) 1.27
42 to 53 12 8/14.5 (0.6) 15/16.0 (0. 9) 23/30.4 (0.8) 0.53
54 to 59 6 7/7.2 (1.0) 1/7.9 (0. 1) 8/15.0 (0.5) 7.00
--------------------------------------------------- ----------------------------------
6 to 59 54 67/70.5 (1.0) 74/70.5 (1. 0) 0.91
The data are expressed as observed number/expected number (ratio of obs/expect)
Overall sex ratio: p-value = 0.556 (boys and girls equally represented)
Overall age distribution: p-value = 0.070 (as expected)
Overall age distribution for boys: p-value = 0.125 (as expected)
Overall age distribution for girls: p-value = 0.071 (as expected)
Overall sex/age distribution: p-value = 0.003 (significant difference)
Team 5: Age cat. mo. boys girls total ratio boys/girls
--------------------------------------------------- ----------------------------------
6 to 17 12 36/30.2 (1.2) 35/33.2 (1. 1) 71/63.3 (1.1) 1.03
18 to 29 12 26/29.4 (0.9) 44/32.3 (1. 4) 70/61.8 (1.1) 0.59
30 to 41 12 22/28.5 (0.8) 33/31.4 (1. 1) 55/59.9 (0.9) 0.67
42 to 53 12 30/28.1 (1.1) 20/30.9 (0. 6) 50/58.9 (0.8) 1.50
54 to 59 6 16/13.9 (1.2) 11/15.3 (0. 7) 27/29.1 (0.9) 1.45
--------------------------------------------------- ----------------------------------
6 to 59 54 130/136.5 (1.0) 143/136.5 (1. 0) 0.91
The data are expressed as observed number/expected number (ratio of obs/expect)
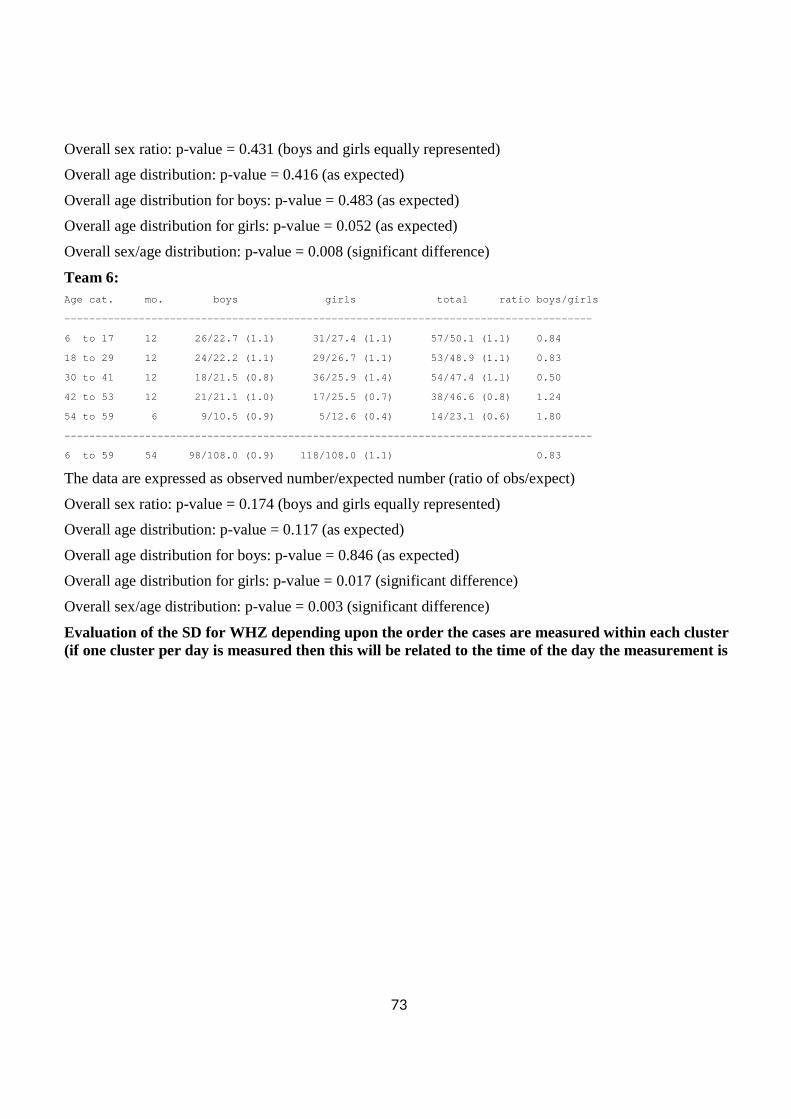
73
Overall sex ratio: p-value = 0.431 (boys and girls equally represented)
Overall age distribution: p-value = 0.416 (as expected)
Overall age distribution for boys: p-value = 0.483 (as expected)
Overall age distribution for girls: p-value = 0.052 (as expected)
Overall sex/age distribution: p-value = 0.008 (significant difference)
Team 6: Age cat. mo. boys girls total ratio boys/girls
--------------------------------------------------- ----------------------------------
6 to 17 12 26/22.7 (1.1) 31/27.4 (1. 1) 57/50.1 (1.1) 0.84
18 to 29 12 24/22.2 (1.1) 29/26.7 (1. 1) 53/48.9 (1.1) 0.83
30 to 41 12 18/21.5 (0.8) 36/25.9 (1. 4) 54/47.4 (1.1) 0.50
42 to 53 12 21/21.1 (1.0) 17/25.5 (0. 7) 38/46.6 (0.8) 1.24
54 to 59 6 9/10.5 (0.9) 5/12.6 (0. 4) 14/23.1 (0.6) 1.80
--------------------------------------------------- ----------------------------------
6 to 59 54 98/108.0 (0.9) 118/108.0 (1. 1) 0.83
The data are expressed as observed number/expected number (ratio of obs/expect)
Overall sex ratio: p-value = 0.174 (boys and girls equally represented)
Overall age distribution: p-value = 0.117 (as expected)
Overall age distribution for boys: p-value = 0.846 (as expected)
Overall age distribution for girls: p-value = 0.017 (significant difference)
Overall sex/age distribution: p-value = 0.003 (significant difference)
Evaluation of the SD for WHZ depending upon the order the cases are measured within each cluster (if one cluster per day is measured then this will be related to the time of the day the measurement is
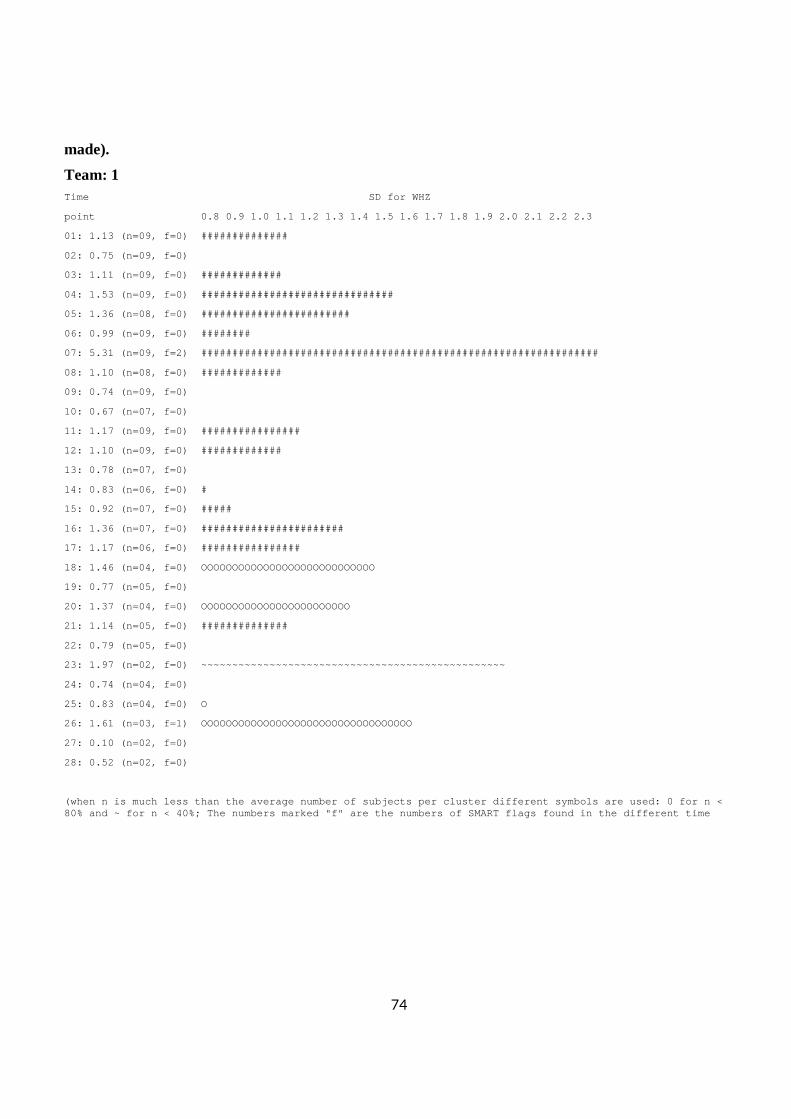
74
made).
Team: 1 Time SD for WHZ
point 0.8 0.9 1.0 1.1 1.2 1.3 1.4 1 .5 1.6 1.7 1.8 1.9 2.0 2.1 2.2 2.3
01: 1.13 (n=09, f=0) ##############
02: 0.75 (n=09, f=0)
03: 1.11 (n=09, f=0) #############
04: 1.53 (n=09, f=0) ############################# ##
05: 1.36 (n=08, f=0) ########################
06: 0.99 (n=09, f=0) ########
07: 5.31 (n=09, f=2) ############################# ###################################
08: 1.10 (n=08, f=0) #############
09: 0.74 (n=09, f=0)
10: 0.67 (n=07, f=0)
11: 1.17 (n=09, f=0) ################
12: 1.10 (n=09, f=0) #############
13: 0.78 (n=07, f=0)
14: 0.83 (n=06, f=0) #
15: 0.92 (n=07, f=0) #####
16: 1.36 (n=07, f=0) #######################
17: 1.17 (n=06, f=0) ################
18: 1.46 (n=04, f=0) OOOOOOOOOOOOOOOOOOOOOOOOOOOO
19: 0.77 (n=05, f=0)
20: 1.37 (n=04, f=0) OOOOOOOOOOOOOOOOOOOOOOOO
21: 1.14 (n=05, f=0) ##############
22: 0.79 (n=05, f=0)
23: 1.97 (n=02, f=0) ~~~~~~~~~~~~~~~~~~~~~~~~~~~~~ ~~~~~~~~~~~~~~~~~~~~
24: 0.74 (n=04, f=0)
25: 0.83 (n=04, f=0) O
26: 1.61 (n=03, f=1) OOOOOOOOOOOOOOOOOOOOOOOOOOOOOOOOOO
27: 0.10 (n=02, f=0)
28: 0.52 (n=02, f=0)
(when n is much less than the average number of sub jects per cluster different symbols are used: 0 for n < 80% and ~ for n < 40%; The numbers marked "f" are t he numbers of SMART flags found in the different ti me
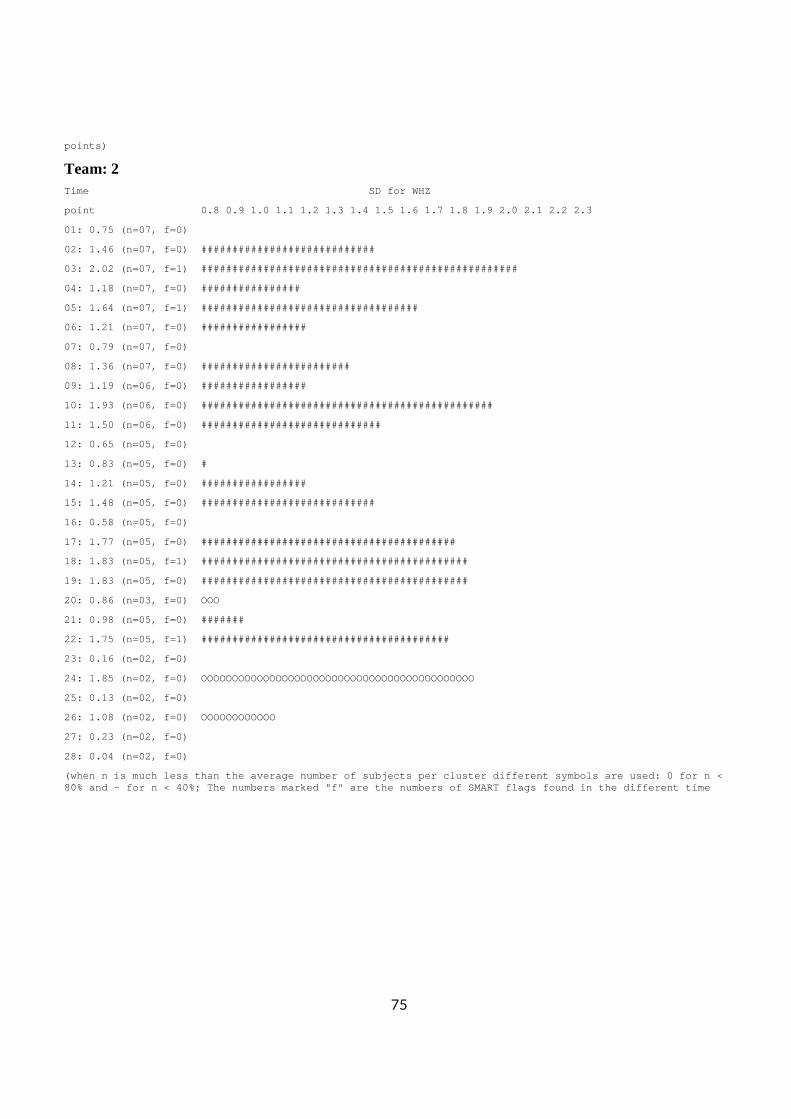
75
points)
Team: 2 Time SD for WHZ
point 0.8 0.9 1.0 1.1 1.2 1.3 1.4 1 .5 1.6 1.7 1.8 1.9 2.0 2.1 2.2 2.3
01: 0.75 (n=07, f=0)
02: 1.46 (n=07, f=0) ############################
03: 2.02 (n=07, f=1) ############################# ######################
04: 1.18 (n=07, f=0) ################
05: 1.64 (n=07, f=1) ############################# ######
06: 1.21 (n=07, f=0) #################
07: 0.79 (n=07, f=0)
08: 1.36 (n=07, f=0) ########################
09: 1.19 (n=06, f=0) #################
10: 1.93 (n=06, f=0) ############################# ##################
11: 1.50 (n=06, f=0) #############################
12: 0.65 (n=05, f=0)
13: 0.83 (n=05, f=0) #
14: 1.21 (n=05, f=0) #################
15: 1.48 (n=05, f=0) ############################
16: 0.58 (n=05, f=0)
17: 1.77 (n=05, f=0) ############################# ############
18: 1.83 (n=05, f=1) ############################# ##############
19: 1.83 (n=05, f=0) ############################# ##############
20: 0.86 (n=03, f=0) OOO
21: 0.98 (n=05, f=0) #######
22: 1.75 (n=05, f=1) ############################# ###########
23: 0.16 (n=02, f=0)
24: 1.85 (n=02, f=0) OOOOOOOOOOOOOOOOOOOOOOOOOOOOOOOOOOOOOOOOOOOO
25: 0.13 (n=02, f=0)
26: 1.08 (n=02, f=0) OOOOOOOOOOOO
27: 0.23 (n=02, f=0)
28: 0.04 (n=02, f=0)
(when n is much less than the average number of sub jects per cluster different symbols are used: 0 for n < 80% and ~ for n < 40%; The numbers marked "f" are t he numbers of SMART flags found in the different ti me
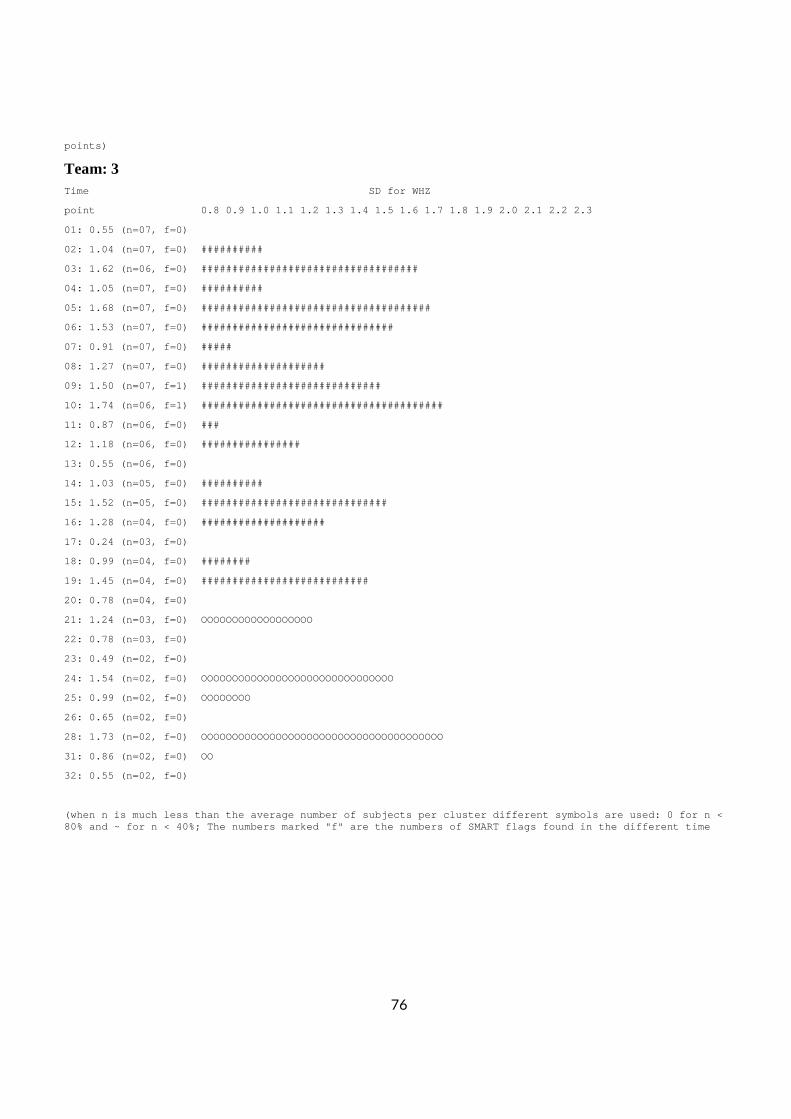
76
points)
Team: 3 Time SD for WHZ
point 0.8 0.9 1.0 1.1 1.2 1.3 1.4 1 .5 1.6 1.7 1.8 1.9 2.0 2.1 2.2 2.3
01: 0.55 (n=07, f=0)
02: 1.04 (n=07, f=0) ##########
03: 1.62 (n=06, f=0) ############################# ######
04: 1.05 (n=07, f=0) ##########
05: 1.68 (n=07, f=0) ############################# ########
06: 1.53 (n=07, f=0) ############################# ##
07: 0.91 (n=07, f=0) #####
08: 1.27 (n=07, f=0) ####################
09: 1.50 (n=07, f=1) #############################
10: 1.74 (n=06, f=1) ############################# ##########
11: 0.87 (n=06, f=0) ###
12: 1.18 (n=06, f=0) ################
13: 0.55 (n=06, f=0)
14: 1.03 (n=05, f=0) ##########
15: 1.52 (n=05, f=0) ############################# #
16: 1.28 (n=04, f=0) ####################
17: 0.24 (n=03, f=0)
18: 0.99 (n=04, f=0) ########
19: 1.45 (n=04, f=0) ###########################
20: 0.78 (n=04, f=0)
21: 1.24 (n=03, f=0) OOOOOOOOOOOOOOOOOO
22: 0.78 (n=03, f=0)
23: 0.49 (n=02, f=0)
24: 1.54 (n=02, f=0) OOOOOOOOOOOOOOOOOOOOOOOOOOOOOOO
25: 0.99 (n=02, f=0) OOOOOOOO
26: 0.65 (n=02, f=0)
28: 1.73 (n=02, f=0) OOOOOOOOOOOOOOOOOOOOOOOOOOOOOOOOOOOOOOO
31: 0.86 (n=02, f=0) OO
32: 0.55 (n=02, f=0)
(when n is much less than the average number of sub jects per cluster different symbols are used: 0 for n < 80% and ~ for n < 40%; The numbers marked "f" are t he numbers of SMART flags found in the different ti me
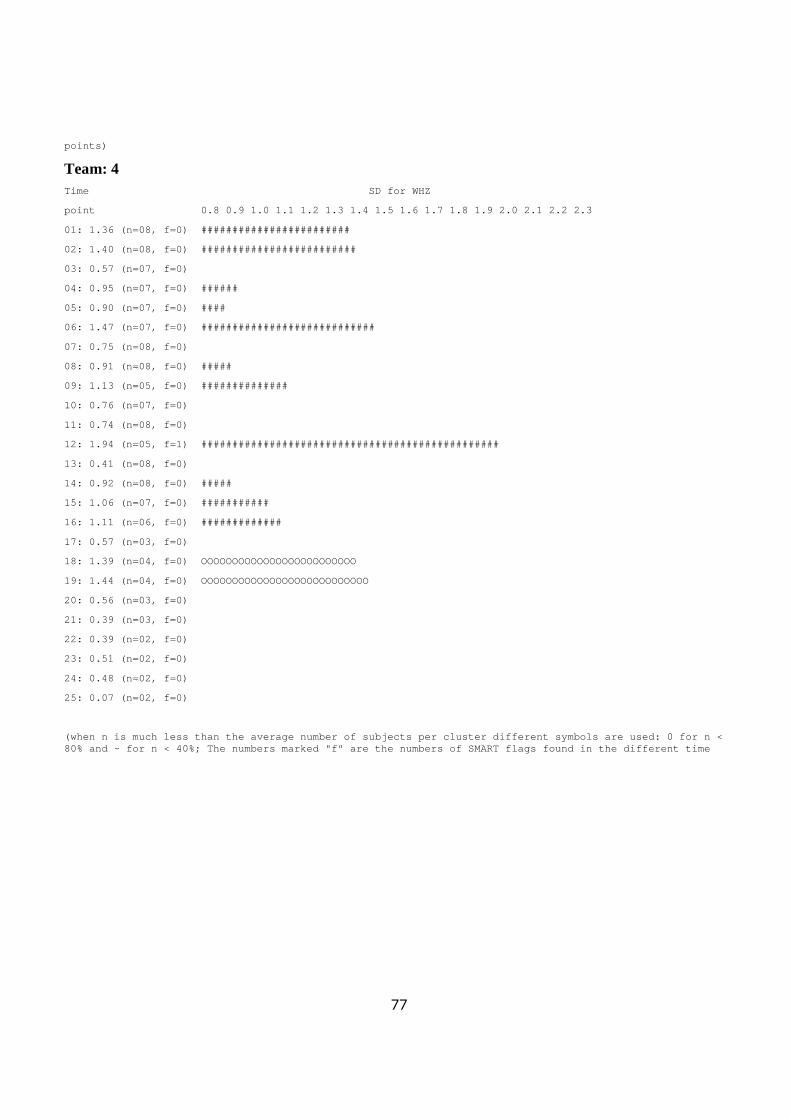
77
points)
Team: 4 Time SD for WHZ
point 0.8 0.9 1.0 1.1 1.2 1.3 1.4 1 .5 1.6 1.7 1.8 1.9 2.0 2.1 2.2 2.3
01: 1.36 (n=08, f=0) ########################
02: 1.40 (n=08, f=0) #########################
03: 0.57 (n=07, f=0)
04: 0.95 (n=07, f=0) ######
05: 0.90 (n=07, f=0) ####
06: 1.47 (n=07, f=0) ############################
07: 0.75 (n=08, f=0)
08: 0.91 (n=08, f=0) #####
09: 1.13 (n=05, f=0) ##############
10: 0.76 (n=07, f=0)
11: 0.74 (n=08, f=0)
12: 1.94 (n=05, f=1) ############################# ###################
13: 0.41 (n=08, f=0)
14: 0.92 (n=08, f=0) #####
15: 1.06 (n=07, f=0) ###########
16: 1.11 (n=06, f=0) #############
17: 0.57 (n=03, f=0)
18: 1.39 (n=04, f=0) OOOOOOOOOOOOOOOOOOOOOOOOO
19: 1.44 (n=04, f=0) OOOOOOOOOOOOOOOOOOOOOOOOOOO
20: 0.56 (n=03, f=0)
21: 0.39 (n=03, f=0)
22: 0.39 (n=02, f=0)
23: 0.51 (n=02, f=0)
24: 0.48 (n=02, f=0)
25: 0.07 (n=02, f=0)
(when n is much less than the average number of sub jects per cluster different symbols are used: 0 for n < 80% and ~ for n < 40%; The numbers marked "f" are t he numbers of SMART flags found in the different ti me
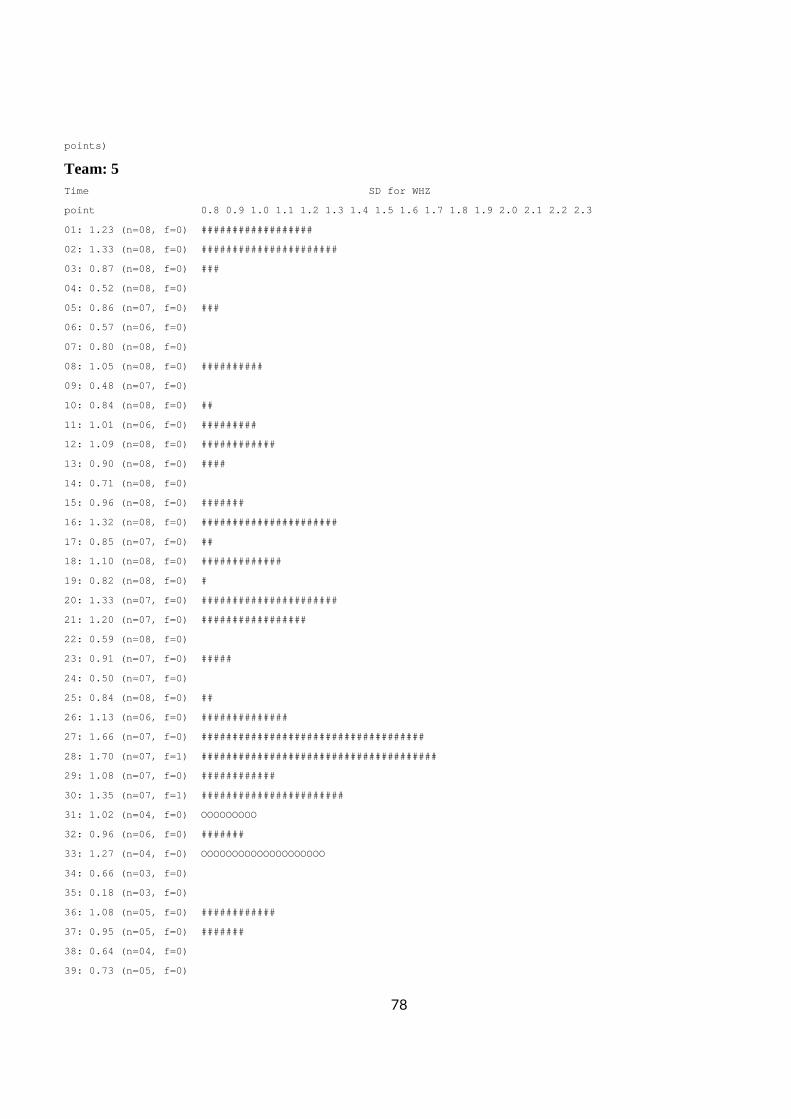
78
points)
Team: 5 Time SD for WHZ
point 0.8 0.9 1.0 1.1 1.2 1.3 1.4 1 .5 1.6 1.7 1.8 1.9 2.0 2.1 2.2 2.3
01: 1.23 (n=08, f=0) ##################
02: 1.33 (n=08, f=0) ######################
03: 0.87 (n=08, f=0) ###
04: 0.52 (n=08, f=0)
05: 0.86 (n=07, f=0) ###
06: 0.57 (n=06, f=0)
07: 0.80 (n=08, f=0)
08: 1.05 (n=08, f=0) ##########
09: 0.48 (n=07, f=0)
10: 0.84 (n=08, f=0) ##
11: 1.01 (n=06, f=0) #########
12: 1.09 (n=08, f=0) ############
13: 0.90 (n=08, f=0) ####
14: 0.71 (n=08, f=0)
15: 0.96 (n=08, f=0) #######
16: 1.32 (n=08, f=0) ######################
17: 0.85 (n=07, f=0) ##
18: 1.10 (n=08, f=0) #############
19: 0.82 (n=08, f=0) #
20: 1.33 (n=07, f=0) ######################
21: 1.20 (n=07, f=0) #################
22: 0.59 (n=08, f=0)
23: 0.91 (n=07, f=0) #####
24: 0.50 (n=07, f=0)
25: 0.84 (n=08, f=0) ##
26: 1.13 (n=06, f=0) ##############
27: 1.66 (n=07, f=0) ############################# #######
28: 1.70 (n=07, f=1) ############################# #########
29: 1.08 (n=07, f=0) ############
30: 1.35 (n=07, f=1) #######################
31: 1.02 (n=04, f=0) OOOOOOOOO
32: 0.96 (n=06, f=0) #######
33: 1.27 (n=04, f=0) OOOOOOOOOOOOOOOOOOOO
34: 0.66 (n=03, f=0)
35: 0.18 (n=03, f=0)
36: 1.08 (n=05, f=0) ############
37: 0.95 (n=05, f=0) #######
38: 0.64 (n=04, f=0)
39: 0.73 (n=05, f=0)
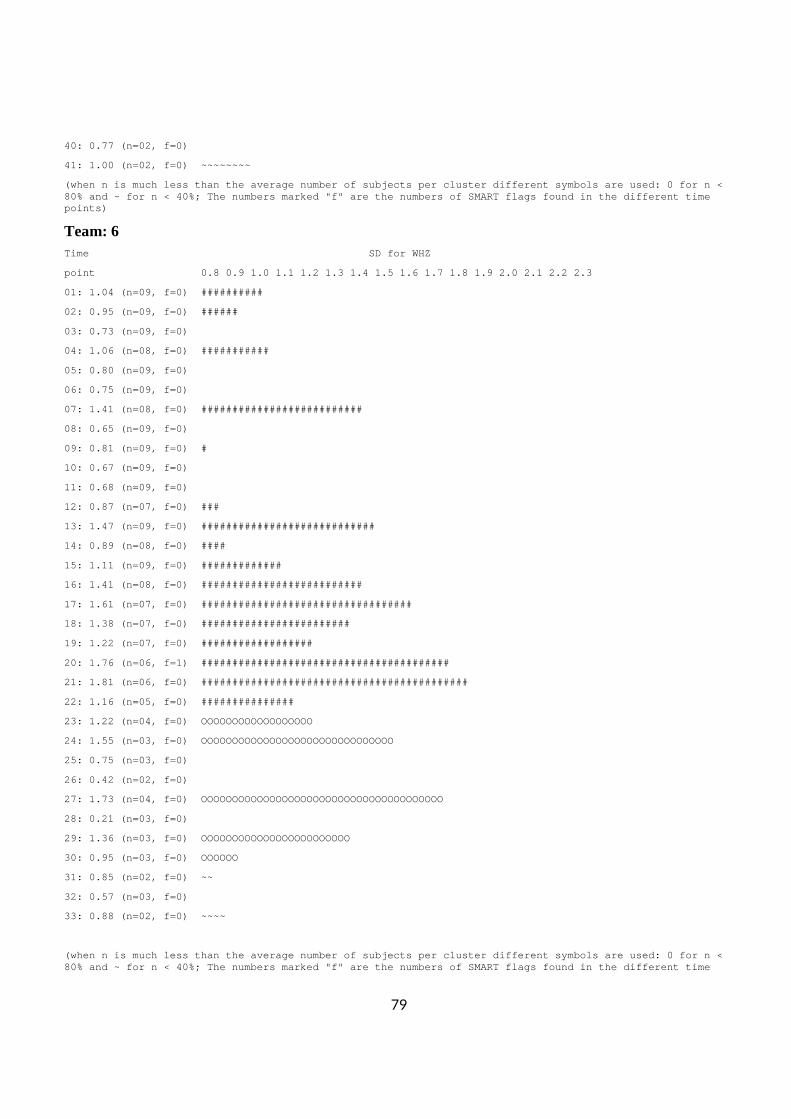
79
40: 0.77 (n=02, f=0)
41: 1.00 (n=02, f=0) ~~~~~~~~
(when n is much less than the average number of sub jects per cluster different symbols are used: 0 for n < 80% and ~ for n < 40%; The numbers marked "f" are t he numbers of SMART flags found in the different ti me points)
Team: 6 Time SD for WHZ
point 0.8 0.9 1.0 1.1 1.2 1.3 1.4 1 .5 1.6 1.7 1.8 1.9 2.0 2.1 2.2 2.3
01: 1.04 (n=09, f=0) ##########
02: 0.95 (n=09, f=0) ######
03: 0.73 (n=09, f=0)
04: 1.06 (n=08, f=0) ###########
05: 0.80 (n=09, f=0)
06: 0.75 (n=09, f=0)
07: 1.41 (n=08, f=0) ##########################
08: 0.65 (n=09, f=0)
09: 0.81 (n=09, f=0) #
10: 0.67 (n=09, f=0)
11: 0.68 (n=09, f=0)
12: 0.87 (n=07, f=0) ###
13: 1.47 (n=09, f=0) ############################
14: 0.89 (n=08, f=0) ####
15: 1.11 (n=09, f=0) #############
16: 1.41 (n=08, f=0) ##########################
17: 1.61 (n=07, f=0) ############################# #####
18: 1.38 (n=07, f=0) ########################
19: 1.22 (n=07, f=0) ##################
20: 1.76 (n=06, f=1) ############################# ###########
21: 1.81 (n=06, f=0) ############################# ##############
22: 1.16 (n=05, f=0) ###############
23: 1.22 (n=04, f=0) OOOOOOOOOOOOOOOOOO
24: 1.55 (n=03, f=0) OOOOOOOOOOOOOOOOOOOOOOOOOOOOOOO
25: 0.75 (n=03, f=0)
26: 0.42 (n=02, f=0)
27: 1.73 (n=04, f=0) OOOOOOOOOOOOOOOOOOOOOOOOOOOOOOOOOOOOOOO
28: 0.21 (n=03, f=0)
29: 1.36 (n=03, f=0) OOOOOOOOOOOOOOOOOOOOOOOO
30: 0.95 (n=03, f=0) OOOOOO
31: 0.85 (n=02, f=0) ~~
32: 0.57 (n=03, f=0)
33: 0.88 (n=02, f=0) ~~~~
(when n is much less than the average number of sub jects per cluster different symbols are used: 0 for n < 80% and ~ for n < 40%; The numbers marked "f" are t he numbers of SMART flags found in the different ti me
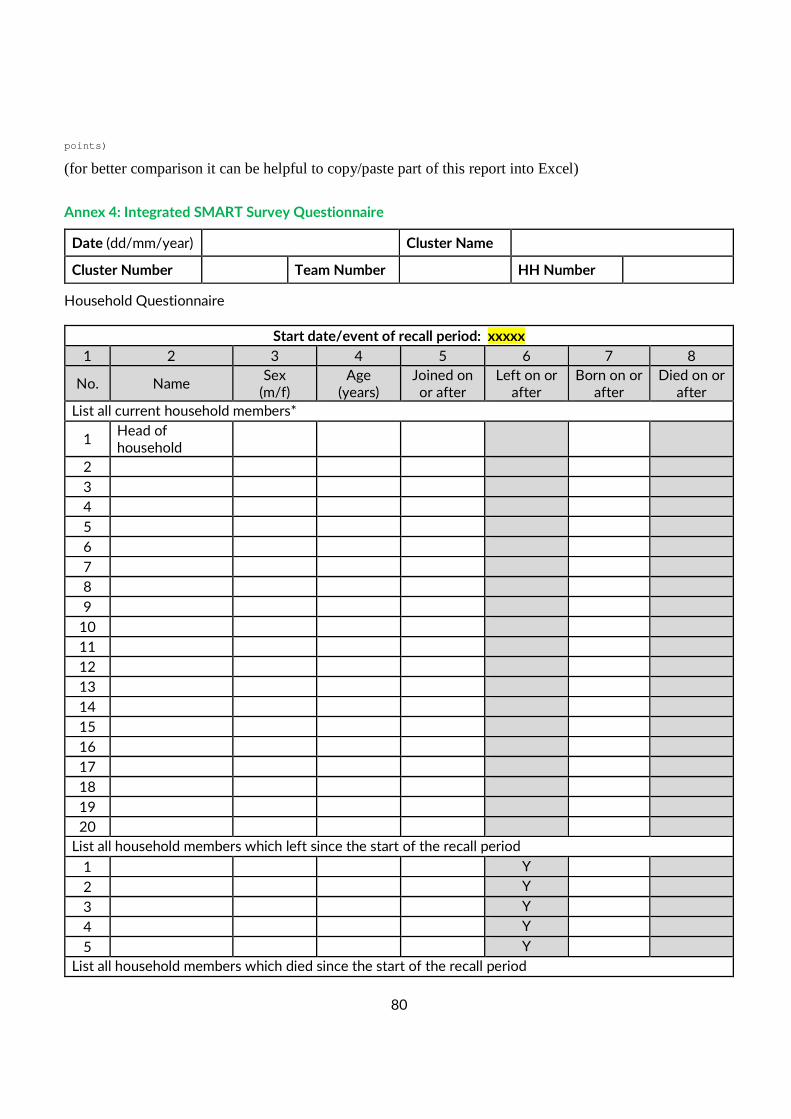
80
points)
(for better comparison it can be helpful to copy/paste part of this report into Excel)
Annex 4: Integrated SMART Survey Questionnaire
Date (dd/mm/year) Cluster Name
Cluster Number Team Number HH Number
Household Questionnaire
Start date/event of recall period: xxxxx
1 2 3 4 5 6 7 8
No. Name Sex
(m/f) Age
(years) Joined on or after
Left on or after
Born on or after
Died on or after
List all current household members*
1 Head of household
2
3
4
5
6
7
8
9
10
11
12
13
14
15
16
17
18
19
20
List all household members which left since the start of the recall period
1 Y
2 Y
3 Y
4 Y
5 Y
List all household members which died since the start of the recall period
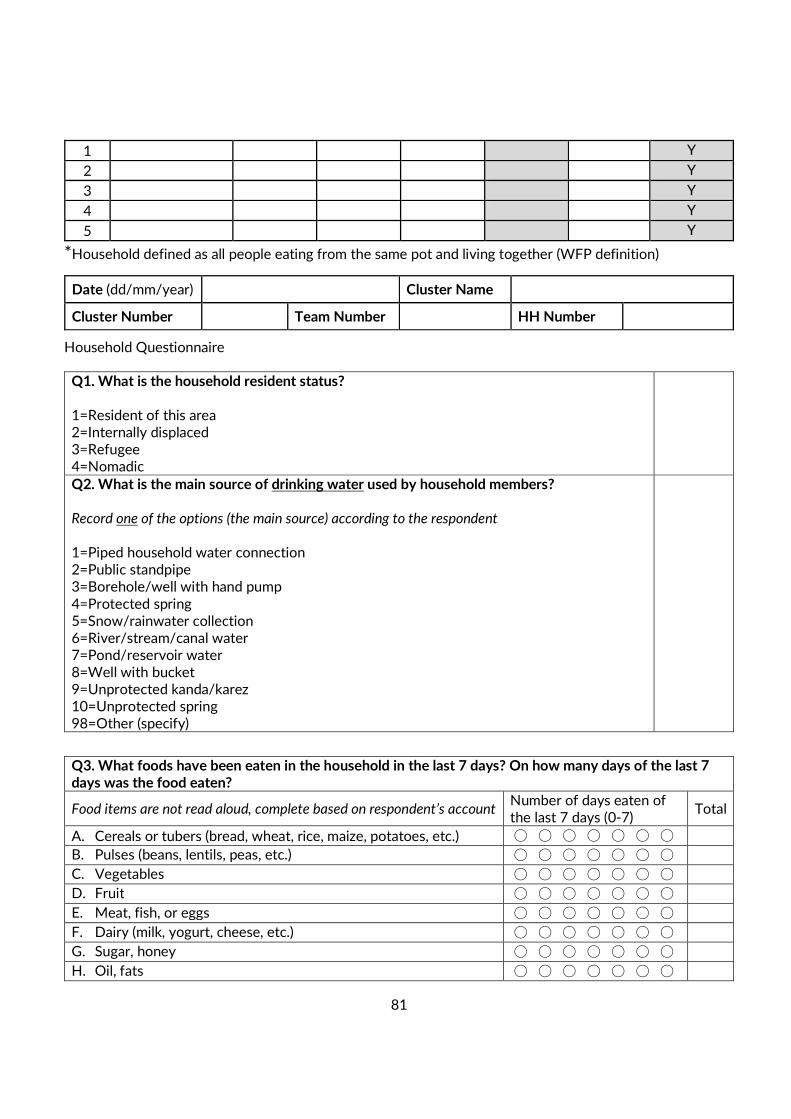
81
1 Y
2 Y
3 Y
4 Y
5 Y
*Household defined as all people eating from the same pot and living together (WFP definition)
Date (dd/mm/year) Cluster Name
Cluster Number Team Number HH Number
Household Questionnaire
Q1. What is the household resident status? 1=Resident of this area 2=Internally displaced 3=Refugee 4=Nomadic
Q2. What is the main source of drinking water used by household members? Record one of the options (the main source) according to the respondent
1=Piped household water connection 2=Public standpipe 3=Borehole/well with hand pump
4=Protected spring 5=Snow/rainwater collection 6=River/stream/canal water 7=Pond/reservoir water 8=Well with bucket 9=Unprotected kanda/karez 10=Unprotected spring 98=Other (specify)
Q3. What foods have been eaten in the household in the last 7 days? On how many days of the last 7 days was the food eaten?
Food items are not read aloud, complete based on respondent’s account Number of days eaten of the last 7 days (0-7)
Total
A. Cereals or tubers (bread, wheat, rice, maize, potatoes, etc.) ⃝ ⃝ ⃝ ⃝ ⃝ ⃝ ⃝
B. Pulses (beans, lentils, peas, etc.) ⃝ ⃝ ⃝ ⃝ ⃝ ⃝ ⃝
C. Vegetables ⃝ ⃝ ⃝ ⃝ ⃝ ⃝ ⃝
D. Fruit ⃝ ⃝ ⃝ ⃝ ⃝ ⃝ ⃝
E. Meat, fish, or eggs ⃝ ⃝ ⃝ ⃝ ⃝ ⃝ ⃝
F. Dairy (milk, yogurt, cheese, etc.) ⃝ ⃝ ⃝ ⃝ ⃝ ⃝ ⃝
G. Sugar, honey ⃝ ⃝ ⃝ ⃝ ⃝ ⃝ ⃝
H. Oil, fats ⃝ ⃝ ⃝ ⃝ ⃝ ⃝ ⃝
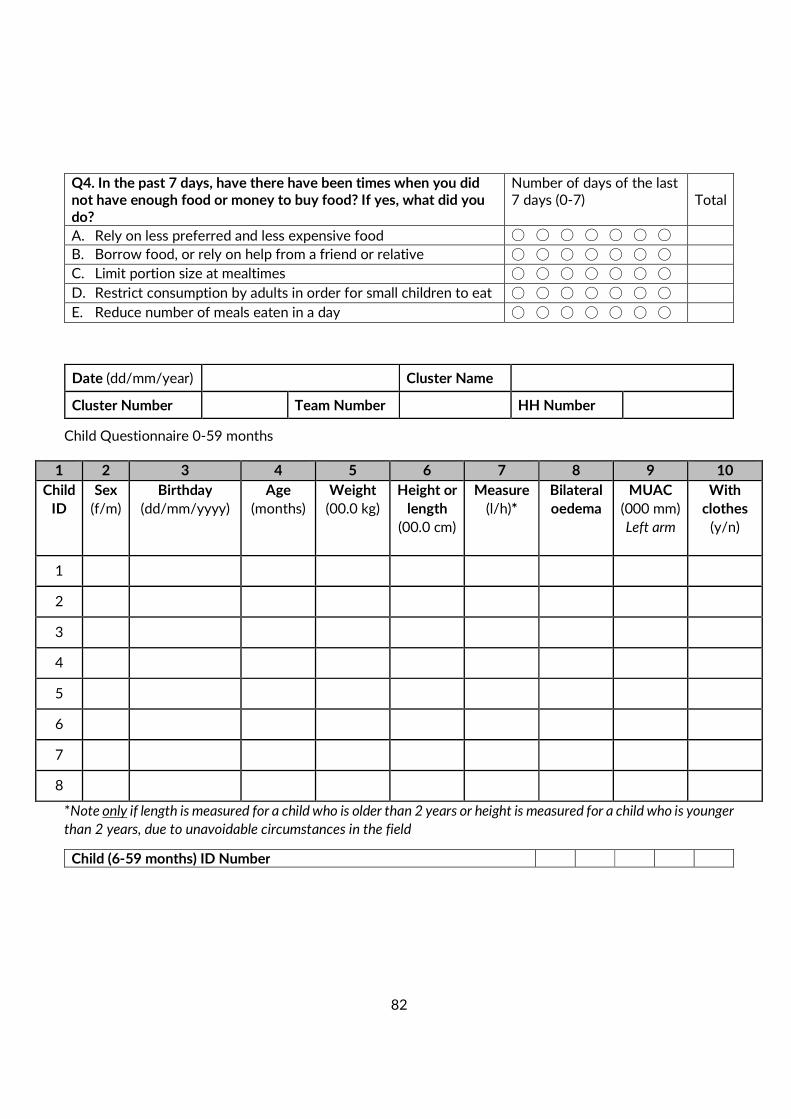
82
Q4. In the past 7 days, have there have been times when you did not have enough food or money to buy food? If yes, what did you do?
Number of days of the last 7 days (0-7) Total
A. Rely on less preferred and less expensive food ⃝ ⃝ ⃝ ⃝ ⃝ ⃝ ⃝
B. Borrow food, or rely on help from a friend or relative ⃝ ⃝ ⃝ ⃝ ⃝ ⃝ ⃝
C. Limit portion size at mealtimes ⃝ ⃝ ⃝ ⃝ ⃝ ⃝ ⃝
D. Restrict consumption by adults in order for small children to eat ⃝ ⃝ ⃝ ⃝ ⃝ ⃝ ⃝
E. Reduce number of meals eaten in a day ⃝ ⃝ ⃝ ⃝ ⃝ ⃝ ⃝
Date (dd/mm/year) Cluster Name
Cluster Number Team Number HH Number
Child Questionnaire 0-59 months
1 2 3 4 5 6 7 8 9 10
Child
ID
Sex
(f/m)
Birthday
(dd/mm/yyyy)
Age
(months)
Weight
(00.0 kg)
Height or
length
(00.0 cm)
Measure
(l/h)*
Bilateral
oedema
MUAC
(000 mm)
Left arm
With
clothes
(y/n)
1
2
3
4
5
6
7
8
*Note only if length is measured for a child who is older than 2 years or height is measured for a child who is younger
than 2 years, due to unavoidable circumstances in the field
Child (6-59 months) ID Number
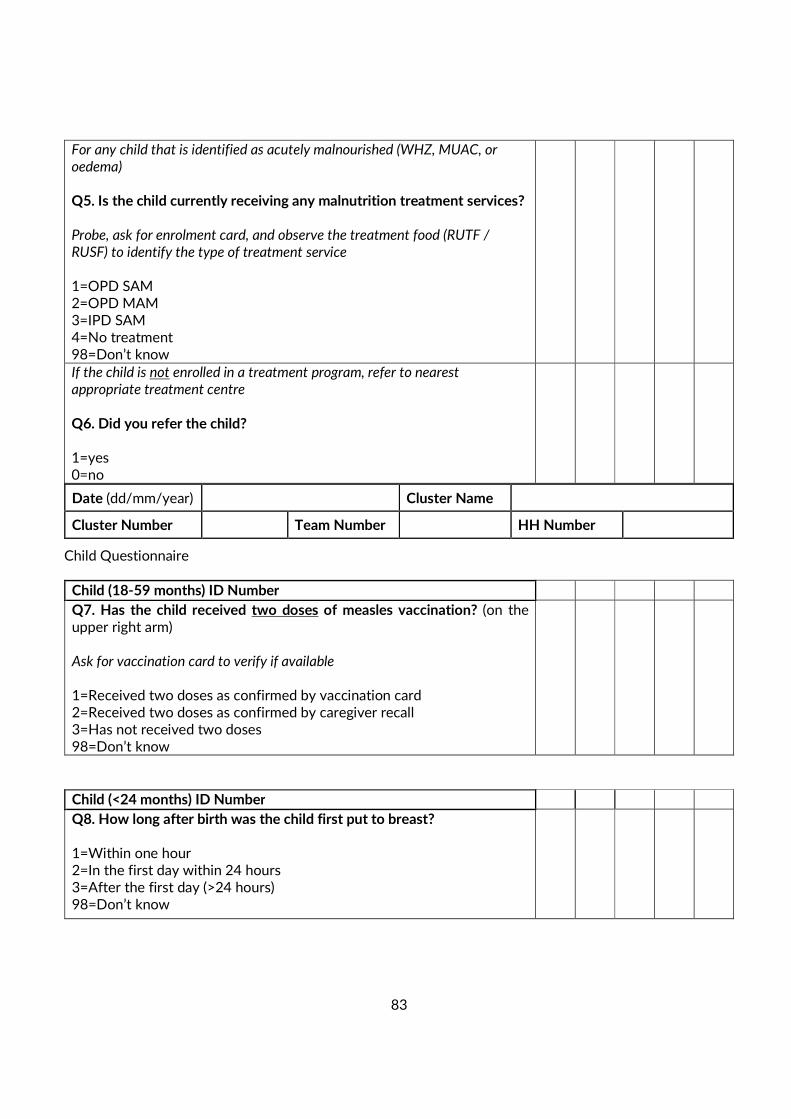
83
For any child that is identified as acutely malnourished (WHZ, MUAC, or oedema) Q5. Is the child currently receiving any malnutrition treatment services? Probe, ask for enrolment card, and observe the treatment food (RUTF / RUSF) to identify the type of treatment service 1=OPD SAM 2=OPD MAM 3=IPD SAM 4=No treatment 98=Don’t know
If the child is not enrolled in a treatment program, refer to nearest appropriate treatment centre
Q6. Did you refer the child? 1=yes 0=no
Date (dd/mm/year) Cluster Name
Cluster Number Team Number HH Number
Child Questionnaire
Child (18-59 months) ID Number
Q7. Has the child received two doses of measles vaccination? (on the upper right arm) Ask for vaccination card to verify if available 1=Received two doses as confirmed by vaccination card 2=Received two doses as confirmed by caregiver recall 3=Has not received two doses 98=Don’t know
Child (<24 months) ID Number
Q8. How long after birth was the child first put to breast? 1=Within one hour 2=In the first day within 24 hours 3=After the first day (>24 hours) 98=Don’t know
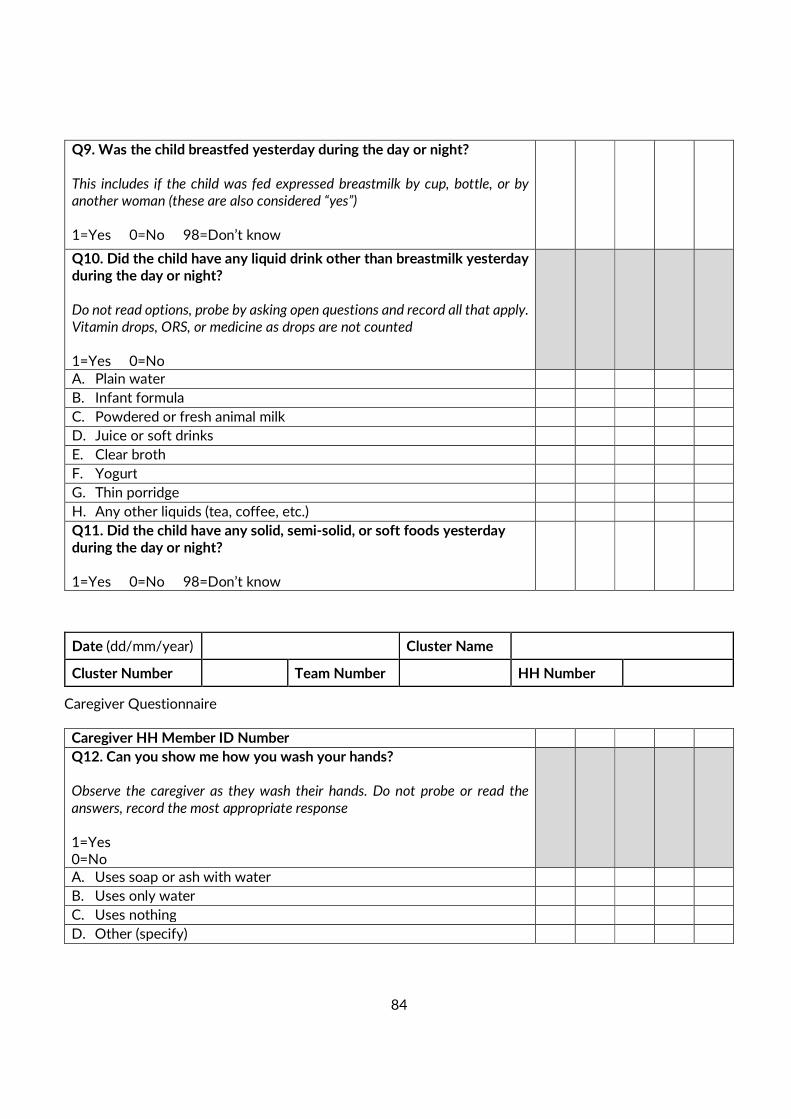
84
Q9. Was the child breastfed yesterday during the day or night? This includes if the child was fed expressed breastmilk by cup, bottle, or by another woman (these are also considered “yes”) 1=Yes 0=No 98=Don’t know
Q10. Did the child have any liquid drink other than breastmilk yesterday during the day or night? Do not read options, probe by asking open questions and record all that apply. Vitamin drops, ORS, or medicine as drops are not counted 1=Yes 0=No
A. Plain water
B. Infant formula
C. Powdered or fresh animal milk
D. Juice or soft drinks
E. Clear broth
F. Yogurt
G. Thin porridge
H. Any other liquids (tea, coffee, etc.)
Q11. Did the child have any solid, semi-solid, or soft foods yesterday during the day or night? 1=Yes 0=No 98=Don’t know
Date (dd/mm/year) Cluster Name
Cluster Number Team Number HH Number
Caregiver Questionnaire
Caregiver HH Member ID Number
Q12. Can you show me how you wash your hands? Observe the caregiver as they wash their hands. Do not probe or read the
answers, record the most appropriate response 1=Yes 0=No
A. Uses soap or ash with water
B. Uses only water
C. Uses nothing
D. Other (specify)
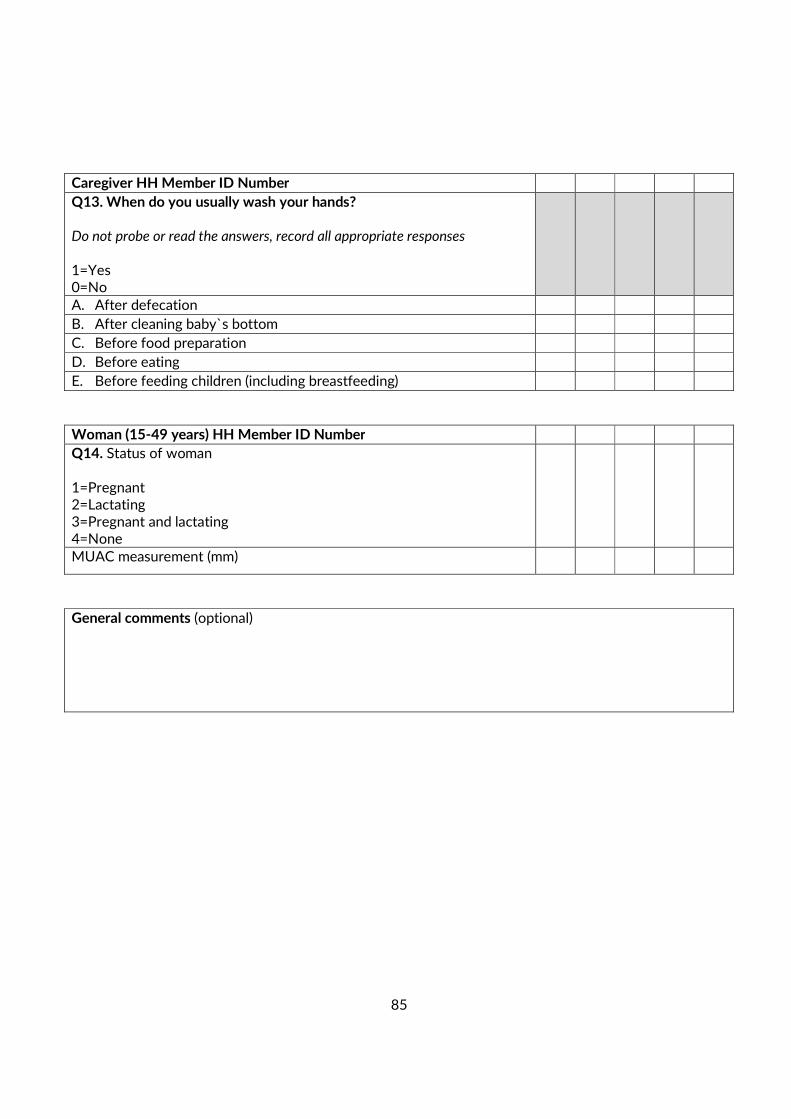
85
Caregiver HH Member ID Number
Q13. When do you usually wash your hands? Do not probe or read the answers, record all appropriate responses 1=Yes 0=No
A. After defecation
B. After cleaning baby`s bottom
C. Before food preparation
D. Before eating
E. Before feeding children (including breastfeeding)
Woman (15-49 years) HH Member ID Number
Q14. Status of woman
1=Pregnant 2=Lactating 3=Pregnant and lactating 4=None
MUAC measurement (mm)
General comments (optional)
86
11. REFERENCES
• ENA software 2011 updated 9th July 2015
• WHO Child Growth Standard 2006
• MEDAIR/ AAH Kandahar SMART survey August 2015
• Afghanistan Demographic and Health Survey (AfDHs) 2015
• WHO mortality emergency threshold
• WHO Emergency Severity classification
• Adapt from WFP Kabul Informal Settlements Winter Need Assessments final report on Food
Security December 8th 2015
• CSO updated population 1397 ( 2018)
• Myatt, M. et al (2018) Children who are both wasted and stunted are also underweight and have a
high risk of death: a descriptive epidemiology of multiple anthropometric deficits using data from
51 countries.
• The SPEHER Handbooks 2018