Embed Size (px)
Citation preview
Kellogg Company2013 Annual Report
Fiscal Year End: December 28, 2013
UNITED STATES SECURITIES AND EXCHANGE COMMISSIONWashington, D.C. 20549
FORM 10-KÍ ANNUAL REPORT PURSUANT TO SECTION 13 OR 15(d) OF THE SECURITIES EXCHANGE ACT OF 1934
For the Fiscal Year Ended December 28, 2013
‘ TRANSITION REPORT PURSUANT TO SECTION 13 OR 15(d) OF THE SECURITIES EXCHANGE ACT OF 1934
For The Transition Period From To
Commission file number 1-4171
Kellogg Company(Exact name of registrant as specified in its charter)
Delaware 38-0710690(State or other jurisdiction of Incorporation
or organization)(I.R.S. Employer Identification No.)
One Kellogg SquareBattle Creek, Michigan 49016-3599
(Address of Principal Executive Offices)
Registrant’s telephone number: (269) 961-2000
Securities registered pursuant to Section 12(b) of the Securities Act:
Title of each class: Name of each exchange on which registered:Common Stock, $.25 par value per share New York Stock Exchange
Securities registered pursuant to Section 12(g) of the Securities Act: None
Indicate by a check mark if the registrant is a well-known seasoned issuer, as defined in Rule 405 of the Securities Act. Yes Í No ‘
Indicate by check mark if the registrant is not required to file reports pursuant to Section 13 or Section 15 (d) of the Act. Yes ‘ No Í
Note — Checking the box above will not relieve any registrant required to file reports pursuant to Section 13 or 15(d) of the Exchange Act from theirobligations under those Sections.
Indicate by check mark whether the registrant: (1) has filed all reports required to be filed by Section 13 or 15(d) of the Securities Exchange Act of 1934during the preceding 12 months (or for such shorter period that the registrant was required to file such reports), and (2) has been subject to such filingrequirements for the past 90 days. Yes Í No ‘
Indicate by check mark whether the registrant has submitted electronically and posted on its website, if any, every Interactive Data File required to besubmitted and posted pursuant to Rule 405 of Regulation S-T during the preceding 12 months (or for such shorter period that the registrant was requiredto submit and post such files). Yes Í No ‘
Indicate by check mark if disclosure of delinquent filers pursuant to Item 405 of Regulation S-K is not contained herein, and will not be contained, to thebest of the registrant’s knowledge in definitive proxy or information statements incorporated by reference in Part III of this Form 10-K or any amendmentto this Form 10-K. Í
Indicate by check mark whether the registrant is a large accelerated filer, an accelerated filer, a non-accelerated filer or a smaller reporting company. Seethe definitions of “large accelerated filer,” “accelerated filer” and “smaller reporting company” in Rule 12b-2 of the Exchange Act. (Check one)
Large accelerated filer Í Accelerated filer ‘ Non-accelerated filer ‘ Smaller reporting company ‘
Indicate by check mark whether the registrant is a shell company (as defined in Rule 12b-2 of the Act). Yes ‘ No Í
The aggregate market value of the common stock held by non-affiliates of the registrant (assuming for purposes of this computation only that theW. K. Kellogg Foundation Trust, directors and executive officers may be affiliates) as of the close of business on June 29, 2013 was approximately $18.4billion based on the closing price of $64.23 for one share of common stock, as reported for the New York Stock Exchange on that date.
As of January 25, 2014, 361,686,112 shares of the common stock of the registrant were issued and outstanding.
Parts of the registrant’s Proxy Statement for the Annual Meeting of Shareowners to be held on April 25, 2014 are incorporated by reference into Part IIIof this Report.
PART IITEM 1. BUSINESS
The Company. Kellogg Company, founded in 1906 andincorporated in Delaware in 1922, and its subsidiariesare engaged in the manufacture and marketing ofready-to-eat cereal and convenience foods.
The address of the principal business office of KelloggCompany is One Kellogg Square, P.O. Box 3599, BattleCreek, Michigan 49016-3599. Unless otherwisespecified or indicated by the context, “Kellogg,” “we,”“us” and “our” refer to Kellogg Company, its divisionsand subsidiaries.
Financial Information About Segments. Information onsegments is located in Note 16 within Notes to theConsolidated Financial Statements.
Principal Products. Our principal products are ready-to-eat cereals and convenience foods, such as cookies,crackers, savory snacks, toaster pastries, cereal bars,fruit-flavored snacks, frozen waffles and veggie foods.These products were, as of February 24, 2014,manufactured by us in 18 countries and marketed inmore than 180 countries. Our cereal products aregenerally marketed under the Kellogg’s name and aresold to the grocery trade through direct sales forces forresale to consumers. We use broker and distributorarrangements for certain products. We also generallyuse these, or similar arrangements, in less-developedmarket areas or in those market areas outside of ourfocus.
We also market cookies, crackers, crisps, and otherconvenience foods, under brands such as Kellogg’s,Keebler, Cheez-It, Murray, Austin and FamousAmos, to supermarkets in the United States through adirect store-door (DSD) delivery system, although otherdistribution methods are also used.
Additional information pertaining to the relative sales ofour products for the years 2011 through 2013 islocated in Note 16 within Notes to the ConsolidatedFinancial Statements, which are included herein underPart II, Item 8.
Raw Materials. Agricultural commodities, includingcorn, wheat, potato flakes, soy bean oil, sugar andcocoa, are the principal raw materials used in ourproducts. Cartonboard, corrugated, and plastic are theprincipal packaging materials used by us. Wecontinually monitor world supplies and prices of suchcommodities (which include such packaging materials),as well as government trade policies. The cost of suchcommodities may fluctuate widely due to governmentpolicy and regulation, weather conditions, climatechange or other unforeseen circumstances. Continuousefforts are made to maintain and improve the quality
and supply of such commodities for purposes of ourshort-term and long-term requirements.
The principal ingredients in the products produced byus in the United States include corn grits, wheat andwheat derivatives, potato flakes, oats, rice, cocoa andchocolate, soybeans and soybean derivatives, variousfruits, sweeteners, flour, vegetable oils, dairy products,eggs, and other filling ingredients, which are obtainedfrom various sources. Most of these commodities arepurchased principally from sources in the United States.
We enter into long-term contracts for the commoditiesdescribed in this section and purchase these items onthe open market, depending on our view of possibleprice fluctuations, supply levels, and our relativenegotiating power. While the cost of some of thesecommodities has, and may continue to, increase overtime, we believe that we will be able to purchase anadequate supply of these items as needed. As furtherdiscussed herein under Part II, Item 7A, we also usecommodity futures and options to hedge some of ourcosts.
Raw materials and packaging needed for internationallybased operations are available in adequate supply andare sometimes imported from countries other thanthose where used in manufacturing.
Natural gas and propane are the primary sources ofenergy used to power processing ovens at majordomestic and international facilities, although certainlocations may use oil or propane on a back-up oralternative basis. In addition, considerable amounts ofdiesel fuel are used in connection with the distributionof our products. As further discussed herein underPart II, Item 7A, we use over-the-counter commodityprice swaps to hedge some of our natural gas costs.
Trademarks and Technology. Generally, our productsare marketed under trademarks we own. Our principaltrademarks are our housemarks, brand names, slogans,and designs related to cereals and convenience foodsmanufactured and marketed by us, and we also grantlicenses to third parties to use these marks on variousgoods. These trademarks include Kellogg’s for cereals,convenience foods and our other products, and thebrand names of certain ready-to-eat cereals, includingAll-Bran, Apple Jacks, Bran Buds, CinnamonCrunch Crispix, Choco Zucaritas, Cocoa Krispies,Complete, Kellogg’s Corn Flakes, Corn Pops,Cracklin’ Oat Bran, Crispix, Cruncheroos,Crunchmania, Crunchy Nut, Eggo, Kellogg’sFiberPlus, Froot Loops, Kellogg’s Frosted Flakes,Krave, Frosted Krispies, Frosted Mini-Wheats, FruitHarvest, Just Right, Kellogg’s Low Fat Granola,Mueslix, Pops, Product 19, Kellogg’s Raisin Bran,Raisin Bran Crunch, Rice Krispies, Rice Krispies
2
Treats, Smacks/Honey Smacks, Smart Start,Kellogg’s Smorz, Special K, Special K Red Berriesand Zucaritas in the United States and elsewhere;Crusli, Sucrilhos, Vector, Musli, NutriDia, andChoco Krispis for cereals in Latin America; Vive andVector in Canada; Coco Pops, Chocos, Frosties,Fruit‘N Fibre, Kellogg’s Crunchy Nut Corn Flakes,Krave, Honey Loops, Kellogg’s Extra, Sustain,Muslix, Country Store, Ricicles, Smacks, Start,Pops, Optima and Tresor for cereals in Europe; andCerola, Sultana Bran, Chex, Frosties, Goldies, RiceBubbles, Nutri-Grain, Kellogg’s Iron Man Food,and BeBig for cereals in Asia and Australia. Additionaltrademarks are the names of certain combinations ofready-to-eat Kellogg’s cereals, including Fun Pak,Jumbo, and Variety.
Other brand names include Kellogg’s Corn FlakeCrumbs; All-Bran, Choco Krispis, Froot Loops,Special K, NutriDia, Kuadri-Krispis, Zucaritas andCrusli for cereal bars, Komplete for biscuits; andKaos for snacks in Mexico and elsewhere in LatinAmerica; Pop-Tarts and Pop-Tarts Ice CreamShoppe for toaster pastries; Pop-Tarts Mini Crispsfor crackers; Eggo, Eggo FiberPlus and Nutri-Grainfor frozen waffles and pancakes; Rice Krispies Treatsfor convenience foods; Special K and Special K2Ofor flavored protein water mixes and protein shakes;Nutri-Grain cereal bars, Nutri-Grain yogurt bars, forconvenience foods in the United States and elsewhere;K-Time, Rice Bubbles, Day Dawn, Be Natural,Sunibrite and LCMs for convenience foods in Asiaand Australia; Nutri-Grain Squares, Nutri-GrainElevenses, and Rice Krispies Squares forconvenience foods in Europe; Kashi and GoLean forcertain cereals, nutrition bars, and mixes; TLC forgranola and cereal bars, crackers and cookies; SpecialK and Vector for meal replacement products; BearNaked for granola cereal, bars and trail mix, Pringlesfor potato crisps and sticks, and Morningstar Farms,Loma Linda, Natural Touch, Gardenburger andWorthington for certain meat and egg alternatives.
We also market convenience foods under trademarksand tradenames which include Keebler, Austin,Keebler Baker’s Treasures, Cheez-It, ChipsDeluxe, Club, E. L. Fudge, Famous Amos, FudgeShoppe, Kellogg’s FiberPlus, Gripz, Jack’s,Jackson’s, Krispy, Mother’s, Murray, MurraySugar Free, Ready Crust, Right Bites, Sandies,Special K, Soft Batch, Stretch Island, Sunshine,Toasteds, Town House, Vienna Creams, ViennaFingers, Wheatables and Zesta. One of oursubsidiaries is also the exclusive licensee of the Carr’scracker line in the United States.
Our trademarks also include logos and depictions ofcertain animated characters in conjunction with ourproducts, including Snap!Crackle!Pop! for CocoaKrispies and Rice Krispies cereals and Rice KrispiesTreats convenience foods; Tony the Tiger for
Kellogg’s Frosted Flakes, Zucaritas, Sucrilhos andFrosties cereals and convenience foods; ErnieKeebler for cookies, convenience foods and otherproducts; the Hollow Tree logo for certainconvenience foods; Toucan Sam for Froot Loopscereal; Dig ‘Em for Smacks/Honey Smacks cereal;Sunny for Kellogg’s Raisin Bran and Raisin BranCrunch cereals, Coco the Monkey for Coco Popscereal; Cornelius for Kellogg’s Corn Flakes; Melvinthe Elephant for certain cereal and convenience foods;Chocos the Bear, Sammy the Seal (aka Smaxey theSeal) for certain cereal products and Mr. P or JuliusPringles for Pringles potato crisps and sticks.
The slogans The Best To You Each Morning, TheOriginal & Best, They’re Gr-r-reat!, TheDifference is K, Supercharged, Earn Your Stripesand Gotta Have My Pops, are used in connectionwith our ready-to-eat cereals, along with L’ Eggo myEggo, used in connection with our frozen waffles andpancakes, Elfin Magic, Childhood Is Calling, TheCookies in the Passionate Purple Package.Uncommonly Good and Baked with Care used inconnection with convenience food products, SevenWhole Grains on a Mission used in connection withKashi natural foods and See Veggies Differentlyused in connection with meat and egg alternativesand Everything Pops With Pringles used inconnection with potato crisps are also importantKellogg trademarks.
The trademarks listed above, among others, whentaken as a whole, are important to our business.Certain individual trademarks are also important toour business. Depending on the jurisdiction,trademarks are generally valid as long as they are inuse and/or their registrations are properly maintainedand they have not been found to have becomegeneric. Registrations of trademarks can also generallybe renewed indefinitely as long as the trademarks arein use.
We consider that, taken as a whole, the rights underour various patents, which expire from time to time,are a valuable asset, but we do not believe that ourbusinesses are materially dependent on any singlepatent or group of related patents. Our activitiesunder licenses or other franchises or concessionswhich we hold are similarly a valuable asset, but arenot believed to be material.
Seasonality. Demand for our products has generallybeen approximately level throughout the year,although some of our convenience foods have a biasfor stronger demand in the second half of the yeardue to events and holidays. We also custom-bakecookies for the Girl Scouts of the U.S.A., which areprincipally sold in the first quarter of the year.
Working Capital. Although terms vary around theworld and by business types, in the United States we
3
generally have required payment for goods sold elevenor sixteen days subsequent to the date of invoice as2% 10/net 11 or 1% 15/net 16. Receipts from goodssold, supplemented as required by borrowings,provide for our payment of dividends, repurchases ofour common stock, capital expansion, and for otheroperating expenses and working capital needs.
Customers. Our largest customer, Wal-Mart Stores,Inc. and its affiliates, accounted for approximately21% of consolidated net sales during 2013, comprisedprincipally of sales within the United States. AtDecember 28, 2013, approximately 18% of ourconsolidated receivables balance and 30% of ourU.S. receivables balance was comprised of amountsowed by Wal-Mart Stores, Inc. and its affiliates. Noother customer accounted for greater than 10% ofnet sales in 2013. During 2013, our top fivecustomers, collectively, including Wal-Mart, accountedfor approximately 32% of our consolidated net salesand approximately 45% of U.S. net sales. There hasbeen significant worldwide consolidation in thegrocery industry in recent years and we believe thatthis trend is likely to continue. Although the loss ofany large customer for an extended length of timecould negatively impact our sales and profits, we donot anticipate that this will occur to a significantextent due to the consumer demand for our productsand our relationships with our customers. Ourproducts have been generally sold through our ownsales forces and through broker and distributorarrangements, and have been generally resold toconsumers in retail stores, restaurants, and other foodservice establishments.
Backlog. For the most part, orders are filled within afew days of receipt and are subject to cancellation atany time prior to shipment. The backlog of anyunfilled orders at December 28, 2013 andDecember 29, 2012 was not material to us.
Competition. We have experienced, and expect tocontinue to experience, intense competition for salesof all of our principal products in our major productcategories, both domestically and internationally. Ourproducts compete with advertised and brandedproducts of a similar nature as well as unadvertisedand private label products, which are typicallydistributed at lower prices, and generally with otherfood products. Principal methods and factors ofcompetition include new product introductions,product quality, taste, convenience, nutritional value,price, advertising and promotion.
Research and Development. Research to support andexpand the use of our existing products and todevelop new food products is carried on at the W. K.Kellogg Institute for Food and Nutrition Research inBattle Creek, Michigan, and at other locations aroundthe world. Our expenditures for research and
development were approximately (in millions):2013-$199; 2012-$206; 2011-$192.
Regulation. Our activities in the United States aresubject to regulation by various government agencies,including the Food and Drug Administration, FederalTrade Commission and the Departments ofAgriculture, Commerce and Labor, as well as voluntaryregulation by other bodies. Various state and localagencies also regulate our activities. Other agenciesand bodies outside of the United States, includingthose of the European Union and various countries,states and municipalities, also regulate our activities.
Environmental Matters. Our facilities are subject tovarious U.S. and foreign, federal, state, and local lawsand regulations regarding the release of material intothe environment and the protection of theenvironment in other ways. We are not a party to anymaterial proceedings arising under these regulations.We believe that compliance with existingenvironmental laws and regulations will not materiallyaffect our consolidated financial condition or ourcompetitive position.
Employees. At December 28, 2013, we hadapproximately 30,277 employees.
Financial Information About Geographic Areas.Information on geographic areas is located in Note 16within Notes to the Consolidated Financial Statements,which are included herein under Part II, Item 8.
Executive Officers. The names, ages, and positions ofour executive officers (as of February 24, 2014) arelisted below, together with their business experience.Executive officers are elected annually by the Board ofDirectors.
James M. Jenness . . . . . . . . . . . . . . . . . . . . . . . . . . .67Chairman of the Board
Mr. Jenness has been our Chairman since February2005 and has served as a Kellogg director since 2000.From February 2005 until December 2006, he alsoserved as our Chief Executive Officer. He was ChiefExecutive Officer of Integrated MerchandisingSystems, LLC, a leader in outsource management ofretail promotion and branded merchandising from1997 to December 2004. He is also Lead Director ofKimberly-Clark Corporation.
John A. Bryant . . . . . . . . . . . . . . . . . . . . . . . . . . . . . .48President and Chief Executive Officer
Mr. Bryant has served as a Kellogg director since July2010. In January 2011, he was appointed Presidentand Chief Executive Officer after having served as ourExecutive Vice President and Chief Operating Officer
4
since August 2008. Mr. Bryant joined Kellogg inMarch 1998, and was promoted during the next eightyears to a number of key financial and executiveleadership roles. He was appointed Executive VicePresident and Chief Financial Officer, KelloggCompany, President, Kellogg International inDecember 2006. In July 2007, Mr. Bryant wasappointed Executive Vice President and Chief FinancialOfficer, Kellogg Company, President, Kellogg NorthAmerica and in August 2008, he was appointedExecutive Vice President, Chief Operating Officer andChief Financial Officer. Mr. Bryant served as ChiefFinancial Officer through December 2009.
Ronald L. Dissinger . . . . . . . . . . . . . . . . . . . . . . . . . .55Senior Vice President and Chief Financial Officer
Ron Dissinger was appointed Senior Vice Presidentand Chief Financial Officer effective January2010. Mr. Dissinger joined Kellogg in 1987 as anaccounting supervisor, and during the next 14 yearsserved in a number of key financial leadership roles,both in the United States and Australia. In 2001, hewas promoted to Vice President and Chief FinancialOfficer, U.S. Morning Foods. In 2004, Mr. Dissingerbecame Vice President, Corporate Financial Planning,and CFO, Kellogg International. In 2005, he becameVice President and CFO, Kellogg Europe and CFO,Kellogg International. In 2007, Mr. Dissinger wasappointed Senior Vice President and Chief FinancialOfficer, Kellogg North America.
Alistair D. Hirst . . . . . . . . . . . . . . . . . . . . . . . . . . . . . .54Senior Vice President, Global Supply Chain
Mr. Hirst assumed his current position in April 2012.He joined the company in 1984 as a FoodTechnologist at the Springs, South Africa, plant. Whileat the facility, he was promoted to Quality AssuranceManager and Production Manager. From 1993-2001,Mr. Hirst held numerous positions in South Africa andAustralia, including Production Manager, PlantManager, and Director, Supply Chain. In 2001,Mr. Hirst was promoted to Director, Procurement atthe Manchester, England, facility and was later namedEuropean Logistics Director. In 2005, he transferred tothe U.S. when promoted to Vice President, GlobalProcurement. In 2008, he was promoted to SeniorVice President, Snacks Supply Chain and to Senior VicePresident, North America Supply Chain, in October2011.
Samantha J. Long . . . . . . . . . . . . . . . . . . . . . . . . . . .46Senior Vice President, Global Human Resources
Ms. Long assumed her current position January 1,2013. She joined the company in 2003 as Director,Human Resources for the United Kingdom, Republic ofIreland and Middle East/Mediterranean businesses aswell as the European finance, sales, human resources,
research and development, information technology,communications and innovations functions. In 2006,Ms. Long transferred to the United States when shewas promoted to Vice President, Human Resources,U.S. Morning Foods & Kashi. She also served ashuman resources business partner to the senior vicepresident of global human resources. From 2008 to2013, she held the position of Vice President, HumanResources, Kellogg North America. Before joining thecompany, she was head of human resources for SharpElectronics based in the United Kingdom. Prior to thatrole, she held a number of positions in her 15-yeartenure with International Computers Limited, part ofthe Fujitsu family of companies.
Paul T. Norman . . . . . . . . . . . . . . . . . . . . . . . . . . . . .49Senior Vice President, Kellogg CompanyChief Growth Officer
Paul Norman was appointed Senior Vice President,Kellogg Company in December 2005 and ChiefGrowth Officer in October 2013. Mr. Norman joinedKellogg’s U.K. sales organization in 1987. From 1989to 1996, Mr. Norman was promoted to severalmarketing roles in France and Canada. He waspromoted to director, marketing, Kellogg de Mexico inJanuary 1997; to Vice President, Marketing, KelloggUSA in February 1999; to President, Kellogg CanadaInc. in December 2000; and to Managing Director,United Kingdom/Republic of Ireland in February 2002.In September 2004, Mr. Norman was appointed toVice President, Kellogg Company, and President,U.S. Morning Foods. In August 2008, Mr. Norman waspromoted to President, Kellogg International.
Gary H. Pilnick . . . . . . . . . . . . . . . . . . . . . . . . . . . . . .49Senior Vice President, General Counsel,Corporate Development and Secretary
Mr. Pilnick was appointed Senior Vice President,General Counsel and Secretary in August 2003 andassumed responsibility for Corporate Development inJune 2004. He joined Kellogg as Vice President —Deputy General Counsel and Assistant Secretary inSeptember 2000 and served in that position untilAugust 2003. Before joining Kellogg, he served as VicePresident and Chief Counsel of Sara Lee BrandedApparel and as Vice President and Chief Counsel,Corporate Development and Finance at Sara LeeCorporation.
Maribeth A. Dangel . . . . . . . . . . . . . . . . . . . . . . . . . .48Vice President and Corporate Controller
Ms. Dangel assumed her current position in April2012. She joined Kellogg Company in 1997 as amanager in the tax department. In 2006, Ms. Dangelbecame a manager for accounting research, waspromoted to director, corporate financial reporting in2007, and was promoted to vice president, financial
5
reporting in May 2010. Before joining the company,she was a tax manager for Price Waterhouse inIndianapolis, Indiana. Prior to that role, she worked asa tax specialist for Dow Corning Corporation inMidland, Michigan.
Availability of Reports; Website Access; OtherInformation. Our internet address ishttp://www.kelloggcompany.com. Through “InvestorRelations” — “Financials” — “SEC Filings” on ourhome page, we make available free of charge ourproxy statements, our annual report on Form 10-K,our quarterly reports on Form 10-Q, our currentreports on Form 8-K, SEC Forms 3, 4 and 5 and anyamendments to those reports filed or furnishedpursuant to Section 13(a) or 15(d) of the SecuritiesExchange Act of 1934 as soon as reasonablypracticable after we electronically file such materialwith, or furnish it to, the Securities and ExchangeCommission. Our reports filed with the Securities andExchange Commission are also made available to readand copy at the SEC’s Public Reference Room at100 F Street, N.E., Washington, D.C. 20549. You mayobtain information about the Public Reference Roomby contacting the SEC at 1-800-SEC-0330. Reportsfiled with the SEC are also made available on itswebsite at www.sec.gov.
Copies of the Corporate Governance Guidelines, theCharters of the Audit, Compensation and Nominatingand Governance Committees of the Board ofDirectors, the Code of Conduct for Kellogg Companydirectors and Global Code of Ethics for KelloggCompany employees (including the chief executiveofficer, chief financial officer and corporate controller)can also be found on the Kellogg Company website.Any amendments or waivers to the Global Code ofEthics applicable to the chief executive officer, chieffinancial officer and corporate controller can also befound in the “Investor Relations” section of theKellogg Company website. Shareowners may alsorequest a free copy of these documents from: KelloggCompany, P.O. Box CAMB, Battle Creek, Michigan49016-9935 (phone: (800) 961-1413), InvestorRelations Department at that same address (phone:(269) 961-2800) or [email protected].
Forward-Looking Statements. This Report contains“forward-looking statements” with projectionsconcerning, among other things, the Company’sglobal growth and efficiency program (Project K), theintegration of the Pringles® business, our strategy,financial principles, and plans; initiatives,improvements and growth; sales, gross margins,advertising, promotion, merchandising, brandbuilding, operating profit, and earnings per share;innovation; investments; capital expenditures; assetwrite-offs and expenditures and costs related toproductivity or efficiency initiatives; the impact ofaccounting changes and significant accountingestimates; our ability to meet interest and debt
principal repayment obligations; minimum contractualobligations; future common stock repurchases or debtreduction; effective income tax rate; cash flow andcore working capital improvements; interest expense;commodity and energy prices; and employee benefitplan costs and funding. Forward-looking statementsinclude predictions of future results or activities andmay contain the words “expect,” “believe,” “will,”“can,” “anticipate,” “estimate,” “project,” “should,”or words or phrases of similar meaning. For example,forward-looking statements are found in this Item 1and in several sections of Management’s Discussionand Analysis. Our actual results or activities may differmaterially from these predictions. Our future resultscould be affected by a variety of factors, including theability to implement Project K as planned, whether theexpected amount of costs associated with Project Kwill exceed forecasts, whether the Company will beable to realize the anticipated benefits from Project Kin the amounts and times expected, the ability torealize the anticipated benefits and synergies from thePringles® acquisition in the amounts and at the timesexpected, the impact of competitive conditions; theeffectiveness of pricing, advertising, and promotionalprograms; the success of innovation, renovation andnew product introductions; the recoverability of thecarrying value of goodwill and other intangibles; thesuccess of productivity improvements and businesstransitions; commodity and energy prices; labor costs;disruptions or inefficiencies in supply chain; theavailability of and interest rates on short-term andlong-term financing; actual market performance ofbenefit plan trust investments; the levels of spendingon systems initiatives, properties, businessopportunities, integration of acquired businesses, andother general and administrative costs; changes inconsumer behavior and preferences; the effect ofU.S. and foreign economic conditions on items such asinterest rates, statutory tax rates, currency conversionand availability; legal and regulatory factors includingchanges in food safety, advertising and labeling lawsand regulations; the ultimate impact of productrecalls; business disruption or other losses from war,terrorist acts, or political unrest; other items; and therisks and uncertainties described in Item 1A below.Forward-looking statements speak only as of the datethey were made, and we undertake no obligation topublicly update them.
ITEM 1A. RISK FACTORS
In addition to the factors discussed elsewhere in thisReport, the following risks and uncertainties couldmaterially adversely affect our business, financialcondition and results of operations. Additional risksand uncertainties not presently known to us or thatwe currently deem immaterial also may impair ourbusiness operations and financial condition.
6
We may not realize the benefits that we expect fromour global four-year efficiency and effectivenessprogram (Project K).
In November 2013, the Company announced a globalfour-year efficiency and effectiveness program(Project K). The successful implementation of Project Kpresents significant organizational design andinfrastructure challenges and in many cases willrequire successful negotiations with third parties,including labor organizations, suppliers, businesspartners, and other stakeholders. In addition, theproject may not advance our business strategy asexpected. As a result, we may not be able toimplement Project K as planned, including realizing, infull or in part, the anticipated benefits from ourprogram. Events and circumstances, such as financialor strategic difficulties, delays and unexpected costsmay occur that could result in our not realizing all orany of the anticipated benefits or our not realizing theanticipated benefits on our expected timetable. If weare unable to realize the anticipated savings of theprogram, our ability to fund other initiatives may beadversely affected. Any failure to implement Project Kin accordance with our expectations could adverselyaffect our financial condition, results of operationsand cash flows.
In addition, the complexity of Project K will require asubstantial amount of management and operationalresources. Our management team must successfullyimplement administrative and operational changesnecessary to achieve the anticipated benefits ofProject K. These and related demands on ourresources may divert the organization’s attention fromexisting core businesses, integrating or separatingpersonnel and financial or other systems, have adverseeffects on existing business relationships with suppliersand customers, and impact employee morale. As aresult our financial condition, results of operations orcash flows may be adversely affected.
Our results may be materially and adversely impactedas a result of increases in the price of raw materials,including agricultural commodities, fuel and labor.
Agricultural commodities, including corn, wheat,soybean oil, sugar and cocoa, are the principal rawmaterials used in our products. Cartonboard,corrugated, and plastic are the principal packagingmaterials used by us. The cost of such commoditiesmay fluctuate widely due to government policy andregulation, weather conditions, climate change orother unforeseen circumstances. To the extent thatany of the foregoing factors affect the prices of suchcommodities and we are unable to increase our pricesor adequately hedge against such changes in prices ina manner that offsets such changes, the results of ouroperations could be materially and adversely affected.In addition, we use derivatives to hedge price riskassociated with forecasted purchases of raw materials.
Our hedged price could exceed the spot price on thedate of purchase, resulting in an unfavorable impacton both gross margin and net earnings.
Cereal processing ovens at major domestic andinternational facilities are regularly fueled by naturalgas or propane, which are obtained from local utilitiesor other local suppliers. Short-term stand-by propanestorage exists at several plants for use in case ofinterruption in natural gas supplies. Oil may also beused to fuel certain operations at various plants. Inaddition, considerable amounts of diesel fuel are usedin connection with the distribution of our products.The cost of fuel may fluctuate widely due to economicand political conditions, government policy andregulation, war, or other unforeseen circumstanceswhich could have a material adverse effect on ourconsolidated operating results or financial condition.
A shortage in the labor pool, failure to successfullynegotiate collectively bargained agreements, or othergeneral inflationary pressures or changes in applicablelaws and regulations could increase labor cost, whichcould have a material adverse effect on ourconsolidated operating results or financial condition.
Additionally, our labor costs include the cost ofproviding benefits for employees. We sponsor anumber of defined benefit plans for employees in theUnited States and various foreign locations, includingpension, retiree health and welfare, active health care,severance and other postemployment benefits. Wealso participate in a number of multiemployer pensionplans for certain of our manufacturing locations. Ourmajor pension plans and U.S. retiree health andwelfare plans are funded with trust assets invested ina globally diversified portfolio of equity securities withsmaller holdings of bonds, real estate and otherinvestments. The annual cost of benefits can varysignificantly from year to year and is materiallyaffected by such factors as changes in the assumed oractual rate of return on major plan assets, a change inthe weighted-average discount rate used to measureobligations, the rate or trend of health care costinflation, and the outcome of collectively-bargainedwage and benefit agreements. Many of ouremployees are covered by collectively-bargainedagreements and other employees may seek to becovered by collectively-bargained agreements. Strikesor work stoppages and interruptions could occur if weare unable to renew these agreements on satisfactoryterms or enter into new agreements on satisfactoryterms, which could adversely impact our operatingresults. The terms and conditions of existing,renegotiated or new agreements could also increaseour costs or otherwise affect our ability to fullyimplement future operational changes to enhance ourefficiency.
7
Multiemployer Pension Plans could adversely affect ourbusiness.
We participate in various “multiemployer” pensionplans administered by labor unions representing someof our employees. We make periodic contributions tothese plans to allow them to meet their pensionbenefit obligations to their participants. Our requiredcontributions to these funds could increase because ofa shrinking contribution base as a result of theinsolvency or withdrawal of other companies thatcurrently contribute to these funds, inability or failureof withdrawing companies to pay their withdrawalliability, lower than expected returns on pension fundassets or other funding deficiencies. In the event thatwe withdraw from participation in one of these plans,then applicable law could require us to make anadditional lump-sum contribution to the plan, and wewould have to reflect that as an expense in ourconsolidated statement of operations and as a liabilityon our consolidated balance sheet. Our withdrawalliability for any multiemployer plan would depend onthe extent of the plan’s funding of vested benefits. Inthe ordinary course of our renegotiation of collectivebargaining agreements with labor unions thatmaintain these plans, we may decide to discontinueparticipation in a plan, and in that event, we couldface a withdrawal liability. Some multiemployer plansin which we participate are reported to havesignificant underfunded liabilities. Such underfundingcould increase the size of our potential withdrawalliability.
We operate in the highly competitive food industry.
We face competition across our product lines,including ready-to-eat cereals and convenience foods,from other companies which have varying abilities towithstand changes in market conditions. Most of ourcompetitors have substantial financial, marketing andother resources, and competition with them in ourvarious markets and product lines could cause us toreduce prices, increase capital, marketing or otherexpenditures, or lose category share, any of whichcould have a material adverse effect on our businessand financial results. Category share and growth couldalso be adversely impacted if we are not successful inintroducing new products.
We may be unable to maintain our profit margins inthe face of a consolidating retail environment. Inaddition, the loss of one of our largest customerscould negatively impact our sales and profits.
Our largest customer, Wal-Mart Stores, Inc. and itsaffiliates, accounted for approximately 21% ofconsolidated net sales during 2013, comprisedprincipally of sales within the United States. AtDecember 28, 2013, approximately 18% of ourconsolidated receivables balance and 30% of ourU.S. receivables balance was comprised of amounts
owed by Wal-Mart Stores, Inc. and its affiliates. Noother customer accounted for greater than 10% ofnet sales in 2013. During 2013, our top fivecustomers, collectively, including Wal-Mart, accountedfor approximately 32% of our consolidated net salesand approximately 45% of U.S. net sales. As the retailgrocery trade continues to consolidate and massmarketers become larger, our large retail customersmay seek to use their position to improve theirprofitability through improved efficiency, lower pricingand increased promotional programs. If we are unableto use our scale, marketing expertise, productinnovation and category leadership positions torespond, our profitability or volume growth could benegatively affected. The loss of any large customer foran extended length of time could negatively impactour sales and profits.
Our results may be negatively impacted if consumersdo not maintain their favorable perception of ourbrands.
We have a number of iconic brands with significantvalue. Maintaining and continually enhancing thevalue of these brands is critical to the success of ourbusiness. Brand value is based in large part onconsumer perceptions. Success in promoting andenhancing brand value depends in large part on ourability to provide high-quality products. Brand valuecould diminish significantly due to a number offactors, including consumer perception that we haveacted in an irresponsible manner, adverse publicityabout our products (whether or not valid), our failureto maintain the quality of our products, the failure ofour products to deliver consistently positive consumerexperiences, or the products becoming unavailable toconsumers. The growing use of social and digitalmedia by consumers, Kellogg and third partiesincreases the speed and extent that information ormisinformation and opinions can be shared. Negativeposts or comments about Kellogg, our brands or ourproducts on social or digital media could seriouslydamage our brands and reputation. If we do notmaintain the favorable perception of our brands, ourresults could be negatively impacted.
Tax matters, including changes in tax rates,disagreements with taxing authorities and impositionof new taxes could impact our results of operationsand financial condition.
Our profits earned outside the U.S. are generally taxedat lower rates than the U.S. statutory rates. The cashwe generate outside the U.S. is principally to be usedto fund our international development. If the fundsgenerated by our U.S. business are not sufficient tomeet our need for cash in the U.S., we may need torepatriate a portion of our future internationalearnings to the U.S. Such international earnings wouldbe subject to U.S. tax which could cause ourworldwide effective tax rate to increase.
8
We are subject to income taxes as well as non-incomebased taxes, such as payroll, sales, use, value-added,net worth, property, withholding and franchise taxesin both the U.S. and various foreign jurisdictions. Weare also subject to regular reviews, examinations andaudits by the Internal Revenue Service and othertaxing authorities with respect to such income andnon-income based taxes inside and outside of the U.S.Although we believe our tax estimates are reasonable,if a taxing authority disagrees with the positions wehave taken, we could face additional tax liability,including interest and penalties. There can be noassurance that payment of such additional amountsupon final adjudication of any disputes will not have amaterial impact on our results of operations andfinancial position.
The enactment of or increases in tariffs, includingvalue added tax, or other changes in the application ofexisting taxes, in markets in which we are currentlyactive, for example, in Mexico, or may be active in thefuture, or on specific products that we sell or withwhich our products compete, may have an adverseeffect on our business or on our results of operations.
If our food products become adulterated, misbrandedor mislabeled, we might need to recall those itemsand may experience product liability if consumers areinjured as a result.
Selling food products involves a number of legal andother risks, including product contamination, spoilage,product tampering, allergens, or other adulteration.We may need to recall some of our products if theybecome adulterated or misbranded. We may also beliable if the consumption of any of our productscauses injury, illness or death. A widespread productrecall or market withdrawal could result in significantlosses due to their costs, the destruction of productinventory, and lost sales due to the unavailability ofproduct for a period of time. For example, in October2012, we initiated a recall of certain packages of Mini-Wheats cereal due to the possible presence offragments of flexible metal mesh from a faultymanufacturing part. We could also suffer losses froma significant product liability judgment against us. Asignificant product recall or product liability case couldalso result in adverse publicity, damage to ourreputation, and a loss of consumer confidence in ourfood products, which could have a material adverseeffect on our business results and the value of ourbrands. Moreover, even if a product liability orconsumer fraud claim is meritless, does not prevail oris not pursued, the negative publicity surroundingassertions against our company and our products orprocesses could adversely affect our reputation orbrands.
We could also be adversely affected if consumers loseconfidence in the safety and quality of certain foodproducts or ingredients, or the food safety system
generally. Adverse publicity about these types ofconcerns, whether or not valid, may discourageconsumers from buying our products or causeproduction and delivery disruptions.
Disruption of our supply chain could have an adverseeffect on our business, financial condition and resultsof operations.
Our ability, including manufacturing or distributioncapabilities, and that of our suppliers, businesspartners and contract manufacturers, to make, moveand sell products is critical to our success. Damage ordisruption to our or their manufacturing ordistribution capabilities due to weather, including anypotential effects of climate change, natural disaster,fire or explosion, terrorism, pandemics, strikes, repairsor enhancements at our facilities, or other reasons,could impair our ability to manufacture or sell ourproducts. Failure to take adequate steps to mitigatethe likelihood or potential impact of such events, or toeffectively manage such events if they occur, couldadversely affect our business, financial condition andresults of operations, as well as require additionalresources to restore our supply chain.
Evolving tax, environmental, food quality and safety orother regulations or failure to comply with existinglicensing, labeling, trade, food quality and safety andother regulations and laws could have a materialadverse effect on our consolidated financial condition.
Our activities, both in and outside of the UnitedStates, are subject to regulation by various federal,state, provincial and local laws, regulations andgovernment agencies, including the U.S. Food andDrug Administration, U.S. Federal Trade Commission,the U.S. Departments of Agriculture, Commerce andLabor, as well as similar and other authorities outsidethe United States, International Accords and Treatiesand others, including voluntary regulation by otherbodies. In addition, legal and regulatory systems inemerging and developing markets may be lessdeveloped, and less certain. These laws andregulations and interpretations thereof may change,sometimes dramatically, as a result of a variety offactors, including political, economic or social events.The manufacturing, marketing and distribution offood products are subject to governmental regulationthat impose additional regulatory requirements. Thoseregulations control such matters as food quality andsafety, ingredients, advertising, product or productionrequirements, labeling, import or export of ourproducts or ingredients, relations with distributors andretailers, health and safety, the environment, andrestrictions on the use of government programs, suchas Supplemental Nutrition Assistance Program, topurchase certain of our products. We are alsoregulated with respect to matters such as licensingrequirements, trade and pricing practices, tax,
9
anticorruption standards, and environmental matters.The need to comply with new, evolving or revised tax,environmental, food quality and safety or other lawsor regulations, or new, evolving or changedinterpretations or enforcement of existing laws orregulations, may have a material adverse effect on ourbusiness and results of operations. Further, if we arefound to be out of compliance with applicable lawsand regulations in these areas, we could be subject tocivil remedies, including fines, injunctions, terminationof necessary licenses or permits, or recalls, as well aspotential criminal sanctions, any of which could have amaterial adverse effect on our business. Even ifregulatory review does not result in these types ofdeterminations, it could potentially create negativepublicity or perceptions which could harm ourbusiness or reputation.
Our operations face significant foreign currencyexchange rate exposure and currency restrictionswhich could negatively impact our operating results.
We hold assets and incur liabilities, earn revenue andpay expenses in a variety of currencies other than theU.S. dollar, including the euro, British pound,Australian dollar, Canadian dollar, Mexican peso,Venezuelan bolivar fuerte and Russian ruble. Becauseour consolidated financial statements are presented inU.S. dollars, we must translate our assets, liabilities,revenue and expenses into U.S. dollars at then-applicable exchange rates. Consequently, changes inthe value of the U.S. dollar may unpredictably andnegatively affect the value of these items in ourconsolidated financial statements, even if their valuehas not changed in their original currency.
If we pursue strategic acquisitions, alliances,divestitures or joint ventures, we may not be able tosuccessfully consummate favorable transactions orsuccessfully integrate acquired businesses.
From time to time, we may evaluate potentialacquisitions, alliances, divestitures or joint venturesthat would further our strategic objectives. Withrespect to acquisitions, we may not be able to identifysuitable candidates, consummate a transaction onterms that are favorable to us, or achieve expectedreturns and other benefits as a result of integrationchallenges. With respect to proposed divestitures ofassets or businesses, we may encounter difficulty infinding acquirers or alternative exit strategies on termsthat are favorable to us, which could delay theaccomplishment of our strategic objectives, or ourdivestiture activities may require us to recognizeimpairment charges. Companies or operationsacquired or joint ventures created may not beprofitable or may not achieve sales levels andprofitability that justify the investments made. Ourcorporate development activities may present financialand operational risks, including diversion ofmanagement attention from existing core businesses,
integrating or separating personnel and financial andother systems, and adverse effects on existing businessrelationships with suppliers and customers. Futureacquisitions could also result in potentially dilutiveissuances of equity securities, the incurrence of debt,contingent liabilities and/or amortization expensesrelated to certain intangible assets and increasedoperating expenses, which could adversely affect ourresults of operations and financial condition.
We may not be able to fully realize the anticipatedbenefits and synergies of the Pringles acquisition or inthe expected time frame.
The overall success of the Pringles acquisition willdepend, in part, on our ability to realize theanticipated benefits and synergies from combiningand integrating the Pringles business into our existingbusiness. We may not be able to fully achieve theseobjectives, or may not be able to achieve theseobjectives on a timely basis, and the anticipated futurebenefits and synergies therefore may not be realizedfully or at all. We may also incur unanticipated costs.The acquisition involves challenges and risks, includingrisks that the transaction does not advance ourbusiness strategy or that we will not realize asatisfactory return. Any integration difficulties coulddecrease or eliminate the anticipated benefits andsynergies of the Pringles acquisition and couldnegatively affect the trading prices of our stock andour future business and financial results.
Potential liabilities and costs from litigation couldadversely affect our business.
There is no guarantee that we will be successful indefending our self in civil, criminal or regulatoryactions, including under general, commercial,employment, environmental, food quality and safety,anti-trust and trade, and environmental laws andregulations, or in asserting its rights under variouslaws. In addition, we could incur substantial costs andfees in defending our self or in asserting our rights inthese actions or meeting new legal requirements. Thecosts and other effects of potential and pendinglitigation and administrative actions against us, andnew legal requirements, cannot be determined withcertainty and may differ from expectations.
Our consolidated financial results and demand for ourproducts are dependent on the successfuldevelopment of new products and processes.
There are a number of trends in consumer preferenceswhich may impact us and the industry as a whole.These include changing consumer dietary trends andthe availability of substitute products.
Our success is dependent on anticipating changes inconsumer preferences and on successful new productand process development and product relaunches in
10
response to such changes. We aim to introduceproducts or new or improved production processes ona timely basis in order to counteract obsolescence anddecreases in sales of existing products. While wedevote significant focus to the development of newproducts and to the research, development andtechnology process functions of our business, we maynot be successful in developing new products or ournew products may not be commercially successful.Our future results and our ability to maintain orimprove our competitive position will depend on ourcapacity to gauge the direction of our key marketsand upon our ability to successfully identify, develop,manufacture, market and sell new or improvedproducts in these changing markets.
Our postretirement benefit-related costs and fundingrequirements could increase as a result of volatility inthe financial markets, changes in interest rates andactuarial assumptions.
Increases in the costs of postretirement medical andpension benefits may continue and negatively affectour business as a result of increased usage of medicalbenefits by retired employees and medical costinflation, the effect of potential declines in the stockand bond markets on the performance of our pensionand post-retirement plan assets, potential reductionsin the discount rate used to determine the presentvalue of our benefit obligations, and changes to ourinvestment strategy that may impact our expectedreturn on pension and post-retirement plan assetsassumptions. U.S. generally accepted accountingprinciples require that we calculate income or expensefor the plans using actuarial valuations. Thesevaluations reflect assumptions about financial marketsand interest rates, which may change based oneconomic conditions. The Company’s accountingpolicy for defined benefit plans may subject earningsto volatility due to the recognition of actuarial gainsand losses, particularly those due to the change in thefair value of pension and post-retirement plan assetsand interest rates. In addition, funding requirementsfor our plans may become more significant. However,the ultimate amounts to be contributed aredependent upon, among other things, interest rates,underlying asset returns, and the impact of legislativeor regulatory changes related to pension and post-retirement funding obligations.
We have a substantial amount of indebtedness.
We have indebtedness that is substantial in relation toour shareholders’ equity. As of December 28, 2013,we had total debt of approximately $7.4 billion andtotal Kellogg Company equity of $3.5 billion.
Our substantial indebtedness could have importantconsequences, including:
• impairing the ability to access global capitalmarkets to obtain additional financing for working
capital, capital expenditures or general corporatepurposes, particularly if the ratings assigned to ourdebt securities by rating organizations were reviseddownward or if a rating organization announcesthat our ratings are under review for a potentialdowngrade;
• a downgrade in our credit ratings, particularly ourshort-term credit rating, would likely reduce theamount of commercial paper we could issue,increase our commercial paper borrowing costs, orboth;
• restricting our flexibility in responding to changingmarket conditions or making us more vulnerable inthe event of a general downturn in economicconditions or our business;
• requiring a substantial portion of the cash flowfrom operations to be dedicated to the payment ofprincipal and interest on our debt, reducing thefunds available to us for other purposes such asexpansion through acquisitions, paying dividends,repurchasing shares, marketing spending andexpansion of our product offerings; and
• causing us to be more leveraged than some of ourcompetitors, which may place us at a competitivedisadvantage.
Our ability to make scheduled payments or torefinance our obligations with respect to indebtednesswill depend on our financial and operatingperformance, which in turn, is subject to prevailingeconomic conditions, the availability of, and interestrates on, short-term financing, and financial, businessand other factors beyond our control.
Our performance is affected by general economic andpolitical conditions and taxation policies.
Customer and consumer demand for our productsmay be impacted by recession, financial and creditmarket disruptions, or other economic downturns inthe United States or other nations. Our results in thepast have been, and in the future may continue to be,materially affected by changes in general economicand political conditions in the United States and othercountries, including the interest rate environment inwhich we conduct business, the financial marketsthrough which we access capital and currency,political unrest and terrorist acts in the United Statesor other countries in which we carry on business.
Current economic conditions globally may delay orreduce purchases by our customers andconsumers. This could result in reductions in sales ofour products, reduced acceptance of innovations, andincreased price competition. Deterioration in economicconditions in any of the countries in which we dobusiness could also cause slower collections onaccounts receivable which may adversely impact ourliquidity and financial condition. Financial institutions
11
may be negatively impacted by economic conditionsand may consolidate or cease to do business whichcould result in a tightening in the credit markets, alow level of liquidity in many financial markets, andincreased volatility in fixed income, credit, currencyand equity markets. There could be a number ofeffects from a financial institution credit crisis on ourbusiness, which could include impaired creditavailability and financial stability of our customers,including our suppliers, co-manufacturers anddistributors. A disruption in financial markets may alsohave an effect on our derivative counterparties andcould also impair our banking partners on which werely for operating cash management. Any of theseevents would likely harm our business, results ofoperations and financial condition.
An impairment of the carrying value of goodwill orother acquired intangibles could negatively affect ourconsolidated operating results and net worth.
The carrying value of goodwill represents the fair valueof acquired businesses in excess of identifiable assetsand liabilities as of the acquisition date. The carryingvalue of other intangibles represents the fair value oftrademarks, trade names, and other acquiredintangibles as of the acquisition date. Goodwill andother acquired intangibles expected to contributeindefinitely to our cash flows are not amortized, butmust be evaluated by management at least annuallyfor impairment. If carrying value exceeds current fairvalue, the intangible is considered impaired and isreduced to fair value via a charge to earnings. Eventsand conditions which could result in an impairmentinclude changes in the industries in which we operate,including competition and advances in technology; asignificant product liability or intellectual propertyclaim; or other factors leading to reduction inexpected sales or profitability. Should the value of oneor more of the acquired intangibles become impaired,our consolidated earnings and net worth may bematerially adversely affected.
As of December 28, 2013, the carrying value ofintangible assets totaled approximately $7.4 billion, ofwhich $5.0 billion was goodwill and $2.4 billionrepresented trademarks, tradenames, and otheracquired intangibles compared to total assets of$15.5 billion and total Kellogg Company equity of$3.5 billion.
Economic downturns could limit consumer demandfor our products.
Retailers are increasingly offering private labelproducts that compete with our products. Consumers’willingness to purchase our products will depend uponour ability to offer products that appeal to consumersat the right price. It is also important that our productsare perceived to be of a higher quality than lessexpensive alternatives. If the difference in quality
between our products and those of store brandsnarrows, or if such difference in quality is perceived tohave narrowed, then consumers may not buy ourproducts. Furthermore, during periods of economicuncertainty, consumers tend to purchase more privatelabel or other economy brands, which could reducesales volumes of our higher margin products or therecould be a shift in our product mix to our lowermargin offerings. If we are not able to maintain orimprove our brand image, it could have a materialeffect on our market share and our profitability.
We may not achieve our targeted cost savings andefficiencies from cost reduction initiatives.
Our success depends in part on our ability to be anefficient producer in a highly competitive industry. Wehave invested a significant amount in capitalexpenditures to improve our operational facilities.Ongoing operational issues are likely to occur whencarrying out major production, procurement, orlogistical changes and these, as well as any failure byus to achieve our planned cost savings andefficiencies, could have a material adverse effect onour business and consolidated financial position andon the consolidated results of our operations andprofitability.
Technology failures could disrupt our operations andnegatively impact our business.
We increasingly rely on information technologysystems to process, transmit, and store electronicinformation. For example, our production anddistribution facilities and inventory management utilizeinformation technology to increase efficiencies andlimit costs. Information technology systems are alsointegral to the reporting of our results of operations.Furthermore, a significant portion of thecommunications between, and storage of personaldata of, our personnel, customers, consumers andsuppliers depends on information technology. Ourinformation technology systems may be vulnerable toa variety of interruptions, as a result of updating ourSAP platform or due to events beyond our control,including, but not limited to, natural disasters, terroristattacks, telecommunications failures, computerviruses, hackers, and other security issues. Moreover,our computer systems have been, and will likelycontinue to be subjected to computer viruses or othermalicious codes, unauthorized access attempts, andcyber- or phishing-attacks. These events couldcompromise our confidential information, impede orinterrupt our business operations, and may result inother negative consequences, including remediationcosts, loss of revenue, litigation and reputationaldamage. Furthermore, if a breach or other breakdownresults in disclosure of confidential or personalinformation, we may suffer reputational, competitiveand/or business harm. To date, we have notexperienced a material breach of cybersecurity. While
12
we have implemented administrative and technicalcontrols and taken other preventive actions to reducethe risk of cyber incidents and protect our informationtechnology, they may be insufficient to preventphysical and electronic break-ins, cyber-attacks orother security breaches to our computer systems.
Our intellectual property rights are valuable, and anyinability to protect them could reduce the value of ourproducts and brands.
We consider our intellectual property rights,particularly and most notably our trademarks, but alsoincluding patents, trade secrets, copyrights andlicensing agreements, to be a significant and valuableaspect of our business. We attempt to protect ourintellectual property rights through a combination ofpatent, trademark, copyright and trade secret laws, aswell as licensing agreements, third party nondisclosureand assignment agreements and policing of thirdparty misuses of our intellectual property. Our failureto obtain or adequately protect our trademarks,products, new features of our products, or ourtechnology, or any change in law or other changesthat serve to lessen or remove the current legalprotections of our intellectual property, may diminishour competitiveness and could materially harm ourbusiness.
We may be unaware of intellectual property rights ofothers that may cover some of our technology, brandsor products. Any litigation regarding patents or otherintellectual property could be costly and time-consuming and could divert the attention of ourmanagement and key personnel from our businessoperations. Third party claims of intellectual propertyinfringement might also require us to enter into costlylicense agreements. We also may be subject tosignificant damages or injunctions againstdevelopment and sale of certain products.
ITEM 1B. UNRESOLVED STAFF COMMENTS
None.
ITEM 2. PROPERTIES
Our corporate headquarters and principal researchand development facilities are located in Battle Creek,Michigan.
We operated, as of February 24, 2014, manufacturingplants and distribution and warehousing facilitiestotaling more than 35 million square feet of buildingarea in the United States and other countries. Ourplants have been designed and constructed to meetour specific production requirements, and weperiodically invest money for capital and technologicalimprovements. At the time of its selection, eachlocation was considered to be favorable, based on the
location of markets, sources of raw materials,availability of suitable labor, transportation facilities,location of our other plants producing similarproducts, and other factors. Our manufacturingfacilities in the United States include four cereal plantsand warehouses located in Battle Creek, Michigan;Lancaster, Pennsylvania; Memphis, Tennessee; andOmaha, Nebraska and other plants or facilities inSan Jose, California; Atlanta, Augusta, Columbus, andRome, Georgia; Chicago, Illinois; Seelyville, Indiana;Kansas City, Kansas; Florence, Louisville, and Pikeville,Kentucky; Grand Rapids and Wyoming, Michigan; BlueAnchor, New Jersey; Cary and Charlotte, NorthCarolina; Cincinnati and Zanesville, Ohio; Muncy,Pennsylvania; Jackson and Rossville, Tennessee;Clearfield, Utah; and Allyn, Washington.
Outside the United States, we had, as of February 24,2014, additional manufacturing locations, some withwarehousing facilities, in Australia, Belgium, Brazil,Canada, Colombia, Ecuador, Germany, Great Britain,India, Japan, Mexico, Poland, Russia, South Africa,South Korea, Spain, Thailand, and Venezuela.
We generally own our principal properties, includingour major office facilities, although somemanufacturing facilities are leased, and no ownedproperty is subject to any major lien or otherencumbrance. Distribution facilities (including relatedwarehousing facilities) and offices of non-plantlocations typically are leased. In general, we considerour facilities, taken as a whole, to be suitable,adequate, and of sufficient capacity for our currentoperations.
ITEM 3. LEGAL PROCEEDINGS
We are subject to various legal proceedings, claims,and governmental inspections, audits or investigationsarising out of our business which cover matters suchas general commercial, governmental regulations,antitrust and trade regulations, product liability,environmental, intellectual property, employment andother actions. In the opinion of management, theultimate resolution of these matters will not have amaterial adverse effect on our financial position orresults of operations.
ITEM 4. MINE SAFETY DISCLOSURE
Not applicable.
13
PART II
ITEM 5. MARKET FOR THE REGISTRANT’SCOMMON EQUITY, RELATED STOCKHOLDERMATTERS AND ISSUER PURCHASES OF EQUITYSECURITIES
Information on the market for our common stock,number of shareowners and dividends is located inNote 15 within Notes to Consolidated FinancialStatements.
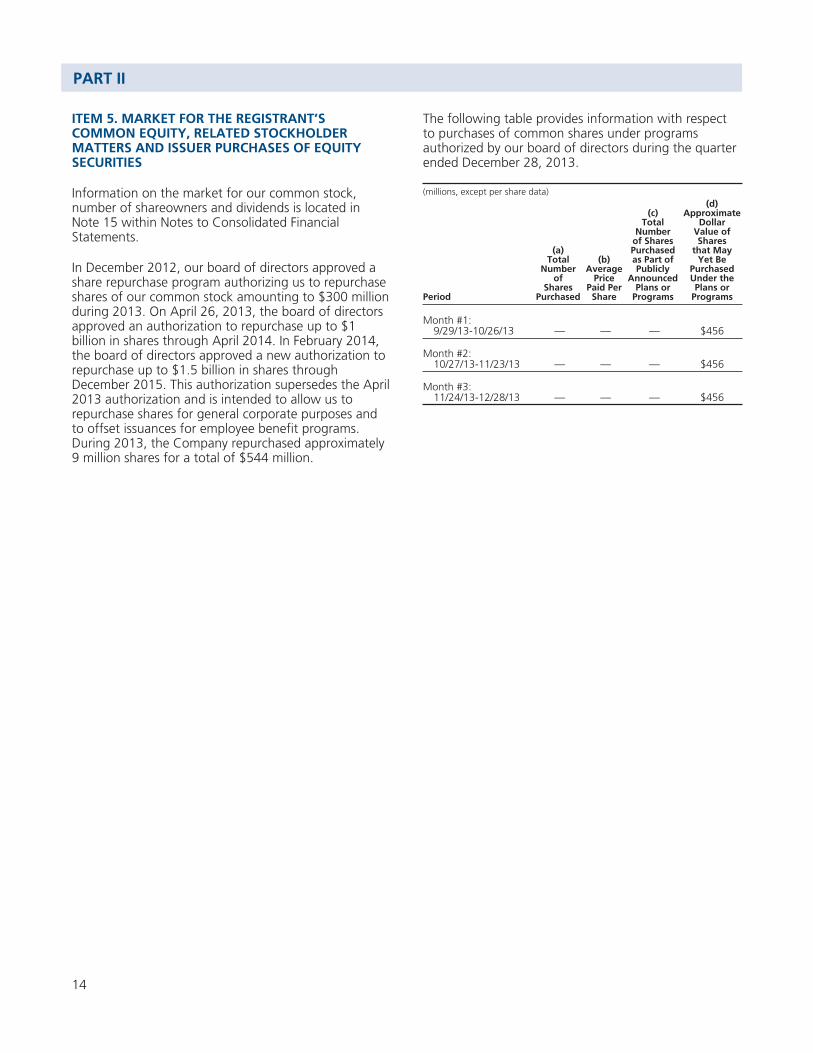
In December 2012, our board of directors approved ashare repurchase program authorizing us to repurchaseshares of our common stock amounting to $300 millionduring 2013. On April 26, 2013, the board of directorsapproved an authorization to repurchase up to $1billion in shares through April 2014. In February 2014,the board of directors approved a new authorization torepurchase up to $1.5 billion in shares throughDecember 2015. This authorization supersedes the April2013 authorization and is intended to allow us torepurchase shares for general corporate purposes andto offset issuances for employee benefit programs.During 2013, the Company repurchased approximately9 million shares for a total of $544 million.
The following table provides information with respectto purchases of common shares under programsauthorized by our board of directors during the quarterended December 28, 2013.
(millions, except per share data)
Period
(a)Total
Numberof
SharesPurchased
(b)Average
PricePaid Per
Share
(c)Total
Numberof SharesPurchasedas Part ofPublicly
AnnouncedPlans or
Programs
(d)Approximate
DollarValue ofShares
that MayYet Be
PurchasedUnder thePlans or
Programs
Month #1:9/29/13-10/26/13 — — — $456
Month #2:10/27/13-11/23/13 — — — $456
Month #3:11/24/13-12/28/13 — — — $456
14
ITEM 6. SELECTED FINANCIAL DATA
Kellogg Company and Subsidiaries
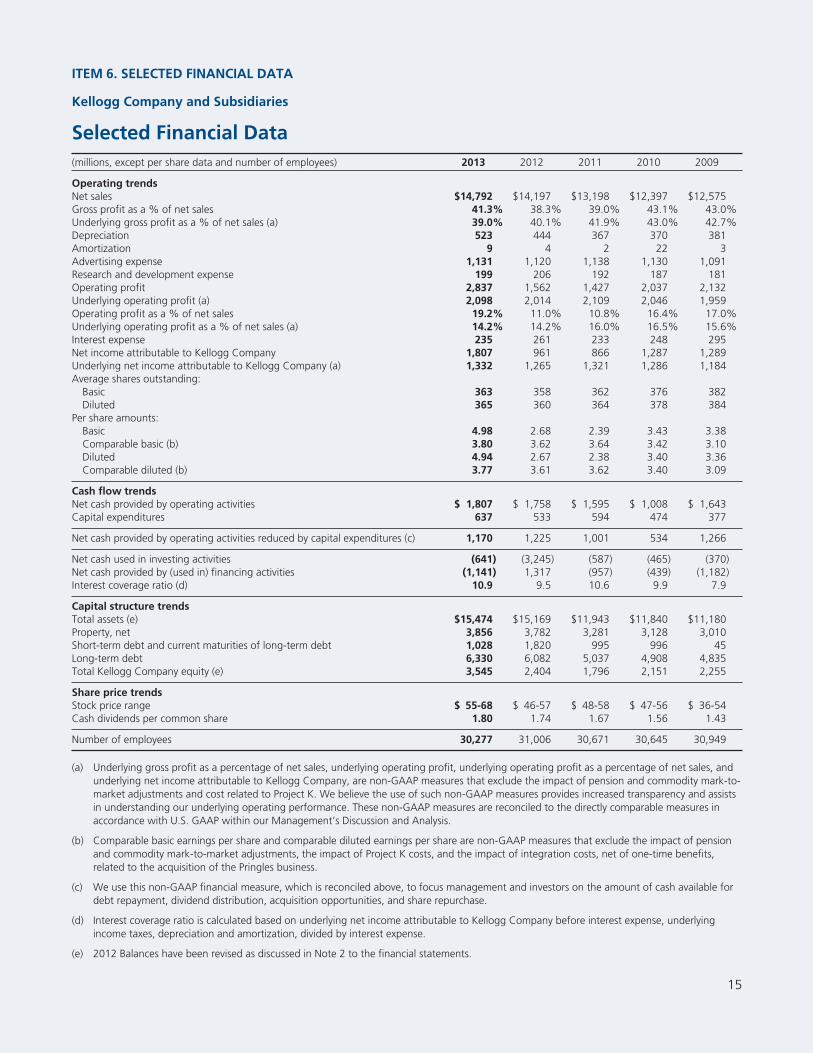
Selected Financial Data(millions, except per share data and number of employees) 2013 2012 2011 2010 2009
Operating trendsNet sales $14,792 $14,197 $13,198 $12,397 $12,575Gross profit as a % of net sales 41.3% 38.3% 39.0% 43.1% 43.0%Underlying gross profit as a % of net sales (a) 39.0% 40.1% 41.9% 43.0% 42.7%Depreciation 523 444 367 370 381Amortization 9 4 2 22 3Advertising expense 1,131 1,120 1,138 1,130 1,091Research and development expense 199 206 192 187 181Operating profit 2,837 1,562 1,427 2,037 2,132Underlying operating profit (a) 2,098 2,014 2,109 2,046 1,959Operating profit as a % of net sales 19.2% 11.0% 10.8% 16.4% 17.0%Underlying operating profit as a % of net sales (a) 14.2% 14.2% 16.0% 16.5% 15.6%Interest expense 235 261 233 248 295Net income attributable to Kellogg Company 1,807 961 866 1,287 1,289Underlying net income attributable to Kellogg Company (a) 1,332 1,265 1,321 1,286 1,184Average shares outstanding:
Basic 363 358 362 376 382Diluted 365 360 364 378 384
Per share amounts:Basic 4.98 2.68 2.39 3.43 3.38Comparable basic (b) 3.80 3.62 3.64 3.42 3.10Diluted 4.94 2.67 2.38 3.40 3.36Comparable diluted (b) 3.77 3.61 3.62 3.40 3.09
Cash flow trendsNet cash provided by operating activities $ 1,807 $ 1,758 $ 1,595 $ 1,008 $ 1,643Capital expenditures 637 533 594 474 377
Net cash provided by operating activities reduced by capital expenditures (c) 1,170 1,225 1,001 534 1,266
Net cash used in investing activities (641) (3,245) (587) (465) (370)Net cash provided by (used in) financing activities (1,141) 1,317 (957) (439) (1,182)Interest coverage ratio (d) 10.9 9.5 10.6 9.9 7.9
Capital structure trendsTotal assets (e) $15,474 $15,169 $11,943 $11,840 $11,180Property, net 3,856 3,782 3,281 3,128 3,010Short-term debt and current maturities of long-term debt 1,028 1,820 995 996 45Long-term debt 6,330 6,082 5,037 4,908 4,835Total Kellogg Company equity (e) 3,545 2,404 1,796 2,151 2,255
Share price trendsStock price range $ 55-68 $ 46-57 $ 48-58 $ 47-56 $ 36-54Cash dividends per common share 1.80 1.74 1.67 1.56 1.43
Number of employees 30,277 31,006 30,671 30,645 30,949
(a) Underlying gross profit as a percentage of net sales, underlying operating profit, underlying operating profit as a percentage of net sales, andunderlying net income attributable to Kellogg Company, are non-GAAP measures that exclude the impact of pension and commodity mark-to-market adjustments and cost related to Project K. We believe the use of such non-GAAP measures provides increased transparency and assistsin understanding our underlying operating performance. These non-GAAP measures are reconciled to the directly comparable measures inaccordance with U.S. GAAP within our Management’s Discussion and Analysis.
(b) Comparable basic earnings per share and comparable diluted earnings per share are non-GAAP measures that exclude the impact of pensionand commodity mark-to-market adjustments, the impact of Project K costs, and the impact of integration costs, net of one-time benefits,related to the acquisition of the Pringles business.
(c) We use this non-GAAP financial measure, which is reconciled above, to focus management and investors on the amount of cash available fordebt repayment, dividend distribution, acquisition opportunities, and share repurchase.
(d) Interest coverage ratio is calculated based on underlying net income attributable to Kellogg Company before interest expense, underlyingincome taxes, depreciation and amortization, divided by interest expense.
(e) 2012 Balances have been revised as discussed in Note 2 to the financial statements.
15
ITEM 7. MANAGEMENT’S DISCUSSION ANDANALYSIS OF FINANCIAL CONDITION ANDRESULTS OF OPERATIONS
Kellogg Company and Subsidiaries
RESULTS OF OPERATIONS
Business overviewThe following Management’s Discussion and Analysisof Financial Condition and Results of Operations(MD&A) is intended to help the reader understandKellogg Company, our operations and our presentbusiness environment. MD&A is provided as asupplement to, and should be read in conjunctionwith, our Consolidated Financial Statements and theaccompanying notes thereto contained in Item 8 ofthis report.
For more than 100 years, consumers have counted onKellogg for great-tasting, high-quality and nutritiousfoods. Kellogg is the world’s leading producer ofcereal, second largest producer of cookies andcrackers, and a leading producer of savory snacks andfrozen foods. Additional product offerings includetoaster pastries, cereal bars, fruit-flavored snacks andveggie foods. Kellogg products are manufactured andmarketed globally.
We manage our operations through eight operatingsegments that are based on product category orgeographic location. These operating segments areevaluated for similarity with regards to economiccharacteristics, products, production processes, typesor classes of customers, distribution methods andregulatory environments to determine if they can beaggregated into reportable segments. We reportresults of operations in the following reportablesegments: U.S. Morning Foods; U.S. Snacks; U.S.Specialty; North America Other; Europe; LatinAmerica; and Asia Pacific. The reportable segmentsare discussed in greater detail in Note 16 within Notesto Consolidated Financial Statements.
We manage our Company for sustainableperformance defined by our long-term annual growthtargets. These targets are 3 to 4% for internal netsales, mid-single-digit (4 to 6%) for underlying internaloperating profit, and high-single-digit (7 to 9%) forcurrency-neutral comparable diluted net earnings pershare.
During 2013 we announced Project K, a four-yearefficiency and effectiveness program. The program isexpected to generate a significant amount of savings,once all phases are approved and implemented, thatwill be invested in key strategic areas of focus for thebusiness. We expect that this investment will drive
future growth in revenues, gross margin, operatingprofit, and cash flow. See the Exit or disposal activitiessection for more information.
ComparabilityInternal net sales growth excludes the impact offoreign currency translation and, if applicable,acquisitions, dispositions and integration costsassociated with the acquisition of the Pringles®
business (Pringles).
Comparability of certain financial measures isimpacted significantly by two types of charges: 1)Mark-to-market adjustments that are recorded forpensions and commodity derivative contracts; and 2)Charges related to Project K. To provide increasedtransparency and assist in understanding ourunderlying operating performance we use non-GAAPfinancial measures within the MD&A that exclude theimpact of these charges. These non-GAAP financialmeasures include underlying gross margin, underlyinggross profit, underlying SGA%, underlying operatingmargin, underlying operating profit, underlyingoperating profit growth, underlying income taxes,underlying effective tax rate, and underlying netincome attributable to Kellogg Company. Underlyinginternal operating profit growth excludes thefollowing impacts, if applicable: foreign currencytranslation, mark-to-market adjustments, acquisitions,dispositions, transaction and integration costsassociated with the acquisition of the Pringlesbusiness, and charges related to Project K.
Additionally, integration costs associated with theacquisition of the Pringles business are excluded fromcomparable basic earnings per share (EPS),comparable diluted EPS, and comparable diluted EPSgrowth.
Financial resultsFor the full year 2013, our reported net sales increasedby 4.2% and internal net sales increased by 0.3%. Weexperienced solid internal net sales growth in U.S.Specialty, North America Other, Europe, LatinAmerica, and Asia Pacific while internal net sales inU.S. Morning Foods and U.S. Snacks declined.Reported operating profit increased by 81.6%, andunderlying internal operating profit increased by1.3%. The increased profit was driven by the slightincrease in sales and cost management across selling,general and administrative expense partially offset bycost of goods sold inflation and business mix driven bysoftness in several developed markets.
Diluted EPS of $4.94 was up 85.0% compared to theprior year of $2.67. Comparable diluted EPS of $3.77increased by 4.4% compared to prior year of $3.61and was in line with our expectations.
16
Reconciliation of certain non-GAAP FinancialMeasures
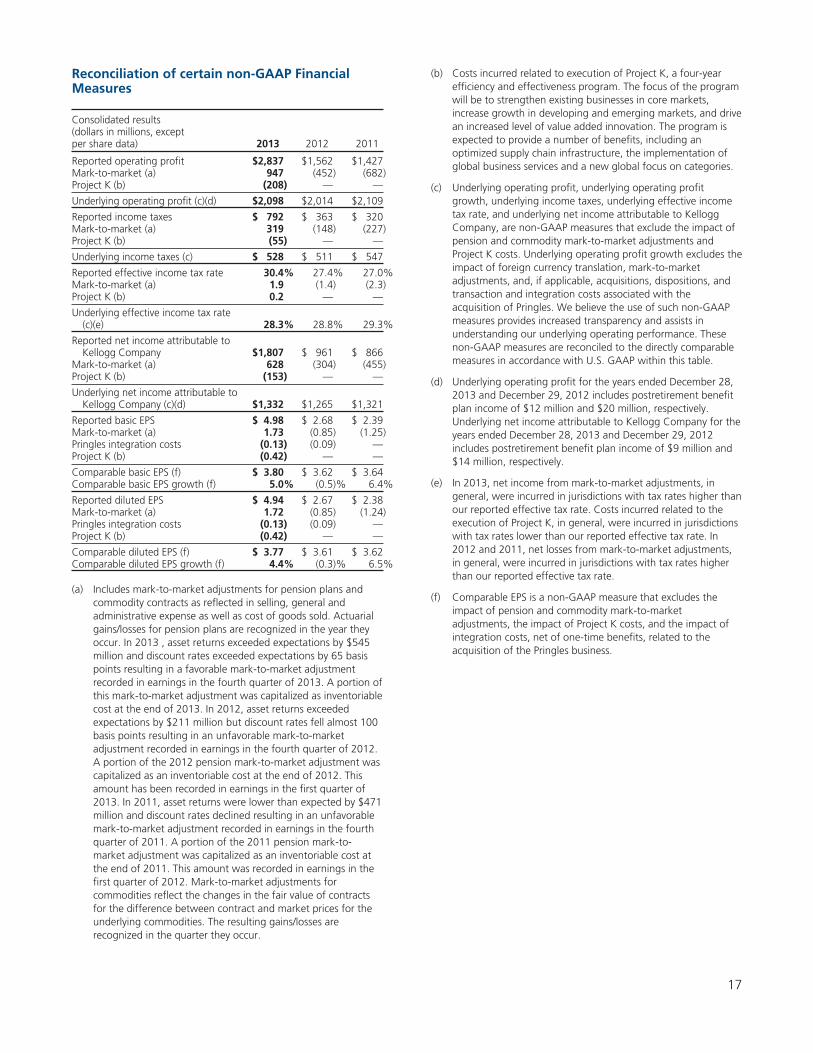
Consolidated results(dollars in millions, exceptper share data) 2013 2012 2011
Reported operating profit $2,837 $1,562 $1,427Mark-to-market (a) 947 (452) (682)Project K (b) (208) — —
Underlying operating profit (c)(d) $2,098 $2,014 $2,109
Reported income taxes $ 792 $ 363 $ 320Mark-to-market (a) 319 (148) (227)Project K (b) (55) — —
Underlying income taxes (c) $ 528 $ 511 $ 547
Reported effective income tax rate 30.4% 27.4% 27.0%Mark-to-market (a) 1.9 (1.4) (2.3)Project K (b) 0.2 — —
Underlying effective income tax rate(c)(e) 28.3% 28.8% 29.3%
Reported net income attributable toKellogg Company $1,807 $ 961 $ 866
Mark-to-market (a) 628 (304) (455)Project K (b) (153) — —
Underlying net income attributable toKellogg Company (c)(d) $1,332 $1,265 $1,321
Reported basic EPS $ 4.98 $ 2.68 $ 2.39Mark-to-market (a) 1.73 (0.85) (1.25)Pringles integration costs (0.13) (0.09) —Project K (b) (0.42) — —
Comparable basic EPS (f) $ 3.80 $ 3.62 $ 3.64Comparable basic EPS growth (f) 5.0% (0.5)% 6.4%
Reported diluted EPS $ 4.94 $ 2.67 $ 2.38Mark-to-market (a) 1.72 (0.85) (1.24)Pringles integration costs (0.13) (0.09) —Project K (b) (0.42) — —
Comparable diluted EPS (f) $ 3.77 $ 3.61 $ 3.62Comparable diluted EPS growth (f) 4.4% (0.3)% 6.5%
(a) Includes mark-to-market adjustments for pension plans andcommodity contracts as reflected in selling, general andadministrative expense as well as cost of goods sold. Actuarialgains/losses for pension plans are recognized in the year theyoccur. In 2013 , asset returns exceeded expectations by $545million and discount rates exceeded expectations by 65 basispoints resulting in a favorable mark-to-market adjustmentrecorded in earnings in the fourth quarter of 2013. A portion ofthis mark-to-market adjustment was capitalized as inventoriablecost at the end of 2013. In 2012, asset returns exceededexpectations by $211 million but discount rates fell almost 100basis points resulting in an unfavorable mark-to-marketadjustment recorded in earnings in the fourth quarter of 2012.A portion of the 2012 pension mark-to-market adjustment wascapitalized as an inventoriable cost at the end of 2012. Thisamount has been recorded in earnings in the first quarter of2013. In 2011, asset returns were lower than expected by $471million and discount rates declined resulting in an unfavorablemark-to-market adjustment recorded in earnings in the fourthquarter of 2011. A portion of the 2011 pension mark-to-market adjustment was capitalized as an inventoriable cost atthe end of 2011. This amount was recorded in earnings in thefirst quarter of 2012. Mark-to-market adjustments forcommodities reflect the changes in the fair value of contractsfor the difference between contract and market prices for theunderlying commodities. The resulting gains/losses arerecognized in the quarter they occur.
(b) Costs incurred related to execution of Project K, a four-yearefficiency and effectiveness program. The focus of the programwill be to strengthen existing businesses in core markets,increase growth in developing and emerging markets, and drivean increased level of value added innovation. The program isexpected to provide a number of benefits, including anoptimized supply chain infrastructure, the implementation ofglobal business services and a new global focus on categories.
(c) Underlying operating profit, underlying operating profitgrowth, underlying income taxes, underlying effective incometax rate, and underlying net income attributable to KelloggCompany, are non-GAAP measures that exclude the impact ofpension and commodity mark-to-market adjustments andProject K costs. Underlying operating profit growth excludes theimpact of foreign currency translation, mark-to-marketadjustments, and, if applicable, acquisitions, dispositions, andtransaction and integration costs associated with theacquisition of Pringles. We believe the use of such non-GAAPmeasures provides increased transparency and assists inunderstanding our underlying operating performance. Thesenon-GAAP measures are reconciled to the directly comparablemeasures in accordance with U.S. GAAP within this table.
(d) Underlying operating profit for the years ended December 28,2013 and December 29, 2012 includes postretirement benefitplan income of $12 million and $20 million, respectively.Underlying net income attributable to Kellogg Company for theyears ended December 28, 2013 and December 29, 2012includes postretirement benefit plan income of $9 million and$14 million, respectively.
(e) In 2013, net income from mark-to-market adjustments, ingeneral, were incurred in jurisdictions with tax rates higher thanour reported effective tax rate. Costs incurred related to theexecution of Project K, in general, were incurred in jurisdictionswith tax rates lower than our reported effective tax rate. In2012 and 2011, net losses from mark-to-market adjustments,in general, were incurred in jurisdictions with tax rates higherthan our reported effective tax rate.
(f) Comparable EPS is a non-GAAP measure that excludes theimpact of pension and commodity mark-to-marketadjustments, the impact of Project K costs, and the impact ofintegration costs, net of one-time benefits, related to theacquisition of the Pringles business.
17
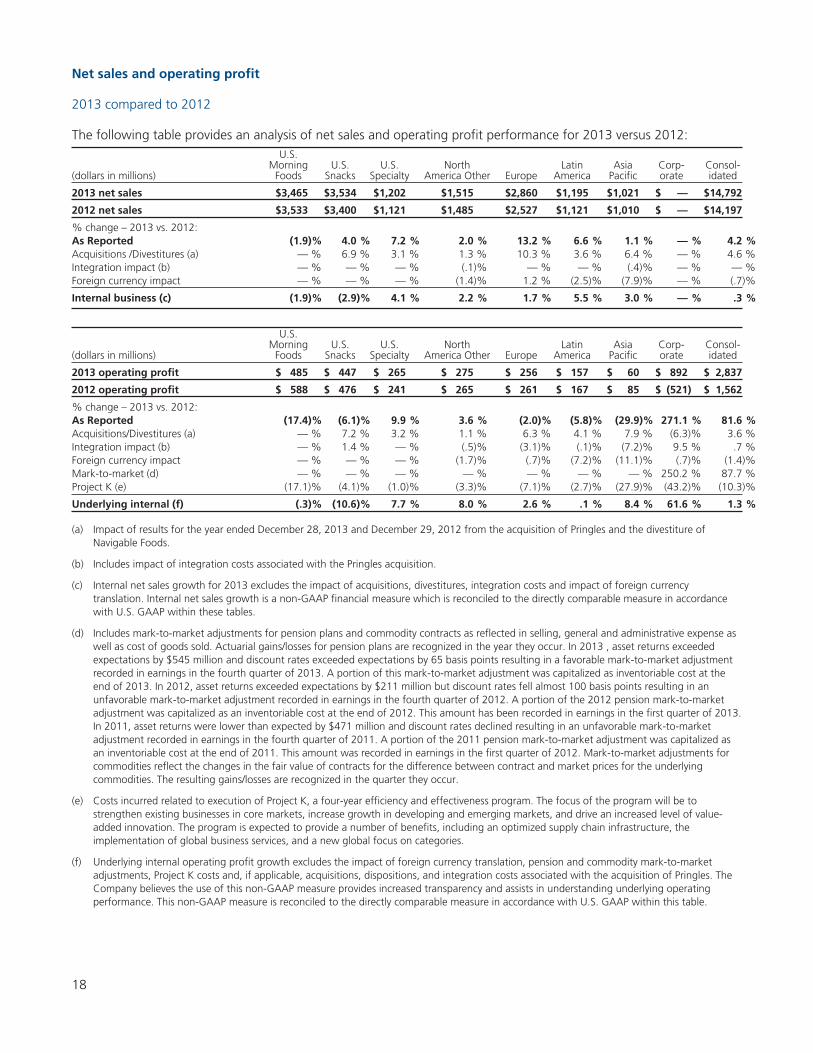
Net sales and operating profit
2013 compared to 2012
The following table provides an analysis of net sales and operating profit performance for 2013 versus 2012:
(dollars in millions)
U.S.Morning
FoodsU.S.
SnacksU.S.
SpecialtyNorth
America Other EuropeLatin
AmericaAsia
PacificCorp-orate
Consol-idated
2013 net sales $3,465 $3,534 $1,202 $1,515 $2,860 $1,195 $1,021 $ — $14,792
2012 net sales $3,533 $3,400 $1,121 $1,485 $2,527 $1,121 $1,010 $ — $14,197
% change – 2013 vs. 2012:As Reported (1.9)% 4.0 % 7.2 % 2.0 % 13.2 % 6.6 % 1.1 % — % 4.2 %Acquisitions /Divestitures (a) — % 6.9 % 3.1 % 1.3 % 10.3 % 3.6 % 6.4 % — % 4.6 %Integration impact (b) — % — % — % (.1)% — % — % (.4)% — % — %Foreign currency impact — % — % — % (1.4)% 1.2 % (2.5)% (7.9)% — % (.7)%
Internal business (c) (1.9)% (2.9)% 4.1 % 2.2 % 1.7 % 5.5 % 3.0 % — % .3 %
(dollars in millions)
U.S.Morning
FoodsU.S.
SnacksU.S.
SpecialtyNorth
America Other EuropeLatin
AmericaAsia
PacificCorp-orate
Consol-idated
2013 operating profit $ 485 $ 447 $ 265 $ 275 $ 256 $ 157 $ 60 $ 892 $ 2,837
2012 operating profit $ 588 $ 476 $ 241 $ 265 $ 261 $ 167 $ 85 $ (521) $ 1,562
% change – 2013 vs. 2012:As Reported (17.4)% (6.1)% 9.9 % 3.6 % (2.0)% (5.8)% (29.9)% 271.1 % 81.6 %Acquisitions/Divestitures (a) — % 7.2 % 3.2 % 1.1 % 6.3 % 4.1 % 7.9 % (6.3)% 3.6 %Integration impact (b) — % 1.4 % — % (.5)% (3.1)% (.1)% (7.2)% 9.5 % .7 %Foreign currency impact — % — % — % (1.7)% (.7)% (7.2)% (11.1)% (.7)% (1.4)%Mark-to-market (d) — % — % — % — % — % — % — % 250.2 % 87.7 %Project K (e) (17.1)% (4.1)% (1.0)% (3.3)% (7.1)% (2.7)% (27.9)% (43.2)% (10.3)%
Underlying internal (f) (.3)% (10.6)% 7.7 % 8.0 % 2.6 % .1 % 8.4 % 61.6 % 1.3 %
(a) Impact of results for the year ended December 28, 2013 and December 29, 2012 from the acquisition of Pringles and the divestiture ofNavigable Foods.
(b) Includes impact of integration costs associated with the Pringles acquisition.
(c) Internal net sales growth for 2013 excludes the impact of acquisitions, divestitures, integration costs and impact of foreign currencytranslation. Internal net sales growth is a non-GAAP financial measure which is reconciled to the directly comparable measure in accordancewith U.S. GAAP within these tables.
(d) Includes mark-to-market adjustments for pension plans and commodity contracts as reflected in selling, general and administrative expense aswell as cost of goods sold. Actuarial gains/losses for pension plans are recognized in the year they occur. In 2013 , asset returns exceededexpectations by $545 million and discount rates exceeded expectations by 65 basis points resulting in a favorable mark-to-market adjustmentrecorded in earnings in the fourth quarter of 2013. A portion of this mark-to-market adjustment was capitalized as inventoriable cost at theend of 2013. In 2012, asset returns exceeded expectations by $211 million but discount rates fell almost 100 basis points resulting in anunfavorable mark-to-market adjustment recorded in earnings in the fourth quarter of 2012. A portion of the 2012 pension mark-to-marketadjustment was capitalized as an inventoriable cost at the end of 2012. This amount has been recorded in earnings in the first quarter of 2013.In 2011, asset returns were lower than expected by $471 million and discount rates declined resulting in an unfavorable mark-to-marketadjustment recorded in earnings in the fourth quarter of 2011. A portion of the 2011 pension mark-to-market adjustment was capitalized asan inventoriable cost at the end of 2011. This amount was recorded in earnings in the first quarter of 2012. Mark-to-market adjustments forcommodities reflect the changes in the fair value of contracts for the difference between contract and market prices for the underlyingcommodities. The resulting gains/losses are recognized in the quarter they occur.
(e) Costs incurred related to execution of Project K, a four-year efficiency and effectiveness program. The focus of the program will be tostrengthen existing businesses in core markets, increase growth in developing and emerging markets, and drive an increased level of value-added innovation. The program is expected to provide a number of benefits, including an optimized supply chain infrastructure, theimplementation of global business services, and a new global focus on categories.
(f) Underlying internal operating profit growth excludes the impact of foreign currency translation, pension and commodity mark-to-marketadjustments, Project K costs and, if applicable, acquisitions, dispositions, and integration costs associated with the acquisition of Pringles. TheCompany believes the use of this non-GAAP measure provides increased transparency and assists in understanding underlying operatingperformance. This non-GAAP measure is reconciled to the directly comparable measure in accordance with U.S. GAAP within this table.
18
Internal net sales for U.S. Morning Foods declined1.9% as a result of unfavorable volume and flatpricing/mix. This segment consists of cereal, toasterpastries, health and wellness bars, and beverages.Cereal category growth has been challengingthroughout the year due to the timing of innovation,weakness in the adult segment of the portfolio andreduced retailer inventories. Despite this categoryperformance, Raisin Bran® posted a solid consumptionincrease behind good innovation and advertising thathas resonated with consumers, and Froot Loops®
posted consumption growth as a result of innovationlaunched during the year. Toaster pastries reportedsolid growth behind innovations which resulted inconsumption and share gains for the year. Beveragescontinued to report increased consumption resultingfrom expanded distribution.
Internal net sales in U.S. Snacks declined by 2.9% as aresult of unfavorable volume which was partially offsetby favorable pricing/mix. This business consists ofcrackers, cereal bars, cookies, savory snacks and fruit-flavored snacks. The sales decline was the result oflower shipments in crackers, cereal bars, cookies, andfruit-flavored snacks. Crackers decline was the resultof Special K Cracker Chips® lapping a strong year-agolaunch. This decline was partially offset withinnovations by the Cheez-it® and Town House®
brands. Sales declined in cereal bars across mostbrands. Cereal bars reported gains in Nutri-Grain® andRice KrispiesTreats® where we invested behindinnovations. Cookies sales declined for the year. Thiswas partially driven by reductions in retailer inventoriesand strong competitor actions resulting in weaknessacross many of our brands. Savory snacks reported asolid sales increase for the year as Pringles®
consumption gains continued throughout the year.
Internal net sales in U.S. Specialty increased by 4.1%as a result of favorable pricing/mix and volume. Salesgrowth was due to strong results from innovationlaunches, expanded points of distribution, and pricing.
Internal net sales in North America Other (U.S. Frozenand Canada) increased by 2.2% due to favorablepricing/mix and volume. Sales growth was the resultof our U.S. Frozen business posting solid growth forthe year while gaining share as a result of increasedbrand-building support behind innovation activity.
Europe’s internal net sales increased 1.7% for the yeardriven by increased volume and favorable pricing/mix.Competitive conditions in Europe remainedchallenging. The cereal category in the UK continuedto be difficult, although new Crunchy Nut® granolacontributed to sales and Crunchy Nut®, Rice Krispies®,and Corn Flakes® all gained share. We also postedsales growth in the Mediterranean/Middle Eastbusinesses and in Russia and are pleased with resultsin these developing growth regions. Latin America’sinternal net sales growth was 5.5% due to a strong
increase in pricing/mix partially offset by a decline involume. Latin America experienced growth in bothcereal and snacks. Cereal performed very well inVenezuela and Brazil. The Snacks business growth wasprimarily the result of strong results from our Pringles®
brand. Internal net sales in Asia Pacific grew 3.0% as aresult of favorable volume partially offset byunfavorable pricing/mix. Asia Pacific’s growth wasdriven by solid cereal performance in India, SoutheastAsia, and Japan. In addition, the snacks businessreported strong performance behind the Pringles®
brand. The Australia business experienced declines inthe cereal business and gains in the snacks business.
Underlying internal operating profit in U.S. MorningFoods declined by 0.3%, U.S. Snacks declined by10.6%, U.S. Specialty increased by 7.7%, NorthAmerica Other grew by 8.0%, Europe increased by2.6%, Latin America increased by 0.1% and AsiaPacific increased by 8.4%. U.S. Morning Foods’decline was attributable to increased commodity costsbeing partially offset by overhead cost containment,reduced consumer promotion investment, and thefavorable impact of lapping a 2012 product recall.U.S. Snacks’ decline was attributable to significantlyincreased commodity costs, being partially offset byreduced advertising investment, reduced consumerpromotion investment, and overhead costcontainment. U.S. Specialty’s increase was attributableto favorable pricing, flat commodity costs, andreduced advertising investment. North AmericaOther’s increase was attributable to favorable pricingand overhead cost containment which was partiallyoffset by slight increases in commodity costs andincreased brand-building investment. Europe’soperating profit improved due to reduced investmentin consumer promotions and advertising along withoverhead cost containment. These benefits werepartially offset by increased commodity costs. Theslight increase in Latin America’s operating profit wasdue to favorable pricing and reduced investment inadvertising being offset by the impact of a supplydisruption in our Venezuela business due to thedifficult operating environment. Asia Pacific’soperating profit improvement was primarily the resultof solid sales growth and 2012 charges related to theclosure of a plant in Australia. Refer to Note 3 withinNotes to Consolidated Financial Statements for furtherinformation on the Australian plant closure.
Underlying internal operating profit for Corporateimproved as a result of reduced pension costs incurredresulting from the combination of lower interest costand higher expected return on assets for the plans.
19
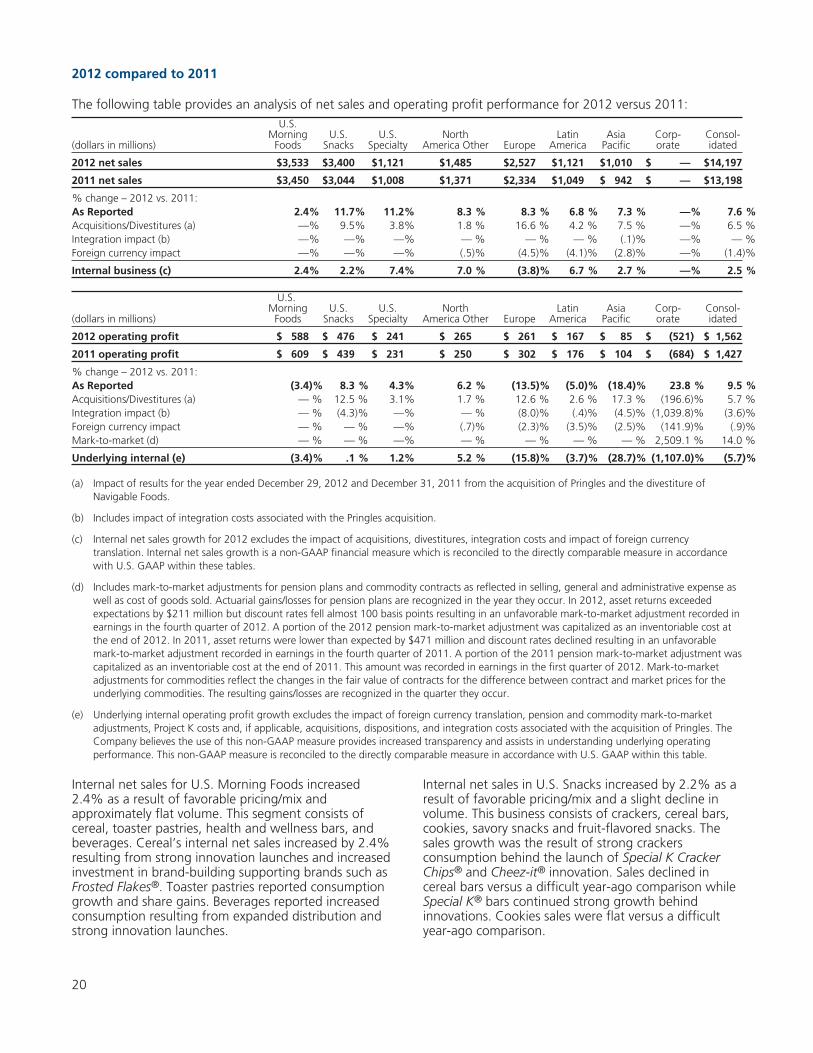
2012 compared to 2011
The following table provides an analysis of net sales and operating profit performance for 2012 versus 2011:
(dollars in millions)
U.S.Morning
FoodsU.S.
SnacksU.S.
SpecialtyNorth
America Other EuropeLatin
AmericaAsia
PacificCorp-orate
Consol-idated
2012 net sales $3,533 $3,400 $1,121 $1,485 $2,527 $1,121 $1,010 $ — $14,197
2011 net sales $3,450 $3,044 $1,008 $1,371 $2,334 $1,049 $ 942 $ — $13,198
% change – 2012 vs. 2011:As Reported 2.4% 11.7% 11.2% 8.3 % 8.3 % 6.8 % 7.3 % —% 7.6 %Acquisitions/Divestitures (a) —% 9.5% 3.8% 1.8 % 16.6 % 4.2 % 7.5 % —% 6.5 %Integration impact (b) —% —% —% — % — % — % (.1)% —% — %Foreign currency impact —% —% —% (.5)% (4.5)% (4.1)% (2.8)% —% (1.4)%
Internal business (c) 2.4% 2.2% 7.4% 7.0 % (3.8)% 6.7 % 2.7 % —% 2.5 %
(dollars in millions)
U.S.Morning
FoodsU.S.
SnacksU.S.
SpecialtyNorth
America Other EuropeLatin
AmericaAsia
PacificCorp-orate
Consol-idated
2012 operating profit $ 588 $ 476 $ 241 $ 265 $ 261 $ 167 $ 85 $ (521) $ 1,562
2011 operating profit $ 609 $ 439 $ 231 $ 250 $ 302 $ 176 $ 104 $ (684) $ 1,427
% change – 2012 vs. 2011:As Reported (3.4)% 8.3 % 4.3% 6.2 % (13.5)% (5.0)% (18.4)% 23.8 % 9.5 %Acquisitions/Divestitures (a) — % 12.5 % 3.1% 1.7 % 12.6 % 2.6 % 17.3 % (196.6)% 5.7 %Integration impact (b) — % (4.3)% —% — % (8.0)% (.4)% (4.5)% (1,039.8)% (3.6)%Foreign currency impact — % — % —% (.7)% (2.3)% (3.5)% (2.5)% (141.9)% (.9)%Mark-to-market (d) — % — % —% — % — % — % — % 2,509.1 % 14.0 %
Underlying internal (e) (3.4)% .1 % 1.2% 5.2 % (15.8)% (3.7)% (28.7)% (1,107.0)% (5.7)%
(a) Impact of results for the year ended December 29, 2012 and December 31, 2011 from the acquisition of Pringles and the divestiture ofNavigable Foods.
(b) Includes impact of integration costs associated with the Pringles acquisition.
(c) Internal net sales growth for 2012 excludes the impact of acquisitions, divestitures, integration costs and impact of foreign currencytranslation. Internal net sales growth is a non-GAAP financial measure which is reconciled to the directly comparable measure in accordancewith U.S. GAAP within these tables.
(d) Includes mark-to-market adjustments for pension plans and commodity contracts as reflected in selling, general and administrative expense aswell as cost of goods sold. Actuarial gains/losses for pension plans are recognized in the year they occur. In 2012, asset returns exceededexpectations by $211 million but discount rates fell almost 100 basis points resulting in an unfavorable mark-to-market adjustment recorded inearnings in the fourth quarter of 2012. A portion of the 2012 pension mark-to-market adjustment was capitalized as an inventoriable cost atthe end of 2012. In 2011, asset returns were lower than expected by $471 million and discount rates declined resulting in an unfavorablemark-to-market adjustment recorded in earnings in the fourth quarter of 2011. A portion of the 2011 pension mark-to-market adjustment wascapitalized as an inventoriable cost at the end of 2011. This amount was recorded in earnings in the first quarter of 2012. Mark-to-marketadjustments for commodities reflect the changes in the fair value of contracts for the difference between contract and market prices for theunderlying commodities. The resulting gains/losses are recognized in the quarter they occur.
(e) Underlying internal operating profit growth excludes the impact of foreign currency translation, pension and commodity mark-to-marketadjustments, Project K costs and, if applicable, acquisitions, dispositions, and integration costs associated with the acquisition of Pringles. TheCompany believes the use of this non-GAAP measure provides increased transparency and assists in understanding underlying operatingperformance. This non-GAAP measure is reconciled to the directly comparable measure in accordance with U.S. GAAP within this table.
Internal net sales for U.S. Morning Foods increased2.4% as a result of favorable pricing/mix andapproximately flat volume. This segment consists ofcereal, toaster pastries, health and wellness bars, andbeverages. Cereal’s internal net sales increased by 2.4%resulting from strong innovation launches and increasedinvestment in brand-building supporting brands such asFrosted Flakes®. Toaster pastries reported consumptiongrowth and share gains. Beverages reported increasedconsumption resulting from expanded distribution andstrong innovation launches.
Internal net sales in U.S. Snacks increased by 2.2% as aresult of favorable pricing/mix and a slight decline involume. This business consists of crackers, cereal bars,cookies, savory snacks and fruit-flavored snacks. Thesales growth was the result of strong crackersconsumption behind the launch of Special K CrackerChips® and Cheez-it® innovation. Sales declined incereal bars versus a difficult year-ago comparison whileSpecial K® bars continued strong growth behindinnovations. Cookies sales were flat versus a difficultyear-ago comparison.
20
Internal net sales in U.S. Specialty increased by 7.4%as a result of favorable pricing/mix and volume. Salesgrowth was due to strong results from innovationlaunches and expanded points of distribution.
Internal net sales in North America Other (U.S. Frozenand Canada) increased by 7.0% due to favorablepricing/mix and volume. Sales growth was the resultof our U.S. Frozen business posting double-digitgrowth for the year while gaining share as a result ofincreased brand-building support behind innovationactivity.
Europe’s internal net sales declined 3.8% for the yeardriven by a decline in volume, partially offset byfavorable pricing/mix. The operating environment inEurope continued to be difficult as a result ofeconomic conditions and competitive activity althoughwe are experiencing continued improvement in salestrends. Latin America’s internal net sales growth was6.7% due to a strong increase in pricing/mix partiallyoffset by a decline in volume. Latin Americaexperienced growth in both cereal and snacks behindan increase in brand-building investment to supportinnovations. Growth was broad-based across nearlyevery market in the segment. Internal net sales in AsiaPacific grew 2.7% as a result of favorable volumepartially offset by unfavorable pricing/mix. AsiaPacific’s growth was driven by solid performanceacross most of Asia, as well as South Africa. Australiaposted a slight decline in sales, but experiencedcontinued improvement throughout the year, whilegaining share in both the cereal and snacks categories.
The third quarter 2012 recall impacted internaloperating profit growth as follows: KelloggConsolidated — (1.8%), U.S. Morning Foods —(3.1%), U.S. Specialty — (1.6%), North America Other— (1.4%).
Underlying internal operating profit in U.S. MorningFoods declined by 3.4%, U.S. Snacks increased by0.1%, U.S. Specialty increased by 1.2%, NorthAmerica Other grew by 5.2%, Europe declined by15.8%, Latin America declined by 3.7% and AsiaPacific declined by 28.7%. U.S. Morning Foods’decline was attributable to the impact of the third-quarter recall and increased commodity costs, partiallyoffset by sales growth in cereal and toaster pastries.U.S. Snacks’ increase was attributable to sales growthwhich was partially offset by cost inflation and adouble-digit increase in brand-building investments.U.S. Specialty’s increase was attributable to strongsales growth being partially offset by increasedcommodity costs and a double-digit increase in brand-building investment. North America Other’s increasewas attributable to strong sales growth being partiallyoffset by increased commodity costs and a double-digit increase in brand-building investment. Europe’soperating profit declined due to lower sales resulting
from the continued difficult operating environmentand increased commodity costs, partially offset byreduced brand-building investment. The decline inLatin America’s operating profit was due to costinflation and increased brand-building investmentmore than offsetting the impact of higher sales. AsiaPacific’s operating profit decline was due to costinflation, charges related to the closure of a plant inAustralia, and increased brand-building investmentmore than offsetting the impact of higher sales. Referto Note 3 within Notes to Consolidated FinancialStatements for further information on the Australianplant closure.
Underlying internal operating profit for Corporatedeclined as a result of increased pension costs incurredresulting from the combination of lower interest costand higher expected return on assets for the plans.
Margin performanceMargin performance was as follows:
Change vs.prior year (pts.)
2013 2012 2011 2013 2012
Reported gross margin (a) 41.3% 38.3% 39.0% 3.0 (.7)Mark-to-market (COGS) (b) 3.4% (1.8)% (2.9)% 5.2 1.1Project K (COGS) (c) (1.1)% —% —% (1.1) —
Underlying gross margin (d) 39.0% 40.1% 41.9% (1.1) (1.8)
Reported SGA% (22.1)% (27.3)%(28.2)% 5.2 .9Mark-to-market (SGA) (b) 3.0% (1.4)% (2.3)% 4.4 .9Project K (SGA) (c) (.3)% —% —% (.3) —
Underlying SGA% (d) (24.8)% (25.9)%(25.9)% 1.1 —
Reported operating margin 19.2% 11.0% 10.8% 8.2 .2Mark-to-market (b) 6.4% (3.2)% (5.2)% 9.6 2.0Project K (c) (1.4)% —% —% (1.4) —
Underlying operatingmargin (d) 14.2% 14.2% 16.0% — (1.8)
(a) Reported gross margin as a percentage of net sales. Grossmargin is equal to net sales less cost of goods sold.
(b) Includes mark-to-market adjustments for pension plans andcommodity contracts as reflected in selling, general andadministrative expense as well as cost of goods sold. Actuarialgains/losses for pension plans are recognized in the year theyoccur. In 2013 , asset returns exceeds expectations by $545million and discount rates exceeded expectations by 65 basispoints resulting in a favorable mark-to-market adjustmentrecorded in earnings in the fourth quarter of 2013. A portion ofthis mark-to-market adjustment was capitalized as inventoriablecost at the end of 2013. In 2012, asset returns exceededexpectations by $211 million but discount rates fell almost 100basis points resulting in an unfavorable mark-to-marketadjustment recorded in earnings in the fourth quarter of 2012.A portion of the 2012 pension mark-to-market adjustment wascapitalized as an inventoriable cost at the end of 2012. Thisamount has been recorded in earnings in the first quarter of
21
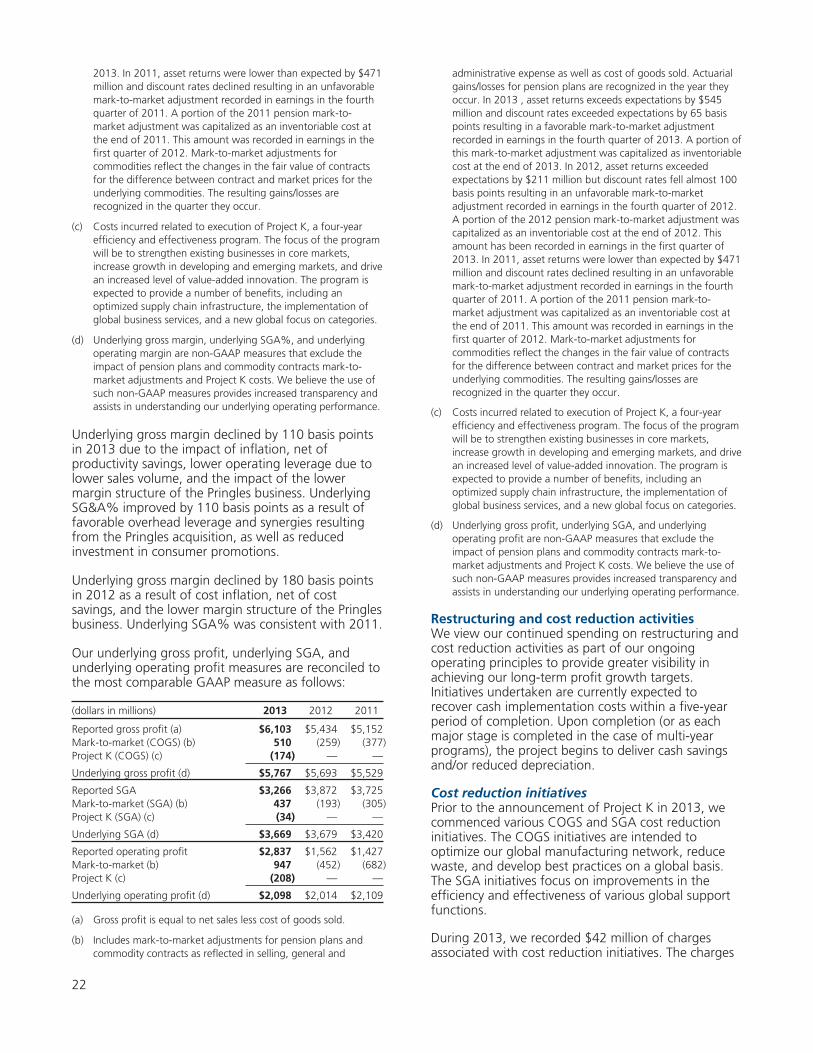
2013. In 2011, asset returns were lower than expected by $471million and discount rates declined resulting in an unfavorablemark-to-market adjustment recorded in earnings in the fourthquarter of 2011. A portion of the 2011 pension mark-to-market adjustment was capitalized as an inventoriable cost atthe end of 2011. This amount was recorded in earnings in thefirst quarter of 2012. Mark-to-market adjustments forcommodities reflect the changes in the fair value of contractsfor the difference between contract and market prices for theunderlying commodities. The resulting gains/losses arerecognized in the quarter they occur.
(c) Costs incurred related to execution of Project K, a four-yearefficiency and effectiveness program. The focus of the programwill be to strengthen existing businesses in core markets,increase growth in developing and emerging markets, and drivean increased level of value-added innovation. The program isexpected to provide a number of benefits, including anoptimized supply chain infrastructure, the implementation ofglobal business services, and a new global focus on categories.
(d) Underlying gross margin, underlying SGA%, and underlyingoperating margin are non-GAAP measures that exclude theimpact of pension plans and commodity contracts mark-to-market adjustments and Project K costs. We believe the use ofsuch non-GAAP measures provides increased transparency andassists in understanding our underlying operating performance.
Underlying gross margin declined by 110 basis pointsin 2013 due to the impact of inflation, net ofproductivity savings, lower operating leverage due tolower sales volume, and the impact of the lowermargin structure of the Pringles business. UnderlyingSG&A% improved by 110 basis points as a result offavorable overhead leverage and synergies resultingfrom the Pringles acquisition, as well as reducedinvestment in consumer promotions.
Underlying gross margin declined by 180 basis pointsin 2012 as a result of cost inflation, net of costsavings, and the lower margin structure of the Pringlesbusiness. Underlying SGA% was consistent with 2011.
Our underlying gross profit, underlying SGA, andunderlying operating profit measures are reconciled tothe most comparable GAAP measure as follows:
(dollars in millions) 2013 2012 2011
Reported gross profit (a) $6,103 $5,434 $5,152Mark-to-market (COGS) (b) 510 (259) (377)Project K (COGS) (c) (174) — —
Underlying gross profit (d) $5,767 $5,693 $5,529
Reported SGA $3,266 $3,872 $3,725Mark-to-market (SGA) (b) 437 (193) (305)Project K (SGA) (c) (34) — —
Underlying SGA (d) $3,669 $3,679 $3,420
Reported operating profit $2,837 $1,562 $1,427Mark-to-market (b) 947 (452) (682)Project K (c) (208) — —
Underlying operating profit (d) $2,098 $2,014 $2,109
(a) Gross profit is equal to net sales less cost of goods sold.
(b) Includes mark-to-market adjustments for pension plans andcommodity contracts as reflected in selling, general and
administrative expense as well as cost of goods sold. Actuarialgains/losses for pension plans are recognized in the year theyoccur. In 2013 , asset returns exceeds expectations by $545million and discount rates exceeded expectations by 65 basispoints resulting in a favorable mark-to-market adjustmentrecorded in earnings in the fourth quarter of 2013. A portion ofthis mark-to-market adjustment was capitalized as inventoriablecost at the end of 2013. In 2012, asset returns exceededexpectations by $211 million but discount rates fell almost 100basis points resulting in an unfavorable mark-to-marketadjustment recorded in earnings in the fourth quarter of 2012.A portion of the 2012 pension mark-to-market adjustment wascapitalized as an inventoriable cost at the end of 2012. Thisamount has been recorded in earnings in the first quarter of2013. In 2011, asset returns were lower than expected by $471million and discount rates declined resulting in an unfavorablemark-to-market adjustment recorded in earnings in the fourthquarter of 2011. A portion of the 2011 pension mark-to-market adjustment was capitalized as an inventoriable cost atthe end of 2011. This amount was recorded in earnings in thefirst quarter of 2012. Mark-to-market adjustments forcommodities reflect the changes in the fair value of contractsfor the difference between contract and market prices for theunderlying commodities. The resulting gains/losses arerecognized in the quarter they occur.
(c) Costs incurred related to execution of Project K, a four-yearefficiency and effectiveness program. The focus of the programwill be to strengthen existing businesses in core markets,increase growth in developing and emerging markets, and drivean increased level of value-added innovation. The program isexpected to provide a number of benefits, including anoptimized supply chain infrastructure, the implementation ofglobal business services, and a new global focus on categories.
(d) Underlying gross profit, underlying SGA, and underlyingoperating profit are non-GAAP measures that exclude theimpact of pension plans and commodity contracts mark-to-market adjustments and Project K costs. We believe the use ofsuch non-GAAP measures provides increased transparency andassists in understanding our underlying operating performance.
Restructuring and cost reduction activitiesWe view our continued spending on restructuring andcost reduction activities as part of our ongoingoperating principles to provide greater visibility inachieving our long-term profit growth targets.Initiatives undertaken are currently expected torecover cash implementation costs within a five-yearperiod of completion. Upon completion (or as eachmajor stage is completed in the case of multi-yearprograms), the project begins to deliver cash savingsand/or reduced depreciation.
Cost reduction initiativesPrior to the announcement of Project K in 2013, wecommenced various COGS and SGA cost reductioninitiatives. The COGS initiatives are intended tooptimize our global manufacturing network, reducewaste, and develop best practices on a global basis.The SGA initiatives focus on improvements in theefficiency and effectiveness of various global supportfunctions.
During 2013, we recorded $42 million of chargesassociated with cost reduction initiatives. The charges
22
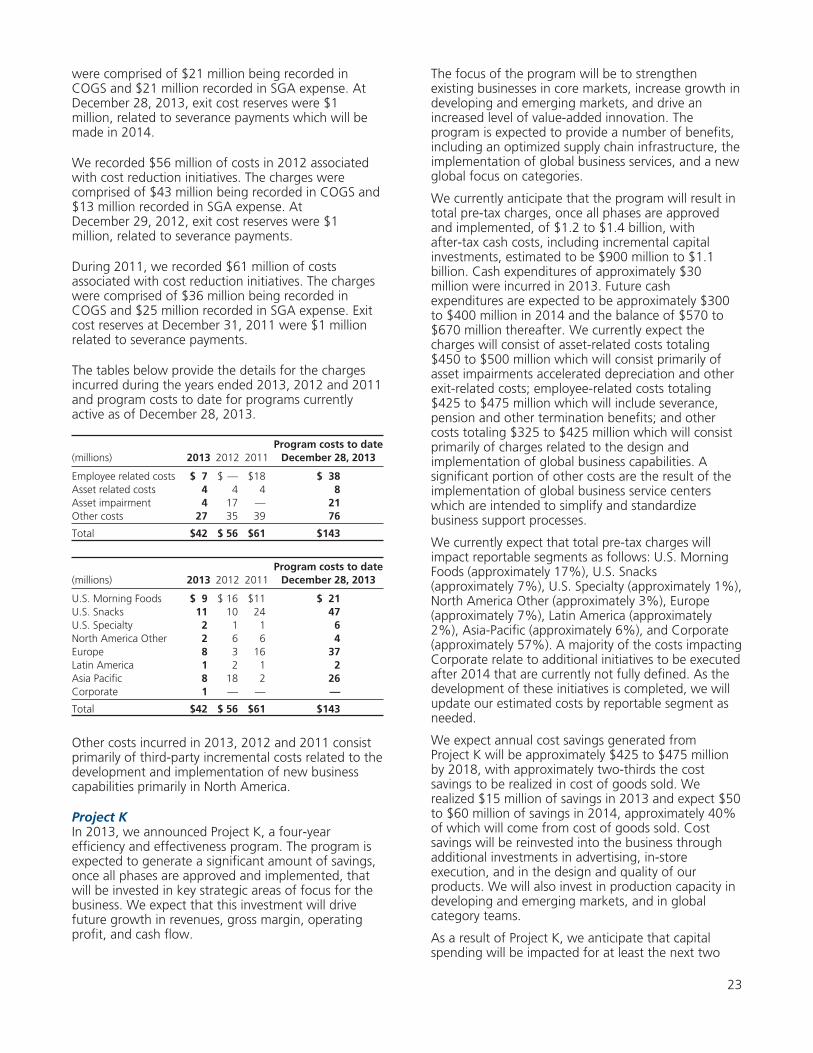
were comprised of $21 million being recorded inCOGS and $21 million recorded in SGA expense. AtDecember 28, 2013, exit cost reserves were $1million, related to severance payments which will bemade in 2014.
We recorded $56 million of costs in 2012 associatedwith cost reduction initiatives. The charges werecomprised of $43 million being recorded in COGS and$13 million recorded in SGA expense. AtDecember 29, 2012, exit cost reserves were $1million, related to severance payments.
During 2011, we recorded $61 million of costsassociated with cost reduction initiatives. The chargeswere comprised of $36 million being recorded inCOGS and $25 million recorded in SGA expense. Exitcost reserves at December 31, 2011 were $1 millionrelated to severance payments.
The tables below provide the details for the chargesincurred during the years ended 2013, 2012 and 2011and program costs to date for programs currentlyactive as of December 28, 2013.
Program costs to date(millions) 2013 2012 2011 December 28, 2013
Employee related costs $ 7 $ — $18 $ 38Asset related costs 4 4 4 8Asset impairment 4 17 — 21Other costs 27 35 39 76
Total $42 $ 56 $61 $143
Program costs to date(millions) 2013 2012 2011 December 28, 2013
U.S. Morning Foods $ 9 $ 16 $11 $ 21U.S. Snacks 11 10 24 47U.S. Specialty 2 1 1 6North America Other 2 6 6 4Europe 8 3 16 37Latin America 1 2 1 2Asia Pacific 8 18 2 26Corporate 1 — — —
Total $42 $ 56 $61 $143
Other costs incurred in 2013, 2012 and 2011 consistprimarily of third-party incremental costs related to thedevelopment and implementation of new businesscapabilities primarily in North America.
Project KIn 2013, we announced Project K, a four-yearefficiency and effectiveness program. The program isexpected to generate a significant amount of savings,once all phases are approved and implemented, thatwill be invested in key strategic areas of focus for thebusiness. We expect that this investment will drivefuture growth in revenues, gross margin, operatingprofit, and cash flow.
The focus of the program will be to strengthenexisting businesses in core markets, increase growth indeveloping and emerging markets, and drive anincreased level of value-added innovation. Theprogram is expected to provide a number of benefits,including an optimized supply chain infrastructure, theimplementation of global business services, and a newglobal focus on categories.
We currently anticipate that the program will result intotal pre-tax charges, once all phases are approvedand implemented, of $1.2 to $1.4 billion, withafter-tax cash costs, including incremental capitalinvestments, estimated to be $900 million to $1.1billion. Cash expenditures of approximately $30million were incurred in 2013. Future cashexpenditures are expected to be approximately $300to $400 million in 2014 and the balance of $570 to$670 million thereafter. We currently expect thecharges will consist of asset-related costs totaling$450 to $500 million which will consist primarily ofasset impairments accelerated depreciation and otherexit-related costs; employee-related costs totaling$425 to $475 million which will include severance,pension and other termination benefits; and othercosts totaling $325 to $425 million which will consistprimarily of charges related to the design andimplementation of global business capabilities. Asignificant portion of other costs are the result of theimplementation of global business service centerswhich are intended to simplify and standardizebusiness support processes.
We currently expect that total pre-tax charges willimpact reportable segments as follows: U.S. MorningFoods (approximately 17%), U.S. Snacks(approximately 7%), U.S. Specialty (approximately 1%),North America Other (approximately 3%), Europe(approximately 7%), Latin America (approximately2%), Asia-Pacific (approximately 6%), and Corporate(approximately 57%). A majority of the costs impactingCorporate relate to additional initiatives to be executedafter 2014 that are currently not fully defined. As thedevelopment of these initiatives is completed, we willupdate our estimated costs by reportable segment asneeded.
We expect annual cost savings generated fromProject K will be approximately $425 to $475 millionby 2018, with approximately two-thirds the costsavings to be realized in cost of goods sold. Werealized $15 million of savings in 2013 and expect $50to $60 million of savings in 2014, approximately 40%of which will come from cost of goods sold. Costsavings will be reinvested into the business throughadditional investments in advertising, in-storeexecution, and in the design and quality of ourproducts. We will also invest in production capacity indeveloping and emerging markets, and in globalcategory teams.
As a result of Project K, we anticipate that capitalspending will be impacted for at least the next two
23
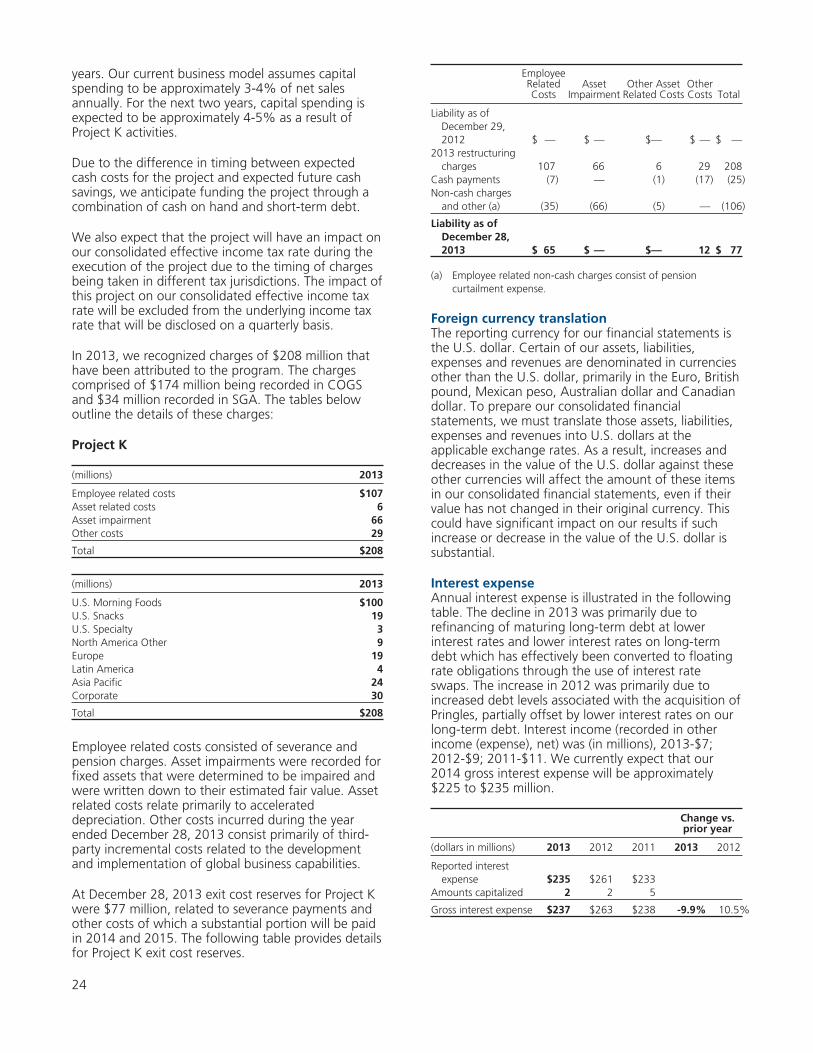
years. Our current business model assumes capitalspending to be approximately 3-4% of net salesannually. For the next two years, capital spending isexpected to be approximately 4-5% as a result ofProject K activities.
Due to the difference in timing between expectedcash costs for the project and expected future cashsavings, we anticipate funding the project through acombination of cash on hand and short-term debt.
We also expect that the project will have an impact onour consolidated effective income tax rate during theexecution of the project due to the timing of chargesbeing taken in different tax jurisdictions. The impact ofthis project on our consolidated effective income taxrate will be excluded from the underlying income taxrate that will be disclosed on a quarterly basis.
In 2013, we recognized charges of $208 million thathave been attributed to the program. The chargescomprised of $174 million being recorded in COGSand $34 million recorded in SGA. The tables belowoutline the details of these charges:
Project K
(millions) 2013
Employee related costs $107Asset related costs 6Asset impairment 66Other costs 29
Total $208
(millions) 2013
U.S. Morning Foods $100U.S. Snacks 19U.S. Specialty 3North America Other 9Europe 19Latin America 4Asia Pacific 24Corporate 30
Total $208
Employee related costs consisted of severance andpension charges. Asset impairments were recorded forfixed assets that were determined to be impaired andwere written down to their estimated fair value. Assetrelated costs relate primarily to accelerateddepreciation. Other costs incurred during the yearended December 28, 2013 consist primarily of third-party incremental costs related to the developmentand implementation of global business capabilities.
At December 28, 2013 exit cost reserves for Project Kwere $77 million, related to severance payments andother costs of which a substantial portion will be paidin 2014 and 2015. The following table provides detailsfor Project K exit cost reserves.
EmployeeRelatedCosts
AssetImpairment
Other AssetRelated Costs
OtherCosts Total
Liability as ofDecember 29,2012 $ — $ — $— $ — $ —
2013 restructuringcharges 107 66 6 29 208
Cash payments (7) — (1) (17) (25)Non-cash charges
and other (a) (35) (66) (5) — (106)
Liability as ofDecember 28,2013 $ 65 $ — $— 12 $ 77
(a) Employee related non-cash charges consist of pensioncurtailment expense.
Foreign currency translationThe reporting currency for our financial statements isthe U.S. dollar. Certain of our assets, liabilities,expenses and revenues are denominated in currenciesother than the U.S. dollar, primarily in the Euro, Britishpound, Mexican peso, Australian dollar and Canadiandollar. To prepare our consolidated financialstatements, we must translate those assets, liabilities,expenses and revenues into U.S. dollars at theapplicable exchange rates. As a result, increases anddecreases in the value of the U.S. dollar against theseother currencies will affect the amount of these itemsin our consolidated financial statements, even if theirvalue has not changed in their original currency. Thiscould have significant impact on our results if suchincrease or decrease in the value of the U.S. dollar issubstantial.
Interest expenseAnnual interest expense is illustrated in the followingtable. The decline in 2013 was primarily due torefinancing of maturing long-term debt at lowerinterest rates and lower interest rates on long-termdebt which has effectively been converted to floatingrate obligations through the use of interest rateswaps. The increase in 2012 was primarily due toincreased debt levels associated with the acquisition ofPringles, partially offset by lower interest rates on ourlong-term debt. Interest income (recorded in otherincome (expense), net) was (in millions), 2013-$7;2012-$9; 2011-$11. We currently expect that our2014 gross interest expense will be approximately$225 to $235 million.
(dollars in millions)
Change vs.prior year
2013 2012 2011 2013 2012
Reported interestexpense $235 $261 $233
Amounts capitalized 2 2 5
Gross interest expense $237 $263 $238 -9.9% 10.5%
24
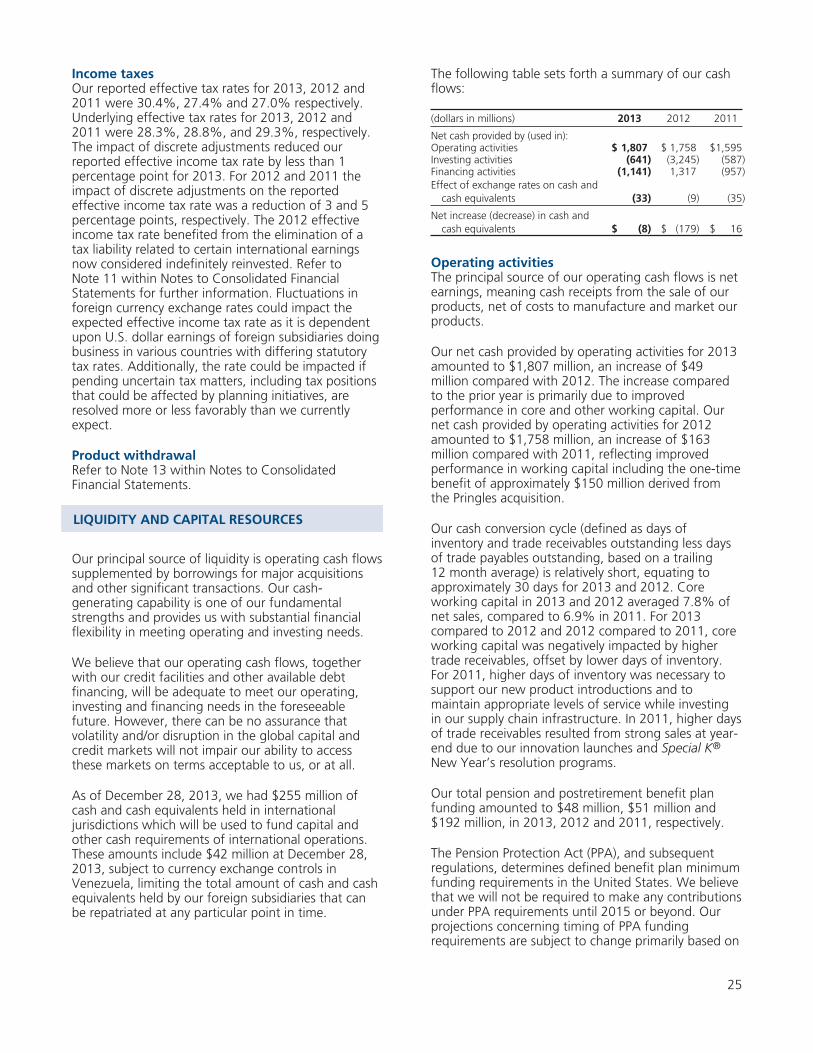
Income taxesOur reported effective tax rates for 2013, 2012 and2011 were 30.4%, 27.4% and 27.0% respectively.Underlying effective tax rates for 2013, 2012 and2011 were 28.3%, 28.8%, and 29.3%, respectively.The impact of discrete adjustments reduced ourreported effective income tax rate by less than 1percentage point for 2013. For 2012 and 2011 theimpact of discrete adjustments on the reportedeffective income tax rate was a reduction of 3 and 5percentage points, respectively. The 2012 effectiveincome tax rate benefited from the elimination of atax liability related to certain international earningsnow considered indefinitely reinvested. Refer toNote 11 within Notes to Consolidated FinancialStatements for further information. Fluctuations inforeign currency exchange rates could impact theexpected effective income tax rate as it is dependentupon U.S. dollar earnings of foreign subsidiaries doingbusiness in various countries with differing statutorytax rates. Additionally, the rate could be impacted ifpending uncertain tax matters, including tax positionsthat could be affected by planning initiatives, areresolved more or less favorably than we currentlyexpect.
Product withdrawalRefer to Note 13 within Notes to ConsolidatedFinancial Statements.
LIQUIDITY AND CAPITAL RESOURCES
Our principal source of liquidity is operating cash flowssupplemented by borrowings for major acquisitionsand other significant transactions. Our cash-generating capability is one of our fundamentalstrengths and provides us with substantial financialflexibility in meeting operating and investing needs.
We believe that our operating cash flows, togetherwith our credit facilities and other available debtfinancing, will be adequate to meet our operating,investing and financing needs in the foreseeablefuture. However, there can be no assurance thatvolatility and/or disruption in the global capital andcredit markets will not impair our ability to accessthese markets on terms acceptable to us, or at all.
As of December 28, 2013, we had $255 million ofcash and cash equivalents held in internationaljurisdictions which will be used to fund capital andother cash requirements of international operations.These amounts include $42 million at December 28,2013, subject to currency exchange controls inVenezuela, limiting the total amount of cash and cashequivalents held by our foreign subsidiaries that canbe repatriated at any particular point in time.
The following table sets forth a summary of our cashflows:
(dollars in millions) 2013 2012 2011
Net cash provided by (used in):Operating activities $ 1,807 $ 1,758 $1,595Investing activities (641) (3,245) (587)Financing activities (1,141) 1,317 (957)Effect of exchange rates on cash and
cash equivalents (33) (9) (35)
Net increase (decrease) in cash andcash equivalents $ (8) $ (179) $ 16
Operating activitiesThe principal source of our operating cash flows is netearnings, meaning cash receipts from the sale of ourproducts, net of costs to manufacture and market ourproducts.
Our net cash provided by operating activities for 2013amounted to $1,807 million, an increase of $49million compared with 2012. The increase comparedto the prior year is primarily due to improvedperformance in core and other working capital. Ournet cash provided by operating activities for 2012amounted to $1,758 million, an increase of $163million compared with 2011, reflecting improvedperformance in working capital including the one-timebenefit of approximately $150 million derived fromthe Pringles acquisition.
Our cash conversion cycle (defined as days ofinventory and trade receivables outstanding less daysof trade payables outstanding, based on a trailing12 month average) is relatively short, equating toapproximately 30 days for 2013 and 2012. Coreworking capital in 2013 and 2012 averaged 7.8% ofnet sales, compared to 6.9% in 2011. For 2013compared to 2012 and 2012 compared to 2011, coreworking capital was negatively impacted by highertrade receivables, offset by lower days of inventory.For 2011, higher days of inventory was necessary tosupport our new product introductions and tomaintain appropriate levels of service while investingin our supply chain infrastructure. In 2011, higher daysof trade receivables resulted from strong sales at year-end due to our innovation launches and Special K®
New Year’s resolution programs.
Our total pension and postretirement benefit planfunding amounted to $48 million, $51 million and$192 million, in 2013, 2012 and 2011, respectively.
The Pension Protection Act (PPA), and subsequentregulations, determines defined benefit plan minimumfunding requirements in the United States. We believethat we will not be required to make any contributionsunder PPA requirements until 2015 or beyond. Ourprojections concerning timing of PPA fundingrequirements are subject to change primarily based on
25
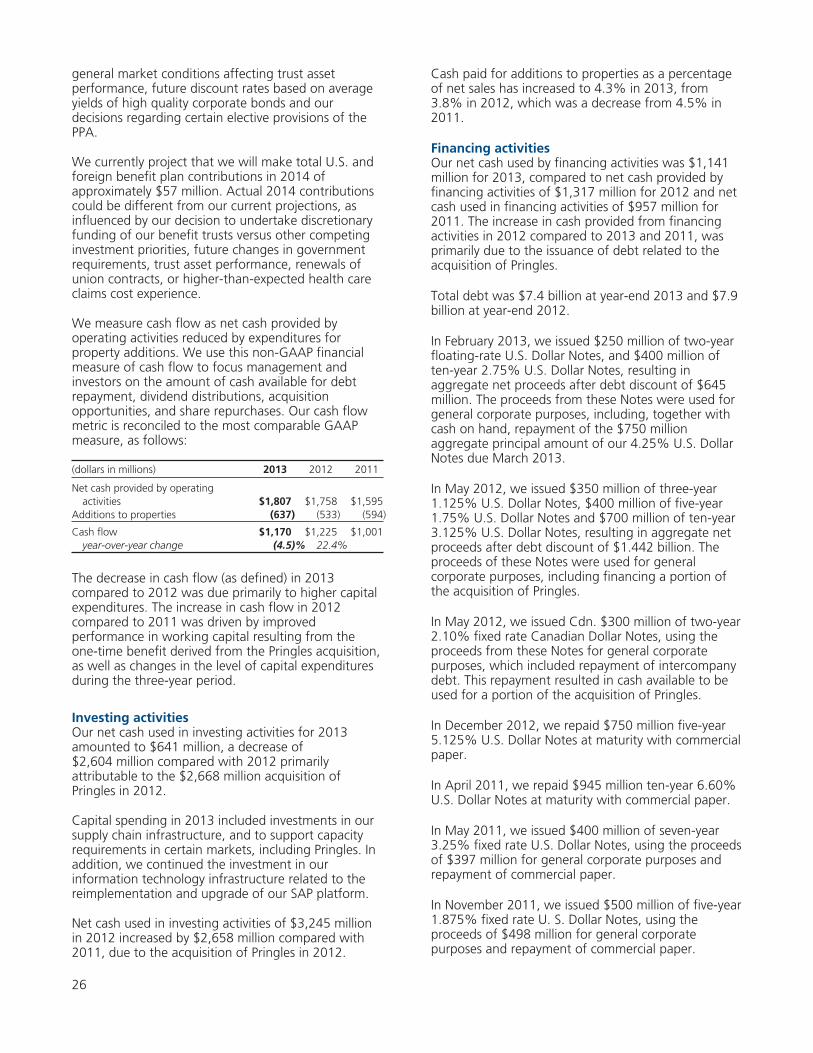
general market conditions affecting trust assetperformance, future discount rates based on averageyields of high quality corporate bonds and ourdecisions regarding certain elective provisions of thePPA.
We currently project that we will make total U.S. andforeign benefit plan contributions in 2014 ofapproximately $57 million. Actual 2014 contributionscould be different from our current projections, asinfluenced by our decision to undertake discretionaryfunding of our benefit trusts versus other competinginvestment priorities, future changes in governmentrequirements, trust asset performance, renewals ofunion contracts, or higher-than-expected health careclaims cost experience.
We measure cash flow as net cash provided byoperating activities reduced by expenditures forproperty additions. We use this non-GAAP financialmeasure of cash flow to focus management andinvestors on the amount of cash available for debtrepayment, dividend distributions, acquisitionopportunities, and share repurchases. Our cash flowmetric is reconciled to the most comparable GAAPmeasure, as follows:
(dollars in millions) 2013 2012 2011
Net cash provided by operatingactivities $1,807 $1,758 $1,595
Additions to properties (637) (533) (594)
Cash flow $1,170 $1,225 $1,001year-over-year change (4.5)% 22.4%
The decrease in cash flow (as defined) in 2013compared to 2012 was due primarily to higher capitalexpenditures. The increase in cash flow in 2012compared to 2011 was driven by improvedperformance in working capital resulting from theone-time benefit derived from the Pringles acquisition,as well as changes in the level of capital expendituresduring the three-year period.
Investing activitiesOur net cash used in investing activities for 2013amounted to $641 million, a decrease of$2,604 million compared with 2012 primarilyattributable to the $2,668 million acquisition ofPringles in 2012.
Capital spending in 2013 included investments in oursupply chain infrastructure, and to support capacityrequirements in certain markets, including Pringles. Inaddition, we continued the investment in ourinformation technology infrastructure related to thereimplementation and upgrade of our SAP platform.
Net cash used in investing activities of $3,245 millionin 2012 increased by $2,658 million compared with2011, due to the acquisition of Pringles in 2012.
Cash paid for additions to properties as a percentageof net sales has increased to 4.3% in 2013, from3.8% in 2012, which was a decrease from 4.5% in2011.
Financing activitiesOur net cash used by financing activities was $1,141million for 2013, compared to net cash provided byfinancing activities of $1,317 million for 2012 and netcash used in financing activities of $957 million for2011. The increase in cash provided from financingactivities in 2012 compared to 2013 and 2011, wasprimarily due to the issuance of debt related to theacquisition of Pringles.
Total debt was $7.4 billion at year-end 2013 and $7.9billion at year-end 2012.
In February 2013, we issued $250 million of two-yearfloating-rate U.S. Dollar Notes, and $400 million often-year 2.75% U.S. Dollar Notes, resulting inaggregate net proceeds after debt discount of $645million. The proceeds from these Notes were used forgeneral corporate purposes, including, together withcash on hand, repayment of the $750 millionaggregate principal amount of our 4.25% U.S. DollarNotes due March 2013.
In May 2012, we issued $350 million of three-year1.125% U.S. Dollar Notes, $400 million of five-year1.75% U.S. Dollar Notes and $700 million of ten-year3.125% U.S. Dollar Notes, resulting in aggregate netproceeds after debt discount of $1.442 billion. Theproceeds of these Notes were used for generalcorporate purposes, including financing a portion ofthe acquisition of Pringles.
In May 2012, we issued Cdn. $300 million of two-year2.10% fixed rate Canadian Dollar Notes, using theproceeds from these Notes for general corporatepurposes, which included repayment of intercompanydebt. This repayment resulted in cash available to beused for a portion of the acquisition of Pringles.
In December 2012, we repaid $750 million five-year5.125% U.S. Dollar Notes at maturity with commercialpaper.
In April 2011, we repaid $945 million ten-year 6.60%U.S. Dollar Notes at maturity with commercial paper.
In May 2011, we issued $400 million of seven-year3.25% fixed rate U.S. Dollar Notes, using the proceedsof $397 million for general corporate purposes andrepayment of commercial paper.
In November 2011, we issued $500 million of five-year1.875% fixed rate U. S. Dollar Notes, using theproceeds of $498 million for general corporatepurposes and repayment of commercial paper.
26
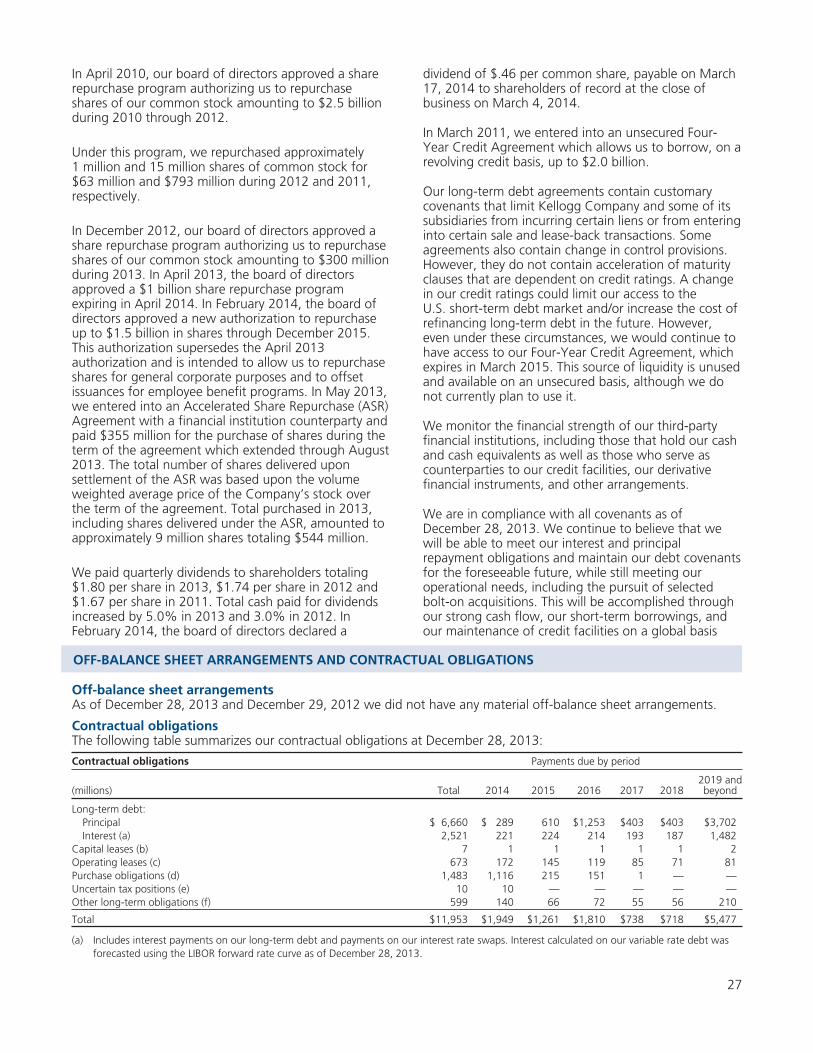
In April 2010, our board of directors approved a sharerepurchase program authorizing us to repurchaseshares of our common stock amounting to $2.5 billionduring 2010 through 2012.
Under this program, we repurchased approximately1 million and 15 million shares of common stock for$63 million and $793 million during 2012 and 2011,respectively.
In December 2012, our board of directors approved ashare repurchase program authorizing us to repurchaseshares of our common stock amounting to $300 millionduring 2013. In April 2013, the board of directorsapproved a $1 billion share repurchase programexpiring in April 2014. In February 2014, the board ofdirectors approved a new authorization to repurchaseup to $1.5 billion in shares through December 2015.This authorization supersedes the April 2013authorization and is intended to allow us to repurchaseshares for general corporate purposes and to offsetissuances for employee benefit programs. In May 2013,we entered into an Accelerated Share Repurchase (ASR)Agreement with a financial institution counterparty andpaid $355 million for the purchase of shares during theterm of the agreement which extended through August2013. The total number of shares delivered uponsettlement of the ASR was based upon the volumeweighted average price of the Company’s stock overthe term of the agreement. Total purchased in 2013,including shares delivered under the ASR, amounted toapproximately 9 million shares totaling $544 million.
We paid quarterly dividends to shareholders totaling$1.80 per share in 2013, $1.74 per share in 2012 and$1.67 per share in 2011. Total cash paid for dividendsincreased by 5.0% in 2013 and 3.0% in 2012. InFebruary 2014, the board of directors declared a
dividend of $.46 per common share, payable on March17, 2014 to shareholders of record at the close ofbusiness on March 4, 2014.
In March 2011, we entered into an unsecured Four-Year Credit Agreement which allows us to borrow, on arevolving credit basis, up to $2.0 billion.
Our long-term debt agreements contain customarycovenants that limit Kellogg Company and some of itssubsidiaries from incurring certain liens or from enteringinto certain sale and lease-back transactions. Someagreements also contain change in control provisions.However, they do not contain acceleration of maturityclauses that are dependent on credit ratings. A changein our credit ratings could limit our access to theU.S. short-term debt market and/or increase the cost ofrefinancing long-term debt in the future. However,even under these circumstances, we would continue tohave access to our Four-Year Credit Agreement, whichexpires in March 2015. This source of liquidity is unusedand available on an unsecured basis, although we donot currently plan to use it.
We monitor the financial strength of our third-partyfinancial institutions, including those that hold our cashand cash equivalents as well as those who serve ascounterparties to our credit facilities, our derivativefinancial instruments, and other arrangements.
We are in compliance with all covenants as ofDecember 28, 2013. We continue to believe that wewill be able to meet our interest and principalrepayment obligations and maintain our debt covenantsfor the foreseeable future, while still meeting ouroperational needs, including the pursuit of selectedbolt-on acquisitions. This will be accomplished throughour strong cash flow, our short-term borrowings, andour maintenance of credit facilities on a global basis
OFF-BALANCE SHEET ARRANGEMENTS AND CONTRACTUAL OBLIGATIONS
Off-balance sheet arrangementsAs of December 28, 2013 and December 29, 2012 we did not have any material off-balance sheet arrangements.
Contractual obligationsThe following table summarizes our contractual obligations at December 28, 2013:
Contractual obligations Payments due by period
(millions) Total 2014 2015 2016 2017 20182019 andbeyond
Long-term debt:Principal $ 6,660 $ 289 610 $1,253 $403 $403 $3,702Interest (a) 2,521 221 224 214 193 187 1,482
Capital leases (b) 7 1 1 1 1 1 2Operating leases (c) 673 172 145 119 85 71 81Purchase obligations (d) 1,483 1,116 215 151 1 — —Uncertain tax positions (e) 10 10 — — — — —Other long-term obligations (f) 599 140 66 72 55 56 210
Total $11,953 $1,949 $1,261 $1,810 $738 $718 $5,477
(a) Includes interest payments on our long-term debt and payments on our interest rate swaps. Interest calculated on our variable rate debt wasforecasted using the LIBOR forward rate curve as of December 28, 2013.
27
(b) The total expected cash payments on our capital leases include interest expense totaling approximately $1 million over the periods presentedabove.
(c) Operating leases represent the minimum rental commitments under non-cancelable operating leases.
(d) Purchase obligations consist primarily of fixed commitments for raw materials to be utilized in the normal course of business and formarketing, advertising and other services. The amounts presented in the table do not include items already recorded in accounts payable orother current liabilities at year-end 2013, nor does the table reflect cash flows we are likely to incur based on our plans, but are not obligatedto incur. Therefore, it should be noted that the exclusion of these items from the table could be a limitation in assessing our total future cashflows under contracts.
(e) As of December 28, 2013, our total liability for uncertain tax positions was $79 million, of which $10 million is expected to be paid in the nexttwelve months. We are not able to reasonably estimate the timing of future cash flows related to the remaining $69 million.
(f) Other long-term obligations are those associated with noncurrent liabilities recorded within the Consolidated Balance Sheet at year-end 2013and consist principally of projected commitments under deferred compensation arrangements, multiemployer plans, and supplementalemployee retirement benefits. The table also includes our current estimate of minimum contributions to defined benefit pension andpostretirement benefit plans through 2019 as follows: 2014-$57; 2015-$40; 2016-$40; 2017-$41; 2018-$41; 2019-$42.
CRITICAL ACCOUNTING ESTIMATES
Promotional expendituresOur promotional activities are conducted either throughthe retail trade or directly with consumers and includeactivities such as in-store displays and events, featureprice discounts, consumer coupons, contests and loyaltyprograms. The costs of these activities are generallyrecognized at the time the related revenue is recorded,which normally precedes the actual cash expenditure.The recognition of these costs therefore requiresmanagement judgment regarding the volume ofpromotional offers that will be redeemed by either theretail trade or consumer. These estimates are madeusing various techniques including historical data onperformance of similar promotional programs.Differences between estimated expense and actualredemptions are normally insignificant and recognizedas a change in management estimate in a subsequentperiod. On a full-year basis, these subsequent periodadjustments represent approximately 0.4% of ourcompany’s net sales. However, our company’s totalpromotional expenditures (including amounts classifiedas a revenue reduction) are significant, so it is likely ourresults would be materially different if differentassumptions or conditions were to prevail.
PropertyLong-lived assets such as property, plant and equipmentare tested for impairment when conditions indicate thatthe carrying value may not be recoverable.Management evaluates several conditions, including,but not limited to, the following: a significant decreasein the market price of an asset or an asset group; asignificant adverse change in the extent or manner inwhich a long-lived asset is being used, including anextended period of idleness; and a current expectationthat, more likely than not, a long-lived asset or assetgroup will be sold or otherwise disposed of significantlybefore the end of its previously estimated useful life. Forassets to be held and used, we project the expectedfuture undiscounted cash flows generated by the long-lived asset or asset group over the remaining useful lifeof the primary asset. If the cash flow analysis yields an
amount less than the carrying amount we determinethe fair value of the asset or asset group by usingcomparable market data. There are inherentuncertainties associated with the judgments andestimates we use in these analyses.
At December 28, 2013, we have property, plant andequipment of $3.9 billion, net of accumulateddepreciation, on our balance sheet. Included in thisamount are approximately $54 million of idle assets.
Goodwill and other intangible assetsWe perform an impairment evaluation of goodwill andintangible assets with indefinite useful lives at leastannually during the fourth quarter of each year inconjunction with our annual budgeting process. Our2012 analysis excluded goodwill and other intangibleassets related to the Pringles acquisition on May 31,2012. To comply with the requirement that all goodwilland indefinite-lived intangible assets are tested forimpairment within one year of acquisition, intangibleassets recognized as part of the Pringles acquisitionwere tested for impairment during the second quarterof 2013 in addition to the evaluation during the fourthquarter of 2013.
Goodwill impairment testing first requires a comparisonbetween the carrying value and fair value of a reportingunit with associated goodwill. Carrying value is basedon the assets and liabilities associated with theoperations of that reporting unit, which often requiresallocation of shared or corporate items amongreporting units. For the 2013 goodwill impairment test,the fair value of the reporting units was estimatedbased on market multiples. Our approach employsmarket multiples based on earnings before interest,taxes, depreciation and amortization (EBITDA), earningsfor companies comparable to our reporting units anddiscounted cash flows. Management believes theassumptions used for the impairment test are consistentwith those utilized by a market participant performingsimilar valuations for our reporting units.
28
Similarly, impairment testing of indefinite-livedintangible assets requires a comparison of carryingvalue to fair value of that particular asset. Fair valuesof non-goodwill intangible assets are based primarilyon projections of future cash flows to be generatedfrom that asset. For instance, cash flows related to aparticular trademark would be based on a projectedroyalty stream attributable to branded product salesdiscounted at rates consistent with rates used bymarket participants. These estimates are made usingvarious inputs including historical data, current andanticipated market conditions, management plans,and market comparables.
We also evaluate the useful life over which a non-goodwill intangible asset with a finite life is expectedto contribute directly or indirectly to our cash flows.Reaching a determination on useful life requiressignificant judgments and assumptions regarding thefuture effects of obsolescence, demand, competition,other economic factors (such as the stability of theindustry, known technological advances, legislativeaction that results in an uncertain or changingregulatory environment, and expected changes indistribution channels), the level of requiredmaintenance expenditures, and the expected lives ofother related groups of assets.
At December 28, 2013, goodwill and other intangibleassets amounted to $7.4 billion, consisting primarily ofgoodwill and brands associated with the 2001acquisition of Keebler Foods Company and the 2012acquisition of Pringles. Within this total, approximately$2.3 billion of non-goodwill intangible assets wereclassified as indefinite-lived, comprised principally ofKeebler and Pringles trademarks. We currently believethat the fair value of our goodwill and other intangibleassets exceeds their carrying value and that thoseintangibles so classified will contribute indefinitely toour cash flows. The percentage of excess fair valueover carrying value of the U.S. Snacks reporting unitwas approximately 57% and 43% in 2013 and 2012,respectively. However, if we had used materiallydifferent assumptions, which we do not believe arereasonably possible, regarding the future performanceof our business or a different market multiple in thevaluation, this could have resulted in significantimpairment losses. Additionally, we have $57 millionof goodwill related to our 2008 acquisition of UnitedBakers in Russia. The percentage of excess fair valueover carrying value of the Russian reporting unit wasapproximately 30% in 2013 and 2012. If we usedmodestly different assumptions regarding salesmultiples and EBITDA in the valuation, this could haveresulted in an impairment loss. For example, if ourprojection of EBITDA margins had been lower by 200basis points, this change in assumption may haveresulted in impairment of some or all of the goodwillin the Russian reporting unit. Management willcontinue to monitor the situation closely.
Retirement benefitsOur company sponsors a number of U.S. and foreigndefined benefit employee pension plans and alsoprovides retiree health care and other welfare benefitsin the United States and Canada. Plan fundingstrategies are influenced by tax regulations and assetreturn performance. A substantial majority of planassets are invested in a globally diversified portfolio ofequity securities with smaller holdings of debtsecurities and other investments. We recognize thecost of benefits provided during retirement over theemployees’ active working life to determine theobligations and expense related to our retiree benefitplans. Inherent in this concept is the requirement touse various actuarial assumptions to predict andmeasure costs and obligations many years prior to thesettlement date. Major actuarial assumptions thatrequire significant management judgment and have amaterial impact on the measurement of ourconsolidated benefits expense and accumulatedobligation include the long-term rates of return onplan assets, the health care cost trend rates, and theinterest rates used to discount the obligations for ourmajor plans, which cover employees in the UnitedStates, United Kingdom and Canada.
Our expense recognition policy for pension andnonpension postretirement benefits is to immediatelyrecognize actuarial gains and losses in our operatingresults in the year in which they occur. Actuarial gainsand losses are recognized annually as of ourmeasurement date, which is our fiscal year-end, orwhen remeasurement is otherwise required undergenerally accepted accounting principles.
Additionally, for purposes of calculating the expectedreturn on plan assets related to pension andnonpension postretirement benefits we use the fairvalue of plan assets.
To conduct our annual review of the long-term rate ofreturn on plan assets, we model expected returns overa 20-year investment horizon with respect to thespecific investment mix of each of our major plans.The return assumptions used reflect a combination ofrigorous historical performance analysis and forward-looking views of the financial markets includingconsideration of current yields on long-term bonds,price-earnings ratios of the major stock marketindices, and long-term inflation. Our U.S. plan model,corresponding to approximately 68% of our trustassets globally, currently incorporates a long-terminflation assumption of 2.5% and an activemanagement premium of 1% (net of fees) validatedby historical analysis and future return expectations.Although we review our expected long-term rates ofreturn annually, our benefit trust investmentperformance for one particular year does not, by itself,significantly influence our evaluation. Our expectedrates of return have generally not been revised,provided these rates continue to fall within a “more
29
likely than not” corridor of between the 25th and75th percentile of expected long-term returns, asdetermined by our modeling process. Our assumedrate of return for U.S. plans in 2014 of 8.5% equatesto approximately the 60th percentile expectation ofour model. Similar methods are used for variousforeign plans with invested assets, reflecting localeconomic conditions. Foreign trust investmentsrepresent approximately 32% of our global benefitplan assets.
Based on consolidated benefit plan assets atDecember 28, 2013, a 100 basis point increase ordecrease in the assumed rate of return wouldcorrespondingly increase or decrease 2014 benefitsexpense by approximately $61 million. For each of thethree fiscal years, our actual return on plan assetsexceeded (was less than) the recognized assumedreturn by the following amounts (in millions):2013-$545; 2012-$211; 2011–$(471).
To conduct our annual review of health care costtrend rates, we model our actual claims cost data overa five-year historical period, including an analysis ofpre-65 versus post-65 age groups and other importantdemographic components in our covered retireepopulation. This data is adjusted to eliminate theimpact of plan changes and other factors that wouldtend to distort the underlying cost inflation trends.Our initial health care cost trend rate is reviewedannually and adjusted as necessary to remainconsistent with recent historical experience and ourexpectations regarding short-term future trends. Incomparison to our actual five-year compound annualclaims cost growth rate of approximately 5.64%, ourinitial trend rate for 2014 of 5.25% reflects theexpected future impact of faster-growing claimsexperience for certain demographic groups within ourtotal employee population. Our initial rate is trendeddownward by 0.5% per year, until the ultimate trendrate of 4.5% is reached. The ultimate trend rate isadjusted annually, as necessary, to approximate thecurrent economic view on the rate of long-terminflation plus an appropriate health care costpremium. Based on consolidated obligations atDecember 28, 2013, a 100 basis point increase in theassumed health care cost trend rates would increase2014 benefits expense by approximately $11 millionand generate an immediate loss recognition of $132million. A 100 basis point excess of 2014 actual healthcare claims cost over that calculated from the assumedtrend rate would result in an experience loss ofapproximately $8 million and would increase 2014expense by $0.4 million. Any arising health care claimscost-related experience gain or loss is recognized inthe year in which they occur. The experience gainarising from recognition of 2013 claims experiencewas approximately $13 million.
To conduct our annual review of discount rates, weselected the discount rate based on a cash-flow
matching analysis using Towers Watson’s proprietaryRATE:Link tool and projections of the future benefitpayments constituting the projected benefit obligationfor the plans. RATE:Link establishes the uniformdiscount rate that produces the same present value ofthe estimated future benefit payments, as is generatedby discounting each year’s benefit payments by a spotrate applicable to that year. The spot rates used in thisprocess are derived from a yield curve created fromyields on the 40th to 90th percentile of U.S. highquality bonds. A similar methodology is applied inCanada and Europe, except the smaller bond marketsimply that yields between the 10th and 90thpercentiles are preferable. The measurement dates forour defined benefit plans are consistent with our fiscalyear end. Accordingly, we select discount rates tomeasure our benefit obligations that are consistentwith market indices during December of each year.
Based on consolidated obligations at December 28,2013, a 25 basis point decline in the weighted-average discount rate used for benefit planmeasurement purposes would increase 2014 benefitsexpense by approximately $1 million and would resultin an immediate loss recognition of $212 million. Allobligation-related actuarial gains and losses arerecognized immediately in the year in which theyoccur.
Despite the previously-described rigorous policies forselecting major actuarial assumptions, we periodicallyexperience material differences between assumed andactual experience. During 2013, we recognized a netactuarial gain of approximately $1,097 millioncompared to a net actuarial loss of approximately$445 million in 2012. Of the total net gain recognizedin 2013, approximately $552 million was relatedprimarily to favorable changes in the discount rate and$545 million in asset gains. Of the $445 million netloss recognized in 2012, approximately $656 millionwas related to unfavorable changes in the discountrate, offset by approximately $211 million of assetgains in 2012.
During 2013, we made contributions in the amount of$34 million to Kellogg’s global tax-qualified pensionprograms. This amount was mostly non-discretionary.Additionally we contributed $14 million to our retireemedical programs.
Income taxesOur consolidated effective income tax rate isinfluenced by tax planning opportunities available tous in the various jurisdictions in which we operate. Thecalculation of our income tax provision and deferredincome tax assets and liabilities is complex andrequires the use of estimates and judgment. Incometaxes are provided on the portion of foreign earningsthat is expected to be remitted to and taxable in theUnited States.
30
We recognize tax benefits associated with uncertaintax positions when, in our judgment, it is more likelythan not that the positions will be sustained uponexamination by a taxing authority. For tax positionsthat meet the more likely than not recognitionthreshold, we initially and subsequently measure thetax benefits as the largest amount that we judge tohave a greater than 50% likelihood of being realizedupon ultimate settlement. Our liability associated withunrecognized tax benefits is adjusted periodically dueto changing circumstances, such as the progress of taxaudits, new or emerging legislation and tax planning.The tax position will be derecognized when it is nolonger more likely than not of being sustained.Significant adjustments to our liability forunrecognized tax benefits impacting our effective taxrate are separately presented in the rate reconciliationtable of Note 11 within Notes to ConsolidatedFinancial Statements.
ACCOUNTING STANDARDS TO BE ADOPTED INFUTURE PERIODS
In July 2013, the Financial Accounting StandardsBoard (FASB) issued an Accounting Standards Update(ASU) which provides guidance on financial statementpresentation of unrecognized tax benefits when a netoperating loss carryforward, a similar tax loss, or a taxcredit carryforward exists. This ASU is expected toeliminate diversity in practice resulting from lack ofexisting guidance. It applies to all entities withunrecognized tax benefits that also have tax loss or taxcredit carryforwards in the same tax jurisdiction as ofthe reporting date. The ASU is effective for fiscalyears, and interim periods within those years,beginning after December 15, 2013, with earlyadoption permitted. The amendments should beapplied prospectively to all unrecognized tax benefitsthat exist at the effective date. Retrospectiveapplication is permitted. We will adopt the updatedstandard in the first quarter of 2014. We do notexpect the adoption of this guidance to have asignificant impact on our financial statements.
FUTURE OUTLOOKWe expect during 2014 that Project K will enable us tobegin to increase investment in certain businesses andthe categories in which we compete. We expectinternal net sales will increase by approximately 1percent, underlying gross margin to improveapproximately 40-50 basis points due to a moderateamount of deflation, net of cost savings initiatives,underlying internal operating profit to be flat to up 2percent, and currency-neutral comparable EPS to growby 1 to 3 percent. This outlook excludes the impact ofmark-to-market adjustments, Project K costs, Pringlesintegration costs, and the 53rd week which will occurin 2014.
ITEM 7A. QUANTITATIVE AND QUALITATIVEDISCLOSURES ABOUT MARKET RISK
Our company is exposed to certain market risks, whichexist as a part of our ongoing business operations. Weuse derivative financial and commodity instruments,where appropriate, to manage these risks. As a matterof policy, we do not engage in trading or speculativetransactions. Refer to Note 12 within Notes toConsolidated Financial Statements for furtherinformation on our derivative financial and commodityinstruments.
Foreign exchange riskOur company is exposed to fluctuations in foreigncurrency cash flows related primarily to third-partypurchases, intercompany transactions, and whenapplicable, nonfunctional currency denominated third-party debt. Our company is also exposed tofluctuations in the value of foreign currencyinvestments in subsidiaries and cash flows related torepatriation of these investments. Additionally, ourcompany is exposed to volatility in the translation offoreign currency denominated earnings to U.S. dollars.Primary exposures include the U.S. dollar versus theeuro, British pound, Australian dollar, Canadian dollar,and Mexican peso, and in the case of inter-subsidiarytransactions, the British pound versus the euro. Weassess foreign currency risk based on transactionalcash flows and translational volatility and may enterinto forward contracts, options, and currency swaps toreduce fluctuations in long or short currency positions.Forward contracts and options are generally less than18 months duration. Currency swap agreements maybe established in conjunction with the term ofunderlying debt issuances.
The total notional amount of foreign currency derivativeinstruments at year-end 2013 was $517 million,representing a settlement obligation of $1 million. Thetotal notional amount of foreign currency derivativeinstruments at year-end 2012 was $570 million,representing a settlement receivable of $1 million. All ofthese derivatives were hedges of anticipated transactions,translational exposure, or existing assets or liabilities, andmature within 18 months. Assuming an unfavorable 10%change in year-end exchange rates, the settlementobligation would have increased by approximately$52 million at year-end 2013 and the settlementreceivable would have decreased by approximately$57 million at year-end 2012. These unfavorable changeswould generally have been offset by favorable changes inthe values of the underlying exposures.
Venezuela was designated as a highly inflationaryeconomy as of the beginning of our 2010 fiscal year.Gains and losses resulting from the translation of thefinancial statements of subsidiaries operating in highlyinflationary economies are recorded in earnings. For2012 and 2011, the impact of the translation of our
31
Venezuelan subsidiary’s financial statements to U.S.dollars was not significant. In February 2013, theVenezuelan government announced a 46.5%devaluation of the official exchange rate. Additionally,the Transaction System for Foreign CurrencyDenominated Securities (SITME), used between May2010 and January 2013 to translate our Venezuelansubsidiary’s financial statements to U.S. dollars, waseliminated. Accordingly, in February 2013 we beganusing the official exchange rate to translate ourVenezuelan subsidiary’s financial statements to U.S.dollars. During 2013 we recognized a $15 millioncharge as a result of the devaluation of the officialVenezuelan exchange rate. At year-end 2013, ourVenezuela subsidiary’s Bolivar Fuerte-denominated netmonetary asset position, which would be subject toremeasurement in the event of a further devaluation,was approximately $63 million.
Interest rate riskOur company is exposed to interest rate volatility withregard to future issuances of fixed rate debt andexisting and future issuances of variable rate debt.Primary exposures include movements in U.S. Treasuryrates, London Interbank Offered Rates (LIBOR), andcommercial paper rates. We periodically use interestrate swaps and forward interest rate contracts toreduce interest rate volatility and funding costsassociated with certain debt issues, and to achieve adesired proportion of variable versus fixed rate debt,based on current and projected market conditions.
During 2013 and 2012, we entered into interest rateswaps in connection with certain U.S. Dollar Notes.Refer to disclosures contained in Note 6 within Notesto Consolidated Financial Statements. The totalnotional amount of interest rate swaps at year-end2013 was $2.4 billion, representing a settlementobligation of $59 million. The total notional amount ofinterest rate swaps at year-end 2012 was $2.2 billion,representing a settlement receivable of $64 million.Assuming average variable rate debt levels during theyear, a one percentage point increase in interest rateswould have increased interest expense byapproximately $35 million at year-end 2013 and $24million at year-end 2012.
Price riskOur company is exposed to price fluctuations primarilyas a result of anticipated purchases of raw andpackaging materials, fuel, and energy. Primaryexposures include corn, wheat, soybean oil, sugar,cocoa, cartonboard, natural gas, and diesel fuel. Wehave historically used the combination of long-termcontracts with suppliers, and exchange-traded futuresand option contracts to reduce price fluctuations in adesired percentage of forecasted raw materialpurchases over a duration of generally less than18 months. During 2006, we entered into twoseparate 10-year over-the-counter commodity swaptransactions to reduce fluctuations in the price of
natural gas used principally in our manufacturingprocesses. The notional amount of the swaps totaled$63 million as of December 28, 2013 and equates toapproximately 50% of our North Americamanufacturing needs over the remaining hedgeperiod. At year-end December 29, 2012 the notionalamount was $84 million.
The total notional amount of commodity derivativeinstruments at year-end 2013, including the NorthAmerica natural gas swaps, was $361 million,representing a settlement obligation of approximately$32 million. The total notional amount of commodityderivative instruments at year-end 2012, including thenatural gas swaps, was $320 million, representing asettlement obligation of approximately $36 million.Assuming a 10% decrease in year-end commodityprices, the settlement obligation would have increasedby approximately $18 million at year-end 2013, and$9 million at year-end 2012, generally offset by areduction in the cost of the underlying commoditypurchases.
In addition to the commodity derivative instrumentsdiscussed above, we use long-term contracts withsuppliers to manage a portion of the price exposureassociated with future purchases of certain rawmaterials, including rice, sugar, cartonboard, andcorrugated boxes. It should be noted the exclusion ofthese contracts from the analysis above could be alimitation in assessing the net market risk of ourcompany.
Reciprocal collateralization agreementsIn some instances we have reciprocal collateralizationagreements with counterparties regarding fair valuepositions in excess of certain thresholds. Theseagreements call for the posting of collateral in theform of cash, treasury securities or letters of credit if anet liability position to us or our counterpartiesexceeds a certain amount. As of December 28, 2013,we had posted collateral of $9 million in the form ofcash, which was reflected as an increase in accountsreceivable, net on the Consolidated Balance Sheet. Asof December 29, 2012, we had received $8 millioncash collateral from a counterparty, which wasreflected as a decrease in other assets on theConsolidated Balance Sheet.
32
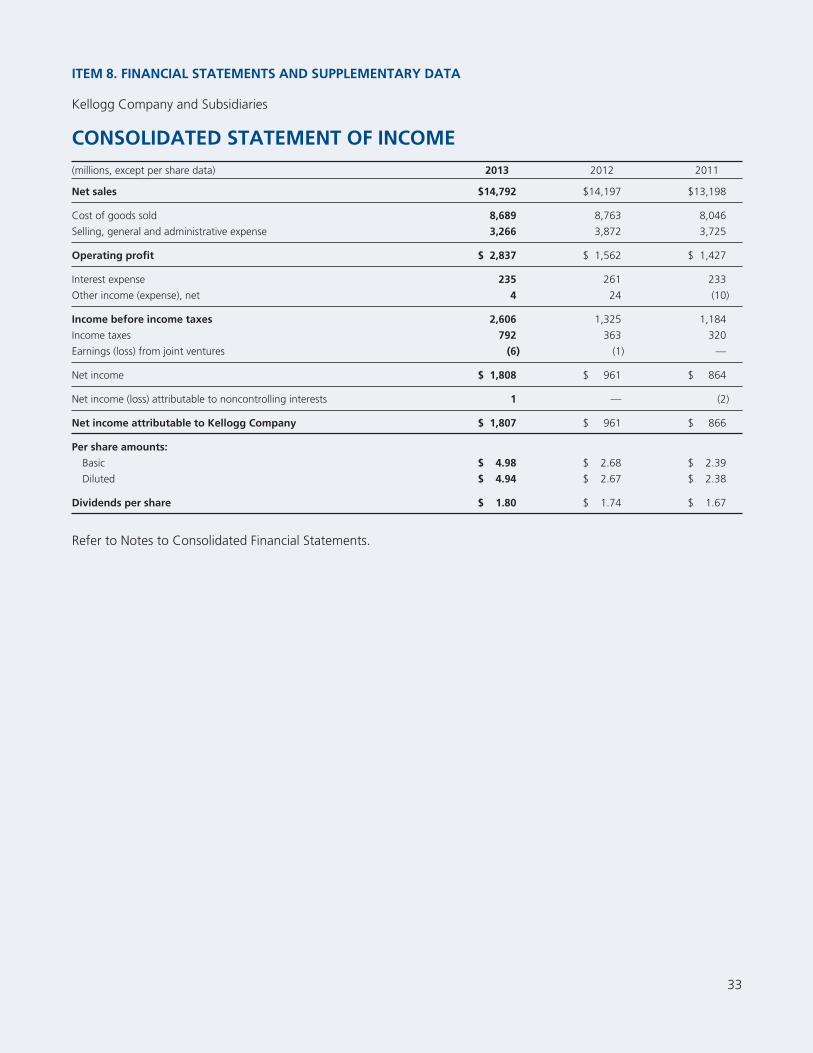
ITEM 8. FINANCIAL STATEMENTS AND SUPPLEMENTARY DATA
Kellogg Company and Subsidiaries
CONSOLIDATED STATEMENT OF INCOME(millions, except per share data) 2013 2012 2011
Net sales $14,792 $14,197 $13,198
Cost of goods sold 8,689 8,763 8,046
Selling, general and administrative expense 3,266 3,872 3,725
Operating profit $ 2,837 $ 1,562 $ 1,427
Interest expense 235 261 233
Other income (expense), net 4 24 (10)
Income before income taxes 2,606 1,325 1,184
Income taxes 792 363 320
Earnings (loss) from joint ventures (6) (1) —
Net income $ 1,808 $ 961 $ 864
Net income (loss) attributable to noncontrolling interests 1 — (2)
Net income attributable to Kellogg Company $ 1,807 $ 961 $ 866
Per share amounts:
Basic $ 4.98 $ 2.68 $ 2.39
Diluted $ 4.94 $ 2.67 $ 2.38
Dividends per share $ 1.80 $ 1.74 $ 1.67
Refer to Notes to Consolidated Financial Statements.
33
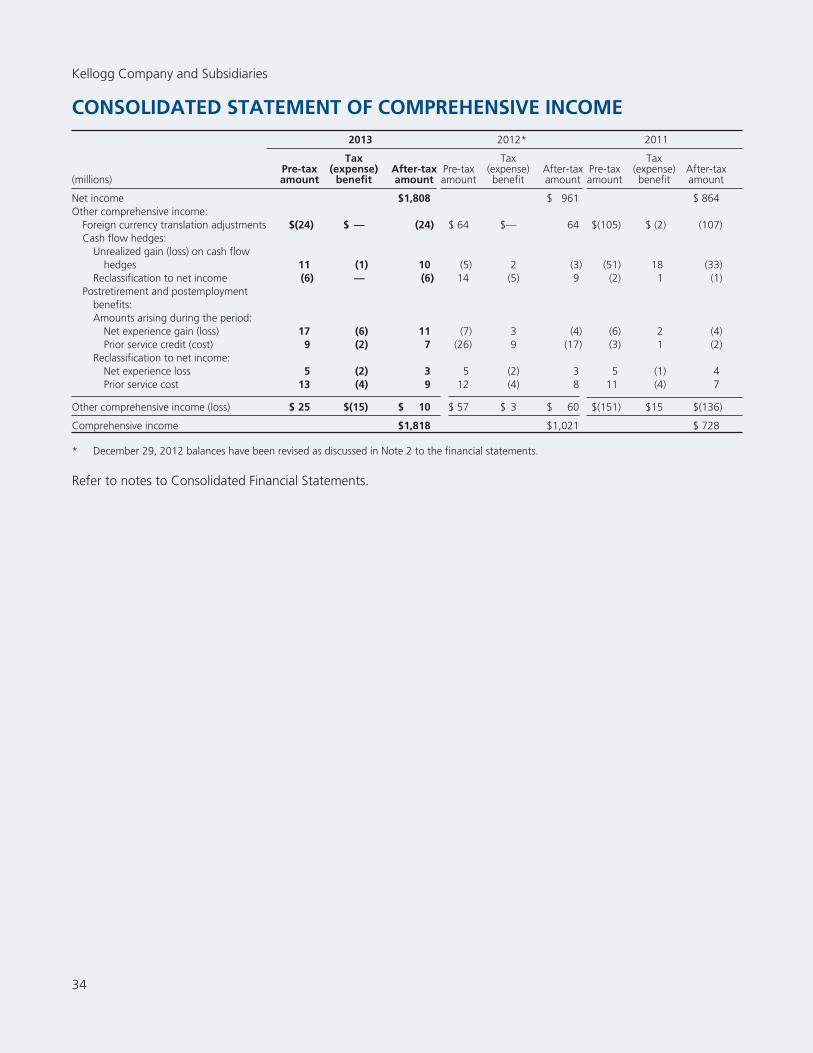
Kellogg Company and Subsidiaries
CONSOLIDATED STATEMENT OF COMPREHENSIVE INCOME2013 2012* 2011
(millions)Pre-taxamount
Tax(expense)
benefitAfter-taxamount
Pre-taxamount
Tax(expense)benefit
After-taxamount
Pre-taxamount
Tax(expense)benefit
After-taxamount
Net income $1,808 $ 961 $ 864Other comprehensive income:
Foreign currency translation adjustments $(24) $ — (24) $ 64 $— 64 $(105) $ (2) (107)Cash flow hedges:
Unrealized gain (loss) on cash flowhedges 11 (1) 10 (5) 2 (3) (51) 18 (33)
Reclassification to net income (6) — (6) 14 (5) 9 (2) 1 (1)Postretirement and postemployment
benefits:Amounts arising during the period:
Net experience gain (loss) 17 (6) 11 (7) 3 (4) (6) 2 (4)Prior service credit (cost) 9 (2) 7 (26) 9 (17) (3) 1 (2)
Reclassification to net income:Net experience loss 5 (2) 3 5 (2) 3 5 (1) 4Prior service cost 13 (4) 9 12 (4) 8 11 (4) 7
Other comprehensive income (loss) $ 25 $(15) $ 10 $ 57 $ 3 $ 60 $(151) $15 $(136)
Comprehensive income $1,818 $1,021 $ 728
* December 29, 2012 balances have been revised as discussed in Note 2 to the financial statements.
Refer to notes to Consolidated Financial Statements.
34
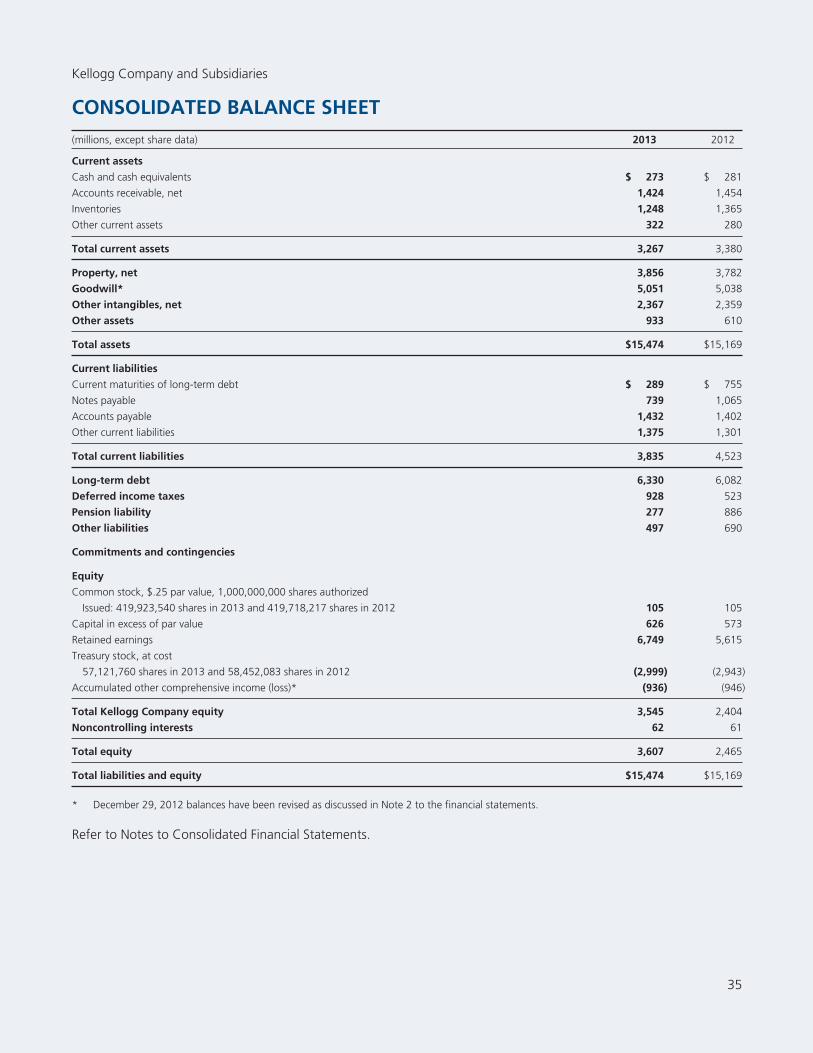
Kellogg Company and Subsidiaries
CONSOLIDATED BALANCE SHEET(millions, except share data) 2013 2012
Current assets
Cash and cash equivalents $ 273 $ 281
Accounts receivable, net 1,424 1,454
Inventories 1,248 1,365
Other current assets 322 280
Total current assets 3,267 3,380
Property, net 3,856 3,782
Goodwill* 5,051 5,038
Other intangibles, net 2,367 2,359
Other assets 933 610
Total assets $15,474 $15,169
Current liabilities
Current maturities of long-term debt $ 289 $ 755
Notes payable 739 1,065
Accounts payable 1,432 1,402
Other current liabilities 1,375 1,301
Total current liabilities 3,835 4,523
Long-term debt 6,330 6,082
Deferred income taxes 928 523
Pension liability 277 886
Other liabilities 497 690
Commitments and contingencies
Equity
Common stock, $.25 par value, 1,000,000,000 shares authorized
Issued: 419,923,540 shares in 2013 and 419,718,217 shares in 2012 105 105
Capital in excess of par value 626 573
Retained earnings 6,749 5,615
Treasury stock, at cost
57,121,760 shares in 2013 and 58,452,083 shares in 2012 (2,999) (2,943)
Accumulated other comprehensive income (loss)* (936) (946)
Total Kellogg Company equity 3,545 2,404
Noncontrolling interests 62 61
Total equity 3,607 2,465
Total liabilities and equity $15,474 $15,169
* December 29, 2012 balances have been revised as discussed in Note 2 to the financial statements.
Refer to Notes to Consolidated Financial Statements.
35
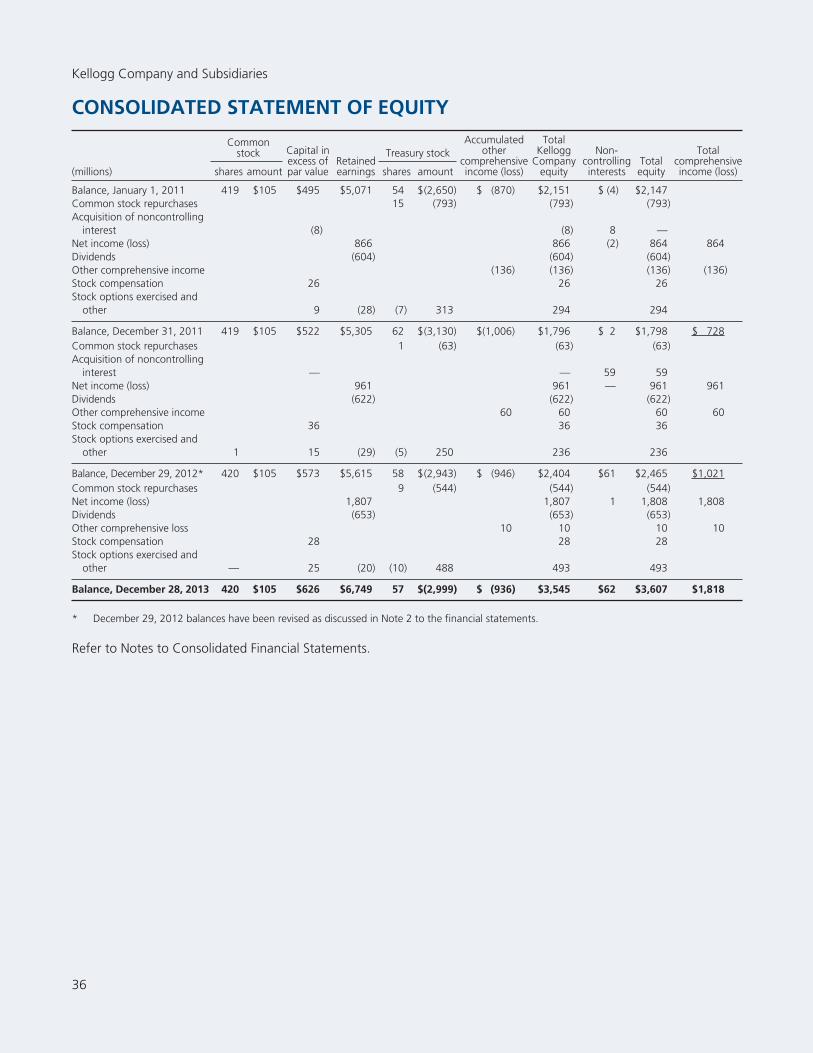
Kellogg Company and Subsidiaries
CONSOLIDATED STATEMENT OF EQUITY
(millions)
Commonstock Capital in
excess ofpar value
Retainedearnings
Treasury stockAccumulated
othercomprehensiveincome (loss)
TotalKellogg
Companyequity
Non-controllinginterests
Totalequity
Totalcomprehensiveincome (loss)shares amount shares amount
Balance, January 1, 2011 419 $105 $495 $5,071 54 $(2,650) $ (870) $2,151 $ (4) $2,147Common stock repurchases 15 (793) (793) (793)Acquisition of noncontrolling
interest (8) (8) 8 —Net income (loss) 866 866 (2) 864 864Dividends (604) (604) (604)Other comprehensive income (136) (136) (136) (136)Stock compensation 26 26 26Stock options exercised and
other 9 (28) (7) 313 294 294
Balance, December 31, 2011 419 $105 $522 $5,305 62 $(3,130) $(1,006) $1,796 $ 2 $1,798 $ 728Common stock repurchases 1 (63) (63) (63)Acquisition of noncontrolling
interest — — 59 59Net income (loss) 961 961 — 961 961Dividends (622) (622) (622)Other comprehensive income 60 60 60 60Stock compensation 36 36 36Stock options exercised and
other 1 15 (29) (5) 250 236 236
Balance, December 29, 2012* 420 $105 $573 $5,615 58 $(2,943) $ (946) $2,404 $61 $2,465 $1,021Common stock repurchases 9 (544) (544) (544)Net income (loss) 1,807 1,807 1 1,808 1,808Dividends (653) (653) (653)Other comprehensive loss 10 10 10 10Stock compensation 28 28 28Stock options exercised and
other — 25 (20) (10) 488 493 493
Balance, December 28, 2013 420 $105 $626 $6,749 57 $(2,999) $ (936) $3,545 $62 $3,607 $1,818
* December 29, 2012 balances have been revised as discussed in Note 2 to the financial statements.
Refer to Notes to Consolidated Financial Statements.
36
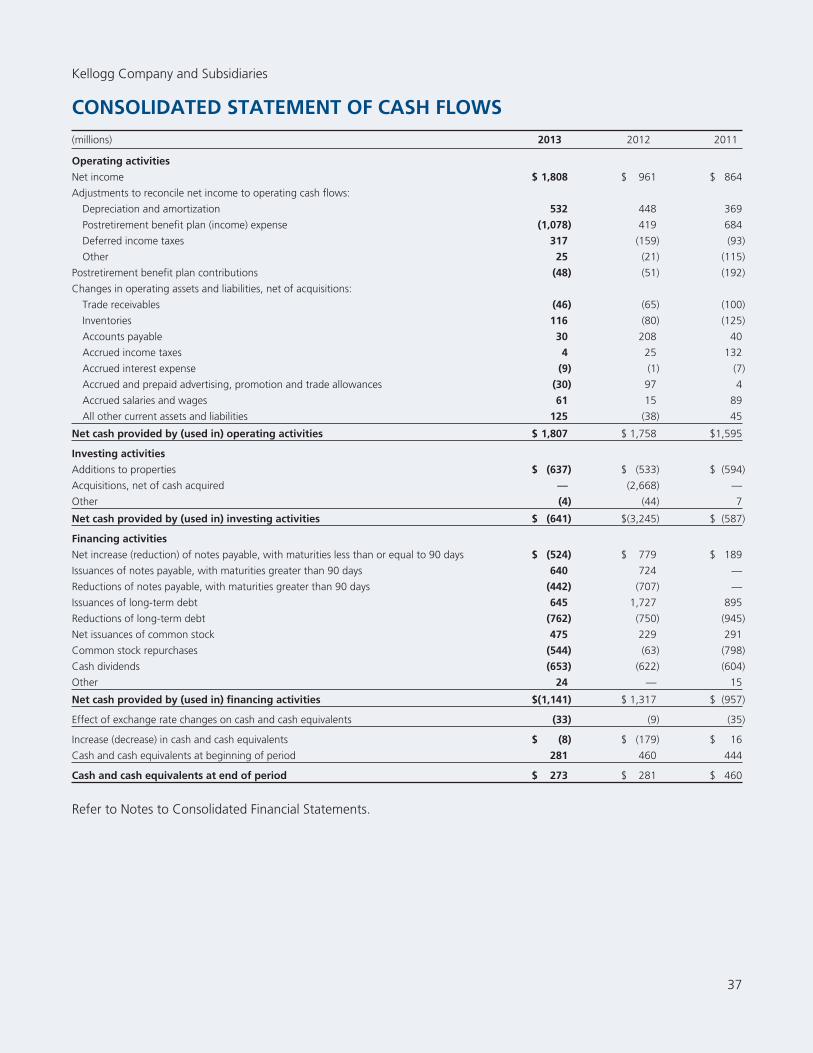
Kellogg Company and Subsidiaries
CONSOLIDATED STATEMENT OF CASH FLOWS(millions) 2013 2012 2011
Operating activities
Net income $ 1,808 $ 961 $ 864
Adjustments to reconcile net income to operating cash flows:
Depreciation and amortization 532 448 369
Postretirement benefit plan (income) expense (1,078) 419 684
Deferred income taxes 317 (159) (93)
Other 25 (21) (115)
Postretirement benefit plan contributions (48) (51) (192)
Changes in operating assets and liabilities, net of acquisitions:
Trade receivables (46) (65) (100)
Inventories 116 (80) (125)
Accounts payable 30 208 40
Accrued income taxes 4 25 132
Accrued interest expense (9) (1) (7)
Accrued and prepaid advertising, promotion and trade allowances (30) 97 4
Accrued salaries and wages 61 15 89
All other current assets and liabilities 125 (38) 45
Net cash provided by (used in) operating activities $ 1,807 $ 1,758 $1,595
Investing activities
Additions to properties $ (637) $ (533) $ (594)
Acquisitions, net of cash acquired — (2,668) —
Other (4) (44) 7
Net cash provided by (used in) investing activities $ (641) $(3,245) $ (587)
Financing activities
Net increase (reduction) of notes payable, with maturities less than or equal to 90 days $ (524) $ 779 $ 189
Issuances of notes payable, with maturities greater than 90 days 640 724 —
Reductions of notes payable, with maturities greater than 90 days (442) (707) —
Issuances of long-term debt 645 1,727 895
Reductions of long-term debt (762) (750) (945)
Net issuances of common stock 475 229 291
Common stock repurchases (544) (63) (798)
Cash dividends (653) (622) (604)
Other 24 — 15
Net cash provided by (used in) financing activities $(1,141) $ 1,317 $ (957)
Effect of exchange rate changes on cash and cash equivalents (33) (9) (35)
Increase (decrease) in cash and cash equivalents $ (8) $ (179) $ 16
Cash and cash equivalents at beginning of period 281 460 444
Cash and cash equivalents at end of period $ 273 $ 281 $ 460
Refer to Notes to Consolidated Financial Statements.
37
Kellogg Company and Subsidiaries
Notes to Consolidated Financial Statements
NOTE 1ACCOUNTING POLICIES
Basis of presentationThe consolidated financial statements include theaccounts of the Kellogg Company, those of thesubsidiaries that it controls due to ownership of amajority voting interest and the accounts of the variableinterest entities (VIEs) of which Kellogg Company is theprimary beneficiary (Kellogg or the Company). TheCompany continually evaluates its involvement withVIEs to determine whether it has variable interests andis the primary beneficiary of the VIE. When these criteriaare met, the Company is required to consolidate theVIE. The Company’s share of earnings or losses ofnonconsolidated affiliates is included in its consolidatedoperating results using the equity method ofaccounting when it is able to exercise significantinfluence over the operating and financial decisions ofthe affiliate. The Company uses the cost method ofaccounting if it is not able to exercise significantinfluence over the operating and financial decisions ofthe affiliate. Intercompany balances and transactionsare eliminated.
The Company’s fiscal year normally ends on theSaturday closest to December 31 and as a result, a53rd week is added approximately every sixth year. TheCompany’s 2013, 2012 and 2011 fiscal years eachcontained 52 weeks and ended on December 28,2013, December 29, 2012 and December 31, 2011,respectively. The next fiscal year which will contain a53rd week for the Company will be 2014, ending onJanuary 3, 2015.
Use of estimatesThe preparation of financial statements in conformitywith accounting principles generally accepted in theUnited States of America requires management tomake estimates and assumptions that affect thereported amounts of assets and liabilities, the disclosureof contingent liabilities at the date of the financialstatements and the reported amounts of revenues andexpenses during the periods reported. Actual resultscould differ from those estimates.
Cash and cash equivalentsHighly liquid investments with remaining statedmaturities of three months or less when purchased areconsidered cash equivalents and recorded at cost.
Accounts receivableAccounts receivable consists principally of tradereceivables, which are recorded at the invoiced amount,net of allowances for doubtful accounts and promptpayment discounts. Trade receivables do not bear
interest. The allowance for doubtful accountsrepresents management’s estimate of the amount ofprobable credit losses in existing accounts receivable, asdetermined from a review of past due balances andother specific account data. Account balances arewritten off against the allowance when managementdetermines the receivable is uncollectible. The Companydoes not have off-balance sheet credit exposure relatedto its customers.
InventoriesInventories are valued at the lower of cost or market.Cost is determined on an average cost basis.
PropertyThe Company’s property consists mainly of plants andequipment used for manufacturing activities. Theseassets are recorded at cost and depreciated overestimated useful lives using straight-line methods forfinancial reporting and accelerated methods, wherepermitted, for tax reporting. Major property categoriesare depreciated over various periods as follows (inyears): manufacturing machinery and equipment 5-30;office equipment 4-5; computer equipment andcapitalized software 3-7; building components 15-25;building structures 50. Cost includes interest associatedwith significant capital projects. Plant and equipmentare reviewed for impairment when conditions indicatethat the carrying value may not be recoverable. Suchconditions include an extended period of idleness or aplan of disposal. Assets to be disposed of at a futuredate are depreciated over the remaining period of use.Assets to be sold are written down to realizable value atthe time the assets are being actively marketed for saleand a sale is expected to occur within one year. As ofyear-end 2013 and 2012, the carrying value of assetsheld for sale was insignificant.
Goodwill and other intangible assetsGoodwill and indefinite-lived intangibles are notamortized, but are tested at least annually for impairmentof value and whenever events or changes in circumstancesindicate the carrying amount of the asset may beimpaired. An intangible asset with a finite life is amortizedon a straight-line basis over the estimated useful life.
For the goodwill impairment test, the fair value of thereporting units are estimated based on marketmultiples. This approach employs market multiplesbased on earnings before interest, taxes, depreciationand amortization, earnings for companies that arecomparable to the Company’s reporting units anddiscounted cash flow. The assumptions used for theimpairment test are consistent with those utilized by amarket participant performing similar valuations for theCompany’s reporting units.
38
Similarly, impairment testing of other intangible assetsrequires a comparison of carrying value to fair value ofthat particular asset. Fair values of non-goodwillintangible assets are based primarily on projections offuture cash flows to be generated from that asset. Forinstance, cash flows related to a particular trademarkwould be based on a projected royalty streamattributable to branded product sales, discounted atrates consistent with rates used by marketparticipants.
These estimates are made using various inputsincluding historical data, current and anticipatedmarket conditions, management plans, and marketcomparables.
Revenue recognitionThe Company recognizes sales upon delivery of itsproducts to customers. Revenue, which includesshipping and handling charges billed to the customer,is reported net of applicable provisions for discounts,returns, allowances, and various governmentwithholding taxes. Methodologies for determiningthese provisions are dependent on local customerpricing and promotional practices, which range fromcontractually fixed percentage price reductions toreimbursement based on actual occurrence orperformance. Where applicable, futurereimbursements are estimated based on acombination of historical patterns and futureexpectations regarding specific in-market productperformance.
Advertising and promotionThe Company expenses production costs ofadvertising the first time the advertising takes place.Advertising expense is classified in selling, general andadministrative (SGA) expense.
The Company classifies promotional payments to itscustomers, the cost of consumer coupons, and othercash redemption offers in net sales. The cost ofpromotional package inserts is recorded in cost ofgoods sold (COGS). Other types of consumerpromotional expenditures are recorded in SGAexpense.
Research and developmentThe costs of research and development (R&D) areexpensed as incurred and are classified in SGAexpense. R&D includes expenditures for new productand process innovation, as well as significanttechnological improvements to existing products andprocesses. The Company’s R&D expenditures primarilyconsist of internal salaries, wages, consulting, andsupplies attributable to time spent on R&D activities.Other costs include depreciation and maintenance ofresearch facilities and equipment, including assets atmanufacturing locations that are temporarily engagedin pilot plant activities.
Stock-based compensationThe Company uses stock-based compensation,including stock options, restricted stock, restrictedstock units, and executive performance shares, toprovide long-term performance incentives for itsglobal workforce.
The Company classifies pre-tax stock compensationexpense principally in SGA expense within itscorporate operations. Expense attributable to awardsof equity instruments is recorded in capital in excess ofpar value in the Consolidated Balance Sheet.
Certain of the Company’s stock-based compensationplans contain provisions that accelerate vesting ofawards upon retirement, disability, or death of eligibleemployees and directors. A stock-based award isconsidered vested for expense attribution purposeswhen the employee’s retention of the award is nolonger contingent on providing subsequent service.Accordingly, the Company recognizes compensationcost immediately for awards granted to retirement-eligible individuals or over the period from the grantdate to the date retirement eligibility is achieved, ifless than the stated vesting period.
The Company recognizes compensation cost for stockoption awards that have a graded vesting schedule ona straight-line basis over the requisite service periodfor the entire award.
Corporate income tax benefits realized upon exerciseor vesting of an award in excess of that previouslyrecognized in earnings (“windfall tax benefit”) isrecorded in other financing activities in theConsolidated Statement of Cash Flows. Realizedwindfall tax benefits are credited to capital in excess ofpar value in the Consolidated Balance Sheet. Realizedshortfall tax benefits (amounts which are less thanthat previously recognized in earnings) are first offsetagainst the cumulative balance of windfall taxbenefits, if any, and then charged directly to incometax expense. The Company currently has sufficientcumulative windfall tax benefits to absorb arisingshortfalls, such that earnings were not affected duringthe periods presented. Correspondingly, the Companyincludes the impact of pro forma deferred tax assets(i.e., the “as if” windfall or shortfall) for purposes ofdetermining assumed proceeds in the treasury stockcalculation of diluted earnings per share.
Income taxesThe Company recognizes uncertain tax positions basedon a benefit recognition model. Provided that the taxposition is deemed more likely than not of beingsustained, the Company recognizes the largestamount of tax benefit that is greater than 50 percentlikely of being ultimately realized upon settlement. Thetax position is derecognized when it is no longer morelikely than not of being sustained. The Companyclassifies income tax-related interest and penalties as
39
interest expense and SGA expense, respectively, onthe Consolidated Statement of Income. The currentportion of the Company’s unrecognized tax benefits ispresented in the Consolidated Balance Sheet in othercurrent assets and other current liabilities, and theamounts expected to be settled after one year arerecorded in other assets and other liabilities.
Income taxes are provided on the portion of foreignearnings that is expected to be remitted to andtaxable in the United States.
Derivative InstrumentsThe fair value of derivative instruments is recorded inother current assets, other assets, other currentliabilities or other liabilities. Gains and lossesrepresenting either hedge ineffectiveness, hedgecomponents excluded from the assessment ofeffectiveness, or hedges of translational exposure arerecorded in the Consolidated Statement of Income inother income (expense), net (OIE). In the ConsolidatedStatement of Cash Flows, settlements of cash flowand fair value hedges are classified as an operatingactivity; settlements of all other derivative instruments,including instruments for which hedge accounting hasbeen discontinued, are classified consistent with thenature of the instrument.
Cash flow hedges. Qualifying derivatives areaccounted for as cash flow hedges when the hedgeditem is a forecasted transaction. Gains and losses onthese instruments are recorded in othercomprehensive income until the underlying transactionis recorded in earnings. When the hedged item isrealized, gains or losses are reclassified fromaccumulated other comprehensive income (loss)(AOCI) to the Consolidated Statement of Income onthe same line item as the underlying transaction.
Fair value hedges. Qualifying derivatives areaccounted for as fair value hedges when the hedgeditem is a recognized asset, liability, or firmcommitment. Gains and losses on these instrumentsare recorded in earnings, offsetting gains and losseson the hedged item.
Net investment hedges. Qualifying derivative andnonderivative financial instruments are accounted foras net investment hedges when the hedged item is anonfunctional currency investment in a subsidiary.Gains and losses on these instruments are included inforeign currency translation adjustments in AOCI.
Derivatives not designated for hedge accounting. Gainsand losses on these instruments are recorded in theConsolidated Statement of Income, on the same lineitem as the underlying hedged item.
Other contracts. The Company periodically enters intoforeign currency forward contracts and options to
reduce volatility in the translation of foreign currencyearnings to U.S. dollars. Gains and losses on theseinstruments are recorded in OIE, generally reducingthe exposure to translation volatility during a full-yearperiod.
Foreign currency exchange risk. The Company isexposed to fluctuations in foreign currency cash flowsrelated primarily to third-party purchases,intercompany transactions and when applicable,nonfunctional currency denominated third-party debt.The Company is also exposed to fluctuations in thevalue of foreign currency investments in subsidiariesand cash flows related to repatriation of theseinvestments. Additionally, the Company is exposed tovolatility in the translation of foreign currencydenominated earnings to U.S. dollars. Managementassesses foreign currency risk based on transactionalcash flows and translational volatility and may enterinto forward contracts, options, and currency swaps toreduce fluctuations in long or short currency positions.Forward contracts and options are generally less than18 months duration. Currency swap agreements areestablished in conjunction with the term of underlyingdebt issues.
For foreign currency cash flow and fair value hedges,the assessment of effectiveness is generally based onchanges in spot rates. Changes in time value arereported in OIE.
Interest rate risk. The Company is exposed to interestrate volatility with regard to future issuances of fixedrate debt and existing and future issuances of variablerate debt. The Company periodically uses interest rateswaps, including forward-starting swaps, to reduceinterest rate volatility and funding costs associatedwith certain debt issues, and to achieve a desiredproportion of variable versus fixed rate debt, based oncurrent and projected market conditions.
Fixed-to-variable interest rate swaps are accounted foras fair value hedges and the assessment ofeffectiveness is based on changes in the fair value ofthe underlying debt, using incremental borrowingrates currently available on loans with similar termsand maturities.
Price risk. The Company is exposed to pricefluctuations primarily as a result of anticipatedpurchases of raw and packaging materials, fuel, andenergy. The Company has historically used thecombination of long-term contracts with suppliers,and exchange-traded futures and option contracts toreduce price fluctuations in a desired percentage offorecasted raw material purchases over a duration ofgenerally less than 18 months.
Certain commodity contracts are accounted for ascash flow hedges, while others are marked to marketthrough earnings. The assessment of effectiveness for
40
exchange-traded instruments is based on changes infutures prices. The assessment of effectiveness forover-the-counter transactions is based on changes indesignated indices.
Pension benefits, nonpension postretirement andpostemployment benefitsThe Company sponsors a number of U.S. and foreignplans to provide pension, health care, and otherwelfare benefits to retired employees, as well as salarycontinuance, severance, and long-term disability toformer or inactive employees.
The recognition of benefit expense is based onactuarial assumptions, such as discount rate, long-term rate of compensation increase, long-term rate ofreturn on plan assets and health care cost trend rate,and is reported in COGS and SGA expense on theConsolidated Statement of Income.
Postemployment benefits. The Company recognizesan obligation for postemployment benefit plans thatvest or accumulate with service. Obligations associatedwith the Company’s postemployment benefit plans,which are unfunded, are included in other currentliabilities and other liabilities on the ConsolidatedBalance Sheet. All gains and losses are recognized overthe average remaining service period of active planparticipants.
Postemployment benefits that do not vest oraccumulate with service or benefits to employees inexcess of those specified in the respective plans areexpensed as incurred.
Pension and nonpension postretirement benefits. TheCompany recognizes actuarial gains and losses inoperating results in the year in which they occur.Experience gains and losses are recognized annually asof the measurement date, which is the Company’sfiscal year-end, or when remeasurement is otherwiserequired under generally accepted accountingprinciples. The Company uses the fair value of planassets to calculate the expected return on plan assets.
Reportable segments are allocated service cost andamortization of prior service cost. All othercomponents of pension and postretirement benefitexpense, including interest cost, expected return onassets, and experience gains and losses are consideredunallocated corporate costs and are not included inthe measure of reportable segment operating results.See Note 16 for more information on reportablesegments.
Management reviews the Company’s expected long-term rates of return annually; however, the benefittrust investment performance for one particular yeardoes not, by itself, significantly influence thisevaluation. The expected rates of return are generally
not revised provided these rates fall between the25th and 75th percentile of expected long-termreturns, as determined by the Company’s modelingprocess.
For defined benefit pension and postretirement plans,the Company records the net overfunded orunderfunded position as a pension asset or pensionliability on the Consolidated Balance Sheet.
New accounting standardsReporting of amounts reclassified out of AccumulatedOther Comprehensive Income. In February 2013, theFinancial Accounting Standards Board (FASB) issued anupdated accounting standard requiring entities topresent information about reclassifications out ofaccumulated other comprehensive income in a singlenote or on the face of the financial statements. TheCompany adopted the updated standard in 2013.
Indefinite-lived intangible asset impairment testing. InJuly 2012, the FASB issued an updated accountingstandard to allow entities the option to first assessqualitative factors to determine whether it is necessaryto perform the quantitative indefinite-lived intangibleasset impairment test. Under the updated standard anentity would not be required to perform thequantitative impairment test unless the entitydetermines, based on a qualitative assessment, that itis more likely than not that an indefinite-livedintangible asset is impaired. The Company adoptedthe revised guidance in 2013, with no impact to theConsolidated Financial Statements.
Presentation of Comprehensive Income. In June 2011,the Financial Accounting Standards Board (FASB)issued a new accounting standard requiring mostentities to present items of net income and othercomprehensive income either in one continuousstatement — referred to as the statement ofcomprehensive income — or in two separate, butconsecutive, statements of net income andcomprehensive income. The update does not changethe items that must be reported in othercomprehensive income or when an item of othercomprehensive income must be reclassified to netincome. The Company adopted this new standard in2012.
Goodwill impairment testing. In September 2011, theFASB issued an updated accounting standard to allowentities the option to first assess qualitative factors todetermine whether it is necessary to perform the two-step quantitative goodwill impairment test. Under theupdated standard an entity would not be required tocalculate the fair value of a reporting unit unless theentity determines, based on a qualitative assessment,that it is more likely than not that its fair value is lessthan its carrying amount. The Company adopted therevised guidance in 2012, with no impact to theConsolidated Financial Statements.
41
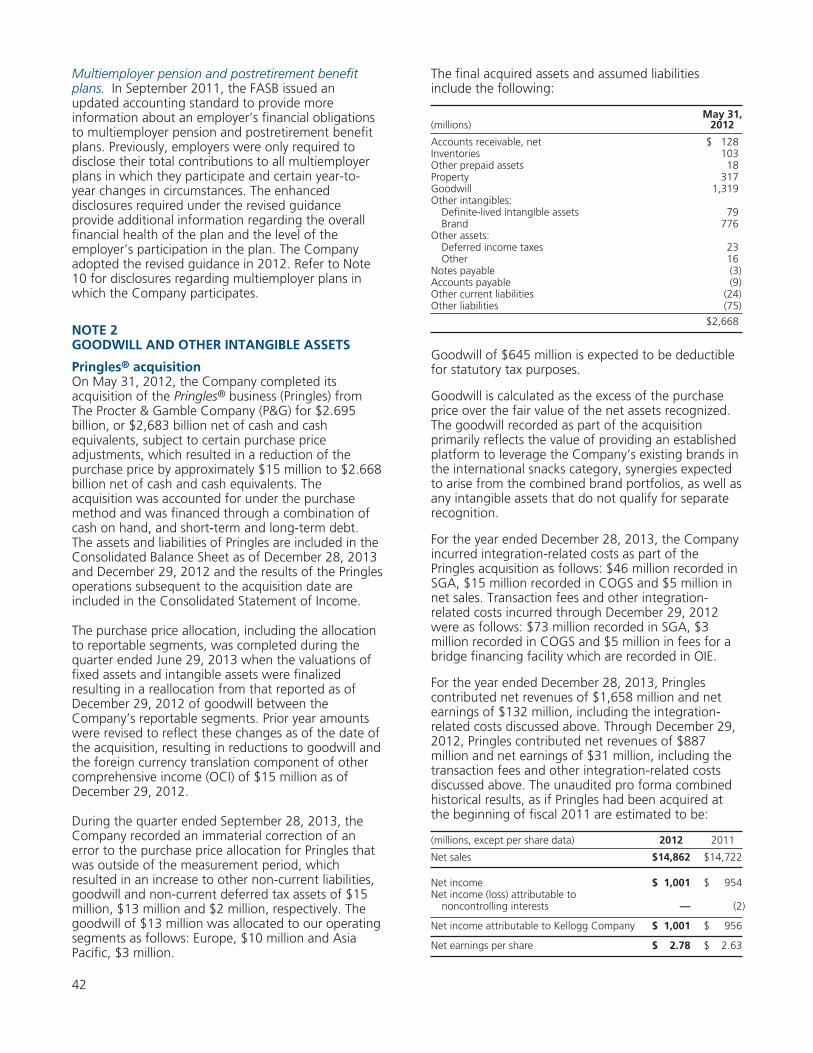
Multiemployer pension and postretirement benefitplans. In September 2011, the FASB issued anupdated accounting standard to provide moreinformation about an employer’s financial obligationsto multiemployer pension and postretirement benefitplans. Previously, employers were only required todisclose their total contributions to all multiemployerplans in which they participate and certain year-to-year changes in circumstances. The enhanceddisclosures required under the revised guidanceprovide additional information regarding the overallfinancial health of the plan and the level of theemployer’s participation in the plan. The Companyadopted the revised guidance in 2012. Refer to Note10 for disclosures regarding multiemployer plans inwhich the Company participates.
NOTE 2GOODWILL AND OTHER INTANGIBLE ASSETS
Pringles® acquisitionOn May 31, 2012, the Company completed itsacquisition of the Pringles® business (Pringles) fromThe Procter & Gamble Company (P&G) for $2.695billion, or $2,683 billion net of cash and cashequivalents, subject to certain purchase priceadjustments, which resulted in a reduction of thepurchase price by approximately $15 million to $2.668billion net of cash and cash equivalents. Theacquisition was accounted for under the purchasemethod and was financed through a combination ofcash on hand, and short-term and long-term debt.The assets and liabilities of Pringles are included in theConsolidated Balance Sheet as of December 28, 2013and December 29, 2012 and the results of the Pringlesoperations subsequent to the acquisition date areincluded in the Consolidated Statement of Income.
The purchase price allocation, including the allocationto reportable segments, was completed during thequarter ended June 29, 2013 when the valuations offixed assets and intangible assets were finalizedresulting in a reallocation from that reported as ofDecember 29, 2012 of goodwill between theCompany’s reportable segments. Prior year amountswere revised to reflect these changes as of the date ofthe acquisition, resulting in reductions to goodwill andthe foreign currency translation component of othercomprehensive income (OCI) of $15 million as ofDecember 29, 2012.
During the quarter ended September 28, 2013, theCompany recorded an immaterial correction of anerror to the purchase price allocation for Pringles thatwas outside of the measurement period, whichresulted in an increase to other non-current liabilities,goodwill and non-current deferred tax assets of $15million, $13 million and $2 million, respectively. Thegoodwill of $13 million was allocated to our operatingsegments as follows: Europe, $10 million and AsiaPacific, $3 million.
The final acquired assets and assumed liabilitiesinclude the following:
(millions)May 31,
2012
Accounts receivable, net $ 128Inventories 103Other prepaid assets 18Property 317Goodwill 1,319Other intangibles:
Definite-lived intangible assets 79Brand 776
Other assets:Deferred income taxes 23Other 16
Notes payable (3)Accounts payable (9)Other current liabilities (24)Other liabilities (75)
$2,668
Goodwill of $645 million is expected to be deductiblefor statutory tax purposes.
Goodwill is calculated as the excess of the purchaseprice over the fair value of the net assets recognized.The goodwill recorded as part of the acquisitionprimarily reflects the value of providing an establishedplatform to leverage the Company’s existing brands inthe international snacks category, synergies expectedto arise from the combined brand portfolios, as well asany intangible assets that do not qualify for separaterecognition.
For the year ended December 28, 2013, the Companyincurred integration-related costs as part of thePringles acquisition as follows: $46 million recorded inSGA, $15 million recorded in COGS and $5 million innet sales. Transaction fees and other integration-related costs incurred through December 29, 2012were as follows: $73 million recorded in SGA, $3million recorded in COGS and $5 million in fees for abridge financing facility which are recorded in OIE.
For the year ended December 28, 2013, Pringlescontributed net revenues of $1,658 million and netearnings of $132 million, including the integration-related costs discussed above. Through December 29,2012, Pringles contributed net revenues of $887million and net earnings of $31 million, including thetransaction fees and other integration-related costsdiscussed above. The unaudited pro forma combinedhistorical results, as if Pringles had been acquired atthe beginning of fiscal 2011 are estimated to be:
(millions, except per share data) 2012 2011
Net sales $14,862 $14,722
Net income $ 1,001 $ 954Net income (loss) attributable to
noncontrolling interests — (2)
Net income attributable to Kellogg Company $ 1,001 $ 956
Net earnings per share $ 2.78 $ 2.63
42
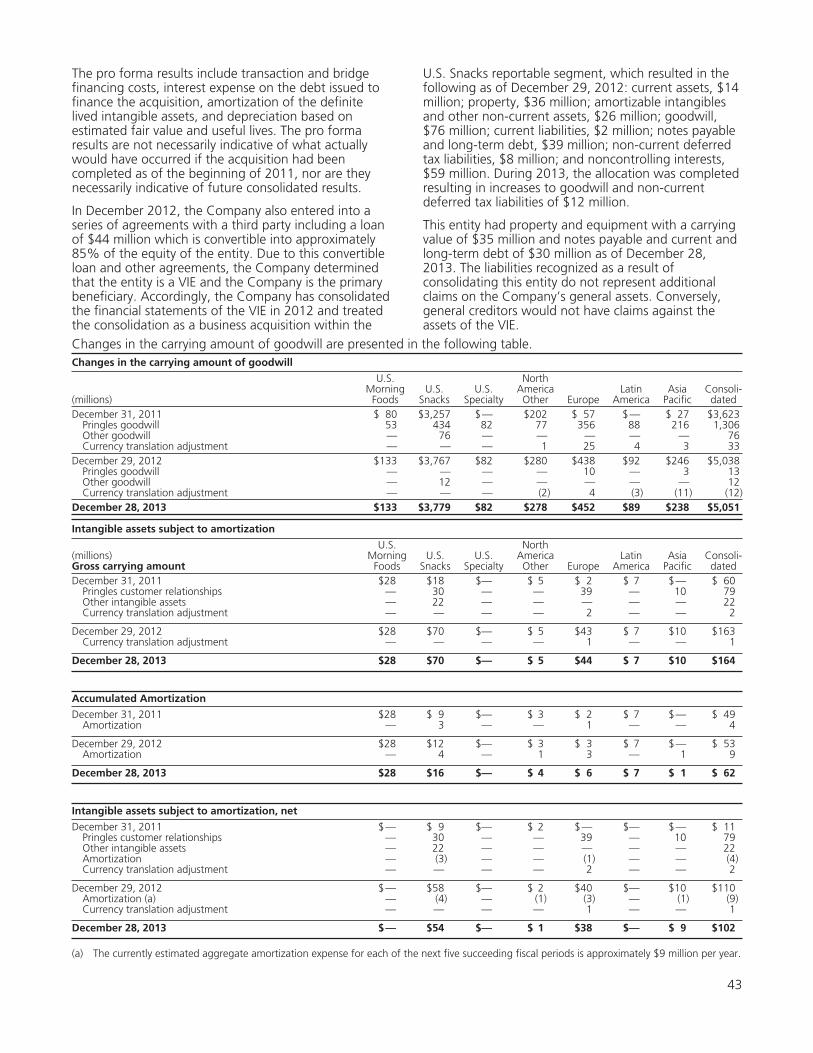
The pro forma results include transaction and bridgefinancing costs, interest expense on the debt issued tofinance the acquisition, amortization of the definitelived intangible assets, and depreciation based onestimated fair value and useful lives. The pro formaresults are not necessarily indicative of what actuallywould have occurred if the acquisition had beencompleted as of the beginning of 2011, nor are theynecessarily indicative of future consolidated results.
In December 2012, the Company also entered into aseries of agreements with a third party including a loanof $44 million which is convertible into approximately85% of the equity of the entity. Due to this convertibleloan and other agreements, the Company determinedthat the entity is a VIE and the Company is the primarybeneficiary. Accordingly, the Company has consolidatedthe financial statements of the VIE in 2012 and treatedthe consolidation as a business acquisition within the
U.S. Snacks reportable segment, which resulted in thefollowing as of December 29, 2012: current assets, $14million; property, $36 million; amortizable intangiblesand other non-current assets, $26 million; goodwill,$76 million; current liabilities, $2 million; notes payableand long-term debt, $39 million; non-current deferredtax liabilities, $8 million; and noncontrolling interests,$59 million. During 2013, the allocation was completedresulting in increases to goodwill and non-currentdeferred tax liabilities of $12 million.
This entity had property and equipment with a carryingvalue of $35 million and notes payable and current andlong-term debt of $30 million as of December 28,2013. The liabilities recognized as a result ofconsolidating this entity do not represent additionalclaims on the Company’s general assets. Conversely,general creditors would not have claims against theassets of the VIE.
Changes in the carrying amount of goodwill are presented in the following table.Changes in the carrying amount of goodwill
(millions)
U.S.Morning
FoodsU.S.
SnacksU.S.
Specialty
NorthAmericaOther Europe
LatinAmerica
AsiaPacific
Consoli-dated
December 31, 2011 $ 80 $3,257 $— $202 $ 57 $— $ 27 $3,623Pringles goodwill 53 434 82 77 356 88 216 1,306Other goodwill — 76 — — — — — 76Currency translation adjustment — — — 1 25 4 3 33
December 29, 2012 $133 $3,767 $82 $280 $438 $92 $246 $5,038Pringles goodwill — — — — 10 — 3 13Other goodwill — 12 — — — — — 12Currency translation adjustment — — — (2) 4 (3) (11) (12)
December 28, 2013 $133 $3,779 $82 $278 $452 $89 $238 $5,051
Intangible assets subject to amortization
(millions)Gross carrying amount
U.S.Morning
FoodsU.S.
SnacksU.S.
Specialty
NorthAmericaOther Europe
LatinAmerica
AsiaPacific
Consoli-dated
December 31, 2011 $28 $18 $— $ 5 $ 2 $ 7 $— $ 60Pringles customer relationships — 30 — — 39 — 10 79Other intangible assets — 22 — — — — — 22Currency translation adjustment — — — — 2 — — 2
December 29, 2012 $28 $70 $— $ 5 $43 $ 7 $10 $163Currency translation adjustment — — — — 1 — — 1
December 28, 2013 $28 $70 $— $ 5 $44 $ 7 $10 $164
Accumulated Amortization
December 31, 2011 $28 $ 9 $— $ 3 $ 2 $ 7 $— $ 49Amortization — 3 — — 1 — — 4
December 29, 2012 $28 $12 $— $ 3 $ 3 $ 7 $— $ 53Amortization — 4 — 1 3 — 1 9
December 28, 2013 $28 $16 $— $ 4 $ 6 $ 7 $ 1 $ 62
Intangible assets subject to amortization, net
December 31, 2011 $— $ 9 $— $ 2 $— $— $— $ 11Pringles customer relationships — 30 — — 39 — 10 79Other intangible assets — 22 — — — — — 22Amortization — (3) — — (1) — — (4)Currency translation adjustment — — — — 2 — — 2
December 29, 2012 $— $58 $— $ 2 $40 $— $10 $110Amortization (a) — (4) — (1) (3) — (1) (9)Currency translation adjustment — — — — 1 — — 1
December 28, 2013 $— $54 $— $ 1 $38 $— $ 9 $102
(a) The currently estimated aggregate amortization expense for each of the next five succeeding fiscal periods is approximately $9 million per year.
43
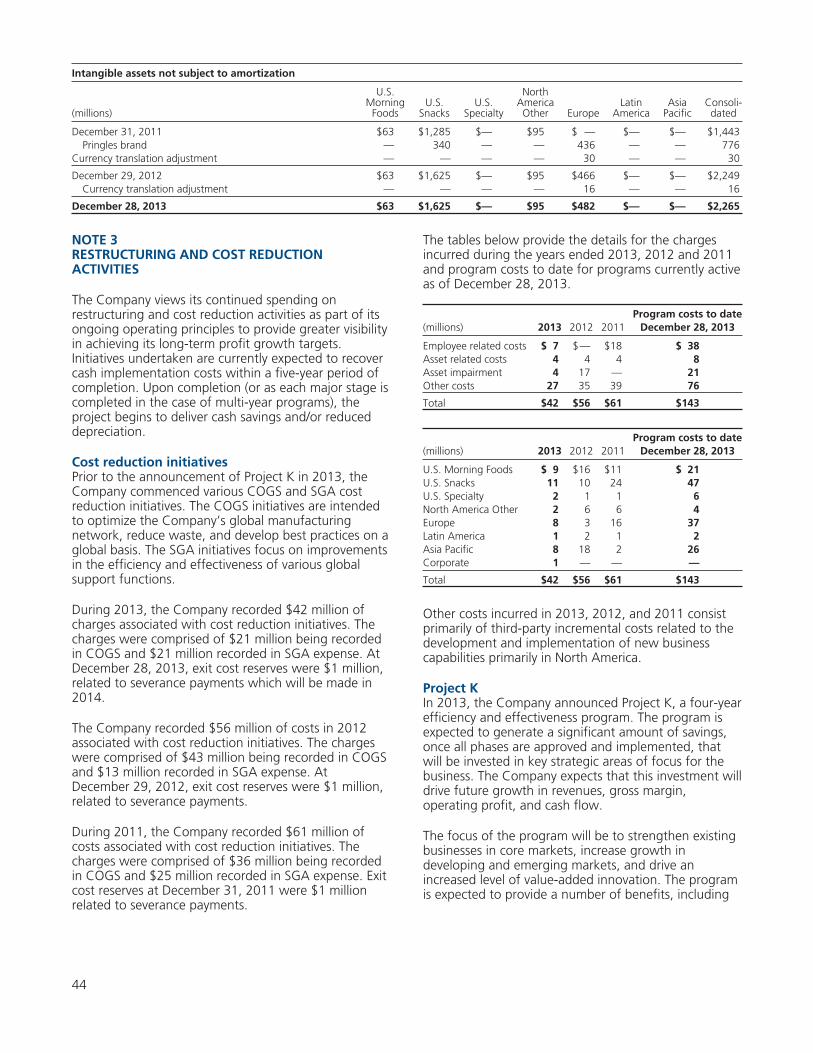
Intangible assets not subject to amortization
(millions)
U.S.Morning
FoodsU.S.
SnacksU.S.
Specialty
NorthAmericaOther Europe
LatinAmerica
AsiaPacific
Consoli-dated
December 31, 2011 $63 $1,285 $— $95 $ — $— $— $1,443Pringles brand — 340 — — 436 — — 776
Currency translation adjustment — — — — 30 — — 30
December 29, 2012 $63 $1,625 $— $95 $466 $— $— $2,249Currency translation adjustment — — — — 16 — — 16
December 28, 2013 $63 $1,625 $— $95 $482 $— $— $2,265
NOTE 3RESTRUCTURING AND COST REDUCTIONACTIVITIES
The Company views its continued spending onrestructuring and cost reduction activities as part of itsongoing operating principles to provide greater visibilityin achieving its long-term profit growth targets.Initiatives undertaken are currently expected to recovercash implementation costs within a five-year period ofcompletion. Upon completion (or as each major stage iscompleted in the case of multi-year programs), theproject begins to deliver cash savings and/or reduceddepreciation.
Cost reduction initiativesPrior to the announcement of Project K in 2013, theCompany commenced various COGS and SGA costreduction initiatives. The COGS initiatives are intendedto optimize the Company’s global manufacturingnetwork, reduce waste, and develop best practices on aglobal basis. The SGA initiatives focus on improvementsin the efficiency and effectiveness of various globalsupport functions.
During 2013, the Company recorded $42 million ofcharges associated with cost reduction initiatives. Thecharges were comprised of $21 million being recordedin COGS and $21 million recorded in SGA expense. AtDecember 28, 2013, exit cost reserves were $1 million,related to severance payments which will be made in2014.
The Company recorded $56 million of costs in 2012associated with cost reduction initiatives. The chargeswere comprised of $43 million being recorded in COGSand $13 million recorded in SGA expense. AtDecember 29, 2012, exit cost reserves were $1 million,related to severance payments.
During 2011, the Company recorded $61 million ofcosts associated with cost reduction initiatives. Thecharges were comprised of $36 million being recordedin COGS and $25 million recorded in SGA expense. Exitcost reserves at December 31, 2011 were $1 millionrelated to severance payments.
The tables below provide the details for the chargesincurred during the years ended 2013, 2012 and 2011and program costs to date for programs currently activeas of December 28, 2013.
Program costs to date(millions) 2013 2012 2011 December 28, 2013
Employee related costs $ 7 $— $18 $ 38Asset related costs 4 4 4 8Asset impairment 4 17 — 21Other costs 27 35 39 76
Total $42 $56 $61 $143
Program costs to date(millions) 2013 2012 2011 December 28, 2013
U.S. Morning Foods $ 9 $16 $11 $ 21U.S. Snacks 11 10 24 47U.S. Specialty 2 1 1 6North America Other 2 6 6 4Europe 8 3 16 37Latin America 1 2 1 2Asia Pacific 8 18 2 26Corporate 1 — — —
Total $42 $56 $61 $143
Other costs incurred in 2013, 2012, and 2011 consistprimarily of third-party incremental costs related to thedevelopment and implementation of new businesscapabilities primarily in North America.
Project KIn 2013, the Company announced Project K, a four-yearefficiency and effectiveness program. The program isexpected to generate a significant amount of savings,once all phases are approved and implemented, thatwill be invested in key strategic areas of focus for thebusiness. The Company expects that this investment willdrive future growth in revenues, gross margin,operating profit, and cash flow.
The focus of the program will be to strengthen existingbusinesses in core markets, increase growth indeveloping and emerging markets, and drive anincreased level of value-added innovation. The programis expected to provide a number of benefits, including
44
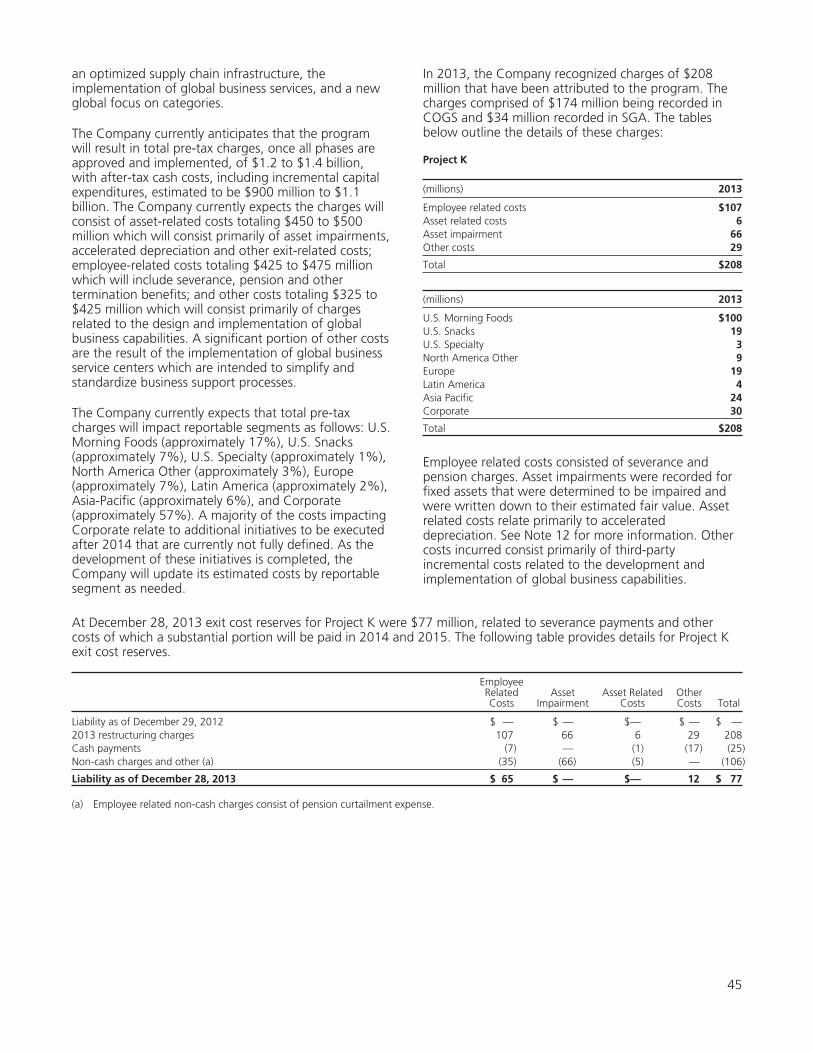
an optimized supply chain infrastructure, theimplementation of global business services, and a newglobal focus on categories.
The Company currently anticipates that the programwill result in total pre-tax charges, once all phases areapproved and implemented, of $1.2 to $1.4 billion,with after-tax cash costs, including incremental capitalexpenditures, estimated to be $900 million to $1.1billion. The Company currently expects the charges willconsist of asset-related costs totaling $450 to $500million which will consist primarily of asset impairments,accelerated depreciation and other exit-related costs;employee-related costs totaling $425 to $475 millionwhich will include severance, pension and othertermination benefits; and other costs totaling $325 to$425 million which will consist primarily of chargesrelated to the design and implementation of globalbusiness capabilities. A significant portion of other costsare the result of the implementation of global businessservice centers which are intended to simplify andstandardize business support processes.
The Company currently expects that total pre-taxcharges will impact reportable segments as follows: U.S.Morning Foods (approximately 17%), U.S. Snacks(approximately 7%), U.S. Specialty (approximately 1%),North America Other (approximately 3%), Europe(approximately 7%), Latin America (approximately 2%),Asia-Pacific (approximately 6%), and Corporate(approximately 57%). A majority of the costs impactingCorporate relate to additional initiatives to be executedafter 2014 that are currently not fully defined. As thedevelopment of these initiatives is completed, theCompany will update its estimated costs by reportablesegment as needed.
In 2013, the Company recognized charges of $208million that have been attributed to the program. Thecharges comprised of $174 million being recorded inCOGS and $34 million recorded in SGA. The tablesbelow outline the details of these charges:
Project K
(millions) 2013
Employee related costs $107Asset related costs 6Asset impairment 66Other costs 29
Total $208
(millions) 2013
U.S. Morning Foods $100U.S. Snacks 19U.S. Specialty 3North America Other 9Europe 19Latin America 4Asia Pacific 24Corporate 30
Total $208
Employee related costs consisted of severance andpension charges. Asset impairments were recorded forfixed assets that were determined to be impaired andwere written down to their estimated fair value. Assetrelated costs relate primarily to accelerateddepreciation. See Note 12 for more information. Othercosts incurred consist primarily of third-partyincremental costs related to the development andimplementation of global business capabilities.
At December 28, 2013 exit cost reserves for Project K were $77 million, related to severance payments and othercosts of which a substantial portion will be paid in 2014 and 2015. The following table provides details for Project Kexit cost reserves.
EmployeeRelatedCosts
AssetImpairment
Asset RelatedCosts
OtherCosts Total
Liability as of December 29, 2012 $ — $ — $— $ — $ —2013 restructuring charges 107 66 6 29 208Cash payments (7) — (1) (17) (25)Non-cash charges and other (a) (35) (66) (5) — (106)
Liability as of December 28, 2013 $ 65 $ — $— 12 $ 77
(a) Employee related non-cash charges consist of pension curtailment expense.
45
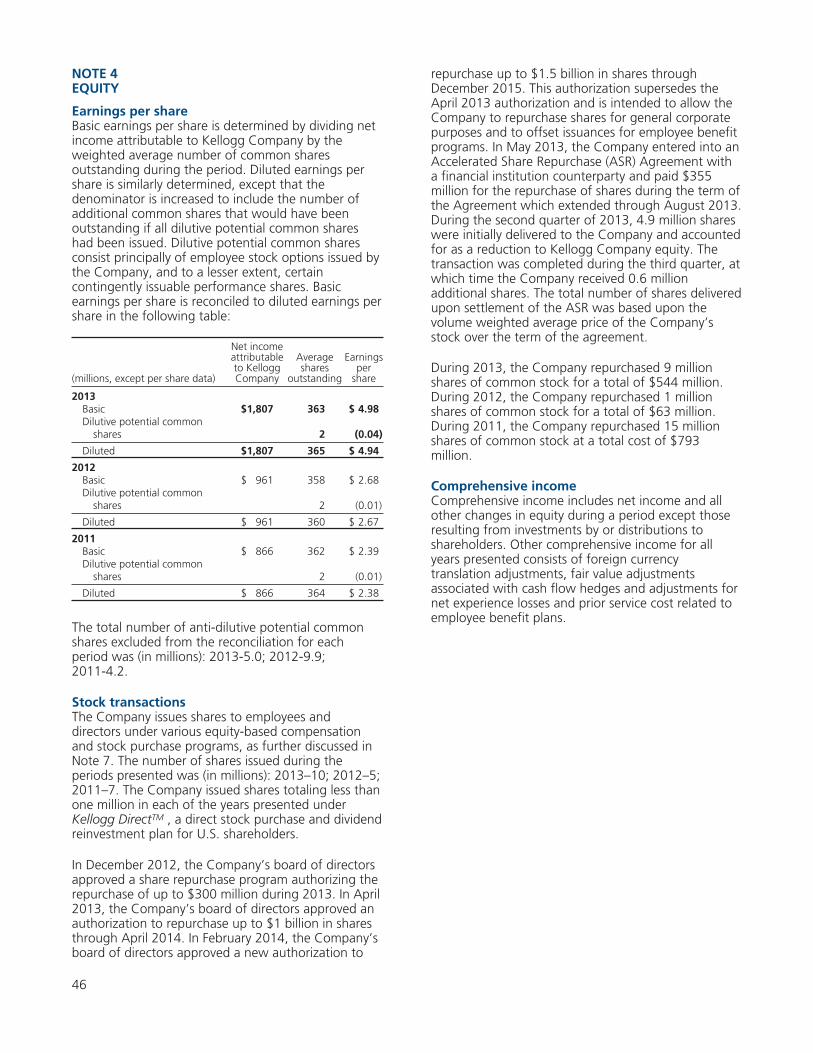
NOTE 4EQUITY
Earnings per shareBasic earnings per share is determined by dividing netincome attributable to Kellogg Company by theweighted average number of common sharesoutstanding during the period. Diluted earnings pershare is similarly determined, except that thedenominator is increased to include the number ofadditional common shares that would have beenoutstanding if all dilutive potential common shareshad been issued. Dilutive potential common sharesconsist principally of employee stock options issued bythe Company, and to a lesser extent, certaincontingently issuable performance shares. Basicearnings per share is reconciled to diluted earnings pershare in the following table:
(millions, except per share data)
Net incomeattributableto KelloggCompany
Averageshares
outstanding
Earningsper
share
2013Basic $1,807 363 $ 4.98Dilutive potential common
shares 2 (0.04)
Diluted $1,807 365 $ 4.94
2012Basic $ 961 358 $ 2.68Dilutive potential common
shares 2 (0.01)
Diluted $ 961 360 $ 2.67
2011Basic $ 866 362 $ 2.39Dilutive potential common
shares 2 (0.01)
Diluted $ 866 364 $ 2.38
The total number of anti-dilutive potential commonshares excluded from the reconciliation for eachperiod was (in millions): 2013-5.0; 2012-9.9;2011-4.2.
Stock transactionsThe Company issues shares to employees anddirectors under various equity-based compensationand stock purchase programs, as further discussed inNote 7. The number of shares issued during theperiods presented was (in millions): 2013–10; 2012–5;2011–7. The Company issued shares totaling less thanone million in each of the years presented underKellogg DirectTM , a direct stock purchase and dividendreinvestment plan for U.S. shareholders.
In December 2012, the Company’s board of directorsapproved a share repurchase program authorizing therepurchase of up to $300 million during 2013. In April2013, the Company’s board of directors approved anauthorization to repurchase up to $1 billion in sharesthrough April 2014. In February 2014, the Company’sboard of directors approved a new authorization to
repurchase up to $1.5 billion in shares throughDecember 2015. This authorization supersedes theApril 2013 authorization and is intended to allow theCompany to repurchase shares for general corporatepurposes and to offset issuances for employee benefitprograms. In May 2013, the Company entered into anAccelerated Share Repurchase (ASR) Agreement witha financial institution counterparty and paid $355million for the repurchase of shares during the term ofthe Agreement which extended through August 2013.During the second quarter of 2013, 4.9 million shareswere initially delivered to the Company and accountedfor as a reduction to Kellogg Company equity. Thetransaction was completed during the third quarter, atwhich time the Company received 0.6 millionadditional shares. The total number of shares deliveredupon settlement of the ASR was based upon thevolume weighted average price of the Company’sstock over the term of the agreement.
During 2013, the Company repurchased 9 millionshares of common stock for a total of $544 million.During 2012, the Company repurchased 1 millionshares of common stock for a total of $63 million.During 2011, the Company repurchased 15 millionshares of common stock at a total cost of $793million.
Comprehensive incomeComprehensive income includes net income and allother changes in equity during a period except thoseresulting from investments by or distributions toshareholders. Other comprehensive income for allyears presented consists of foreign currencytranslation adjustments, fair value adjustmentsassociated with cash flow hedges and adjustments fornet experience losses and prior service cost related toemployee benefit plans.
46
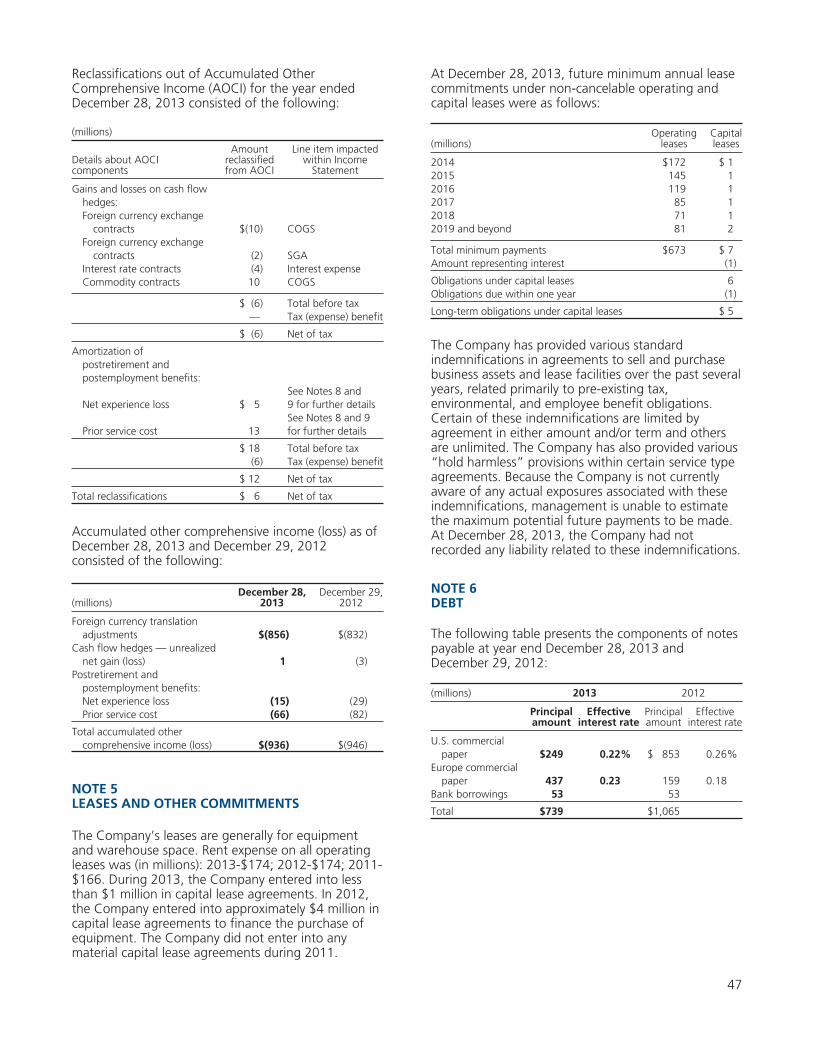
Reclassifications out of Accumulated OtherComprehensive Income (AOCI) for the year endedDecember 28, 2013 consisted of the following:
(millions)
Details about AOCIcomponents
Amountreclassifiedfrom AOCI
Line item impactedwithin Income
Statement
Gains and losses on cash flowhedges:Foreign currency exchange
contracts $(10) COGSForeign currency exchange
contracts (2) SGAInterest rate contracts (4) Interest expenseCommodity contracts 10 COGS
$ (6) Total before tax— Tax (expense) benefit
$ (6) Net of tax
Amortization ofpostretirement andpostemployment benefits:
Net experience loss $ 5See Notes 8 and9 for further details
Prior service cost 13See Notes 8 and 9for further details
$ 18 Total before tax(6) Tax (expense) benefit
$ 12 Net of tax
Total reclassifications $ 6 Net of tax
Accumulated other comprehensive income (loss) as ofDecember 28, 2013 and December 29, 2012consisted of the following:
(millions)December 28,
2013December 29,
2012
Foreign currency translationadjustments $(856) $(832)
Cash flow hedges — unrealizednet gain (loss) 1 (3)
Postretirement andpostemployment benefits:Net experience loss (15) (29)Prior service cost (66) (82)
Total accumulated othercomprehensive income (loss) $(936) $(946)
NOTE 5LEASES AND OTHER COMMITMENTS
The Company’s leases are generally for equipmentand warehouse space. Rent expense on all operatingleases was (in millions): 2013-$174; 2012-$174; 2011-$166. During 2013, the Company entered into lessthan $1 million in capital lease agreements. In 2012,the Company entered into approximately $4 million incapital lease agreements to finance the purchase ofequipment. The Company did not enter into anymaterial capital lease agreements during 2011.
At December 28, 2013, future minimum annual leasecommitments under non-cancelable operating andcapital leases were as follows:
(millions)Operating
leasesCapitalleases
2014 $172 $ 12015 145 12016 119 12017 85 12018 71 12019 and beyond 81 2
Total minimum payments $673 $ 7Amount representing interest (1)
Obligations under capital leases 6Obligations due within one year (1)
Long-term obligations under capital leases $ 5
The Company has provided various standardindemnifications in agreements to sell and purchasebusiness assets and lease facilities over the past severalyears, related primarily to pre-existing tax,environmental, and employee benefit obligations.Certain of these indemnifications are limited byagreement in either amount and/or term and othersare unlimited. The Company has also provided various“hold harmless” provisions within certain service typeagreements. Because the Company is not currentlyaware of any actual exposures associated with theseindemnifications, management is unable to estimatethe maximum potential future payments to be made.At December 28, 2013, the Company had notrecorded any liability related to these indemnifications.
NOTE 6DEBT
The following table presents the components of notespayable at year end December 28, 2013 andDecember 29, 2012:
(millions) 2013 2012
Principalamount
Effectiveinterest rate
Principalamount
Effectiveinterest rate
U.S. commercialpaper $249 0.22% $ 853 0.26%
Europe commercialpaper 437 0.23 159 0.18
Bank borrowings 53 53
Total $739 $1,065
47
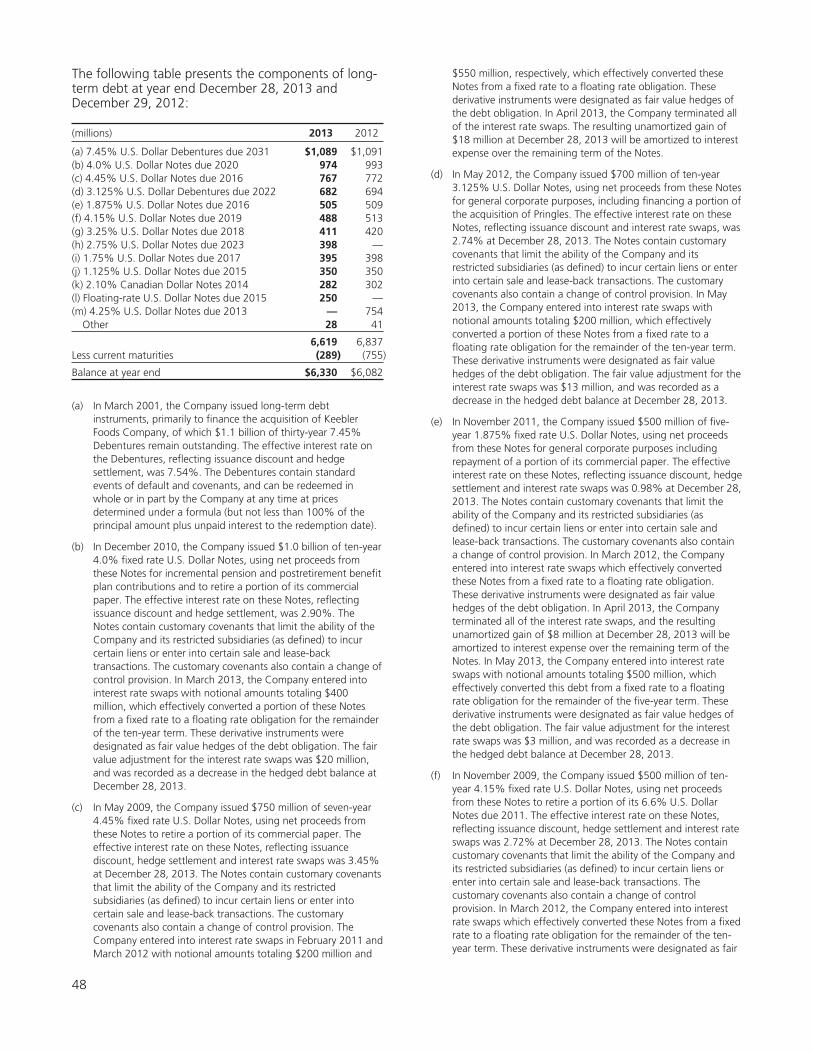
The following table presents the components of long-term debt at year end December 28, 2013 andDecember 29, 2012:
(millions) 2013 2012
(a) 7.45% U.S. Dollar Debentures due 2031 $1,089 $1,091(b) 4.0% U.S. Dollar Notes due 2020 974 993(c) 4.45% U.S. Dollar Notes due 2016 767 772(d) 3.125% U.S. Dollar Debentures due 2022 682 694(e) 1.875% U.S. Dollar Notes due 2016 505 509(f) 4.15% U.S. Dollar Notes due 2019 488 513(g) 3.25% U.S. Dollar Notes due 2018 411 420(h) 2.75% U.S. Dollar Notes due 2023 398 —(i) 1.75% U.S. Dollar Notes due 2017 395 398(j) 1.125% U.S. Dollar Notes due 2015 350 350(k) 2.10% Canadian Dollar Notes 2014 282 302(l) Floating-rate U.S. Dollar Notes due 2015 250 —(m) 4.25% U.S. Dollar Notes due 2013 — 754
Other 28 41
6,619 6,837Less current maturities (289) (755)
Balance at year end $6,330 $6,082
(a) In March 2001, the Company issued long-term debtinstruments, primarily to finance the acquisition of KeeblerFoods Company, of which $1.1 billion of thirty-year 7.45%Debentures remain outstanding. The effective interest rate onthe Debentures, reflecting issuance discount and hedgesettlement, was 7.54%. The Debentures contain standardevents of default and covenants, and can be redeemed inwhole or in part by the Company at any time at pricesdetermined under a formula (but not less than 100% of theprincipal amount plus unpaid interest to the redemption date).
(b) In December 2010, the Company issued $1.0 billion of ten-year4.0% fixed rate U.S. Dollar Notes, using net proceeds fromthese Notes for incremental pension and postretirement benefitplan contributions and to retire a portion of its commercialpaper. The effective interest rate on these Notes, reflectingissuance discount and hedge settlement, was 2.90%. TheNotes contain customary covenants that limit the ability of theCompany and its restricted subsidiaries (as defined) to incurcertain liens or enter into certain sale and lease-backtransactions. The customary covenants also contain a change ofcontrol provision. In March 2013, the Company entered intointerest rate swaps with notional amounts totaling $400million, which effectively converted a portion of these Notesfrom a fixed rate to a floating rate obligation for the remainderof the ten-year term. These derivative instruments weredesignated as fair value hedges of the debt obligation. The fairvalue adjustment for the interest rate swaps was $20 million,and was recorded as a decrease in the hedged debt balance atDecember 28, 2013.
(c) In May 2009, the Company issued $750 million of seven-year4.45% fixed rate U.S. Dollar Notes, using net proceeds fromthese Notes to retire a portion of its commercial paper. Theeffective interest rate on these Notes, reflecting issuancediscount, hedge settlement and interest rate swaps was 3.45%at December 28, 2013. The Notes contain customary covenantsthat limit the ability of the Company and its restrictedsubsidiaries (as defined) to incur certain liens or enter intocertain sale and lease-back transactions. The customarycovenants also contain a change of control provision. TheCompany entered into interest rate swaps in February 2011 andMarch 2012 with notional amounts totaling $200 million and
$550 million, respectively, which effectively converted theseNotes from a fixed rate to a floating rate obligation. Thesederivative instruments were designated as fair value hedges ofthe debt obligation. In April 2013, the Company terminated allof the interest rate swaps. The resulting unamortized gain of$18 million at December 28, 2013 will be amortized to interestexpense over the remaining term of the Notes.
(d) In May 2012, the Company issued $700 million of ten-year3.125% U.S. Dollar Notes, using net proceeds from these Notesfor general corporate purposes, including financing a portion ofthe acquisition of Pringles. The effective interest rate on theseNotes, reflecting issuance discount and interest rate swaps, was2.74% at December 28, 2013. The Notes contain customarycovenants that limit the ability of the Company and itsrestricted subsidiaries (as defined) to incur certain liens or enterinto certain sale and lease-back transactions. The customarycovenants also contain a change of control provision. In May2013, the Company entered into interest rate swaps withnotional amounts totaling $200 million, which effectivelyconverted a portion of these Notes from a fixed rate to afloating rate obligation for the remainder of the ten-year term.These derivative instruments were designated as fair valuehedges of the debt obligation. The fair value adjustment for theinterest rate swaps was $13 million, and was recorded as adecrease in the hedged debt balance at December 28, 2013.
(e) In November 2011, the Company issued $500 million of five-year 1.875% fixed rate U.S. Dollar Notes, using net proceedsfrom these Notes for general corporate purposes includingrepayment of a portion of its commercial paper. The effectiveinterest rate on these Notes, reflecting issuance discount, hedgesettlement and interest rate swaps was 0.98% at December 28,2013. The Notes contain customary covenants that limit theability of the Company and its restricted subsidiaries (asdefined) to incur certain liens or enter into certain sale andlease-back transactions. The customary covenants also containa change of control provision. In March 2012, the Companyentered into interest rate swaps which effectively convertedthese Notes from a fixed rate to a floating rate obligation.These derivative instruments were designated as fair valuehedges of the debt obligation. In April 2013, the Companyterminated all of the interest rate swaps, and the resultingunamortized gain of $8 million at December 28, 2013 will beamortized to interest expense over the remaining term of theNotes. In May 2013, the Company entered into interest rateswaps with notional amounts totaling $500 million, whicheffectively converted this debt from a fixed rate to a floatingrate obligation for the remainder of the five-year term. Thesederivative instruments were designated as fair value hedges ofthe debt obligation. The fair value adjustment for the interestrate swaps was $3 million, and was recorded as a decrease inthe hedged debt balance at December 28, 2013.
(f) In November 2009, the Company issued $500 million of ten-year 4.15% fixed rate U.S. Dollar Notes, using net proceedsfrom these Notes to retire a portion of its 6.6% U.S. DollarNotes due 2011. The effective interest rate on these Notes,reflecting issuance discount, hedge settlement and interest rateswaps was 2.72% at December 28, 2013. The Notes containcustomary covenants that limit the ability of the Company andits restricted subsidiaries (as defined) to incur certain liens orenter into certain sale and lease-back transactions. Thecustomary covenants also contain a change of controlprovision. In March 2012, the Company entered into interestrate swaps which effectively converted these Notes from a fixedrate to a floating rate obligation for the remainder of the ten-year term. These derivative instruments were designated as fair
48
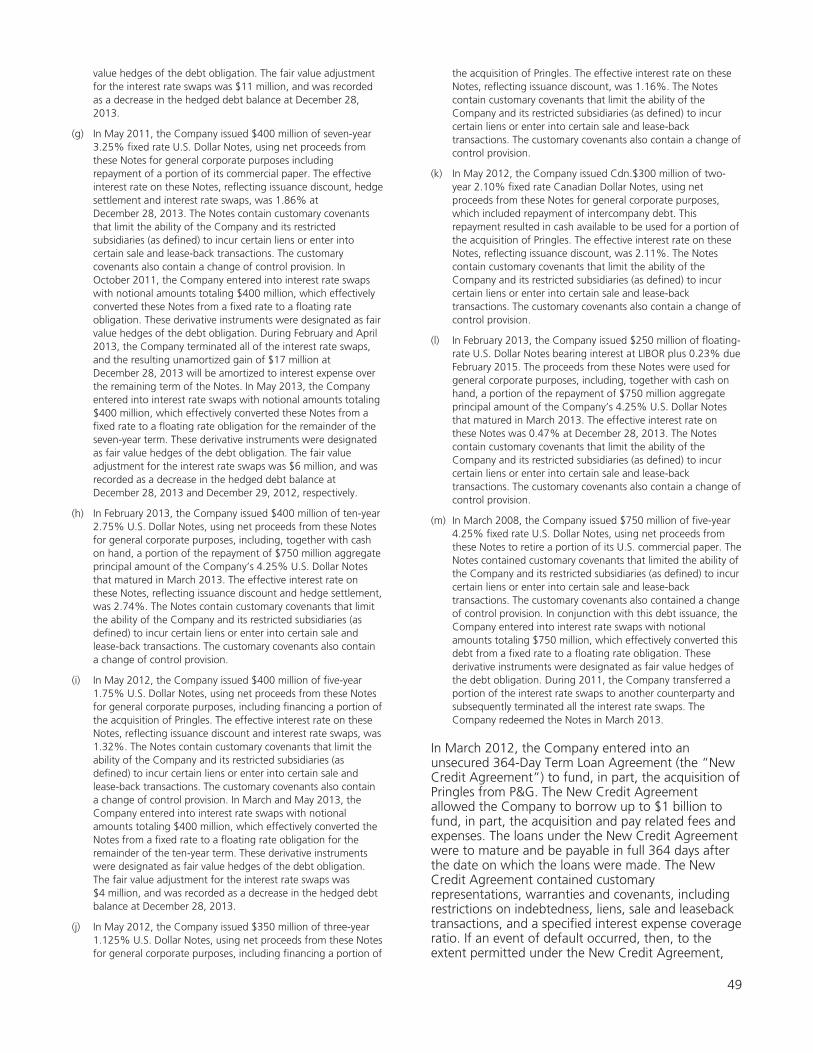
value hedges of the debt obligation. The fair value adjustmentfor the interest rate swaps was $11 million, and was recordedas a decrease in the hedged debt balance at December 28,2013.
(g) In May 2011, the Company issued $400 million of seven-year3.25% fixed rate U.S. Dollar Notes, using net proceeds fromthese Notes for general corporate purposes includingrepayment of a portion of its commercial paper. The effectiveinterest rate on these Notes, reflecting issuance discount, hedgesettlement and interest rate swaps, was 1.86% atDecember 28, 2013. The Notes contain customary covenantsthat limit the ability of the Company and its restrictedsubsidiaries (as defined) to incur certain liens or enter intocertain sale and lease-back transactions. The customarycovenants also contain a change of control provision. InOctober 2011, the Company entered into interest rate swapswith notional amounts totaling $400 million, which effectivelyconverted these Notes from a fixed rate to a floating rateobligation. These derivative instruments were designated as fairvalue hedges of the debt obligation. During February and April2013, the Company terminated all of the interest rate swaps,and the resulting unamortized gain of $17 million atDecember 28, 2013 will be amortized to interest expense overthe remaining term of the Notes. In May 2013, the Companyentered into interest rate swaps with notional amounts totaling$400 million, which effectively converted these Notes from afixed rate to a floating rate obligation for the remainder of theseven-year term. These derivative instruments were designatedas fair value hedges of the debt obligation. The fair valueadjustment for the interest rate swaps was $6 million, and wasrecorded as a decrease in the hedged debt balance atDecember 28, 2013 and December 29, 2012, respectively.
(h) In February 2013, the Company issued $400 million of ten-year2.75% U.S. Dollar Notes, using net proceeds from these Notesfor general corporate purposes, including, together with cashon hand, a portion of the repayment of $750 million aggregateprincipal amount of the Company’s 4.25% U.S. Dollar Notesthat matured in March 2013. The effective interest rate onthese Notes, reflecting issuance discount and hedge settlement,was 2.74%. The Notes contain customary covenants that limitthe ability of the Company and its restricted subsidiaries (asdefined) to incur certain liens or enter into certain sale andlease-back transactions. The customary covenants also containa change of control provision.
(i) In May 2012, the Company issued $400 million of five-year1.75% U.S. Dollar Notes, using net proceeds from these Notesfor general corporate purposes, including financing a portion ofthe acquisition of Pringles. The effective interest rate on theseNotes, reflecting issuance discount and interest rate swaps, was1.32%. The Notes contain customary covenants that limit theability of the Company and its restricted subsidiaries (asdefined) to incur certain liens or enter into certain sale andlease-back transactions. The customary covenants also containa change of control provision. In March and May 2013, theCompany entered into interest rate swaps with notionalamounts totaling $400 million, which effectively converted theNotes from a fixed rate to a floating rate obligation for theremainder of the ten-year term. These derivative instrumentswere designated as fair value hedges of the debt obligation.The fair value adjustment for the interest rate swaps was$4 million, and was recorded as a decrease in the hedged debtbalance at December 28, 2013.
(j) In May 2012, the Company issued $350 million of three-year1.125% U.S. Dollar Notes, using net proceeds from these Notesfor general corporate purposes, including financing a portion of
the acquisition of Pringles. The effective interest rate on theseNotes, reflecting issuance discount, was 1.16%. The Notescontain customary covenants that limit the ability of theCompany and its restricted subsidiaries (as defined) to incurcertain liens or enter into certain sale and lease-backtransactions. The customary covenants also contain a change ofcontrol provision.
(k) In May 2012, the Company issued Cdn.$300 million of two-year 2.10% fixed rate Canadian Dollar Notes, using netproceeds from these Notes for general corporate purposes,which included repayment of intercompany debt. Thisrepayment resulted in cash available to be used for a portion ofthe acquisition of Pringles. The effective interest rate on theseNotes, reflecting issuance discount, was 2.11%. The Notescontain customary covenants that limit the ability of theCompany and its restricted subsidiaries (as defined) to incurcertain liens or enter into certain sale and lease-backtransactions. The customary covenants also contain a change ofcontrol provision.
(l) In February 2013, the Company issued $250 million of floating-rate U.S. Dollar Notes bearing interest at LIBOR plus 0.23% dueFebruary 2015. The proceeds from these Notes were used forgeneral corporate purposes, including, together with cash onhand, a portion of the repayment of $750 million aggregateprincipal amount of the Company’s 4.25% U.S. Dollar Notesthat matured in March 2013. The effective interest rate onthese Notes was 0.47% at December 28, 2013. The Notescontain customary covenants that limit the ability of theCompany and its restricted subsidiaries (as defined) to incurcertain liens or enter into certain sale and lease-backtransactions. The customary covenants also contain a change ofcontrol provision.
(m) In March 2008, the Company issued $750 million of five-year4.25% fixed rate U.S. Dollar Notes, using net proceeds fromthese Notes to retire a portion of its U.S. commercial paper. TheNotes contained customary covenants that limited the ability ofthe Company and its restricted subsidiaries (as defined) to incurcertain liens or enter into certain sale and lease-backtransactions. The customary covenants also contained a changeof control provision. In conjunction with this debt issuance, theCompany entered into interest rate swaps with notionalamounts totaling $750 million, which effectively converted thisdebt from a fixed rate to a floating rate obligation. Thesederivative instruments were designated as fair value hedges ofthe debt obligation. During 2011, the Company transferred aportion of the interest rate swaps to another counterparty andsubsequently terminated all the interest rate swaps. TheCompany redeemed the Notes in March 2013.
In March 2012, the Company entered into anunsecured 364-Day Term Loan Agreement (the “NewCredit Agreement”) to fund, in part, the acquisition ofPringles from P&G. The New Credit Agreementallowed the Company to borrow up to $1 billion tofund, in part, the acquisition and pay related fees andexpenses. The loans under the New Credit Agreementwere to mature and be payable in full 364 days afterthe date on which the loans were made. The NewCredit Agreement contained customaryrepresentations, warranties and covenants, includingrestrictions on indebtedness, liens, sale and leasebacktransactions, and a specified interest expense coverageratio. If an event of default occurred, then, to theextent permitted under the New Credit Agreement,
49
the administrative agent could (i) not earlier than thedate on which the acquisition is or is to beconsummated, terminate the commitments under theNew Credit Agreement and (ii) accelerate anyoutstanding loans under the New Credit Agreement.The Company had no borrowings against the NewCredit Agreement and, in May 2012, upon issuance ofthe U.S. Dollar Notes described above, the availablecommitments under the New Credit Agreement wereautomatically and permanently reduced to $0.
The Company and two of its subsidiaries (the Issuers)maintain a program under which the Issuers may issueeuro-commercial paper notes up to a maximumaggregate amount outstanding at any time of$750 million or its equivalent in alternative currencies.The notes may have maturities ranging up to 364 daysand will be senior unsecured obligations of theapplicable Issuer. Notes issued by subsidiary Issuers willbe guaranteed by the Company. The notes may beissued at a discount or may bear fixed or floating rateinterest or a coupon calculated by reference to anindex or formula. There was $437 million and $159million outstanding under this program as ofDecember 28, 2013 and December 29, 2012,respectively.
At December 28, 2013, the Company had $2.2 billionof short-term lines of credit, virtually all of which wereunused and available for borrowing on an unsecuredbasis. These lines were comprised principally of anunsecured Four-Year Credit Agreement, which theCompany entered into in March 2011 and expires in2015. The Four-Year Credit Agreement allows theCompany to borrow, on a revolving credit basis, up to$2.0 billion, to obtain letters of credit in an aggregateamount up to $75 million, U.S. swingline loans in anaggregate amount up to $200 million and Europeanswingline loans in an aggregate amount up to $400million and to provide a procedure for lenders to bid onshort-term debt of the Company. The agreementcontains customary covenants and warranties, includingspecified restrictions on indebtedness, liens, sale andleaseback transactions, and a specified interestcoverage ratio. If an event of default occurs, then, tothe extent permitted, the administrative agent mayterminate the commitments under the credit facility,accelerate any outstanding loans under the agreement,and demand the deposit of cash collateral equal to thelender’s letter of credit exposure plus interest.
The Company was in compliance with all covenants asof December 28, 2013.
Scheduled principal repayments on long-term debt are(in millions): 2014–$289; 2015–$610; 2016–$1,253;2017–$403; 2018–$403; 2019 and beyond–$3,702.
Interest paid was (in millions): 2013–$234; 2012–$254; 2011–$249. Interest expense capitalized as partof the construction cost of fixed assets was (inmillions): 2013–$2; 2012–$2; 2011–$5.
NOTE 7STOCK COMPENSATION
The Company uses various equity-based compensationprograms to provide long-term performance incentivesfor its global workforce. Currently, these incentivesconsist principally of stock options, and to a lesserextent, executive performance shares, restricted stockunits and restricted stock grants. The Company alsosponsors a discounted stock purchase plan in theUnited States and matching-grant programs in severalinternational locations. Additionally, the Companyawards restricted stock to its outside directors. Theseawards are administered through several plans, asdescribed within this Note.
The 2013 Long-Term Incentive Plan (2013 Plan),approved by shareholders in 2013, permits awards toemployees and officers in the form of incentive andnon-qualified stock options, performance units,restricted stock or restricted stock units, and stockappreciation rights. The 2013 Plan, which replaced the2009 Long-Term Incentive Plan (2009 Plan), authorizesthe issuance of a total of (a) 22 million shares; plus(b) the total number of shares remaining available forfuture grants under the 2009 Plan. The total numberof shares remaining available for issuance under the2013 Plan will be reduced by two shares for eachshare issued pursuant to an award under the 2013Plan other than a stock option or stock appreciationright, or potentially issuable pursuant to anoutstanding award other than a stock option or stockappreciation right, which will in each case reduce thetotal number of shares remaining by one share foreach share issued. The 2013 Plan includes severallimitations on awards or payments to individualparticipants. Options granted under the 2013 and2009 Plans generally vest over three years. AtDecember 28, 2013, there were 27 million remainingauthorized, but unissued, shares under the 2013 Plan.This amount includes 5 million shares remainingavailable under the 2009 Plan.
The Non-Employee Director Stock Plan (2009 DirectorPlan) was approved by shareholders in 2009 andallows each eligible non-employee director to receiveshares of the Company’s common stock annually. Thenumber of shares granted pursuant to each annualaward will be determined by the Nominating andGovernance Committee of the Board of Directors. The2009 Director Plan, which replaced the 2000 Non-Employee Director Stock Plan (2000 Director Plan),reserves 500,000 shares for issuance, plus the totalnumber of shares as to which awards granted underthe 2009 Director Plan or the 2000 Director Plansexpire or are forfeited, terminated or settled in cash.Under both the 2009 and 2000 Director Plans, shares(other than stock options) are placed in the KelloggCompany Grantor Trust for Non-Employee Directors(the Grantor Trust). Under the terms of the GrantorTrust, shares are available to a director only upon
50
termination of service on the Board. Under the 2009Director Plan, awards were as follows (number ofshares): 2013-26,504; 2012-26,940; 2011-24,850.
The 2002 Employee Stock Purchase Plan wasapproved by shareholders in 2002 and permits eligibleemployees to purchase Company stock at adiscounted price. This plan allows for a maximum of2.5 million shares of Company stock to be issued at apurchase price equal to 95% of the fair market valueof the stock on the last day of the quarterly purchaseperiod. Total purchases through this plan for anyemployee are limited to a fair market value of $25,000during any calendar year. At December 28, 2013,there were approximately 0.5 million remainingauthorized, but unissued, shares under this plan.Shares were purchased by employees under this planas follows (approximate number of shares): 2013–85,000; 2012–107,000; 2011–110,000. Optionsgranted to employees to purchase discounted stockunder this plan are included in the option activitytables within this note.
Additionally, an international subsidiary of theCompany maintains a stock purchase plan for itsemployees. Subject to limitations, employeecontributions to this plan are matched 1:1 by theCompany. Under this plan, shares were granted by theCompany to match an equal number of sharespurchased by employees as follows (approximatenumber of shares): 2013–58,000; 2012–71,000;2011–68,000.
Compensation expense for all types of equity-basedprograms and the related income tax benefitrecognized were as follows:
(millions) 2013 2012 2011
Pre-tax compensation expense $38 $46 $37
Related income tax benefit $14 $17 $13
As of December 28, 2013, total stock-basedcompensation cost related to non-vested awards notyet recognized was $43 million and the weighted-average period over which this amount is expected tobe recognized was 2 years.
Cash flows realized upon exercise or vesting of stock-based awards in the periods presented are included inthe following table. Tax benefits realized upon exerciseor vesting of stock-based awards generally representthe tax benefit of the difference between the exerciseprice and the strike price of the option.
Cash used by the Company to settle equityinstruments granted under stock-based awards wasinsignificant.
(millions) 2013 2012 2011
Total cash received from option exercisesand similar instruments $475 $229 $291
Tax benefits realized upon exercise orvesting of stock-based awards:Windfall benefits classified as financing
cash flow $ 24 $ 6 $ 11
Shares used to satisfy stock-based awards are normallyissued out of treasury stock, although management isauthorized to issue new shares to the extent permittedby respective plan provisions. Refer to Note 4 forinformation on shares issued during the periodspresented to employees and directors under variouslong-term incentive plans and share repurchases underthe Company’s stock repurchase authorizations. TheCompany does not currently have a policy ofrepurchasing a specified number of shares issuedunder employee benefit programs during anyparticular time period.
Stock optionsDuring the periods presented, non-qualified stockoptions were granted to eligible employees under the2013 and 2009 Plans with exercise prices equal to thefair market value of the Company’s stock on the grantdate, a contractual term of ten years, and a three-yeargraded vesting period.
Management estimates the fair value of each annualstock option award on the date of grant using alattice-based option valuation model. Compositeassumptions are presented in the following table.Weighted-average values are disclosed for certaininputs which incorporate a range of assumptions.Expected volatilities are based principally on historicalvolatility of the Company’s stock, and to a lesserextent, on implied volatilities from traded options onthe Company’s stock. Historical volatility correspondsto the contractual term of the options granted. TheCompany uses historical data to estimate optionexercise and employee termination within thevaluation models; separate groups of employees thathave similar historical exercise behavior are consideredseparately for valuation purposes. The expected termof options granted represents the period of time thatoptions granted are expected to be outstanding; theweighted-average expected term for all employeegroups is presented in the following table. The risk-free rate for periods within the contractual life of theoptions is based on the U.S. Treasury yield curve ineffect at the time of grant.
51
Stock option valuation modelassumptions for grants within theyear ended: 2013 2012 2011
Weighted-average expectedvolatility 15.00% 16.00% 17.00%
Weighted-average expected term(years) 7.44 7.53 6.99
Weighted-average risk-freeinterest rate 1.49% 1.60% 3.06%
Dividend yield 2.90% 3.30% 3.10%
Weighted-average fair value ofoptions granted $ 5.92 $ 5.23 $ 7.59
A summary of option activity for the year endedDecember 28, 2013 is presented in the followingtable:
Employee anddirector stockoptions
Shares(millions)
Weighted-averageexercise
price
Weighted-average
remainingcontractualterm (yrs.)
Aggregateintrinsicvalue
(millions)
Outstanding,beginning ofperiod 25 $50Granted 6 60Exercised (10) 48Forfeitures and
expirations (1) 55
Outstanding, end ofperiod 20 $54 7.0 $143
Exercisable, end ofperiod 9 $50 5.4 $101
Additionally, option activity for the comparable prioryear periods is presented in the following table:
(millions, except per share data) 2012 2011
Outstanding, beginning of year 24 26Granted 6 5Exercised (4) (6)Forfeitures and expirations (1) (1)
Outstanding, end of year 25 24
Exercisable, end of year 14 16
Weighted-average exercise price:Outstanding, beginning of year $48 $47
Granted 52 53Exercised 44 45Forfeitures and expirations 53 52
Outstanding, end of year $50 $48
Exercisable, end of year $48 $47
The total intrinsic value of options exercised during theperiods presented was (in millions): 2013–$139;2012–$34; 2011–$63.
Other stock-based awardsDuring the periods presented, other stock-basedawards consisted principally of executive performanceshares and restricted stock granted under the 2013and 2009 Plans.
In 2013, 2012 and 2011, the Company madeperformance share awards to a limited number ofsenior executive-level employees, which entitles theseemployees to receive a specified number of shares ofthe Company’s common stock on the vesting date,provided cumulative three-year targets are achieved.The cumulative three-year targets involved operatingprofit and internal net sales growth. Managementestimates the fair value of performance share awardsbased on the market price of the underlying stock onthe date of grant, reduced by the present value ofestimated dividends foregone during the performanceperiod. The 2013, 2012 and 2011 target grants (asrevised for non-vested forfeitures and otheradjustments) currently correspond to approximately208,000, 183,000 and 117,000 shares, respectively,with a grant-date fair value of $54, $47, and $48 pershare. The actual number of shares issued on thevesting date could range from zero to 200% of target,depending on actual performance achieved. Based onthe market price of the Company’s common stock atyear-end 2013, the maximum future value that couldbe awarded on the vesting date was (in millions):2013 award–$23; 2012 award–$17; and 2011 award–$11. The 2010 performance share award, payable instock, was settled at 40% of target in February 2013for a total dollar equivalent of $4 million.
The Company also periodically grants restricted stockand restricted stock units to eligible employees underthe 2013 Plan. Restrictions with respect to sale ortransferability generally lapse after three years and, inthe case of restricted stock, the grantee is normallyentitled to receive shareholder dividends during thevesting period. Management estimates the fair valueof restricted stock grants based on the market price ofthe underlying stock on the date of grant. A summaryof restricted stock activity for the year endedDecember 28, 2013, is presented in the followingtable:
Employee restricted stock and restrictedstock units
Shares(thousands)
Weighted-average
grant-datefair value
Non-vested, beginning of year 316 $50Granted 139 52Vested (117) 51Forfeited (20) 47
Non-vested, end of year 318 $52
Grants of restricted stock and restricted stock units forcomparable prior-year periods were: 2012 – 160,000,2011–102,000.
The total fair value of restricted stock and restrictedstock units vesting in the periods presented was (inmillions): 2013–$6; 2012–$4; 2011–$7.
52
NOTE 8PENSION BENEFITS
The Company sponsors a number of U.S. and foreignpension plans to provide retirement benefits for itsemployees. The majority of these plans are funded orunfunded defined benefit plans, although theCompany does participate in a limited number ofmultiemployer or other defined contribution plans forcertain employee groups. See Note 10 for moreinformation regarding the Company’s participation inmultiemployer plans. Defined benefits for salariedemployees are generally based on salary and years ofservice, while union employee benefits are generally anegotiated amount for each year of service.
Obligations and funded statusThe aggregate change in projected benefit obligation,plan assets, and funded status is presented in thefollowing tables.
(millions) 2013 2012
Change in projected benefit obligationBeginning of year $5,135 $4,367Service cost 133 110Interest cost 203 207Plan participants’ contributions 2 2Amendments 4 23Actuarial (gain)loss (407) 535Benefits paid (218) (213)Acquisitions 17 47Curtailment and special termination benefits 26 —Foreign currency adjustments (7) 57
End of year $4,888 $5,135
Change in plan assetsFair value beginning of year $4,374 $3,931Actual return on plan assets 802 508Employer contributions 34 38Plan participants’ contributions 2 2Benefits paid (200) (187)Acquisitions — 23Foreign currency adjustments 2 59
Fair value end of year $5,014 $4,374
Funded status $ 126 $ (761)
Amounts recognized in the ConsolidatedBalance Sheet consist of
Other assets $ 419 $ 145Other current liabilities (16) (20)Other liabilities (277) (886)
Net amount recognized $ 126 $ (761)
Amounts recognized in accumulated othercomprehensive income consist of
Prior service cost $ 73 $ 94
Net amount recognized $ 73 $ 94
The accumulated benefit obligation for all definedbenefit pension plans was $4.5 billion and $4.7 billionat December 28, 2013 and December 29, 2012,respectively. Information for pension plans withaccumulated benefit obligations in excess of planassets were:
(millions) 2013 2012
Projected benefit obligation $327 $3,707Accumulated benefit obligation $251 $3,442Fair value of plan assets $ 58 $2,823
ExpenseThe components of pension expense are presented inthe following table. Pension expense for definedcontribution plans relates to certain foreign-baseddefined contribution plans and multiemployer plans inthe United States in which the Company participateson behalf of certain unionized workforces.
(millions) 2013 2012 2011
Service cost $ 133 $ 110 $ 96Interest cost 203 207 209Expected return on plan assets (359) (344) (361)Amortization of unrecognized prior
service cost 16 14 14Recognized net (gain)loss (854) 372 747Curtailment and special termination
benefits 34 — —
Pension (income)expense:Defined benefit plans (827) 359 705Defined contribution plans 35 29 35
Total $(792) $ 388 $ 740
The estimated prior service cost for defined benefitpension plans that will be amortized fromaccumulated other comprehensive income intopension expense over the next fiscal year isapproximately $14 million.
The Company and certain of its subsidiaries sponsor401(k) or similar savings plans for active employees.Expense related to these plans was (in millions): 2013– $41; 2012 – $39; 2011- $36. These amounts are notincluded in the preceding expense table. Companycontributions to these savings plans approximateannual expense. Company contributions tomultiemployer and other defined contribution pensionplans approximate the amount of annual expensepresented in the preceding table.
See discussion in Note 3 related to curtailment andspecial termination benefit costs recognized in 2013.
AssumptionsThe worldwide weighted-average actuarial assumptionsused to determine benefit obligations were:
2013 2012 2011
Discount rate 4.7% 4.0% 4.8%Long-term rate of compensation increase 4.1% 4.1% 4.2%
53
The worldwide weighted-average actuarialassumptions used to determine annual net periodicbenefit cost were:
2013 2012 2011
Discount rate 4.1% 4.8% 5.4%Long-term rate of compensation increase 4.1% 4.2% 4.2%Long-term rate of return on plan assets 8.5% 8.9% 8.9%
To determine the overall expected long-term rate ofreturn on plan assets, the Company models expectedreturns over a 20-year investment horizon with respectto the specific investment mix of its major plans. Thereturn assumptions used reflect a combination ofrigorous historical performance analysis and forward-looking views of the financial markets includingconsideration of current yields on long-term bonds,price-earnings ratios of the major stock marketindices, and long-term inflation. The U.S. model,which corresponds to approximately 68% ofconsolidated pension and other postretirement benefitplan assets, incorporates a long-term inflationassumption of 2.5% and an active managementpremium of 1% (net of fees) validated by historicalanalysis. Similar methods are used for various foreignplans with invested assets, reflecting local economicconditions. The expected rate of return for 2013 of8.5% equated to approximately the 60th percentileexpectation. Refer to Note 1.
To conduct the annual review of discount rates, theCompany selected the discount rate based on a cash-flow matching analysis using Towers Watson’sproprietary RATE:Link tool and projections of thefuture benefit payments that constitute the projectedbenefit obligation for the plans. RATE:Link establishesthe uniform discount rate that produces the samepresent value of the estimated future benefitpayments, as is generated by discounting each year’sbenefit payments by a spot rate applicable to thatyear. The spot rates used in this process are derivedfrom a yield curve created from yields on the 40th to90th percentile of U.S. high quality bonds. A similarmethodology is applied in Canada and Europe, exceptthe smaller bond markets imply that yields betweenthe 10th and 90th percentiles are preferable. Themeasurement dates for the defined benefit plans areconsistent with the Company’s fiscal year end.Accordingly, the Company selected discount rates tomeasure the benefit obligations consistent withmarket indices during December of each year.
Plan assetsThe Company categorized Plan assets within a threelevel fair value hierarchy described as follows:
Investments stated at fair value as determined byquoted market prices (Level 1) include:
Cash and cash equivalents: Value based on cost,which approximates fair value.
Corporate stock, common: Value based on the lastsales price on the primary exchange.
Investments stated at estimated fair value usingsignificant observable inputs (Level 2) include:
Cash and cash equivalents: Institutional short-terminvestment vehicles valued daily.
Mutual funds: Valued at the net asset value of sharesheld by the Plan at year end.
Collective trusts: Value based on the net asset valueof units held at year end.
Bonds: Value based on matrices or models frompricing vendors.
Limited partnerships: Value based on the ending netcapital account balance at year end.
Investments stated at estimated fair value usingsignificant unobservable inputs (Level 3) include:
Real Estate: Value based on the net asset value ofunits held at year end. The fair value of real estateholdings is based on market data including earningscapitalization, discounted cash flow analysis,comparable sales transactions or a combination ofthese methods.
Bonds: Value based on matrices or models frombrokerage firms. A limited number of the investmentsare in default.
The preceding methods described may produce a fairvalue calculation that may not be indicative of netrealizable value or reflective of future fair values.Furthermore, although the Company believes itsvaluation methods are appropriate and consistent withother market participants, the use of differentmethodologies or assumptions to determine the fairvalue of certain financial instruments could result in adifferent fair value measurement at the reportingdate.
The Company’s practice regarding the timing oftransfers between levels is to measure transfers in atthe beginning of the month and transfers out at theend of the month. For the year ended December 28,2013, the Company had no transfers between Levels1 and 2.
54
The fair value of Plan assets as of December 28, 2013summarized by level within the fair value hierarchy areas follows:
(millions)Total
Level 1Total
Level 2Total
Level 3 Total
Cash and cash equivalents $ 28 $ 83 $ — $ 111Corporate stock, common:
Domestic 576 — — 576International 297 — — 297
Mutual funds:International equity — 726 — 726International debt — 54 — 54
Collective trusts:Domestic equity — 737 — 737International equity — 982 — 982Eurozone sovereign
debt — 14 — 14Other international debt — 288 — 288
Limited partnerships — 468 — 468Bonds, corporate — 370 1 371Bonds, government — 123 — 123Bonds, other — 52 — 52Real estate — — 125 125Other — 82 8 90
Total $901 $3,979 $134 $5,014
The fair value of Plan assets at December 29, 2012 aresummarized as follows:
(millions)Total
Level 1Total
Level 2Total
Level 3 Total
Cash and cash equivalents $ 29 $ 32 $ — $ 61Corporate stock, common:
Domestic 466 — — 466International 259 — — 259
Mutual funds:International equity — 717 — 717International debt — 58 — 58
Collective trusts:Domestic equity — 535 — 535International equity — 920 — 920Eurozone sovereign debt — 17 — 17Other international debt — 274 — 274
Limited partnerships — 275 — 275Bonds, corporate — 441 — 441Bonds, government — 150 — 150Bonds, other — 66 — 66Real estate — — 115 115Other 4 7 9 20
Total $758 $3,492 $124 $4,374
There were no unfunded commitments to purchaseinvestments at December 28, 2013 or December 29,2012.
The Company’s investment strategy for its majordefined benefit plans is to maintain a diversifiedportfolio of asset classes with the primary goal ofmeeting long-term cash requirements as they becomedue. Assets are invested in a prudent manner tomaintain the security of funds while maximizingreturns within the Plan’s investment policy. Theinvestment policy specifies the type of investmentvehicles appropriate for the Plan, asset allocation
guidelines, criteria for the selection of investmentmanagers, procedures to monitor overall investmentperformance as well as investment managerperformance. It also provides guidelines enabling Planfiduciaries to fulfill their responsibilities.
The current weighted-average target asset allocationreflected by this strategy is: equity securities–72%;debt securities–22%; other–6%. Investment inCompany common stock represented 1.2% and 1.3%of consolidated plan assets at December 28, 2013 andDecember 29, 2012, respectively. Plan fundingstrategies are influenced by tax regulations andfunding requirements. The Company currently expectsto contribute approximately $43 million to its definedbenefit pension plans during 2014.
Level 3 gains and lossesChanges in the fair value of the Plan’s Level 3 assetsare summarized as follows:
(millions)Bonds,
corporateReal
estate Other Total
December 31, 2011 $ 1 $105 $ 6 $112Purchases — — 1 1Sales (1) — — (1)Realized and unrealized
gain — 6 2 8Transfer out — 4 — 4
December 29, 2012 $— $115 $ 9 $124Purchases 1 1 1 3Sales — — (1) (1)Realized and unrealized
gain — 8 — 8Currency translation — 1 (1) —
December 28, 2013 $ 1 $125 $ 8 $134
The net change in Level 3 assets includes a gainattributable to the change in unrealized holding gainsor losses related to Level 3 assets held atDecember 28, 2013 and December 29, 2012 totaling$8 million for both years.
Benefit paymentsThe following benefit payments, which reflectexpected future service, as appropriate, are expectedto be paid (in millions): 2014–$252; 2015–$418;2016–$263; 2017–$254; 2018–$263; 2019 to 2023–$1,498.
NOTE 9NONPENSION POSTRETIREMENT ANDPOSTEMPLOYMENT BENEFITS
PostretirementThe Company sponsors a number of plans to providehealth care and other welfare benefits to retiredemployees in the United States and Canada, who havemet certain age and service requirements. Themajority of these plans are funded or unfundeddefined benefit plans, although the Company doesparticipate in a limited number of multiemployer or
55
other defined contribution plans for certain employeegroups. The Company contributes to voluntaryemployee benefit association (VEBA) trusts to fundcertain U.S. retiree health and welfare benefitobligations.
Obligations and funded statusThe aggregate change in accumulated postretirementbenefit obligation, plan assets, and funded status ispresented in the following tables.
(millions) 2013 2012
Change in accumulated benefit obligationBeginning of year $1,323 $1,155Service cost 34 27Interest cost 50 53Actuarial (gain) loss (145) 115Benefits paid (56) (62)Curtailments 1 —Acquisitions — 34Foreign currency adjustments (5) 1
End of year $1,202 $1,323
Change in plan assetsFair value beginning of year $1,040 $ 965Actual return on plan assets 188 132Employer contributions 14 13Benefits paid (64) (70)
Fair value end of year $1,178 $1,040
Funded status $ (24) $ (283)
Amounts recognized in the ConsolidatedBalance Sheet consist of
Other non-current assets $ 47 $ —Other current liabilities (3) (2)Other liabilities (68) (281)
Net amount recognized $ (24) $ (283)
Amounts recognized in accumulated othercomprehensive income consist of
Prior service credit (1) (3)
Net amount recognized $ (1) $ (3)
ExpenseComponents of postretirement benefit expense(income) were:
(millions) 2013 2012 2011
Service cost $ 34 $ 27 $ 23Interest cost 50 53 62Expected return on plan assets (86) (84) (87)Amortization of unrecognized prior
service credit (3) (2) (3)Recognized net (gain) loss (247) 66 (16)Curtailment 1 — —
Postretirement benefit expense:Defined benefit plans (251) 60 (21)Defined contribution plans 13 13 14
Total $(238) $ 73 $ (7)
The estimated prior service cost credit that will beamortized from accumulated other comprehensiveincome into nonpension postretirement benefitexpense over the next fiscal year is expected to beapproximately $3 million.
See discussion in Note 3 regarding curtailmentexpense recognized in 2013.
AssumptionsThe weighted-average actuarial assumptions used todetermine benefit obligations were:
2013 2012 2011
Discount rate 4.8% 3.9% 4.6%
The weighted-average actuarial assumptions used todetermine annual net periodic benefit cost were:
2013 2012 2011
Discount rate 3.9% 4.6% 5.3%Long-term rate of return on plan assets 8.5% 8.9% 8.9%
The Company determines the overall discount rateand expected long-term rate of return on VEBA trustobligations and assets in the same manner as thatdescribed for pension trusts in Note 8.
The assumed health care cost trend rate is 5.3% for2014, decreasing gradually to 4.5% by the year 2017and remaining at that level thereafter. These trendrates reflect the Company’s historical experience andmanagement’s expectations regarding future trends.A one percentage point change in assumed healthcare cost trend rates would have the following effects:
(millions)One percentagepoint increase
One percentagepoint decrease
Effect on total of service andinterest cost components $ 11 $ (9)
Effect on postretirementbenefit obligation 132 (110)
Plan assetsThe fair value of Plan assets as of December 28, 2013summarized by level within fair value hierarchydescribed in Note 8, are as follows:
(millions)Total
Level 1Total
Level 2Total
Level 3 Total
Cash and cash equivalents $ 7 $ 39 $— $ 46Corporate stock, common:
Domestic 231 — — 231International 15 — — 15
Mutual funds:Domestic equity — 167 — 167International equity — 124 — 124Domestic debt — 57 — 57
Collective trusts:Domestic equity — 14 — 14International equity — 169 — 169
Limited partnerships — 169 — 169Bonds, corporate — 130 — 130Bonds, government — 39 — 39Bonds, other — 16 — 16Other — 1 — 1
Total $253 $925 $— $1,178
56
The fair value of Plan assets at December 29, 2012 aresummarized as follows:
(millions)Total
Level 1Total
Level 2Total
Level 3 Total
Cash and cash equivalents $ 5 $ 12 $— $ 17Corporate stock, common:
Domestic 174 — — 174International 18 — — 18
Mutual funds:Domestic equity — 63 — 63International equity — 161 — 161Domestic debt — 60 — 60
Collective trusts:Domestic equity — 126 — 126International equity — 110 — 110
Limited partnerships — 101 — 101Bonds, corporate — 142 — 142Bonds, government — 49 — 49Bonds, other — 17 — 17Other 2 — — 2
Total $199 $841 $— $1,040
The Company’s asset investment strategy for its VEBAtrusts is consistent with that described for its pensiontrusts in Note 8. The current target asset allocation is75% equity securities and 25% debt securities. TheCompany currently expects to contributeapproximately $14 million to its VEBA trusts during2014.
There were no Level 3 assets during 2013 and 2012.
PostemploymentUnder certain conditions, the Company providesbenefits to former or inactive employees, includingsalary continuance, severance, and long-termdisability, in the United States and several foreignlocations. The Company’s postemployment benefitplans are unfunded. Actuarial assumptions used aregenerally consistent with those presented for pensionbenefits in Note 8. The aggregate change inaccumulated postemployment benefit obligation andthe net amount recognized were:
(millions) 2013 2012
Change in accumulated benefit obligationBeginning of year $103 $ 93Service cost 7 7Interest cost 3 4Actuarial (gain) loss (17) 7Benefits paid (9) (8)
End of year $ 87 $ 103
Funded status $ (87) $(103)
Amounts recognized in the ConsolidatedBalance Sheet consist of
Other current liabilities $ (8) $ (10)Other liabilities (79) (93)
Net amount recognized $ (87) $(103)
Amounts recognized in accumulated othercomprehensive income consist of
Net experience loss $ 25 $ 46
Net amount recognized $ 25 $ 46
Components of postemployment benefit expensewere:
(millions) 2013 2012 2011
Service cost $ 7 $ 7 $ 6Interest cost 3 4 4Recognized net loss 5 5 5
Postemployment benefit expense $15 $16 $15
The estimated net experience loss that will beamortized from accumulated other comprehensiveincome into postemployment benefit expense over thenext fiscal year is approximately $3 million.
Benefit paymentsThe following benefit payments, which reflectexpected future service, as appropriate, are expectedto be paid:
(millions) Postretirement Postemployment
2014 $ 68 $ 82015 69 82016 70 72017 71 82018 72 82019-2023 385 41
NOTE 10MULTIEMPLOYER PENSION AND POSTRETIREMENTPLANS
The Company contributes to multiemployer definedcontribution pension and postretirement benefit plansunder the terms of collective-bargaining agreementsthat cover certain unionized employee groups in theUnited States. Contributions to these plans areincluded in total pension and postretirement benefitexpense as reported in Notes 8 and 9, respectively.
Pension benefitsThe risks of participating in multiemployer pensionplans are different from single-employer plans. Assetscontributed to a multiemployer plan by one employermay be used to provide benefits to employees of otherparticipating employers. If a participating employerstops contributing to the plan, the unfundedobligations of the plan are borne by the remainingparticipating employers.
57
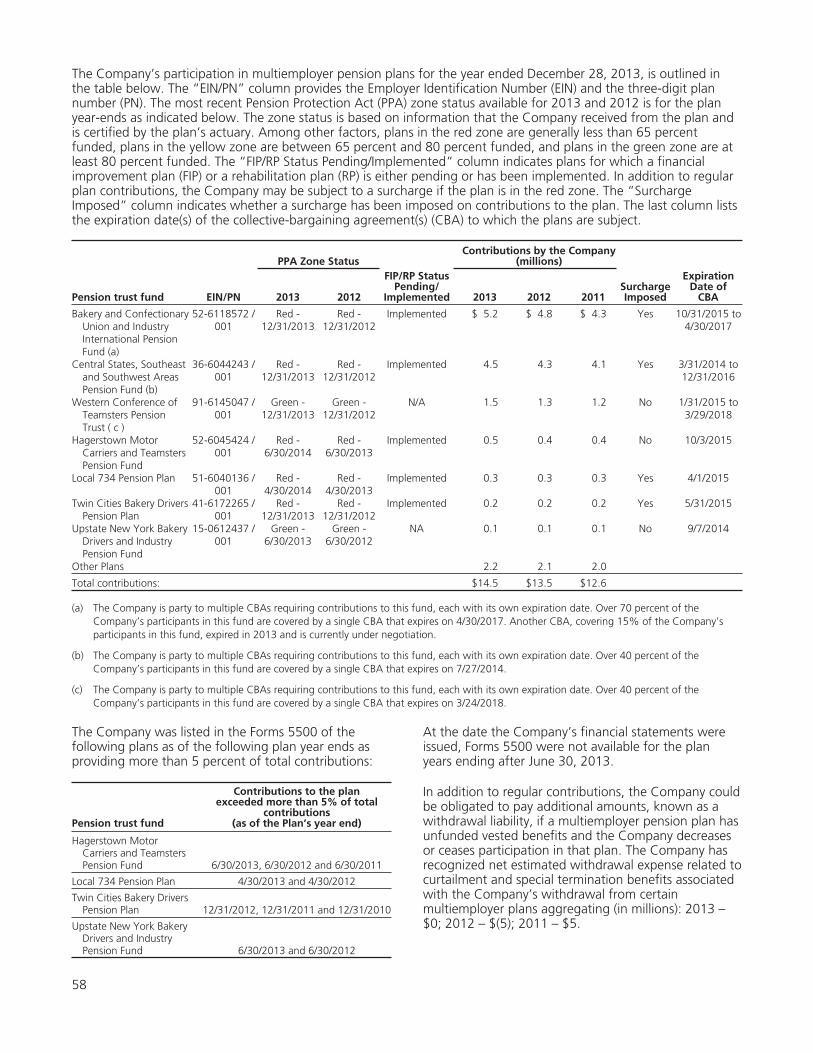
The Company’s participation in multiemployer pension plans for the year ended December 28, 2013, is outlined inthe table below. The “EIN/PN” column provides the Employer Identification Number (EIN) and the three-digit plannumber (PN). The most recent Pension Protection Act (PPA) zone status available for 2013 and 2012 is for the planyear-ends as indicated below. The zone status is based on information that the Company received from the plan andis certified by the plan’s actuary. Among other factors, plans in the red zone are generally less than 65 percentfunded, plans in the yellow zone are between 65 percent and 80 percent funded, and plans in the green zone are atleast 80 percent funded. The “FIP/RP Status Pending/Implemented” column indicates plans for which a financialimprovement plan (FIP) or a rehabilitation plan (RP) is either pending or has been implemented. In addition to regularplan contributions, the Company may be subject to a surcharge if the plan is in the red zone. The “SurchargeImposed” column indicates whether a surcharge has been imposed on contributions to the plan. The last column liststhe expiration date(s) of the collective-bargaining agreement(s) (CBA) to which the plans are subject.
PPA Zone StatusFIP/RP Status
Pending/Implemented
Contributions by the Company(millions)
Pension trust fund EIN/PN 2013 2012 2013 2012 2011SurchargeImposed
ExpirationDate of
CBA
Bakery and ConfectionaryUnion and IndustryInternational PensionFund (a)
52-6118572 /001
Red -12/31/2013
Red -12/31/2012
Implemented $ 5.2 $ 4.8 $ 4.3 Yes 10/31/2015 to4/30/2017
Central States, Southeastand Southwest AreasPension Fund (b)
36-6044243 /001
Red -12/31/2013
Red -12/31/2012
Implemented 4.5 4.3 4.1 Yes 3/31/2014 to12/31/2016
Western Conference ofTeamsters PensionTrust ( c )
91-6145047 /001
Green -12/31/2013
Green -12/31/2012
N/A 1.5 1.3 1.2 No 1/31/2015 to3/29/2018
Hagerstown MotorCarriers and TeamstersPension Fund
52-6045424 /001
Red -6/30/2014
Red -6/30/2013
Implemented 0.5 0.4 0.4 No 10/3/2015
Local 734 Pension Plan 51-6040136 /001
Red -4/30/2014
Red -4/30/2013
Implemented 0.3 0.3 0.3 Yes 4/1/2015
Twin Cities Bakery DriversPension Plan
41-6172265 /001
Red -12/31/2013
Red -12/31/2012
Implemented 0.2 0.2 0.2 Yes 5/31/2015
Upstate New York BakeryDrivers and IndustryPension Fund
15-0612437 /001
Green -6/30/2013
Green -6/30/2012
NA 0.1 0.1 0.1 No 9/7/2014
Other Plans 2.2 2.1 2.0
Total contributions: $14.5 $13.5 $12.6
(a) The Company is party to multiple CBAs requiring contributions to this fund, each with its own expiration date. Over 70 percent of theCompany’s participants in this fund are covered by a single CBA that expires on 4/30/2017. Another CBA, covering 15% of the Company’sparticipants in this fund, expired in 2013 and is currently under negotiation.
(b) The Company is party to multiple CBAs requiring contributions to this fund, each with its own expiration date. Over 40 percent of theCompany’s participants in this fund are covered by a single CBA that expires on 7/27/2014.
(c) The Company is party to multiple CBAs requiring contributions to this fund, each with its own expiration date. Over 40 percent of theCompany’s participants in this fund are covered by a single CBA that expires on 3/24/2018.
The Company was listed in the Forms 5500 of thefollowing plans as of the following plan year ends asproviding more than 5 percent of total contributions:
Pension trust fund
Contributions to the planexceeded more than 5% of total
contributions(as of the Plan’s year end)
Hagerstown MotorCarriers and TeamstersPension Fund 6/30/2013, 6/30/2012 and 6/30/2011
Local 734 Pension Plan 4/30/2013 and 4/30/2012
Twin Cities Bakery DriversPension Plan 12/31/2012, 12/31/2011 and 12/31/2010
Upstate New York BakeryDrivers and IndustryPension Fund 6/30/2013 and 6/30/2012
At the date the Company’s financial statements wereissued, Forms 5500 were not available for the planyears ending after June 30, 2013.
In addition to regular contributions, the Company couldbe obligated to pay additional amounts, known as awithdrawal liability, if a multiemployer pension plan hasunfunded vested benefits and the Company decreasesor ceases participation in that plan. The Company hasrecognized net estimated withdrawal expense related tocurtailment and special termination benefits associatedwith the Company’s withdrawal from certainmultiemployer plans aggregating (in millions): 2013 –$0; 2012 – $(5); 2011 – $5.
58
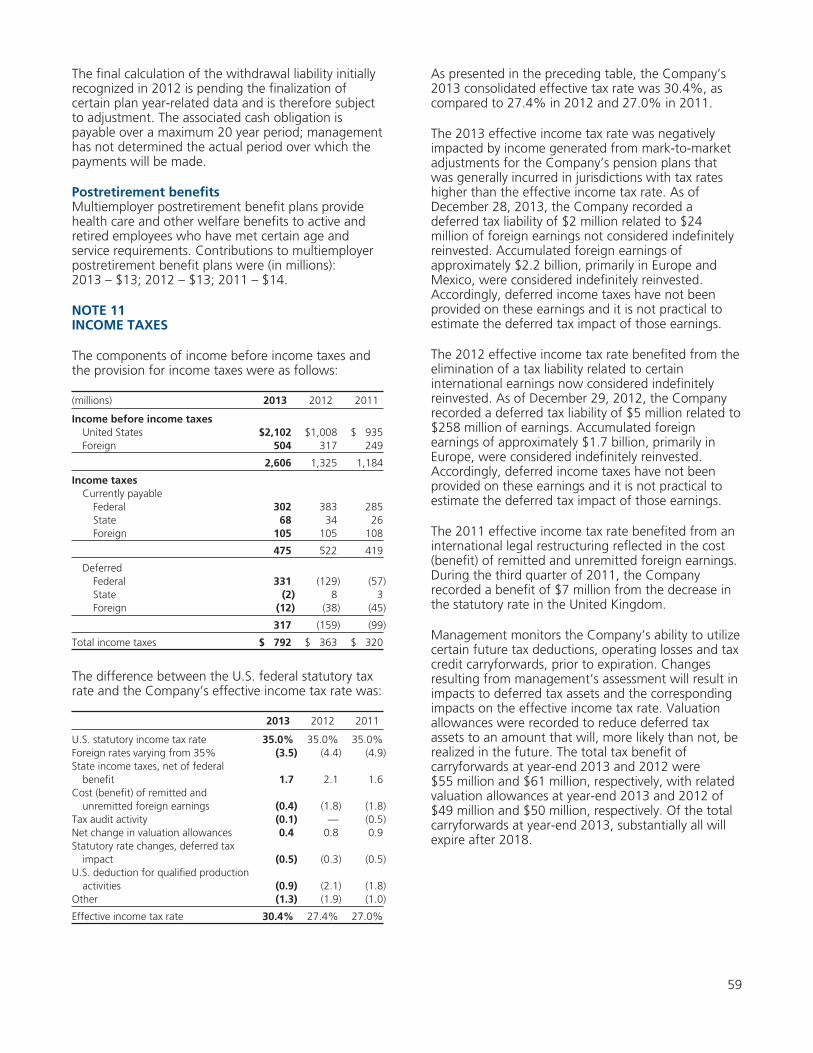
The final calculation of the withdrawal liability initiallyrecognized in 2012 is pending the finalization ofcertain plan year-related data and is therefore subjectto adjustment. The associated cash obligation ispayable over a maximum 20 year period; managementhas not determined the actual period over which thepayments will be made.
Postretirement benefitsMultiemployer postretirement benefit plans providehealth care and other welfare benefits to active andretired employees who have met certain age andservice requirements. Contributions to multiemployerpostretirement benefit plans were (in millions):2013 – $13; 2012 – $13; 2011 – $14.
NOTE 11INCOME TAXES
The components of income before income taxes andthe provision for income taxes were as follows:
(millions) 2013 2012 2011
Income before income taxesUnited States $2,102 $1,008 $ 935Foreign 504 317 249
2,606 1,325 1,184
Income taxesCurrently payable
Federal 302 383 285State 68 34 26Foreign 105 105 108
475 522 419
DeferredFederal 331 (129) (57)State (2) 8 3Foreign (12) (38) (45)
317 (159) (99)
Total income taxes $ 792 $ 363 $ 320
The difference between the U.S. federal statutory taxrate and the Company’s effective income tax rate was:
2013 2012 2011
U.S. statutory income tax rate 35.0% 35.0% 35.0%Foreign rates varying from 35% (3.5) (4.4) (4.9)State income taxes, net of federal
benefit 1.7 2.1 1.6Cost (benefit) of remitted and
unremitted foreign earnings (0.4) (1.8) (1.8)Tax audit activity (0.1) — (0.5)Net change in valuation allowances 0.4 0.8 0.9Statutory rate changes, deferred tax
impact (0.5) (0.3) (0.5)U.S. deduction for qualified production
activities (0.9) (2.1) (1.8)Other (1.3) (1.9) (1.0)
Effective income tax rate 30.4% 27.4% 27.0%
As presented in the preceding table, the Company’s2013 consolidated effective tax rate was 30.4%, ascompared to 27.4% in 2012 and 27.0% in 2011.
The 2013 effective income tax rate was negativelyimpacted by income generated from mark-to-marketadjustments for the Company’s pension plans thatwas generally incurred in jurisdictions with tax rateshigher than the effective income tax rate. As ofDecember 28, 2013, the Company recorded adeferred tax liability of $2 million related to $24million of foreign earnings not considered indefinitelyreinvested. Accumulated foreign earnings ofapproximately $2.2 billion, primarily in Europe andMexico, were considered indefinitely reinvested.Accordingly, deferred income taxes have not beenprovided on these earnings and it is not practical toestimate the deferred tax impact of those earnings.
The 2012 effective income tax rate benefited from theelimination of a tax liability related to certaininternational earnings now considered indefinitelyreinvested. As of December 29, 2012, the Companyrecorded a deferred tax liability of $5 million related to$258 million of earnings. Accumulated foreignearnings of approximately $1.7 billion, primarily inEurope, were considered indefinitely reinvested.Accordingly, deferred income taxes have not beenprovided on these earnings and it is not practical toestimate the deferred tax impact of those earnings.
The 2011 effective income tax rate benefited from aninternational legal restructuring reflected in the cost(benefit) of remitted and unremitted foreign earnings.During the third quarter of 2011, the Companyrecorded a benefit of $7 million from the decrease inthe statutory rate in the United Kingdom.
Management monitors the Company’s ability to utilizecertain future tax deductions, operating losses and taxcredit carryforwards, prior to expiration. Changesresulting from management’s assessment will result inimpacts to deferred tax assets and the correspondingimpacts on the effective income tax rate. Valuationallowances were recorded to reduce deferred taxassets to an amount that will, more likely than not, berealized in the future. The total tax benefit ofcarryforwards at year-end 2013 and 2012 were$55 million and $61 million, respectively, with relatedvaluation allowances at year-end 2013 and 2012 of$49 million and $50 million, respectively. Of the totalcarryforwards at year-end 2013, substantially all willexpire after 2018.
59
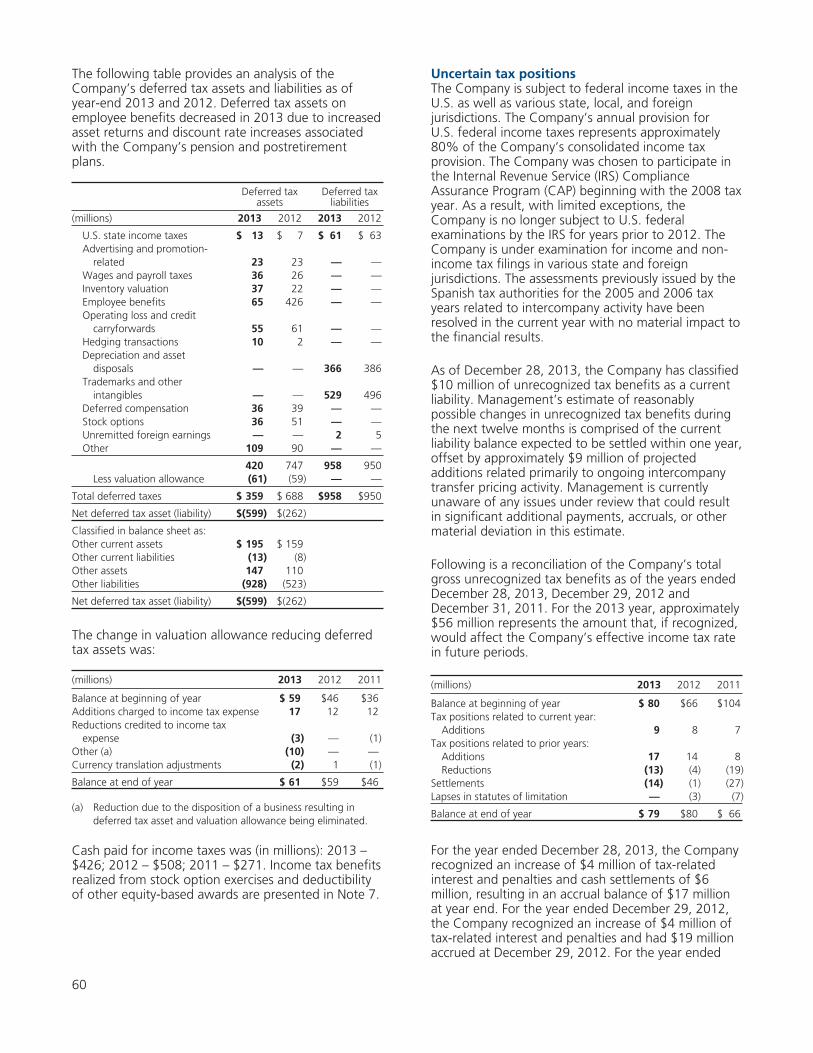
The following table provides an analysis of theCompany’s deferred tax assets and liabilities as ofyear-end 2013 and 2012. Deferred tax assets onemployee benefits decreased in 2013 due to increasedasset returns and discount rate increases associatedwith the Company’s pension and postretirementplans.
Deferred taxassets
Deferred taxliabilities
(millions) 2013 2012 2013 2012
U.S. state income taxes $ 13 $ 7 $ 61 $ 63Advertising and promotion-
related 23 23 — —Wages and payroll taxes 36 26 — —Inventory valuation 37 22 — —Employee benefits 65 426 — —Operating loss and credit
carryforwards 55 61 — —Hedging transactions 10 2 — —Depreciation and asset
disposals — — 366 386Trademarks and other
intangibles — — 529 496Deferred compensation 36 39 — —Stock options 36 51 — —Unremitted foreign earnings — — 2 5Other 109 90 — —
420 747 958 950Less valuation allowance (61) (59) — —
Total deferred taxes $ 359 $ 688 $958 $950
Net deferred tax asset (liability) $(599) $(262)
Classified in balance sheet as:Other current assets $ 195 $ 159Other current liabilities (13) (8)Other assets 147 110Other liabilities (928) (523)
Net deferred tax asset (liability) $(599) $(262)
The change in valuation allowance reducing deferredtax assets was:
(millions) 2013 2012 2011
Balance at beginning of year $ 59 $46 $36Additions charged to income tax expense 17 12 12Reductions credited to income tax
expense (3) — (1)Other (a) (10) — —Currency translation adjustments (2) 1 (1)
Balance at end of year $ 61 $59 $46
(a) Reduction due to the disposition of a business resulting indeferred tax asset and valuation allowance being eliminated.
Cash paid for income taxes was (in millions): 2013 –$426; 2012 – $508; 2011 – $271. Income tax benefitsrealized from stock option exercises and deductibilityof other equity-based awards are presented in Note 7.
Uncertain tax positionsThe Company is subject to federal income taxes in theU.S. as well as various state, local, and foreignjurisdictions. The Company’s annual provision forU.S. federal income taxes represents approximately80% of the Company’s consolidated income taxprovision. The Company was chosen to participate inthe Internal Revenue Service (IRS) ComplianceAssurance Program (CAP) beginning with the 2008 taxyear. As a result, with limited exceptions, theCompany is no longer subject to U.S. federalexaminations by the IRS for years prior to 2012. TheCompany is under examination for income and non-income tax filings in various state and foreignjurisdictions. The assessments previously issued by theSpanish tax authorities for the 2005 and 2006 taxyears related to intercompany activity have beenresolved in the current year with no material impact tothe financial results.
As of December 28, 2013, the Company has classified$10 million of unrecognized tax benefits as a currentliability. Management’s estimate of reasonablypossible changes in unrecognized tax benefits duringthe next twelve months is comprised of the currentliability balance expected to be settled within one year,offset by approximately $9 million of projectedadditions related primarily to ongoing intercompanytransfer pricing activity. Management is currentlyunaware of any issues under review that could resultin significant additional payments, accruals, or othermaterial deviation in this estimate.
Following is a reconciliation of the Company’s totalgross unrecognized tax benefits as of the years endedDecember 28, 2013, December 29, 2012 andDecember 31, 2011. For the 2013 year, approximately$56 million represents the amount that, if recognized,would affect the Company’s effective income tax ratein future periods.
(millions) 2013 2012 2011
Balance at beginning of year $ 80 $66 $104Tax positions related to current year:
Additions 9 8 7Tax positions related to prior years:
Additions 17 14 8Reductions (13) (4) (19)
Settlements (14) (1) (27)Lapses in statutes of limitation — (3) (7)
Balance at end of year $ 79 $80 $ 66
For the year ended December 28, 2013, the Companyrecognized an increase of $4 million of tax-relatedinterest and penalties and cash settlements of $6million, resulting in an accrual balance of $17 millionat year end. For the year ended December 29, 2012,the Company recognized an increase of $4 million oftax-related interest and penalties and had $19 millionaccrued at December 29, 2012. For the year ended
60
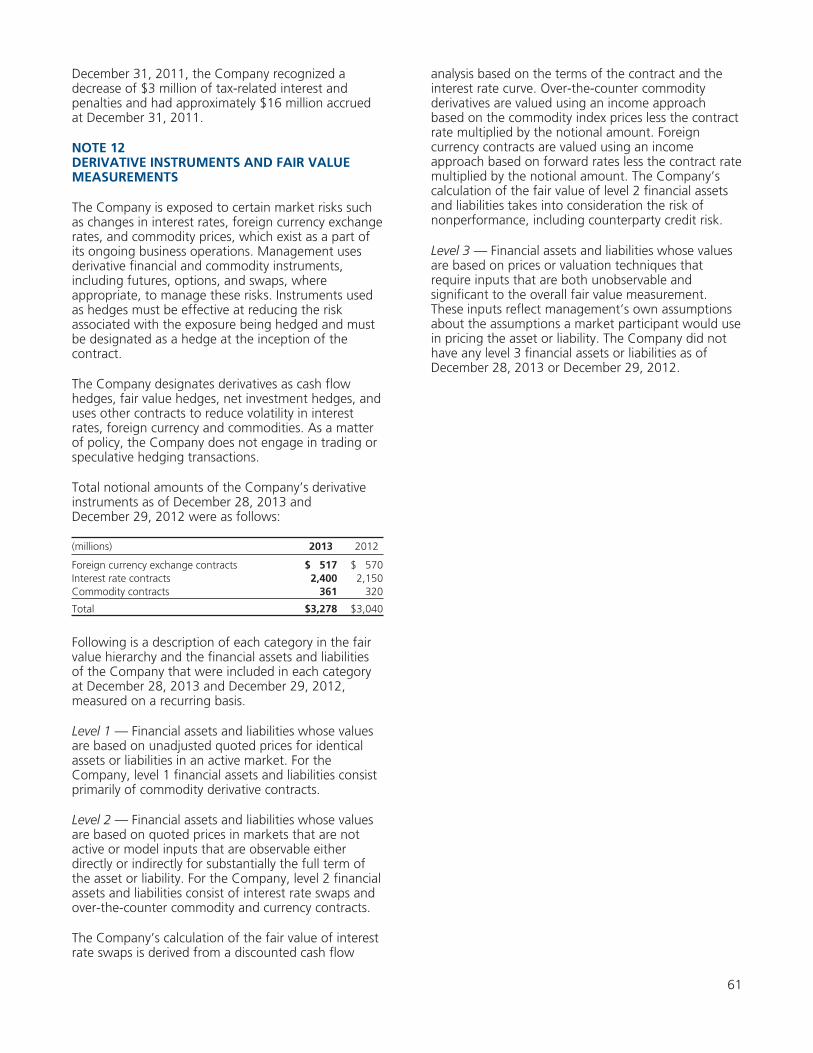
December 31, 2011, the Company recognized adecrease of $3 million of tax-related interest andpenalties and had approximately $16 million accruedat December 31, 2011.
NOTE 12DERIVATIVE INSTRUMENTS AND FAIR VALUEMEASUREMENTS
The Company is exposed to certain market risks suchas changes in interest rates, foreign currency exchangerates, and commodity prices, which exist as a part ofits ongoing business operations. Management usesderivative financial and commodity instruments,including futures, options, and swaps, whereappropriate, to manage these risks. Instruments usedas hedges must be effective at reducing the riskassociated with the exposure being hedged and mustbe designated as a hedge at the inception of thecontract.
The Company designates derivatives as cash flowhedges, fair value hedges, net investment hedges, anduses other contracts to reduce volatility in interestrates, foreign currency and commodities. As a matterof policy, the Company does not engage in trading orspeculative hedging transactions.
Total notional amounts of the Company’s derivativeinstruments as of December 28, 2013 andDecember 29, 2012 were as follows:
(millions) 2013 2012
Foreign currency exchange contracts $ 517 $ 570Interest rate contracts 2,400 2,150Commodity contracts 361 320
Total $3,278 $3,040
Following is a description of each category in the fairvalue hierarchy and the financial assets and liabilitiesof the Company that were included in each categoryat December 28, 2013 and December 29, 2012,measured on a recurring basis.
Level 1 — Financial assets and liabilities whose valuesare based on unadjusted quoted prices for identicalassets or liabilities in an active market. For theCompany, level 1 financial assets and liabilities consistprimarily of commodity derivative contracts.
Level 2 — Financial assets and liabilities whose valuesare based on quoted prices in markets that are notactive or model inputs that are observable eitherdirectly or indirectly for substantially the full term ofthe asset or liability. For the Company, level 2 financialassets and liabilities consist of interest rate swaps andover-the-counter commodity and currency contracts.
The Company’s calculation of the fair value of interestrate swaps is derived from a discounted cash flow
analysis based on the terms of the contract and theinterest rate curve. Over-the-counter commodityderivatives are valued using an income approachbased on the commodity index prices less the contractrate multiplied by the notional amount. Foreigncurrency contracts are valued using an incomeapproach based on forward rates less the contract ratemultiplied by the notional amount. The Company’scalculation of the fair value of level 2 financial assetsand liabilities takes into consideration the risk ofnonperformance, including counterparty credit risk.
Level 3 — Financial assets and liabilities whose valuesare based on prices or valuation techniques thatrequire inputs that are both unobservable andsignificant to the overall fair value measurement.These inputs reflect management’s own assumptionsabout the assumptions a market participant would usein pricing the asset or liability. The Company did nothave any level 3 financial assets or liabilities as ofDecember 28, 2013 or December 29, 2012.
61
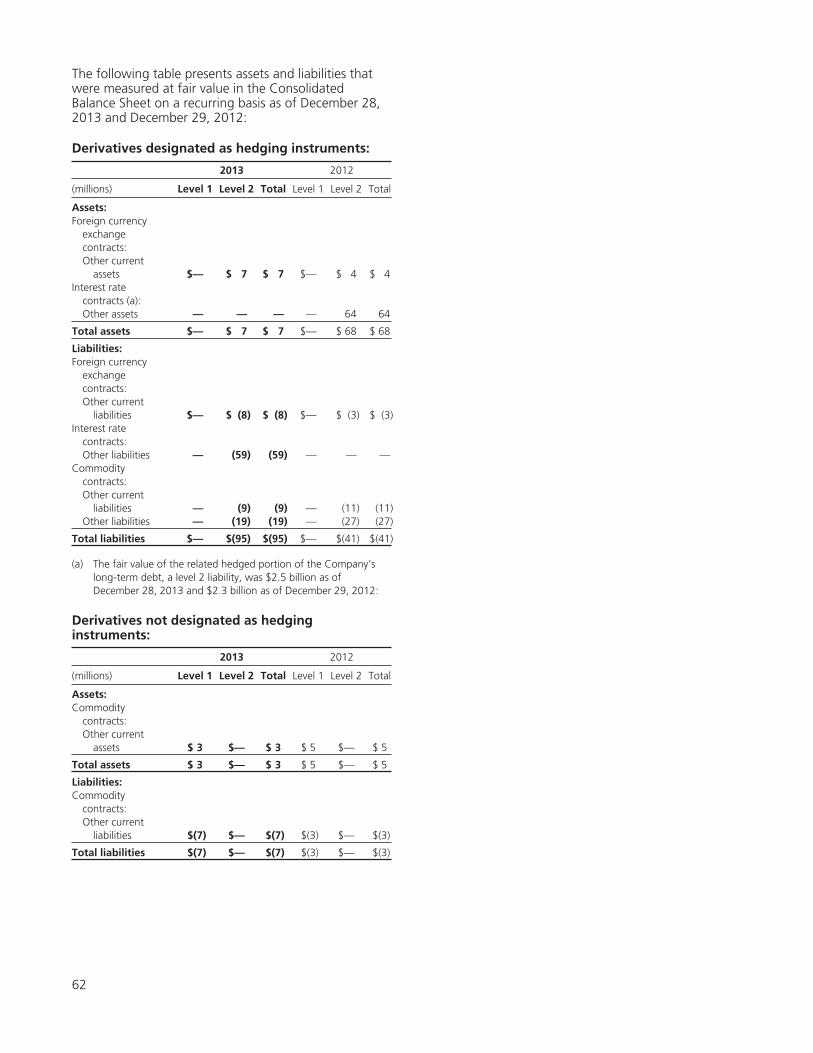
The following table presents assets and liabilities thatwere measured at fair value in the ConsolidatedBalance Sheet on a recurring basis as of December 28,2013 and December 29, 2012:
Derivatives designated as hedging instruments:
2013 2012
(millions) Level 1 Level 2 Total Level 1 Level 2 Total
Assets:Foreign currency
exchangecontracts:Other current
assets $— $ 7 $ 7 $— $ 4 $ 4Interest rate
contracts (a):Other assets — — — — 64 64
Total assets $— $ 7 $ 7 $— $ 68 $ 68
Liabilities:Foreign currency
exchangecontracts:Other current
liabilities $— $ (8) $ (8) $— $ (3) $ (3)Interest rate
contracts:Other liabilities — (59) (59) — — —
Commoditycontracts:Other current
liabilities — (9) (9) — (11) (11)Other liabilities — (19) (19) — (27) (27)
Total liabilities $— $(95) $(95) $— $(41) $(41)
(a) The fair value of the related hedged portion of the Company’slong-term debt, a level 2 liability, was $2.5 billion as ofDecember 28, 2013 and $2.3 billion as of December 29, 2012:
Derivatives not designated as hedginginstruments:
2013 2012
(millions) Level 1 Level 2 Total Level 1 Level 2 Total
Assets:Commodity
contracts:Other current
assets $ 3 $— $ 3 $ 5 $— $ 5
Total assets $ 3 $— $ 3 $ 5 $— $ 5
Liabilities:Commodity
contracts:Other current
liabilities $(7) $— $(7) $(3) $— $(3)
Total liabilities $(7) $— $(7) $(3) $— $(3)
62
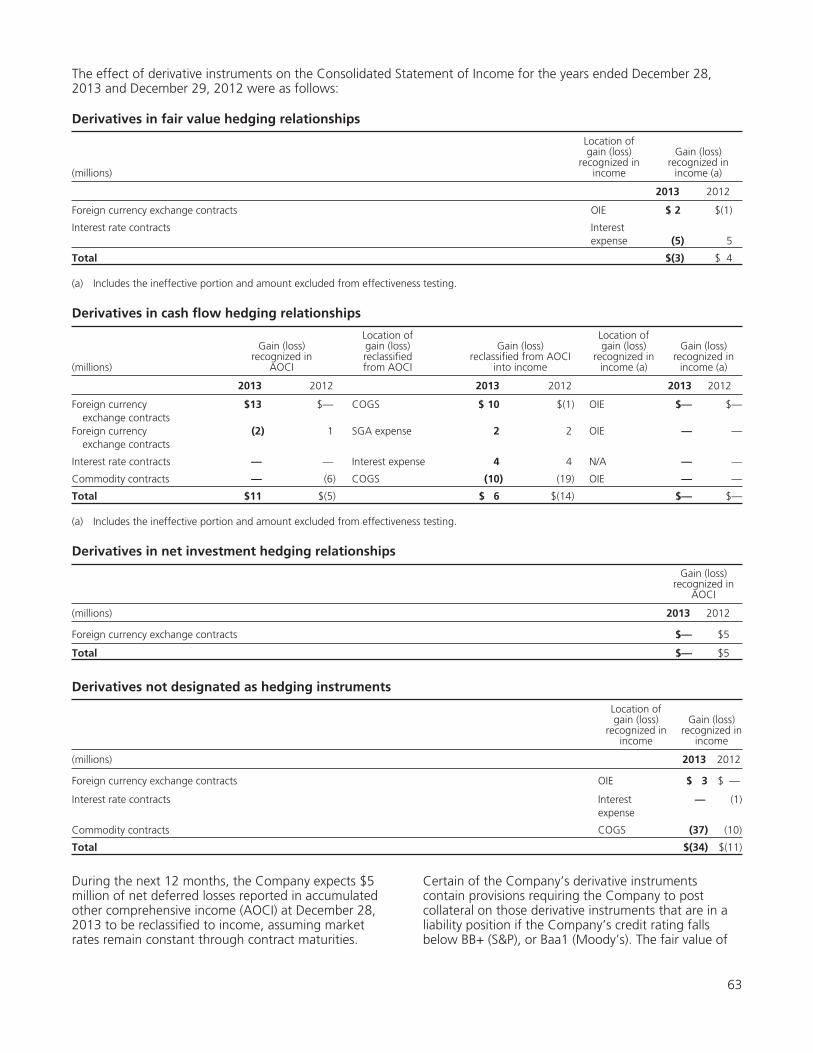
The effect of derivative instruments on the Consolidated Statement of Income for the years ended December 28,2013 and December 29, 2012 were as follows:
Derivatives in fair value hedging relationships
(millions)
Location ofgain (loss)
recognized inincome
Gain (loss)recognized in
income (a)
2013 2012
Foreign currency exchange contracts OIE $ 2 $(1)
Interest rate contracts Interestexpense (5) 5
Total $(3) $ 4
(a) Includes the ineffective portion and amount excluded from effectiveness testing.
Derivatives in cash flow hedging relationships
(millions)
Gain (loss)recognized in
AOCI
Location ofgain (loss)reclassifiedfrom AOCI
Gain (loss)reclassified from AOCI
into income
Location ofgain (loss)
recognized inincome (a)
Gain (loss)recognized in
income (a)
2013 2012 2013 2012 2013 2012
Foreign currencyexchange contracts
$13 $— COGS $ 10 $(1) OIE $— $—
Foreign currencyexchange contracts
(2) 1 SGA expense 2 2 OIE — —
Interest rate contracts — — Interest expense 4 4 N/A — —
Commodity contracts — (6) COGS (10) (19) OIE — —
Total $11 $(5) $ 6 $(14) $— $—
(a) Includes the ineffective portion and amount excluded from effectiveness testing.
Derivatives in net investment hedging relationships
Gain (loss)recognized in
AOCI
(millions) 2013 2012
Foreign currency exchange contracts $— $5
Total $— $5
Derivatives not designated as hedging instruments
Location ofgain (loss)
recognized inincome
Gain (loss)recognized in
income
(millions) 2013 2012
Foreign currency exchange contracts OIE $ 3 $ —
Interest rate contracts Interestexpense
— (1)
Commodity contracts COGS (37) (10)
Total $(34) $(11)
During the next 12 months, the Company expects $5million of net deferred losses reported in accumulatedother comprehensive income (AOCI) at December 28,2013 to be reclassified to income, assuming marketrates remain constant through contract maturities.
Certain of the Company’s derivative instrumentscontain provisions requiring the Company to postcollateral on those derivative instruments that are in aliability position if the Company’s credit rating fallsbelow BB+ (S&P), or Baa1 (Moody’s). The fair value of
63
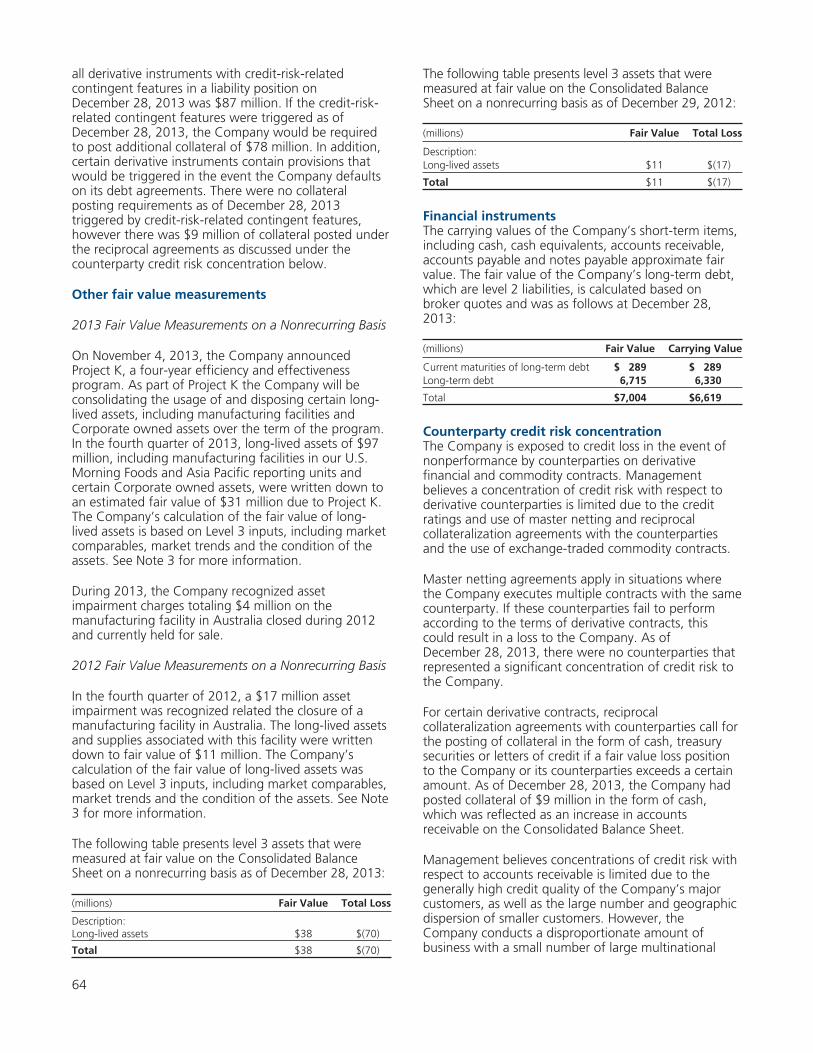
all derivative instruments with credit-risk-relatedcontingent features in a liability position onDecember 28, 2013 was $87 million. If the credit-risk-related contingent features were triggered as ofDecember 28, 2013, the Company would be requiredto post additional collateral of $78 million. In addition,certain derivative instruments contain provisions thatwould be triggered in the event the Company defaultson its debt agreements. There were no collateralposting requirements as of December 28, 2013triggered by credit-risk-related contingent features,however there was $9 million of collateral posted underthe reciprocal agreements as discussed under thecounterparty credit risk concentration below.
Other fair value measurements
2013 Fair Value Measurements on a Nonrecurring Basis
On November 4, 2013, the Company announcedProject K, a four-year efficiency and effectivenessprogram. As part of Project K the Company will beconsolidating the usage of and disposing certain long-lived assets, including manufacturing facilities andCorporate owned assets over the term of the program.In the fourth quarter of 2013, long-lived assets of $97million, including manufacturing facilities in our U.S.Morning Foods and Asia Pacific reporting units andcertain Corporate owned assets, were written down toan estimated fair value of $31 million due to Project K.The Company’s calculation of the fair value of long-lived assets is based on Level 3 inputs, including marketcomparables, market trends and the condition of theassets. See Note 3 for more information.
During 2013, the Company recognized assetimpairment charges totaling $4 million on themanufacturing facility in Australia closed during 2012and currently held for sale.
2012 Fair Value Measurements on a Nonrecurring Basis
In the fourth quarter of 2012, a $17 million assetimpairment was recognized related the closure of amanufacturing facility in Australia. The long-lived assetsand supplies associated with this facility were writtendown to fair value of $11 million. The Company’scalculation of the fair value of long-lived assets wasbased on Level 3 inputs, including market comparables,market trends and the condition of the assets. See Note3 for more information.
The following table presents level 3 assets that weremeasured at fair value on the Consolidated BalanceSheet on a nonrecurring basis as of December 28, 2013:
(millions) Fair Value Total Loss
Description:Long-lived assets $38 $(70)
Total $38 $(70)
The following table presents level 3 assets that weremeasured at fair value on the Consolidated BalanceSheet on a nonrecurring basis as of December 29, 2012:
(millions) Fair Value Total Loss
Description:Long-lived assets $11 $(17)
Total $11 $(17)
Financial instrumentsThe carrying values of the Company’s short-term items,including cash, cash equivalents, accounts receivable,accounts payable and notes payable approximate fairvalue. The fair value of the Company’s long-term debt,which are level 2 liabilities, is calculated based onbroker quotes and was as follows at December 28,2013:
(millions) Fair Value Carrying Value
Current maturities of long-term debt $ 289 $ 289Long-term debt 6,715 6,330
Total $7,004 $6,619
Counterparty credit risk concentrationThe Company is exposed to credit loss in the event ofnonperformance by counterparties on derivativefinancial and commodity contracts. Managementbelieves a concentration of credit risk with respect toderivative counterparties is limited due to the creditratings and use of master netting and reciprocalcollateralization agreements with the counterpartiesand the use of exchange-traded commodity contracts.
Master netting agreements apply in situations wherethe Company executes multiple contracts with the samecounterparty. If these counterparties fail to performaccording to the terms of derivative contracts, thiscould result in a loss to the Company. As ofDecember 28, 2013, there were no counterparties thatrepresented a significant concentration of credit risk tothe Company.
For certain derivative contracts, reciprocalcollateralization agreements with counterparties call forthe posting of collateral in the form of cash, treasurysecurities or letters of credit if a fair value loss positionto the Company or its counterparties exceeds a certainamount. As of December 28, 2013, the Company hadposted collateral of $9 million in the form of cash,which was reflected as an increase in accountsreceivable on the Consolidated Balance Sheet.
Management believes concentrations of credit risk withrespect to accounts receivable is limited due to thegenerally high credit quality of the Company’s majorcustomers, as well as the large number and geographicdispersion of smaller customers. However, theCompany conducts a disproportionate amount ofbusiness with a small number of large multinational
64
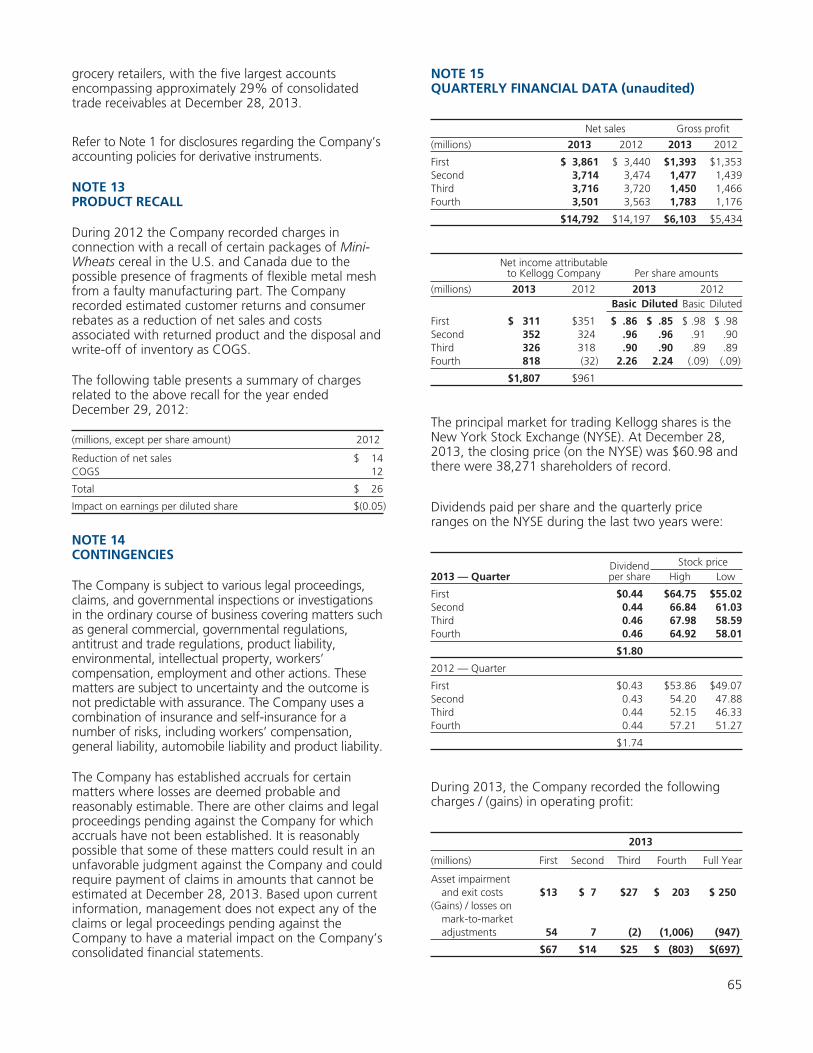
grocery retailers, with the five largest accountsencompassing approximately 29% of consolidatedtrade receivables at December 28, 2013.
Refer to Note 1 for disclosures regarding the Company’saccounting policies for derivative instruments.
NOTE 13PRODUCT RECALL
During 2012 the Company recorded charges inconnection with a recall of certain packages of Mini-Wheats cereal in the U.S. and Canada due to thepossible presence of fragments of flexible metal meshfrom a faulty manufacturing part. The Companyrecorded estimated customer returns and consumerrebates as a reduction of net sales and costsassociated with returned product and the disposal andwrite-off of inventory as COGS.
The following table presents a summary of chargesrelated to the above recall for the year endedDecember 29, 2012:
(millions, except per share amount) 2012
Reduction of net sales $ 14COGS 12
Total $ 26
Impact on earnings per diluted share $(0.05)
NOTE 14CONTINGENCIES
The Company is subject to various legal proceedings,claims, and governmental inspections or investigationsin the ordinary course of business covering matters suchas general commercial, governmental regulations,antitrust and trade regulations, product liability,environmental, intellectual property, workers’compensation, employment and other actions. Thesematters are subject to uncertainty and the outcome isnot predictable with assurance. The Company uses acombination of insurance and self-insurance for anumber of risks, including workers’ compensation,general liability, automobile liability and product liability.
The Company has established accruals for certainmatters where losses are deemed probable andreasonably estimable. There are other claims and legalproceedings pending against the Company for whichaccruals have not been established. It is reasonablypossible that some of these matters could result in anunfavorable judgment against the Company and couldrequire payment of claims in amounts that cannot beestimated at December 28, 2013. Based upon currentinformation, management does not expect any of theclaims or legal proceedings pending against theCompany to have a material impact on the Company’sconsolidated financial statements.
NOTE 15QUARTERLY FINANCIAL DATA (unaudited)
Net sales Gross profit
(millions) 2013 2012 2013 2012
First $ 3,861 $ 3,440 $1,393 $1,353Second 3,714 3,474 1,477 1,439Third 3,716 3,720 1,450 1,466Fourth 3,501 3,563 1,783 1,176
$14,792 $14,197 $6,103 $5,434
Net income attributableto Kellogg Company Per share amounts
(millions) 2013 2012 2013 2012Basic Diluted Basic Diluted
First $ 311 $351 $ .86 $ .85 $ .98 $ .98Second 352 324 .96 .96 .91 .90Third 326 318 .90 .90 .89 .89Fourth 818 (32) 2.26 2.24 (.09) (.09)
$1,807 $961
The principal market for trading Kellogg shares is theNew York Stock Exchange (NYSE). At December 28,2013, the closing price (on the NYSE) was $60.98 andthere were 38,271 shareholders of record.
Dividends paid per share and the quarterly priceranges on the NYSE during the last two years were:
2013 — QuarterDividendper share
Stock priceHigh Low
First $0.44 $64.75 $55.02Second 0.44 66.84 61.03Third 0.46 67.98 58.59Fourth 0.46 64.92 58.01
$1.80
2012 — Quarter
First $0.43 $53.86 $49.07Second 0.43 54.20 47.88Third 0.44 52.15 46.33Fourth 0.44 57.21 51.27
$1.74
During 2013, the Company recorded the followingcharges / (gains) in operating profit:
2013
(millions) First Second Third Fourth Full Year
Asset impairmentand exit costs $13 $ 7 $27 $ 203 $ 250
(Gains) / losses onmark-to-marketadjustments 54 7 (2) (1,006) (947)
$67 $14 $25 $ (803) $(697)
65
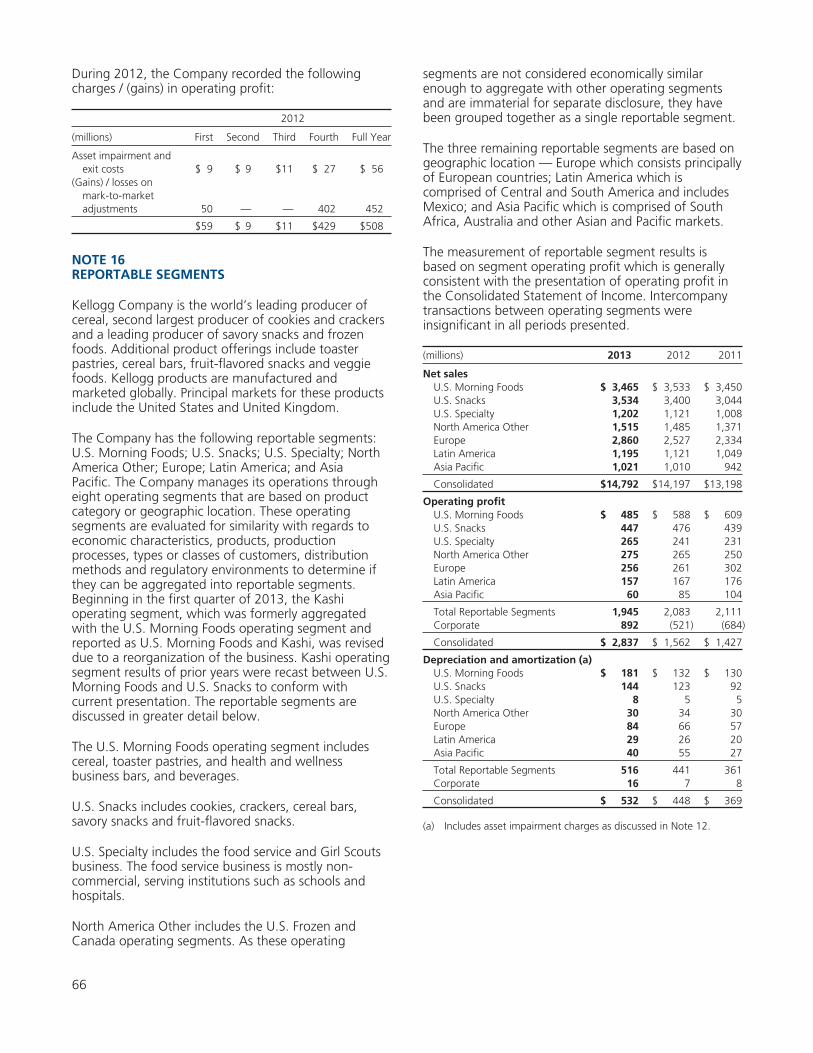
During 2012, the Company recorded the followingcharges / (gains) in operating profit:
2012
(millions) First Second Third Fourth Full Year
Asset impairment andexit costs $ 9 $ 9 $11 $ 27 $ 56
(Gains) / losses onmark-to-marketadjustments 50 — — 402 452
$59 $ 9 $11 $429 $508
NOTE 16REPORTABLE SEGMENTS
Kellogg Company is the world’s leading producer ofcereal, second largest producer of cookies and crackersand a leading producer of savory snacks and frozenfoods. Additional product offerings include toasterpastries, cereal bars, fruit-flavored snacks and veggiefoods. Kellogg products are manufactured andmarketed globally. Principal markets for these productsinclude the United States and United Kingdom.
The Company has the following reportable segments:U.S. Morning Foods; U.S. Snacks; U.S. Specialty; NorthAmerica Other; Europe; Latin America; and AsiaPacific. The Company manages its operations througheight operating segments that are based on productcategory or geographic location. These operatingsegments are evaluated for similarity with regards toeconomic characteristics, products, productionprocesses, types or classes of customers, distributionmethods and regulatory environments to determine ifthey can be aggregated into reportable segments.Beginning in the first quarter of 2013, the Kashioperating segment, which was formerly aggregatedwith the U.S. Morning Foods operating segment andreported as U.S. Morning Foods and Kashi, was reviseddue to a reorganization of the business. Kashi operatingsegment results of prior years were recast between U.S.Morning Foods and U.S. Snacks to conform withcurrent presentation. The reportable segments arediscussed in greater detail below.
The U.S. Morning Foods operating segment includescereal, toaster pastries, and health and wellnessbusiness bars, and beverages.
U.S. Snacks includes cookies, crackers, cereal bars,savory snacks and fruit-flavored snacks.
U.S. Specialty includes the food service and Girl Scoutsbusiness. The food service business is mostly non-commercial, serving institutions such as schools andhospitals.
North America Other includes the U.S. Frozen andCanada operating segments. As these operating
segments are not considered economically similarenough to aggregate with other operating segmentsand are immaterial for separate disclosure, they havebeen grouped together as a single reportable segment.
The three remaining reportable segments are based ongeographic location — Europe which consists principallyof European countries; Latin America which iscomprised of Central and South America and includesMexico; and Asia Pacific which is comprised of SouthAfrica, Australia and other Asian and Pacific markets.
The measurement of reportable segment results isbased on segment operating profit which is generallyconsistent with the presentation of operating profit inthe Consolidated Statement of Income. Intercompanytransactions between operating segments wereinsignificant in all periods presented.
(millions) 2013 2012 2011
Net salesU.S. Morning Foods $ 3,465 $ 3,533 $ 3,450U.S. Snacks 3,534 3,400 3,044U.S. Specialty 1,202 1,121 1,008North America Other 1,515 1,485 1,371Europe 2,860 2,527 2,334Latin America 1,195 1,121 1,049Asia Pacific 1,021 1,010 942
Consolidated $14,792 $14,197 $13,198
Operating profitU.S. Morning Foods $ 485 $ 588 $ 609U.S. Snacks 447 476 439U.S. Specialty 265 241 231North America Other 275 265 250Europe 256 261 302Latin America 157 167 176Asia Pacific 60 85 104
Total Reportable Segments 1,945 2,083 2,111Corporate 892 (521) (684)
Consolidated $ 2,837 $ 1,562 $ 1,427
Depreciation and amortization (a)U.S. Morning Foods $ 181 $ 132 $ 130U.S. Snacks 144 123 92U.S. Specialty 8 5 5North America Other 30 34 30Europe 84 66 57Latin America 29 26 20Asia Pacific 40 55 27
Total Reportable Segments 516 441 361Corporate 16 7 8
Consolidated $ 532 $ 448 $ 369
(a) Includes asset impairment charges as discussed in Note 12.
66
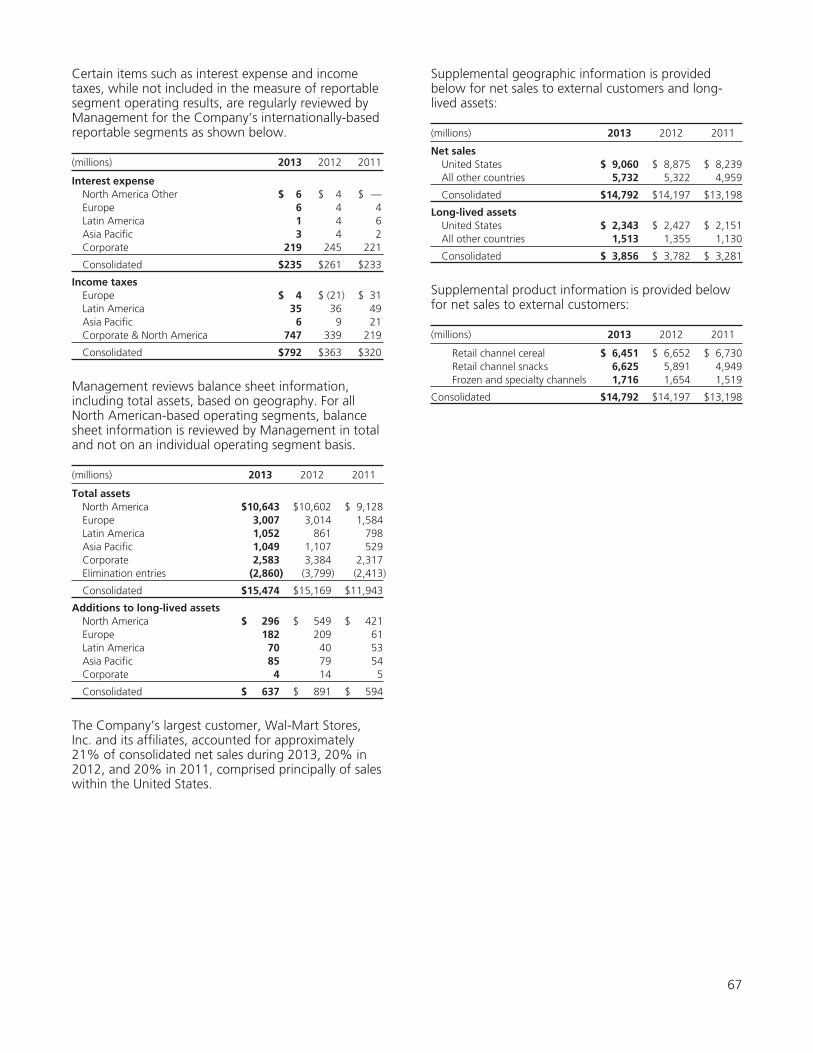
Certain items such as interest expense and incometaxes, while not included in the measure of reportablesegment operating results, are regularly reviewed byManagement for the Company’s internationally-basedreportable segments as shown below.
(millions) 2013 2012 2011
Interest expenseNorth America Other $ 6 $ 4 $ —Europe 6 4 4Latin America 1 4 6Asia Pacific 3 4 2Corporate 219 245 221
Consolidated $235 $261 $233
Income taxesEurope $ 4 $ (21) $ 31Latin America 35 36 49Asia Pacific 6 9 21Corporate & North America 747 339 219
Consolidated $792 $363 $320
Management reviews balance sheet information,including total assets, based on geography. For allNorth American-based operating segments, balancesheet information is reviewed by Management in totaland not on an individual operating segment basis.
(millions) 2013 2012 2011
Total assetsNorth America $10,643 $10,602 $ 9,128Europe 3,007 3,014 1,584Latin America 1,052 861 798Asia Pacific 1,049 1,107 529Corporate 2,583 3,384 2,317Elimination entries (2,860) (3,799) (2,413)
Consolidated $15,474 $15,169 $11,943
Additions to long-lived assetsNorth America $ 296 $ 549 $ 421Europe 182 209 61Latin America 70 40 53Asia Pacific 85 79 54Corporate 4 14 5
Consolidated $ 637 $ 891 $ 594
The Company’s largest customer, Wal-Mart Stores,Inc. and its affiliates, accounted for approximately21% of consolidated net sales during 2013, 20% in2012, and 20% in 2011, comprised principally of saleswithin the United States.
Supplemental geographic information is providedbelow for net sales to external customers and long-lived assets:
(millions) 2013 2012 2011
Net salesUnited States $ 9,060 $ 8,875 $ 8,239All other countries 5,732 5,322 4,959
Consolidated $14,792 $14,197 $13,198
Long-lived assetsUnited States $ 2,343 $ 2,427 $ 2,151All other countries 1,513 1,355 1,130
Consolidated $ 3,856 $ 3,782 $ 3,281
Supplemental product information is provided belowfor net sales to external customers:
(millions) 2013 2012 2011
Retail channel cereal $ 6,451 $ 6,652 $ 6,730Retail channel snacks 6,625 5,891 4,949Frozen and specialty channels 1,716 1,654 1,519
Consolidated $14,792 $14,197 $13,198
67

NOTE 17SUPPLEMENTAL FINANCIAL STATEMENT DATA
Consolidated Statement of Income(millions) 2013 2012 2011
Research and development expense $ 199 $ 206 $ 192Advertising expense $1,131 $1,120 $1,138
Consolidated Balance Sheet(millions) 2013 2012
Trade receivables $ 1,231 $ 1,185Allowance for doubtful accounts (5) (6)Refundable income taxes 52 68Other receivables 146 207
Accounts receivable, net $ 1,424 $ 1,454
Raw materials and supplies $ 319 $ 300Finished goods and materials in process 929 1,065
Inventories $ 1,248 $ 1,365
Deferred income taxes $ 195 $ 152Other prepaid assets 127 128
Other current assets $ 322 $ 280
Land $ 125 $ 117Buildings 2,155 2,084Machinery and equipment 6,059 5,978Capitalized software 325 279Construction in progress 693 533Accumulated depreciation (5,501) (5,209)
Property, net $ 3,856 $ 3,782
Other intangibles $ 2,429 $ 2,412Accumulated amortization (62) (53)
Other intangibles, net $ 2,367 $ 2,359
Pension $ 419 $ 145Other 514 465
Other assets $ 933 $ 610
Accrued income taxes $ 69 $ 46Accrued salaries and wages 327 266Accrued advertising and promotion 476 517Other 503 472
Other current liabilities $ 1,375 $ 1,301
Nonpension postretirement benefits $ 68 $ 281Other 429 409
Other liabilities $ 497 $ 690
Allowance for doubtful accounts(millions) 2013 2012 2011
Balance at beginning of year $ 6 $ 8 $10Additions charged to expense 2 1 —Doubtful accounts charged to reserve (3) (3) (2)
Balance at end of year $ 5 $ 6 $ 8
NOTE 18SUBSEQUENT EVENTS
On February 24, 2014, the Company announced anoffer to purchase up to $700 million aggregateprincipal of its 3.125% U.S. Dollar Debentures due2022, 2.75% U.S. Dollar Notes due 2023 and 4.0%U.S. Dollar Notes due 2020. The offer to purchaseexpires March 21, 2014, subject to early terminationor extension at the Company’s discretion. TheCompany intends to fund the purchase with theissuance of commercial paper.
68
Management’s Responsibility forFinancial Statements
Management is responsible for the preparation of theCompany’s consolidated financial statements andrelated notes. We believe that the consolidatedfinancial statements present the Company’s financialposition and results of operations in conformity withaccounting principles that are generally accepted inthe United States, using our best estimates andjudgments as required.
The independent registered public accounting firmaudits the Company’s consolidated financialstatements in accordance with the standards of thePublic Company Accounting Oversight Board andprovides an objective, independent review of thefairness of reported operating results and financialposition.
The board of directors of the Company has an AuditCommittee composed of four non-managementDirectors. The Committee meets regularly withmanagement, internal auditors, and the independentregistered public accounting firm to reviewaccounting, internal control, auditing and financialreporting matters.
Formal policies and procedures, including an activeEthics and Business Conduct program, support theinternal controls and are designed to ensureemployees adhere to the highest standards ofpersonal and professional integrity. We have arigorous internal audit program that independentlyevaluates the adequacy and effectiveness of theseinternal controls.
Management’s Report on InternalControl over Financial Reporting
Management is responsible for designing, maintainingand evaluating adequate internal control over financialreporting, as such term is defined in Rule 13a-15(f)under the Securities Exchange Act of 1934, asamended. Our internal control over financial reportingis designed to provide reasonable assurance regardingthe reliability of financial reporting and thepreparation of the financial statements for externalpurposes in accordance with U.S. generally acceptedaccounting principles.
We conducted an evaluation of the effectiveness ofour internal control over financial reporting based onthe framework in Internal Control — IntegratedFramework (1992) issued by the Committee ofSponsoring Organizations of the TreadwayCommission.
Because of its inherent limitations, internal controlover financial reporting may not prevent or detectmisstatements. Also, projections of any evaluation ofeffectiveness to future periods are subject to the riskthat controls may become inadequate because ofchanges in conditions or that the degree ofcompliance with the policies or procedures maydeteriorate.
Based on our evaluation under the framework inInternal Control — Integrated Framework (1992),management concluded that our internal control overfinancial reporting was effective as of December 28,2013. The effectiveness of our internal control overfinancial reporting as of December 28, 2013 has beenaudited by PricewaterhouseCoopers LLP, anindependent registered public accounting firm, asstated in their report which follows.
John A. BryantPresident and Chief Executive Officer
Ronald L. DissingerSenior Vice President and Chief Financial Officer
69
Report of Independent Registered Public Accounting Firm
To the Shareholders and Board of Directors ofKellogg Company
In our opinion, the consolidated financial statementslisted in the index appearing under Item 15(a)(1) presentfairly, in all material respects, the financial position ofKellogg Company and its subsidiaries at December 28,2013 and December 29, 2012, and the results of theiroperations and their cash flows for each of the threeyears in the period ended December 28, 2013 inconformity with accounting principles generallyaccepted in the United States of America. Also in ouropinion, the Company maintained, in all materialrespects, effective internal control over financialreporting as of December 28, 2013, based on criteriaestablished in Internal Control — Integrated Framework(1992) issued by the Committee of SponsoringOrganizations of the Treadway Commission (COSO).The Company’s management is responsible for thesefinancial statements, for maintaining effective internalcontrol over financial reporting and for its assessmentof the effectiveness of internal control over financialreporting, included in the accompanying Management’sReport on Internal Control over Financial Reporting. Ourresponsibility is to express opinions on these financialstatements and on the Company’s internal control overfinancial reporting based on our integrated audits. Weconducted our audits in accordance with the standardsof the Public Company Accounting Oversight Board(United States). Those standards require that we planand perform the audits to obtain reasonable assuranceabout whether the financial statements are free ofmaterial misstatement and whether effective internalcontrol over financial reporting was maintained in allmaterial respects. Our audits of the financial statementsincluded examining, on a test basis, evidencesupporting the amounts and disclosures in the financialstatements, assessing the accounting principles usedand significant estimates made by management, andevaluating the overall financial statement presentation.Our audit of internal control over financial reportingincluded obtaining an understanding of internal controlover financial reporting, assessing the risk that a
material weakness exists, and testing and evaluating thedesign and operating effectiveness of internal controlbased on the assessed risk. Our audits also includedperforming such other procedures as we considerednecessary in the circumstances. We believe that ouraudits provide a reasonable basis for our opinions.
A company’s internal control over financial reporting isa process designed to provide reasonable assuranceregarding the reliability of financial reporting and thepreparation of financial statements for externalpurposes in accordance with generally acceptedaccounting principles. A company’s internal control overfinancial reporting includes those policies andprocedures that (i) pertain to the maintenance ofrecords that, in reasonable detail, accurately and fairlyreflect the transactions and dispositions of the assets ofthe company; (ii) provide reasonable assurance thattransactions are recorded as necessary to permitpreparation of financial statements in accordance withgenerally accepted accounting principles, and thatreceipts and expenditures of the company are beingmade only in accordance with authorizations ofmanagement and directors of the company; and(iii) provide reasonable assurance regarding preventionor timely detection of unauthorized acquisition, use, ordisposition of the company’s assets that could have amaterial effect on the financial statements.
Because of its inherent limitations, internal control overfinancial reporting may not prevent or detectmisstatements. Also, projections of any evaluation ofeffectiveness to future periods are subject to the riskthat controls may become inadequate because ofchanges in conditions, or that the degree of compliancewith the policies or procedures may deteriorate.
Detroit, MichiganFebruary 24, 2014
70
ITEM 9. CHANGES IN AND DISAGREEMENTS WITHACCOUNTANTS ON ACCOUNTING AND FINANCIALDISCLOSURE
None.
ITEM 9A. CONTROLS AND PROCEDURES
(a) We maintain disclosure controls and procedures thatare designed to ensure that information required to bedisclosed in our Exchange Act reports is recorded,processed, summarized and reported within the timeperiods specified in the SEC’s rules and forms, and thatsuch information is accumulated and communicated toour management, including our Chief Executive Officerand Chief Financial Officer as appropriate, to allowtimely decisions regarding required disclosure underRules 13a-15(e) and 15d-15(e). Disclosure controls andprocedures, no matter how well designed andoperated, can provide only reasonable, rather thanabsolute, assurance of achieving the desired controlobjectives.
As of December 28, 2013, management carried out anevaluation under the supervision and with theparticipation of our Chief Executive Officer and ourChief Financial Officer, of the effectiveness of thedesign and operation of our disclosure controls andprocedures. Based on the foregoing, our ChiefExecutive Officer and Chief Financial Officer concludedthat our disclosure controls and procedures wereeffective at the reasonable assurance level.
(b) Pursuant to Section 404 of the Sarbanes-Oxley Actof 2002, we have included a report of management’sassessment of the design and effectiveness of our
internal control over financial reporting as part of thisAnnual Report on Form 10-K. The independentregistered public accounting firm ofPricewaterhouseCoopers LLP also attested to, andreported on, the effectiveness of our internal controlover financial reporting. Management’s report and theindependent registered public accounting firm’sattestation report are included in our 2013 financialstatements in Item 8 of this Report under the captionsentitled “Management’s Report on Internal Controlover Financial Reporting” and “Report of IndependentRegistered Public Accounting Firm” and areincorporated herein by reference.
(c) During the first quarter of 2012, we initiated theimplementation of an upgrade to our existing enterpriseresource planning (ERP) system within North America.This implementation has resulted in the modification ofcertain business processes and internal controlsimpacting financial reporting. During theimplementation, which is expected to continue into2014, we have taken the necessary steps to monitorand maintain appropriate internal controls impactingfinancial reporting. It is anticipated that, uponcompletion, implementation of this new ERP willenhance internal controls due to increased automationand further integration of related processes.
There have been no other changes in our internalcontrol over financial reporting that have materiallyaffected, or are reasonably likely to materially affect,our internal control over financial reporting.
ITEM 9B. OTHER INFORMATION
Not applicable.
PART III
ITEM 10. DIRECTORS, EXECUTIVE OFFICERS ANDCORPORATE GOVERNANCE
Directors — Refer to the information in our ProxyStatement to be filed with the Securities and ExchangeCommission for the Annual Meeting of Shareowners tobe held on April 25, 2014 (the “Proxy Statement”),under the caption “Proposal 1 — Election of Directors,”which information is incorporated herein by reference.
Identification and Members of Audit Committee; AuditCommittee Financial Expert — Refer to the informationin the Proxy Statement under the caption “Board andCommittee Membership,” which information isincorporated herein by reference.
Executive Officers of the Registrant — Refer to“Executive Officers” under Item 1 of this Report.
For information concerning Section 16(a) of theSecurities Exchange Act of 1934 — Refer to theinformation under the caption “SecurityOwnership — Section 16(a) Beneficial OwnershipReporting Compliance” of the Proxy Statement, whichinformation is incorporated herein by reference.
Code of Ethics for Chief Executive Officer, ChiefFinancial Officer and Controller — We have adopted aGlobal Code of Ethics which applies to our chiefexecutive officer, chief financial officer, corporatecontroller and all our other employees, and which canbe found at www.kelloggcompany.com. Anyamendments or waivers to the Global Code of Ethicsapplicable to our chief executive officer, chief financialofficer or corporate controller may also be found atwww.kelloggcompany.com.
71
ITEM 11. EXECUTIVE COMPENSATION
Refer to the information under the captions“2013 Director Compensation and Benefits,”“Compensation Discussion and Analysis,” “ExecutiveCompensation,” “Retirement and Non-QualifiedDefined Contribution and Deferred CompensationPlans,” and “Potential Post-Employment Payments” of
the Proxy Statement, which is incorporated herein byreference. See also the information under the caption“Compensation Committee Report” of the ProxyStatement, which information is incorporated herein byreference; however, such information is only“furnished” hereunder and not deemed “filed” forpurposes of Section 18 of the Securities Exchange Actof 1934.
ITEM 12. SECURITY OWNERSHIP OF CERTAIN BENEFICIAL OWNERS AND MANAGEMENT AND RELATEDSTOCKHOLDER MATTERS
Refer to the information under the captions “Security Ownership — Five Percent Holders” and “SecurityOwnership — Officer and Director Stock Ownership” of the Proxy Statement, which information is incorporatedherein by reference.
Securities Authorized for Issuance Under Equity Compensation Plans
(millions, except per share data)
Plan category
Number of securities tobe issued upon exerciseof outstanding options,warrants and rights as
of December 28, 2012 (a)
Weighted-averageexercise price of
outstanding options,warrants andrights as of
December 28, 2013 (b)
Number of securitiesremaining available forfuture issuance underequity compensation
plans (excluding securitiesreflected in column (a) asof December 28, 2013 (c)*
Equity compensation plans approved by security holders 19.2 $ 54 27.5Equity compensation plans not approved by security holders — NA 0.3
Total 19.2 $ 54 27.8
* The total number of shares remaining available for issuance under the 2013 Long-term Incentive Plan will be reduced by two shares for eachshare issued pursuant to an award other than a stock option or stock appreciation right, or potentially issuable pursuant to an outstandingaward other than a stock option or stock appreciation right, which will in each case reduce the total number of shares remaining by one sharefor each share issued.
Three plans are considered “Equity compensation plansnot approved by security holders.” The Kellogg ShareIncentive Plan, which was adopted in 2002 and isavailable to most U.K. employees of specified KelloggCompany subsidiaries; a similar plan, which is availableto employees in the Republic of Ireland; and theDeferred Compensation Plan for Non-EmployeeDirectors, which was adopted in 1986 and amended in1993 and 2002.
Under the Kellogg Share Incentive Plan, eligible U.K.employees may contribute up to 1,500 Pounds Sterlingannually to the plan through payroll deductions. Thetrustees of the plan use those contributions to buyshares of our common stock at fair market value on theopen market, with Kellogg matching thosecontributions on a 1:1 basis. Shares must be withdrawnfrom the plan when employees cease employment.Under current law, eligible employees generally receivecertain income and other tax benefits if those shares areheld in the plan for a specified number of years. Asimilar plan is also available to employees in theRepublic of Ireland. As these plans are open marketplans with no set overall maximum, no amounts forthese plans are included in the above table. However,approximately 58,000 shares were purchased by eligibleemployees under the Kellogg Share Incentive Plan, theplan for the Republic of Ireland and other similarpredecessor plans during 2013, with approximately an
additional 58,000 shares being provided as matchedshares.
The Deferred Compensation Plan for Non-EmployeeDirectors was amended and restated during 2013.Under the Deferred Compensation Plan for Non-Employee Directors, non-employee Directors may electto defer all or part of their compensation (other thanexpense reimbursement) into units which are creditedto their accounts. The units have a value equal to thefair market value of a share of our common stock onthe appropriate date, with dividend equivalents beingearned on the whole units in non-employee Directors’accounts. Units must be paid in shares of our commonstock, either in a lump sum or in up to ten annualinstallments, with the installments to begin as soon aspracticable after the non-employee Director’s service asa Director terminates. No more than 300,000 shares areauthorized for use under this plan, of whichapproximately 1,000 had been issued as ofDecember 28, 2013.
ITEM 13. CERTAIN RELATIONSHIPS AND RELATEDTRANSACTIONS, AND DIRECTOR INDEPENDENCE
Refer to the information under the captions “CorporateGovernance — Director Independence” and “RelatedPerson Transactions” of the Proxy Statement, whichinformation is incorporated herein by reference.
72
ITEM 14. PRINCIPAL ACCOUNTANT FEES ANDSERVICES
Refer to the information under the captions“Proposal 4 — Ratification ofPricewaterhouseCoopers LLP — Fees Paid to
Independent Registered Public Accounting Firm” and“Proposal 4 — Ratification of PricewaterhouseCoopersLLP — Preapproval Policies and Procedures” of theProxy Statement, which information is incorporatedherein by reference.
PART IV
ITEM 15. EXHIBITS, FINANCIAL STATEMENTSCHEDULES
The Consolidated Financial Statements and relatedNotes, together with Management’s Report on InternalControl over Financial Reporting, and the Reportthereon of PricewaterhouseCoopers LLP datedFebruary 24, 2014, are included herein in Part II, Item 8.
(a) 1. Consolidated Financial Statements
Consolidated Statement of Income for the years endedDecember 28, 2013, December 29, 2012 andDecember 31, 2011.
Consolidated Statement of Comprehensive Income forthe years ended December 28, 2013, December 29,2012 and December 31, 2011.
Consolidated Balance Sheet at December 28, 2013 andDecember 29, 2012.
Consolidated Statement of Equity for the years endedDecember 28, 2013, December 29, 2012 andDecember 31, 2011.
Consolidated Statement of Cash Flows for the yearsended December 28, 2013, December 29, 2012 andDecember 31, 2011.
Notes to Consolidated Financial Statements.
Management’s Report on Internal Control over FinancialReporting.
Report of Independent Registered Public AccountingFirm.
(a) 2. Consolidated Financial Statement Schedule
All financial statement schedules are omitted becausethey are not applicable or the required information isshown in the financial statements or the notes thereto.
(a) 3. Exhibits required to be filed by Item 601 ofRegulation S-K
The information called for by this Item is incorporatedherein by reference from the Exhibit Index included inthis Report.
73
SIGNATURES
Pursuant to the requirements of Section 13 or 15(d) of the Securities Exchange Act of 1934, the Registrant has dulycaused this Report to be signed on its behalf by the undersigned, thereunto duly authorized, this 24th day ofFebruary, 2014.
KELLOGG COMPANY
By: /s/ John A. Bryant
John A. BryantPresident and Chief Executive Officer
Pursuant to the requirements of the Securities Exchange Act of 1934, this Report has been signed below by thefollowing persons on behalf of the Registrant and in the capacities and on the dates indicated.
Name Capacity Date
/s/ John A. BryantJohn A. Bryant
President and Chief Executive Officer andDirector (Principal Executive Officer)
February 24, 2014
/s/ Ronald L. DissingerRonald L. Dissinger
Senior Vice President and Chief FinancialOfficer (Principal Financial Officer)
February 24, 2014
/s/ Maribeth A. DangelMaribeth A. Dangel
Vice President and Corporate Controller(Principal Accounting Officer)
February 24, 2014
*James M. Jenness
Chairman of the Board and Director February 24, 2014
*Benjamin S. Carson Sr.
Director February 24, 2014
*John T. Dillon
Director February 24, 2014
*Gordon Gund
Director February 24, 2014
*Donald R. Knauss
Director February 24, 2014
*Ann McLaughlin Korologos
Director February 24, 2014
*Mary A. Laschinger
Director February 24, 2014
*Cynthia H. Milligan
Director February 24, 2014
*Rogelio M. Rebolledo
Director February 24, 2014
* By: /s/ Gary H. Pilnick
Gary H. Pilnick
Attorney-in-fact February 24, 2014
74
EXHIBIT INDEX
ExhibitNo. Description
Electronic(E),Paper(P) orIncorp. ByRef.(IBRF)
2.01 Amended and Restated Transaction Agreement between us and The Procter & GambleCompany, incorporated by reference to Exhibit 1.1 of our Current Report on Form 8-K datedMay 31, 2012, Commission file number 1-4171.
IBRF
3.01 Amended Restated Certificate of Incorporation of Kellogg Company, incorporated byreference to Exhibit 4.1 to our Registration Statement on Form S-8, file number 333-56536.
IBRF
3.02 Bylaws of Kellogg Company, as amended, incorporated by reference to Exhibit 3.1 to ourCurrent Report on Form 8-K dated April 24, 2009, Commission file number 1-4171.
IBRF
4.01 Indenture dated August 1, 1993, between us and Harris Trust and Savings Bank,incorporated by reference to Exhibit 4.1 to our Registration Statement on Form S-3,Commission file number 33-49875
IBRF
4.02 Indenture and Supplemental Indenture dated March 15 and March 29, 2001, respectively,between Kellogg Company and BNY Midwest Trust Company, including the form of 7.45%Debentures due 2031, incorporated by reference to Exhibit 4.01 and 4.02 to our QuarterlyReport on Form 10-Q for the quarter ending March 31, 2001, Commission file number1-4171.
IBRF
4.03 Form of Indenture between Kellogg Company and The Bank of New York Mellon TrustCompany, N.A., incorporated by reference to Exhibit 4.1 to our Registration Statement onForm S-3, Commission file number 333-159303.
IBRF
4.04 Officers’ Certificate of Kellogg Company (with form of Kellogg Company 4.450% SeniorNote Due May 30, 2016), incorporated by reference to Exhibit 4.2 to our Current Report onForm 8-K dated May 18, 2009, Commission file number 1-4171.
IBRF
4.05 Officers’ Certificate of Kellogg Company (with form of Kellogg Company 4.150% SeniorNote Due 2019), incorporated by reference to Exhibit 4.2 to our Current Report on Form 8-Kdated November 16, 2009, Commission file number 1-4171.
IBRF
4.06 Officers’ Certificate of Kellogg Company (with form of Kellogg Company 4.000% SeniorNote Due 2020), incorporated by reference to Exhibit 4.1 to our Current Report on Form 8-Kdated December 8, 2010, Commission file number 1-4171.
IBRF
4.07 Four-Year Credit Agreement dated as of March 4, 2011 with 32 lenders, JPMorgan ChaseBank, N.A., as Administrative Agent, Barclays Capital, as Syndication Agent, BNP Paribas,Cooperatieve Centrale Raiffeisen-Boerenleenbank B.A., “Rabobank Nederland”, New YorkBranch and Wells Fargo Bank, N.A., as Documentation Agents, J.P. Morgan Securities LLC,Barclays Capital, BNP Paribas Securities Corp., Cooperatieve Centrale Raiffeisen-Boerenleenbank B.A., “Rabobank Nederland”, New York Branch and Wells Fargo Securities,LLC, as Joint Lead Arrangers and Joint Bookrunners, incorporated by reference to Exhibit 4.1to our Current Report on Form 8-K dated March 10, 2011, Commission file number 1-4171.
IBRF
4.08 Officers’ Certificate of Kellogg Company (with form of Kellogg Company 3.25% Senior NoteDue 2018), incorporated by reference to Exhibit 4.1 to our Current Report on Form 8-K datedMay 15, 2011, Commission file number 1-4171.
IBRF
4.09 Officers’ Certificate of Kellogg Company (with form of Kellogg Company 1.875% SeniorNote Due 2016), incorporated by reference to Exhibit 4.1 to our Current Report on Form 8-Kdated November 17, 2011, Commission file number 1-4171.
IBRF
4.10 Officers’ Certificate of Kellogg Company (with form of 1.125% Senior Note due 2015,1.750% Senior Note due 2017 and 3.125% Senior Note due 2022), incorporated byreference to Exhibit 4.1 to our Current Report on Form 8-K dated May 17, 2012, Commissionfile number 1-4171.
IBRF
4.11 Indenture, dated as of May 22, 2012, between Kellogg Canada Inc., Kellogg Company, andBNY Trust Company of Canada and The Bank of New York Mellon Trustee Company, N.A.,as trustees, incorporated by reference to Exhibit 4.1 to our Current Report on Form 8-K datedMay 22, 2012, commission file number 1-4171.
IBRF
4.12 First Supplemental Indenture, dated as of May 22, 2012, between Kellogg Canada, Inc.,Kellogg Company, and BNY Trust Company of Canada and The Bank of New York MellonTrustee Company, N.A., as trustees incorporated by reference to Exhibit 4.1 to our CurrentReport on Form 8-K dated May 22, 2012, Commission file number 1-4171.
IBRF
75
ExhibitNo. Description
Electronic(E),Paper(P) orIncorp. ByRef.(IBRF)
4.13 Officer’s Certificate of Kellogg Company (with form of Floating Rate Senior Notes due 2015and 2.750% Senior Notes due 2023), incorporated by reference to Exhibit 4.1 to our CurrentReport on Form 8-K dated February 14, 2013, Commission file number 1-4171.
IBRF
10.01 Kellogg Company Excess Benefit Retirement Plan, incorporated by reference to Exhibit 10.01to our Annual Report on Form 10-K for the fiscal year ended December 31, 1983,Commission file number 1-4171.*
IBRF
10.02 Kellogg Company Supplemental Retirement Plan, incorporated by reference to Exhibit 10.05to our Annual Report on Form 10-K for the fiscal year ended December 31, 1990,Commission file number 1-4171.*
IBRF
10.03 Kellogg Company Supplemental Savings and Investment Plan, as amended and restated as ofJanuary 1, 2003, incorporated by reference to Exhibit 10.03 to our Annual Report onForm 10-K for the fiscal year ended December 28, 2002, Commission file number 1-4171.*
IBRF
10.04 Kellogg Company International Retirement Plan, incorporated by reference to Exhibit 10.05to our Annual Report on Form 10-K for the fiscal year ended December 31, 1997,Commission file number 1-4171.*
IBRF
10.05 Kellogg Company Executive Survivor Income Plan, incorporated by reference to Exhibit 10.06to our Annual Report on Form 10-K for the fiscal year ended December 31, 1985,Commission file number 1-4171.*
IBRF
10.06 Kellogg Company Key Executive Benefits Plan, incorporated by reference to Exhibit 10.09 toour Annual Report on Form 10-K for the fiscal year ended December 31, 1991, Commissionfile number 1-4171.*
IBRF
10.07 Kellogg Company Key Employee Long Term Incentive Plan, incorporated by reference toExhibit 10.6 to our Annual Report on Form 10-K for the fiscal year ended December 29,2007, Commission file number 1-4171.*
IBRF
10.08 Kellogg Company Senior Executive Officer Performance Bonus Plan, incorporated byreference to Exhibit 10.10 to our Annual Report on Form 10-K for the fiscal year endedDecember 31, 1995, Commission file number 1-4171.*
IBRF
10.09 Kellogg Company 2000 Non-Employee Director Stock Plan, incorporated by reference toExhibit 10.10 to our Annual Report on Form 10-K for the fiscal year ended December 29,2007, Commission file number 1-4171.*
IBRF
10.10 Kellogg Company Bonus Replacement Stock Option Plan, incorporated by reference toExhibit 10.12 to our Annual Report on Form 10-K for the fiscal year ended December 31,1997, Commission file number 1-4171.*
IBRF
10.11 Kellogg Company Executive Compensation Deferral Plan incorporated by reference toExhibit 10.13 to our Annual Report on Form 10-K for the fiscal year ended December 31,1997, Commission file number 1-4171.*
IBRF
10.12 Employment Letter between us and James M. Jenness, incorporated by reference toExhibit 10.18 to our Annual Report in Form 10-K for the fiscal year ended January 1, 2005,Commission file number 1-4171.*
IBRF
10.13 Agreement between us and other executives, incorporated by reference to Exhibit 10.05 ofour Quarterly Report on Form 10-Q for the quarter ended June 30, 2000, Commission filenumber 1-4171.*
IBRF
10.14 Stock Option Agreement between us and James Jenness, incorporated by reference toExhibit 4.4 to our Registration Statement on Form S-8, file number 333-56536.*
IBRF
10.15 Kellogg Company 2002 Employee Stock Purchase Plan, as amended and restated as ofJanuary 1, 2008, incorporated by reference to Exhibit 10.22 to our Annual Report onForm 10-K for the fiscal year ended December 29, 2007, Commission file number 1-4171.*
IBRF
10.16 Kellogg Company 1993 Employee Stock Ownership Plan, incorporated by reference toExhibit 10.23 to our Annual Report on Form 10-K for the fiscal year ended December 29,2007, Commission file number 1-4171.*
IBRF
10.17 Kellogg Company 2003 Long-Term Incentive Plan, as amended and restated as ofDecember 8, 2006, incorporated by reference to Exhibit 10. to our Annual Report onForm 10-K for the fiscal year ended December 30, 2006, Commission file number 1-4171.*
IBRF
10.18 Kellogg Company Severance Plan, incorporated by reference to Exhibit 10. of our AnnualReport on Form 10-K for the fiscal year ended December 28, 2002, Commission file number1-4171.*
IBRF
76
ExhibitNo. Description
Electronic(E),Paper(P) orIncorp. ByRef.(IBRF)
10.19 Form of Non-Qualified Option Agreement for Senior Executives under 2003 Long-TermIncentive Plan, incorporated by reference to Exhibit 10.4 to our Quarterly Report on Form 10-Q for the fiscal period ended September 25, 2004, Commission file number 1-4171.*
IBRF
10.20 Form of Restricted Stock Grant Award under 2003 Long-Term Incentive Plan, incorporated byreference to Exhibit 10.5 to our Quarterly Report on Form 10-Q for the fiscal period endedSeptember 25, 2004, Commission file number 1-4171.*
IBRF
10.21 Form of Non-Qualified Option Agreement for Non-Employee Director under 2000 Non-Employee Director Stock Plan, incorporated by reference to Exhibit 10.6 to our QuarterlyReport on Form 10-Q for the fiscal period ended September 25, 2004, Commission filenumber 1-4171.*
IBRF
10.22 First Amendment to the Key Executive Benefits Plan, incorporated by reference toExhibit 10.39 of our Annual Report in Form 10-K for our fiscal year ended January 1, 2005,Commission file number 1-4171.*
IBRF
10.23 Restricted Stock Grant/Non-Compete Agreement between us and John Bryant, incorporatedby reference to Exhibit 10.1 of our Quarterly Report on Form 10-Q for the period ended April2, 2005, Commission file number 1-4171 (the “2005 Q1 Form 10-Q”).*
IBRF
10.24 Executive Survivor Income Plan, incorporated by reference to Exhibit 10.42 of our AnnualReport in Form 10-K for our fiscal year ended December 31, 2005, Commission file number1-4171.*
IBRF
10.25 Agreement between us and James M. Jenness, incorporated by reference to Exhibit 10.2 toour Current Report on Form 8-K dated October 20, 2006, Commission file number 1-4171.*
IBRF
10.26 Letter Agreement between us and John A. Bryant, dated July 23, 2007, incorporated byreference to Exhibit 10.2 to our Current Report on Form 8-K dated July 23, 2007,Commission file number 1-4171.*
IBRF
10.27 Agreement between us and James M. Jenness, dated February 22, 2008, incorporated byreference to Exhibit 10.1 to our Current Report on Form 8-K dated February 22, 2008,Commission file number 1-4171.*
IBRF
10.29 Form of Amendment to Form of Agreement between us and certain executives, incorporatedby reference to Exhibit 10.1 to our Current Report on Form 8-K dated December 18, 2008,Commission file number 1-4171.*
IBRF
10.30 Amendment to Letter Agreement between us and John A. Bryant, dated December 18,2008, incorporated by reference to Exhibit 10.2 to our Current Report on Form 8-K datedDecember 18, 2008, Commission file number 1-4171.*
IBRF
10.31 Form of Restricted Stock Grant Award under 2003 Long-Term Incentive Plan, incorporated byreference to Exhibit 10.2 to our Current Report on Form 8-K dated December 18, 2008,Commission file number 1-4171.*
IBRF
10.32 Form of Option Terms and Conditions for SVP Executive Officers under 2003 Long-TermIncentive Plan, incorporated by reference to Exhibit 10.2 to our Current Report on Form 8-Kdated February 20, 2009, Commission file number 1-4171.*
IBRF
10.33 Kellogg Company 2009 Long-Term Incentive Plan, incorporated by reference to Exhibit 10.1to our Registration Statement on Form S-8 dated April 27, 2009, Commission file number333-158824.*
IBRF
10.34 Kellogg Company 2009 Non-Employee Director Stock Plan, incorporated by reference toExhibit 10.1 to our Registration Statement on Form S-8 dated April 27, 2009, Commissionfile number 333-158825.*
IBRF
10.35 2010-2012 Executive Performance Plan, incorporated by reference to Exhibit 10.1 of ourCurrent Report on Form 8-K dated February 23, 2010, Commission file number 1-4171.*
IBRF
10.36 2011-2013 Executive Performance Plan, incorporated by reference to Exhibit 10.1 of ourCurrent Report on Form 8-K dated February 25, 2011, Commission file number 1-4171.*
IBRF
10.37 Form of Option Terms and Conditions under 2009 Long-Term Incentive Plan, incorporated byreference to Exhibit 10.2 to our Current Report on Form 8-K dated February 25, 2011,Commission file number 1-4171.
IBRF
10.38 Letter Agreement between us and Gary Pilnick, dated May 20, 2008, incorporated byreference to Exhibit 10.54 to our Annual Report on Form 10-K for the fiscal year endedJanuary 1, 2011, commission file number 1-4171.*
IBRF
77
ExhibitNo. Description
Electronic(E),Paper(P) orIncorp. ByRef.(IBRF)
10.39 Kellogg Company Senior Executive Annual Incentive Plan, incorporated by reference toAppendix A of our Board of Directors’ proxy statement for the annual meeting ofshareholders held on April 29, 2011.*
IBRF
10.40 2012-2014 Executive Performance Plan, incorporated by reference to Exhibit 10.1 of ourCurrent Report on Form 8-K dated February 23, 2012, Commission file number 1-4171.*
IBRF
10.41 Form of Option Terms and Conditions, incorporated by reference to Exhibit 10.2 to ourCurrent Report on Form 8-K dated February 23, 2012, Commission file number 1-4171.*
IBRF
10.42 Form of Restricted Stock Terms and Conditions, incorporated by reference to Exhibit 10.45to our Annual Report on Form 10-K for the fiscal year ended December 31, 2011,Commission file number 1-4171.*
IBRF
10.43 Form of Restricted Stock Unit Terms and Conditions, incorporated by reference toExhibit 10.45 to our Annual Report on Form 10-K for the fiscal year ended December 29,2012, Commission file number 1-4171.*
IBRF
10.44 2013-2015 Executive Performance Plan, incorporated by reference to Exhibit 10.1 to ourCurrent Report on Form 8-K dated February 27, 2013, Commission file number 1-4171.*
IBRF
10.45 Kellogg Company 2013 Long-Term Incentive Plan, incorporated by reference toExhibit 10.1 to our Registration Statement on Form S-8, file number 333-188222.*
IBRF
10.46 Kellogg Company Pringles Savings and Investment Plan, incorporated by reference toExhibit 4.3 to our Registration Statement on Form S-8, file number 333-189638.*
IBRF
10.47 Amendment Number 1. to the Kellogg Company Pringles Savings and Investment Plan,incorporated by reference to Exhibit 4.4 to our Registration Statement on Form S-8, filenumber 333-189638.*
IBRF
10.48 Agreement between us and Brad Davidson, dated August 21, 2013, incorporated byreference to Exhibit 10.1 to our Quarterly Report on Form 10-Q for the fiscal period endedSeptember 28, 2013, Commission file number 1-4171.*
IBRF
10.49 Kellogg Company Deferred Compensation Plan for Non-Employee Directors.* E10.50 Kellogg Company Executive Compensation Deferral Plan.* E10.51 Kellogg Company Change of Control Severance Policy for Key Executives.* E21.01 Domestic and Foreign Subsidiaries of Kellogg. E23.01 Consent of Independent Registered Public Accounting Firm. E24.01 Powers of Attorney authorizing Gary H. Pilnick to execute our Annual Report on
Form 10-K for the fiscal year ended December 28, 2013, on behalf of the Board ofDirectors, and each of them.
E
31.1 Rule 13a-14(a)/15d-14(a) Certification by John A. Bryant. E31.2 Rule 13a-14(a)/15d-14(a) Certification by Ronald L. Dissinger. E32.1 Section 1350 Certification by John A. Bryant. E32.2 Section 1350 Certification by Ronald L. Dissinger. E
101.INS XBRL Instance Document E101.SCH XBRL Taxonomy Extension Schema Document E101.CAL XBRL Taxonomy Extension Calculation Linkbase Document E101.DEF XBRL Taxonomy Extension Definition Linkbase Document E101.LAB XBRL Taxonomy Extension Label Linkbase Document E101.PRE XBRL Taxonomy Extension Presentation LInkbase Document E
* A management contract or compensatory plan required to be filed with this Report.
We agree to furnish to the Securities and Exchange Commission, upon its request, a copy of any instrument definingthe rights of holders of long-term debt of Kellogg and our subsidiaries and any of our unconsolidated subsidiaries forwhich Financial Statements are required to be filed.
We will furnish any of our shareowners a copy of any of the above Exhibits not included herein upon the writtenrequest of such shareowner and the payment to Kellogg of the reasonable expenses incurred in furnishing such copyor copies.
END OF ANNUAL REPORT ON FORM 10-K
78
Corporate and Shareowner Information
World HeadquartersKellogg CompanyOne Kellogg Square, P.O. Box 3599Battle Creek, MI 49016-3599Switchboard: (269) 961-2000
Corporate website: www.kelloggcompany.com
General information by telephone: (800) 962-1413
Common StockListed on the New York Stock ExchangeTicker Symbol: K
Annual Meeting of ShareownersFriday, April 25, 2014, 1:00 p.m. ETBattle Creek, Michigan
An audio replay of the presentation including slides willbe available at http://investor.kelloggs.com for one year.For further information, call (269) 961-2800.
Shareowner Account Assistance(877) 910-5385 – Toll Free U.S., Puerto Rico & Canada(651) 450-4064 – All other locations & TDD for hearingimpaired
Transfer agent, registrar and dividend disbursingagent:Wells Fargo Bank, N.A.Kellogg Shareowner ServicesP.O. Box 64854St. Paul, MN 55164-0854
Online account access and inquires:http://www.shareowneronline.com
TrusteeThe Bank of New York Mellon Trust Company N.A.2 North LaSalle Street, Suite 1020Chicago, IL 60602
3ML FR Notes – Due February 13, 20151.125% Notes – Due May 15, 20154.450% Notes – Due May 30, 20161.875% Notes – Due November 17, 20161.750% Notes – Due May 17, 20173.250% Notes – Due May, 21, 20184.150% Notes – Due November 15, 20194.000% Notes – Due December 15, 20203.125% Notes – Due May 17, 20222.750% Notes – Due March 2, 20237.450% Notes – Due April 1, 2031
BNY Trust Company of CanadaSuite 520, 1130 West Pender StreetVancouver, BC V6E 4A4
2.100% Notes – Due May 22, 2014
CertificationsThe most recent certifications by our chief executiveand chief financial officers pursuant to Section 302 ofthe Sarbanes-Oxley Act of 2002 are filed as exhibits tothe accompanying annual report on SEC Form 10-K.Our chief executive officer’s most recent annualcertification to The New York Stock Exchange wassubmitted on May 20, 2013.
Independent Registered Public Accounting FirmPricewaterhouseCoopers LLP
Company InformationKellogg Company’s website –www.kelloggcompany.com – contains a wide range ofinformation about the company, including newsreleases, financial reports, investor information,corporate governance, career opportunities andinformation on the Company’s Corporate Responsibilityefforts.
Printed materials such as the Annual Report on SECForm 10-K, quarterly reports on SEC Form 10-Q andother company information may be requested via thiswebsite, or by calling (800) 962-1413.
Direct Stock Purchase and Dividend ReinvestmentPlanKellogg Direct™ is a direct stock purchase and dividendreinvestment plan that provides a convenient andeconomical method for new investors to make an initialinvestment in shares of Kellogg Company commonstock and for existing shareowners to increase theirholdings of our common stock.
The minimum initial investment is $50, including a one-time enrollment fee of $15; the maximum annualinvestment through the Plan is $100,000. The Companypays all fees related to purchase transactions.
If your shares are held in street name by your brokerand you are interested in participating in the Plan, youmay have your broker transfer the shares electronicallyto Wells Fargo Bank, N.A., through the DirectRegistration System.
For more details on the plan, please contact KelloggShareowner Services at (877) 910-5385 or visit ourinvestor website, http://investor.kelloggs.com.
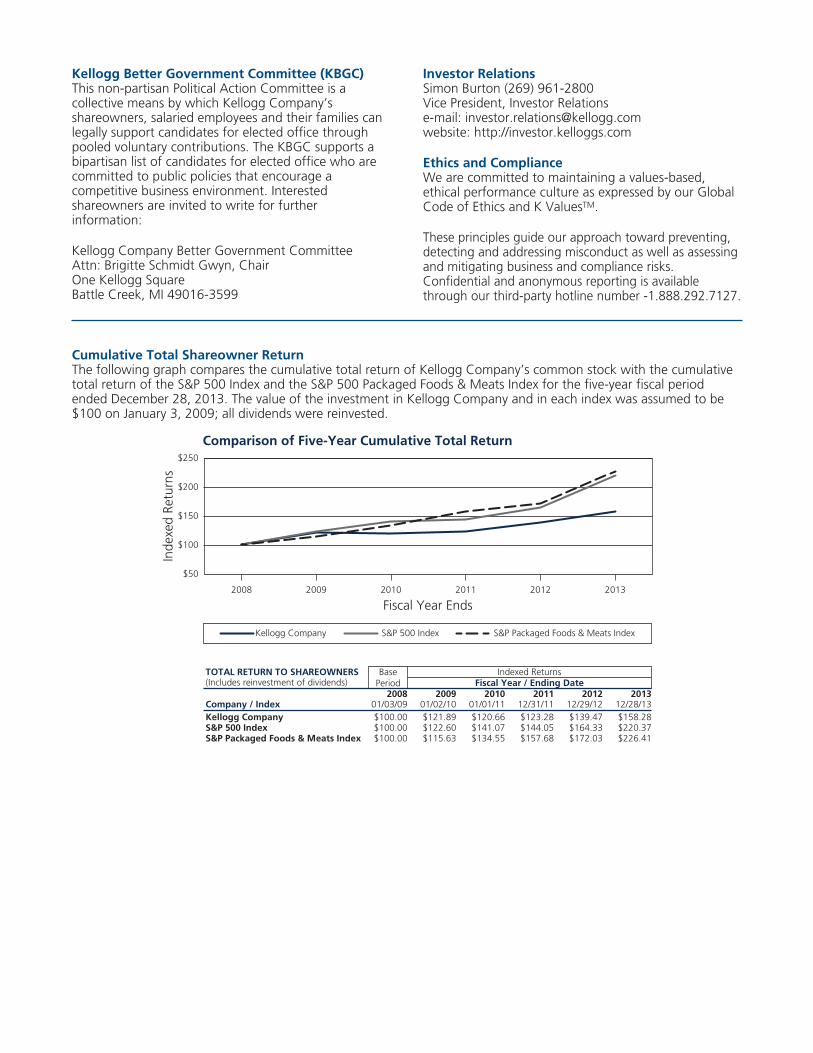
Kellogg Better Government Committee (KBGC)This non-partisan Political Action Committee is acollective means by which Kellogg Company’sshareowners, salaried employees and their families canlegally support candidates for elected office throughpooled voluntary contributions. The KBGC supports abipartisan list of candidates for elected office who arecommitted to public policies that encourage acompetitive business environment. Interestedshareowners are invited to write for furtherinformation:
Kellogg Company Better Government CommitteeAttn: Brigitte Schmidt Gwyn, ChairOne Kellogg SquareBattle Creek, MI 49016-3599
Investor RelationsSimon Burton (269) 961-2800Vice President, Investor Relationse-mail: [email protected]: http://investor.kelloggs.com
Ethics and ComplianceWe are committed to maintaining a values-based,ethical performance culture as expressed by our GlobalCode of Ethics and K ValuesTM.
These principles guide our approach toward preventing,detecting and addressing misconduct as well as assessingand mitigating business and compliance risks.Confidential and anonymous reporting is availablethrough our third-party hotline number -1.888.292.7127.
Cumulative Total Shareowner ReturnThe following graph compares the cumulative total return of Kellogg Company’s common stock with the cumulativetotal return of the S&P 500 Index and the S&P 500 Packaged Foods & Meats Index for the five-year fiscal periodended December 28, 2013. The value of the investment in Kellogg Company and in each index was assumed to be$100 on January 3, 2009; all dividends were reinvested.
2008 2009 2010 2011 2012 2013
$50
$100
$150
$200
$250
Comparison of Five-Year Cumulative Total Return
Kellogg Company S&P 500 Index S&P Packaged Foods & Meats Index
TOTAL RETURN TO SHAREOWNERS BasePeriod(Includes reinvestment of dividends)
2008 2009 2010 2011 2012 2013Company / Index 01/03/09 01/02/10 01/01/11 12/31/11 12/29/12 12/28/13Kellogg Company $100.00 $121.89 $120.66 $123.28 $139.47 $158.28S&P 500 Index $100.00 $122.60 $141.07 $144.05 $164.33 $220.37S&P Packaged Foods & Meats Index $100.00 $115.63 $134.55 $157.68 $172.03 $226.41
Fiscal Year / Ending DateIndexed Returns
Inde
xed
Retu
rns
Fiscal Year Ends