Embed Size (px)
DESCRIPTION
Miljøbelastning med anthropogene stoffer. Eksempel „bly“: konsekvenser, iagttagelser og helbred Hans von Storch Institut für Küstenforschung, GKSS Forschungszentrum. Kemisk Institut, K øbenhavn, 13 Dezember 2006. Institut für Küstenforschung. I f K. Institut für Küstenforschung. I f K. - PowerPoint PPT Presentation
Citation preview
Kemisk Institut, København, 13 Dezember 2006
Miljøbelastning med anthropogene stoffer
Eksempel „bly“: konsekvenser, iagttagelser og helbred
Hans von StorchInstitut für Küstenforschung, GKSS Forschungszentrum
Inst
itut f
ür K
üste
nfor
schu
ng
I f K

Inst
itut f
ür K
üste
nfor
schu
ng
I f K
The case of Germany
Questions
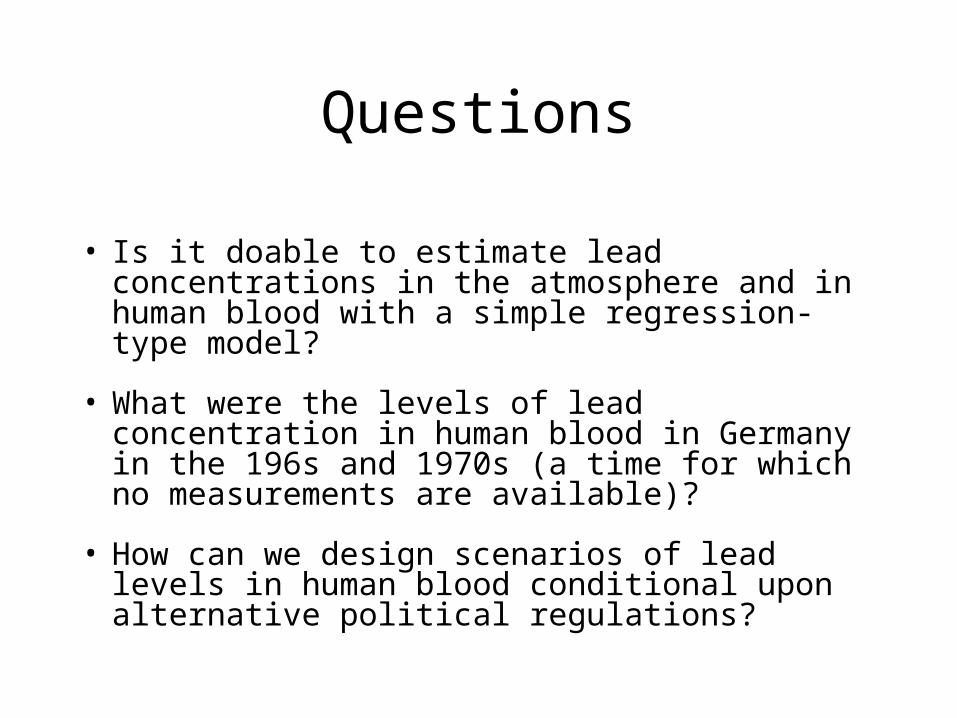
• Is it doable to estimate lead concentrations in the atmosphere and in human blood with a simple regression-type model?
• What were the levels of lead concentration in human blood in Germany in the 196s and 1970s (a time for which no measurements are available)?
• How can we design scenarios of lead levels in human blood conditional upon alternative political regulations?
Inst
itut f
ür K
üste
nfor
schu
ng
I f K
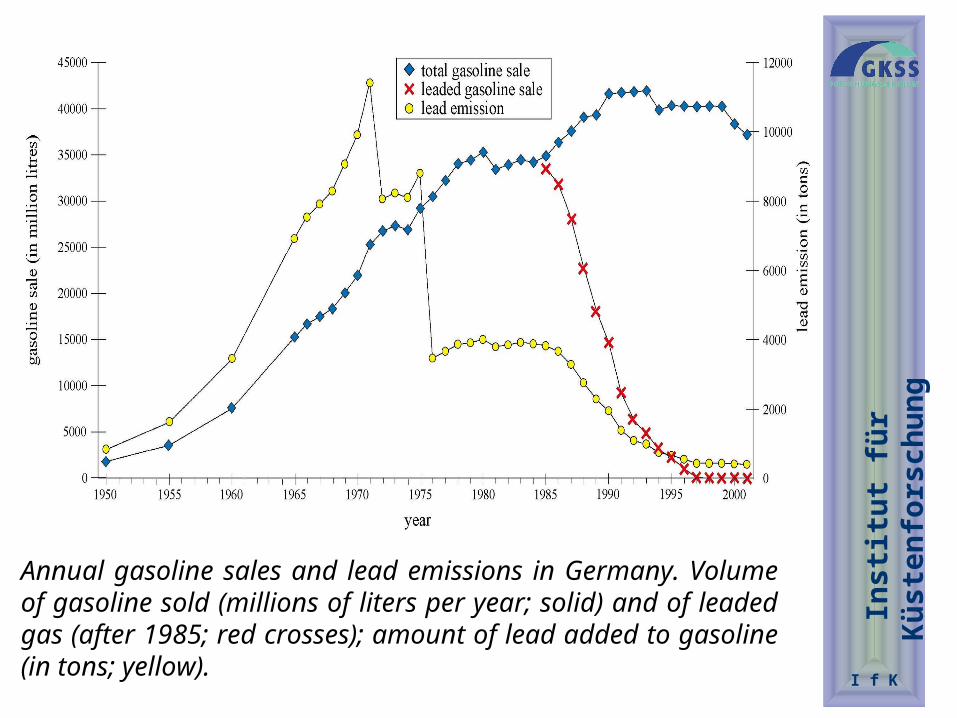
Annual gasoline sales and lead emissions in Germany. Volume of gasoline sold (millions of liters per year; solid) and of leaded gas (after 1985; red crosses); amount of lead added to gasoline (in tons; yellow).
Inst
itut f
ür K
üste
nfor
schu
ng
I f K
We have two data sets with time series of lead concentrations in human blood (LHB), beginning in the late 1970s. No reliable earlier data about lead in the human blood in Germany is available.
Data set “G” (“Germany”; Heinzow, 1998) is unsystematically collected, with samples at different locations, different methods, different age and gender groups.
The second data set “M” (“Münster”; Human-Probenbank Münster 2002;) is better, as it is derived from a controlled sampling strategy – for groups of students living in the industrial town of Münster (51.5oN, 7.4oE) in Nordrhine-Westfalia, close to the Ruhr area with heavy industry and intensive road traffic.
1980 1983 1986 1989 1992 1995 1998 2001
0
40
80
120
g/l
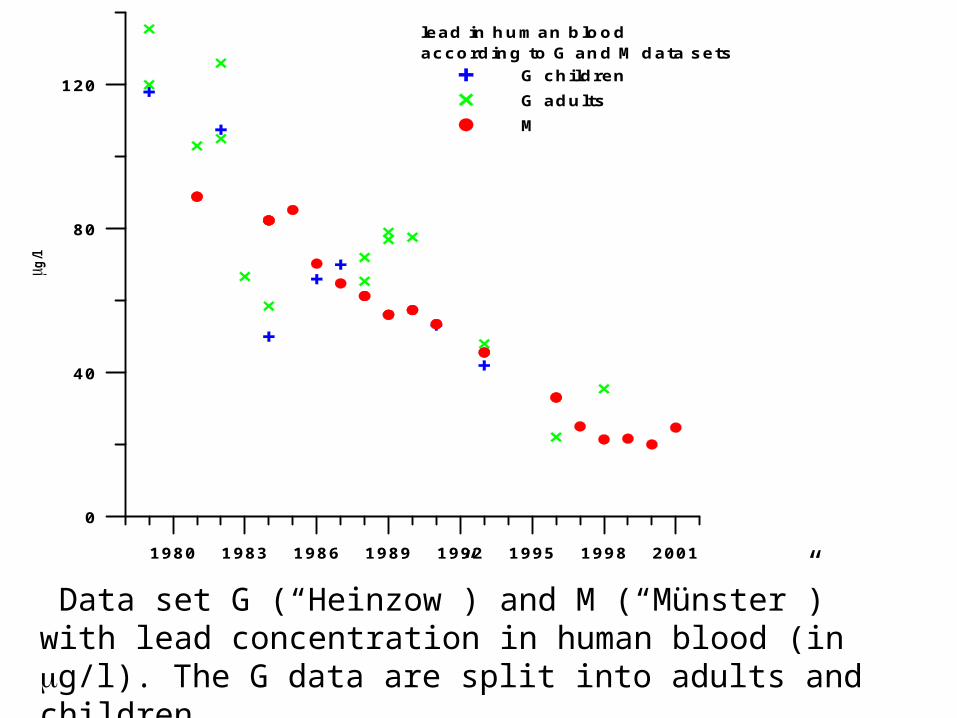
lead in human bloodaccording to G and M data sets
G childrenG adultsM
Data set G (“Heinzow”) and M (“Münster”) with lead concentration in human blood (in g/l). The G data are split into adults and children.
2 0 4 0 6 0 8 0 1 0 0 1 2 0
M sam ples (g/l)
2 0
4 0
6 0
8 0
1 0 0
1 2 0G
sam
ples
(g/
l)
0 5 10 15 20 25
0
5
10
15
20
25
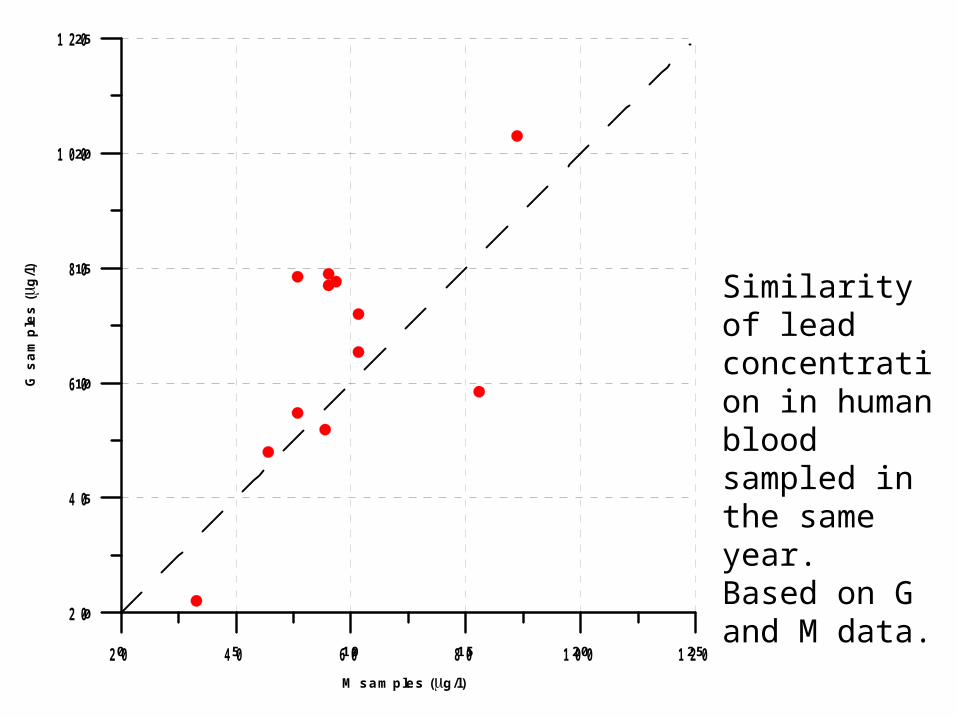
Similarity of lead concentration in human blood sampled in the same year.Based on G and M data.
0 0.04 0.08 0.12 0.16
lead concentration in gasoline (g/l)
0
40
80
120
lead
con
cent
ratio
n in
blo
od (
g/l)
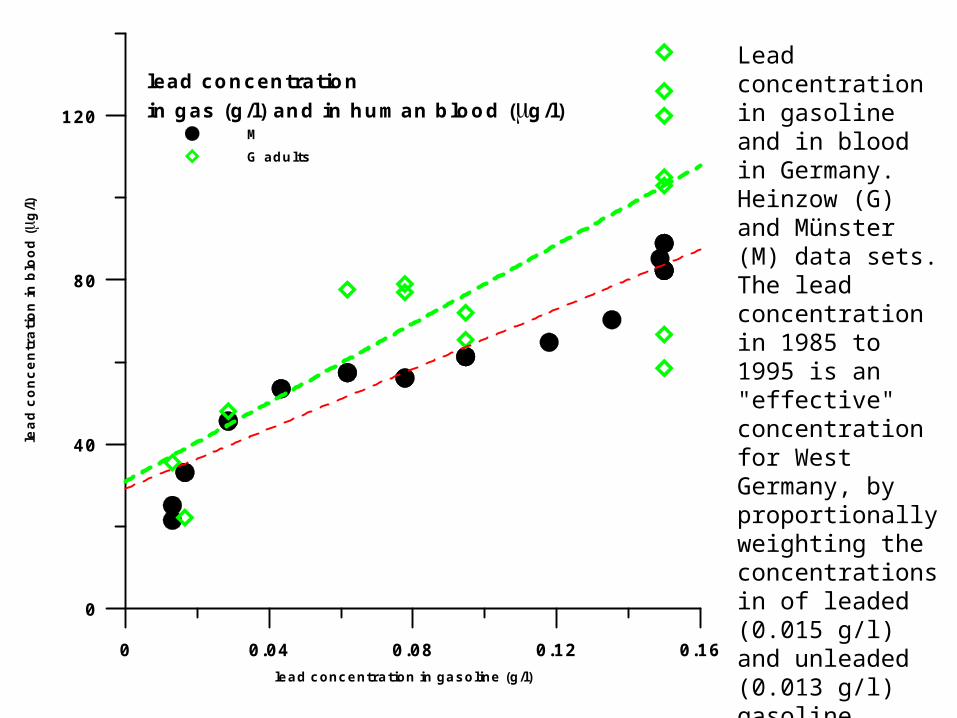
lead concentrationin gas (g/l) and in human blood (g/l)
MG adults
Lead concentration in gasoline and in blood in Germany. Heinzow (G) and Münster (M) data sets. The lead concentration in 1985 to 1995 is an "effective" concentration for West Germany, by proportionally weighting the concentrations in of leaded (0.015 g/l) and unleaded (0.013 g/l) gasoline
Inst
itut f
ür K
üste
nfor
schu
ng
I f K
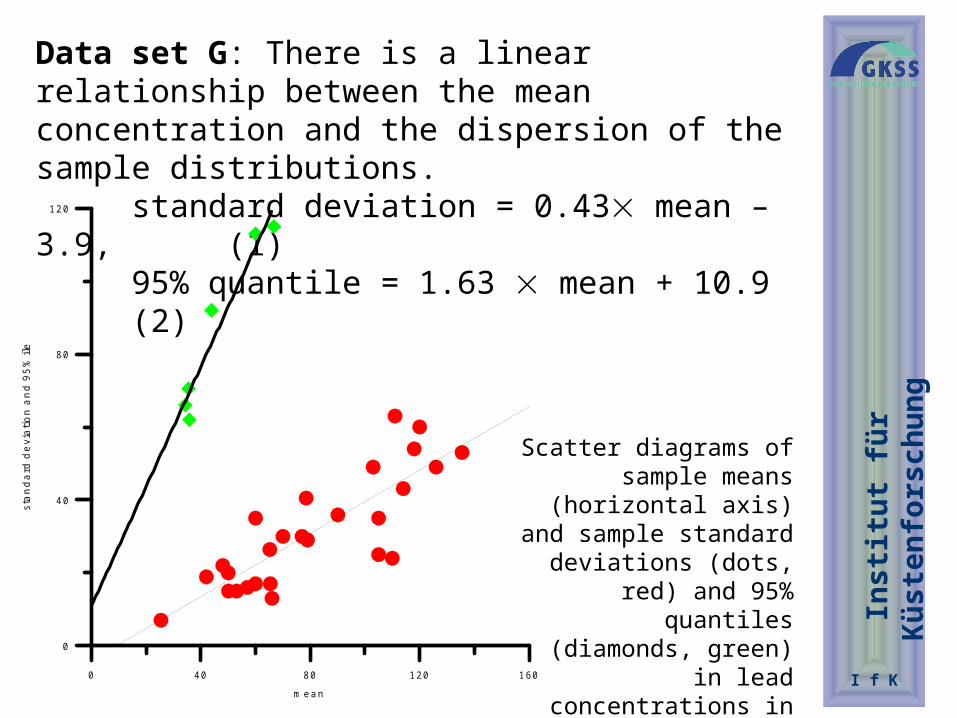
Data set G: There is a linear relationship between the mean concentration and the dispersion of the sample distributions.
standard deviation = 0.43 mean – 3.9, (1)95% quantile = 1.63 mean + 10.9 (2)
0 40 80 120 160m e a n
0
40
80
120
stan
dard
dev
iatio
n an
d 95
%ile
Scatter diagrams of sample means (horizontal axis) and sample standard deviations
(dots, red) and 95% quantiles (diamonds, green) in lead concentrations in human
blood in data set G. In g/l.
Inst
itut f
ür K
üste
nfor
schu
ng
I f K
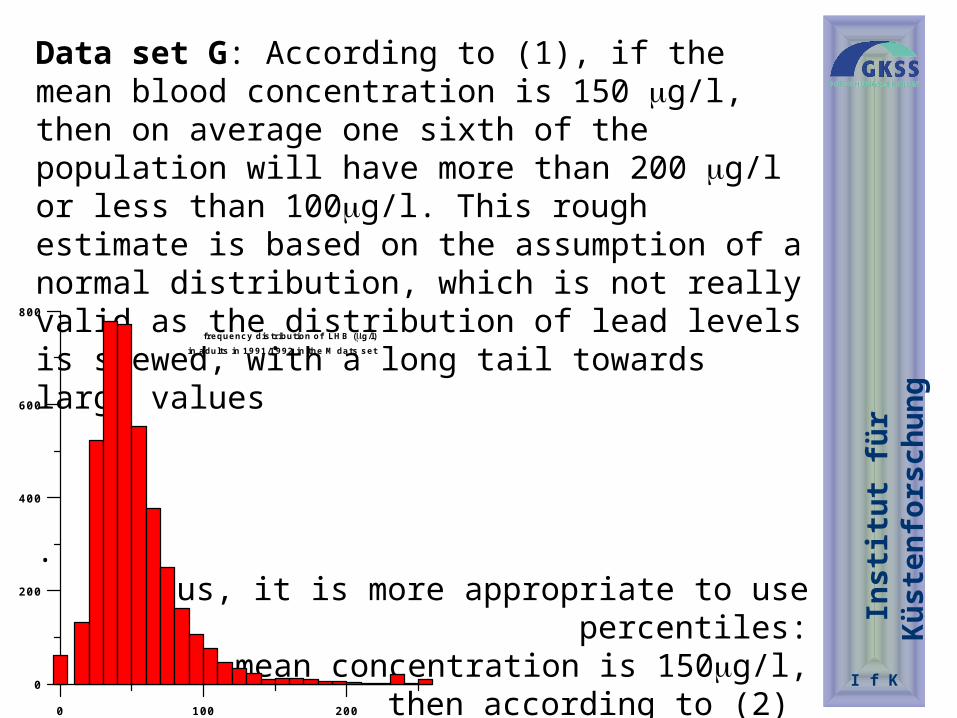
Data set G: According to (1), if the mean blood concentration is 150 g/l, then on average one sixth of the population will have more than 200 g/l or less than 100g/l. This rough estimate is based on the assumption of a normal distribution, which is not really valid as the distribution of lead levels is skewed, with a long tail towards large values
. Thus, it is more appropriate to use percentiles:
If the mean concentration is 150g/l, then according to (2)
5% of the population may have a concentration of
more than 250 g/l.0 100 200
0
200
400
600
800frequency dis tribution of LH B (g/l)
in adults in 1991/1992 in the M dats set
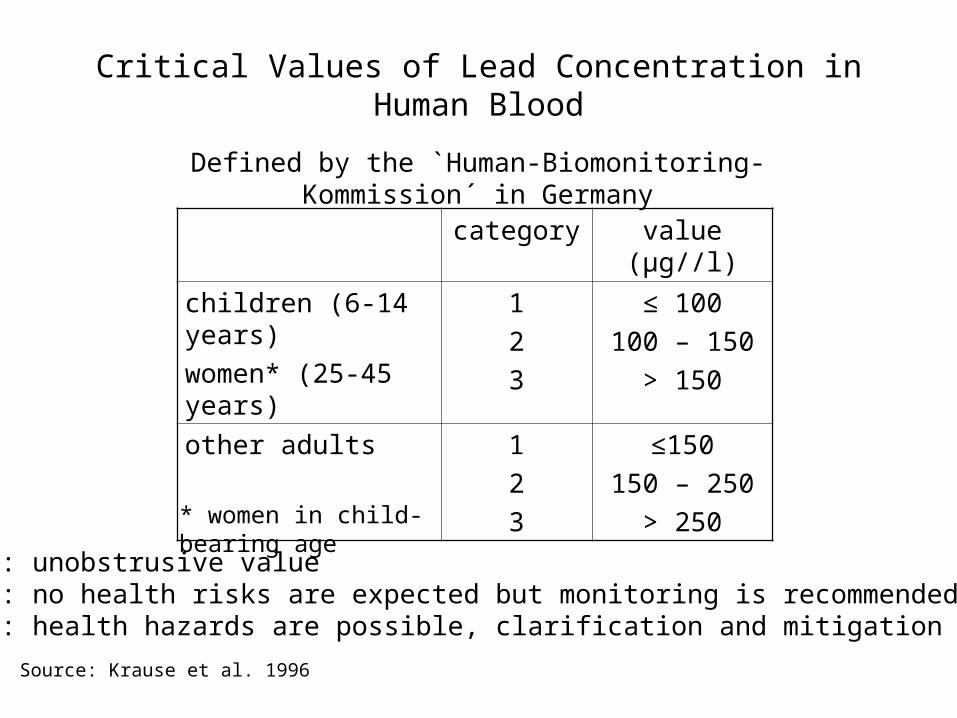
Critical Values of Lead Concentration in Human Blood
Category 1: unobstrusive valueCategory 2: no health risks are expected but monitoring is recommendedCategory 3: health hazards are possible, clarification and mitigation is needed
category value (μg//l)
children (6-14 years)women* (25-45 years)
123
≤ 100100 – 150
> 150other adults 1
23
≤150150 – 250
> 250
Source: Krause et al. 1996
Defined by the `Human-Biomonitoring-Kommission´ in Germany
* women in child-bearing age
0 20 40 60 80 100
0
40
80
120
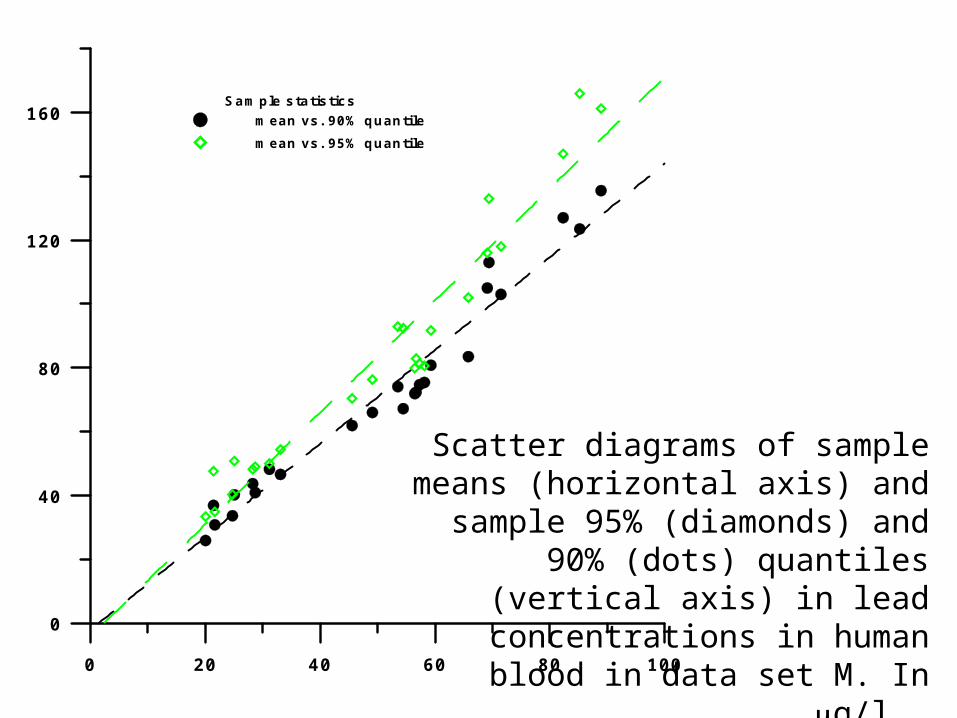
160 Sam ple statisticsmean vs. 90% quantilemean vs. 95% quantile
Scatter diagrams of sample means (horizontal axis) and sample 95%
(diamonds) and 90% (dots) quantiles (vertical axis) in lead concentrations in human blood in data set M. In g/l.
Inst
itut f
ür K
üste
nfor
schu
ng
I f K
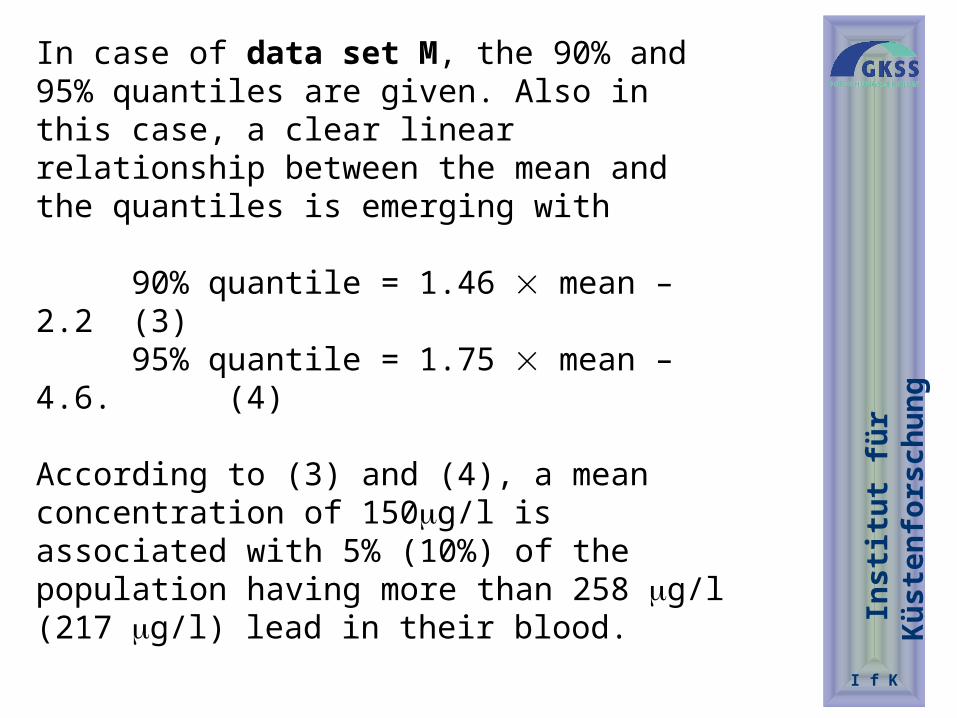
In case of data set M, the 90% and 95% quantiles are given. Also in this case, a clear linear relationship between the mean and the quantiles is emerging with
90% quantile = 1.46 mean – 2.2 (3)95% quantile = 1.75 mean – 4.6. (4)
According to (3) and (4), a mean concentration of 150g/l is associated with 5% (10%) of the population having more than 258 g/l (217 g/l) lead in their blood.
Inst
itut f
ür K
üste
nfor
schu
ng
I f K
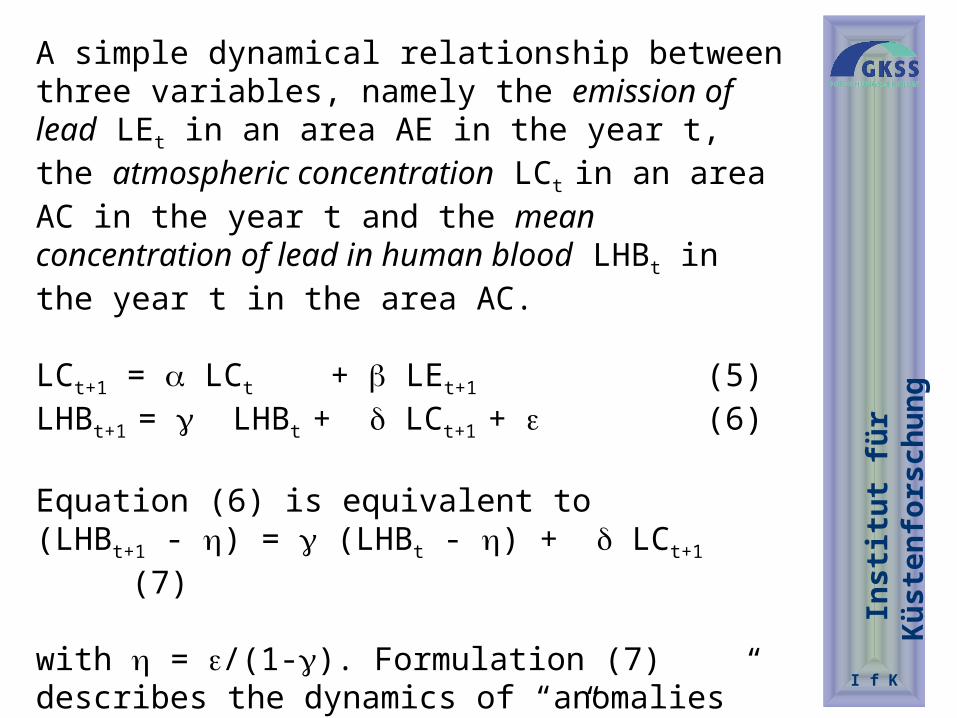
A simple dynamical relationship between three variables, namely the emission of lead LEt in an area AE in the year t, the atmospheric concentration LCt in an area AC in the year t and the mean concentration of lead in human blood LHBt in the year t in the area AC.
LCt+1 = LCt + LEt+1 (5)LHBt+1 = LHBt + LCt+1 + (6)
Equation (6) is equivalent to(LHBt+1 - ) = (LHBt - ) + LCt+1 (7)
with = /(1-). Formulation (7) describes the dynamics of “anomalies” LHBt- relative to a “normal” state towards which the system converges as soon as the forcing LCt ceases if <1. For 0 < <1 the air concentration approaches asymptotically with a time scale of 1/(1-) if LCt=0.
Inst
itut f
ür K
üste
nfor
schu
ng
I f K
1955 1960 1965 1970 1975 1980 1985 1990 1995 2000
0
2000
4000
6000
8000
10000
12000estimates of lead emissionrelated to use in gasoline (g/l)
MW V estimatePacyna estimate
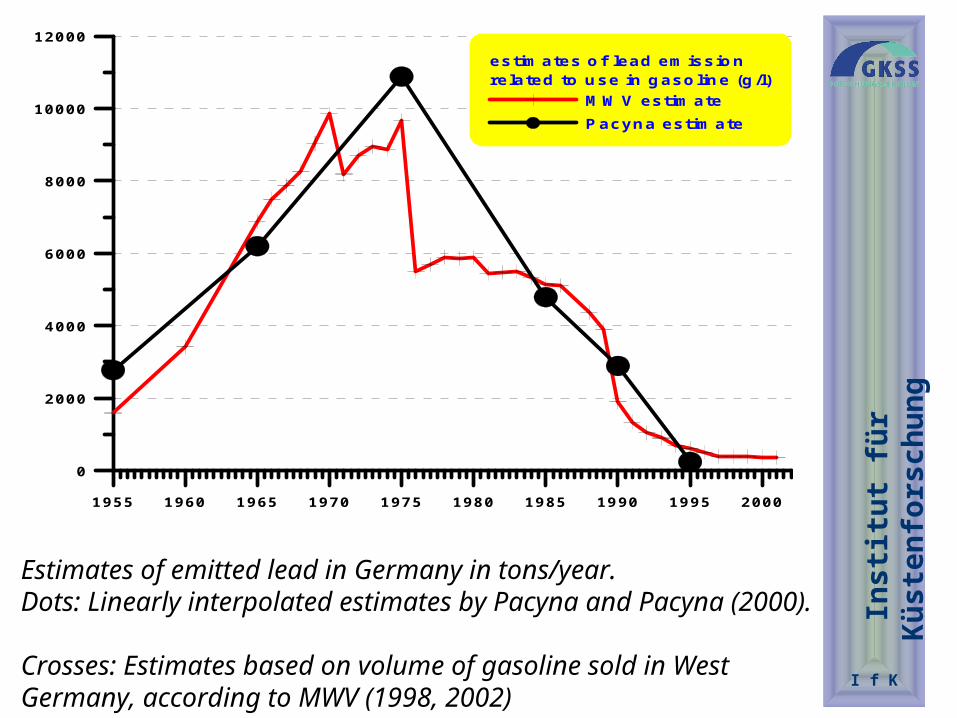
Estimates of emitted lead in Germany in tons/year.Dots: Linearly interpolated estimates by Pacyna and Pacyna (2000).Crosses: Estimates based on volume of gasoline sold in West Germany, according to MWV (1998, 2002)
Inst
itut f
ür K
üste
nfor
schu
ng
I f K
1960 1970 1980 1990
-200
0
200
400
600B est guess of emissions in A E Muenster case
Pacyna linearly interpolatedbest guess according to (8)difference
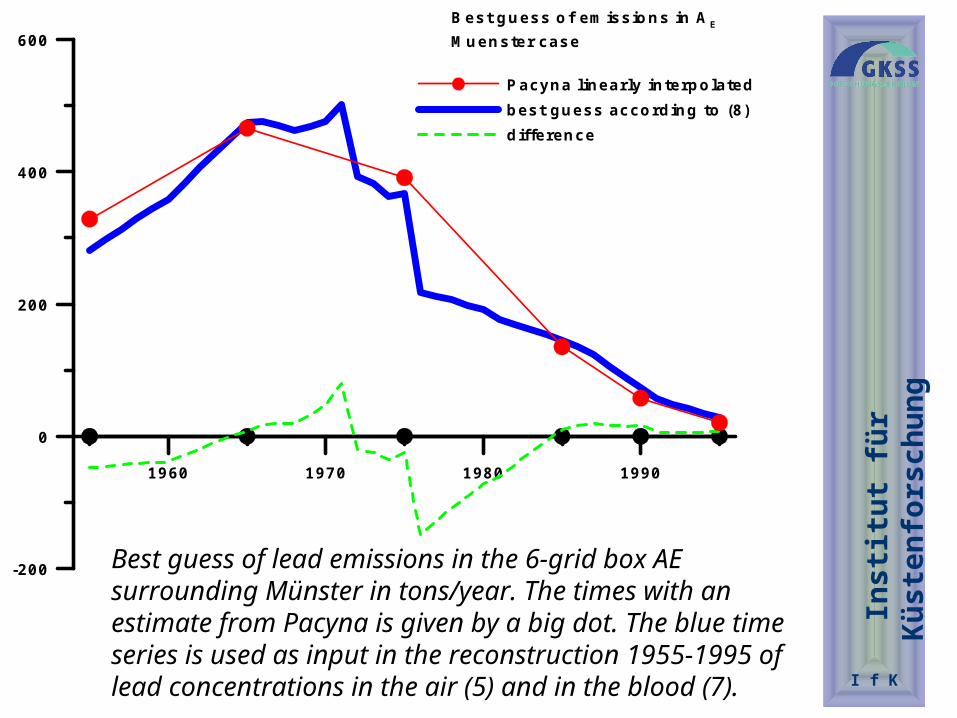
Best guess of lead emissions in the 6-grid box AE surrounding Münster in tons/year. The times with an estimate from Pacyna is given by a big dot. The blue time series is used as input in the reconstruction 1955-1995 of lead concentrations in the air (5) and in the blood (7).
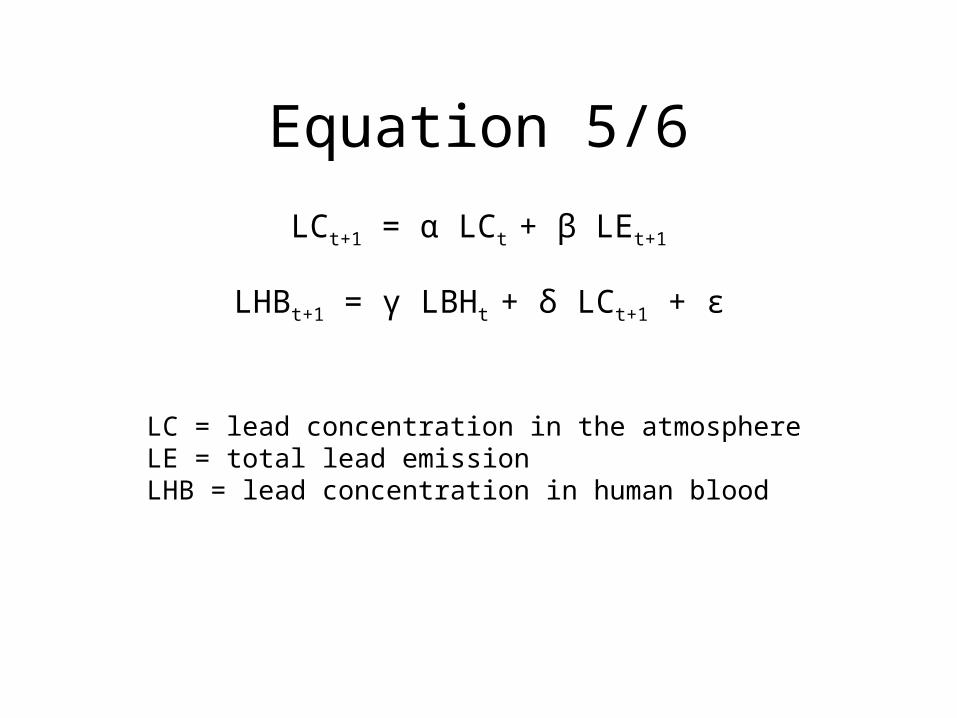
Equation 5/6LCt+1 = α LCt + β LEt+1
LC = lead concentration in the atmosphereLE = total lead emissionLHB = lead concentration in human blood
LHBt+1 = γ LBHt + δ LCt+1 + ε
1960 1970 1980 1990
0
200
400
600
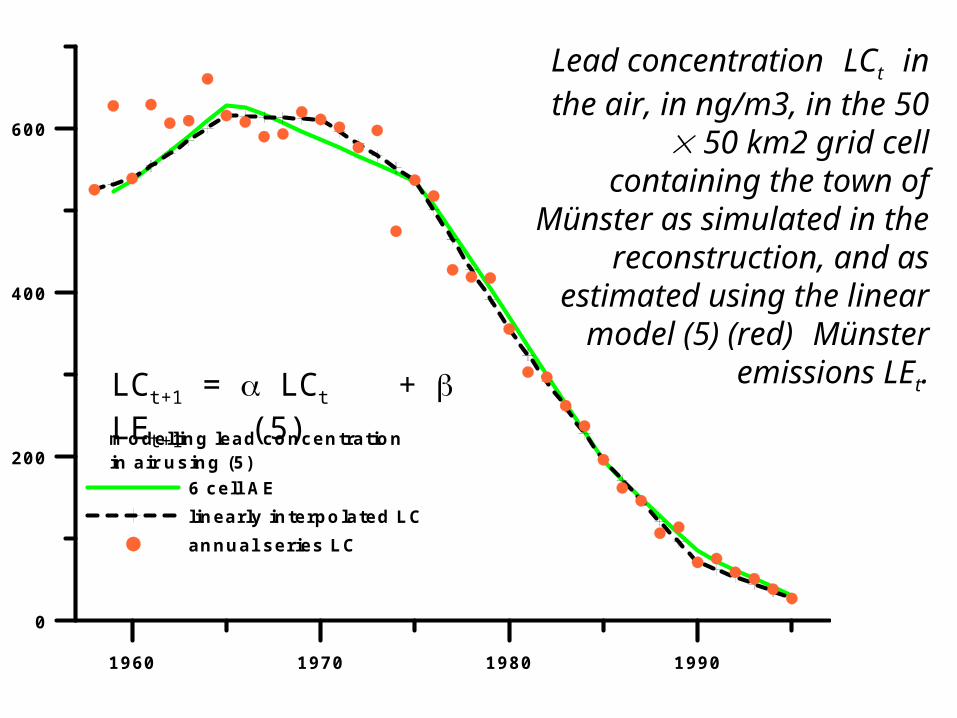
modelling lead concentrationin air using (5)
6 cell AElinearly interpolated LCannual series LC
Lead concentration LCt in the air, in ng/m3, in the 50 50 km2 grid cell containing the
town of Münster as simulated in the reconstruction, and as
estimated using the linear model (5) (red) Münster
emissions LEt.LCt+1 = LCt + LEt+1 (5)
Inst
itut f
ür K
üste
nfor
schu
ng
I f K
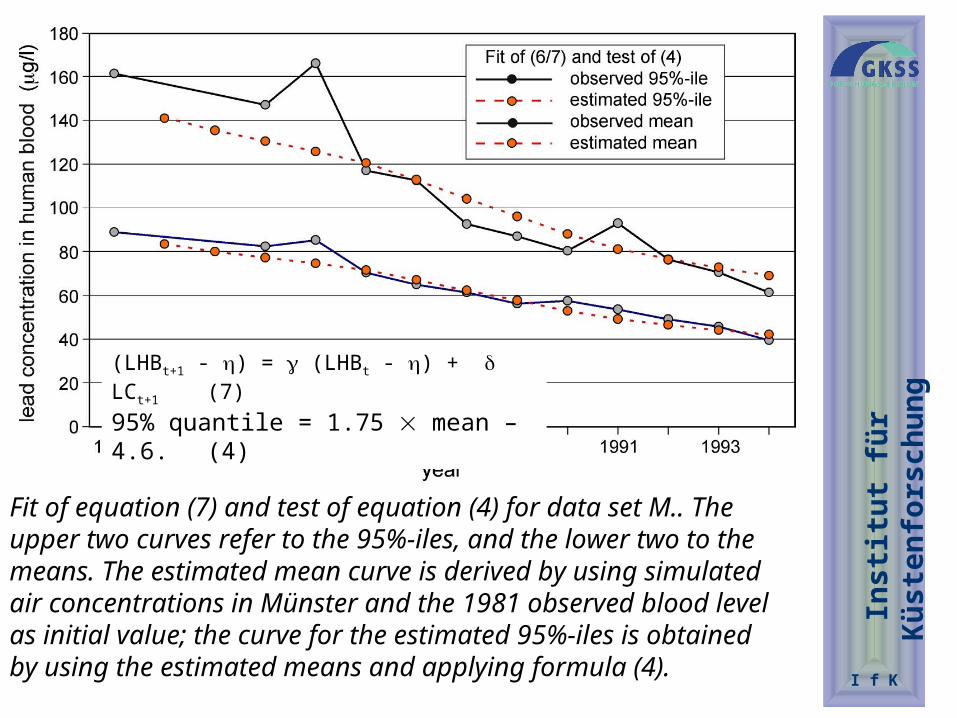
Fit of equation (7) and test of equation (4) for data set M.. The upper two curves refer to the 95%-iles, and the lower two to the means. The estimated mean curve is derived by using simulated air concentrations in Münster and the 1981 observed blood level as initial value; the curve for the estimated 95%-iles is obtained by using the estimated means and applying formula (4).
(LHBt+1 - ) = (LHBt - ) + LCt+1 (7)95% quantile = 1.75 mean – 4.6. (4)
1955 1960 1965 1970 1975 1980 1985 1990 1995
0
100
200
300
400lea
d co
ncen
tratio
n in
blo
od (
g/l)
means
90%-iles
95%-iles
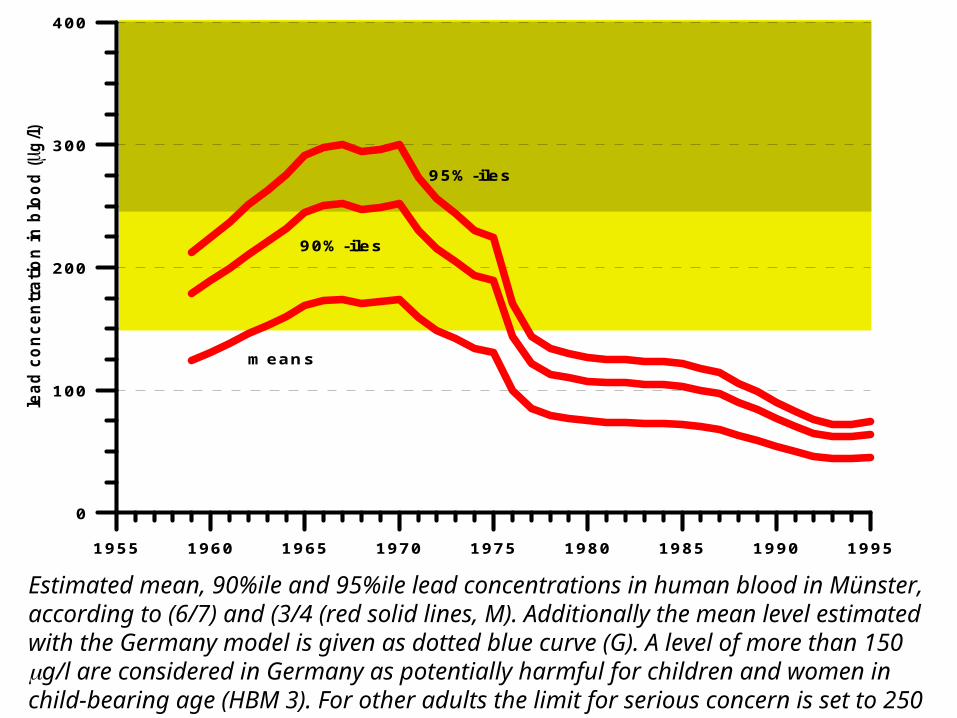
Estimated mean, 90%ile and 95%ile lead concentrations in human blood in Münster, according to (6/7) and (3/4 (red solid lines, M). Additionally the mean level estimated with the Germany model is given as dotted blue curve (G). A level of more than 150 g/l are considered in Germany as potentially harmful for children and women in child-bearing age (HBM 3). For other adults the limit for serious concern is set to 250 g/l.
Inst
itut f
ür K
üste
nfor
schu
ng
I f K
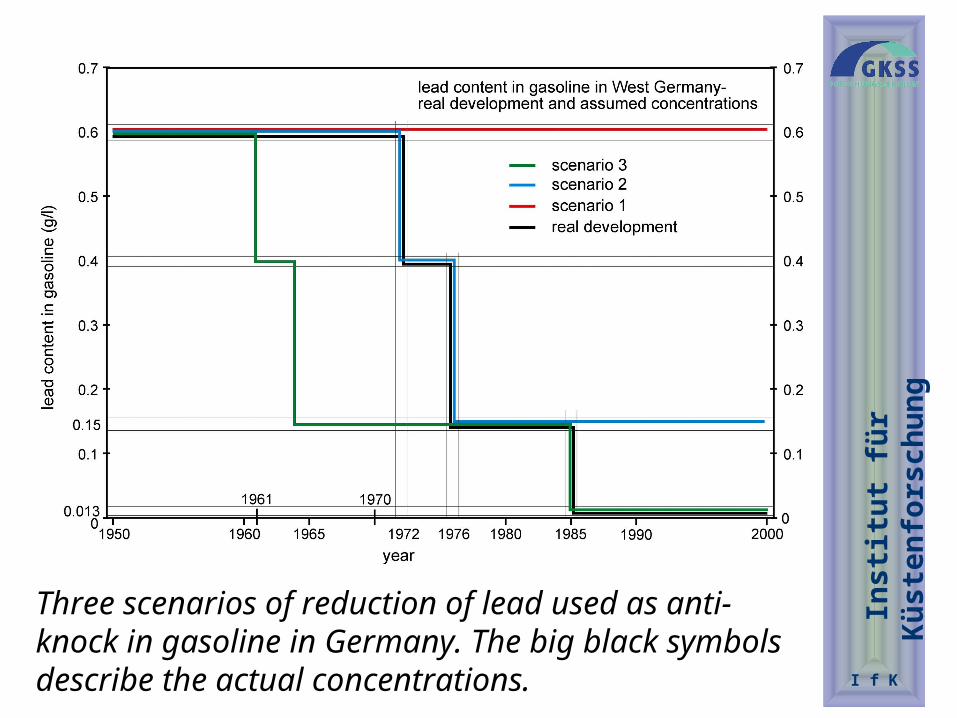
Three scenarios of reduction of lead used as anti-knock in gasoline in Germany. The big black symbols describe the actual concentrations.
Inst
itut f
ür K
üste
nfor
schu
ng
I f K
1950 1960 1970 1980 1990 2000
0
100
200
300
400lea
d con
cent
ratio
n in b
lood,
g/l
lead concentrations in human bloodadults in Münster
scenario 1: m eansscenario 1: 90% ilesscenario 1: 95% ilesscenario 2: 90% ilesscenario 3: 90% iles
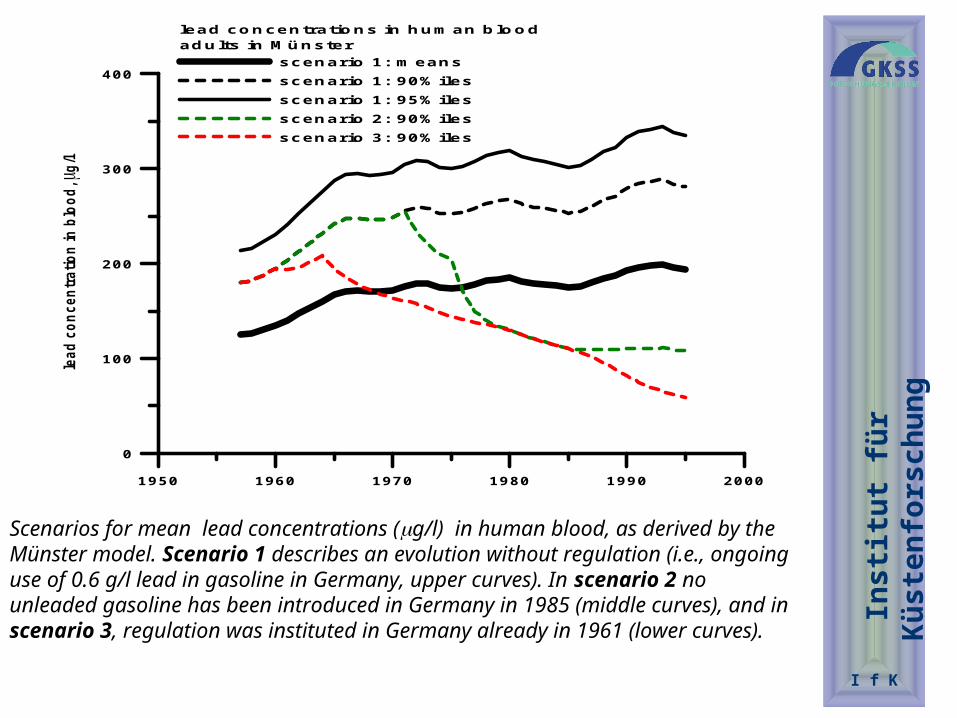
Scenarios for mean lead concentrations (g/l) in human blood, as derived by the Münster model. Scenario 1 describes an evolution without regulation (i.e., ongoing use of 0.6 g/l lead in gasoline in Germany, upper curves). In scenario 2 no unleaded gasoline has been introduced in Germany in 1985 (middle curves), and in scenario 3, regulation was instituted in Germany already in 1961 (lower curves).
Conclusions
• It is possible to reconstruct atmospheric lead concentrations and blood lead levels using a simple regression model
• It is possible to estimate lead concentrations in human blood using only lead emissions
• Reducing the lead content in gasoline was a successful environmental policy to limit human health risks

Inst
itut f
ür K
üste
nfor
schu
ng
I f K
Rest of the world
Inst
itut f
ür K
üste
nfor
schu
ng
I f K
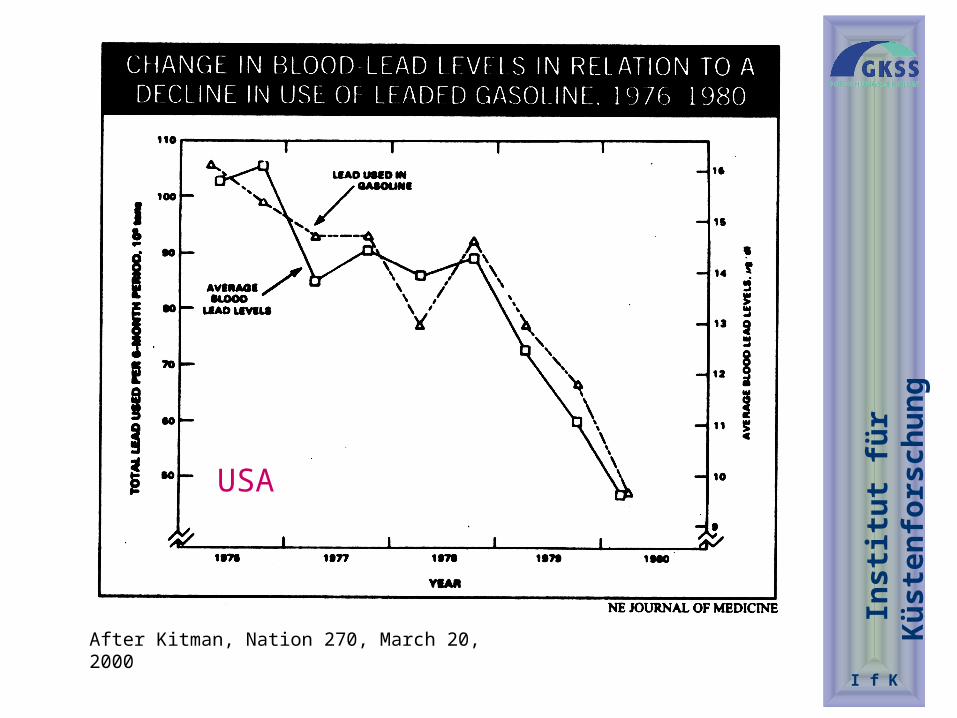
USA
After Kitman, Nation 270, March 20, 2000

May 8, 2001
New Warnings on Lead and ChildrenBy ERIC NAGOURNEY
new study raises questions about whether the current measure used to define lead poisoning is stringent enough.
Lead poisoning has been redefined over the years, as doctors have decided that smaller and smaller amounts are acceptable. It is now considered to occur at 10 micrograms of lead per deciliter of blood.
But researchers told a recent gathering of the Pediatric Academic Societies of evidence that even at levels lower than that, lead in the bloodstream appears dangerous.
The primary researcher, Dr. Bruce Lanphear of the Children's Hospital Medical Center of Cincinnati, said that in the children he and his colleagues had studied, I.Q. declined in those with less than 10 micrograms of lead per deciliter of blood. The findings, he said, suggest that millions more children in the United States than previously suspected may be at risk.
"This is clearly a major public health crisis, and there really is too much complacency about this as a public health issue," he said.
The researchers studied 276 children born in five hospitals in Rochester, N.Y., and then kept track of them for five years, measuring their lead levels and then their I.Q.'s at age 5.
The researchers reported finding an inverse relationship between I.Q. and lead levels. Among all the children, they said, there was an average 5.5 percent reduction in I.Q. for every 10-microgram increase in lead.
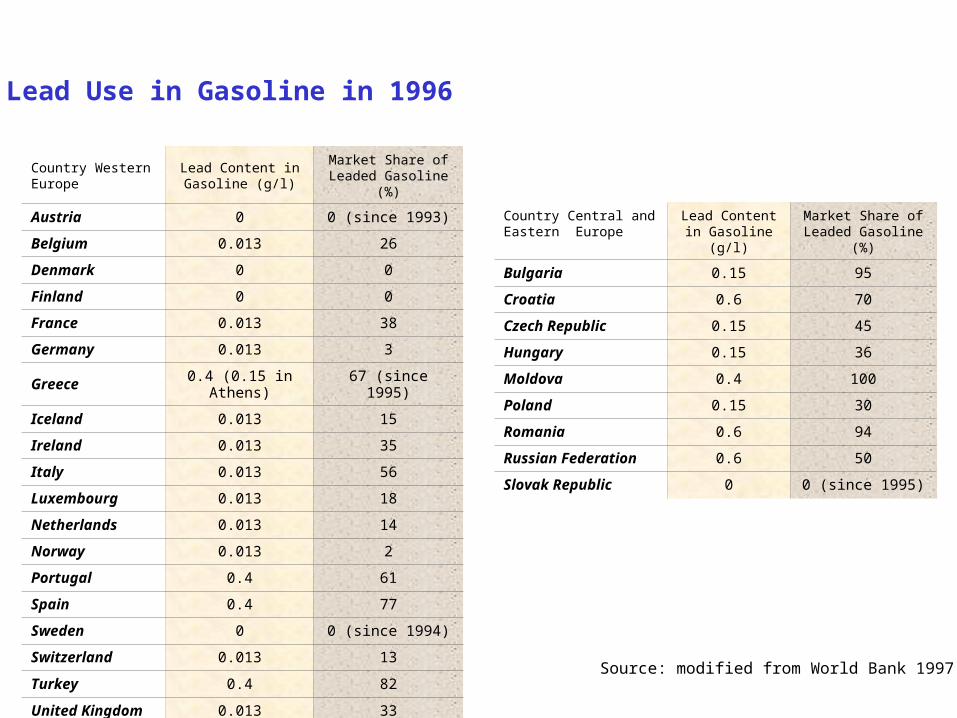
Lead Use in Gasoline in 1996
Country Western Europe
Lead Content in Gasoline (g/l)
Market Share of Leaded Gasoline (%)
Austria 0 0 (since 1993)
Belgium 0.013 26
Denmark 0 0
Finland 0 0
France 0.013 38
Germany 0.013 3
Greece 0.4 (0.15 in Athens) 67 (since 1995)
Iceland 0.013 15
Ireland 0.013 35
Italy 0.013 56
Luxembourg 0.013 18
Netherlands 0.013 14
Norway 0.013 2
Portugal 0.4 61
Spain 0.4 77
Sweden 0 0 (since 1994)
Switzerland 0.013 13
Turkey 0.4 82
United Kingdom 0.013 33
Country Central and Eastern Europe
Lead Content in Gasoline (g/l)
Market Share of Leaded Gasoline (%)
Bulgaria 0.15 95
Croatia 0.6 70
Czech Republic 0.15 45
Hungary 0.15 36
Moldova 0.4 100
Poland 0.15 30
Romania 0.6 94
Russian Federation 0.6 50
Slovak Republic 0 0 (since 1995)
Source: modified from World Bank 1997
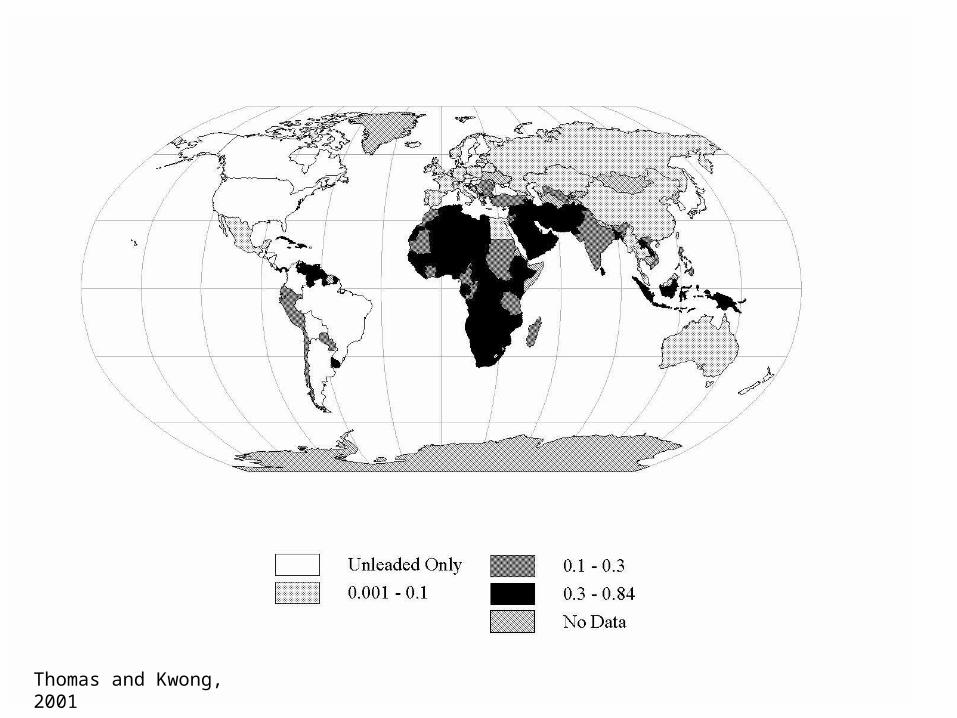
Thomas and Kwong, 2001
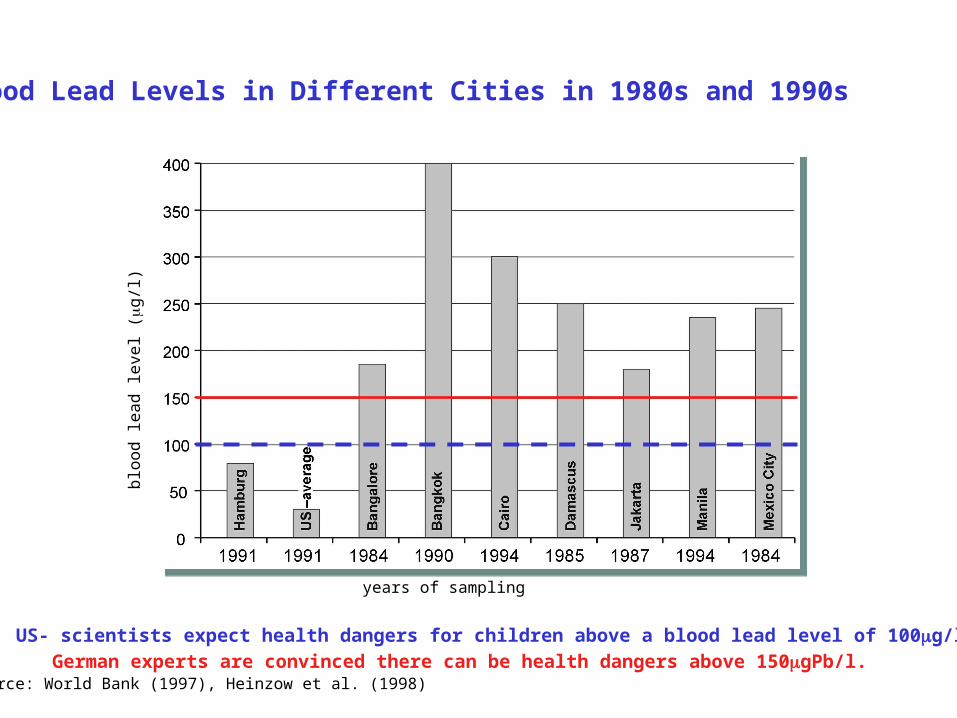
Source: World Bank (1997), Heinzow et al. (1998)
Blood Lead Levels in Different Cities in 1980s and 1990s
US- scientists expect health dangers for children above a blood lead level of 100g/l.German experts are convinced there can be health dangers above 150gPb/l.
bloo
d le
ad le
vel (
g/l)
years of sampling

Inst
itut f
ür K
üste
nfor
schu
ng
I f K
Web-page
http://w3g.gkss.de/staff/blei/index.html