Embed Size (px)
Citation preview
IPC ACUTE FOOD INSECURITY AND ACUTE mAlNUTRITION ANAlYSIS
July 2019 – October 2019 Issued October 2019
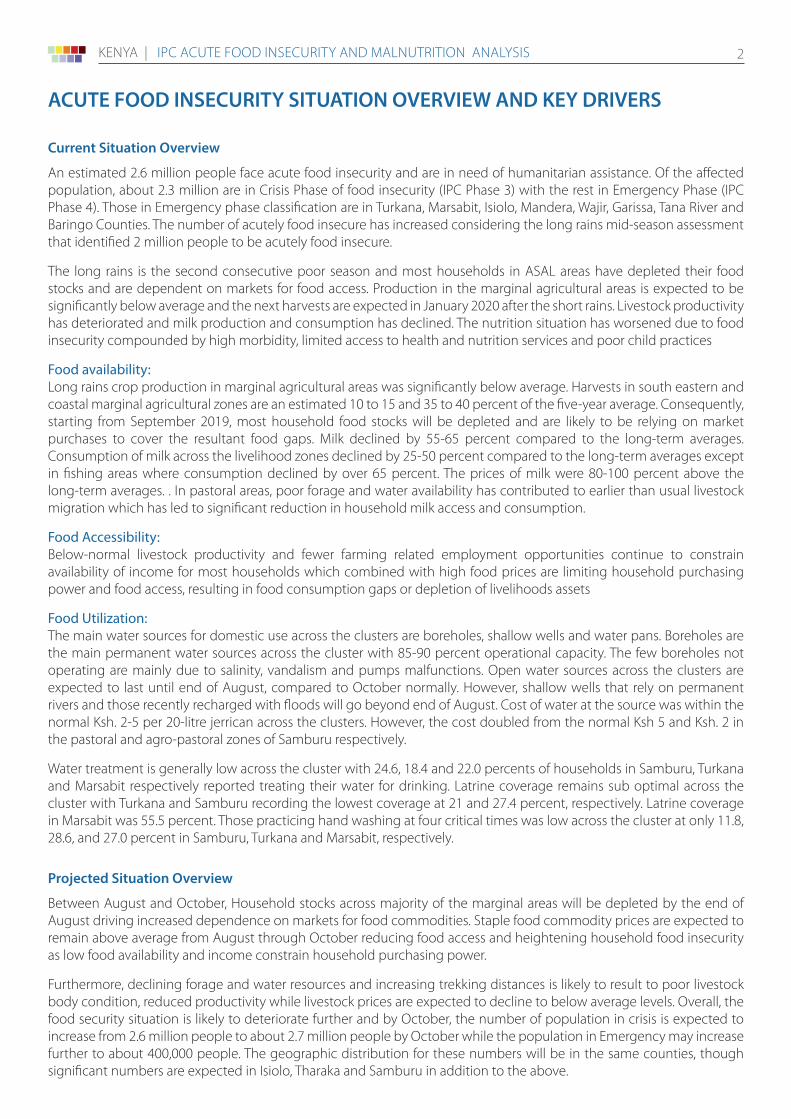
How severe, how many and when: In July 2019, estimated 2.6 Million people (19% of the population in ASAL) are classified in IPC phase 3 and/or worse acute food insecurity. Comparing to 2018 same period, around 700,000 people were classified in Crisis (IPC Phase 3). The deterioration and severity of food insecurity was mainly attributed to performance of the seasonal rainfall. In the projection period of August to October 2019, the population in crisis and above is expected to increase from 2.6 million people to about 3.1 million people, while the population in Emergency possibly will increase from 298,000 to 357,000.
Where and who: In July 2019, while almost all the counties have populations in either Crisis or Emergency, majority of these populations are in Turkana, Mandera, Baringo Wajir, Garissa, Marsabit and Tana river in the predominant pastoral livelihoods and Kitui, Makueni, Kilifi, Meru North in the marginal agricultural and agro pastoral livelihoods. During the projection period of August to October 2019, the geographic distribution for these numbers are in Turkana, Mandera, Baringo Wajir, Garissa, Marsabit and Tana river in the predominant pastoral livelihoods and Kitui, Makueni, Kilifi, Meru North in the marginal agricultural and agro pastoral livelihoods, with significant numbers are expected in Isiolo, Tharaka and Samburu.
Why: The main driver of food insecurity was the poor long rains season which was a second consecutive season. Poor rainfall coupled with high land surface temperatures in many areas led to poor crop and livestock production and rapid deterioration of rangeland resources. The scarcity of rangeland resources triggered an earlier-than-normal livestock migration into dry season grazing areas and also into atypical grazing areas such as game parks and reserves, which resulted in resource-based conflicts. These led to minor livestock losses, displacement and death. There was also an outbreak of human diseases among them an outbreak of Kalazaar disease in the northern pastoral areas as well as cholera. Livestock diseases were also prevalent in both the pastoral and marginal agricultural areas were Foot and Mouth Disease (FMD), Contagious Caprine Pleuro-pneumonia (CCPP), Pestes des Petits Ruminants (PPR), Lumpy Skin Disease (LSD) and Heart Water.
Current Acute Food Insecurity - Current July 2019
ACUTE FOOD INSECURITY - CURRENT JUlY 2019
2.6m18% of the population
People facing severe acute food insecurity (IPC Phase 3+)
IN NEED OF URGENT ACTION
Phase 5 0People in Catastrophe
Phase 4 298,000People in Emergency
Phase 3 2,270,000People in Crisis
Phase 2 6,556,000People in Stress
Phase 1 4,758,000People minimally food insecure
Wajir
Marsabit
Turkana
Kitui
Garissa
Isiolo
Tana River
Kilifi
Mandera
Kajiado
Samburu
Narok
Taita Taveta
Baringo
Meru
Kwale
Laikipia
Nakuru
Nyeri
Lamu
Nakuru
Makueni
West Pokot
Siaya
MachakosMigori
Nandi
EmbuHoma BayBomet
Kisumu
Kiambu
Kericho
Busia
Kisii
Bungoma
Nyandarua
KakamegaUasin Gishu
Murang'a
Trans Nzoia
Tharaka-Nithi
Elgeyo-Marakwet
Kirinyaga
Nairobi
MombasaMombasa
MAP KEYIPC Acute Food Insecurity
(mapped Phase represents
at least 20% of the population)
1 - Minimal
2 - Stressed
3 - Crisis
4 - Emergency
5 - Famine
Urban settlement classification
ACUTE mAlNUTRITION - APRIl 2019 - FEB 2020
Severe Acute Malnutrition (SAM) 133,500
Moderate Acute Malnutrition (MAM) 490,500
69,330Pregnant or lactating women acutely malnourished
IN NEED OF TREATMENT
624,500the number of 6-59 months children acutely malnourished
IN NEED OF TREATMENT
KENYA Food insecurity persists across the ASAls counties exacerbated by consecutive poor seasonal performance
PROJECTED AUgUST 2019 - OCTOBER 2019
3.1m22% of the population
People facing severe acute food insecurity (IPC Phase 3+)
IN NEED OF URGENT ACTION
Phase 5 0People in Catastrophe
Phase 4 357,000People in Emergency
Phase 3 2,739,000People in Crisis
Phase 2 6,016,000People in Stress
Phase 1 4,769,000People minimally food insecure
kenya | IPC aCUTe FOOD InSeCURITy anD MalnUTRITIOn analySIS 2
ACUTE FOOD INSECURITY SITUATION OVERVIEW AND KEY DRIVERS
Current Situation Overview
An estimated 2.6 million people face acute food insecurity and are in need of humanitarian assistance. Of the affected population, about 2.3 million are in Crisis Phase of food insecurity (IPC Phase 3) with the rest in Emergency Phase (IPC Phase 4). Those in Emergency phase classification are in Turkana, Marsabit, Isiolo, Mandera, Wajir, Garissa, Tana River and Baringo Counties. The number of acutely food insecure has increased considering the long rains mid-season assessment that identified 2 million people to be acutely food insecure.
The long rains is the second consecutive poor season and most households in ASAL areas have depleted their food stocks and are dependent on markets for food access. Production in the marginal agricultural areas is expected to be significantly below average and the next harvests are expected in January 2020 after the short rains. Livestock productivity has deteriorated and milk production and consumption has declined. The nutrition situation has worsened due to food insecurity compounded by high morbidity, limited access to health and nutrition services and poor child practices
Food availability:Long rains crop production in marginal agricultural areas was significantly below average. Harvests in south eastern and coastal marginal agricultural zones are an estimated 10 to 15 and 35 to 40 percent of the five-year average. Consequently, starting from September 2019, most household food stocks will be depleted and are likely to be relying on market purchases to cover the resultant food gaps. Milk declined by 55-65 percent compared to the long-term averages. Consumption of milk across the livelihood zones declined by 25-50 percent compared to the long-term averages except in fishing areas where consumption declined by over 65 percent. The prices of milk were 80-100 percent above the long-term averages. . In pastoral areas, poor forage and water availability has contributed to earlier than usual livestock migration which has led to significant reduction in household milk access and consumption.
Food Accessibility:Below-normal livestock productivity and fewer farming related employment opportunities continue to constrain availability of income for most households which combined with high food prices are limiting household purchasing power and food access, resulting in food consumption gaps or depletion of livelihoods assets
Food Utilization:The main water sources for domestic use across the clusters are boreholes, shallow wells and water pans. Boreholes are the main permanent water sources across the cluster with 85-90 percent operational capacity. The few boreholes not operating are mainly due to salinity, vandalism and pumps malfunctions. Open water sources across the clusters are expected to last until end of August, compared to October normally. However, shallow wells that rely on permanent rivers and those recently recharged with floods will go beyond end of August. Cost of water at the source was within the normal Ksh. 2-5 per 20-litre jerrican across the clusters. However, the cost doubled from the normal Ksh 5 and Ksh. 2 in the pastoral and agro-pastoral zones of Samburu respectively.
Water treatment is generally low across the cluster with 24.6, 18.4 and 22.0 percents of households in Samburu, Turkana and Marsabit respectively reported treating their water for drinking. Latrine coverage remains sub optimal across the cluster with Turkana and Samburu recording the lowest coverage at 21 and 27.4 percent, respectively. Latrine coverage in Marsabit was 55.5 percent. Those practicing hand washing at four critical times was low across the cluster at only 11.8, 28.6, and 27.0 percent in Samburu, Turkana and Marsabit, respectively.
Projected Situation Overview
Between August and October, Household stocks across majority of the marginal areas will be depleted by the end of August driving increased dependence on markets for food commodities. Staple food commodity prices are expected to remain above average from August through October reducing food access and heightening household food insecurity as low food availability and income constrain household purchasing power.
Furthermore, declining forage and water resources and increasing trekking distances is likely to result to poor livestock body condition, reduced productivity while livestock prices are expected to decline to below average levels. Overall, the food security situation is likely to deteriorate further and by October, the number of population in crisis is expected to increase from 2.6 million people to about 2.7 million people by October while the population in Emergency may increase further to about 400,000 people. The geographic distribution for these numbers will be in the same counties, though significant numbers are expected in Isiolo, Tharaka and Samburu in addition to the above.
kenya | IPC aCUTe FOOD InSeCURITy anD MalnUTRITIOn analySIS 3
ACUTE mAlNUTRITION SITUATION OVERVIEW AND KEY DRIVERS
Current Situation Overview
According to the Integrated Phase Classification for Acute Malnutrition conducted in July 2019, nutrition situation has deteriorated in several counties compared to February 2019 (Figure 1) with Laisamis, Turkana South and North being in extremely critical phase (Phase 5; GAM WHZ ≥30 percent). North Horr, Turkana Central and West, Mandera, Wajir, Garissa as well as Tiaty in Baringo County were in critical phase (Phase 4; GAM WHZ 15.0 - 29.9 percent) while West Pokot and Isiolo Counties were classified in serious phase (Phase 3; GAM WHZ 10.0 -14.9 percent). Saku, Moyale, Baringo North and South were in poor phase (Phase 2; GAM WHZ ≥ 5 to 9.9 percent) while Laikipia, Kitui, Narok, Kajiado, Taita Taveta, Kilifi, Kwale and Lamu were in acceptable phase (Phase 1; GAM WHZ <5 percent).
The high prevalence of acute malnutrition is mainly attributed to poor food availability with low milk production and consumption and increasing food prices observed in the most affected areas This has resulted from the cumulative negative effect of the below average 2018 short rains and the late on set of the 2019 long rains. High morbidity, limited access to health and nutrition services following scale down of integrated outreaches in some areas such as Laisamis in Marsabit, poor child practices coupled with pre-existing factors such as poverty, high illiteracy and poor infrastructure have aggravated the problem. Rains have been received in selected parts of ASAL counties such as Turkana and pasture has regenerated. However, the effect of the rains on milk availability will not be felt in the coming few months as animals will take time to breed as their body condition recover.
Projected Situation Overview
Acute malnutrition levels are expected to remain high though in the same phase in most areas assessed except in North Horr and Moyale which will deteriorate to phase 5 and 3 respectively. The expected high malnutrition levels will be mainly due to the projected food insecurity resulting from the increasing food prices, reduced milk availability as animals move further away from homes in search of pasture and deteriorating animal condition. The expected deterioration of WASH indicators due to drought and the associated increase in WASH related morbidities, the persistent cholera outbreak in selected counties such as Kajiado and Wajir and, Kalazaar in Marsabit and Wajir will impact negatively on malnutrition levels in the affected counties.
kenya | IPC aCUTe FOOD InSeCURITy anD MalnUTRITIOn analySIS 4
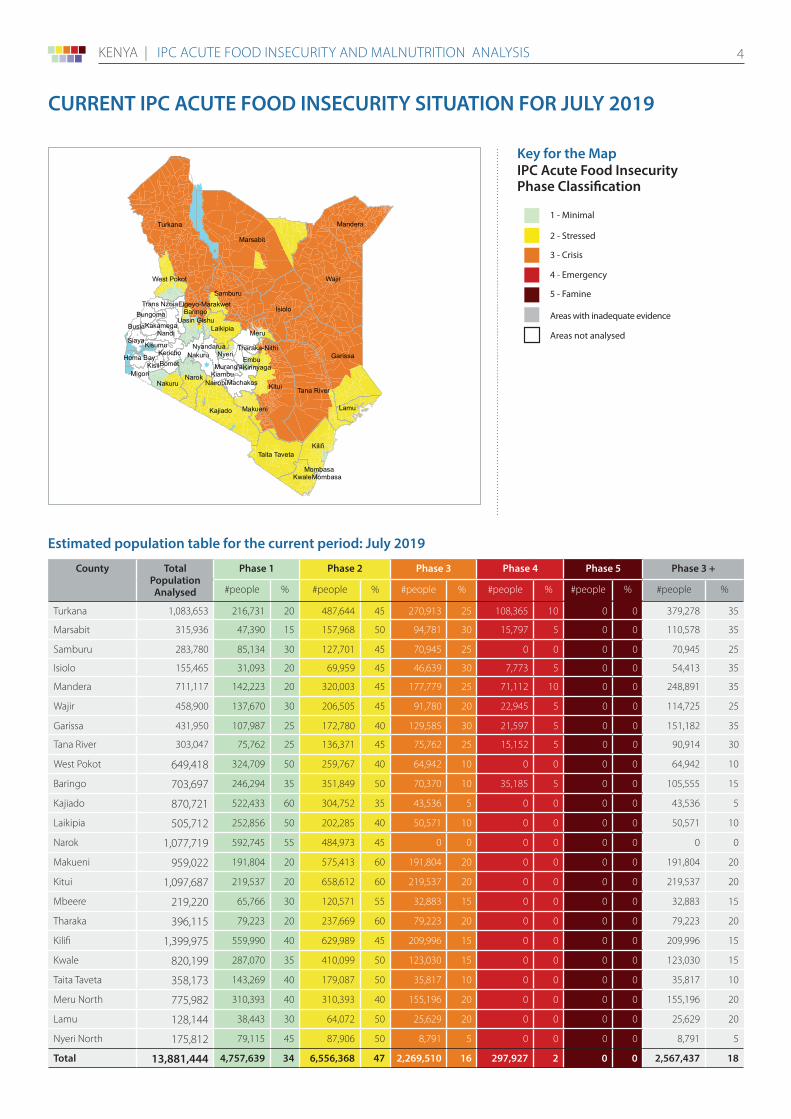
CURRENT IPC ACUTE FOOD INSECURITY SITUATION FOR JUlY 2019
Wajir
Marsabit
Turkana
Kitui
Garissa
Isiolo
Tana River
Kilifi
Mandera
Kajiado
Samburu
Narok
Taita Taveta
Baringo
Meru
Kwale
Laikipia
Nakuru
Nyeri
Lamu
Nakuru
Makueni
West Pokot
Siaya
MachakosMigori
Nandi
EmbuHoma BayBomet
Kisumu
Kiambu
Kericho
Busia
Kisii
Bungoma
Nyandarua
KakamegaUasin Gishu
Murang'a
Trans Nzoia
Tharaka-Nithi
Elgeyo-Marakwet
Kirinyaga
Nairobi
MombasaMombasa
Map Symbols
Urban settlement classification
1 - Minimal
2 - Stressed
3 - Crisis
4 - Emergency
5 - Famine
Areas with inadequate evidence
Areas not analysed
> 25% of households meet 25-50%of caloric needs through assistance
> 25% of households meet > 50% of caloric needs through assistance
AcceptableMediumHigh
Evidence Level
***
***
Classi�cation takes into account levelshumanitarian food assistance provided
Key for the map IPC Acute Food Insecurity Phase Classification
County Total PopulationAnalysed
Phase 1 Phase 2 Phase 3 Phase 4 Phase 5 Phase 3 +
#people % #people % #people % #people % #people % #people %
Turkana 1,083,653 216,731 20 487,644 45 270,913 25 108,365 10 0 0 379,278 35
Marsabit 315,936 47,390 15 157,968 50 94,781 30 15,797 5 0 0 110,578 35
Samburu 283,780 85,134 30 127,701 45 70,945 25 0 0 0 0 70,945 25
Isiolo 155,465 31,093 20 69,959 45 46,639 30 7,773 5 0 0 54,413 35
Mandera 711,117 142,223 20 320,003 45 177,779 25 71,112 10 0 0 248,891 35
Wajir 458,900 137,670 30 206,505 45 91,780 20 22,945 5 0 0 114,725 25
Garissa 431,950 107,987 25 172,780 40 129,585 30 21,597 5 0 0 151,182 35
Tana River 303,047 75,762 25 136,371 45 75,762 25 15,152 5 0 0 90,914 30
West Pokot 649,418 324,709 50 259,767 40 64,942 10 0 0 0 0 64,942 10
Baringo 703,697 246,294 35 351,849 50 70,370 10 35,185 5 0 0 105,555 15
Kajiado 870,721 522,433 60 304,752 35 43,536 5 0 0 0 0 43,536 5
Laikipia 505,712 252,856 50 202,285 40 50,571 10 0 0 0 0 50,571 10
Narok 1,077,719 592,745 55 484,973 45 0 0 0 0 0 0 0 0
Makueni 959,022 191,804 20 575,413 60 191,804 20 0 0 0 0 191,804 20
Kitui 1,097,687 219,537 20 658,612 60 219,537 20 0 0 0 0 219,537 20
Mbeere 219,220 65,766 30 120,571 55 32,883 15 0 0 0 0 32,883 15
Tharaka 396,115 79,223 20 237,669 60 79,223 20 0 0 0 0 79,223 20
Kilifi 1,399,975 559,990 40 629,989 45 209,996 15 0 0 0 0 209,996 15
Kwale 820,199 287,070 35 410,099 50 123,030 15 0 0 0 0 123,030 15
Taita Taveta 358,173 143,269 40 179,087 50 35,817 10 0 0 0 0 35,817 10
Meru North 775,982 310,393 40 310,393 40 155,196 20 0 0 0 0 155,196 20
Lamu 128,144 38,443 30 64,072 50 25,629 20 0 0 0 0 25,629 20
Nyeri North 175,812 79,115 45 87,906 50 8,791 5 0 0 0 0 8,791 5
Total 13,881,444 4,757,639 34 6,556,368 47 2,269,510 16 297,927 2 0 0 2,567,437 18
Estimated population table for the current period: July 2019
kenya | IPC aCUTe FOOD InSeCURITy anD MalnUTRITIOn analySIS 5
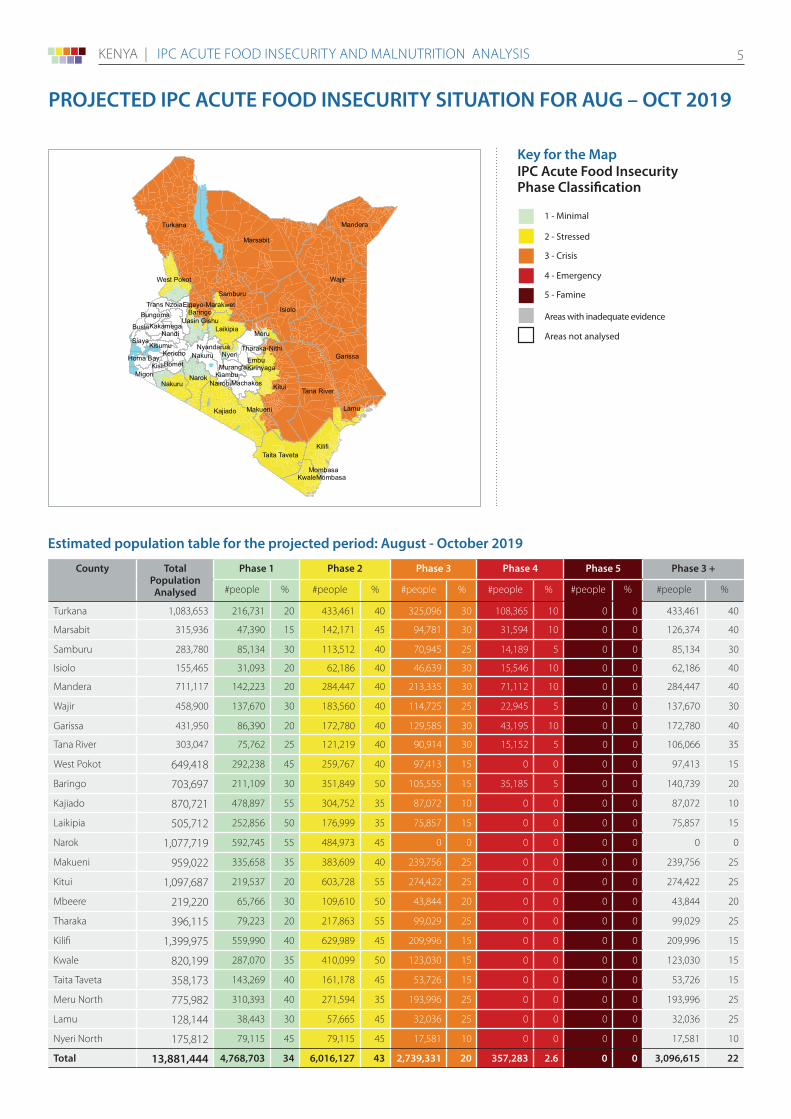
PROJECTED IPC ACUTE FOOD INSECURITY SITUATION FOR AUg – OCT 2019
Wajir
Marsabit
Turkana
Kitui
Garissa
Isiolo
Tana River
Kilifi
Mandera
Kajiado
Samburu
Narok
Taita Taveta
Baringo
Meru
Kwale
Laikipia
Nakuru
Nyeri
Lamu
Nakuru
Makueni
West Pokot
Siaya
MachakosMigori
Nandi
EmbuHoma BayBomet
Kisumu
Kiambu
Kericho
Busia
Kisii
Bungoma
Nyandarua
KakamegaUasin Gishu
Murang'a
Trans Nzoia
Tharaka-Nithi
Elgeyo-Marakwet
Kirinyaga
Nairobi
MombasaMombasa
Map Symbols
Urban settlement classification
1 - Minimal
2 - Stressed
3 - Crisis
4 - Emergency
5 - Famine
Areas with inadequate evidence
Areas not analysed
> 25% of households meet 25-50%of caloric needs through assistance
> 25% of households meet > 50% of caloric needs through assistance
AcceptableMediumHigh
Evidence Level
***
***
Classi�cation takes into account levelshumanitarian food assistance provided
Key for the map IPC Acute Food Insecurity Phase Classification
County Total PopulationAnalysed
Phase 1 Phase 2 Phase 3 Phase 4 Phase 5 Phase 3 +
#people % #people % #people % #people % #people % #people %
Turkana 1,083,653 216,731 20 433,461 40 325,096 30 108,365 10 0 0 433,461 40
Marsabit 315,936 47,390 15 142,171 45 94,781 30 31,594 10 0 0 126,374 40
Samburu 283,780 85,134 30 113,512 40 70,945 25 14,189 5 0 0 85,134 30
Isiolo 155,465 31,093 20 62,186 40 46,639 30 15,546 10 0 0 62,186 40
Mandera 711,117 142,223 20 284,447 40 213,335 30 71,112 10 0 0 284,447 40
Wajir 458,900 137,670 30 183,560 40 114,725 25 22,945 5 0 0 137,670 30
Garissa 431,950 86,390 20 172,780 40 129,585 30 43,195 10 0 0 172,780 40
Tana River 303,047 75,762 25 121,219 40 90,914 30 15,152 5 0 0 106,066 35
West Pokot 649,418 292,238 45 259,767 40 97,413 15 0 0 0 0 97,413 15
Baringo 703,697 211,109 30 351,849 50 105,555 15 35,185 5 0 0 140,739 20
Kajiado 870,721 478,897 55 304,752 35 87,072 10 0 0 0 0 87,072 10
Laikipia 505,712 252,856 50 176,999 35 75,857 15 0 0 0 0 75,857 15
Narok 1,077,719 592,745 55 484,973 45 0 0 0 0 0 0 0 0
Makueni 959,022 335,658 35 383,609 40 239,756 25 0 0 0 0 239,756 25
Kitui 1,097,687 219,537 20 603,728 55 274,422 25 0 0 0 0 274,422 25
Mbeere 219,220 65,766 30 109,610 50 43,844 20 0 0 0 0 43,844 20
Tharaka 396,115 79,223 20 217,863 55 99,029 25 0 0 0 0 99,029 25
Kilifi 1,399,975 559,990 40 629,989 45 209,996 15 0 0 0 0 209,996 15
Kwale 820,199 287,070 35 410,099 50 123,030 15 0 0 0 0 123,030 15
Taita Taveta 358,173 143,269 40 161,178 45 53,726 15 0 0 0 0 53,726 15
Meru North 775,982 310,393 40 271,594 35 193,996 25 0 0 0 0 193,996 25
Lamu 128,144 38,443 30 57,665 45 32,036 25 0 0 0 0 32,036 25
Nyeri North 175,812 79,115 45 79,115 45 17,581 10 0 0 0 0 17,581 10
Total 13,881,444 4,768,703 34 6,016,127 43 2,739,331 20 357,283 2.6 0 0 3,096,615 22
Estimated population table for the projected period: August - October 2019
kenya | IPC aCUTe FOOD InSeCURITy anD MalnUTRITIOn analySIS 6
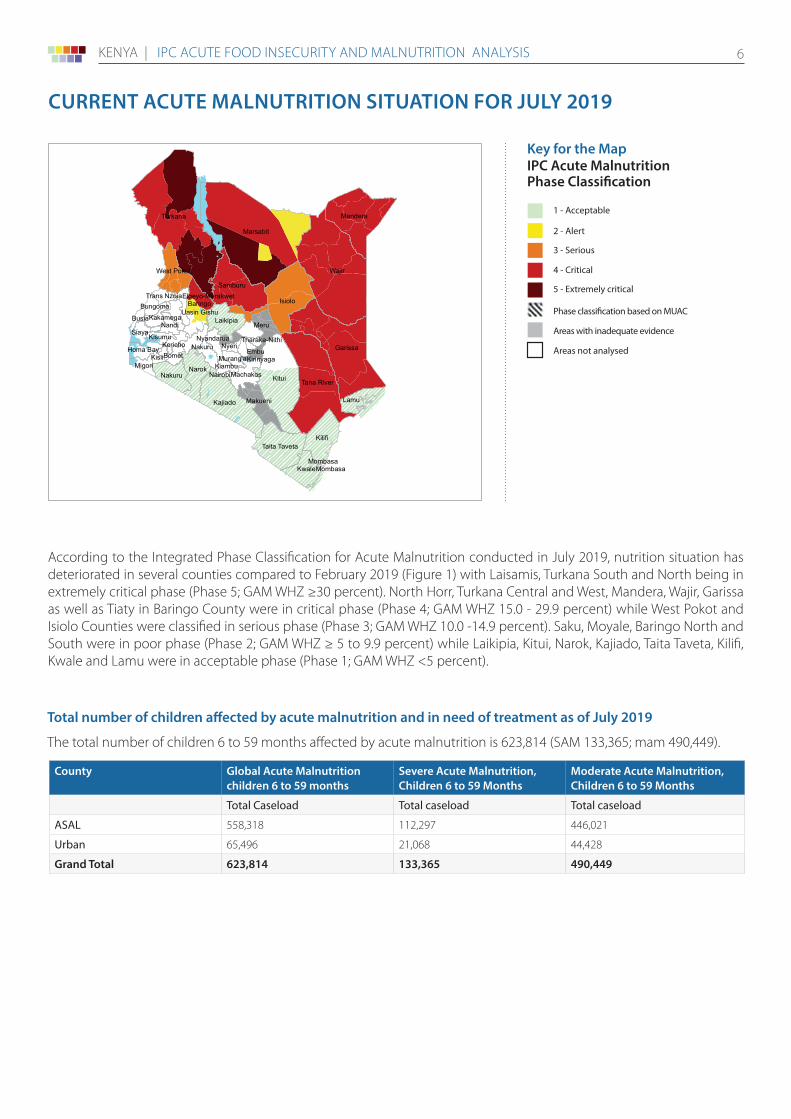
According to the Integrated Phase Classification for Acute Malnutrition conducted in July 2019, nutrition situation has deteriorated in several counties compared to February 2019 (Figure 1) with Laisamis, Turkana South and North being in extremely critical phase (Phase 5; GAM WHZ ≥30 percent). North Horr, Turkana Central and West, Mandera, Wajir, Garissa as well as Tiaty in Baringo County were in critical phase (Phase 4; GAM WHZ 15.0 - 29.9 percent) while West Pokot and Isiolo Counties were classified in serious phase (Phase 3; GAM WHZ 10.0 -14.9 percent). Saku, Moyale, Baringo North and South were in poor phase (Phase 2; GAM WHZ ≥ 5 to 9.9 percent) while Laikipia, Kitui, Narok, Kajiado, Taita Taveta, Kilifi, Kwale and Lamu were in acceptable phase (Phase 1; GAM WHZ <5 percent).
CURRENT ACUTE mAlNUTRITION SITUATION FOR JUlY 2019
Wajir
Marsabit
Turkana
Kitui
Garissa
Isiolo
Tana River
Kilifi
Mandera
Kajiado
Samburu
Narok
Taita Taveta
Baringo
Meru
Kwale
Laikipia
Nakuru
Nyeri
Lamu
Nakuru
Makueni
West Pokot
Siaya
MachakosMigori
Nandi
EmbuHoma BayBomet
Kisumu
Kiambu
Kericho
Busia
Kisii
Bungoma
Nyandarua
KakamegaUasin Gishu
Murang'a
Trans Nzoia
Tharaka-Nithi
Elgeyo-Marakwet
Kirinyaga
Nairobi
MombasaMombasa
Key for the map IPC Acute malnutrition Phase Classification
Map Symbols
Urban settlement classification
1 - Acceptable
2 - Alert
3 - Serious
4 - Critical
5 - Extremely critical
Areas with inadequate evidence
Phase classification based on MUAC
Areas not analysed
AcceptableMediumHigh
Evidence Level
***
***
County global Acute malnutrition children 6 to 59 months
Severe Acute malnutrition, Children 6 to 59 months
moderate Acute malnutrition, Children 6 to 59 months
Total Caseload Total caseload Total caseload
ASAL 558,318 112,297 446,021
Urban 65,496 21,068 44,428
grand Total 623,814 133,365 490,449
Total number of children affected by acute malnutrition and in need of treatment as of July 2019
The total number of children 6 to 59 months affected by acute malnutrition is 623,814 (SAM 133,365; mam 490,449).
kenya | IPC aCUTe FOOD InSeCURITy anD MalnUTRITIOn analySIS 7
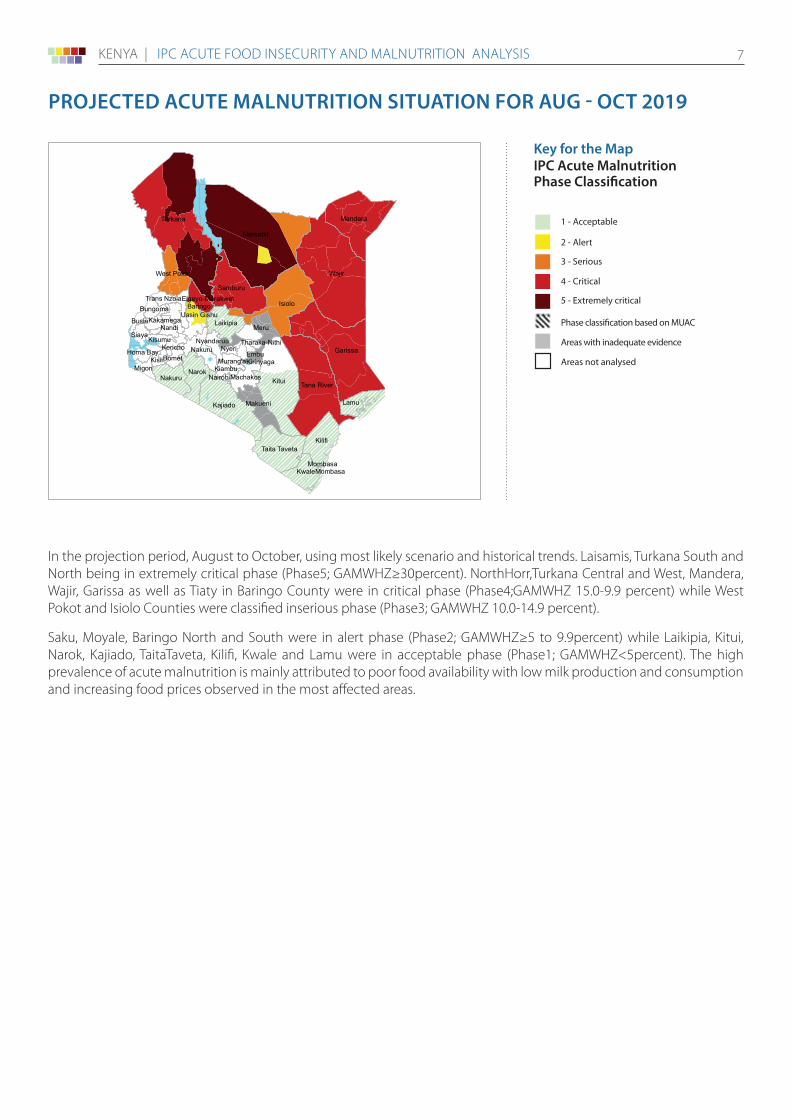
In the projection period, August to October, using most likely scenario and historical trends. Laisamis, Turkana South and North being in extremely critical phase (Phase5; GAMWHZ≥30percent). NorthHorr,Turkana Central and West, Mandera, Wajir, Garissa as well as Tiaty in Baringo County were in critical phase (Phase4;GAMWHZ 15.0-9.9 percent) while West Pokot and Isiolo Counties were classified inserious phase (Phase3; GAMWHZ 10.0-14.9 percent).
Saku, Moyale, Baringo North and South were in alert phase (Phase2; GAMWHZ≥5 to 9.9percent) while Laikipia, Kitui, Narok, Kajiado, TaitaTaveta, Kilifi, Kwale and Lamu were in acceptable phase (Phase1; GAMWHZ<5percent). The high prevalence of acute malnutrition is mainly attributed to poor food availability with low milk production and consumption and increasing food prices observed in the most affected areas.
PROJECTED ACUTE mAlNUTRITION SITUATION FOR AUg - OCT 2019
Wajir
Marsabit
Turkana
Kitui
Garissa
Isiolo
Tana River
Kilifi
Mandera
Kajiado
Samburu
Narok
Taita Taveta
Baringo
Meru
Kwale
Laikipia
Nakuru
Nyeri
Lamu
Nakuru
Makueni
West Pokot
Siaya
MachakosMigori
Nandi
EmbuHoma BayBomet
Kisumu
Kiambu
Kericho
Busia
Kisii
Bungoma
Nyandarua
KakamegaUasin Gishu
Murang'a
Trans Nzoia
Tharaka-Nithi
Elgeyo-Marakwet
Kirinyaga
Nairobi
MombasaMombasa
Key for the map IPC Acute malnutrition Phase Classification
Map Symbols
Urban settlement classification
1 - Acceptable
2 - Alert
3 - Serious
4 - Critical
5 - Extremely critical
Areas with inadequate evidence
Phase classification based on MUAC
Areas not analysed
AcceptableMediumHigh
Evidence Level
***
***
kenya | IPC aCUTe FOOD InSeCURITy anD MalnUTRITIOn analySIS 8
Response Priorities
Food Security• Food and safety nets to an estimated 2.6 million food insecure people in need of assistance with interventions focused
on reducing malnutrition and increasing resilience of the affected communities.
• Supplementary feeding for children 6 to 59 months and pregnant and lactating women in the most affected counties.
• Provision of farm inputs, support to livestock disease control, provision of livestock feeds, water infrastructure maintenance, repair and spare parts for boreholes, provision of school feeding meals.
• Crop and livestock insurance schemes to reduce climate related risks to vulnerable populations.
Nutrition• Strengthen community/health facility linkages and scale up community level activities such as active case finding,
mass screening and integrated outreaches in the most affected areas for timely detection and treatment of acute malnutrition among children under five years and PLW
• Ensure nutrition commodities are available to manage the increased caseload
• Advocate for food sector response to bridge the food gap at household level
• Consider implementing Blanket Supplementary Feeding Program (BSFP) for areas with high levels of acute malnutrition to prevent and mitigate the effects of acute malnutrition
• Increase program performance monitoring, nutrition surveillance and scale up IMAM surge approach through existing partnerships for early warning, system capacity adjustment and early action
• Continue nutrition capacity strengthening for improved health and nutrition service delivery
• Promote and strengthen already existing multi-sectoral engagement and collaboration to ensure coordinated multi-sectoral efforts and synergy to address contributory factors of acute malnutrition across sectors
• Continued advocacy and inclusion of nutrition outcomes for under-fives as core indicators in agriculture, WASH, education, food security and social protection programs for concerted efforts and accountability to prevent and reduce vulnerability to acute malnutrition especially in arid areas
• Update contingency and response plans as part of early action and response
Situation monitoring and Update of Activities
Food SecurityThe key factors to monitor over the next six months include:
1. Performance of 2019 short rains given the poor performance of the cumulative effect of the below average 2018 short rains and late onset of the 2019 long rains
2. Crop production in the high and medium rainfall areas.
3. High and increasing staple food prices.
4. Close monitoring of the trends of malnutrition and related outcomes such as morbidity and deaths in the most affected counties.
5. Human disease outbreaks; mainly Cholera, Measles, Kalazaar and the rising trend of diarrhoea
Nutrition1. Performance of 2019 short rains given the poor performance of the cumulative effect of the below average 2018 short
rains and late onset of the 2019 long rains
2. Trends of malnutrition and related outcomes such as morbidity and deaths.
3. Scale up of live saving interventions (outreaches and mass screening) and IMAM program performance in areas with emergency levels of malnutrition
4. Disease outbreaks e.g. Cholera, Measles, Kalazaar and the rising trend of diarrhoea
RECOmmENDATIONS FOR ACTION
kenya | IPC aCUTe FOOD InSeCURITy anD MalnUTRITIOn analySIS 9
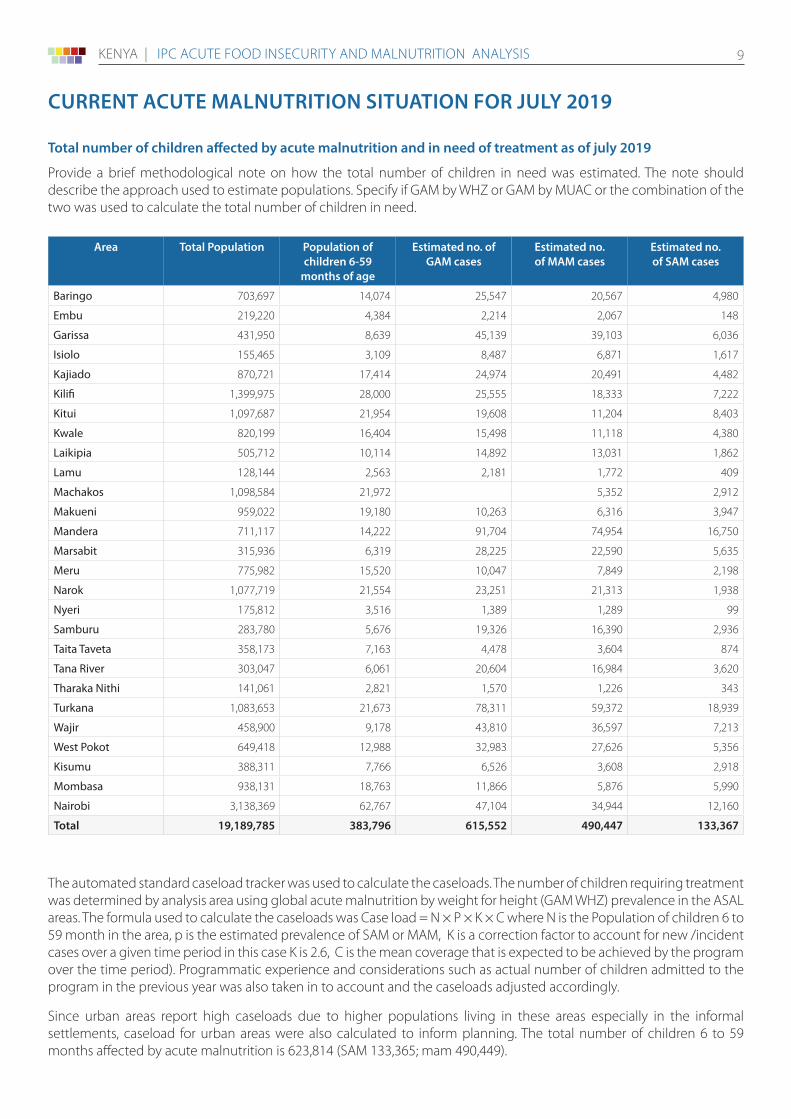
Total number of children affected by acute malnutrition and in need of treatment as of july 2019
Provide a brief methodological note on how the total number of children in need was estimated. The note should describe the approach used to estimate populations. Specify if GAM by WHZ or GAM by MUAC or the combination of the two was used to calculate the total number of children in need.
Area Total Population Population of children 6-59
months of age
Estimated no. of gAm cases
Estimated no. of mAm cases
Estimated no. of SAm cases
Baringo 703,697 14,074 25,547 20,567 4,980
Embu 219,220 4,384 2,214 2,067 148
Garissa 431,950 8,639 45,139 39,103 6,036
Isiolo 155,465 3,109 8,487 6,871 1,617
Kajiado 870,721 17,414 24,974 20,491 4,482
Kilifi 1,399,975 28,000 25,555 18,333 7,222
Kitui 1,097,687 21,954 19,608 11,204 8,403
Kwale 820,199 16,404 15,498 11,118 4,380
Laikipia 505,712 10,114 14,892 13,031 1,862
Lamu 128,144 2,563 2,181 1,772 409
Machakos 1,098,584 21,972 5,352 2,912
Makueni 959,022 19,180 10,263 6,316 3,947
Mandera 711,117 14,222 91,704 74,954 16,750
Marsabit 315,936 6,319 28,225 22,590 5,635
Meru 775,982 15,520 10,047 7,849 2,198
Narok 1,077,719 21,554 23,251 21,313 1,938
Nyeri 175,812 3,516 1,389 1,289 99
Samburu 283,780 5,676 19,326 16,390 2,936
Taita Taveta 358,173 7,163 4,478 3,604 874
Tana River 303,047 6,061 20,604 16,984 3,620
Tharaka Nithi 141,061 2,821 1,570 1,226 343
Turkana 1,083,653 21,673 78,311 59,372 18,939
Wajir 458,900 9,178 43,810 36,597 7,213
West Pokot 649,418 12,988 32,983 27,626 5,356
Kisumu 388,311 7,766 6,526 3,608 2,918
Mombasa 938,131 18,763 11,866 5,876 5,990
Nairobi 3,138,369 62,767 47,104 34,944 12,160
Total 19,189,785 383,796 615,552 490,447 133,367
CURRENT ACUTE mAlNUTRITION SITUATION FOR JUlY 2019
The automated standard caseload tracker was used to calculate the caseloads. The number of children requiring treatment was determined by analysis area using global acute malnutrition by weight for height (GAM WHZ) prevalence in the ASAL areas. The formula used to calculate the caseloads was Case load = N × P × K × C where N is the Population of children 6 to 59 month in the area, p is the estimated prevalence of SAM or MAM, K is a correction factor to account for new /incident cases over a given time period in this case K is 2.6, C is the mean coverage that is expected to be achieved by the program over the time period). Programmatic experience and considerations such as actual number of children admitted to the program in the previous year was also taken in to account and the caseloads adjusted accordingly.
Since urban areas report high caseloads due to higher populations living in these areas especially in the informal settlements, caseload for urban areas were also calculated to inform planning. The total number of children 6 to 59 months affected by acute malnutrition is 623,814 (SAM 133,365; mam 490,449).
kenya | IPC aCUTe FOOD InSeCURITy anD MalnUTRITIOn analySIS 10
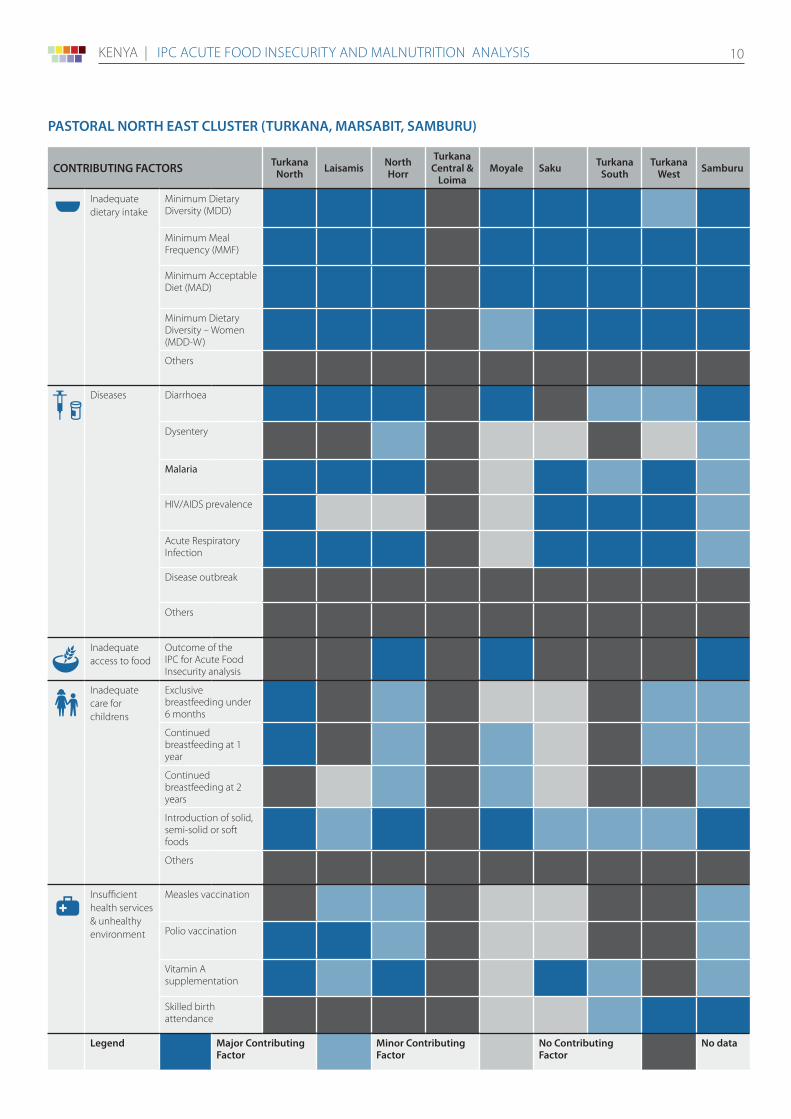
CONTRIBUTINg FACTORS Turkana North laisamis North
Horr
Turkana Central &
loimamoyale Saku Turkana
SouthTurkana
West Samburu
Inadequate dietary intake
Minimum Dietary Diversity (MDD)
Minimum Meal Frequency (MMF)
Minimum Acceptable Diet (MAD)
Minimum Dietary Diversity – Women (MDD-W)
Others
Diseases Diarrhoea
Dysentery
Malaria
HIV/AIDS prevalence
Acute Respiratory Infection
Disease outbreak
Others
Inadequate access to food
Outcome of the IPC for Acute Food Insecurity analysis
Inadequate care for childrens
Exclusive breastfeeding under 6 months
Continued breastfeeding at 1 year
Continued breastfeeding at 2 years
Introduction of solid, semi-solid or soft foods
Others
Insufficient health services & unhealthy environment
Measles vaccination
Polio vaccination
Vitamin A supplementation
Skilled birth attendance
legend major Contributing Factor
minor Contributing Factor
No Contributing Factor
No data
PASTORAl NORTH EAST ClUSTER (TURKANA, mARSABIT, SAmBURU)
kenya | IPC aCUTe FOOD InSeCURITy anD MalnUTRITIOn analySIS 11
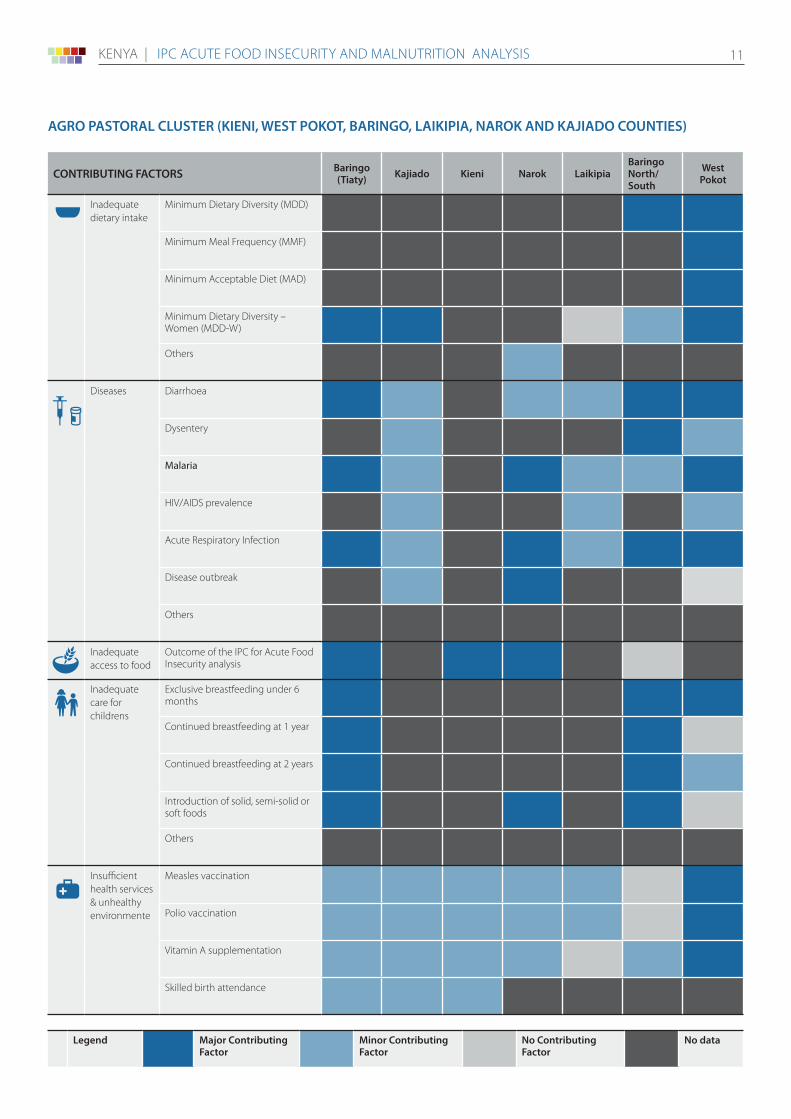
AgRO PASTORAl ClUSTER (KIENI, WEST POKOT, BARINgO, lAIKIPIA, NAROK AND KAJIADO COUNTIES)
CONTRIBUTINg FACTORS Baringo (Tiaty) Kajiado Kieni Narok laikipia
Baringo North/ South
West Pokot
Inadequate dietary intake
Minimum Dietary Diversity (MDD)
Minimum Meal Frequency (MMF)
Minimum Acceptable Diet (MAD)
Minimum Dietary Diversity – Women (MDD-W)
Others
Diseases Diarrhoea
Dysentery
Malaria
HIV/AIDS prevalence
Acute Respiratory Infection
Disease outbreak
Others
Inadequate access to food
Outcome of the IPC for Acute Food Insecurity analysis
Inadequate care for childrens
Exclusive breastfeeding under 6 months
Continued breastfeeding at 1 year
Continued breastfeeding at 2 years
Introduction of solid, semi-solid or soft foods
Others
Insufficient health services & unhealthy environmente
Measles vaccination
Polio vaccination
Vitamin A supplementation
Skilled birth attendance
legend major Contributing Factor
minor Contributing Factor
No Contributing Factor
No data
kenya | IPC aCUTe FOOD InSeCURITy anD MalnUTRITIOn analySIS 12
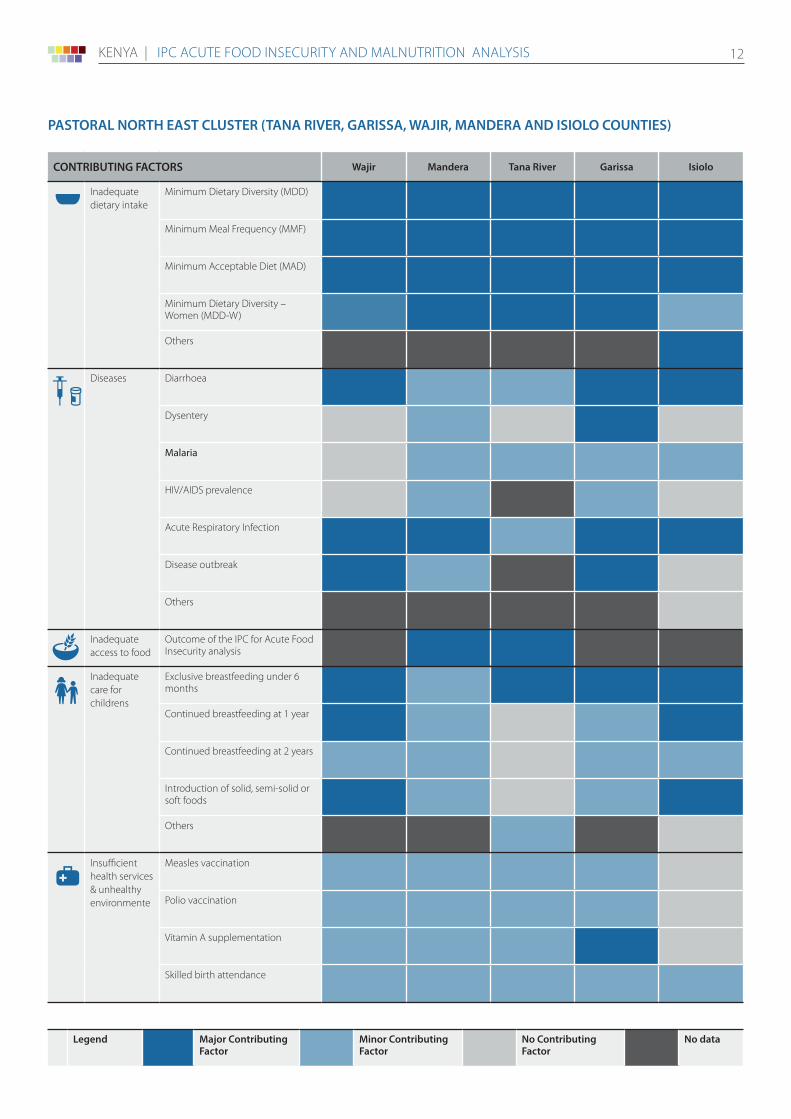
PASTORAl NORTH EAST ClUSTER (TANA RIVER, gARISSA, WAJIR, mANDERA AND ISIOlO COUNTIES)
CONTRIBUTINg FACTORS Wajir mandera Tana River garissa Isiolo
Inadequate dietary intake
Minimum Dietary Diversity (MDD)
Minimum Meal Frequency (MMF)
Minimum Acceptable Diet (MAD)
Minimum Dietary Diversity – Women (MDD-W)
Others
Diseases Diarrhoea
Dysentery
Malaria
HIV/AIDS prevalence
Acute Respiratory Infection
Disease outbreak
Others
Inadequate access to food
Outcome of the IPC for Acute Food Insecurity analysis
Inadequate care for childrens
Exclusive breastfeeding under 6 months
Continued breastfeeding at 1 year
Continued breastfeeding at 2 years
Introduction of solid, semi-solid or soft foods
Others
Insufficient health services & unhealthy environmente
Measles vaccination
Polio vaccination
Vitamin A supplementation
Skilled birth attendance
legend major Contributing Factor
minor Contributing Factor
No Contributing Factor
No data
kenya | IPC aCUTe FOOD InSeCURITy anD MalnUTRITIOn analySIS 13
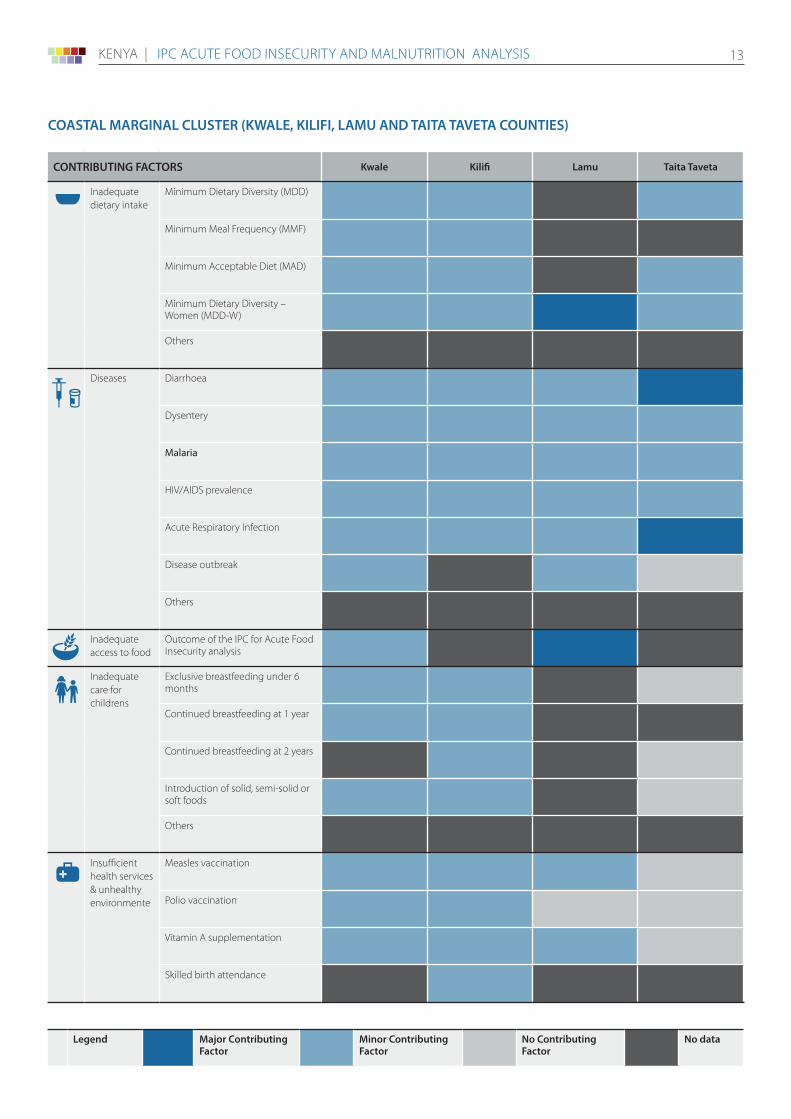
COASTAl mARgINAl ClUSTER (KWAlE, KIlIFI, lAmU AND TAITA TAVETA COUNTIES)
CONTRIBUTINg FACTORS Kwale Kilifi lamu Taita Taveta
Inadequate dietary intake
Minimum Dietary Diversity (MDD)
Minimum Meal Frequency (MMF)
Minimum Acceptable Diet (MAD)
Minimum Dietary Diversity – Women (MDD-W)
Others
Diseases Diarrhoea
Dysentery
Malaria
HIV/AIDS prevalence
Acute Respiratory Infection
Disease outbreak
Others
Inadequate access to food
Outcome of the IPC for Acute Food Insecurity analysis
Inadequate care for childrens
Exclusive breastfeeding under 6 months
Continued breastfeeding at 1 year
Continued breastfeeding at 2 years
Introduction of solid, semi-solid or soft foods
Others
Insufficient health services & unhealthy environmente
Measles vaccination
Polio vaccination
Vitamin A supplementation
Skilled birth attendance
legend major Contributing Factor
minor Contributing Factor
No Contributing Factor
No data
kenya | IPC aCUTe FOOD InSeCURITy anD MalnUTRITIOn analySIS 14
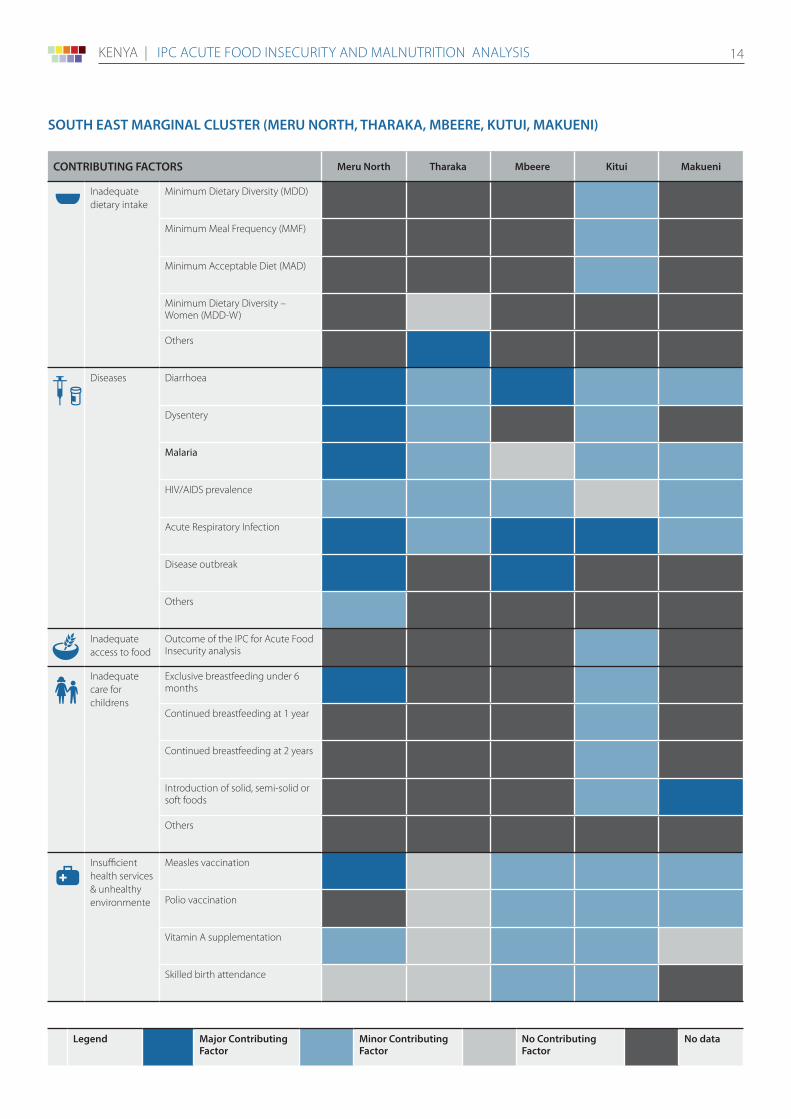
SOUTH EAST mARgINAl ClUSTER (mERU NORTH, THARAKA, mBEERE, KUTUI, mAKUENI)
CONTRIBUTINg FACTORS meru North Tharaka mbeere Kitui makueni
Inadequate dietary intake
Minimum Dietary Diversity (MDD)
Minimum Meal Frequency (MMF)
Minimum Acceptable Diet (MAD)
Minimum Dietary Diversity – Women (MDD-W)
Others
Diseases Diarrhoea
Dysentery
Malaria
HIV/AIDS prevalence
Acute Respiratory Infection
Disease outbreak
Others
Inadequate access to food
Outcome of the IPC for Acute Food Insecurity analysis
Inadequate care for childrens
Exclusive breastfeeding under 6 months
Continued breastfeeding at 1 year
Continued breastfeeding at 2 years
Introduction of solid, semi-solid or soft foods
Others
Insufficient health services & unhealthy environmente
Measles vaccination
Polio vaccination
Vitamin A supplementation
Skilled birth attendance
legend major Contributing Factor
minor Contributing Factor
No Contributing Factor
No data
kenya | IPC aCUTe FOOD InSeCURITy anD MalnUTRITIOn analySIS 15
PROCESS, mETHODOlOgY AND lImITATIONS
What is the IPC and IPC Acute Food Insecurity?
The IPC is a set of tools and procedures to classify the severity and characteristics of acute food and nutrition crises as well as chronic food insecurity based on international standards. The IPC consists of four mutually reinforcing functions, each with a set of specific protocols (tools and procedures). The core IPC parameters include consensus building, convergence of evidence, accountability, transparency and comparability. The IPC analysis aims at informing emergency response as well as medium and long-term food security policy and programming.
For the IPC, Acute Food Insecurity is defined as any manifestation of food insecurity found in a specified area at a specific point in time of a severity that threatens lives or livelihoods, or both, regardless of the causes, context or duration. It is highly susceptible to change and can occur and manifest in a population within a short amount of time, as a result of sudden changes or shocks that negatively impact on the determinants of food insecurity.
Contact for further InformationJames Odour IPC Chairperson (NDMA) [email protected].
John mwangi IPC Focal person (NDMA) [email protected].
IPC Global Support Unit www.ipcinfo.org
This analysis has been conducted under the patronage of the National Drought Management Authority (NDMA). It has benefited from the technical and financial support of the European Union
Classification of food insecurity and malnutrition was conducted using the IPC protocols, which are developed and implemented worldwide by the IPC Global Partnership - Action Against Hunger, CARE, CILSS, EC-JRC , FAO, FEWSNET, Global Food Security Cluster, Global Nutrition Cluster, IGAD, Oxfam, PROGRESAN-SICA, SADC, Save the Children, UNICEF and WFP.
Process and methodology
The 2019 Long Rains Assessment was conducted between 7th and 20th July 2019 by the Kenya Food Security Steering Group (KFSSG) in collaboration with the County Steering Groups (CSGs). The KFSSG is a multi-agency body comprised of government departments, UN agencies and NGOs concerned with food and nutrition security and is chaired by the National Drought Management Authority (NDMA) and co-chaired by the World Food Programme.
The assessment involved the collection of both primary and secondary data covering 23 counties that comprise the arid and semi-arid region of Kenya, and which are generally the most food insecure given their levels of aridity and vulnerability. The area covers over 80 percent of Kenya’s landmass.
The analysis focused on acute food insecurity, although chronic issues with a direct impact on acute food insecurity were also considered. The assessment was based on the four pillars of food security – food availability, access, utilization and stability – and looked at the contributing factors and outcomes and the effects on each sector. The assessment also identified interventions to address the issues arising in each sector: agriculture, livestock, water, health and nutrition, education, peace and security, and markets and trade.
limitations of the analysis
1. A large number of the analysis team members were new to IPC, therefore, the entire process moved a bit slowly than anticipated.
2. Inadequate reliable data for nutrition indicators. SMART nutrition surveys were conducted in only eight out of the 23 ASAL counties.
3. Insufficient historical data for some outcome indicators like livelihood coping presented challenges in interpreting seasonal trends and making a comparison between current and past situation
Sources
The principal sources included:
1. The NDMA’s drought early warning and monitoring system
2. Data collected from the relevant sectors at county and sub-county level
3. Community interviews and market interviews using focus group discussions and trader interviews
4. Primary and secondary data from nutrition surveys (SMART surveys)
5. Field observations during transect drives
6. Agro-climatic data from FEWS NET
FAMINE EARLY WARNING SYSTEMS NETWORK
FEWS NET
IPC Analysis Partners: