Embed Size (px)
Citation preview
Annual Review and
Bulletin of Statistics
2015
Copyright Reserved
Office of the Managing Director
Kenya Ports Authority
Mombasa
February 2016
KENYA PORTS AUTHORITY
ii
Vision, Mission and Core Values......................................................................................................................................................... iii
Notes and Definitions........................................................................................................................................................................... iv
Foreword................................................................................................................................................................................................
.........................................
v
Overview.................................................................................................................................................................................................
.........................................
vii
Port Performance………………………………………………………………………………………………………………………….......... 1
Port Performance: 2011 - 2015 (Table 1)…………………………………………………………………………………………………….. 1
Port Throughput: 2015 (Chart 1).......................................................................................................................................................... 1
Port Throughput: 2011 - 2015 (Chart 2)............................................................................................................................................... 2
Cargo Profile: 2011 - 2015 (Chart 3).................................................................................................................... ................................ 2
Principal Export Commodities: 2011 - 2015 (Table 2).......................................................................................................................... 3
Principal Import Commodities: 2011 - 2015 (Table 3).......................................................................................................................... 4
Top Ten Export Commodities: 2015 (Chart 4)..................................................................................................................................... 5
Top Ten Import Commodities: 2015 (Chart 5).................................................................................................................... .................. 5
Destination of Exports: 2015 (Chart 6)......................................................................................................................................... ...... 6
Origin of Imports: 2015 (Chart 7)....................................................................................................................................................... 6
Top Twenty Export Trading Partners: 2015 (Chart 8).................................................................................................................... .... 7
Top Twenty Import Trading Partners: 2015 (Chart 9).................................................................................................................... .... 7
Number of Motor Vehicles Discharged: 2011 - 2015 (Table 4).......................................................................................................... 8
Container Traffic: 2011 - 2015 (Table 5).................................................................................................................... ........................ 9
Container Traffic: 2011 - 2015 (Chart 10).......................................................................................................................................... 9
Transit Traffic: 2015 (Table 6)........................................................................................................................................................... 10
Transit Market: 2015 (Chart 11)......................................................................................................................................................... 11
Vessel Performance at Mombasa Container Terminal: 2015 (Table 7)............................................................................................. 12
Vessel Performance at Mombasa Container Terminal: 2015 (Chart 12)........................................................................................... 12
Vessel Calls and the Average Port Days per Ship: 2015 (Table 8)................................................................................................... 13
Analysis of Ships Waiting Time: 2011 - 2015 (Table 9).................................................................................................................... . 13
Average Waiting Days per Ship: 2011 - 2015 (Table 10)................................................................................................................... 14
Average Waiting Days per Ship: 2011 - 2015 (Chart 13)................................................................................................................... 14
Berth Occupancy (%): General Cargo Berths: 2011 - 2015 (Table 11)............................................................................................. 15
Berth Occupancy (%): General Cargo Berths: 2011 - 2015 (Chart 14).............................................................................................. 15
Berth Occupancy (%): Mombasa Container Terminal: 2011 - 2015 (Table 12)................................................................................. 16
Berth Occupancy (%): Mombasa Container Terminal: 2011 - 2015 (Chart 15)................................................................................. 16
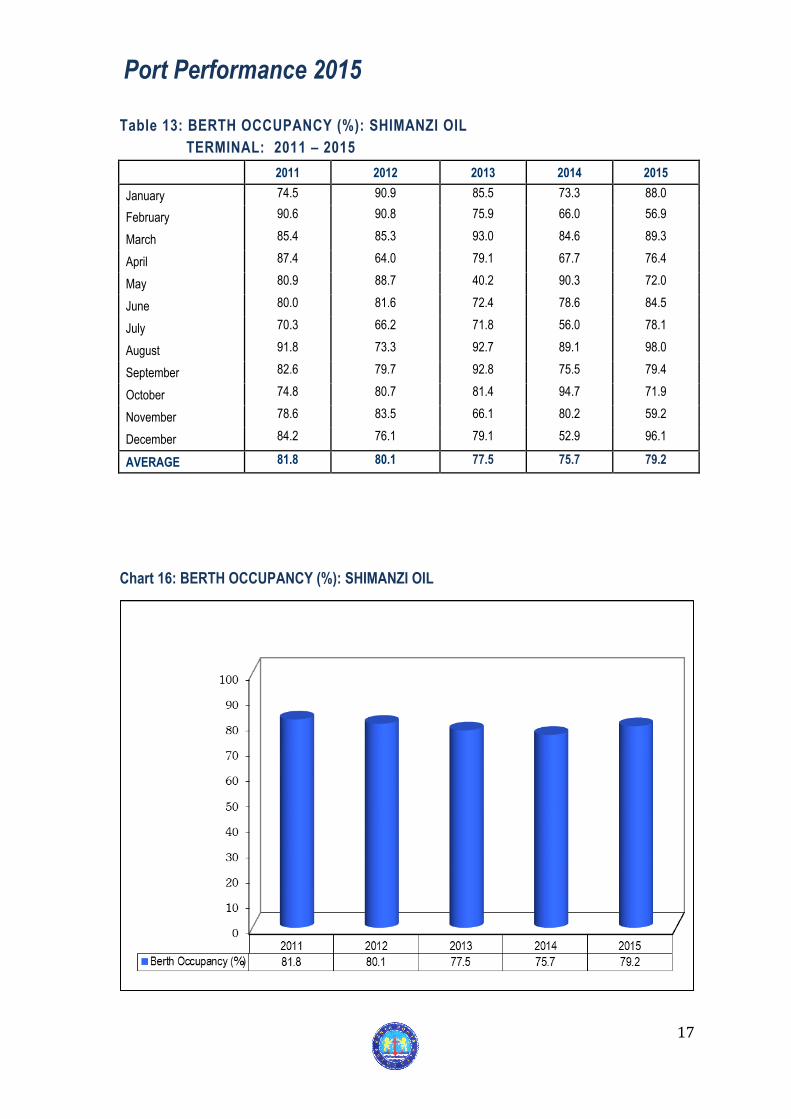
Berth Occupancy (%): Shimanzi Oil Terminal: 2011 - 2015 (Table 13)............................................................................................ 17
Berth Occupancy (%): Shimanzi Oil Terminal: 2011 - 2015 (Chart 16)............................................................................................ 17
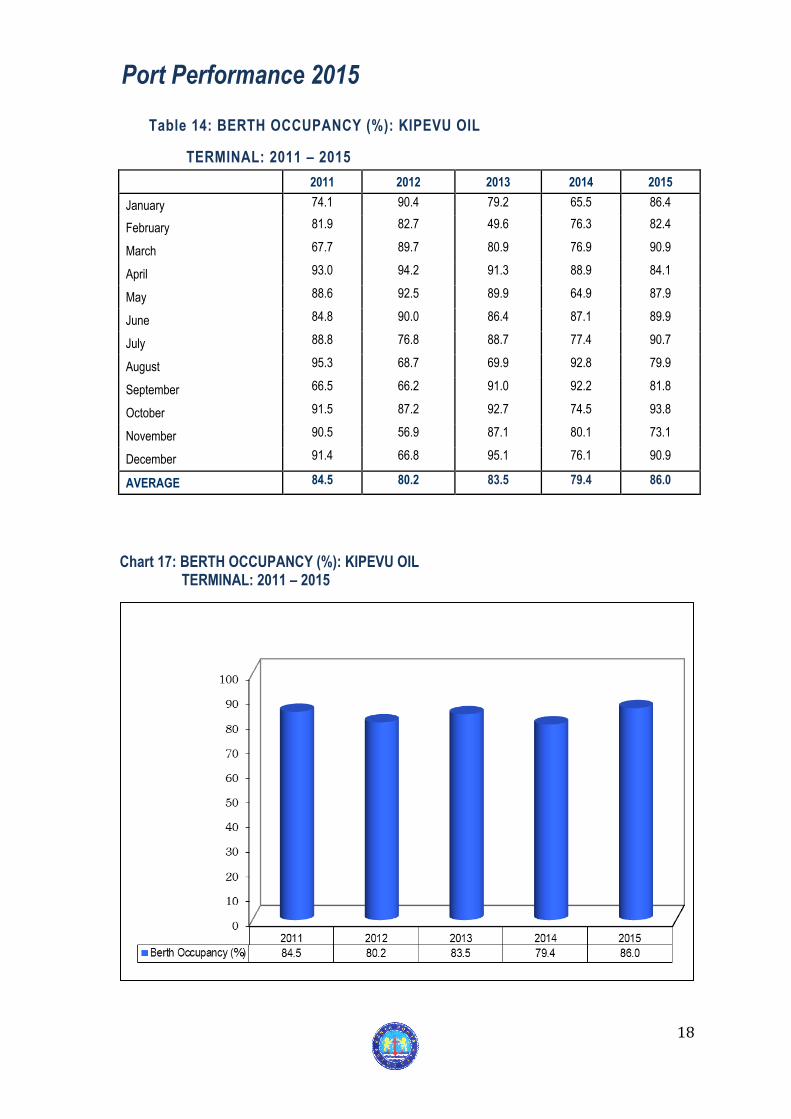
Berth Occupancy (%): Kipevu Oil Terminal: 2011 - 2015 (Table 14)................................................................................................. 18
Berth Occupancy (%): Kipevu Oil Terminal: 2011 - 2015 (Chart 17)................................................................................................. 18
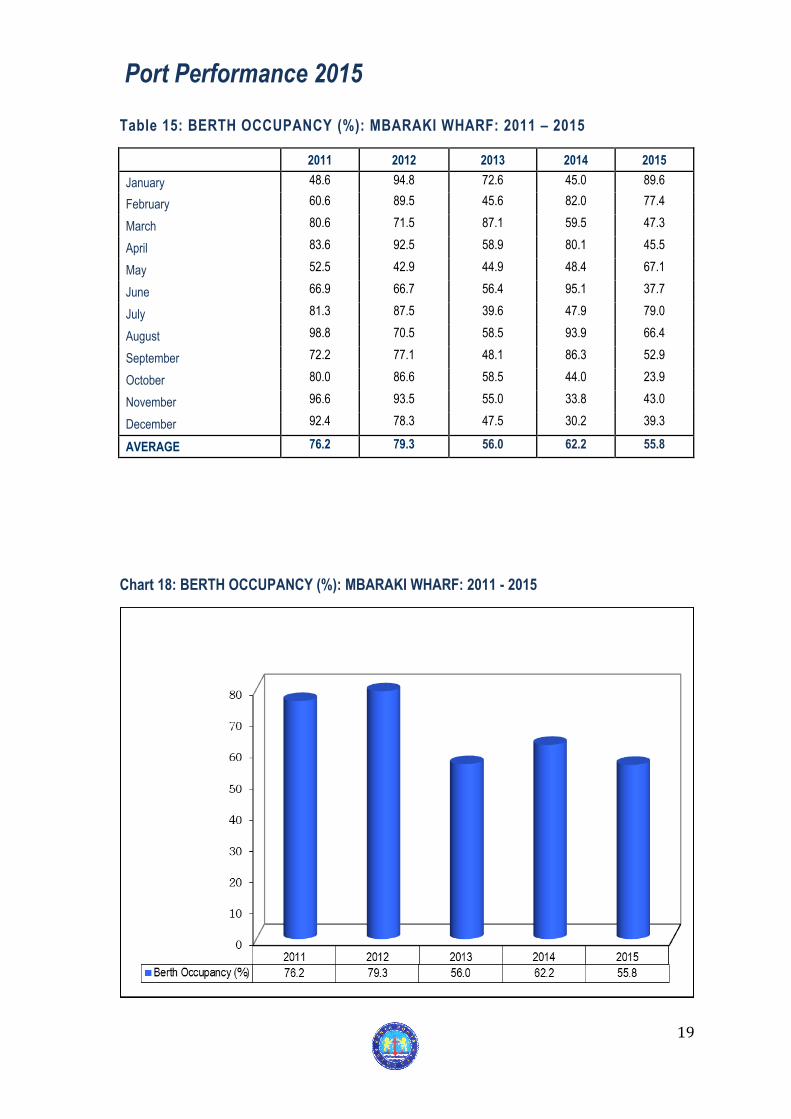
Berth Occupancy (%): Mbaraki Wharf: 2011 - 2015 (Table 15)......................................................................................................... 19
Berth Occupancy (%): Mbaraki Wharf: 2011 - 2015 (Chart 18)......................................................................................................... 19
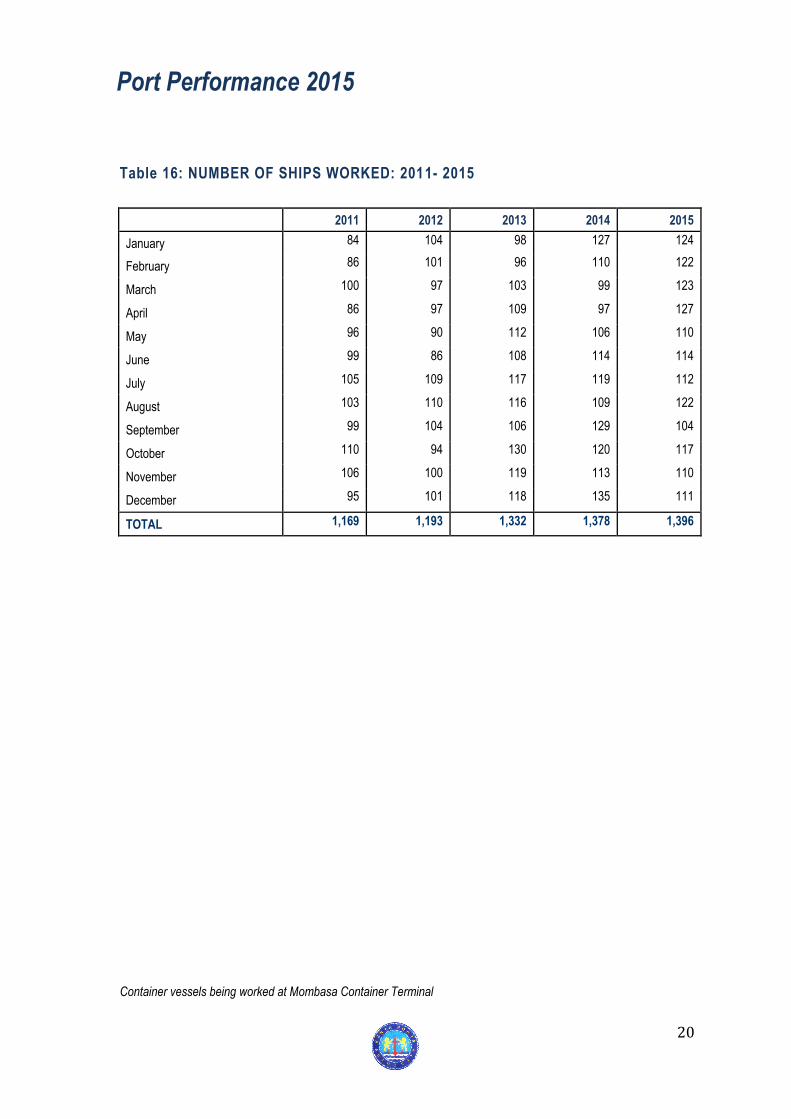
Number of Ships Worked: 2011 - 2015: (Table 16)......................................................................................................................... 20
Average Tonnage of Dry Cargo Handled per Ship Working Day: 2011 - 2015 (Table 17)................................................................ 21
Average Tonnage of Dry Cargo per Gang Shift: 2011 - 2015: (Table 18)......................................................................................... 21
Average Equipment Reliability (%): 2015 (Chart 19)......................................................................................................................... 22
Nairobi Inland Container Depot Traffic : 2011 - 2015 (Table 19)....................................................................................................... 23
Kisumu Inland Container Depot Traffic: 2011 - 2015 (Table 20)....................................................................................................... 23
Cruise Traffic: 2011 - 2015 (Table 21).............................................................................................................................................. 23
Number of Cruise Vessels: 2011 - 2015 (Chart 20)........................................................................................................................... 23
Financial Performance................................................................................................................................................................... 24 Balance Sheet as at 30th June: 2010/11 - 2014/15 (Table 22)......................................................................................................... 24
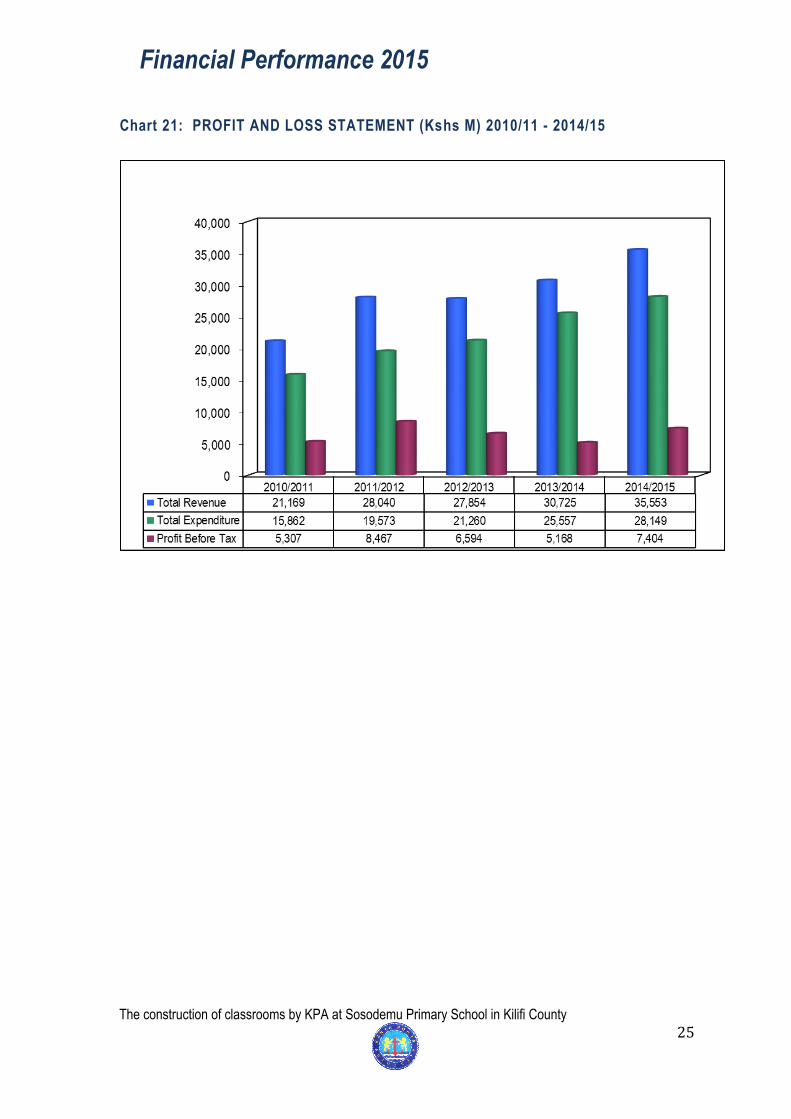
Profit and Loss Statement (Kshs. M): 2010/11 - 2014/15 (Chart 21)................................................................................................. 25
Port Facilities...................................................................................................................................................................................... 26
Berths and Jetties: 2015 (Table 23)................................................................................................................................................. .... 26
Sheds/Stacking Grounds: 2015 (Table 24).......................................................................................................................................... 27
Equipment: 2015 (Table 25)............................................................................................................................ ..................................... 28
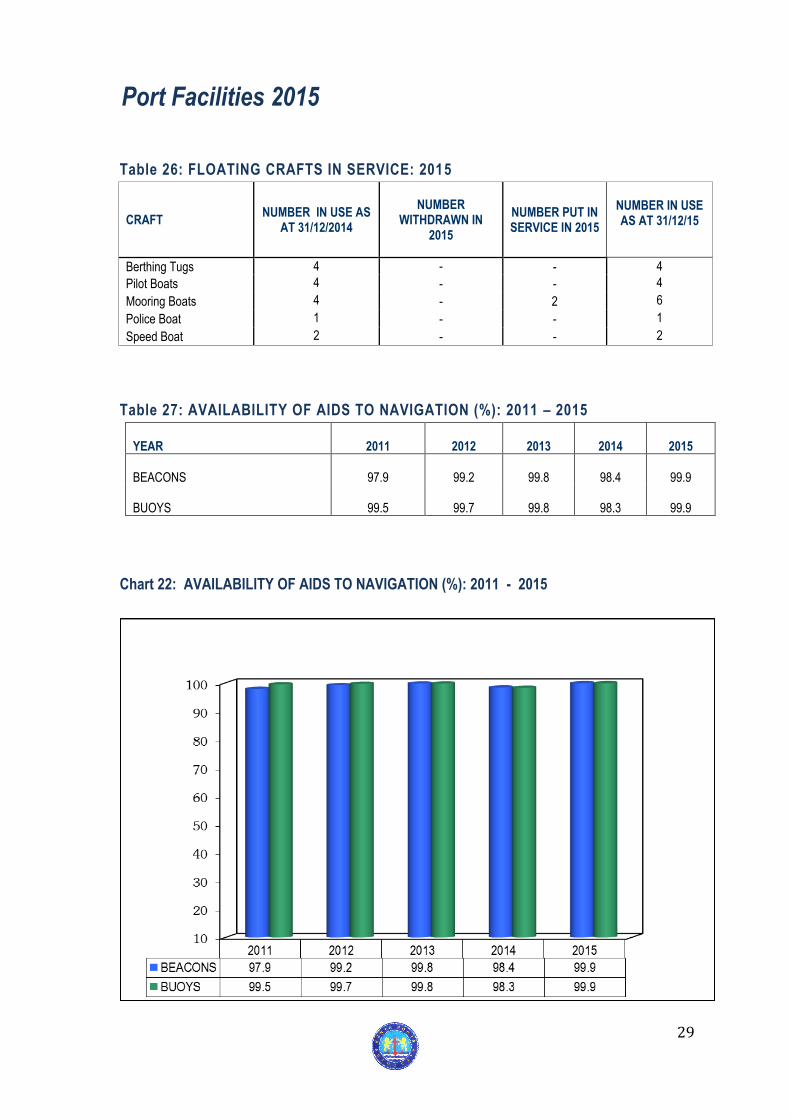
Floating Crafts in Service: 2015 (Table 26).......................................................................................................................................... 29
Availability of Aids to Navigation: 2011 - 2015 (Table 27).................................................................................................................... 29
Availability of Aids to Navigation: 2011 - 2015 (Chart 23).................................................................................................................... 29
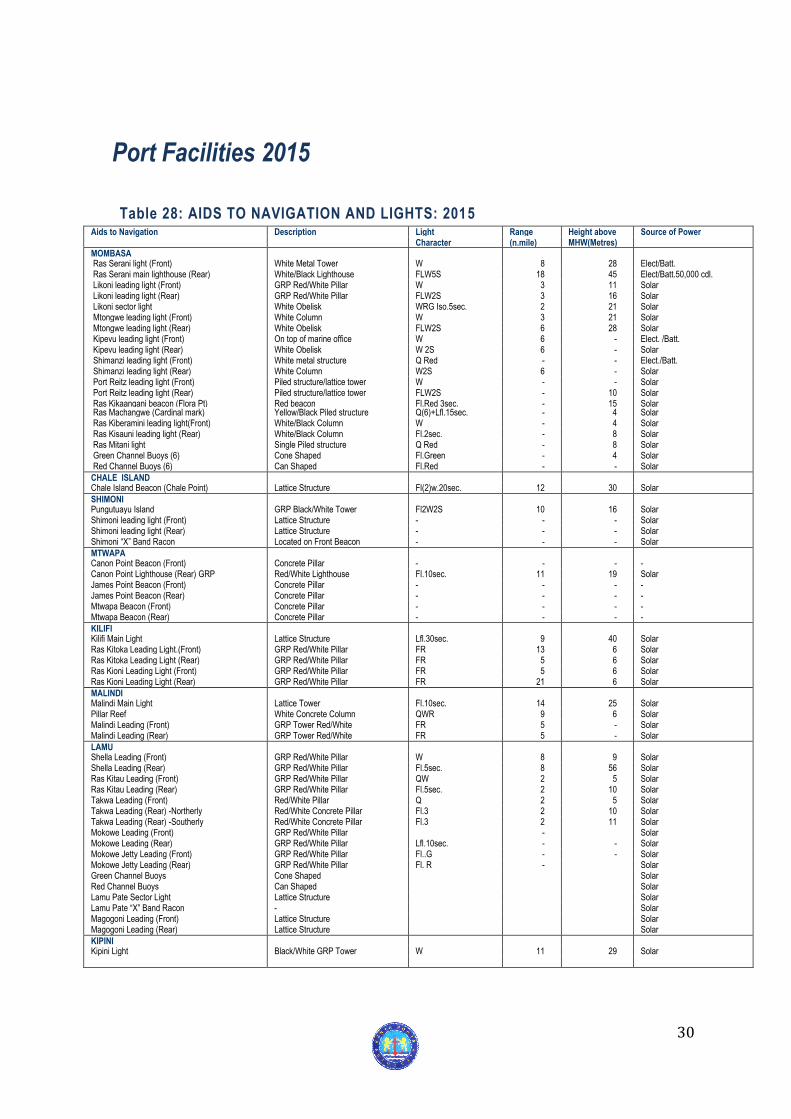
Aids to Navigation and Lights: 2015 (Table 28)................................................................................................................................... 30
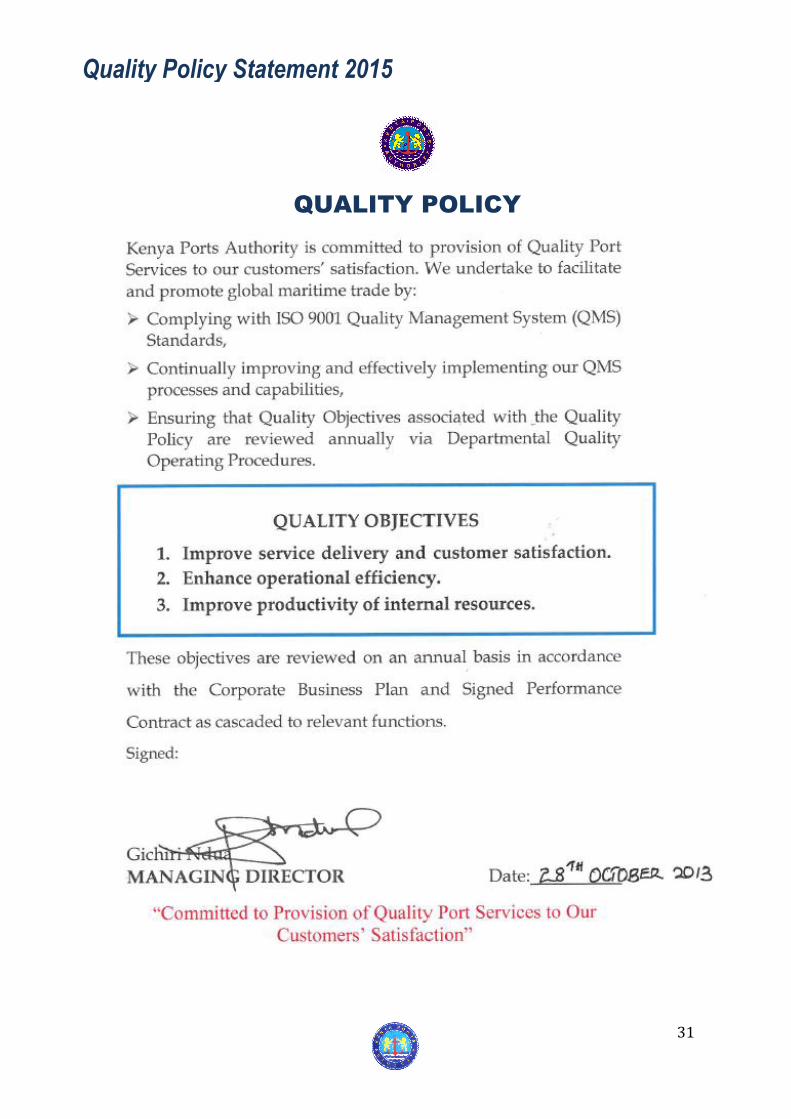
Quality Policy Statement ...................... ...................................................................................................... 31
Contents
Page
iii
Vision
World class seaports of choice.
Mission
To facilitate and promote global maritime trade through the provision
of competitive port services.
Core Values
Customer Focus: Service excellence is key to our operations and we endeavour to exceed customer expectations.
Integrity: We uphold fairness, honesty, professionalism and transparency in all our undertakings.
Teamwork: We embrace team spirit in all that we do.
We Care: We care for our staff, the communities around us and are
sensitive to the environment.
Vision, Mission and Core Values
iv
WEIGHT: Unless otherwise stated, all tonnages are in deadweight tons
Ton – Metric of 1000 Kg
DWT – Deadweight tons
SYMBOL: “-” means NIL or negligible
“T/MENT” means Transhipment
“TEU” means Twenty- Foot Equivalent Units
POL means Petroleum Oil and Lubricants
GRT means Gross Registered Tonnage
LOA means Length Overall
SOT means Shimanzi Oil Terminal
KOT means Kipevu Oil Terminal
NOTE: 1. Unless otherwise stated, the tables in this bulletin refer to the Port of Mombasa
2. For ease of clarity, figures in some tables are where applicable, rounded to the
nearest (‘000’)
Notes and Definitions
Arrivals of Ship to Shore Gantry (STS) at the Second Container Terminal
Foreword
Catherine Mturi-Wairi
Ag.MANAGING DIRECTOR
Iam delighted to present the 2015 edition of
the Annual Review and Bulletin of Port Statistics. In line with the Authority’s policy as illustrated in the past series of this publication, the Bulletin underscores Management commitment to providing comprehensive coverage of Port Performance Indicators relating to all aspects of Port Operations. The key objective of statistics is to provide reliable, accurate, and timely foundation for computory performance indicators to inform and guide strategic decisions and also guide port planning and development. The Bulletin is also an important source of information to government policy makers, port stakeholders, consultants and researchers. Besides the port performance statistics, the core port functions, including provision of marine services, cargo handling, ships’ dockage and other land based ancillary services are well covered. In the economic arena, the year 2015 was as turbulent as preceding years in recent time. The global economy registered a mild growth
of 2.6 per cent. Developing countries grew by 4.4 per cent, Sub Saharan Africa by 4.5 per cent and the domestic economy recorded 5.4 per cent in 2015. Notably, in the last five years, the Port achieved significant traffic growth, with total cargo throughput increasing at an annual average of 7.6 per cent from 19.95 million tons in 2011 to 26.73 million tons in 2015 while the container traffic grew by 8.7 per cent from 770,804 TEUs to 1,076,118 TEUs over the five-year period. In 2015, the Port continued its vital role as trade facilitator and enabler to the hinterland region. Transit Traffic, witnessed a growth of 6.5 percent registering 7.67 million tons up from 7.20 million tons handled in 2014. Uganda, our biggest transit market has continued to increase its usage of the Port. In 2015, Uganda cargo grew by 8.2 percent registering 6.00 million tons up from 5.52 million tons in 2014. With regards to ship sizes, 2015 was also a special year for the Port of Mombasa. For the first time in history, the Port celebrated the reception of the biggest vessel to ever call at the Port of Mombasa, MV Maersk Clemence Schulte. The 6,000 TEU capacity Vessel is 250 meters long and 37.5 meters wide, with a laden draught of 13.9 meters. In December 2015, the Port again marked the reception of some of the leading Cruise Vessels among them; MV Seven Seas Voyagers with a total of 1,109 passengers on board and MV Nautica with 1,041 passengers on board. 2015 witnessed increased Cruise shipping activities, with a total of 5,072 passengers against 1,126 passengers in 2014. This performance was a clear indication of market confidence in the prevailing business environment underscored by improved Port performance. In line with the KPA vision “World Class Seaports of Choice”, the Authority remains committed to operational excellence and quality services that exceeds customer expectation. Construction of Phase I of the Second Container Terminal is now over 98 per cent complete and we are looking forward to hand over by March 2016. The new terminal will provide additional capacity of 550,000 TEUs annually.
vi
The equipment acquisition schedule to meet customer needs is on-going. Mombasa is now one of the best equipped ports in the region and our performance attests to this. In 2015, the Port received eight Terminal Tractors, three Ship to Shore Gantry cranes and awaits arrival of eight Empty Container Handlers in early 2016. On Port Automation, we continue with the transformation of ICT systems. The effect of the upgrade is that our customers can now conduct business online without their physical presence in the Port. This is mostly so in the area of E- procurement and invoice processing. We also continue to closely work with other government agencies and stakeholders to effectively interface with the National Single Window and the Single Customs Territory Systems. The Single Customs Territory, which aims to quicken documentation, is supported by the East African Community and has been up and running for a year now and has so far been embraced by Kenya, Rwanda and Uganda. Under this initiative, clearance and revenue collection by transit importers and governments respectively is done at the Port of Mombasa which is the first point of entry. This is in accordance with the international best practices. Port Security System has continued to witness substantial gains following Implementation of the Integrated Security System to safeguard the Port from intrusion, raising security standards to international levels. This development has positioned the Port of Mombasa as one of the most secure maritime facilities in the Continent. KPA also works closely with all National Security Agencies to ensure a safe and efficient corridor for effective trading. Development of Crude Oil handling facility is underway, as a new modern Oil Terminal to replace the current Kipevu Oil Terminal. Preliminary designs have been finalized and tender for construction will be done in early 2016. On behalf of the Board of Directors, Management and Staff of Kenya Ports
Authority, I express my gratitude to our esteemed customers, development partners and all stakeholders for their continued partnership to progressively position the Port of Mombasa as a World Class Port of Choice. We wish you a fruitful 2016.
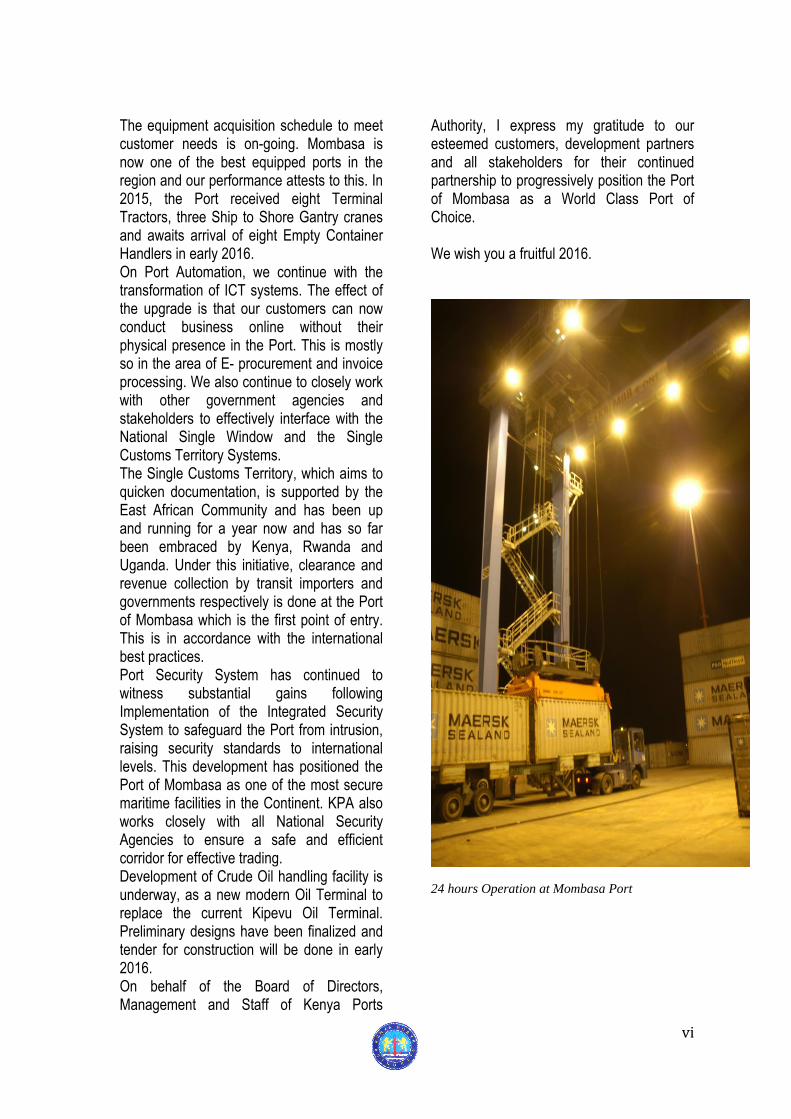
24 hours Operation at Mombasa Port
vii
Edward Kamau
GENERAL MANAGER CORPORATE
SERVICES
n keeping with the tradition of the past editions, the 2015 Annual Review and Bulletin of Statistics gives a
comprehensive coverage of statistics relating to all aspects of port operations and shipping services. Data has a crucial role of providing the basis upon which most management decisions, as well as sector specific policies are derived.
During the period under review, the Port handled a total of 26.732 million tons of cargo against 24.875 million tons handled in 2014, reflecting a volume increase of 1.857
million tons or 7.5 per cent. Imports increased by 9.2 per cent, from 20.777 million tons in 2015 to 22.680 million tons in 2015. Exports also registered an increase of 5.0 per cent, from 3.366 million tons in 2014 to 3,534 million tons in 2015.
The increased cargo volume was mainly driven by dry bulk cargo and conventional cargo types which posted notable increases of 22.4 per cent and 17.1 per cent respectively. Containerized and liquid bulk cargo types also increased marginally posting 6.6 per cent and 0.6 per cent respectively.
Transit traffic registered notable increase of traffic by 6.5 per cent up from 7.199 million tons in 2014 to 7.667 million tons in 2015. Transshipment traffic however, posted a decline of 28.4 per cent from 0.732 million tons in 2014 to 0.518 million tons in the period under review.
The timely publication of this Bulletin, which has always been a very demanding task, could not have been possible without the co-operation and contributions of various Divisions, Departments and staff of the Authority as sources of primary data.
I take this opportunity once again, to express my appreciation to all who participated.
The Head Quarters of Mombasa Port.
I
Overview
1
Table 1: PORT PERFORMANCE: 2011 – 2015
2011 2012 2013 2014 2015
IMPORTS (‘000’ DWT)
Containerized Cargo 5,226 5,954 5,974 6,524 6,955
Conventional Cargo 1,298 1,302 1,726 1,830 2,143
Dry Bulk 3,807 4,811 4,913 5,231 6,350
Liquid Bulk 6,607 6,665 6,537 7,192 7,232
TOTAL 16,938 18,732 19,150 20,777 22,680
of which Transit In 5,166 6,201 6,196 6,691 7,167
EXPORTS (‘000’ DWT)
Containerized Cargo 2,337 2,626 2,690 2,791 2,803
Conventional Cargo 171 153 128 108 113
Dry Bulk 122 106 65 422 578
Liquid Bulk 158 160 100 45 40
TOTAL 2,788 3,045 2,983 3,366 3,534
of which Transit Out 430 425 513 508
500
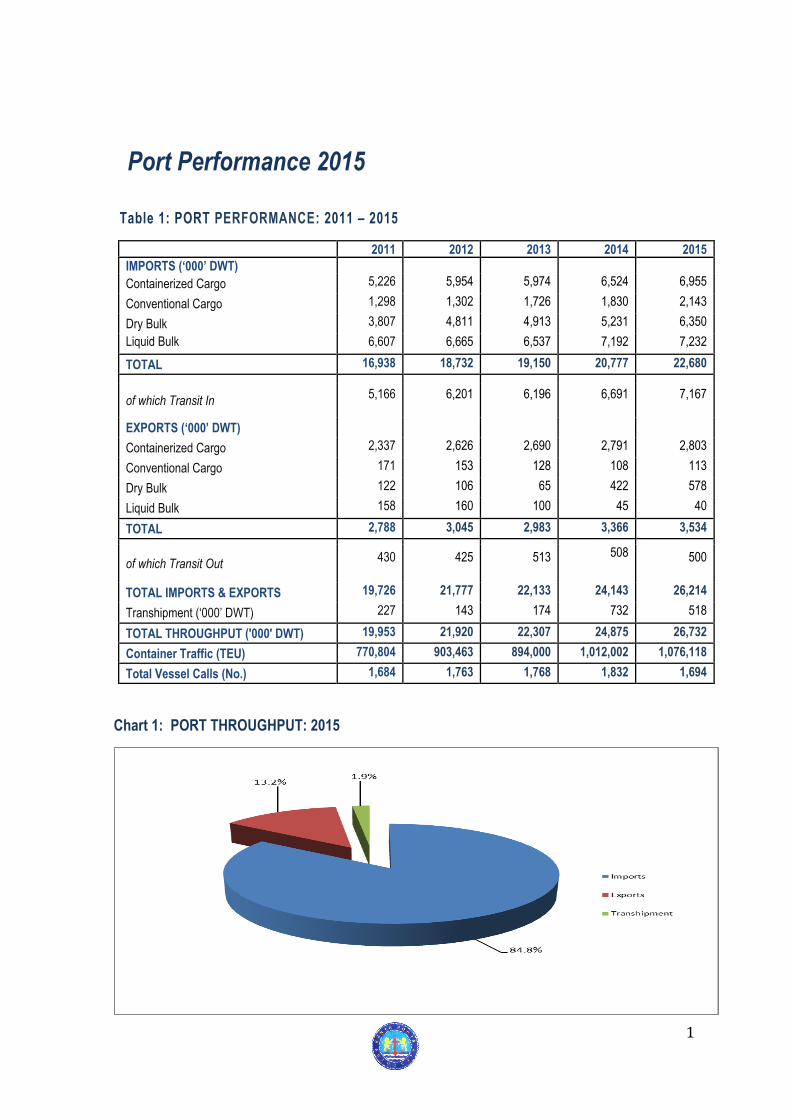
TOTAL IMPORTS & EXPORTS 19,726 21,777 22,133 24,143 26,214
Transhipment (‘000’ DWT) 227 143 174 732 518
TOTAL THROUGHPUT ('000' DWT) 19,953 21,920 22,307 24,875 26,732
Container Traffic (TEU) 770,804 903,463 894,000 1,012,002 1,076,118
Total Vessel Calls (No.) 1,684 1,763 1,768 1,832 1,694
Chart 1: PORT THROUGHPUT: 2015
Port Performance 2015
2
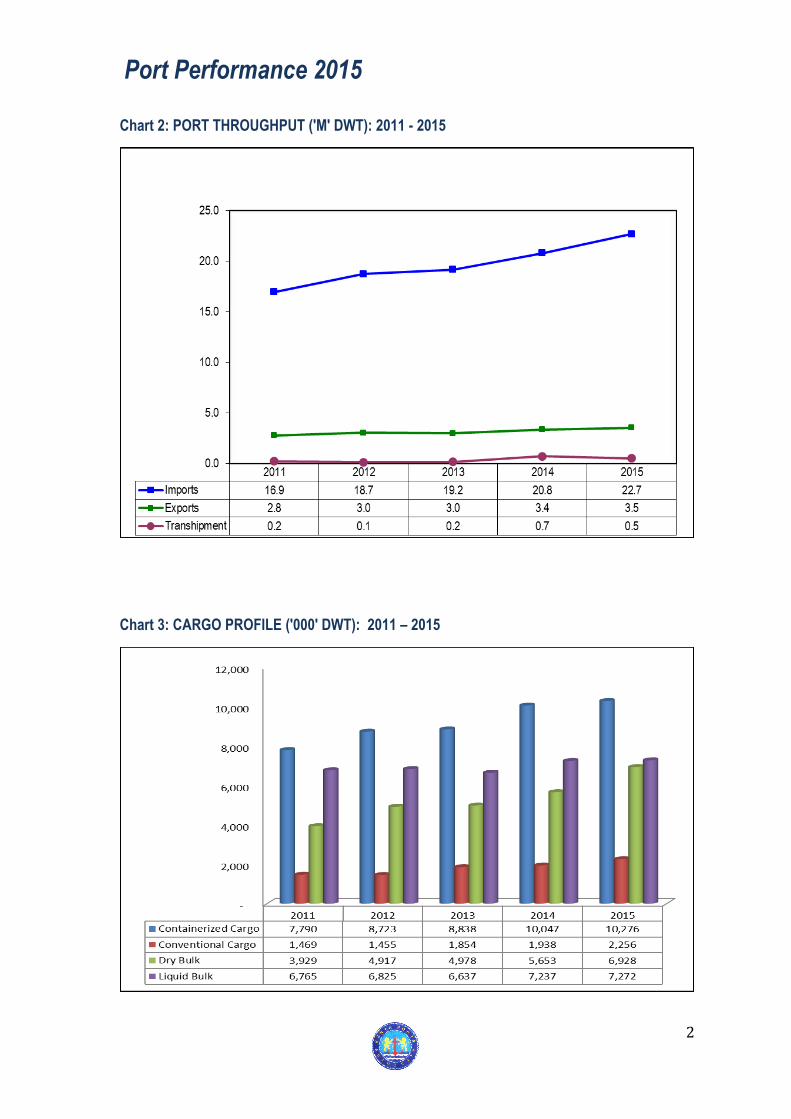
Chart 2: PORT THROUGHPUT ('M' DWT): 2011 - 2015
Chart 3: CARGO PROFILE ('000' DWT): 2011 – 2015
Port Performance 2015
3
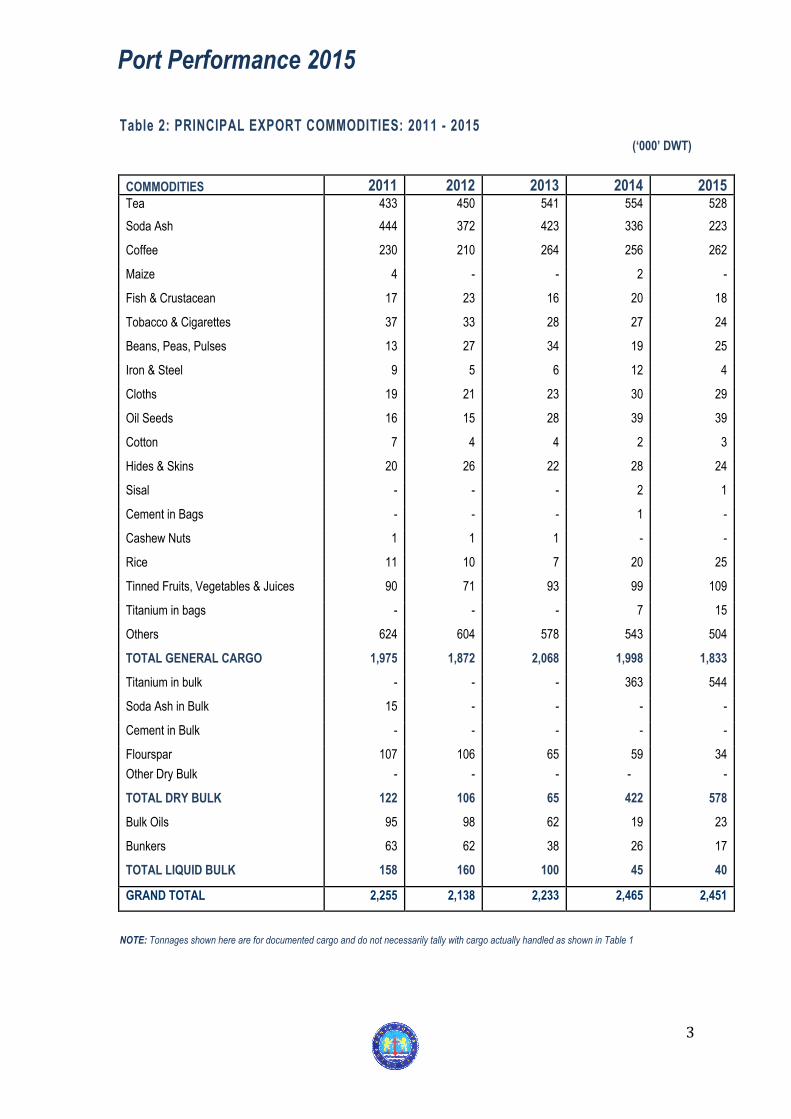
Table 2: PRINCIPAL EXPORT COMMODITIES: 2011 - 2015
(‘000’ DWT)
COMMODITIES 2011 2012 2013 2014 2015 Tea 433 450 541 554 528
Soda Ash 444 372 423 336 223
Coffee 230 210 264 256 262
Maize 4 - - 2 -
Fish & Crustacean 17 23 16 20 18
Tobacco & Cigarettes 37 33 28 27 24
Beans, Peas, Pulses 13 27 34 19 25
Iron & Steel 9 5 6 12 4
Cloths 19 21 23 30 29
Oil Seeds 16 15 28 39 39
Cotton 7 4 4 2 3
Hides & Skins 20 26 22 28 24
Sisal - - - 2 1
Cement in Bags - - - 1 -
Cashew Nuts 1 1 1 - -
Rice 11 10 7 20 25
Tinned Fruits, Vegetables & Juices 90 71 93 99 109
Titanium in bags - - - 7 15
Others 624 604 578 543 504
TOTAL GENERAL CARGO 1,975 1,872 2,068 1,998 1,833
Titanium in bulk - - - 363 544
Soda Ash in Bulk 15 - - - -
Cement in Bulk - - - - -
Flourspar 107 106 65 59 34
Other Dry Bulk - - - - -
TOTAL DRY BULK 122 106 65 422 578
Bulk Oils 95 98 62 19 23
Bunkers 63 62 38 26 17
TOTAL LIQUID BULK 158 160 100 45 40
GRAND TOTAL 2,255 2,138 2,233 2,465 2,451
NOTE: Tonnages shown here are for documented cargo and do not necessarily tally with cargo actually handled as shown in Table 1
Port Performance 2015
4
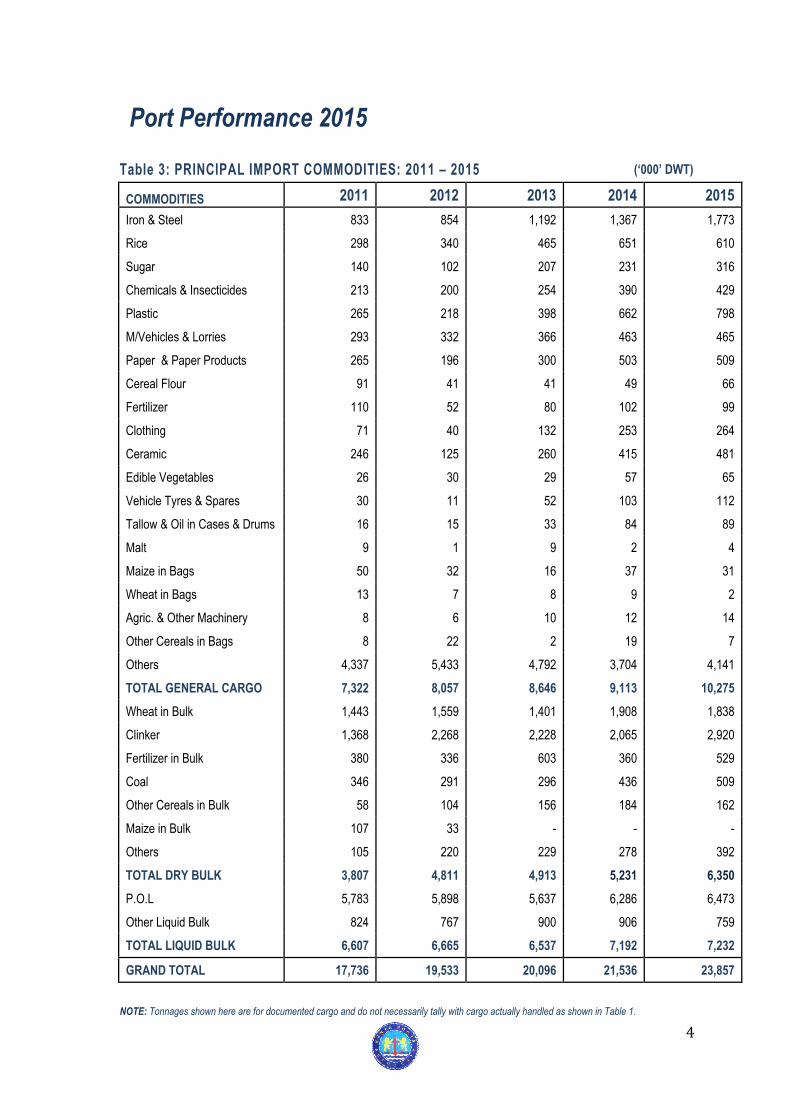
Table 3: PRINCIPAL IMPORT COMMODITIES: 2011 – 2015 (‘000’ DWT)
COMMODITIES 2011 2012 2013 2014 2015
Iron & Steel 833 854 1,192 1,367 1,773
Rice 298 340 465 651 610
Sugar 140 102 207 231 316
Chemicals & Insecticides 213 200 254 390 429
Plastic 265 218 398 662 798
M/Vehicles & Lorries 293 332 366 463 465
Paper & Paper Products 265 196 300 503 509
Cereal Flour 91 41 41 49 66
Fertilizer 110 52 80 102 99
Clothing 71 40 132 253 264
Ceramic 246 125 260 415 481
Edible Vegetables 26 30 29 57 65
Vehicle Tyres & Spares 30 11 52 103 112
Tallow & Oil in Cases & Drums 16 15 33 84 89
Malt 9 1 9 2 4
Maize in Bags 50 32 16 37 31
Wheat in Bags 13 7 8 9 2
Agric. & Other Machinery 8 6 10 12 14
Other Cereals in Bags 8 22 2 19 7
Others 4,337 5,433 4,792 3,704 4,141
TOTAL GENERAL CARGO 7,322 8,057 8,646 9,113 10,275
Wheat in Bulk 1,443 1,559 1,401 1,908 1,838
Clinker 1,368 2,268 2,228 2,065 2,920
Fertilizer in Bulk 380 336 603 360 529
Coal 346 291 296 436 509
Other Cereals in Bulk 58 104 156 184 162
Maize in Bulk 107 33 - - -
Others 105 220 229 278 392
TOTAL DRY BULK 3,807 4,811 4,913 5,231 6,350
P.O.L 5,783 5,898 5,637 6,286 6,473
Other Liquid Bulk 824 767 900 906 759
TOTAL LIQUID BULK 6,607 6,665 6,537 7,192 7,232
GRAND TOTAL 17,736 19,533 20,096 21,536 23,857
NOTE: Tonnages shown here are for documented cargo and do not necessarily tally with cargo actually handled as shown in Table 1.
Port Performance 2015
5
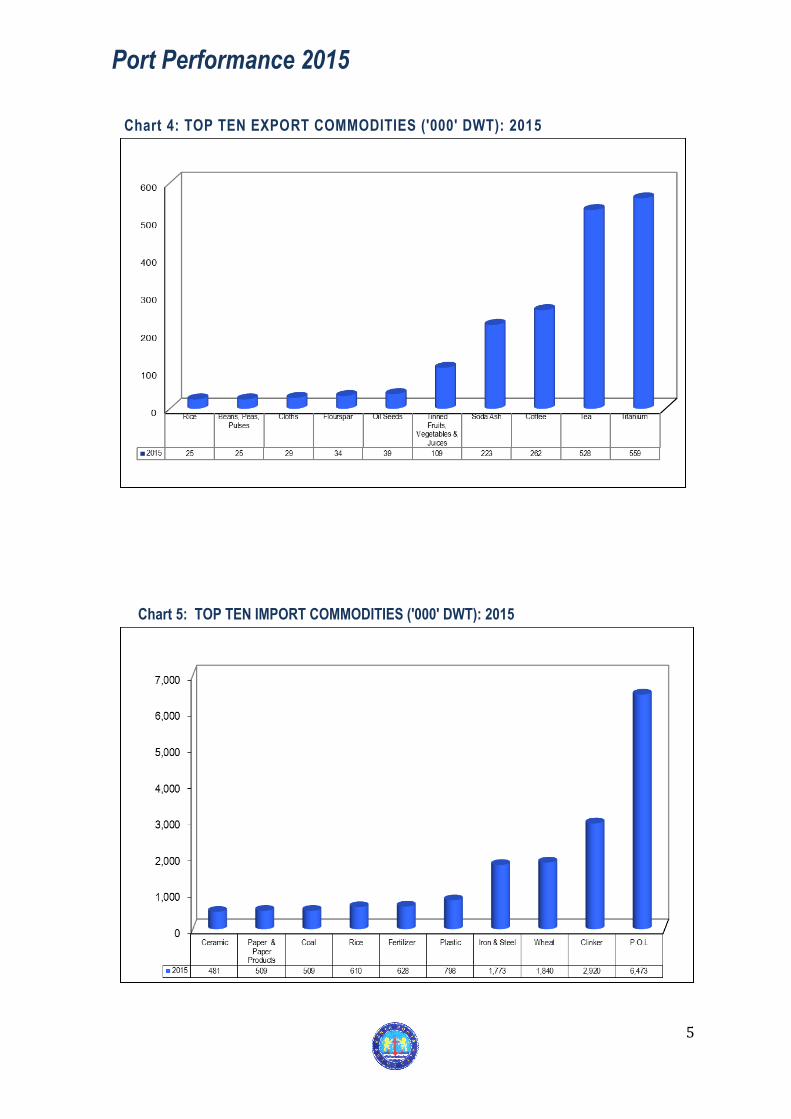
Chart 4: TOP TEN EXPORT COMMODITIES ('000' DWT): 2015
Chart 5: TOP TEN IMPORT COMMODITIES ('000' DWT): 2015
Port Performance 2015
6
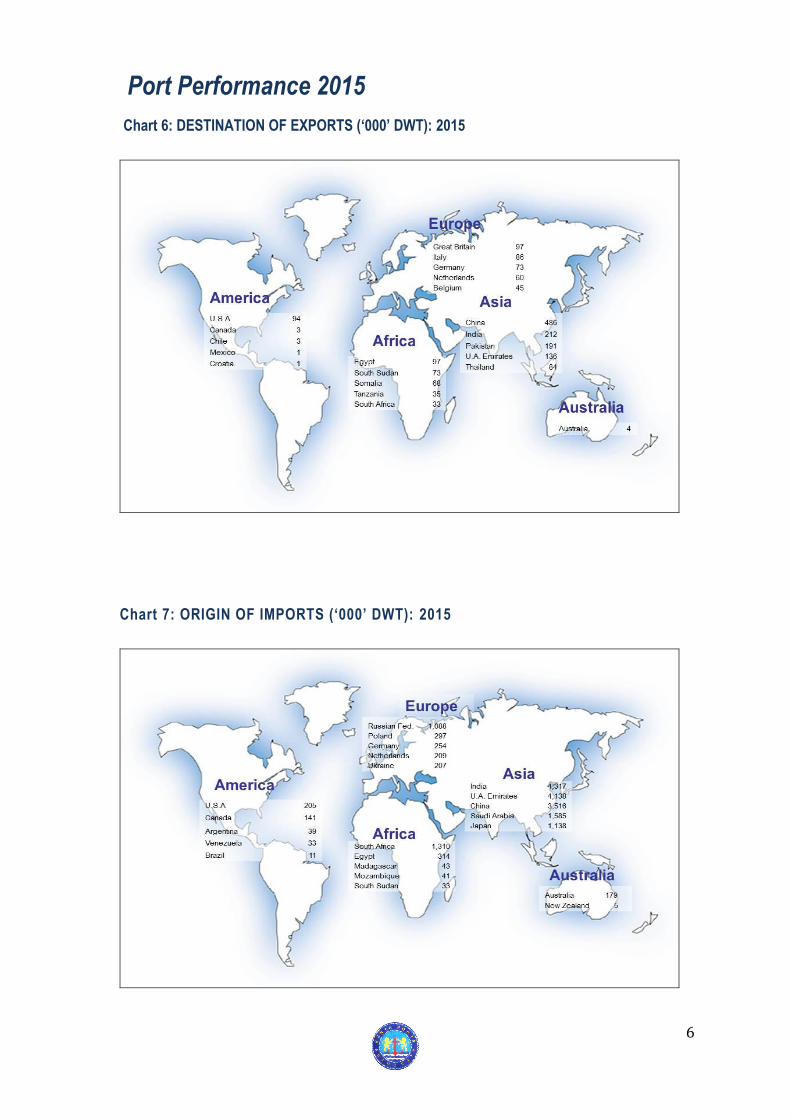
Chart 6: DESTINATION OF EXPORTS (‘000’ DWT): 2015
Chart 7: ORIGIN OF IMPORTS (‘000’ DWT): 2015
Port Performance 2015
7
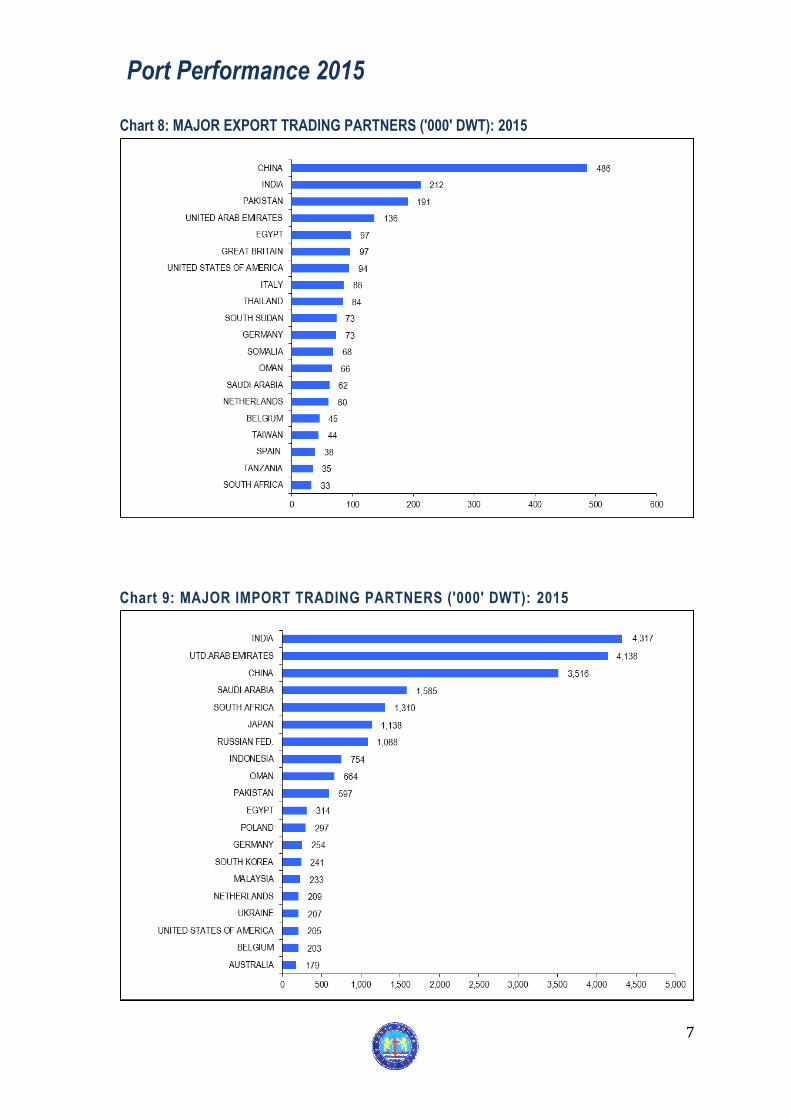
Chart 8: MAJOR EXPORT TRADING PARTNERS ('000' DWT): 2015
Chart 9: MAJOR IMPORT TRADING PARTNERS ('000' DWT): 2015
Port Performance 2015
8
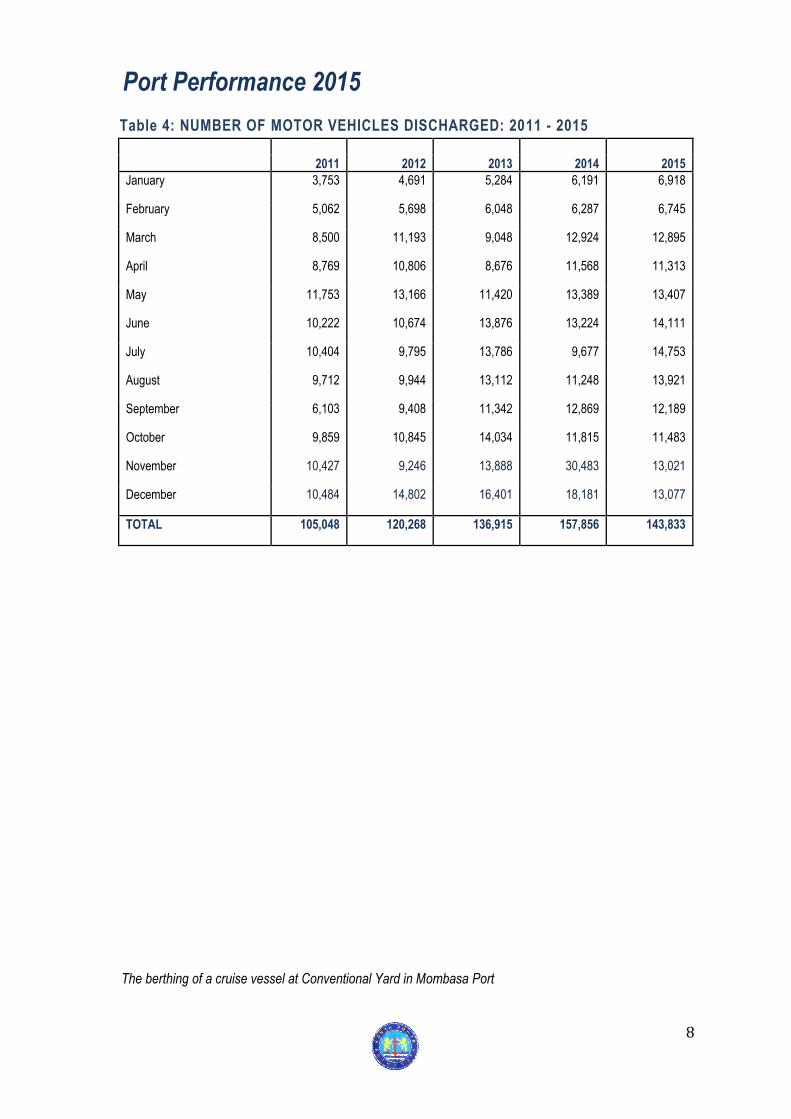
Table 4: NUMBER OF MOTOR VEHICLES DISCHARGED: 2011 - 2015
2011 2012 2013 2014 2015
January 3,753 4,691 5,284 6,191 6,918
February 5,062 5,698 6,048 6,287 6,745
March 8,500 11,193 9,048 12,924 12,895
April 8,769 10,806 8,676 11,568 11,313
May 11,753 13,166 11,420 13,389 13,407
June 10,222 10,674 13,876 13,224 14,111
July 10,404 9,795 13,786 9,677 14,753
August 9,712 9,944 13,112 11,248 13,921
September 6,103 9,408 11,342 12,869 12,189
October 9,859 10,845 14,034 11,815 11,483
November 10,427 9,246 13,888 30,483 13,021
December 10,484 14,802 16,401 18,181 13,077
TOTAL 105,048 120,268 136,915 157,856 143,833
Port Performance 2015
The berthing of a cruise vessel at Conventional Yard in Mombasa Port
9
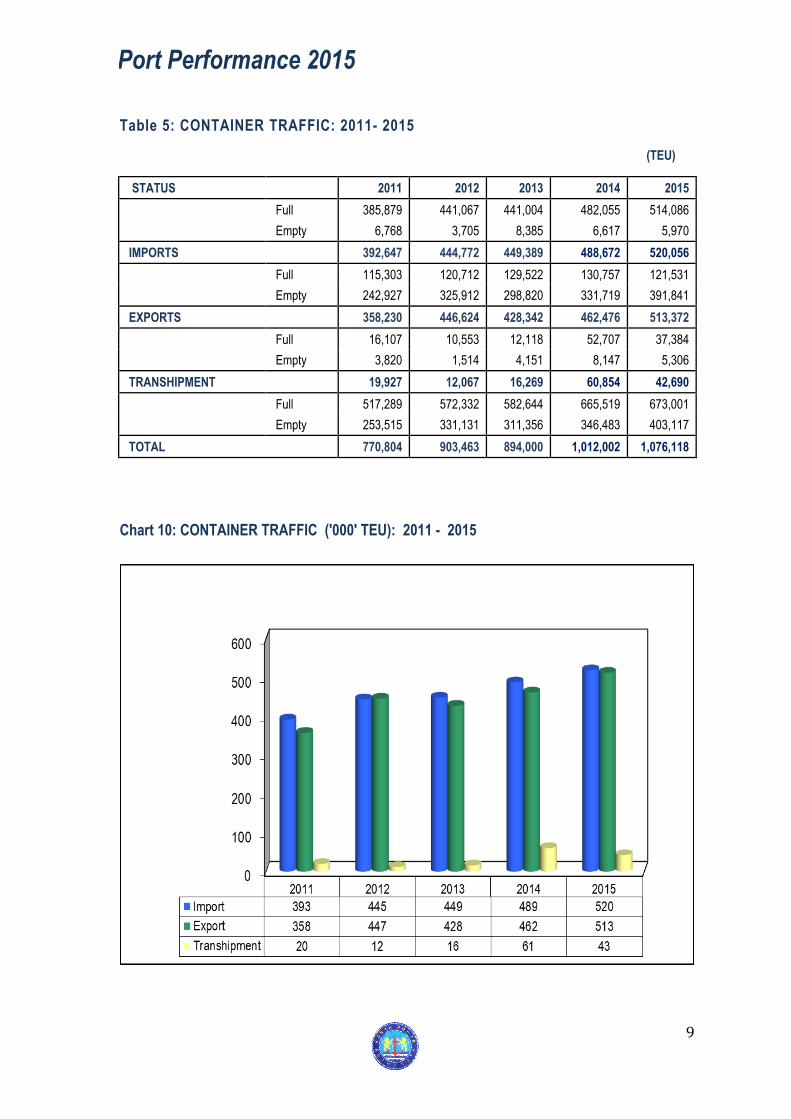
Table 5: CONTAINER TRAFFIC: 2011- 2015
(TEU)
STATUS 2011 2012 2013 2014 2015
Full 385,879 441,067 441,004 482,055 514,086
Empty 6,768 3,705 8,385 6,617 5,970
IMPORTS 392,647 444,772 449,389 488,672 520,056
Full 115,303 120,712 129,522 130,757 121,531
Empty 242,927 325,912 298,820 331,719 391,841
EXPORTS 358,230 446,624 428,342 462,476 513,372
Full 16,107 10,553 12,118 52,707 37,384
Empty 3,820 1,514 4,151 8,147 5,306
TRANSHIPMENT 19,927 12,067 16,269 60,854 42,690
Full 517,289 572,332 582,644 665,519 673,001
Empty 253,515 331,131 311,356 346,483 403,117
TOTAL 770,804 903,463 894,000 1,012,002 1,076,118
Chart 10: CONTAINER TRAFFIC ('000' TEU): 2011 - 2015
Port Performance 2015
10
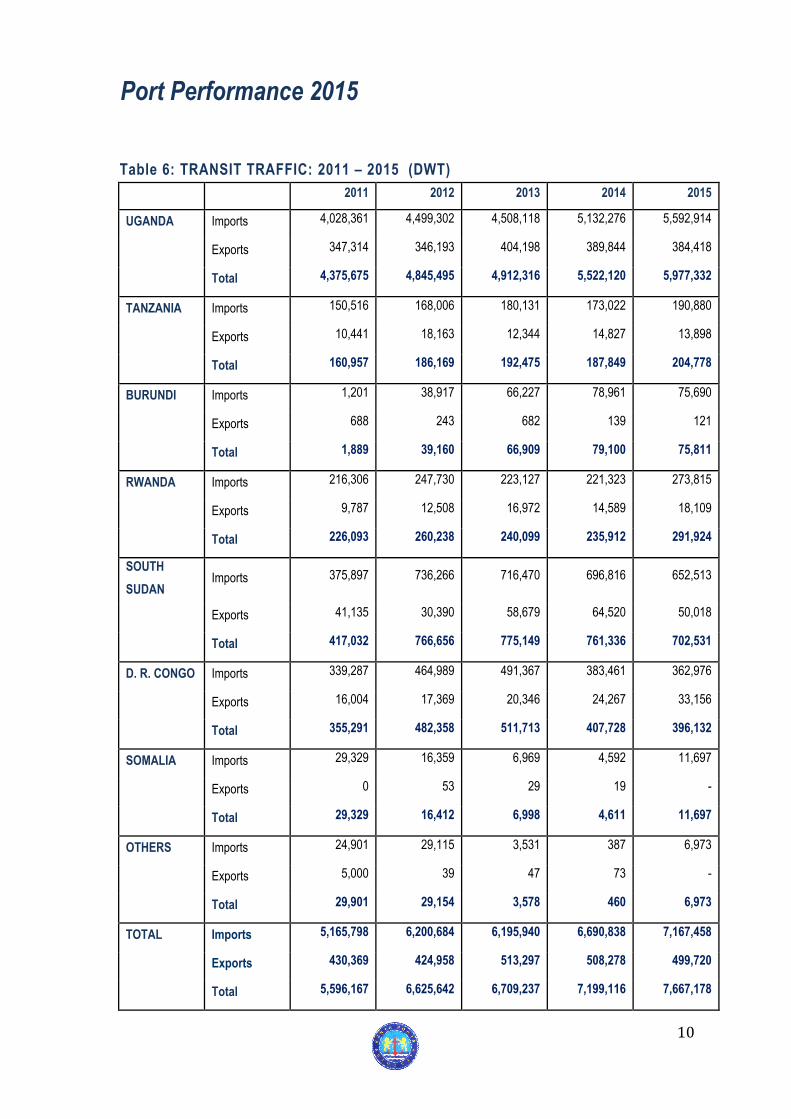
Table 6: TRANSIT TRAFFIC: 2011 – 2015 (DWT)
2011 2012 2013 2014 2015
UGANDA Imports 4,028,361 4,499,302 4,508,118 5,132,276 5,592,914
Exports 347,314 346,193 404,198 389,844 384,418
Total 4,375,675 4,845,495 4,912,316 5,522,120 5,977,332
TANZANIA Imports 150,516 168,006 180,131 173,022 190,880
Exports 10,441 18,163 12,344 14,827 13,898
Total 160,957 186,169 192,475 187,849 204,778
BURUNDI Imports 1,201 38,917 66,227 78,961 75,690
Exports 688 243 682 139 121
Total 1,889 39,160 66,909 79,100 75,811
RWANDA Imports 216,306 247,730 223,127 221,323 273,815
Exports 9,787 12,508 16,972 14,589 18,109
Total 226,093 260,238 240,099 235,912 291,924
SOUTH
SUDAN Imports 375,897 736,266 716,470 696,816 652,513
Exports 41,135 30,390 58,679 64,520 50,018
Total 417,032 766,656 775,149 761,336 702,531
D. R. CONGO Imports 339,287 464,989 491,367 383,461 362,976
Exports 16,004 17,369 20,346 24,267 33,156
Total 355,291 482,358 511,713 407,728 396,132
SOMALIA Imports 29,329 16,359 6,969 4,592 11,697
Exports 0 53 29 19 -
Total 29,329 16,412 6,998 4,611 11,697
OTHERS Imports 24,901 29,115 3,531 387 6,973
Exports 5,000 39 47 73 -
Total 29,901 29,154 3,578 460 6,973
TOTAL Imports 5,165,798 6,200,684 6,195,940 6,690,838 7,167,458
Exports 430,369 424,958 513,297 508,278 499,720
Total 5,596,167 6,625,642 6,709,237 7,199,116 7,667,178
Port Performance 2015
11
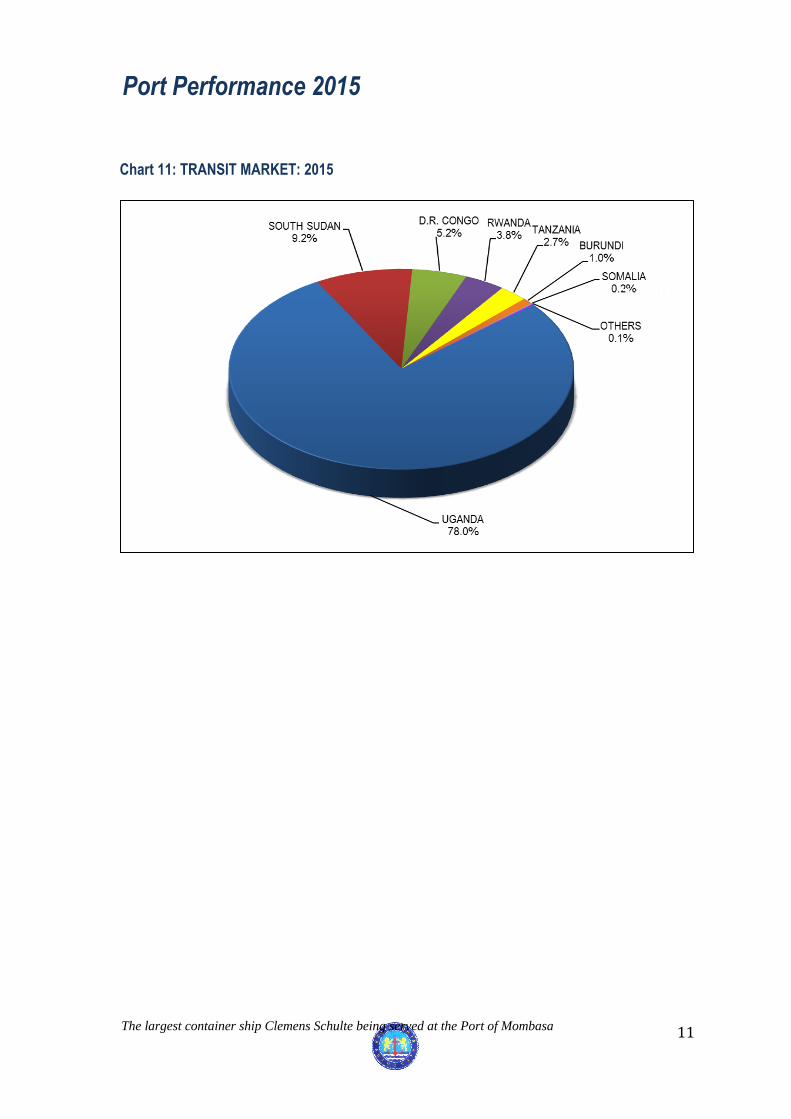
Chart 11: TRANSIT MARKET: 2015
Port Performance 2015
The largest container ship Clemens Schulte being served at the Port of Mombasa
.
12
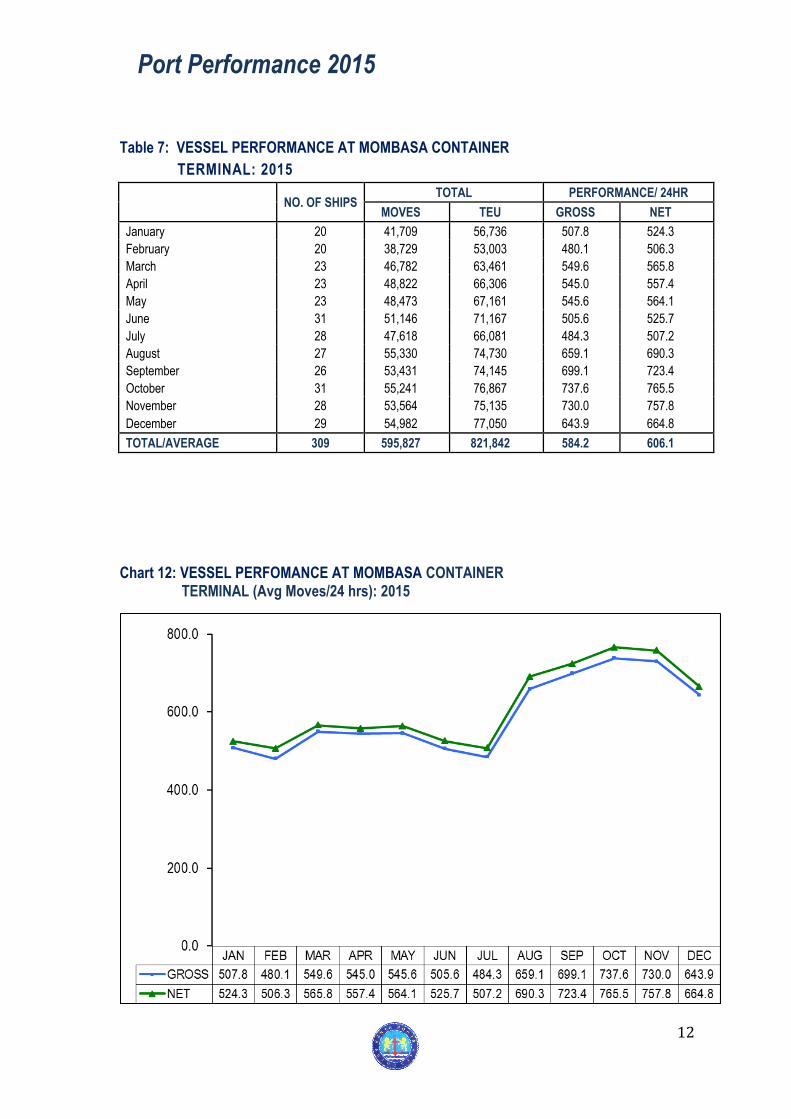
Table 7: VESSEL PERFORMANCE AT MOMBASA CONTAINER
TERMINAL: 2015
NO. OF SHIPS TOTAL PERFORMANCE/ 24HR
MOVES TEU GROSS NET
January 20 41,709 56,736 507.8 524.3
February 20 38,729 53,003 480.1 506.3
March 23 46,782 63,461 549.6 565.8
April 23 48,822 66,306 545.0 557.4
May 23 48,473 67,161 545.6 564.1
June 31 51,146 71,167 505.6 525.7
July 28 47,618 66,081 484.3 507.2
August 27 55,330 74,730 659.1 690.3
September 26 53,431 74,145 699.1 723.4
October 31 55,241 76,867 737.6 765.5
November 28 53,564 75,135 730.0 757.8
December 29 54,982 77,050 643.9 664.8
TOTAL/AVERAGE 309 595,827 821,842 584.2 606.1
Chart 12: VESSEL PERFOMANCE AT MOMBASA CONTAINER TERMINAL (Avg Moves/24 hrs): 2015
Port Performance 2015
13
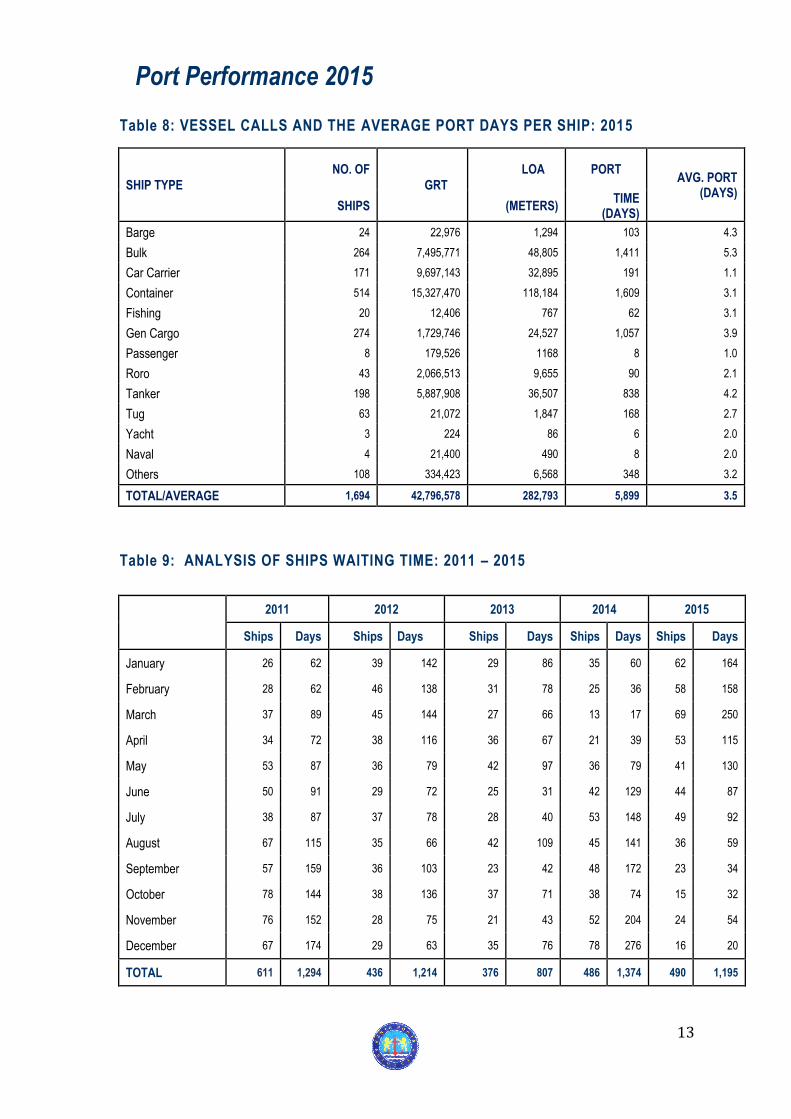
Table 8: VESSEL CALLS AND THE AVERAGE PORT DAYS PER SHIP: 2015
SHIP TYPE
NO. OF
GRT
LOA PORT AVG. PORT
(DAYS) SHIPS (METERS)
TIME (DAYS)
Barge 24 22,976 1,294 103 4.3
Bulk 264 7,495,771 48,805 1,411 5.3
Car Carrier 171 9,697,143 32,895 191 1.1
Container 514 15,327,470 118,184 1,609 3.1
Fishing 20 12,406 767 62 3.1
Gen Cargo 274 1,729,746 24,527 1,057 3.9
Passenger 8 179,526 1168 8 1.0
Roro 43 2,066,513 9,655 90 2.1
Tanker 198 5,887,908 36,507 838 4.2
Tug 63 21,072 1,847 168 2.7
Yacht 3 224 86 6 2.0
Naval 4 21,400 490 8 2.0
Others 108 334,423 6,568 348 3.2
TOTAL/AVERAGE 1,694 42,796,578 282,793 5,899 3.5
Table 9: ANALYSIS OF SHIPS WAITING TIME: 2011 – 2015
2011 2012 2013 2014 2015
Ships Days Ships Days Ships Days Ships Days Ships Days
January 26 62 39 142 29 86 35 60 62 164
February 28 62 46 138 31 78 25 36 58 158
March 37 89 45 144 27 66 13 17 69 250
April 34 72 38 116 36 67 21 39 53 115
May 53 87 36 79 42 97 36 79 41 130
June 50 91 29 72 25 31 42 129 44 87
July 38 87 37 78 28 40 53 148 49 92
August 67 115 35 66 42 109 45 141 36 59
September 57 159 36 103 23 42 48 172 23 34
October 78 144 38 136 37 71 38 74 15 32
November 76 152 28 75 21 43 52 204 24 54
December 67 174 29 63 35 76 78 276 16 20
TOTAL 611 1,294 436 1,214 376 807 486 1,374 490 1,195
Port Performance 2015
14
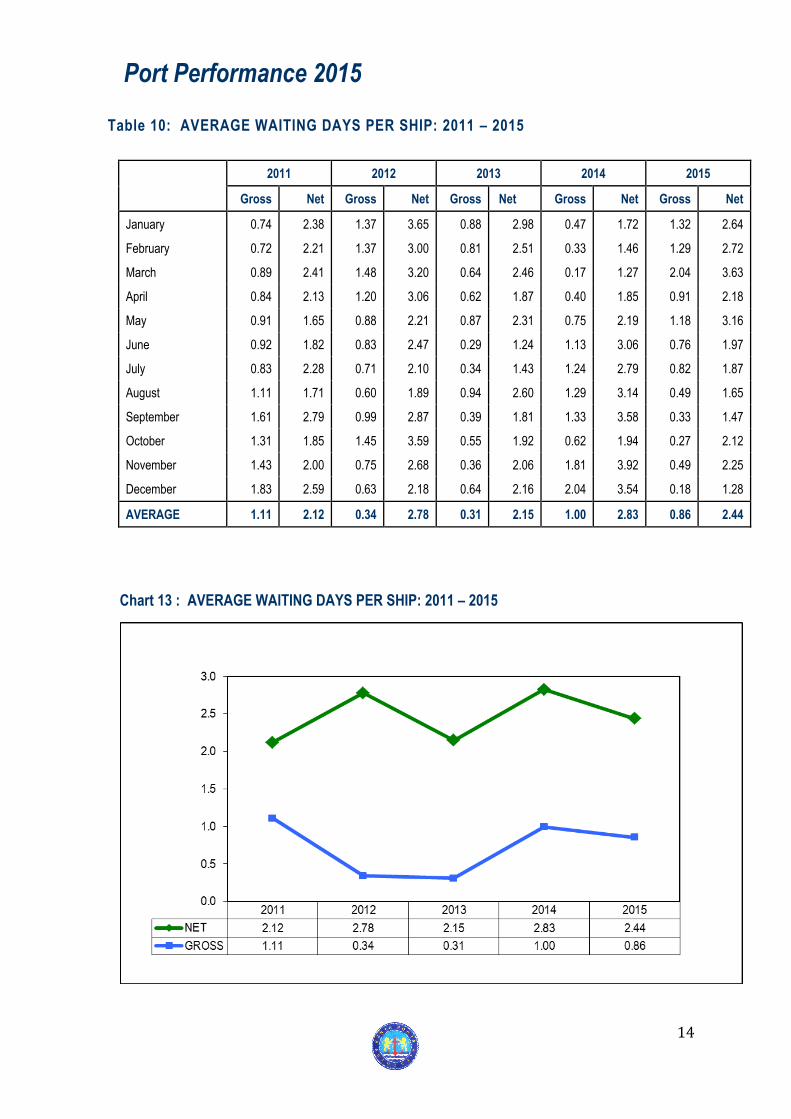
Table 10: AVERAGE WAITING DAYS PER SHIP: 2011 – 2015
2011 2012 2013 2014 2015
Gross Net Gross Net Gross Net Gross Net Gross Net
January 0.74 2.38 1.37 3.65 0.88 2.98 0.47 1.72 1.32 2.64
February 0.72 2.21 1.37 3.00 0.81 2.51 0.33 1.46 1.29 2.72
March 0.89 2.41 1.48 3.20 0.64 2.46 0.17 1.27 2.04 3.63
April 0.84 2.13 1.20 3.06 0.62 1.87 0.40 1.85 0.91 2.18
May 0.91 1.65 0.88 2.21 0.87 2.31 0.75 2.19 1.18 3.16
June 0.92 1.82 0.83 2.47 0.29 1.24 1.13 3.06 0.76 1.97
July 0.83 2.28 0.71 2.10 0.34 1.43 1.24 2.79 0.82 1.87
August 1.11 1.71 0.60 1.89 0.94 2.60 1.29 3.14 0.49 1.65
September 1.61 2.79 0.99 2.87 0.39 1.81 1.33 3.58 0.33 1.47
October 1.31 1.85 1.45 3.59 0.55 1.92 0.62 1.94 0.27 2.12
November 1.43 2.00 0.75 2.68 0.36 2.06 1.81 3.92 0.49 2.25
December 1.83 2.59 0.63 2.18 0.64 2.16 2.04 3.54 0.18 1.28
AVERAGE 1.11 2.12 0.34 2.78 0.31 2.15 1.00 2.83 0.86 2.44
Chart 13 : AVERAGE WAITING DAYS PER SHIP: 2011 – 2015
Port Performance 2015
15
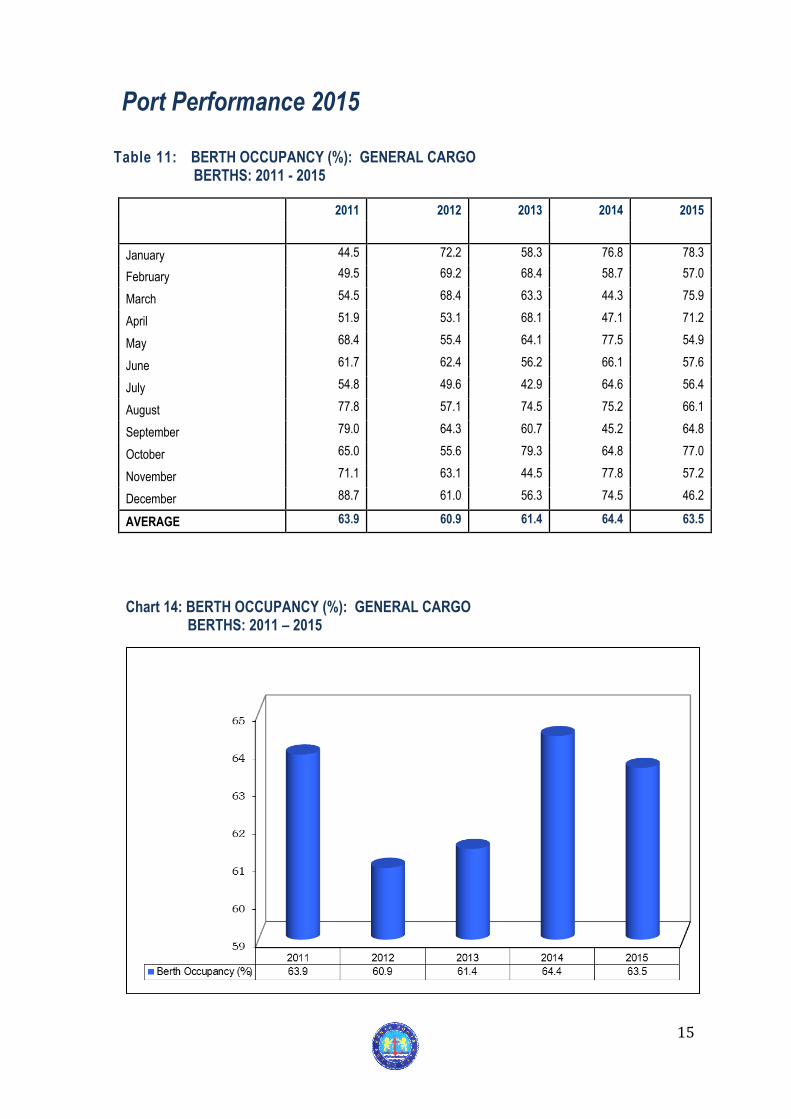
Table 11: BERTH OCCUPANCY (%): GENERAL CARGO BERTHS: 2011 - 2015
2011 2012 2013 2014 2015
January 44.5 72.2 58.3 76.8 78.3
February 49.5 69.2 68.4 58.7 57.0
March 54.5 68.4 63.3 44.3 75.9
April 51.9 53.1 68.1 47.1 71.2
May 68.4 55.4 64.1 77.5 54.9
June 61.7 62.4 56.2 66.1 57.6
July 54.8 49.6 42.9 64.6 56.4
August 77.8 57.1 74.5 75.2 66.1
September 79.0 64.3 60.7 45.2 64.8
October 65.0 55.6 79.3 64.8 77.0
November 71.1 63.1 44.5 77.8 57.2
December 88.7 61.0 56.3 74.5 46.2
AVERAGE 63.9 60.9 61.4 64.4 63.5
Chart 14: BERTH OCCUPANCY (%): GENERAL CARGO BERTHS: 2011 – 2015
Port Performance 2015
16
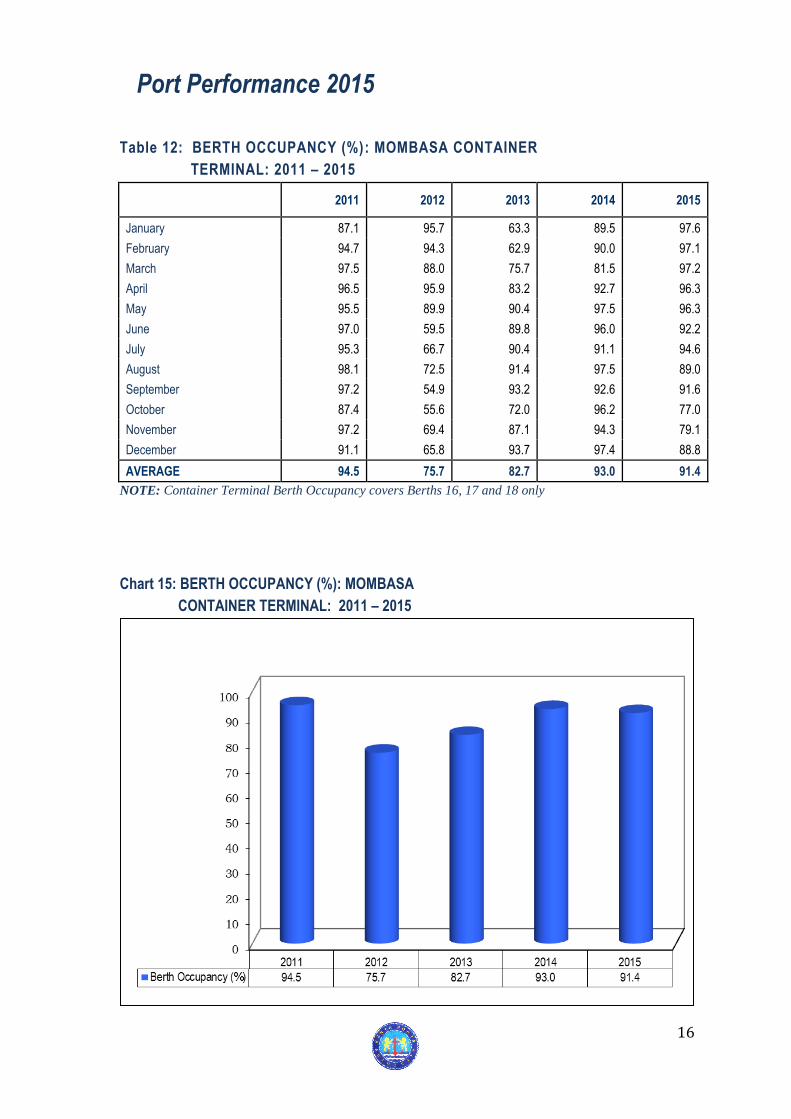
Table 12: BERTH OCCUPANCY (%): MOMBASA CONTAINER
TERMINAL: 2011 – 2015
2011 2012 2013 2014 2015
January 87.1 95.7 63.3 89.5 97.6
February 94.7 94.3 62.9 90.0 97.1
March 97.5 88.0 75.7 81.5 97.2
April 96.5 95.9 83.2 92.7 96.3
May 95.5 89.9 90.4 97.5 96.3
June 97.0 59.5 89.8 96.0 92.2
July 95.3 66.7 90.4 91.1 94.6
August 98.1 72.5 91.4 97.5 89.0
September 97.2 54.9 93.2 92.6 91.6
October 87.4 55.6 72.0 96.2 77.0
November 97.2 69.4 87.1 94.3 79.1
December 91.1 65.8 93.7 97.4 88.8
AVERAGE 94.5 75.7 82.7 93.0 91.4
NOTE: Container Terminal Berth Occupancy covers Berths 16, 17 and 18 only
Chart 15: BERTH OCCUPANCY (%): MOMBASA
CONTAINER TERMINAL: 2011 – 2015
Port Performance 2015
17
Table 13: BERTH OCCUPANCY (%): SHIMANZI OIL
TERMINAL: 2011 – 2015
2011 2012 2013 2014 2015
January 74.5 90.9 85.5 73.3 88.0
February 90.6 90.8 75.9 66.0 56.9
March 85.4 85.3 93.0 84.6 89.3
April 87.4 64.0 79.1 67.7 76.4
May 80.9 88.7 40.2 90.3 72.0
June 80.0 81.6 72.4 78.6 84.5
July 70.3 66.2 71.8 56.0 78.1
August 91.8 73.3 92.7 89.1 98.0
September 82.6 79.7 92.8 75.5 79.4
October 74.8 80.7 81.4 94.7 71.9
November 78.6 83.5 66.1 80.2 59.2
December 84.2 76.1 79.1 52.9 96.1
AVERAGE 81.8 80.1 77.5 75.7 79.2
Chart 16: BERTH OCCUPANCY (%): SHIMANZI OIL
Port Performance 2015
18
Table 14: BERTH OCCUPANCY (%): KIPEVU OIL
TERMINAL: 2011 – 2015
2011 2012 2013 2014 2015
January 74.1 90.4 79.2 65.5 86.4
February 81.9 82.7 49.6 76.3 82.4
March 67.7 89.7 80.9 76.9 90.9
April 93.0 94.2 91.3 88.9 84.1
May 88.6 92.5 89.9 64.9 87.9
June 84.8 90.0 86.4 87.1 89.9
July 88.8 76.8 88.7 77.4 90.7
August 95.3 68.7 69.9 92.8 79.9
September 66.5 66.2 91.0 92.2 81.8
October 91.5 87.2 92.7 74.5 93.8
November 90.5 56.9 87.1 80.1 73.1
December 91.4 66.8 95.1 76.1 90.9
AVERAGE 84.5 80.2 83.5 79.4 86.0
Chart 17: BERTH OCCUPANCY (%): KIPEVU OIL TERMINAL: 2011 – 2015
Port Performance 2015
19
Table 15: BERTH OCCUPANCY (%): MBARAKI WHARF: 2011 – 2015
2011 2012 2013 2014 2015
January 48.6 94.8 72.6 45.0 89.6
February 60.6 89.5 45.6 82.0 77.4
March 80.6 71.5 87.1 59.5 47.3
April 83.6 92.5 58.9 80.1 45.5
May 52.5 42.9 44.9 48.4 67.1
June 66.9 66.7 56.4 95.1 37.7
July 81.3 87.5 39.6 47.9 79.0
August 98.8 70.5 58.5 93.9 66.4
September 72.2 77.1 48.1 86.3 52.9
October 80.0 86.6 58.5 44.0 23.9
November 96.6 93.5 55.0 33.8 43.0
December 92.4 78.3 47.5 30.2 39.3
AVERAGE 76.2 79.3 56.0 62.2 55.8
Chart 18: BERTH OCCUPANCY (%): MBARAKI WHARF: 2011 - 2015
Port Performance 2015
20
Table 16: NUMBER OF SHIPS WORKED: 2011- 2015
2011 2012 2013 2014 2015
January 84 104 98 127 124
February 86 101 96 110 122
March 100 97 103 99 123
April 86 97 109 97 127
May 96 90 112 106 110
June 99 86 108 114 114
July 105 109 117 119 112
August 103 110 116 109 122
September 99 104 106 129 104
October 110 94 130 120 117
November 106 100 119 113 110
December 95 101 118 135 111
TOTAL 1,169 1,193 1,332 1,378 1,396
Container vessels being worked at Mombasa Container Terminal
Port Performance 2015
21
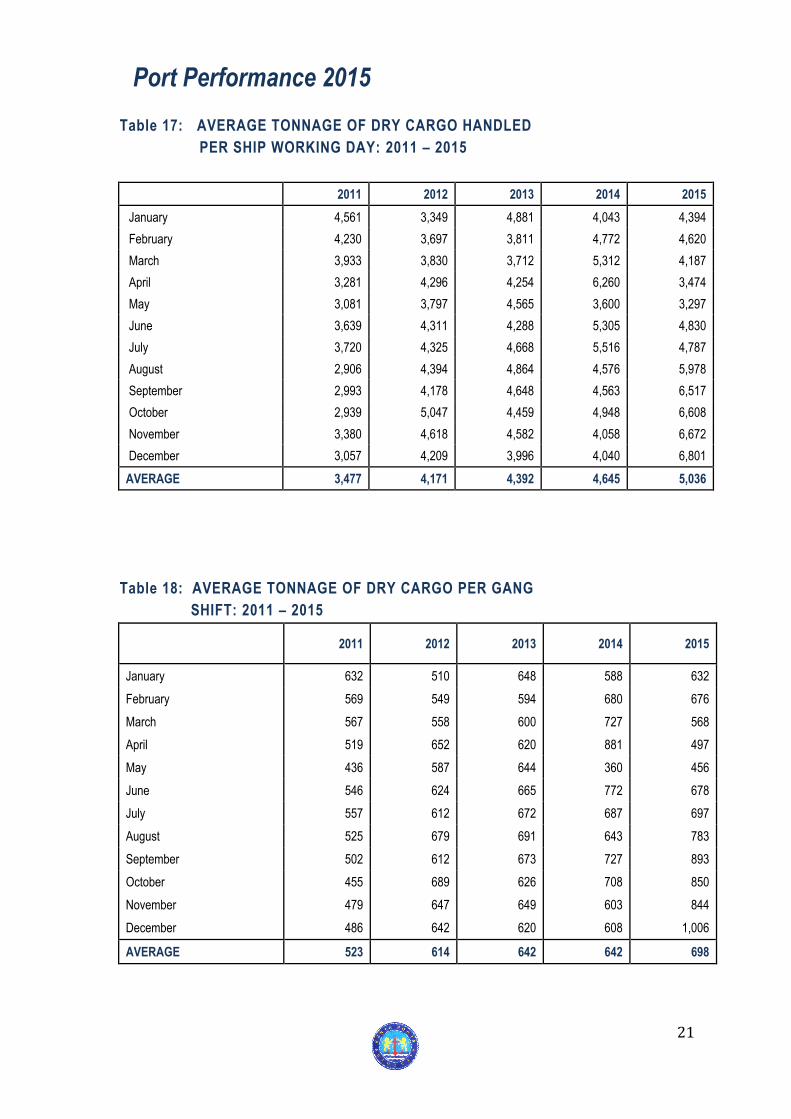
Table 17: AVERAGE TONNAGE OF DRY CARGO HANDLED
PER SHIP WORKING DAY: 2011 – 2015
2011 2012 2013 2014 2015
January 4,561 3,349 4,881 4,043 4,394
February 4,230 3,697 3,811 4,772 4,620
March 3,933 3,830 3,712 5,312 4,187
April 3,281 4,296 4,254 6,260 3,474
May 3,081 3,797 4,565 3,600 3,297
June 3,639 4,311 4,288 5,305 4,830
July 3,720 4,325 4,668 5,516 4,787
August 2,906 4,394 4,864 4,576 5,978
September 2,993 4,178 4,648 4,563 6,517
October 2,939 5,047 4,459 4,948 6,608
November 3,380 4,618 4,582 4,058 6,672
December 3,057 4,209 3,996 4,040 6,801
AVERAGE 3,477 4,171 4,392 4,645 5,036
Table 18: AVERAGE TONNAGE OF DRY CARGO PER GANG
SHIFT: 2011 – 2015
2011 2012 2013 2014 2015
January 632 510 648 588 632
February 569 549 594 680 676
March 567 558 600 727 568
April 519 652 620 881 497
May 436 587 644 360 456
June 546 624 665 772 678
July 557 612 672 687 697
August 525 679 691 643 783
September 502 612 673 727 893
October 455 689 626 708 850
November 479 647 649 603 844
December 486 642 620 608 1,006
AVERAGE 523 614 642 642 698
Port Performance 2015
22
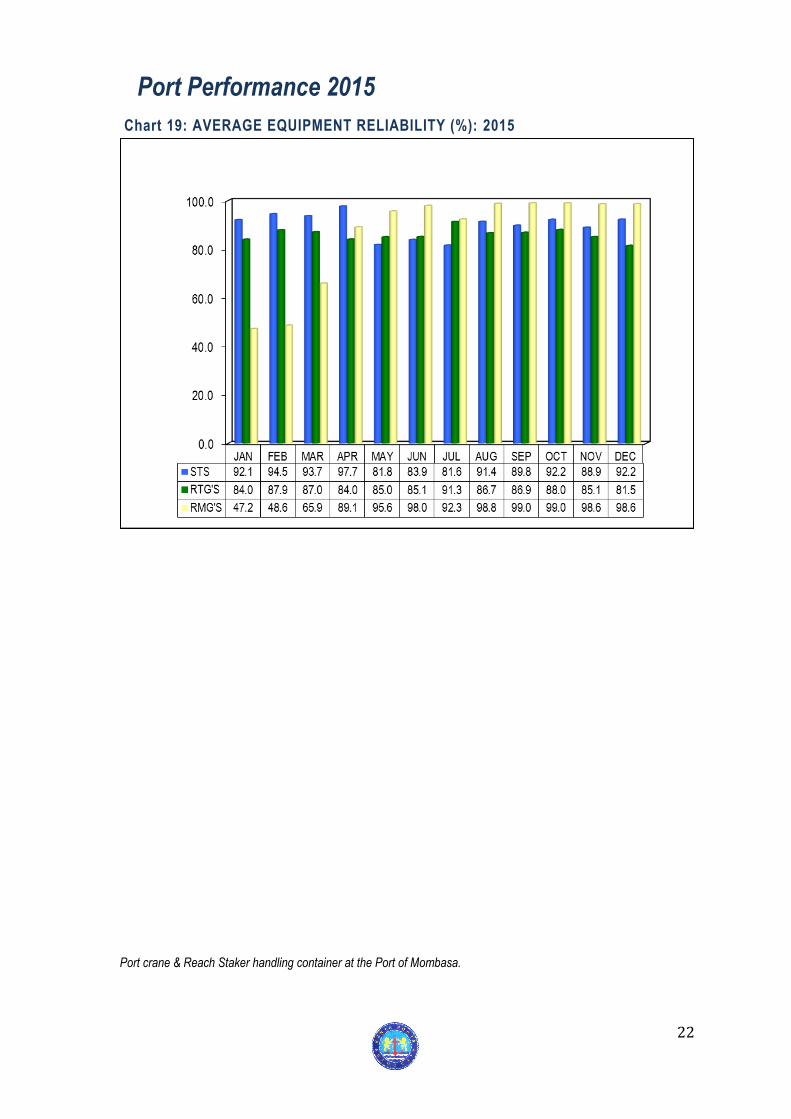
Chart 19: AVERAGE EQUIPMENT RELIABILITY (%): 2015
Port crane & Reach Staker handling container at the Port of Mombasa.
Port Performance 2015
23
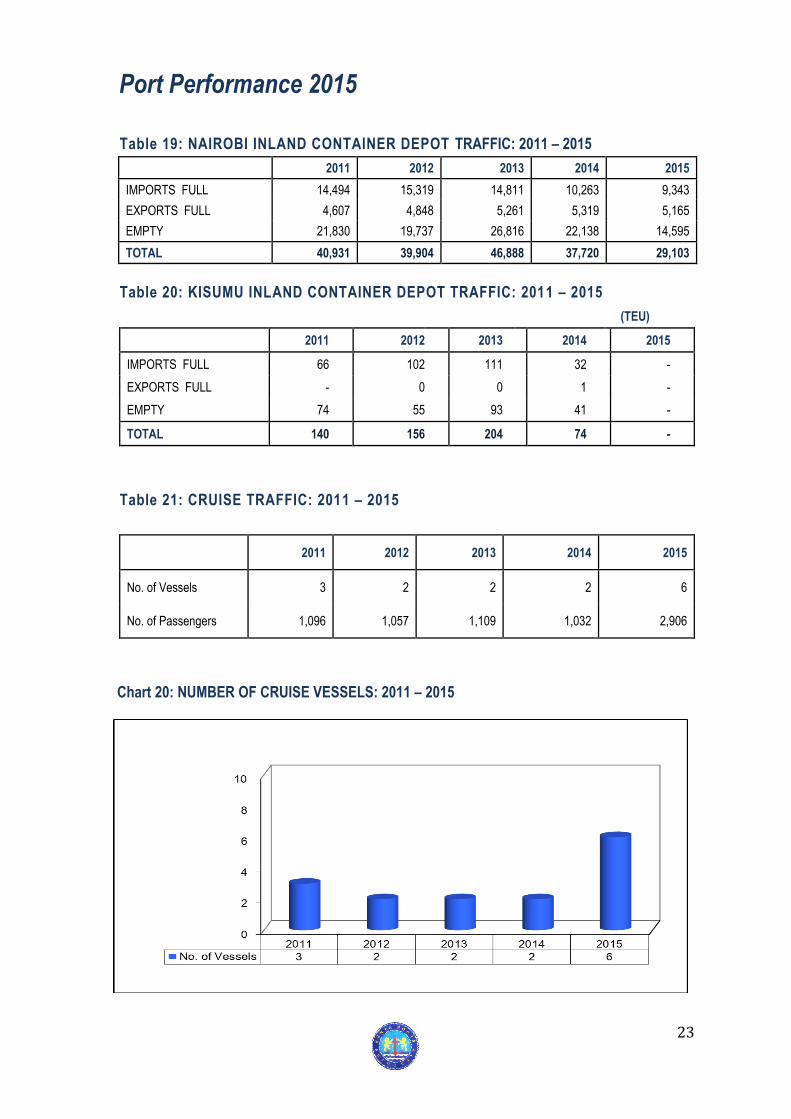
Table 19: NAIROBI INLAND CONTAINER DEPOT TRAFFIC: 2011 – 2015
2011 2012 2013 2014 2015
IMPORTS FULL 14,494 15,319 14,811 10,263 9,343
EXPORTS FULL 4,607 4,848 5,261 5,319 5,165
EMPTY 21,830 19,737 26,816 22,138 14,595
TOTAL 40,931 39,904 46,888 37,720 29,103
Table 20: KISUMU INLAND CONTAINER DEPOT TRAFFIC: 2011 – 2015
(TEU)
2011 2012 2013 2014 2015
IMPORTS FULL 66 102 111 32 -
EXPORTS FULL - 0 0 1 -
EMPTY 74 55 93 41 -
TOTAL 140 156 204 74 -
Table 21: CRUISE TRAFFIC: 2011 – 2015
2011 2012 2013 2014 2015
No. of Vessels 3 2 2 2 6
No. of Passengers 1,096 1,057 1,109 1,032 2,906
Chart 20: NUMBER OF CRUISE VESSELS: 2011 – 2015
Port Performance 2015
24
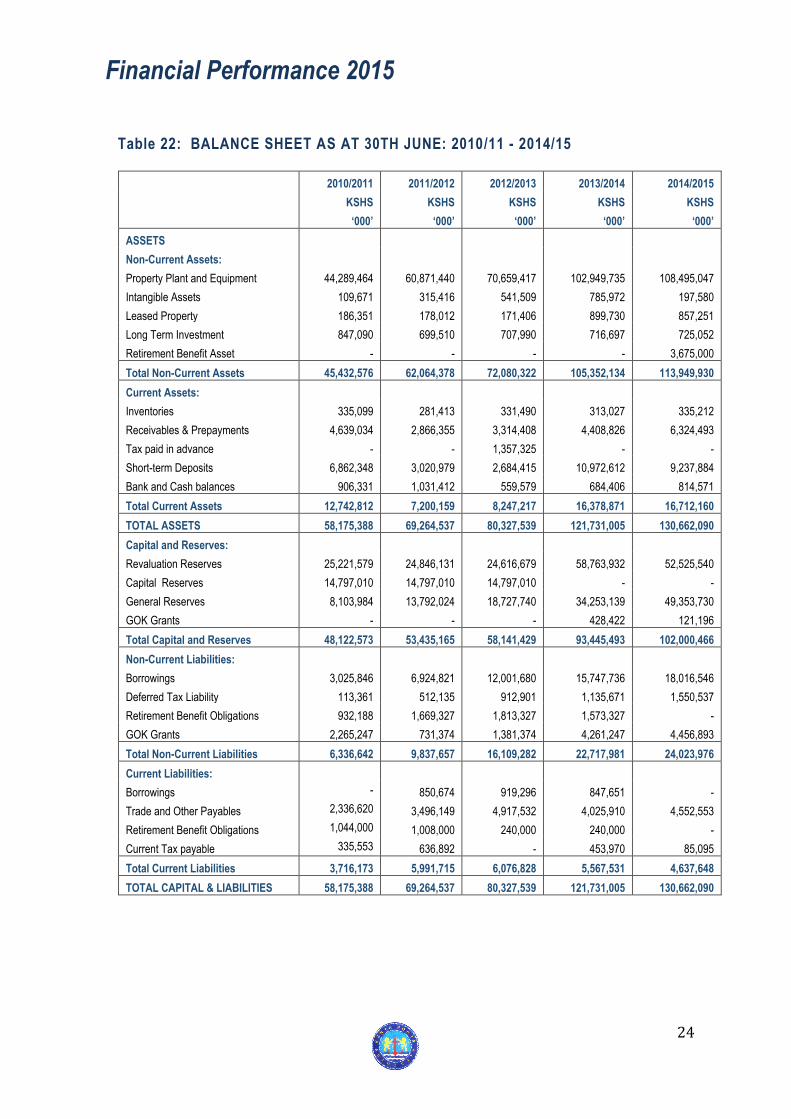
Table 22: BALANCE SHEET AS AT 30TH JUNE: 2010/11 - 2014/15
2010/2011 2011/2012 2012/2013 2013/2014 2014/2015
KSHS KSHS KSHS KSHS KSHS
‘000’ ‘000’ ‘000’ ‘000’ ‘000’
ASSETS
Non-Current Assets:
Property Plant and Equipment 44,289,464 60,871,440 70,659,417 102,949,735 108,495,047
Intangible Assets 109,671 315,416 541,509 785,972 197,580
Leased Property 186,351 178,012 171,406 899,730 857,251
Long Term Investment 847,090 699,510 707,990 716,697 725,052
Retirement Benefit Asset - - - - 3,675,000
Total Non-Current Assets 45,432,576 62,064,378 72,080,322 105,352,134 113,949,930
Current Assets:
Inventories 335,099 281,413 331,490 313,027 335,212
Receivables & Prepayments 4,639,034 2,866,355 3,314,408 4,408,826 6,324,493
Tax paid in advance - - 1,357,325 - -
Short-term Deposits 6,862,348 3,020,979 2,684,415 10,972,612 9,237,884
Bank and Cash balances 906,331 1,031,412 559,579 684,406 814,571
Total Current Assets 12,742,812 7,200,159 8,247,217 16,378,871 16,712,160
TOTAL ASSETS 58,175,388 69,264,537 80,327,539 121,731,005 130,662,090
Capital and Reserves:
Revaluation Reserves 25,221,579 24,846,131 24,616,679 58,763,932 52,525,540
Capital Reserves 14,797,010 14,797,010 14,797,010 - -
General Reserves 8,103,984 13,792,024 18,727,740 34,253,139 49,353,730
GOK Grants - - - 428,422 121,196
Total Capital and Reserves 48,122,573 53,435,165 58,141,429 93,445,493 102,000,466
Non-Current Liabilities:
Borrowings 3,025,846 6,924,821 12,001,680 15,747,736 18,016,546
Deferred Tax Liability 113,361 512,135 912,901 1,135,671 1,550,537
Retirement Benefit Obligations 932,188 1,669,327 1,813,327 1,573,327 -
GOK Grants 2,265,247 731,374 1,381,374 4,261,247 4,456,893
Total Non-Current Liabilities 6,336,642 9,837,657 16,109,282 22,717,981 24,023,976
Current Liabilities:
Borrowings - 850,674 919,296 847,651 -
Trade and Other Payables 2,336,620 3,496,149 4,917,532 4,025,910 4,552,553
Retirement Benefit Obligations 1,044,000 1,008,000 240,000 240,000 -
Current Tax payable 335,553 636,892 - 453,970 85,095
Total Current Liabilities 3,716,173 5,991,715 6,076,828 5,567,531 4,637,648
TOTAL CAPITAL & LIABILITIES 58,175,388 69,264,537 80,327,539 121,731,005 130,662,090
Financial Performance 2015
25
Chart 21: PROFIT AND LOSS STATEMENT (Kshs M) 2010/11 - 2014/15
The construction of classrooms by KPA at Sosodemu Primary School in Kilifi County
Financial Performance 2015
26
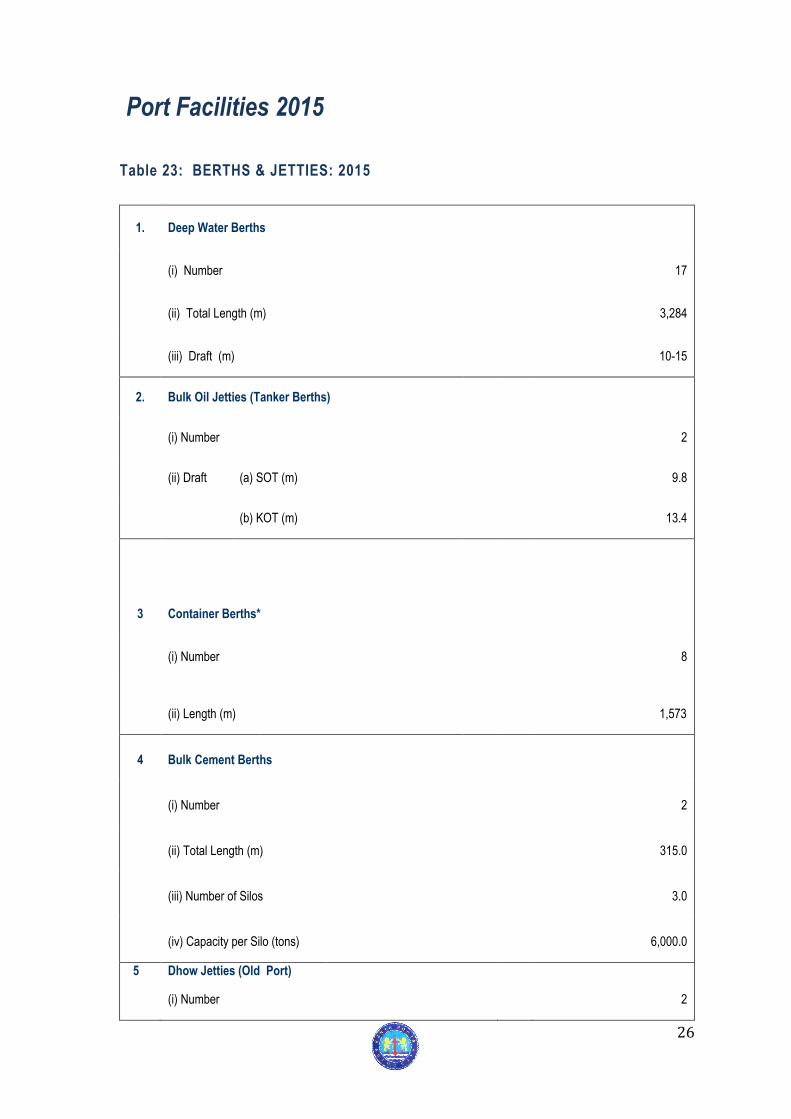
Table 23: BERTHS & JETTIES: 2015
1. Deep Water Berths
(i) Number 17
(ii) Total Length (m) 3,284
(iii) Draft (m) 10-15
2. Bulk Oil Jetties (Tanker Berths)
(i) Number 2
(ii) Draft (a) SOT (m) 9.8
(b) KOT (m) 13.4
3 Container Berths*
(i) Number 8
(ii) Length (m) 1,573
4 Bulk Cement Berths
(i) Number 2
(ii) Total Length (m) 315.0
(iii) Number of Silos 3.0
(iv) Capacity per Silo (tons) 6,000.0
5 Dhow Jetties (Old Port)
(i) Number 2
Port Facilities 2015
27
* Length & number included in 1 above.
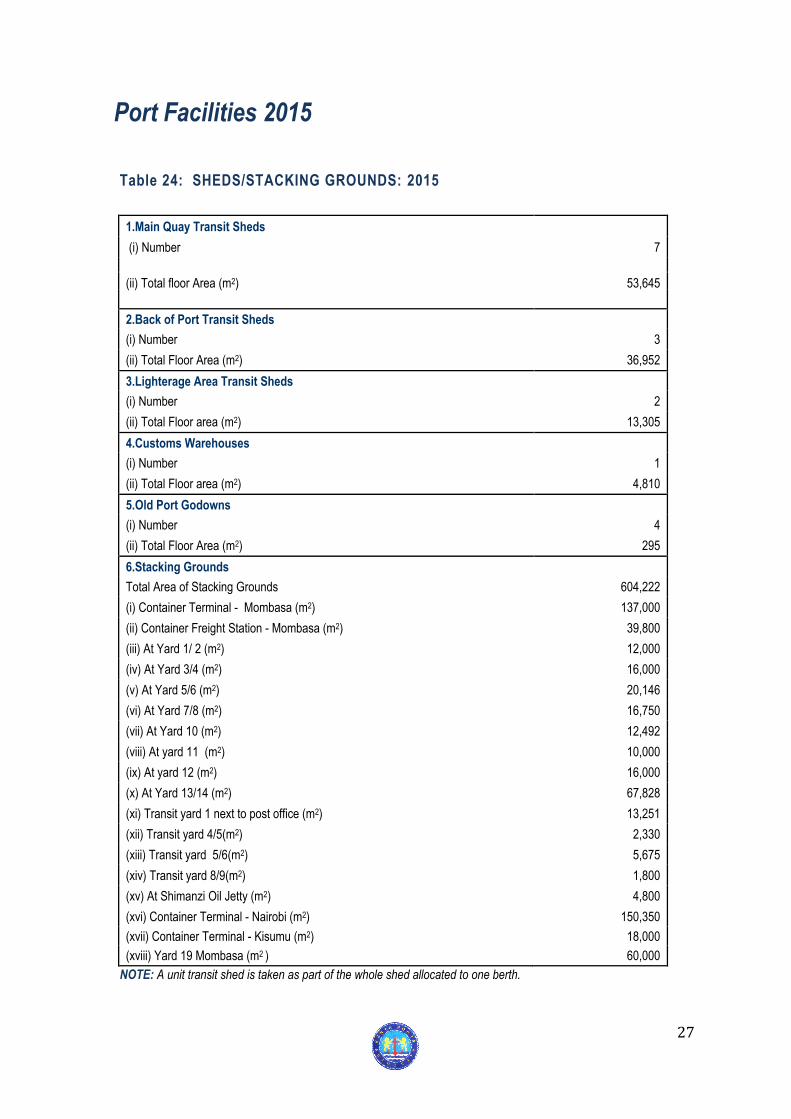
Table 24: SHEDS/STACKING GROUNDS: 2015
1.Main Quay Transit Sheds
(i) Number 7
(ii) Total floor Area (m2) 53,645
2.Back of Port Transit Sheds
(i) Number 3
(ii) Total Floor Area (m2) 36,952
3.Lighterage Area Transit Sheds
(i) Number 2
(ii) Total Floor area (m2) 13,305
4.Customs Warehouses
(i) Number 1
(ii) Total Floor area (m2) 4,810
5.Old Port Godowns
(i) Number 4
(ii) Total Floor Area (m2) 295
6.Stacking Grounds
Total Area of Stacking Grounds 604,222
(i) Container Terminal - Mombasa (m2) 137,000
(ii) Container Freight Station - Mombasa (m2) 39,800
(iii) At Yard 1/ 2 (m2) 12,000
(iv) At Yard 3/4 (m2) 16,000
(v) At Yard 5/6 (m2) 20,146
(vi) At Yard 7/8 (m2) 16,750
(vii) At Yard 10 (m2) 12,492
(viii) At yard 11 (m2) 10,000
(ix) At yard 12 (m2) 16,000
(x) At Yard 13/14 (m2) 67,828
(xi) Transit yard 1 next to post office (m2) 13,251
(xii) Transit yard 4/5(m2) 2,330
(xiii) Transit yard 5/6(m2) 5,675
(xiv) Transit yard 8/9(m2) 1,800
(xv) At Shimanzi Oil Jetty (m2) 4,800
(xvi) Container Terminal - Nairobi (m2) 150,350
(xvii) Container Terminal - Kisumu (m2) 18,000
(xviii) Yard 19 Mombasa (m2 ) 60,000
NOTE: A unit transit shed is taken as part of the whole shed allocated to one berth.
Port Facilities 2015
28
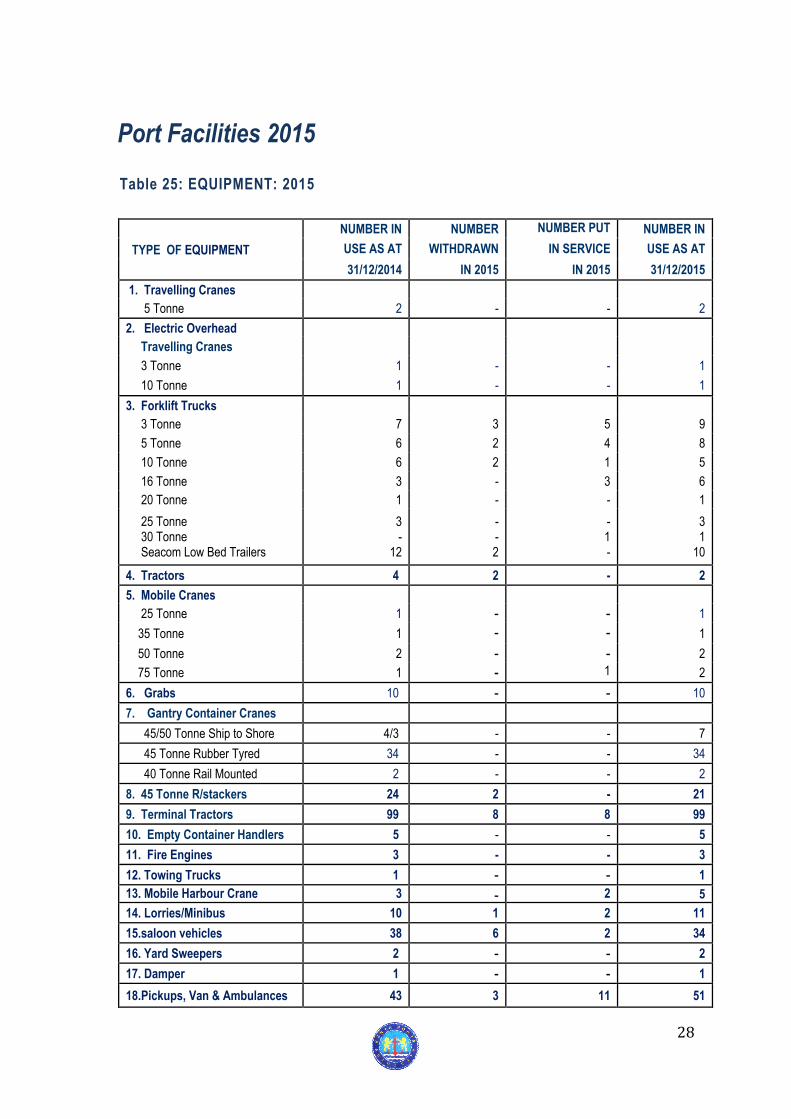
Table 25: EQUIPMENT: 2015
TYPE OF EQUIPMENT
NUMBER IN NUMBER NUMBER PUT PPUPUT
NUMBER IN
USE AS AT WITHDRAWN IN SERVICE USE AS AT
31/12/2014 IN 2015 IN 2015 31/12/2015
1. Travelling Cranes
5 Tonne 2 - - 2
2. Electric Overhead
Travelling Cranes
3 Tonne 1 - - 1
10 Tonne 1 - - 1
3. Forklift Trucks
3 Tonne 7 3 5 9
5 Tonne 6 2 4 8
10 Tonne 6 2 1 5
16 Tonne 3 - 3 6
20 Tonne 1 - - 1
25 Tonne 30 Tonne Seacom Low Bed Trailers
3 -
12
- - 2
- 1 -
3 1
10
4. Tractors 4 2 - 2
5. Mobile Cranes
25 Tonne 1 - - 1
35 Tonne 1 - - 1
50 Tonne 2 - - 2
75 Tonne 1 - 1 2
6. Grabs 10 - - 10
7. Gantry Container Cranes
45/50 Tonne Ship to Shore 4/3 - - 7
45 Tonne Rubber Tyred 34 - - 34
40 Tonne Rail Mounted 2 - - 2
8. 45 Tonne R/stackers 24 2 - 21
9. Terminal Tractors 99 8 8 99
10. Empty Container Handlers 5 - - 5
11. Fire Engines 3 - - 3
12. Towing Trucks 1 - - 1
13. Mobile Harbour Crane
3
-
0
2 5
14. Lorries/Minibus 10 1 2 11
15.saloon vehicles 38 6 2 34
16. Yard Sweepers 2 - - 2
17. Damper 1 - - 1
18.Pickups, Van & Ambulances 43 3 11 51
Port Facilities 2015
29
Table 26: FLOATING CRAFTS IN SERVICE: 2015
CRAFT NUMBER IN USE AS
AT 31/12/2014
NUMBER WITHDRAWN IN
2015
NUMBER PUT IN SERVICE IN 2015
NUMBER IN USE AS AT 31/12/15
Berthing Tugs 4 -
- 4
Pilot Boats 4 - - 4
Mooring Boats 4 - 2 6
Police Boat 1 - - 1
Speed Boat 2 - - 2
Table 27: AVAILABILITY OF AIDS TO NAVIGATION (%): 2011 – 2015
YEAR 2011
2012
2013
2014
2015
BEACONS 97.9
99.2
99.8
98.4
99.9
BUOYS 99.5
99.7
99.8
98.3
99.9
Chart 22: AVAILABILITY OF AIDS TO NAVIGATION (%): 2011 - 2015
Port Facilities 2015
30
Table 28: AIDS TO NAVIGATION AND LIGHTS: 2015 Aids to Navigation Description Light Range Height above
MHW(Metres) Source of Power
Character (n.mile) MOMBASA Ras Serani light (Front) White Metal Tower W 8 28 Elect/Batt. Ras Serani main lighthouse (Rear) White/Black Lighthouse FLW5S 18 45 Elect/Batt.50,000 cdl. Likoni leading light (Front) GRP Red/White Pillar W 3 11 Solar Likoni leading light (Rear) GRP Red/White Pillar FLW2S 3 16 Solar Likoni sector light White Obelisk WRG Iso.5sec. 2 21 Solar Mtongwe leading light (Front) White Column W 3 21 Solar Mtongwe leading light (Rear) White Obelisk FLW2S 6 28 Solar Kipevu leading light (Front) On top of marine office W 6 - Elect. /Batt. Kipevu leading light (Rear) White Obelisk W 2S 6 - Solar Shimanzi leading light (Front) White metal structure Q Red - - Elect./Batt. Shimanzi leading light (Rear) White Column W2S 6 - Solar Port Reitz leading light (Front) Piled structure/lattice tower W - - Solar Port Reitz leading light (Rear) Piled structure/lattice tower FLW2S - 10 Solar Ras Kikaangani beacon (Flora Pt) Red beacon Fl.Red 3sec. - 15 Solar Ras Machangwe (Cardinal mark) Yellow/Black Piled structure Q(6)+Lfl.15sec. - 4 Solar Ras Kiberamini leading light(Front) White/Black Column W - 4 Solar Ras Kisauni leading light (Rear) White/Black Column Fl.2sec. - 8 Solar Ras Mitani light Single Piled structure Q Red - 8 Solar Green Channel Buoys (6) Cone Shaped Fl.Green - 4 Solar Red Channel Buoys (6) Can Shaped Fl.Red - - Solar
CHALE ISLAND Chale Island Beacon (Chale Point) Lattice Structure Fl(2)w.20sec. 12 30 Solar
SHIMONI Pungutuayu Island GRP Black/White Tower Fl2W2S 10 16 Solar Shimoni leading light (Front) Lattice Structure - - - Solar Shimoni leading light (Rear) Lattice Structure - - - Solar Shimoni “X” Band Racon Located on Front Beacon - - - Solar
MTWAPA Canon Point Beacon (Front) Concrete Pillar - - - - Canon Point Lighthouse (Rear) GRP Red/White Lighthouse Fl.10sec. 11 19 Solar James Point Beacon (Front) Concrete Pillar - - - - James Point Beacon (Rear) Concrete Pillar - - - - Mtwapa Beacon (Front) Concrete Pillar - - - - Mtwapa Beacon (Rear) Concrete Pillar - - - -
KILIFI Kilifi Main Light Lattice Structure Lfl.30sec. 9 40 Solar Ras Kitoka Leading Light.(Front) GRP Red/White Pillar FR 13 6 Solar Ras Kitoka Leading Light (Rear) GRP Red/White Pillar FR 5 6 Solar Ras Kioni Leading Light (Front) GRP Red/White Pillar FR 5 6 Solar Ras Kioni Leading Light (Rear) GRP Red/White Pillar FR 21 6 Solar
MALINDI Malindi Main Light Lattice Tower Fl.10sec. 14 25 Solar Pillar Reef White Concrete Column QWR 9 6 Solar Malindi Leading (Front) GRP Tower Red/White FR 5 - Solar Malindi Leading (Rear) GRP Tower Red/White FR 5 - Solar
LAMU Shella Leading (Front) GRP Red/White Pillar W 8 9 Solar Shella Leading (Rear) GRP Red/White Pillar Fl.5sec. 8 56 Solar Ras Kitau Leading (Front) GRP Red/White Pillar QW 2 5 Solar Ras Kitau Leading (Rear) GRP Red/White Pillar Fl.5sec. 2 10 Solar Takwa Leading (Front) Red/White Pillar Q 2 5 Solar Takwa Leading (Rear) -Northerly Red/White Concrete Pillar Fl.3 2 10 Solar Takwa Leading (Rear) -Southerly Red/White Concrete Pillar Fl.3 2 11 Solar Mokowe Leading (Front) GRP Red/White Pillar - Solar Mokowe Leading (Rear) GRP Red/White Pillar Lfl.10sec. - - Solar Mokowe Jetty Leading (Front) GRP Red/White Pillar Fl..G - - Solar Mokowe Jetty Leading (Rear) GRP Red/White Pillar Fl. R - Solar Green Channel Buoys Cone Shaped Solar Red Channel Buoys Can Shaped Solar Lamu Pate Sector Light Lattice Structure Solar Lamu Pate “X” Band Racon - Solar Magogoni Leading (Front) Lattice Structure Solar Magogoni Leading (Rear) Lattice Structure Solar
KIPINI Kipini Light Black/White GRP Tower W 11 29 Solar
Port Facilities 2015
31
QUALITY POLICY
Quality Policy Statement 2015


![KENYA PORTS AUTHORITY ACT - FAOLEX Databasefaolex.fao.org/docs/pdf/ken1745a.pdf · LAWS OF KENYA KENYA PORTS AUTHORITY ACT CHAPTER 391 Revised Edition 2012 [1979] Published by the](https://img.pdfslide.net/doc/110x75/5aabc5da7f8b9a59658c42dc/kenya-ports-authority-act-faolex-of-kenya-kenya-ports-authority-act-chapter-391.jpg)