Embed Size (px)
DESCRIPTION
FIZIK
Citation preview
1 | R a m a l a n S P M 2 0 1 4 K e r t a s 3 S o a l a n 1 S u h a i m i - I n o v a s i
ANSWERING TIPS FOR PAPER 3TIPS MENJAWAB SOALAN KERTAS 3
Section A : Question 1
1. Test the students in using of scientific measuring instrument and make the readings.Menguji murid menggunakan alat pengukur dan membuat bacaan
2. The students should know how to make reading in several type of measuring instrument without error, tabulate the data and draw a graph based on the data.Pelajar perlu mengetahui bagaimana untuk mengambil bacaan beberapa alat pengukur tanpa ralat, menjadualkan data dan melukis graf berdasarkan nilai dalam data.
3. The students have to write the reading in correct d.p as the accuracy of the instrument. Pelajar dikehendaki menulis bacaan dengan bilangan t.p seperti kejituan alat pengukur.
4. Draw a suitable graph based on the given title with the following ;- Correct quantities and their unit on both axes- Uniform scale at both axes- Points plotted correctly- Balance graph line - Size of graph 5 x 4 larger squares or 10 cm x 8 cm
Melukis graf mengikut tajuk yang diarahkan dengan ciri-ciri berikut :- Kuantiti kedua-dua paksi dengan unit yang betul- Skala yang seragam sesuai dengan kuantiti dalam data- Pindahan titik yang betul- Garisan graf yang seimbang- Saiz graf yang cukup besar minima (5 x 4 petak besar atas graf) atau 10cm x 8cm
(0,0)
(i)
(0,0)
y
x
F
y is directly proportional to x
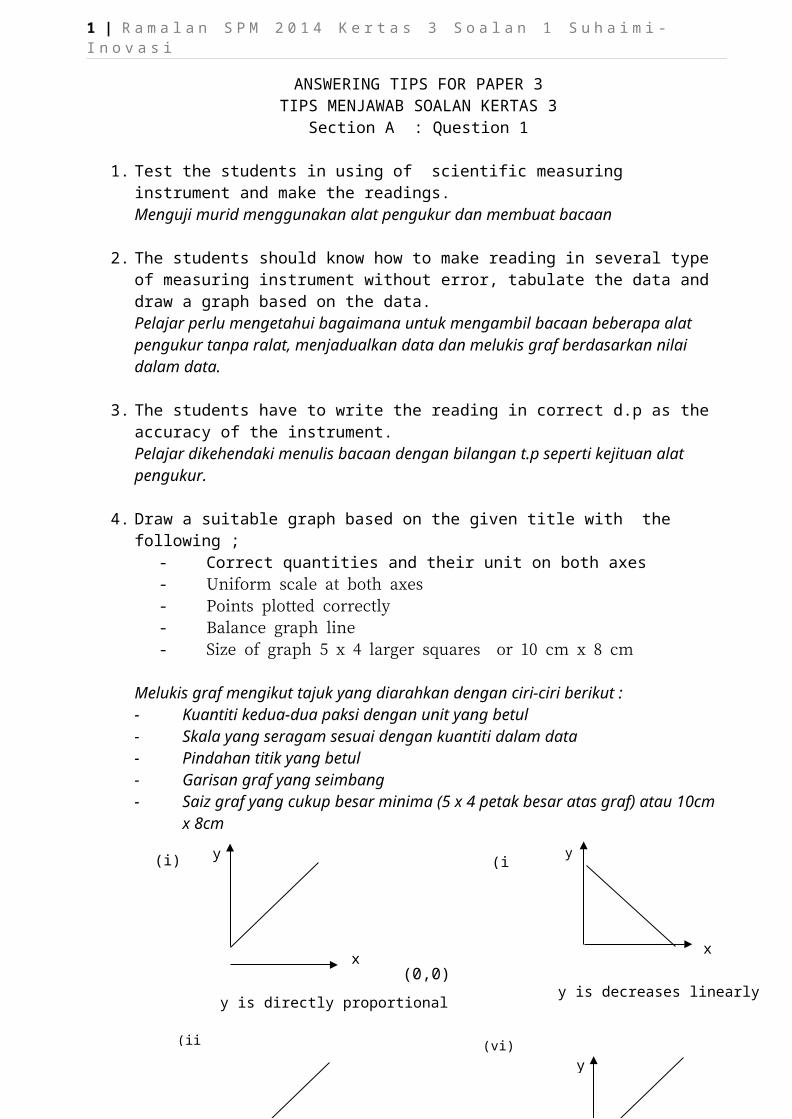
y is increase linearly to x
y
y is decreases linearly to x
x
y
x
(ii)
(iii) (vi)
(0,0)
y
x
y is increase linearly to x
2 | R a m a l a n S P M 2 0 1 4 K e r t a s 3 S o a l a n 1 S u h a i m i - I n o v a s i
Trial SBP 2014
Section ABahagian A
[28 marks/28 markah]Answer all questions in this section Jawab
semua soalan dalam bahagian ini. cikguadura.wordpress.com
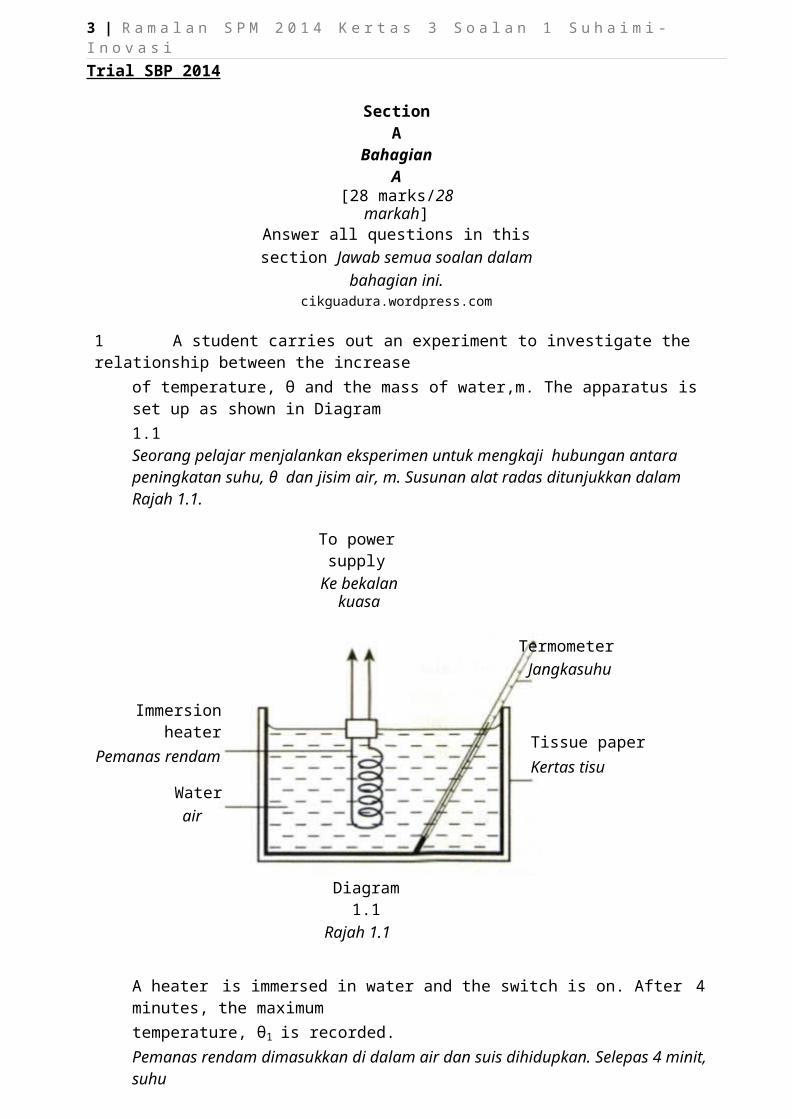
1 A student carries out an experiment to investigate the relationship between the increaseof temperature, θ and the mass of water,m. The apparatus is set up as shown in Diagram1.1Seorang pelajar menjalankan eksperimen untuk mengkaji hubungan antara peningkatan suhu, θ dan jisim air, m. Susunan alat radas ditunjukkan dalam Rajah 1.1.
To power supplyKe bekalan kuasa
TermometerJangkasuhu
Immersion heaterPemanas rendam
Waterair
Tissue paperKertas tisu
Diagram 1.1Rajah 1.1
A heater is immersed in water and the switch is on. After 4 minutes, the maximumtemperature, θ1 is recorded.Pemanas rendam dimasukkan di dalam air dan suis dihidupkan. Selepas 4 minit, suhumaksimum, θ1 direkodkan.
3 | R a m a l a n S P M 2 0 1 4 K e r t a s 3 S o a l a n 1 S u h a i m i - I n o v a s i
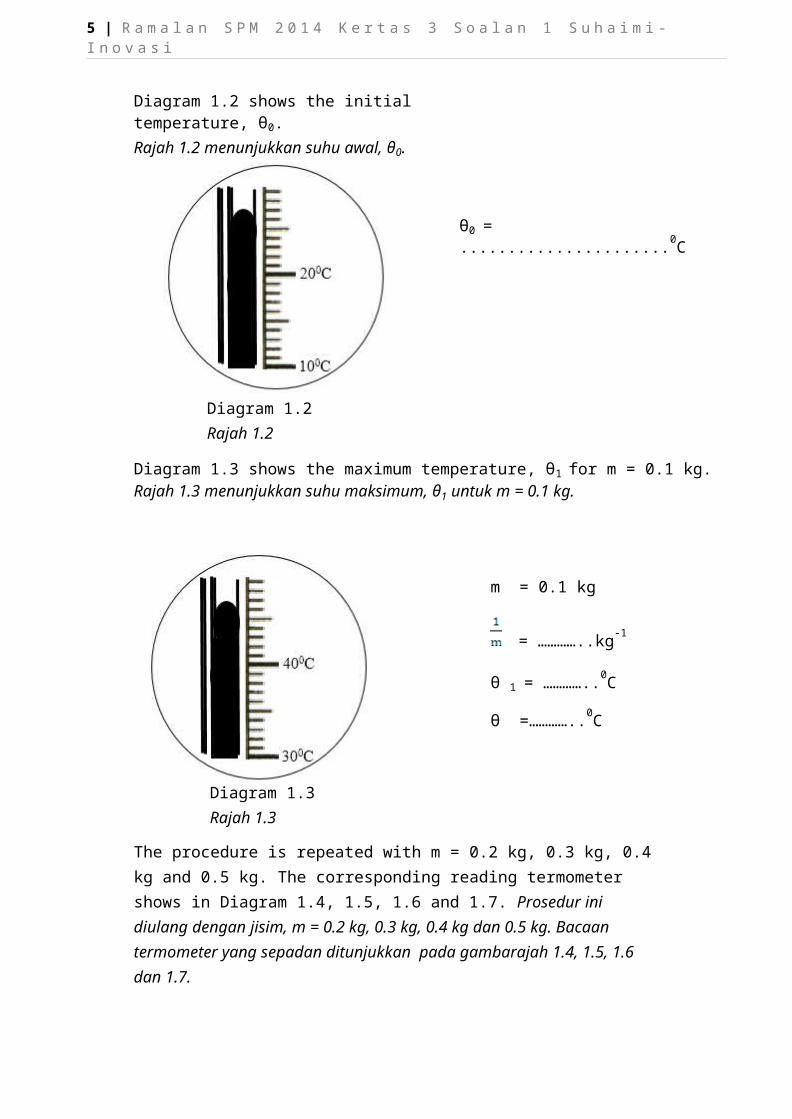
Diagram 1.2 shows the initial temperature, θ0.Rajah 1.2 menunjukkan suhu awal, θ0.
θ0 = ......................0C
Diagram 1.2Rajah 1.2
Diagram 1.3 shows the maximum temperature, θ1 for m = 0.1 kg.Rajah 1.3 menunjukkan suhu maksimum, θ1 untuk m = 0.1 kg.
m = 0.1 kg
= …………..kg-1
θ 1 = …………..0C
θ =…………..0C
Diagram 1.3Rajah 1.3
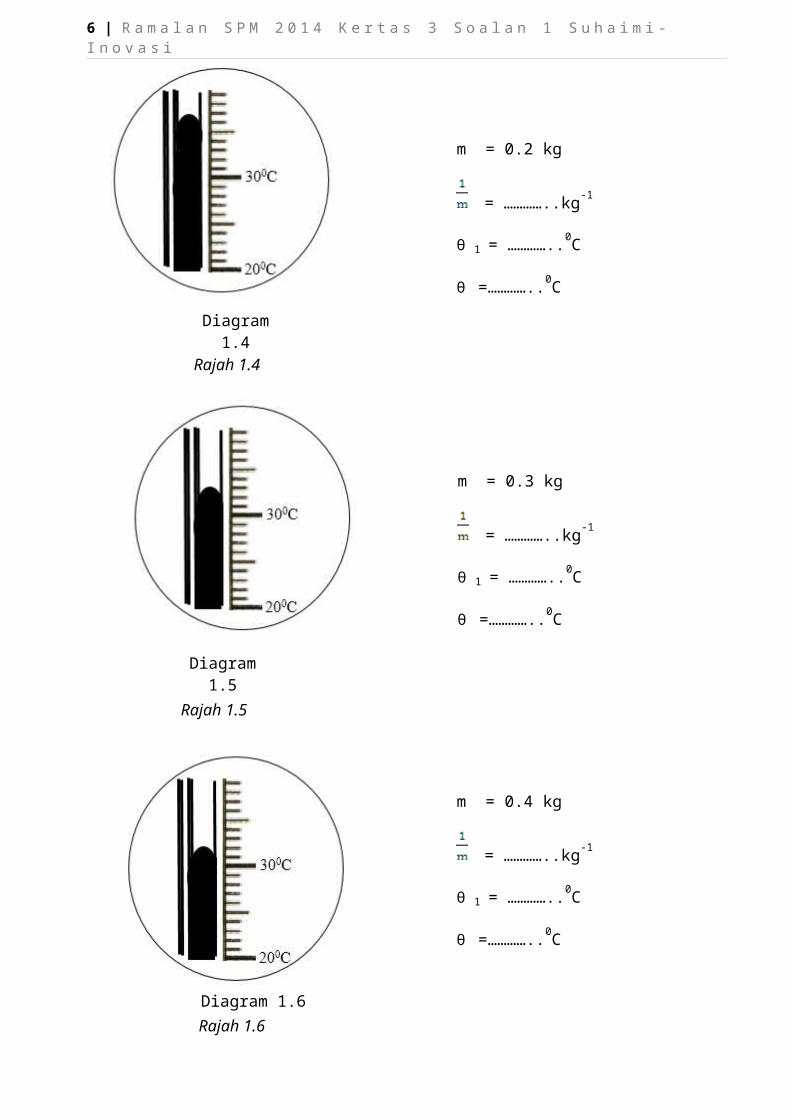
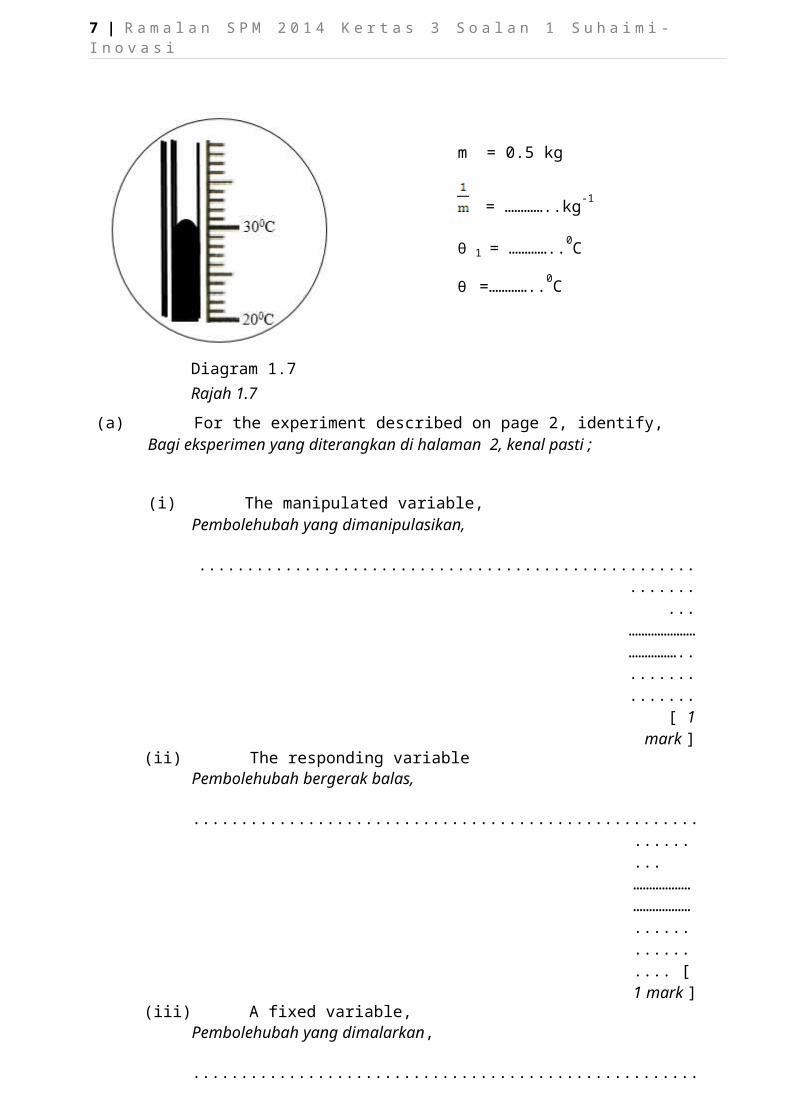
The procedure is repeated with m = 0.2 kg, 0.3 kg, 0.4 kg and 0.5 kg. The corresponding reading termometer shows in Diagram 1.4, 1.5, 1.6 and 1.7. Prosedur ini diulang dengan jisim, m = 0.2 kg, 0.3 kg, 0.4 kg dan 0.5 kg. Bacaan termometer yang sepadan ditunjukkan pada gambarajah 1.4, 1.5, 1.6 dan 1.7.
4 | R a m a l a n S P M 2 0 1 4 K e r t a s 3 S o a l a n 1 S u h a i m i - I n o v a s i
Diagram 1.4Rajah 1.4
Diagram 1.5Rajah 1.5
Diagram 1.6Rajah 1.6
m = 0.2 kg
= …………..kg-1
θ 1 = …………..0C
θ =…………..0C
m = 0.3 kg
= …………..kg-1
θ 1 = …………..0C
θ =…………..0C
m = 0.4 kg
= …………..kg-1
θ 1 = …………..0C
θ =…………..0C
5 | R a m a l a n S P M 2 0 1 4 K e r t a s 3 S o a l a n 1 S u h a i m i - I n o v a s i
m = 0.5 kg
= …………..kg-1
θ 1 = …………..0C
θ =…………..0C
Diagram 1.7Rajah 1.7
(a) For the experiment described on page 2, identify,Bagi eksperimen yang diterangkan di halaman 2, kenal pasti ;
(i) The manipulated variable,Pembolehubah yang dimanipulasikan,
..............................................................………………………………................ [ 1 mark ]
(ii) The responding variablePembolehubah bergerak balas,
..............................................................………………………………................ [ 1 mark ]
(iii) A fixed variable,Pembolehubah yang dimalarkan,
..............................................................………………………………................ [ 1 mark ]
6 | R a m a l a n S P M 2 0 1 4 K e r t a s 3 S o a l a n 1 S u h a i m i - I n o v a s i
6 4531/3
(b) Based on Diagram 1.2, 1.3, 1.4, 1.5,1.6 and 1.7 on page 3, 4 and 5.Berdasarkan Rajah 1.2, 1.3, 1.4. 1.5, 1.6 dan 1.7 dihalaman 3, 4 dan 5.(i) Record the reading of θ 0.
Rekod bacaan θ 0.
(ii) Calculate for each m.
Hitung bagi setiap m.
(iii) Record the readings of θ 1.Rekod bacaan θ 1.
[1 mark]
[1 mark]
[2 mark](iv) For each value of θ 1, in b(iii), calculate increase of temperature, θ using the
formula below:Untuk setiap nilai θ 1 di b(iii), hitung peningkatan suhu, θ mengunakan rumus di bawah:
θ = θ 1- θ 0
(v) Tabulate your results for m, , θ 1 and θ in the space below.
[1 mark]
Jadualkan data anda bagi semua nilai m, , θ 1 and θ dalam ruang di bawah.
[2 marks ]
(c ) On the graph paper on page 7, draw a graph of θ against
Pada kertas graf di halaman 7 , lukiskan graf θ melawan
[ 5 marks]
7 | R a m a l a n S P M 2 0 1 4 K e r t a s 3 S o a l a n 1 S u h a i m i - I n o v a s i
(d) Based on the graph on page 7, state the relationship between θ and m .Berdasarkan graf anda di halaman 7, nyatakan hubungan antara θ dan m.
..............................................................………………………………............
Trial MRSM 2014
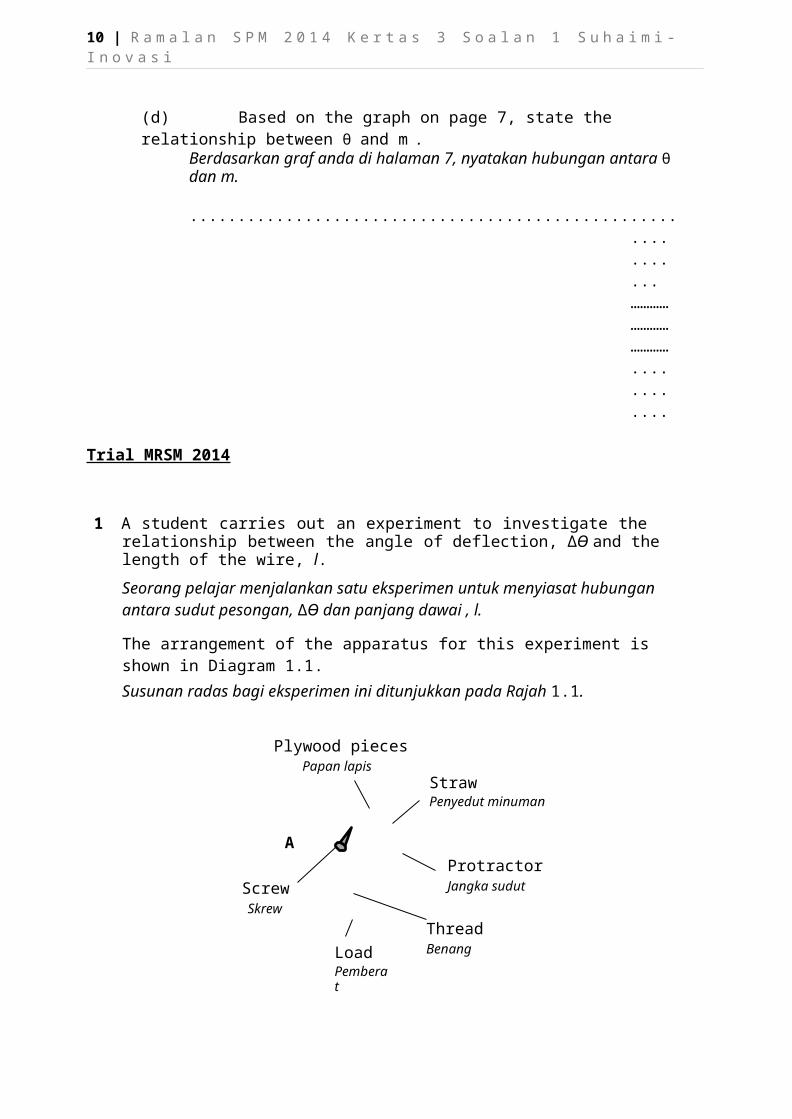
1 A student carries out an experiment to investigate the relationship between the angle of deflection, ∆Ɵ and the length of the wire, l.
Seorang pelajar menjalankan satu eksperimen untuk menyiasat hubungan antara sudut pesongan, ∆Ɵ dan panjang dawai , l.
The arrangement of the apparatus for this experiment is shown in Diagram 1.1.
Susunan radas bagi eksperimen ini ditunjukkan pada Rajah 1.1.
Plywood piecesPapan lapis
StrawPenyedut minuman
A
ScrewSkrew
LoadPemberat
ProtractorJangka sudut
ThreadBenang
Diagram 1.1Rajah 1.1
The thread of the load lies exactly aligned with the 90° mark on the protractor.
Benang beban berada segaris dengan tanda sudut 90° pada jangka sudut.
A wire length of, l =10.0 cm is hung from A and the final angle of deflection, Ɵf is measured using a protractor as shown in Diagram 1.2.
Seutas dawai dengan panjang, l =10.0 cm digantungkan pada A dan sudut pesongan akhir, Ɵf diukur menggunakan jangka sudut seperti ditunjukkan dalam Rajah 1.2.
Diagram 1.2
8 | R a m a l a n S P M 2 0 1 4 K e r t a s 3 S o a l a n 1 S u h a i m i - I n o v a s i
Ɵf
Rajah 1.2
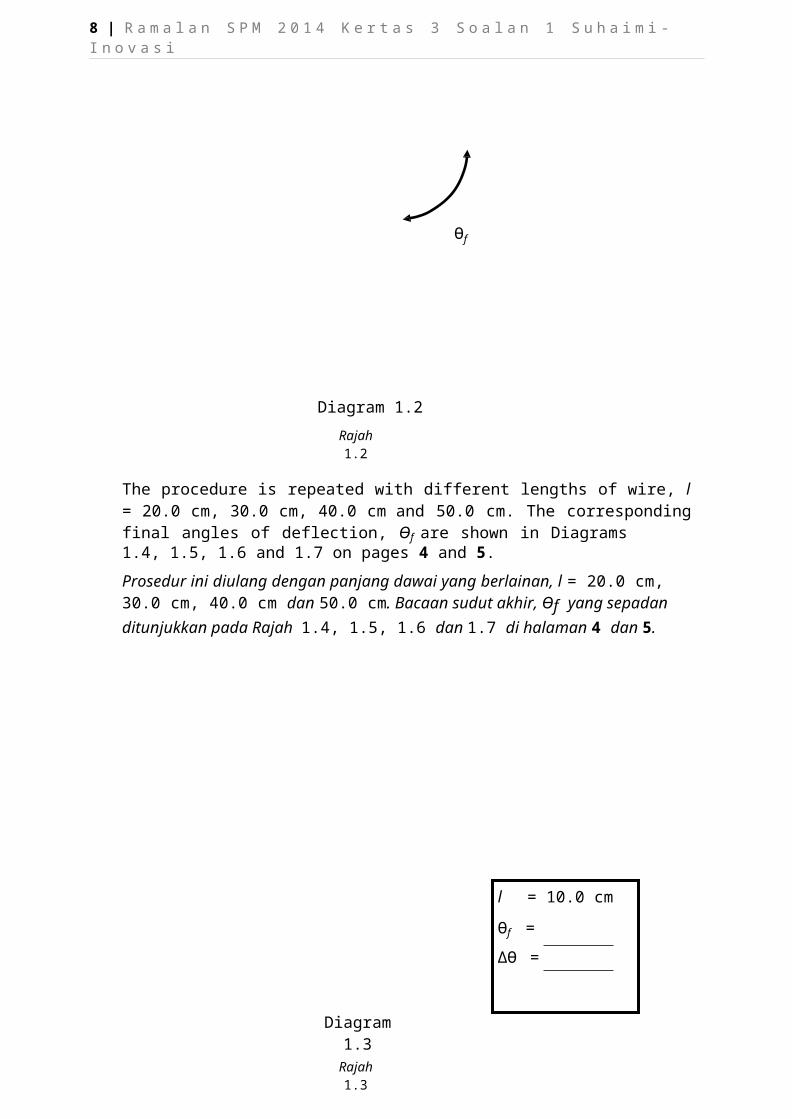
The procedure is repeated with different lengths of wire, l = 20.0 cm, 30.0 cm, 40.0 cm and 50.0 cm. The corresponding final angles of deflection, Ɵf are shown in Diagrams1.4, 1.5, 1.6 and 1.7 on pages 4 and 5.
Prosedur ini diulang dengan panjang dawai yang berlainan, l = 20.0 cm, 30.0 cm, 40.0 cm dan 50.0 cm. Bacaan sudut akhir, Ɵf yang sepadan ditunjukkan pada Rajah 1.4, 1.5, 1.6 dan 1.7 di halaman 4 dan 5.
l = 10.0 cm
Ɵf =
∆Ɵ =
Diagram 1.3Rajah 1.3
9 | R a m a l a n S P M 2 0 1 4 K e r t a s 3 S o a l a n 1 S u h a i m i - I n o v a s i
l = 20.0 cm
Ɵf =
∆Ɵ =
Diagram 1.4Rajah 1.4
l = 30.0 cm
Ɵf =
∆Ɵ =
Diagram 1.5Rajah 1.5
10 | R a m a l a n S P M 2 0 1 4 K e r t a s 3 S o a l a n 1 S u h a i m i - I n o v a s i
l = 40.0 cm
Ɵf =
∆Ɵ =
Diagram 1.6Rajah 1.6
l = 50.0 cm
Ɵf =
∆Ɵ =
Diagram 1.7Rajah 1.7
[Turn over
11 | R a m a l a n S P M 2 0 1 4 K e r t a s 3 S o a l a n 1 S u h a i m i - I n o v a s i
For Examiner’s
Use.
1(a)(i)
1
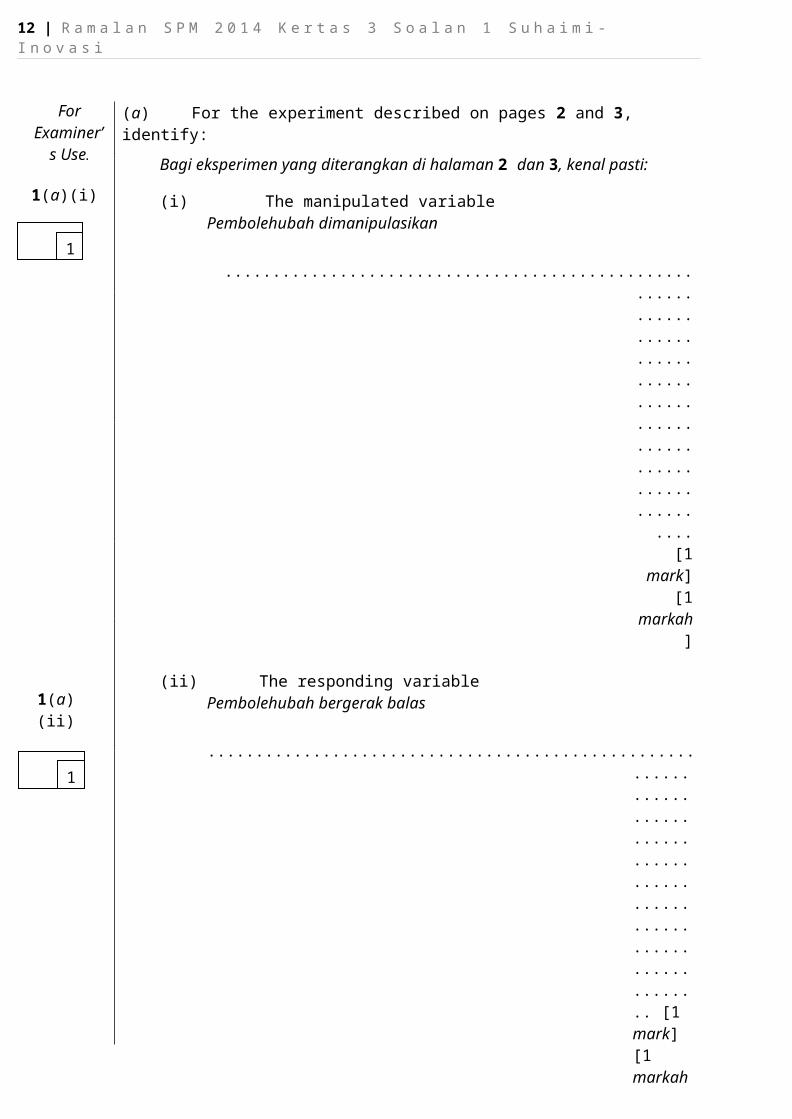
(a) For the experiment described on pages 2 and 3, identify:
Bagi eksperimen yang diterangkan di halaman 2 dan 3, kenal pasti:
(i) The manipulated variablePembolehubah dimanipulasikan
....................................................................................................................... [1 mark]
[1 markah]
1(a)(ii)
1
(ii) The responding variablePembolehubah bergerak balas
....................................................................................................................... [1 mark] [1 markah]
1(a)(iii)
1
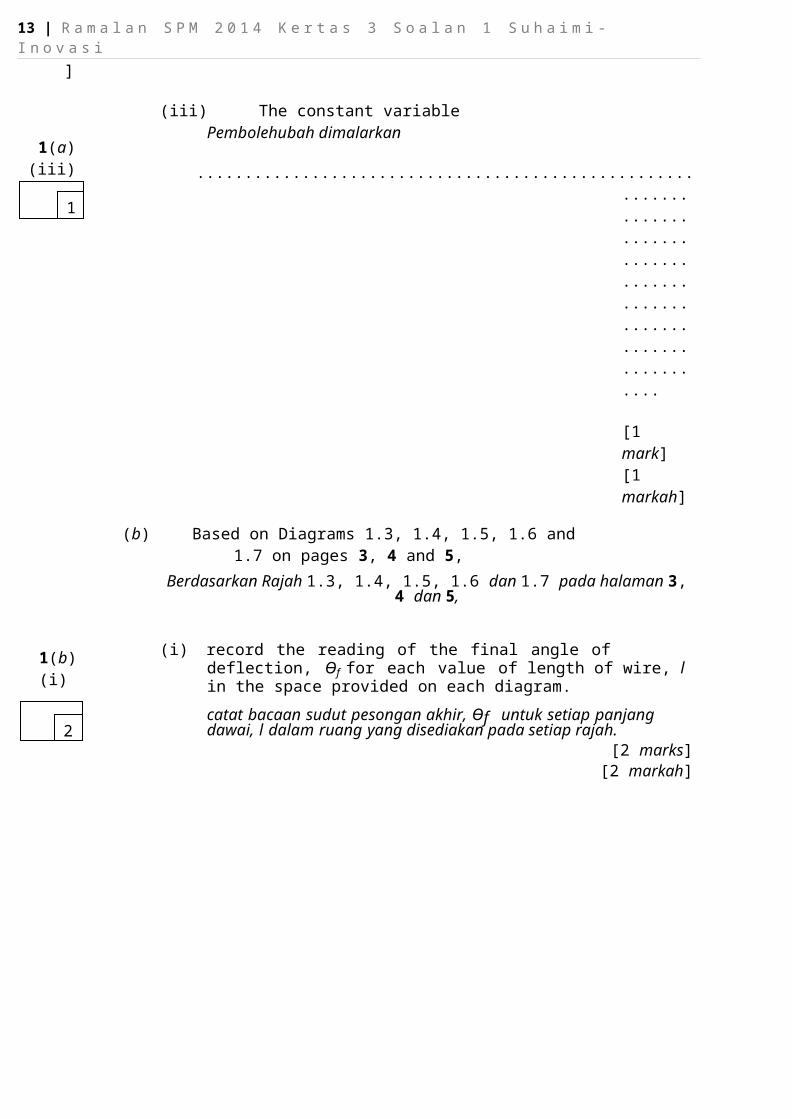
(iii) The constant variablePembolehubah dimalarkan
....................................................................................................................... [1 mark] [1 markah]
(b) Based on Diagrams 1.3, 1.4, 1.5, 1.6 and 1.7 on pages 3, 4 and 5,
Berdasarkan Rajah 1.3, 1.4, 1.5, 1.6 dan 1.7 pada halaman 3, 4 dan 5,
1(b)(i)
2
(i) record the reading of the final angle of deflection, Ɵf for each value of length of wire, l in the space provided on each diagram.
catat bacaan sudut pesongan akhir, Ɵf untuk setiap panjang dawai, l dalam ruang yang disediakan pada setiap rajah.
[2 marks][2 markah]
12 | R a m a l a n S P M 2 0 1 4 K e r t a s 3 S o a l a n 1 S u h a i m i - I n o v a s i
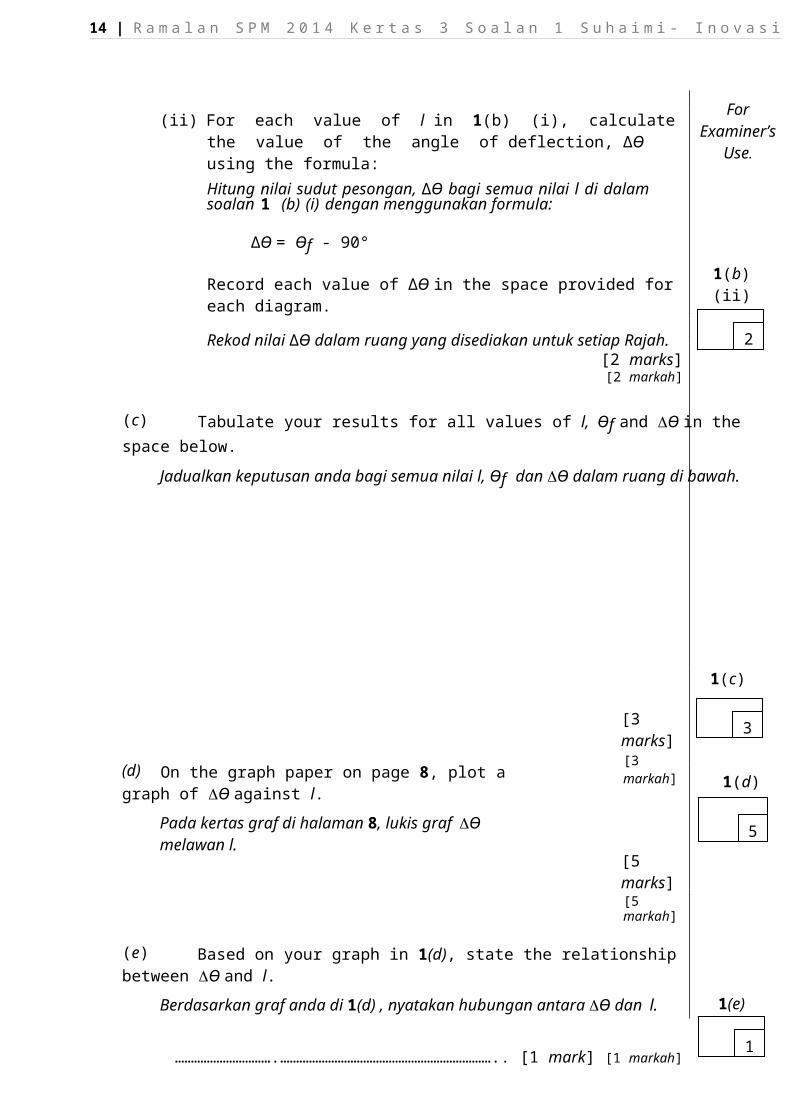
(ii) For each value of l in 1(b) (i), calculate the value of the angle of deflection, ∆Ɵ using the formula:
Hitung nilai sudut pesongan, ∆Ɵ bagi semua nilai l di dalam soalan 1 (b) (i) dengan menggunakan formula:
∆Ɵ = Ɵf - 90°
Record each value of ∆Ɵ in the space provided for each diagram.
Rekod nilai ∆Ɵ dalam ruang yang disediakan untuk setiap Rajah.[2 marks][2 markah]
For Examiner’s
Use.
1(b)(ii)
2
(c) Tabulate your results for all values of l,Ɵf and Ɵ in the space below.
Jadualkan keputusan anda bagi semua nilai l, Ɵf dan Ɵ dalam ruang di bawah.
1(c)
(d) On the graph paper on page 8, plot a graph of Ɵ against l.
Pada kertas graf di halaman 8, lukis graf Ɵ melawan l.
[3 marks][3 markah]
[5 marks][5 markah]
3
1(d)
5
(e) Based on your graph in 1(d), state the relationship between Ɵ and l.
Berdasarkan graf anda di 1(d) , nyatakan hubungan antara Ɵ dan l.
………………………….………………………………………………………….. [1 mark]
[1 markah]
1(e)
1
13 | R a m a l a n S P M 2 0 1 4 K e r t a s 3 S o a l a n 1 S u h a i m i - I n o v a s i
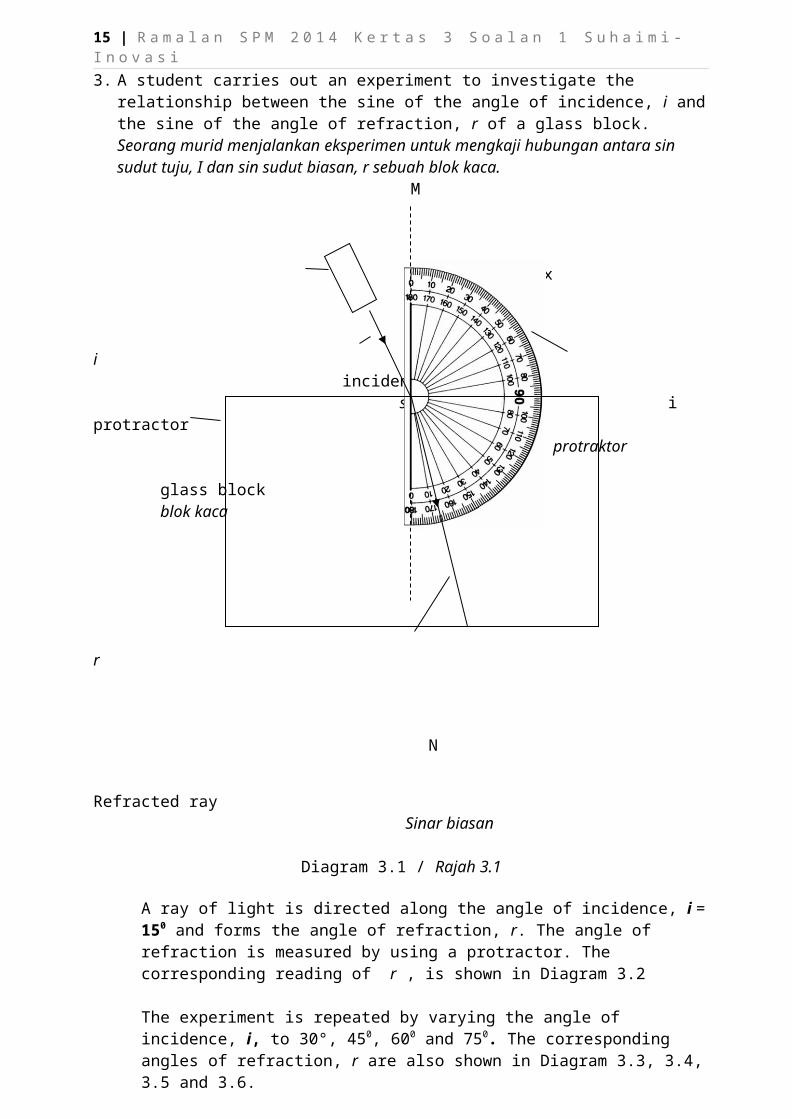
3. A student carries out an experiment to investigate the relationship between the sine of the angle of incidence, i and the sine of the angle of refraction, r of a glass block.Seorang murid menjalankan eksperimen untuk mengkaji hubungan antara sin sudut tuju, I dan sin sudut biasan, r sebuah blok kaca.
M
ray box kotak sinar
i incident ray
sinar tuju i protractor protraktor
glass block blok kaca
r
N
Refracted ray Sinar biasan
Diagram 3.1 / Rajah 3.1
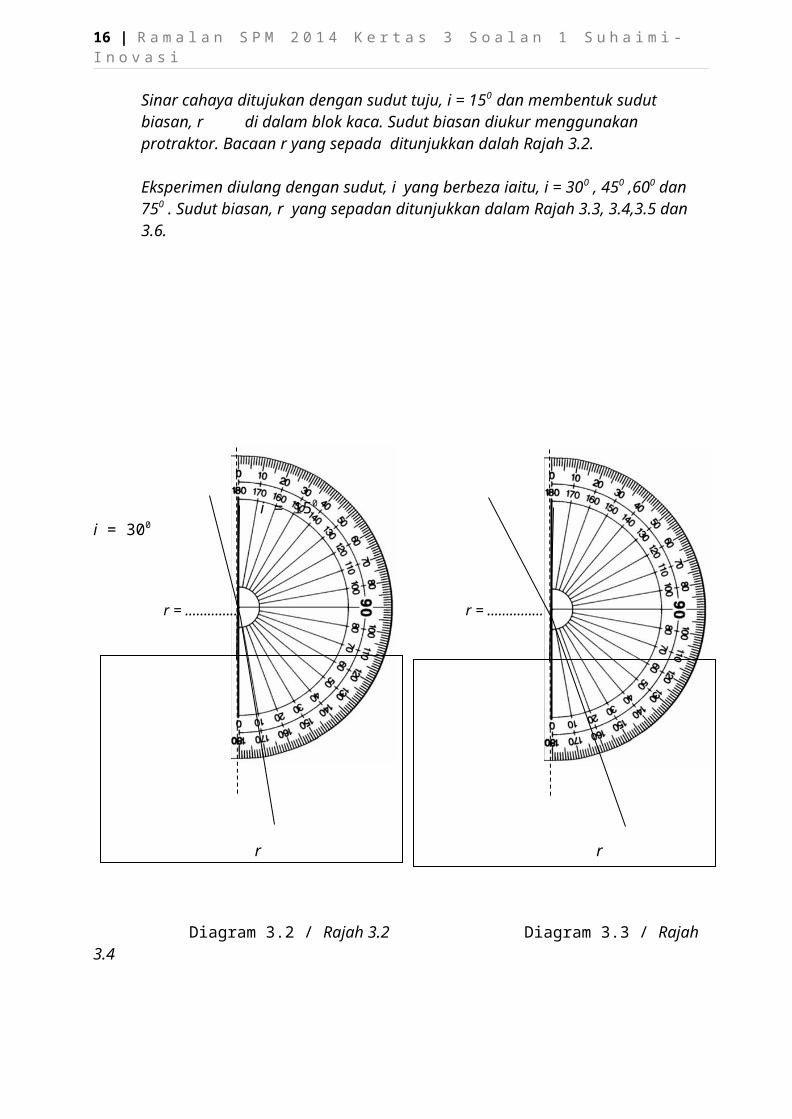
A ray of light is directed along the angle of incidence, i = 150 and forms the angle of refraction, r. The angle of refraction is measured by using a protractor. The corresponding reading of r , is shown in Diagram 3.2
The experiment is repeated by varying the angle of incidence, i, to 30°, 450, 600 and 750. The corresponding angles of refraction, r are also shown in Diagram 3.3, 3.4, 3.5 and 3.6.
Sinar cahaya ditujukan dengan sudut tuju, i = 150 dan membentuk sudut biasan, r di dalam blok kaca. Sudut biasan diukur menggunakan protraktor. Bacaan r yang sepada ditunjukkan dalah Rajah 3.2.
Eksperimen diulang dengan sudut, i yang berbeza iaitu, i = 300 , 450 ,600 dan 750 . Sudut biasan, r yang sepadan ditunjukkan dalam Rajah 3.3, 3.4,3.5 dan 3.6.
14 | R a m a l a n S P M 2 0 1 4 K e r t a s 3 S o a l a n 1 S u h a i m i - I n o v a s i
i = 150 i = 300
r = …………… r = ……………
r r
Diagram 3.2 / Rajah 3.2 Diagram 3.3 / Rajah 3.4
i = 450 i = 600
r = …………… r = ……………
r r
Diagram 3.4 / Rajah 3.4 Diagram 3.5 / Rajah 3.5

15 | R a m a l a n S P M 2 0 1 4 K e r t a s 3 S o a l a n 1 S u h a i m i - I n o v a s i
i = 750
r = ……………
r
Diagram 3.6 / Rajah 3.6
(a) For the experiment described above, identify:Merujuk eksperimen yang ditunjukkan, tentukan:
(i) The manipulated variable pembolehubah manipulasi
.................................................................................................................................
[ 1 mark ](ii) The responding variable
pembolehubah bergerakbalas
.................................................................................................................................
[ 1 mark](iii) The constant variable
pembolehubahan dimalarkan
.................................................................................................................................
[ 1 mark]
16 | R a m a l a n S P M 2 0 1 4 K e r t a s 3 S o a l a n 1 S u h a i m i - I n o v a s i
(b) Based on diagram 3.2, 3.3, 3.4, 3.5 and 3.6, determine the angle of refraction, r, and sine r , when angle of incidence, i is equal to 300, 450, 600 and 750
Tabulate the values of i, sine i, r and sine r in the space below.
Berdasarkan Rajah 3.2, 3.3, 3.4 dan 3.6, tentukan sudut biasan, r dan sin r apabila sudut tuju, i = 300 , 450 ,600 dan 750
Jadualkan nilai i , sin i , r dan sin r dalam ruangan di bawah.
[6 marks]
(c) On the graph paper, plot a graph of sine i against sine r. Di atas kertas graf, lukis graf sin i melawan sin r.
[5 marks]
(d) Based on your graph, state the relationship between sin i and sine r.Berdasarkan graf anda, nyatakan hubungan antara sin i dan sin r.
....................................................................................................................................
[ 1 mark]
(e) State one precaution that should be taken to obtain the accurate result.Nyatakan satu langkah berjaga-jaga yang perlu diambil untuk mendapat keputusan eksperimen yang lebih tepat.
....................................................................................................................................
[ 1 mark ]
17 | R a m a l a n S P M 2 0 1 4 K e r t a s 3 S o a l a n 1 S u h a i m i - I n o v a s i
Trial SBP 2014
No.1
Answer Mark
(a)(i)
Manipulated variable = mass//m 1
(ii)Responding variable = rise of temperature/θ//reading of thermometer/θ1 1
(iii)Constant variable = Energy//power//Initial temperature/θ0//time for heating 1
(b)(i)
27 1
(ii) 1/m =10.00,5.00, 3.33, 2.50 and 2.00 1(iii) θ1 =47, 37,33,32,31 1(iv) θ = 20, 10, 6, 5 , 4 1(v) m/kg 1/m/kg-1 θ1/0C θ/0C 2
-table -1-unit- 1
(c) Draw the graph of θ against 1/m .
A - Label y-axis and x-axis correctlyB - States the unit at the axis correctlyC - Both axes with the even and uniform scale: D - 5 points correctly plotted:E - a smooth best straight lineF - minimum size of the graph is 5 x 4 squares of 2 x 2 cm.Draw the graph of θ against 1/ m .A - Label y-axis and x-axis correctlyB - States the unit at the axis correctlyC - Both axes with the even and uniform scale: D - 5 points correctly plotted:E - a smooth best straight lineF - minimum size of the graph is 5 x 4 squares of 2 x 2 cm.
No of ticks Score6 55 4
3-4 32 21 1
18 | R a m a l a n S P M 2 0 1 4 K e r t a s 3 S o a l a n 1 S u h a i m i - I n o v a s i
5(d) State the correct relationship b as e d on the c a n d id at e ’s g r ap h
θ is increasing linearly to 1/m // θ α 1/m
1
TOTAL 16No 2 Answer(a)(i) Extrapolation
straight line from λ = 0.00065 to the graph x = 4.75 mm (without unit)
111
(b) x increase 1(c)(i) Show a big on the graph to determine the gradient(5 x 4 blocks)
The correct y 2 y1 from the drawnx2 x1
m = 7.27 x 10³
111
(c)(ii) a = D/k= 4 /(7.27 x 103 )= 5.50 x 10⁻⁴ m
111
(d) decrease 1(e) 1. Do experiment in dark room
2. The eye is perpendicular to the scale of rulerMax 1 mark
1
Total 12
19 | R a m a l a n S P M 2 0 1 4 K e r t a s 3 S o a l a n 1 S u h a i m i - I n o v a s i
Trial MRSM 2014
20 | R a m a l a n S P M 2 0 1 4 K e r t a s 3 S o a l a n 1 S u h a i m i - I n o v a s i
Question Answer Marks3 (a) (i) Incident Angle 13 (a) (ii) Refracted angle 13 (a) (iii) Density of glass block 13 (b) Table for i, sine i, r and sine r
i / 0 Sine i r / 0 Sine r15 0.26 10 0.1730 0.50 19 0.3345 0.71 26 0.4460 0.87 30 0.5075 0.97 38 0.62
Give a tick () based on the following:A Columns i, sine i, r and sine r B Correct units for i, sine i, r and sine r C All 5 values of r correct
[Note : 3 or 4 values of V correct : ]
D All 5 values of sine i and sine r correct E All values of θ and Δθ
written as whole numbers orconsistent to at least 2 d.p.
6
3 (c) Graph of sine i against sine rGive a tick () based on the following:
A sine i at the y-axis, sine r at the x-axis B Correct units at both axes
C Uniform scale at both axes D 5 points plotted correctly
[Note : 4 points plotted correctly : ] E Straight line through the origin
F Minimum size of graph 5 x 4 big squares (Big square : 2 cm x 2 cm)(From the origin to the last point)
Marks awarded :Number of Marks
7 55-6 43-4 32 21 1
Subtotal marks : 5
5
3 (d) sine r is directly proportional to sine r 13 (e) The experiment should be done in darkened room 1
Total marks 16
![JANGAN BUKA KERTAS SOALAN INI SEHINGGA … · JANGAN BUKA KERTAS SOALAN INI SEHINGGA DIBERITAHU 1. ... Soalan dalam Bahasa Inggeris mendahului soalan yang sepadan dalam ... [3 marks]](https://img.pdfslide.net/doc/110x75/5abfbd587f8b9a8e3f8eae3a/jangan-buka-kertas-soalan-ini-sehingga-buka-kertas-soalan-ini-sehingga-diberitahu.jpg)