Embed Size (px)
DESCRIPTION
Ketchum Municipal Carbon Assessment Baseline Report 2008
Citation preview
CITY of KETCHUM
Climate Protection Campaign
Carbon Emissions Baseline Inventory
Municipal Analysis
2004, 2007
Compiled by Kyle Livingston
Climate Protection Coordinator
Environmental Resource Center
2
Introduction
In October 2007, the City of Ketchum and the City Council approved a climate protection resolution and general guidelines to address their energy costs and carbon emissions (i.e. greenhouse gas emissions). In addition, the City committed to reduce their emissions by joining the Cities for Climate Protection Campaign (CCP), a program of the International Council for Local Environmental Initiatives (ICLEI). The ICLEI framework is designed to educate and empower local governments worldwide to take action on climate change.
By becoming an official ICLEI member in May 2008, Ketchum joined a network of over 1,000 local governments worldwide, all striving toward reducing energy costs and their carbon emissions with the larger goal of combating climate change. Through effective and practical local action, the City will demonstrate how strategies to reduce carbon emissions can help the communities within the Wood River Valley thrive economically while achieving increased livability, sustainability and resiliency.
As part of a regional climate protection effort, the cities of Hailey and Sun Valley as well as Blaine County have also become ICLEI members. Each local government has profiled their historic energy costs and carbon emissions in order to identify cost effective ways to reduce those emissions. The following assessment specific to Ketchum’s government operations has yielded detailed information about the City’s carbon emissions and energy consumption. The City, in the form of an Internal Sustainability Team (proposed to be the ‘Ketchum Green Team’) is now employing tools to explore how various policy and administrative decisions affect energy costs and carbon emissions.
ICLEI Cities for Climate Protection (CCP) Campaign ICLEI uses the performance-oriented framework and methodology of the CCP Campaign's Five Milestones to assist local governments in developing and implementing harmonized local approaches for reducing global warming and air pollution emissions. The milestone process consists of: � Milestone 1: Conduct a baseline emissions inventory and forecast COMPLETE
� Based on energy and waste data, the City has calculated greenhouse gas emissions for a base year (2004) and for the most current year (2007). The inventory captures emissions from all municipal operations and provides a benchmark against which the City can measure progress.
� Milestone 2: Adopt an emissions reduction target � The City adopts an emissions reduction target for a forecast year (e.g. 2015) and possibly a
cumulative emissions reduction target allowing for an annual reassessment of progress. The City Council passes a resolution establishing the emission reduction target or targets for the City’s municipal operations. The target is essential both to foster political will and to create a framework to guide the planning and implementation of measures.
� Milestone 3: Develop a Climate Action Plan for reducing emissions � The City develops a Local Action Plan that describes or lists the policies and measures, both short and
long term, which the City’s government will undertake in order to reduce carbon emissions and achieve its emissions reduction target. Most plans include a timeline, a description of financing mechanisms, and an assignment of responsibility to departments and staff. In addition to directing carbon reduction measures, most plans also incorporate public awareness and education efforts. The development of the Local Action Plan should include strong public input and involvement in order to build the consensus among stakeholders required to implement measures.
� Milestone 4: Implement policies and measures � The City implements the policies and measures contained in their Local Action Plan. Typical policies
and measures implemented by CCP participants include energy efficiency improvements to municipal buildings and water treatment facilities, streetlight retrofits, public transit improvements, installation of renewable power applications, and methane recovery from waste management.
� Milestone 5: Monitor and verify results � Monitoring and verifying progress on the implementation of measures to reduce or avoid carbon
emissions is an ongoing process. Monitoring begins once measures are implemented and continues for the life of the measures, providing important feedback that can be use to improve the measures over time. ICLEI's software provides a uniform methodology for local governments to report on measures.
3
3263 tons eCO2
3813 tons eCO2
7,000,000
7,200,000
7,400,000
7,600,000
7,800,000
8,000,000
8,200,000
8,400,000
8,600,000
2004 2007
Total Energy Used and eCO2 Emitted
Energy (kWh)
KETCHUM’S MUNICIPAL CARBON EMISSIONS BASELINE INVENTORY
Municipal Sectors Analyzed The following sectors of City’s municipal operations were analyzed for the calendar years of 2004 and 2007 using ICLEI’s Clean Air and Climate Protection (CACP) Software: � Facility energy usage
� electricity (kWh) and natural gas (therms) data for the City’s facilities gathered from Idaho Power and Intermountain Gas records
� Vehicle Fleet fuel consumption � gallons of gasoline and diesel fuel consumed by the City’s vehicle fleet gathered from United Oil,
Brico and Shell records � Employee Commuter Miles (annual Vehicle Miles Traveled)
� VMT data extrapolated from Employee Commute questionnaires circulated to City employees � Streetlight energy usage
� traffic and street lights’ electricity data gathered from Idaho Power records � Water and Sewage infrastructure energy use
� electricity (kWh) and natural gas (therms) data for the City’s Water and Sewage infrastructure gathered from Idaho Power and Intermountain Gas records
� Waste volume from City facilities � waste tonnage based on the size of Clear Creek waste bins at the City’s facilities and frequency of
pick-up
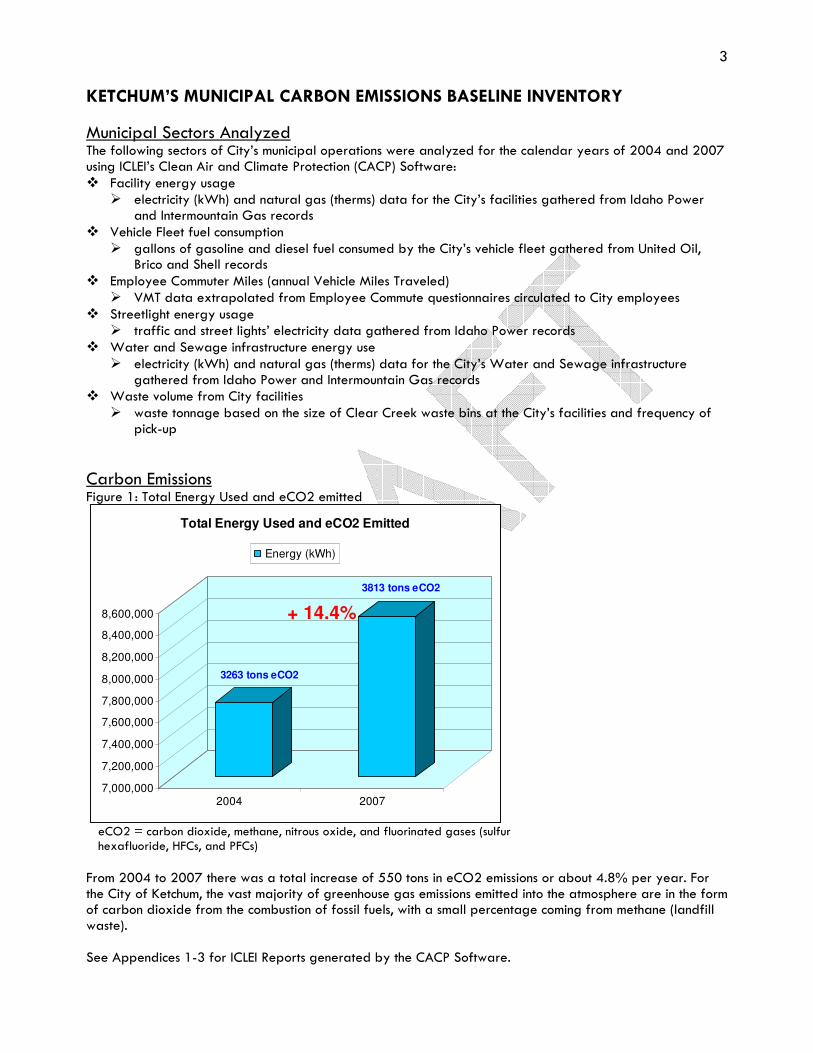
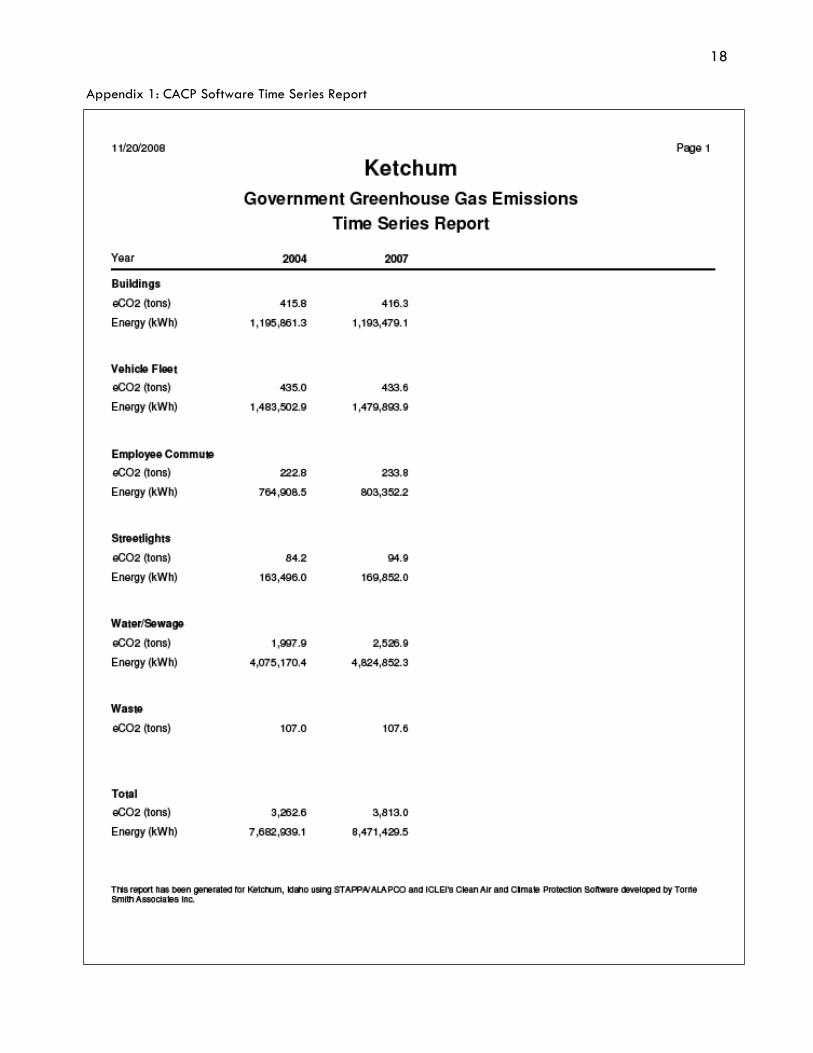
Carbon Emissions Figure 1: Total Energy Used and eCO2 emitted From 2004 to 2007 there was a total increase of 550 tons in eCO2 emissions or about 4.8% per year. For the City of Ketchum, the vast majority of greenhouse gas emissions emitted into the atmosphere are in the form of carbon dioxide from the combustion of fossil fuels, with a small percentage coming from methane (landfill waste). See Appendices 1-3 for ICLEI Reports generated by the CACP Software.
+ 14.4%
eCO2 = carbon dioxide, methane, nitrous oxide, and fluorinated gases (sulfur hexafluoride, HFCs, and PFCs)
4
2007 Carbon Emissions by Sector
11%
11%
6% 2%
67%3%
Buildings
Vehicle Fleet
Employee Commute
Streetlights
Water/Sewage
Waste
2007 City Infrastructure Electricity Usage
1% 5%
1%
1%
1%
48%
40%
3%
Street Buildings
City Hall
Atkinson's Park
General outlets
W/S Buildings
Sewer Plant
W/S Infrastructure
Streetlights
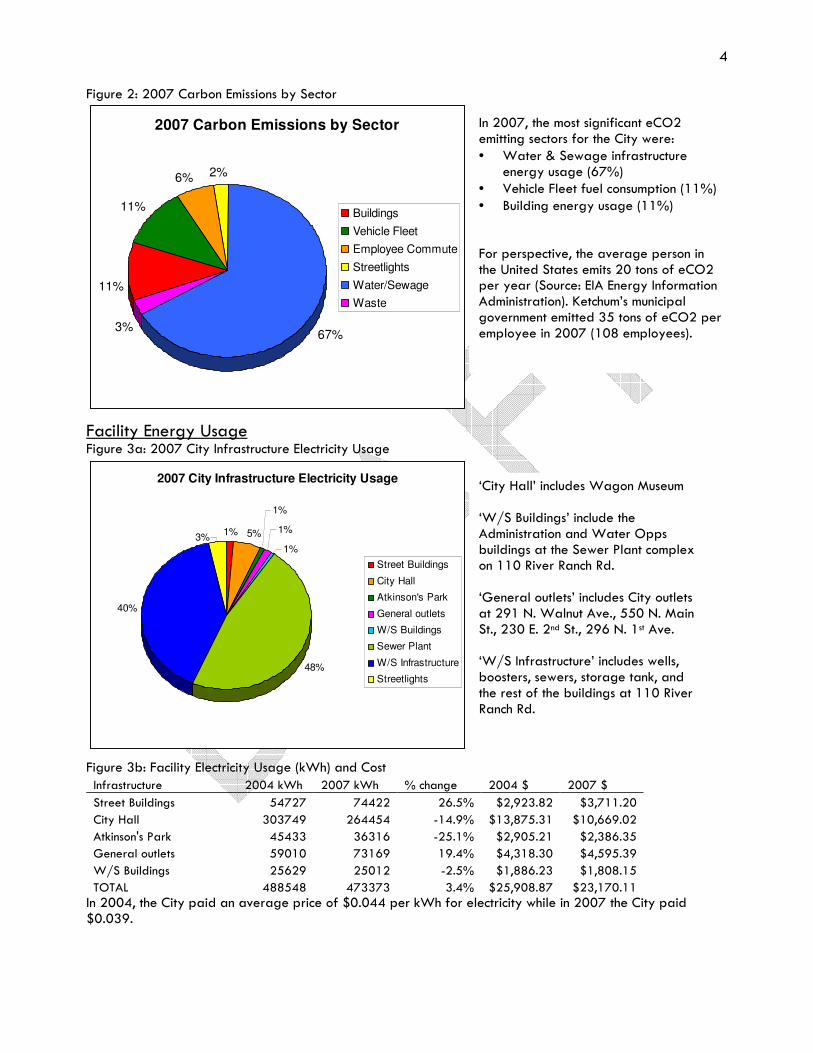
Figure 2: 2007 Carbon Emissions by Sector
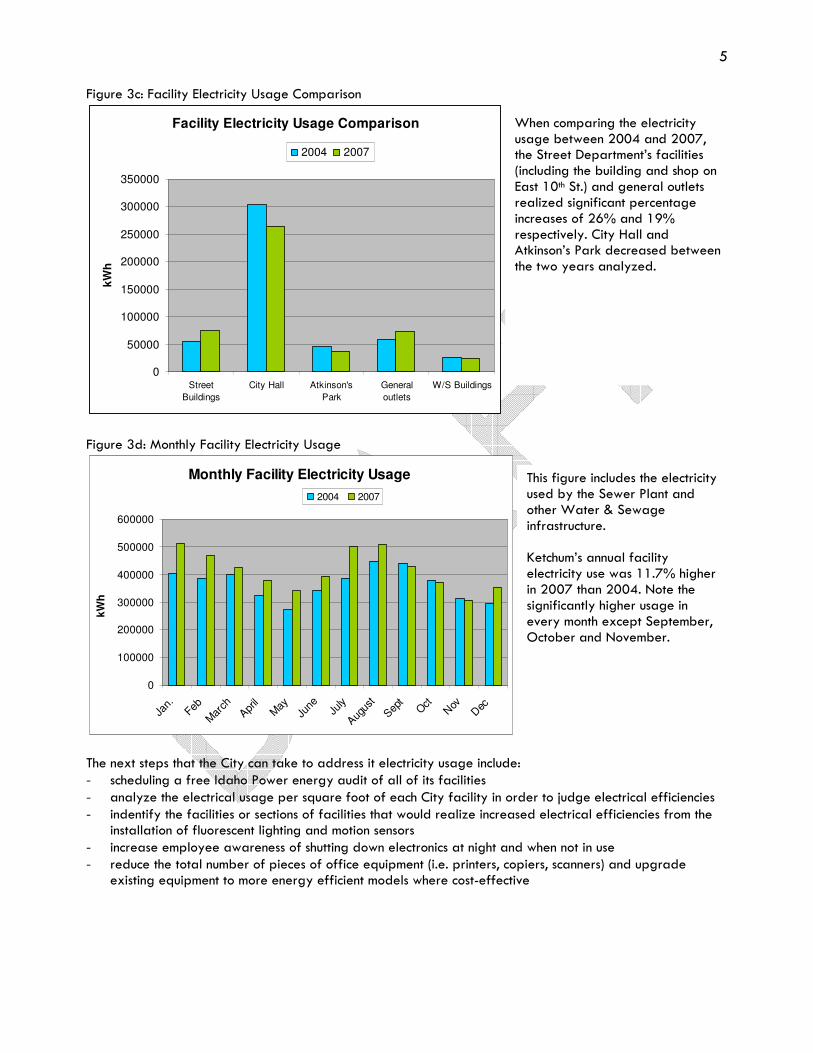
Facility Energy Usage Figure 3a: 2007 City Infrastructure Electricity Usage Figure 3b: Facility Electricity Usage (kWh) and Cost Infrastructure 2004 kWh 2007 kWh % change 2004 $ 2007 $
Street Buildings 54727 74422 26.5% $2,923.82 $3,711.20
City Hall 303749 264454 -14.9% $13,875.31 $10,669.02
Atkinson's Park 45433 36316 -25.1% $2,905.21 $2,386.35
General outlets 59010 73169 19.4% $4,318.30 $4,595.39
W/S Buildings 25629 25012 -2.5% $1,886.23 $1,808.15
TOTAL 488548 473373 3.4% $25,908.87 $23,170.11 In 2004, the City paid an average price of $0.044 per kWh for electricity while in 2007 the City paid $0.039.
In 2007, the most significant eCO2 emitting sectors for the City were: • Water & Sewage infrastructure
energy usage (67%) • Vehicle Fleet fuel consumption (11%) • Building energy usage (11%) For perspective, the average person in the United States emits 20 tons of eCO2 per year (Source: EIA Energy Information Administration). Ketchum’s municipal government emitted 35 tons of eCO2 per employee in 2007 (108 employees).
‘City Hall’ includes Wagon Museum ‘W/S Buildings’ include the Administration and Water Opps buildings at the Sewer Plant complex on 110 River Ranch Rd. ‘General outlets’ includes City outlets at 291 N. Walnut Ave., 550 N. Main St., 230 E. 2nd St., 296 N. 1st Ave. ‘W/S Infrastructure’ includes wells, boosters, sewers, storage tank, and the rest of the buildings at 110 River Ranch Rd.
5
Monthly Facility Electricity Usage
0
100000
200000
300000
400000
500000
600000
Jan.
Feb
Mar
chApr
ilM
ayJu
neJu
ly
Augus
t
Sept
Oct
Nov
Dec
kW
h
2004 2007
Facility Electricity Usage Comparison
0
50000
100000
150000
200000
250000
300000
350000
Street
Buildings
City Hall Atkinson's
Park
General
outlets
W/S Buildings
kW
h
2004 2007
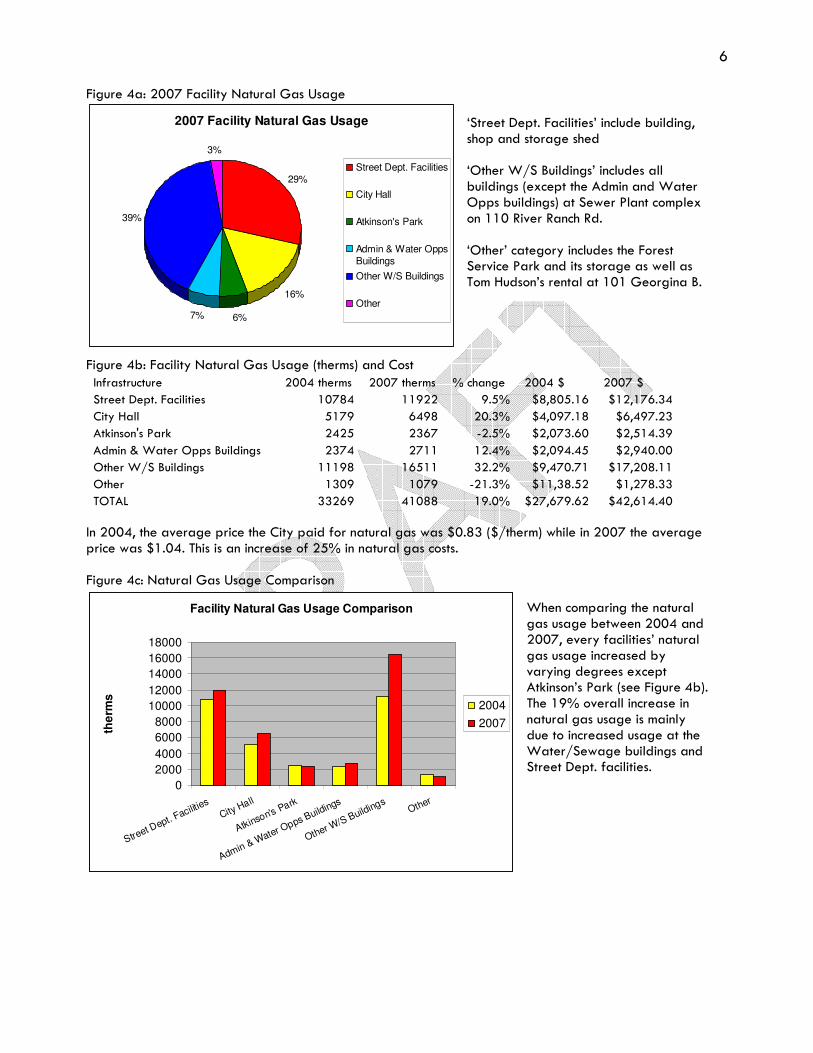
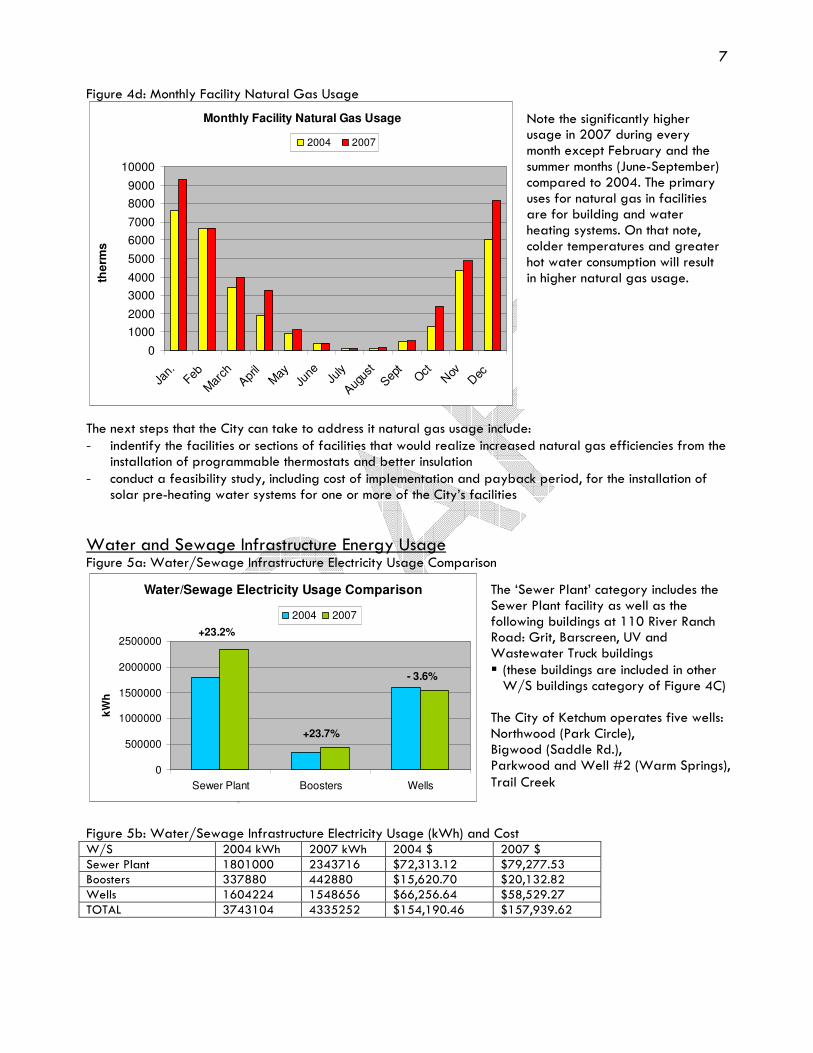
Figure 3c: Facility Electricity Usage Comparison Figure 3d: Monthly Facility Electricity Usage The next steps that the City can take to address it electricity usage include: - scheduling a free Idaho Power energy audit of all of its facilities - analyze the electrical usage per square foot of each City facility in order to judge electrical efficiencies - indentify the facilities or sections of facilities that would realize increased electrical efficiencies from the
installation of fluorescent lighting and motion sensors - increase employee awareness of shutting down electronics at night and when not in use - reduce the total number of pieces of office equipment (i.e. printers, copiers, scanners) and upgrade
existing equipment to more energy efficient models where cost-effective
When comparing the electricity usage between 2004 and 2007, the Street Department’s facilities (including the building and shop on East 10th St.) and general outlets realized significant percentage increases of 26% and 19% respectively. City Hall and Atkinson’s Park decreased between the two years analyzed.
This figure includes the electricity used by the Sewer Plant and other Water & Sewage infrastructure. Ketchum’s annual facility electricity use was 11.7% higher in 2007 than 2004. Note the significantly higher usage in every month except September, October and November.
6
2007 Facility Natural Gas Usage
29%
16%
6%7%
39%
3%
Street Dept. Facilities
City Hall
Atkinson's Park
Admin & Water OppsBuildings
Other W/S Buildings
Other
Facility Natural Gas Usage Comparison
0
2000
4000
6000
8000
10000
12000
14000
16000
18000
Street Dept. F
acilities
City Hall
Atkinson's Park
Admin & Water O
pps Buildings
Other W/S Buildings
Other
the
rms
2004
2007
Figure 4a: 2007 Facility Natural Gas Usage Figure 4b: Facility Natural Gas Usage (therms) and Cost Infrastructure 2004 therms 2007 therms % change 2004 $ 2007 $
Street Dept. Facilities 10784 11922 9.5% $8,805.16 $12,176.34
City Hall 5179 6498 20.3% $4,097.18 $6,497.23
Atkinson's Park 2425 2367 -2.5% $2,073.60 $2,514.39
Admin & Water Opps Buildings 2374 2711 12.4% $2,094.45 $2,940.00
Other W/S Buildings 11198 16511 32.2% $9,470.71 $17,208.11
Other 1309 1079 -21.3% $11,38.52 $1,278.33
TOTAL 33269 41088 19.0% $27,679.62 $42,614.40 In 2004, the average price the City paid for natural gas was $0.83 ($/therm) while in 2007 the average price was $1.04. This is an increase of 25% in natural gas costs. Figure 4c: Natural Gas Usage Comparison
When comparing the natural gas usage between 2004 and 2007, every facilities’ natural gas usage increased by varying degrees except Atkinson’s Park (see Figure 4b). The 19% overall increase in natural gas usage is mainly due to increased usage at the Water/Sewage buildings and Street Dept. facilities.
‘Street Dept. Facilities’ include building, shop and storage shed ‘Other W/S Buildings’ includes all buildings (except the Admin and Water Opps buildings) at Sewer Plant complex on 110 River Ranch Rd. ‘Other’ category includes the Forest Service Park and its storage as well as Tom Hudson’s rental at 101 Georgina B.
7
Monthly Facility Natural Gas Usage
0
1000
2000
3000
4000
5000
6000
7000
8000
9000
10000
Jan.
Feb
Mar
chApr
ilM
ayJu
neJu
ly
Augus
t
Sep
tOct
Nov
Dec
the
rms
2004 2007
Figure 4d: Monthly Facility Natural Gas Usage The next steps that the City can take to address it natural gas usage include: - indentify the facilities or sections of facilities that would realize increased natural gas efficiencies from the
installation of programmable thermostats and better insulation - conduct a feasibility study, including cost of implementation and payback period, for the installation of
solar pre-heating water systems for one or more of the City’s facilities
Water and Sewage Infrastructure Energy Usage Figure 5a: Water/Sewage Infrastructure Electricity Usage Comparison
Figure 5b: Water/Sewage Infrastructure Electricity Usage (kWh) and Cost W/S 2004 kWh 2007 kWh 2004 $ 2007 $ Sewer Plant 1801000 2343716 $72,313.12 $79,277.53 Boosters 337880 442880 $15,620.70 $20,132.82 Wells 1604224 1548656 $66,256.64 $58,529.27 TOTAL 3743104 4335252 $154,190.46 $157,939.62
Note the significantly higher usage in 2007 during every month except February and the summer months (June-September) compared to 2004. The primary uses for natural gas in facilities are for building and water heating systems. On that note, colder temperatures and greater hot water consumption will result in higher natural gas usage.
The ‘Sewer Plant’ category includes the Sewer Plant facility as well as the following buildings at 110 River Ranch Road: Grit, Barscreen, UV and Wastewater Truck buildings � (these buildings are included in other W/S buildings category of Figure 4C)
The City of Ketchum operates five wells: Northwood (Park Circle), Bigwood (Saddle Rd.), Parkwood and Well #2 (Warm Springs), Trail Creek
Water/Sewage Electricity Usage Comparison
- 3.6%
+23.7%
+23.2%
0
500000
1000000
1500000
2000000
2500000
Sewer Plant Boosters Wells
kW
h
2004 2007
8
Traffic and Street Light Electricity Usage
+3.7%
140000
145000
150000
155000
160000
165000
170000
175000
Streetlights
kW
h
2004 2007
In 2007, The City of Ketchum paid nearly $180,000 on electricity and natural gas for its water/sewage infrastructure. This is over three-quarters of the total money spent ($236,598) on electricity and natural gas for all of the City’s municipal operations. The increase in energy usage, both electricity and natural gas, from the water and sewage infrastructure accounted for 529 tons of the total 550 ton increase in eCO2 emissions for the entire City between 2004 and 2007. The Sewer Plant alone accounted for {…} tons of that increase. In a sense, the Sewer Plant and the other water/sewage infrastructure, particularly the wells, are the ‘gorilla in the closet’ as far as Ketchum’s energy usage and carbon emissions are concerned. The next steps the City can take to address the energy usage of its water/sewage infrastructure:
� identify the facilities at 110 River Ranch Road that would realize increased electrical and natural gas efficiencies due to the installation of fluorescent lighting, motion sensors, programmable thermostats and better insulation
� conduct a detailed assessment of the Sewer Plant’s wastewater treatment equipment including a cost and payback period analysis of installing more energy efficient drives (i.e. variable frequency drives) that vary their energy usage with the load of wastewater to be treated
� implement a water conservation campaign directed at City residents, including a pay-as-you-use payment program. Although the amount of water used by City residents does not have an exact correlation to the amount of energy required to treat water at the Sewer Plant, it is true that the less water that is treated the less energy is required. This campaign becomes even more important considering the projected growth of Ketchum.
� Evaluate alternative energy options for offsetting some or all of the electricity used by the Sewer Plant complex including wind turbines, solar panels, and/or an aerobic bio-digester for solid waste - Include the cost for a feasibility study of alternative energy options for the Sewer Plant complex in
the 2010 City budget - Conduct an annual review of new technologies which will allow the City to decide when it is most cost
feasible to pursue alternative energy options (i.e. solar panel and wind turbine power generating efficiencies should increase with new technologies in the near future)
- Boulder, CO partnered with a private company to construct a solar panel array that supplies its Wastewater Treatment Plant with over 1.4 million kWh of electricity per year. A similar array for Ketchum’s Sewer Plant would supply 60% of its annual electricity needs.
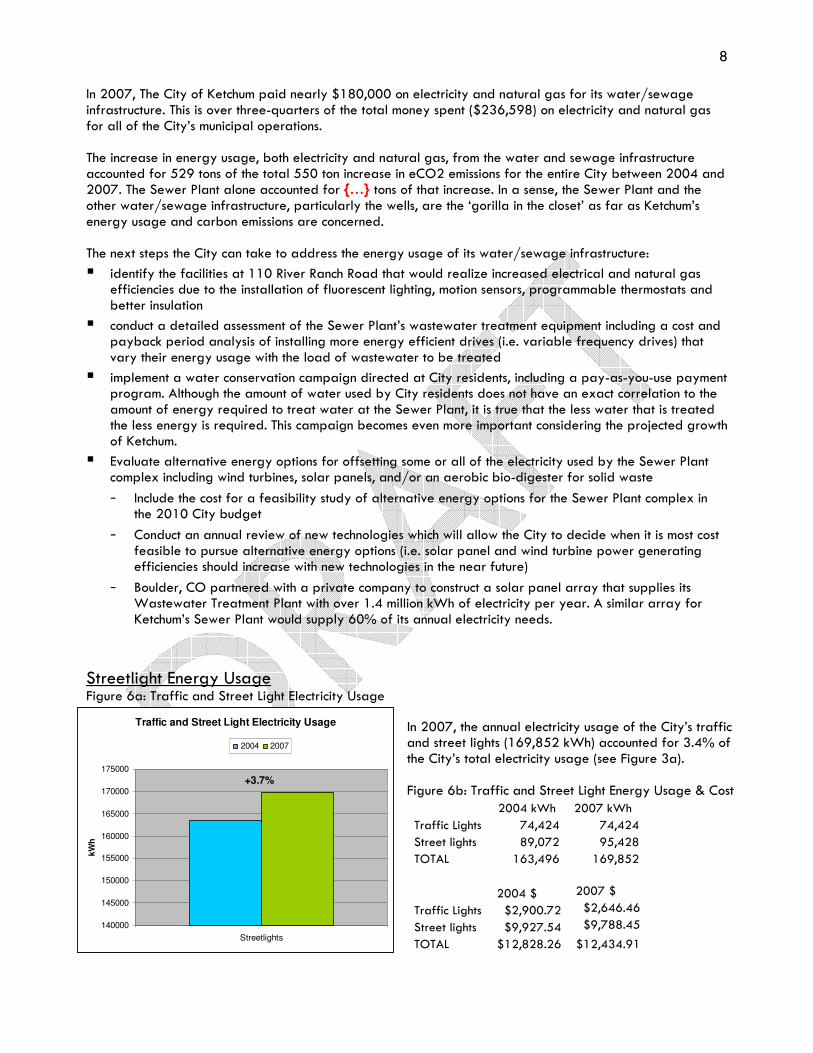
Streetlight Energy Usage Figure 6a: Traffic and Street Light Electricity Usage
In 2007, the annual electricity usage of the City’s traffic and street lights (169,852 kWh) accounted for 3.4% of the City’s total electricity usage (see Figure 3a). Figure 6b: Traffic and Street Light Energy Usage & Cost 2004 kWh 2007 kWh
Traffic Lights 74,424 74,424
Street lights 89,072 95,428
TOTAL 163,496 169,852
2004 $ 2007 $
Traffic Lights $2,900.72 $2,646.46
Street lights $9,927.54 $9,788.45
TOTAL $12,828.26 $12,434.91
9
Vehicle Fleet Fuel Cost
40,928.8 gal 40,820.6 gal
17.3%
50.2%
$0.00
$20,000.00
$40,000.00
$60,000.00
$80,000.00
$100,000.00
$120,000.00
$140,000.00
$160,000.00
2004 2007
Cost $ Cost $3.50/gal
The next steps that the City can take to address its traffic and street lights’ electricity usage: - Identify the incandescent streetlights that have not been upgraded to more energy efficient fluorescents - Conduct a cost of implementation and payback period analysis for changing the City’s traffic signals from
incandescent to LED. o LED Traffic signals consume 85% less energy than incandescent signals and on average have a
payback period of less than seven years for a single signal. o There are significant maintenance and replacement lightbulb costs associated with incandescent
signals whereas LED signals require nearly zero maintenance over their extended lifespan.
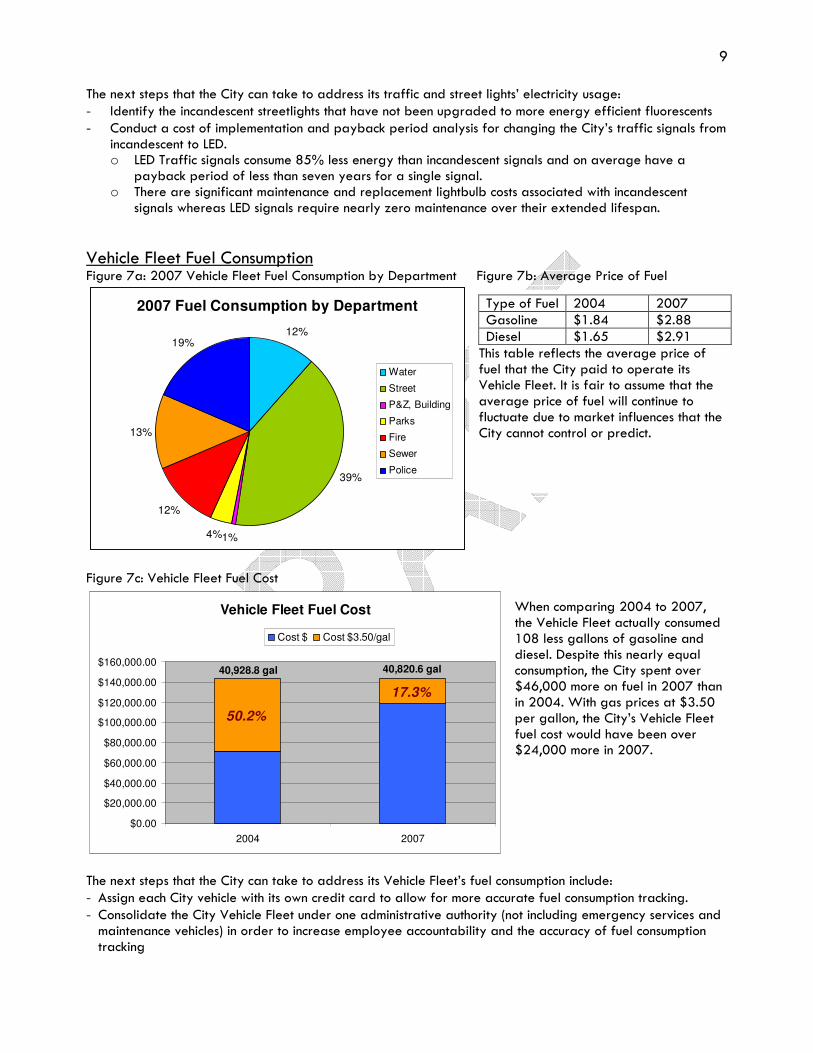
Vehicle Fleet Fuel Consumption Figure 7a: 2007 Vehicle Fleet Fuel Consumption by Department Figure 7b: Average Price of Fuel
2007 Fuel Consumption by Department
12%
39%
1%4%
12%
13%
19%
Water
Street
P&Z, Building
Parks
Fire
Sewer
Police
Figure 7c: Vehicle Fleet Fuel Cost The next steps that the City can take to address its Vehicle Fleet’s fuel consumption include: - Assign each City vehicle with its own credit card to allow for more accurate fuel consumption tracking. - Consolidate the City Vehicle Fleet under one administrative authority (not including emergency services and maintenance vehicles) in order to increase employee accountability and the accuracy of fuel consumption tracking
Type of Fuel 2004 2007 Gasoline $1.84 $2.88 Diesel $1.65 $2.91 This table reflects the average price of fuel that the City paid to operate its Vehicle Fleet. It is fair to assume that the average price of fuel will continue to fluctuate due to market influences that the City cannot control or predict.
When comparing 2004 to 2007, the Vehicle Fleet actually consumed 108 less gallons of gasoline and diesel. Despite this nearly equal consumption, the City spent over $46,000 more on fuel in 2007 than in 2004. With gas prices at $3.50 per gallon, the City’s Vehicle Fleet fuel cost would have been over $24,000 more in 2007.
10
Ketchum Employee Commute
22%
10.8%
0
50000
100000
150000
200000
250000
300000
350000
400000
450000
500000
2004 2007
Ve
hic
le M
ile
s T
rav
ele
d (
VM
T)
Miles driven Alt. Transport
Fuel Cost per Week ($3.50/gallon gas)
$0.00
$10.00
$20.00
$30.00
$40.00
$50.00
5 10 20 50 100 200
commuter miles per week
$ s
pe
nt
on
fu
el e
ac
h w
ee
k
auto full (20 mpg)
auto compact (27 mpg)
auto mid (22 mpg)
Light truck/SUV (14 mpg)
- Encouraging employees to use video-conferencing and webinars in lieu of traveling - Responsible vehicle purchasing in the future including considerations of Hybrid, fuel-efficient and alternative fuel vehicles o Miles Electric Car for the Parks Department (60-mile range per charge) http://www.milesev.com
� The City of Hailey is also considering a Miles Electric Truck for their Parks Departments. Discounts of up to $1,500 per vehicle are available for bulk purchases.
o Alternative fuels � Use of Biodiesel by all City diesel vehicles when convenient. B-5 Biodiesel offered at the Hailey
Chevron only. The City could encourage north-valley gas stations to offer biodiesel. � Vegetable-oil conversion opportunities (any diesel vehicle) including partnering with local
businesses to form a vegetable oil fuel co-op
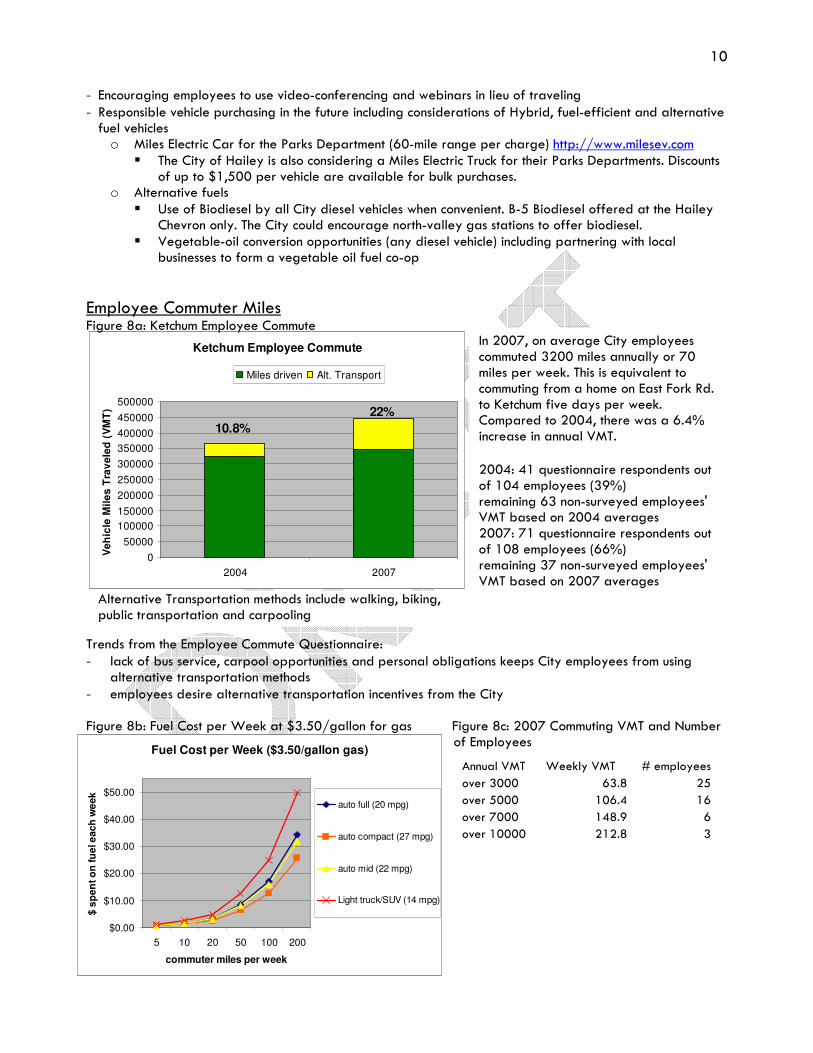
Employee Commuter Miles Figure 8a: Ketchum Employee Commute Trends from the Employee Commute Questionnaire: - lack of bus service, carpool opportunities and personal obligations keeps City employees from using
alternative transportation methods - employees desire alternative transportation incentives from the City Figure 8b: Fuel Cost per Week at $3.50/gallon for gas Figure 8c: 2007 Commuting VMT and Number of Employees
In 2007, on average City employees commuted 3200 miles annually or 70 miles per week. This is equivalent to commuting from a home on East Fork Rd. to Ketchum five days per week. Compared to 2004, there was a 6.4% increase in annual VMT. 2004: 41 questionnaire respondents out of 104 employees (39%) remaining 63 non-surveyed employees' VMT based on 2004 averages 2007: 71 questionnaire respondents out of 108 employees (66%) remaining 37 non-surveyed employees' VMT based on 2007 averages
Annual VMT Weekly VMT # employees
over 3000 63.8 25
over 5000 106.4 16
over 7000 148.9 6
over 10000 212.8 3
Alternative Transportation methods include walking, biking, public transportation and carpooling
11
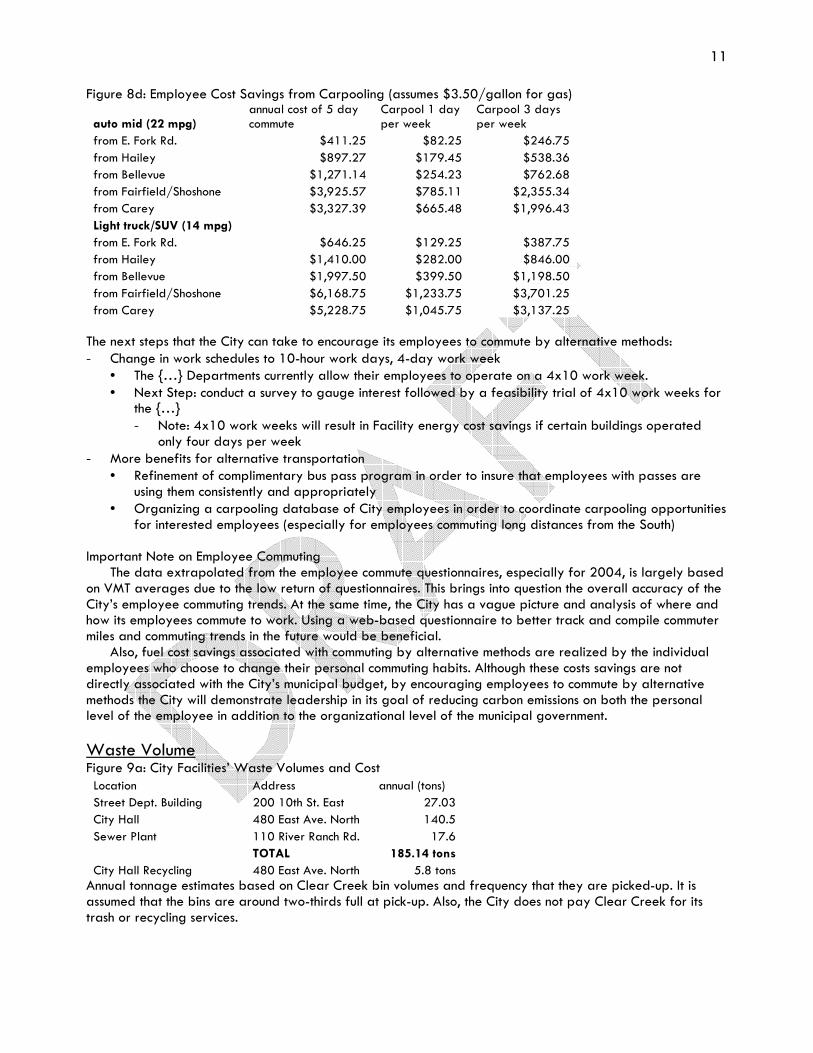
Figure 8d: Employee Cost Savings from Carpooling (assumes $3.50/gallon for gas)
auto mid (22 mpg) annual cost of 5 day commute
Carpool 1 day per week
Carpool 3 days per week
from E. Fork Rd. $411.25 $82.25 $246.75
from Hailey $897.27 $179.45 $538.36
from Bellevue $1,271.14 $254.23 $762.68
from Fairfield/Shoshone $3,925.57 $785.11 $2,355.34
from Carey $3,327.39 $665.48 $1,996.43
Light truck/SUV (14 mpg)
from E. Fork Rd. $646.25 $129.25 $387.75
from Hailey $1,410.00 $282.00 $846.00
from Bellevue $1,997.50 $399.50 $1,198.50
from Fairfield/Shoshone $6,168.75 $1,233.75 $3,701.25
from Carey $5,228.75 $1,045.75 $3,137.25 The next steps that the City can take to encourage its employees to commute by alternative methods: - Change in work schedules to 10-hour work days, 4-day work week
• The {…} Departments currently allow their employees to operate on a 4x10 work week. • Next Step: conduct a survey to gauge interest followed by a feasibility trial of 4x10 work weeks for
the {…} - Note: 4x10 work weeks will result in Facility energy cost savings if certain buildings operated
only four days per week - More benefits for alternative transportation
• Refinement of complimentary bus pass program in order to insure that employees with passes are using them consistently and appropriately
• Organizing a carpooling database of City employees in order to coordinate carpooling opportunities for interested employees (especially for employees commuting long distances from the South)
Important Note on Employee Commuting The data extrapolated from the employee commute questionnaires, especially for 2004, is largely based on VMT averages due to the low return of questionnaires. This brings into question the overall accuracy of the City’s employee commuting trends. At the same time, the City has a vague picture and analysis of where and how its employees commute to work. Using a web-based questionnaire to better track and compile commuter miles and commuting trends in the future would be beneficial. Also, fuel cost savings associated with commuting by alternative methods are realized by the individual employees who choose to change their personal commuting habits. Although these costs savings are not directly associated with the City’s municipal budget, by encouraging employees to commute by alternative methods the City will demonstrate leadership in its goal of reducing carbon emissions on both the personal level of the employee in addition to the organizational level of the municipal government.
Waste Volume Figure 9a: City Facilities’ Waste Volumes and Cost Location Address annual (tons)
Street Dept. Building 200 10th St. East 27.03
City Hall 480 East Ave. North 140.5
Sewer Plant 110 River Ranch Rd. 17.6
TOTAL 185.14 tons
City Hall Recycling 480 East Ave. North 5.8 tons Annual tonnage estimates based on Clear Creek bin volumes and frequency that they are picked-up. It is assumed that the bins are around two-thirds full at pick-up. Also, the City does not pay Clear Creek for its trash or recycling services.

12
Figure 9b: City Waste Composition Breakdown by Type Waste Type Waste Share Paper Products 38% Food Waste 13% Plant Debris 10% Wood/Textiles 4% All Other Waste 35%
Waste share percentages based on ICLEI general waste breakdown The next steps that the City can take to address its waste volumes: - Refining and expanding the recycling program at City facilities. The City currently operates recycling bins
at the City Hall facility only. Materials currently recycled include cardboard (at 4th St. recycling center), aluminum, glass and plastic. The Ohio Gulch Recovery Center recycles white office paper, mixed paper, newspapers and magazines among a variety of other materials.
- By creating a central recycling station at each City facility (especially the Street Dept. and Sewer Plant): � City employees can more easily recycle all appropriate materials � transportation of those materials to the proper waste receptacles and Ohio Gulch can be better
coordinated and routed � the overall waste tonnage generated by City employees and City facilities will be reduced
- Reevaluate the City’s contract with Clear Creek Disposal when it comes up for renewal with an emphasis on expanded recycling of additional materials (i.e. Plastic #1-#7) and community-wide organic waste composting
Important Note on Waste Volumes
The City’s waste volumes are a small part of Ketchum’s overall carbon emissions (3%) and are primarily due to methane emissions of the waste when it is put into the landfill. There does not seem to be a more accurate method to measure waste volumes or better track waste share percentages on a municipal level the size of Ketchum’s City government. The first step the City should take is to expand its recycling program to include all the materials that are currently recycled at Ohio Gulch. There are additional benefits to recycling besides offsetting methane emissions in the landfill including natural resource savings as well as energy and carbon emission savings from source reduction and reuse. By showing leadership in expanding its recycling program on a municipal level the City will demonstrate its commitment to smart practice and the overall success of its climate protection campaign. Like Employee Commuting, the real habitual change has to occur on the personal level of the employee although the incentive can come from the organizational level of the municipal government.
13
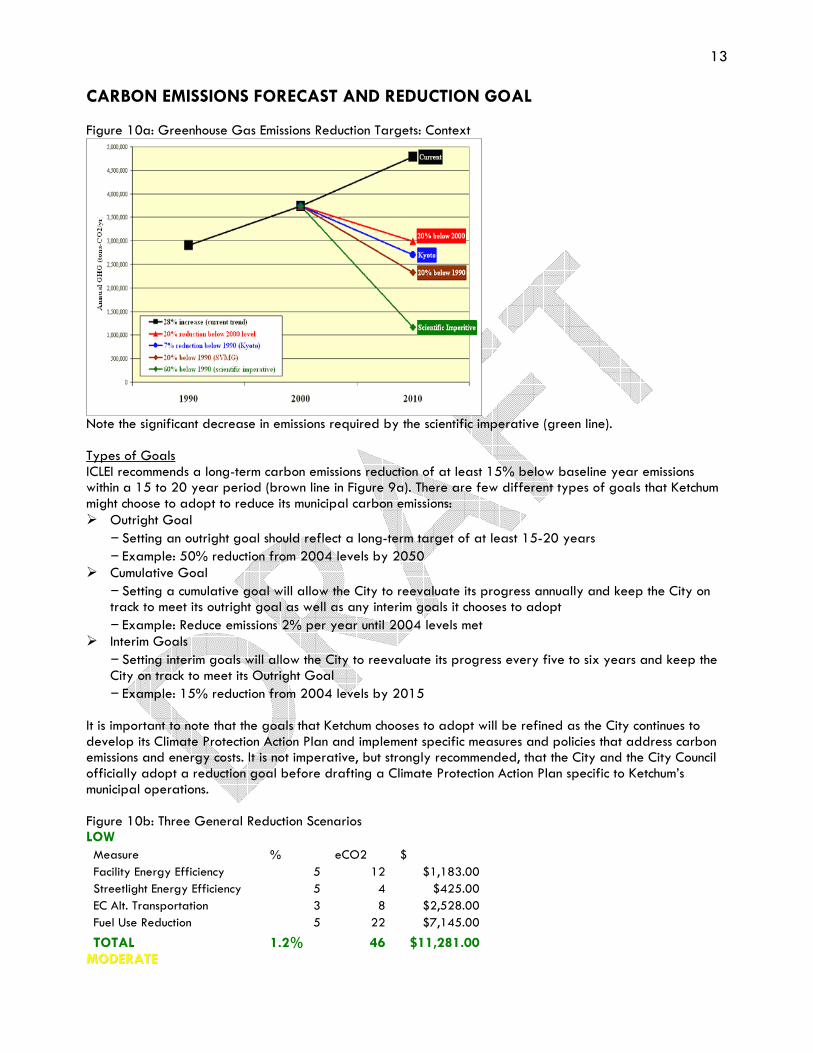
CARBON EMISSIONS FORECAST AND REDUCTION GOAL Figure 10a: Greenhouse Gas Emissions Reduction Targets: Context
Note the significant decrease in emissions required by the scientific imperative (green line). Types of Goals ICLEI recommends a long-term carbon emissions reduction of at least 15% below baseline year emissions within a 15 to 20 year period (brown line in Figure 9a). There are few different types of goals that Ketchum might choose to adopt to reduce its municipal carbon emissions: � Outright Goal
– Setting an outright goal should reflect a long-term target of at least 15-20 years – Example: 50% reduction from 2004 levels by 2050
� Cumulative Goal
– Setting a cumulative goal will allow the City to reevaluate its progress annually and keep the City on track to meet its outright goal as well as any interim goals it chooses to adopt
– Example: Reduce emissions 2% per year until 2004 levels met � Interim Goals
– Setting interim goals will allow the City to reevaluate its progress every five to six years and keep the City on track to meet its Outright Goal
– Example: 15% reduction from 2004 levels by 2015 It is important to note that the goals that Ketchum chooses to adopt will be refined as the City continues to develop its Climate Protection Action Plan and implement specific measures and policies that address carbon emissions and energy costs. It is not imperative, but strongly recommended, that the City and the City Council officially adopt a reduction goal before drafting a Climate Protection Action Plan specific to Ketchum’s municipal operations. Figure 10b: Three General Reduction Scenarios LOW Measure % eCO2 $
Facility Energy Efficiency 5 12 $1,183.00
Streetlight Energy Efficiency 5 4 $425.00
EC Alt. Transportation 3 8 $2,528.00
Fuel Use Reduction 5 22 $7,145.00
TOTAL 1.2% 46 $11,281.00 MMOODDEERRAATTEE
14
Carbon Emissions w/Reduction Scenarios
+ 5.6%
- 1.2%
- 2.6%
- 3.9%
3,200.00
3,300.00
3,400.00
3,500.00
3,600.00
3,700.00
3,800.00
3,900.00
4,000.00
4,100.00
2004 2007 2009
eC
O2 (
ton
s)
Business as Usual LOW MODERATE HIGH
Measure % eCO2 $
Facility Energy Efficiency 10 24 $2,367.00
Streetlight Energy Efficiency 10 9 $849.00
EC Alt. Transportation 8 21 $6,805.00
Fuel Use Reduction 10 44 $14,289.00
TTOOTTAALL 22..66%% 9988 $$2244,,331100..0000 AGGRESSIVE Measure % eCO2 $
Facility Energy Efficiency 15 36 $3,550.00
Streetlight Energy Efficiency 15 13 $1,274.00
EC Alt. Transportation 13 35 $11,278.00
Fuel Use Reduction 15 66 $21,432.00
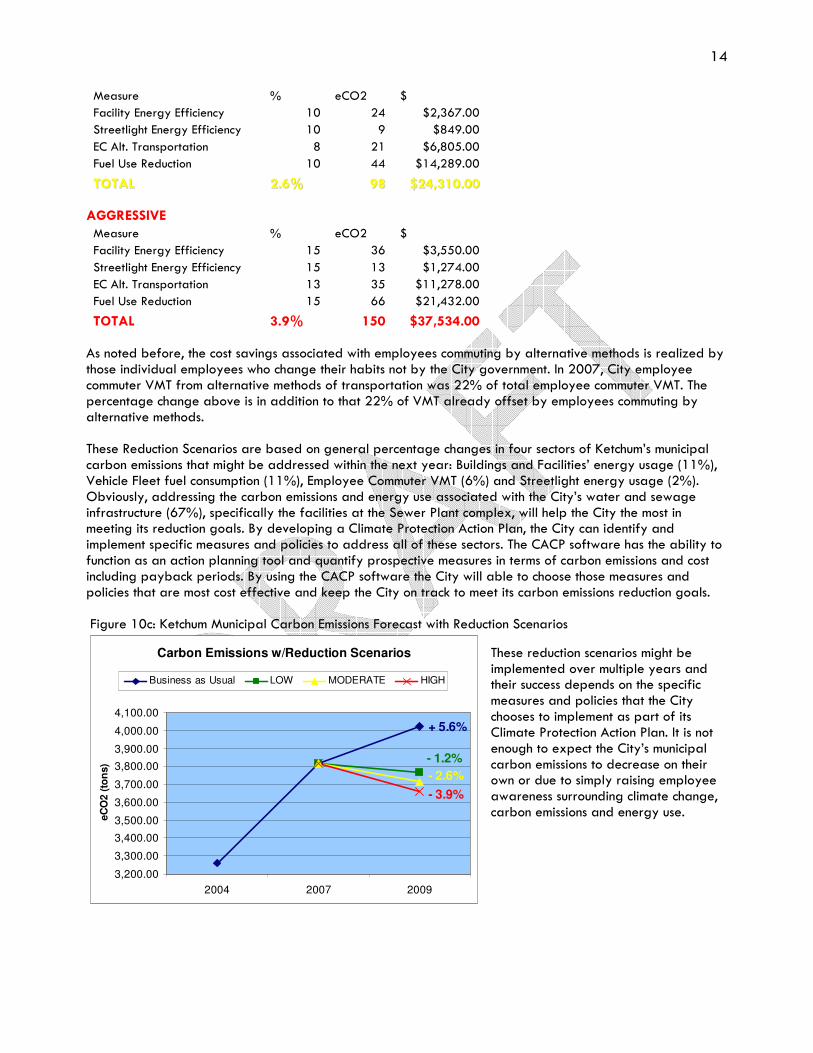
TOTAL 3.9% 150 $37,534.00 As noted before, the cost savings associated with employees commuting by alternative methods is realized by those individual employees who change their habits not by the City government. In 2007, City employee commuter VMT from alternative methods of transportation was 22% of total employee commuter VMT. The percentage change above is in addition to that 22% of VMT already offset by employees commuting by alternative methods. These Reduction Scenarios are based on general percentage changes in four sectors of Ketchum’s municipal carbon emissions that might be addressed within the next year: Buildings and Facilities’ energy usage (11%), Vehicle Fleet fuel consumption (11%), Employee Commuter VMT (6%) and Streetlight energy usage (2%). Obviously, addressing the carbon emissions and energy use associated with the City’s water and sewage infrastructure (67%), specifically the facilities at the Sewer Plant complex, will help the City the most in meeting its reduction goals. By developing a Climate Protection Action Plan, the City can identify and implement specific measures and policies to address all of these sectors. The CACP software has the ability to function as an action planning tool and quantify prospective measures in terms of carbon emissions and cost including payback periods. By using the CACP software the City will able to choose those measures and policies that are most cost effective and keep the City on track to meet its carbon emissions reduction goals. Figure 10c: Ketchum Municipal Carbon Emissions Forecast with Reduction Scenarios
These reduction scenarios might be implemented over multiple years and their success depends on the specific measures and policies that the City chooses to implement as part of its Climate Protection Action Plan. It is not enough to expect the City’s municipal carbon emissions to decrease on their own or due to simply raising employee awareness surrounding climate change, carbon emissions and energy use.
15
2004
2006
2008
2010
2012
2014
2016
2018
2020
2022
2024
2004 level
15%
25%
0
500
1000
1500
2000
2500
3000
3500
4000
4500
eC
O2 (
ton
s)
Carbon Emissions with Reduction Goals
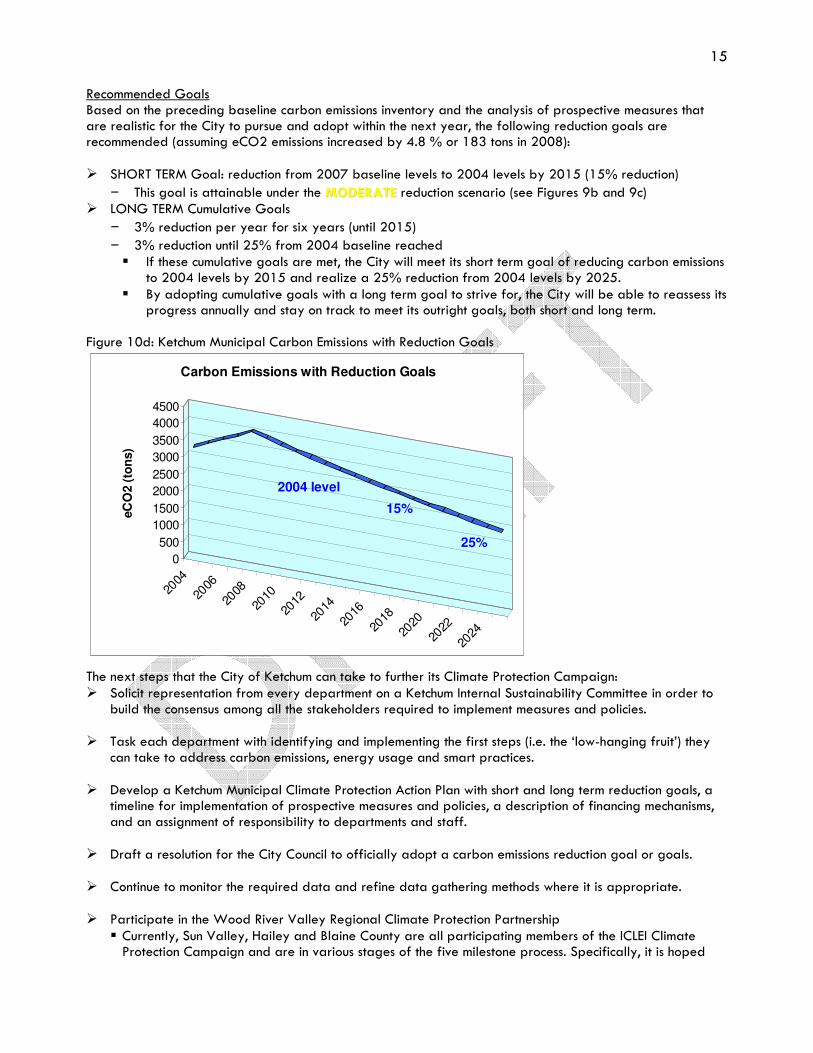
Recommended Goals Based on the preceding baseline carbon emissions inventory and the analysis of prospective measures that are realistic for the City to pursue and adopt within the next year, the following reduction goals are recommended (assuming eCO2 emissions increased by 4.8 % or 183 tons in 2008): � SHORT TERM Goal: reduction from 2007 baseline levels to 2004 levels by 2015 (15% reduction)
– This goal is attainable under the MMOODDEERRAATTEE reduction scenario (see Figures 9b and 9c) � LONG TERM Cumulative Goals
– 3% reduction per year for six years (until 2015)
– 3% reduction until 25% from 2004 baseline reached � If these cumulative goals are met, the City will meet its short term goal of reducing carbon emissions
to 2004 levels by 2015 and realize a 25% reduction from 2004 levels by 2025. � By adopting cumulative goals with a long term goal to strive for, the City will be able to reassess its
progress annually and stay on track to meet its outright goals, both short and long term.
Figure 10d: Ketchum Municipal Carbon Emissions with Reduction Goals The next steps that the City of Ketchum can take to further its Climate Protection Campaign: � Solicit representation from every department on a Ketchum Internal Sustainability Committee in order to
build the consensus among all the stakeholders required to implement measures and policies. � Task each department with identifying and implementing the first steps (i.e. the ‘low-hanging fruit’) they
can take to address carbon emissions, energy usage and smart practices. � Develop a Ketchum Municipal Climate Protection Action Plan with short and long term reduction goals, a
timeline for implementation of prospective measures and policies, a description of financing mechanisms, and an assignment of responsibility to departments and staff.
� Draft a resolution for the City Council to officially adopt a carbon emissions reduction goal or goals. � Continue to monitor the required data and refine data gathering methods where it is appropriate. � Participate in the Wood River Valley Regional Climate Protection Partnership
� Currently, Sun Valley, Hailey and Blaine County are all participating members of the ICLEI Climate Protection Campaign and are in various stages of the five milestone process. Specifically, it is hoped

16
that by collaborating on a regional level, these local governments as well as interested community groups, organizations, and citizens can more effectively:
- Exchange local best practices, opportunities and challenges - Disseminate and analyze the Blaine County Community Carbon Emissions Baseline Inventory - Carry out a series of community meetings involving the key stakeholders - Identify key issues and strategies that might necessitate or benefit from regional collaboration - Work toward building more sustainable and resilient communities within the Wood River Valley while improving the quality of life for residents and visitors alike
17
Data Sources and Locations Idaho Power, Intermountain Gas, United Oil, Brico and Shell records supplied by: Assistant City Clerk Katie Carnduff [email protected] 208.726.3841 Waste volume data supplied by: Clear Creek Office Manager Abbi Lukkasson [email protected] 208.726.9600 All data files and CACP software stored on the computer of: Senior Planner Nathan Warren [email protected] 208.726.7801 Carbon Emissions data stored in Excel file “Ketchum ICLEI Analysis.xls” Electricity data stored in Excel file "Ketchum Elec Gas 2004, 2007.xls" Natural Gas data stored in Excel file "Ketchum Elec Gas 2004, 2007.xls" Vehicle fleet fuel data stored in Excel file "Ketchum Vehicle Fleet 2004, 2007.xls" Employee Commute questionnaire data stored in Excel file "Ketchum Employee Commute 2004, 2007.xls" Employee Commute questionnaire stored in Word file 'Employee Commute Template - Ketchum' hard copies of questionnaires stored in Nathan Warren’s office Waste volume data stored in Excel file "Ketchum Municipal Waste.xls" Figure 1: stored in Excel file “Ketchum ICLEI Analysis.xls” Figure 2: stored in Excel file “Ketchum ICLEI Analysis.xls” Figure 3a: stored in Excel file "Ketchum Elec Gas 2004, 2007.xls" Figure 3b: stored in Excel file "Ketchum Elec Gas 2004, 2007.xls" Figure 3c: stored in Excel file "Ketchum Elec Gas 2004, 2007.xls" Figure 3d: stored in Excel file "Ketchum Elec Gas 2004, 2007.xls" Figure 4a: stored in Excel file "Ketchum Elec Gas 2004, 2007.xls" Figure 4b: stored in Excel file "Ketchum Elec Gas 2004, 2007.xls" Figure 4c: stored in Excel file "Ketchum Elec Gas 2004, 2007.xls" Figure 4d: stored in Excel file "Ketchum Elec Gas 2004, 2007.xls" Figure 5a: stored in Excel file "Ketchum Elec Gas 2004, 2007.xls" Figure 5b: stored in Excel file "Ketchum Elec Gas 2004, 2007.xls" Figure 6a: stored in Excel file "Ketchum Elec Gas 2004, 2007.xls" Figure 6b: stored in Excel file "Ketchum Elec Gas 2004, 2007.xls" Figure 7a: stored in Excel file "Ketchum Vehicle Fleet 2004, 2007.xls" Figure 7b: stored in Excel file "Ketchum Vehicle Fleet 2004, 2007.xls" Figure 7c: stored in Excel file "Ketchum Vehicle Fleet 2004, 2007.xls" Figure 8a: stored in Excel file “Ketchum Employee Commute 2004, 2007.xls" Figure 8b: stored in Excel file “Ketchum Employee Commute 2004, 2007.xls" Figure 8c: stored in Excel file “Ketchum Employee Commute 2004, 2007.xls" Figure 8d: stored in Excel file “Ketchum Employee Commute 2004, 2007.xls" Figure 9a: stored in Excel file "Ketchum Municipal Waste.xls" Figure 9b: stored in Waste tab of Government Analysis section of CACP Software Figure 10a: stored in Powerpoint file “Ketchum Baseline Presentation.ppt” Figure 10b: stored in Excel file “Ketchum ICLEI Analysis.xls” Figure 10c: stored in Excel file “Ketchum ICLEI Analysis.xls” Figure 10d: stored in Excel file “Ketchum ICLEI Analysis.xls”
18
Appendix 1: CACP Software Time Series Report
19
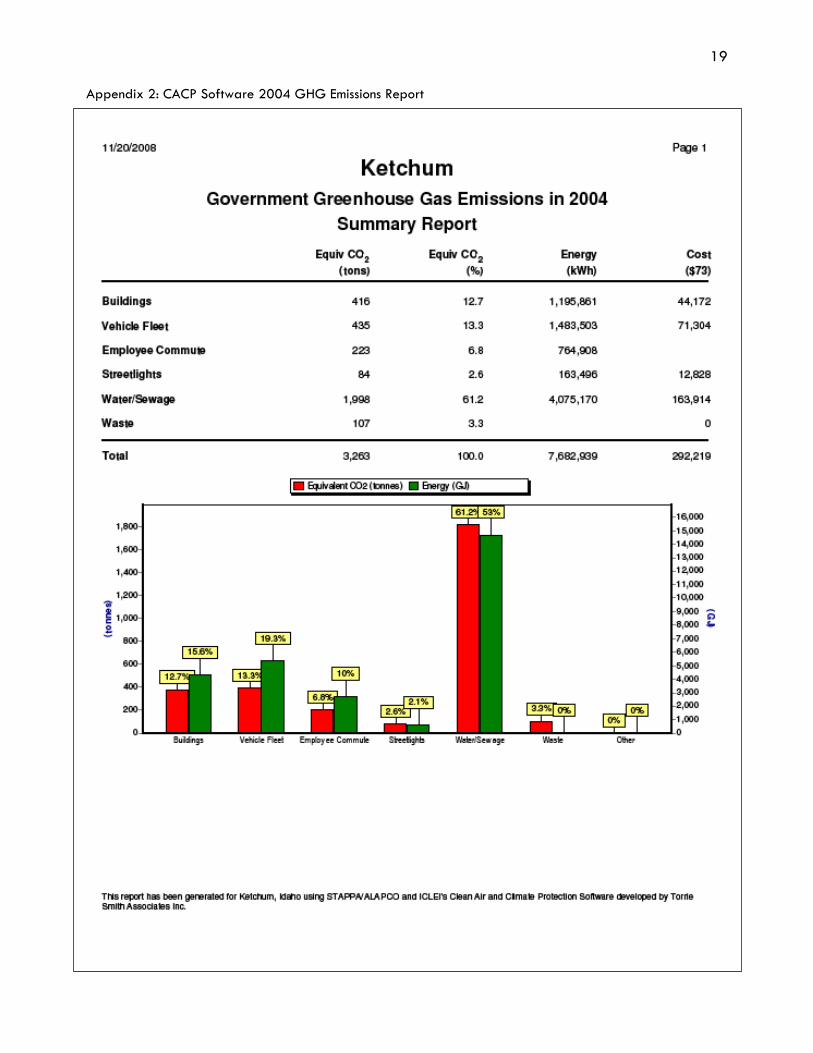
Appendix 2: CACP Software 2004 GHG Emissions Report
20
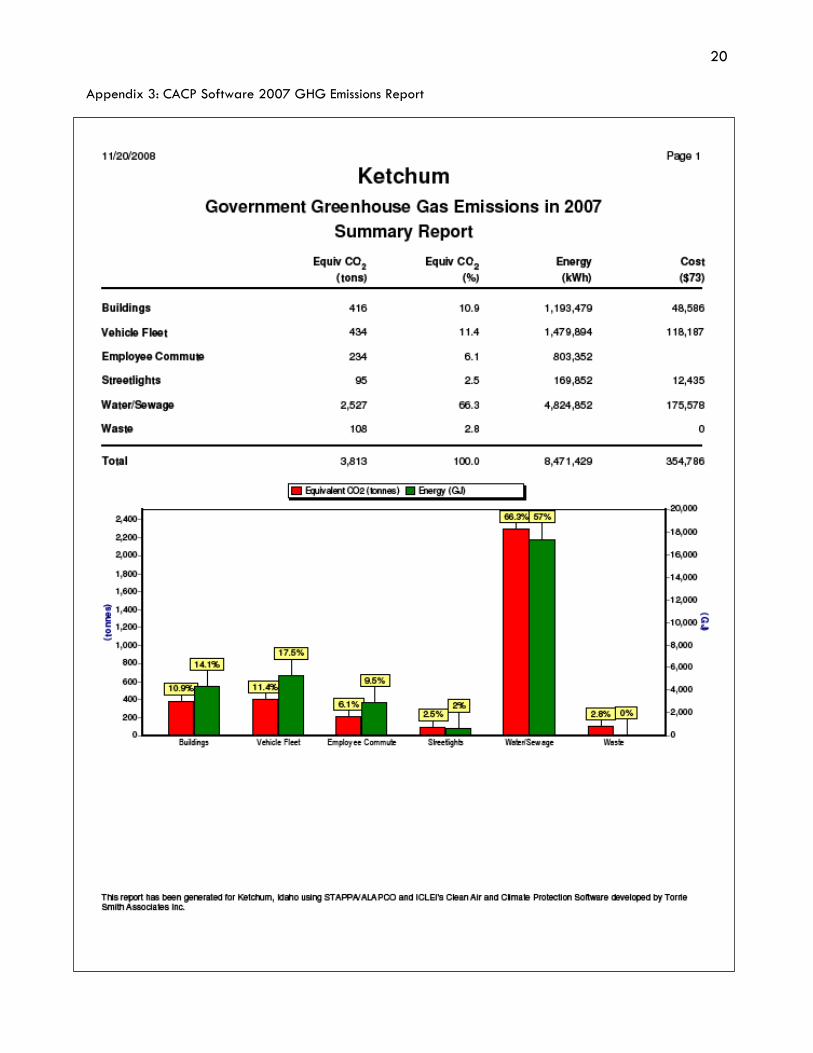
Appendix 3: CACP Software 2007 GHG Emissions Report