Embed Size (px)
Citation preview

Keystone Exams: Algebra IAssessment Anchors and Eligible Content
with Sample Questions and Glossary
Pennsylvania Department of Education
www.education.state.pa.us
January 2013

Pennsylvania Department of Education—Assessment Anchors and Eligible Content Page 2
PENNSYLVANIA DEPARTMENT OF EDUCATION
General Introduction to the Keystone Exam Assessment Anchors
Introduction
Since the introduction of the Keystone Exams, the Pennsylvania Department of Education (PDE) has been working to create a set of tools designed to help educators improve instructional practices and better understand the Keystone Exams. The Assessment Anchors, as defined by the Eligible Content, are one of the many tools the Department believes will better align curriculum, instruction, and assessment practices throughout the Commonwealth. Without this alignment, it will not be possible to significantly improve student achievement across the Commonwealth.
How were Keystone Exam Assessment Anchors developed?
Prior to the development of the Assessment Anchors, multiple groups of PA educators convened to create a set of standards for each of the Keystone Exams. Enhanced Standards, derived from a review of existing standards, focused on what students need to know and be able to do in order to be college and career ready. (Note: Since that time, PA Common Core Standards have replaced the Enhanced Standards and reflect the college- and career-ready focus.) Additionally, the Assessment Anchors and Eligible Content statements were created by other groups of educators charged with the task of clarifying the standards assessed on the Keystone Exams. The Assessment Anchors, as defined by the Eligible Content, have been designed to hold together, or anchor, the state assessment system and the curriculum/instructional practices in schools.
Assessment Anchors, as defined by the Eligible Content, were created with the following design parameters: Clear: The Assessment Anchors are easy to read and are user friendly; they clearly detail which
standards are assessed on the Keystone Exams.
Focused: The Assessment Anchors identify a core set of standards that can be reasonably assessed on a large-scale assessment; this will keep educators from having to guess which standards are critical.
Rigorous: The Assessment Anchors support the rigor of the state standards by assessing higher-order and reasoning skills.
Manageable: The Assessment Anchors define the standards in a way that can be easily incorporated into a course to prepare students for success.
How can teachers, administrators, schools, and districts use these Assessment Anchors?
The Assessment Anchors, as defined by the Eligible Content, can help focus teaching and learning because they are clear, manageable, and closely aligned with the Keystone Exams. Teachers and administrators will be better informed about which standards will be assessed. The Assessment Anchors and Eligible Content should be used along with the Standards and the Curriculum Framework of the Standards Aligned System (SAS) to build curriculum, design lessons, and support student achievement.
The Assessment Anchors and Eligible Content are designed to enable educators to determine when they feel students are prepared to be successful in the Keystone Exams. An evaluation of current course offerings, through the lens of what is assessed on those particular Keystone Exams, may provide an opportunity for an alignment to ensure student preparedness.
Pennsylvania Department of Education—Assessment Anchors and Eligible Content Page 3
How are the Assessment Anchors organized?
The Assessment Anchors, as defined by the Eligible Content, are organized into cohesive blueprints, each structured with a common labeling system that can be read like an outline. This framework is organized first by module, then by Assessment Anchor, followed by Anchor Descriptor, and then finally, at the greatest level of detail, by an Eligible Content statement. The common format of this outline is followed across the Keystone Exams.
Here is a description of each level in the labeling system for the Keystone Exams: Module: The Assessment Anchors are organized into two thematic modules for each of the
Keystone Exams. The module title appears at the top of each page. The module level is important because the Keystone Exams are built using a module format, with each of the Keystone Exams divided into two equal-size test modules. Each module is made up of two or more Assessment Anchors.
Assessment Anchor: The Assessment Anchor appears in the shaded bar across the top of each Assessment Anchor table. The Assessment Anchors represent categories of subject matter that anchor the content of the Keystone Exams. Each Assessment Anchor is part of a module and has one or more Anchor Descriptors unified under it.
Anchor Descriptor: Below each Assessment Anchor is a specific Anchor Descriptor. The Anchor Descriptor level provides further details that delineate the scope of content covered by the Assessment Anchor. Each Anchor Descriptor is part of an Assessment Anchor and has one or more Eligible Content statements unified under it.
Eligible Content: The column to the right of the Anchor Descriptor contains the Eligible Content statements. The Eligible Content is the most specific description of the content that is assessed on the Keystone Exams. This level is considered the assessment limit and helps educators identify the range of the content covered on the Keystone Exams.
PA Common Core Standard: In the column to the right of each Eligible Content statement is a code representing one or more PA Common Core Standards that correlate to the Eligible Content statement. Some Eligible Content statements include annotations that indicate certain clarifications about the scope of an Eligible Content.
“e.g.” (“for example”)—sample approach, but not a limit to the Eligible Content
“i.e.” (“that is”)—specific limit to the Eligible Content
“Note”—content exclusions or definable range of the Eligible Content
How do the K–12 Pennsylvania Common Core Standards affect this document?
Assessment Anchor and Eligible Content statements are aligned to the PA Common Core Standards; thus, the former enhanced standards are no longer necessary. Within this document, all standard references reflect the PA Common Core Standards.
Standards Aligned System—www.pdesas.org
Pennsylvania Department of Education—www.education.state.pa.us
Pennsylvania Department of Education—Assessment Anchors and Eligible Content Page 4
Keystone Exams: Algebra I
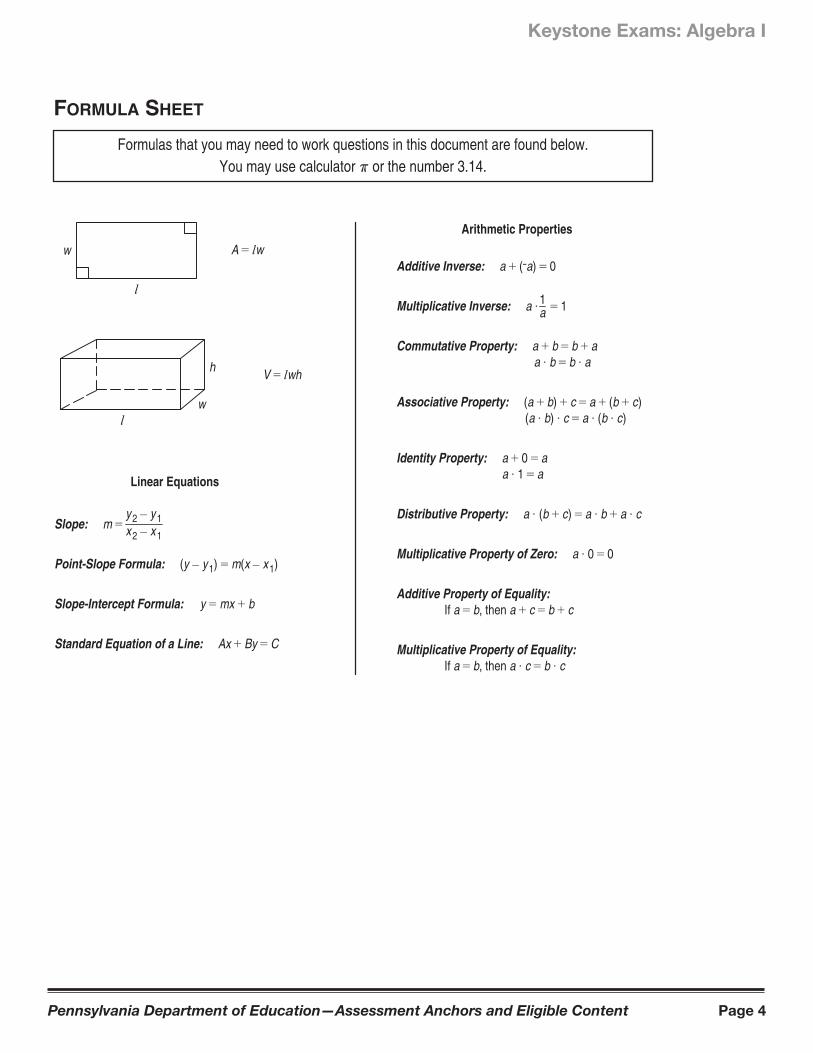
FORMULA SHEET
Formulas that you may need to work questions in this document are found below.You may use calculator π or the number 3.14.
A = lw
l
w
V = lwh
lw
h
Arithmetic Properties
Additive Inverse: a + (ˉa) = 0
Multiplicative Inverse: a · = 1
Commutative Property: a + b = b + a a · b = b · a
Associative Property: (a + b) + c = a + (b + c) (a · b) · c = a · (b · c)
Identity Property: a + 0 = a a · 1 = a
Distributive Property: a · (b + c) = a · b + a · c
Multiplicative Property of Zero: a · 0 = 0
Additive Property of Equality: If a = b, then a + c = b + c
Multiplicative Property of Equality: If a = b, then a · c = b · c
1a
Linear Equations
Slope: m =
Point-Slope Formula: (y – y 1) = m(x – x 1)
Slope-Intercept Formula: y = mx + b
Standard Equation of a Line: Ax + By = C
y 2 – y 1x 2 – x 1
Pennsylvania Department of Education—Assessment Anchors and Eligible Content Page 5
Keystone Exams: Algebra I
MODULE 1—Operations and Linear Equations & Inequalities
ASSESSMENT ANCHOR
A1.1.1 Operations with Real Numbers and Expressions
Anchor Descriptor Eligible Content
PA Common
Core
Standards
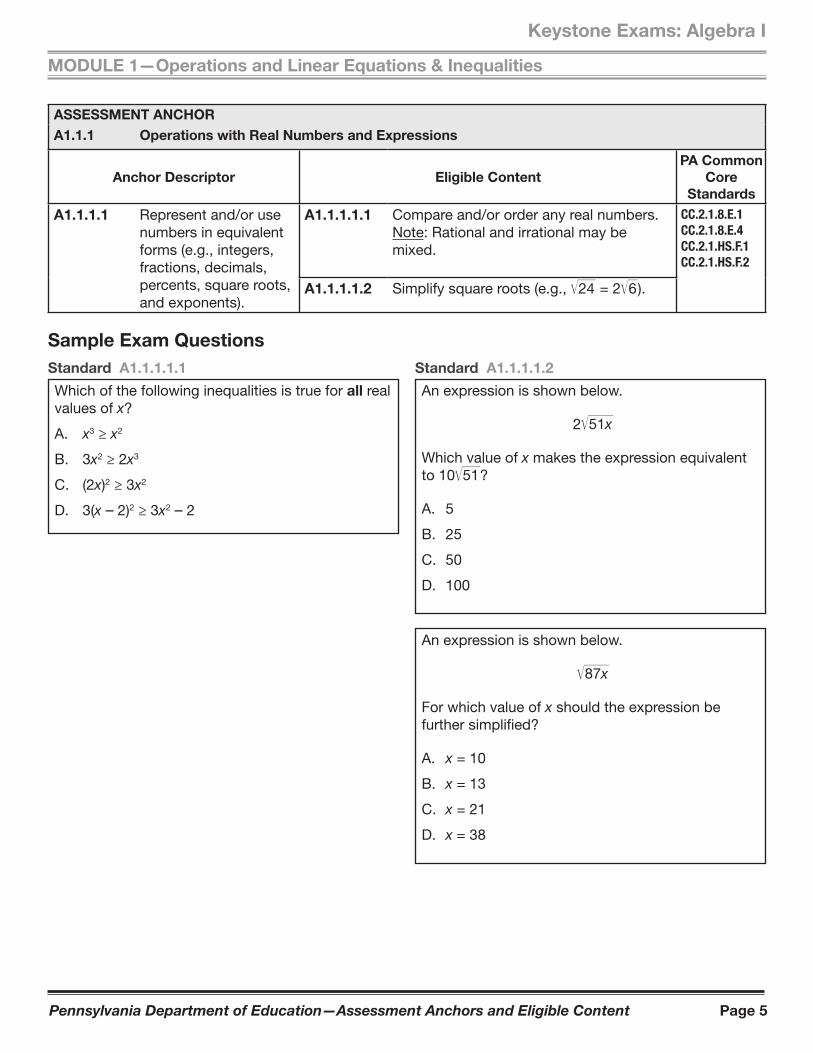
A1.1.1.1 Represent and/or use numbers in equivalent forms (e.g., integers, fractions, decimals, percents, square roots, and exponents).
A1.1.1.1.1 Compare and/or order any real numbers.Note: Rational and irrational may be mixed.
CC.2.1.8.E.1
CC.2.1.8.E.4
CC.2.1.HS.F.1
CC.2.1.HS.F.2
A1.1.1.1.2 Simplify square roots (e.g., Ï}
24 = 2 Ï}
6 ).
Sample Exam Questions
Standard A1.1.1.1.1
Which of the following inequalities is true for all real values of x?
A. x3 ≥ x2
B. 3x2 ≥ 2x3
C. (2x)2 ≥ 3x2
D. 3(x – 2)2 ≥ 3x2 – 2
Standard A1.1.1.1.2
An expression is shown below.
2 Ï}
51x
Which value of x makes the expression equivalent to 10 Ï
}
51 ?
A. 5
B. 25
C. 50
D. 100
An expression is shown below.
Ï}
87x
For which value of x should the expression be further simplified?
A. x = 10
B. x = 13
C. x = 21
D. x = 38
Pennsylvania Department of Education—Assessment Anchors and Eligible Content Page 6
MODULE 1—Operations and Linear Equations & Inequalities
Keystone Exams: Algebra I
ASSESSMENT ANCHOR
A1.1.1 Operations with Real Numbers and Expressions
Anchor Descriptor Eligible Content
PA Common
Core
Standards
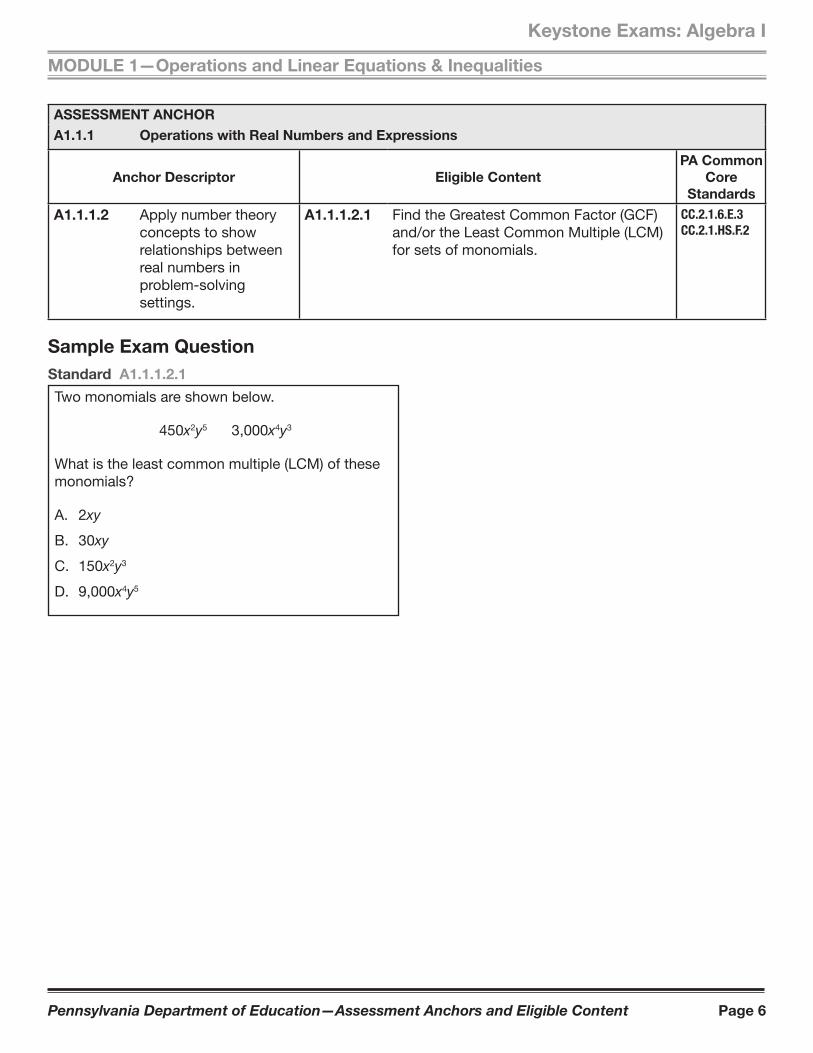
A1.1.1.2 Apply number theory concepts to show relationships between real numbers in problem-solving settings.
A1.1.1.2.1 Find the Greatest Common Factor (GCF) and/or the Least Common Multiple (LCM) for sets of monomials.
CC.2.1.6.E.3
CC.2.1.HS.F.2
Sample Exam Question
Standard A1.1.1.2.1
Two monomials are shown below.
450x2y5 3,000x4y3
What is the least common multiple (LCM) of these monomials?
A. 2xy
B. 30xy
C. 150x2y3
D. 9,000x4y5
Pennsylvania Department of Education—Assessment Anchors and Eligible Content Page 7
Keystone Exams: Algebra I
MODULE 1—Operations and Linear Equations & Inequalities
ASSESSMENT ANCHOR
A1.1.1 Operations with Real Numbers and Expressions
Anchor Descriptor Eligible Content
PA Common
Core
Standards
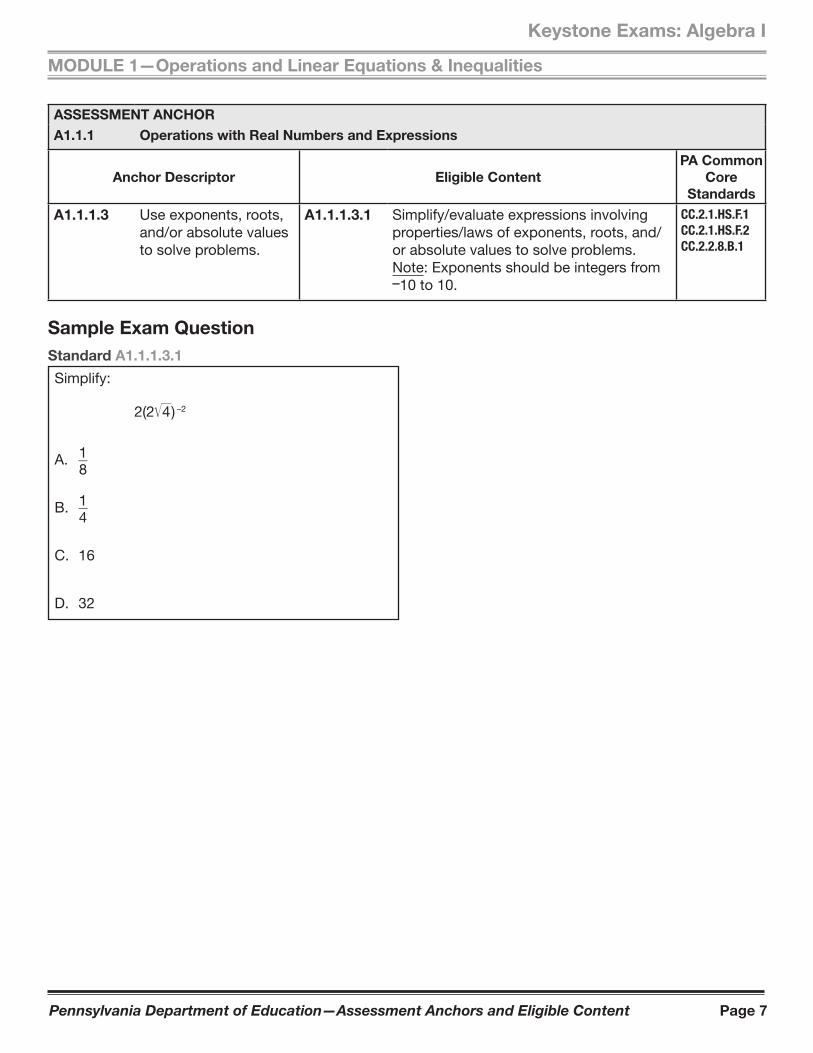
A1.1.1.3 Use exponents, roots, and/or absolute values to solve problems.
A1.1.1.3.1 Simplify/evaluate expressions involving properties/laws of exponents, roots, and/or absolute values to solve problems. Note: Exponents should be integers from –10 to 10.
CC.2.1.HS.F.1
CC.2.1.HS.F.2
CC.2.2.8.B.1
Sample Exam Question
Standard A1.1.1.3.1
Simplify:
2(2 Ï}
4 ) –2
A. 1 __ 8
B. 1 __ 4
C. 16
D. 32
Pennsylvania Department of Education—Assessment Anchors and Eligible Content Page 8
MODULE 1—Operations and Linear Equations & Inequalities
Keystone Exams: Algebra I
ASSESSMENT ANCHOR
A1.1.1 Operations with Real Numbers and Expressions
Anchor Descriptor Eligible Content
PA Common
Core
Standards
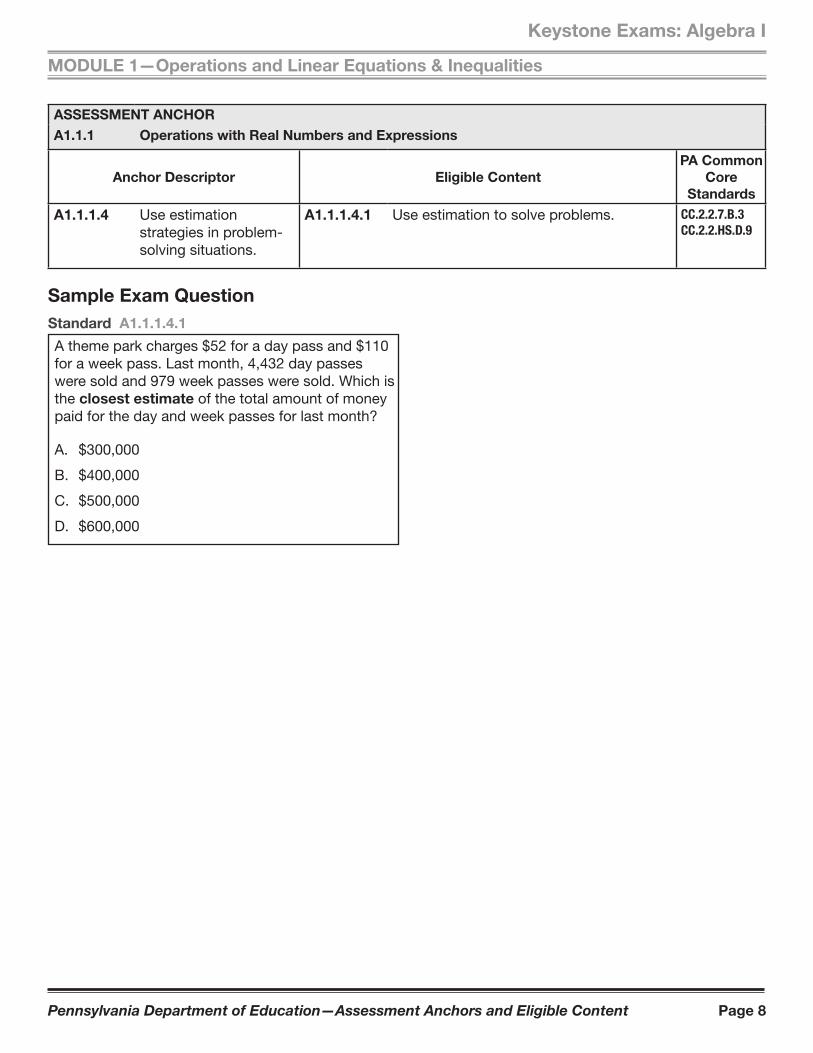
A1.1.1.4 Use estimation strategies in problem-solving situations.
A1.1.1.4.1 Use estimation to solve problems. CC.2.2.7.B.3
CC.2.2.HS.D.9
Sample Exam Question
Standard A1.1.1.4.1
A theme park charges $52 for a day pass and $110 for a week pass. Last month, 4,432 day passes were sold and 979 week passes were sold. Which is the closest estimate of the total amount of money paid for the day and week passes for last month?
A. $300,000
B. $400,000
C. $500,000
D. $600,000
Pennsylvania Department of Education—Assessment Anchors and Eligible Content Page 9
Keystone Exams: Algebra I
MODULE 1—Operations and Linear Equations & Inequalities
ASSESSMENT ANCHOR
A1.1.1 Operations with Real Numbers and Expressions
Anchor Descriptor Eligible Content
PA Common
Core
Standards
A1.1.1.5 Simplify expressions involving polynomials.
A1.1.1.5.1 Add, subtract, and/or multiply polynomial expressions (express answers in simplest form). Note: Nothing larger than a binomial multiplied by a trinomial.
CC.2.2.HS.D.1 CC.2.2.HS.D.2 CC.2.2.HS.D.3
CC.2.2.HS.D.5
CC.2.2.HS.D.6
A1.1.1.5.2 Factor algebraic expressions, including difference of squares and trinomials.Note: Trinomials are limited to the form ax2 + bx + c where a is equal to 1 after factoring out all monomial factors.
A1.1.1.5.3 Simplify/reduce a rational algebraic expression.
Sample Exam Questions
Standard A1.1.1.5.1
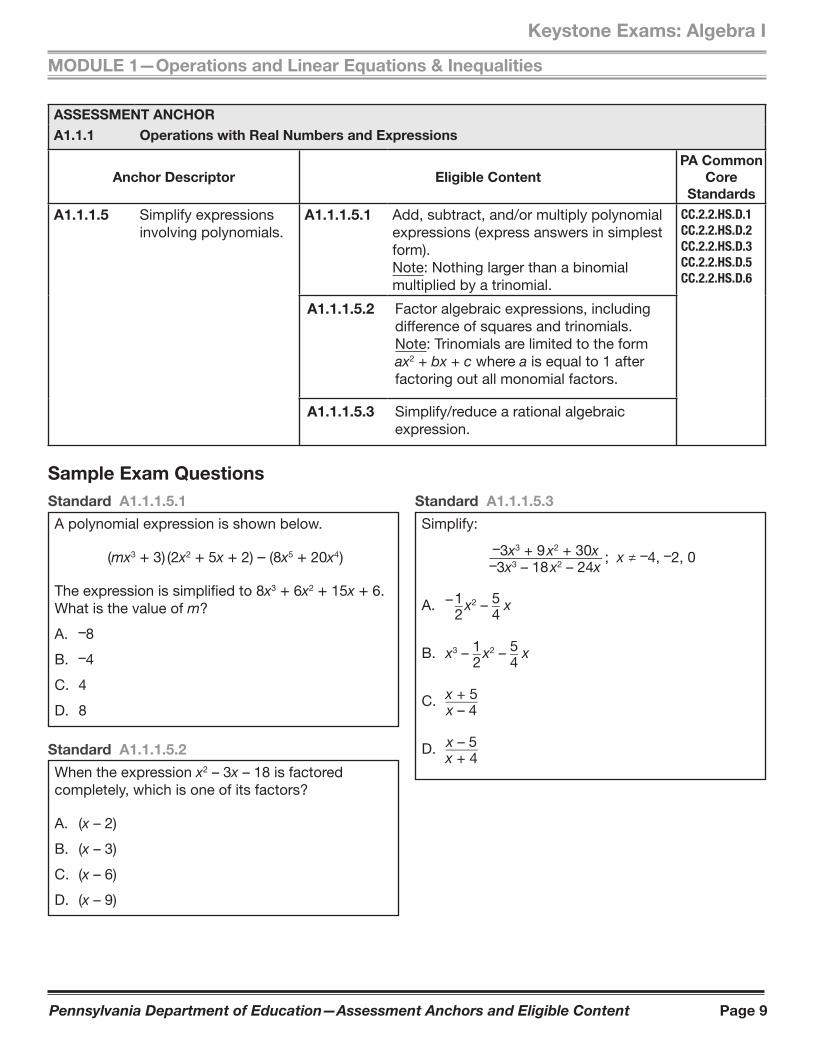
A polynomial expression is shown below.
(mx3 + 3 ) (2x2 + 5x + 2) – (8x5 + 20x4 )
The expression is simplified to 8x3 + 6x2 + 15x + 6. What is the value of m?
A. –8
B. –4
C. 4
D. 8
Standard A1.1.1.5.2
When the expression x2 – 3x – 18 is factored completely, which is one of its factors?
A. (x – 2)
B. (x – 3)
C. (x – 6)
D. (x – 9)
Standard A1.1.1.5.3
Simplify:
–3x3 + 9 x2 + 30x }} –3x3 – 18 x2 – 24x ; x ≠ –4, –2, 0
A. – 1 } 2 x2 – 5 }
4 x
B. x3 – 1 } 2
x2 – 5 } 4 x
C. x + 5 } x – 4
D. x – 5 } x + 4
Pennsylvania Department of Education—Assessment Anchors and Eligible Content Page 10
MODULE 1—Operations and Linear Equations & Inequalities
Keystone Exams: Algebra I
Standard A1.1.1
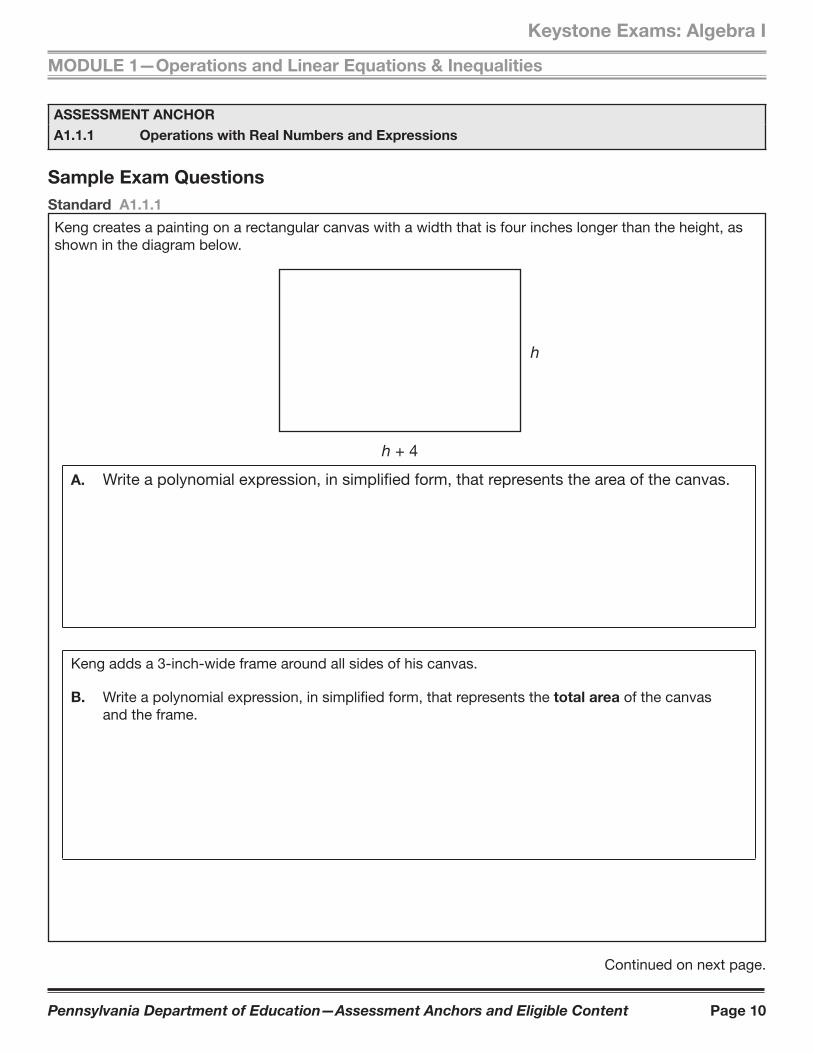
Keng creates a painting on a rectangular canvas with a width that is four inches longer than the height, as shown in the diagram below.
h
h + 4
A. Write a polynomial expression, in simplifi ed form, that represents the area of the canvas.
Keng adds a 3-inch-wide frame around all sides of his canvas.
B. Write a polynomial expression, in simplified form, that represents the total area of the canvas and the frame.
Continued on next page.
ASSESSMENT ANCHOR
A1.1.1 Operations with Real Numbers and Expressions
Sample Exam Questions
Pennsylvania Department of Education—Assessment Anchors and Eligible Content Page 11
Keystone Exams: Algebra I
MODULE 1—Operations and Linear Equations & Inequalities
Continued. Please refer to the previous page for task explanation.
Keng is unhappy with his 3-inch-wide frame, so he decides to put a frame with a different width around his canvas. The total area of the canvas and the new frame is given by the polynomial h2 + 8h + 12, where h represents the height of the canvas.
C. Determine the width of the new frame. Show all your work. Explain why you did each step.
Pennsylvania Department of Education—Assessment Anchors and Eligible Content Page 12
MODULE 1—Operations and Linear Equations & Inequalities
Keystone Exams: Algebra I
Standard A1.1.1
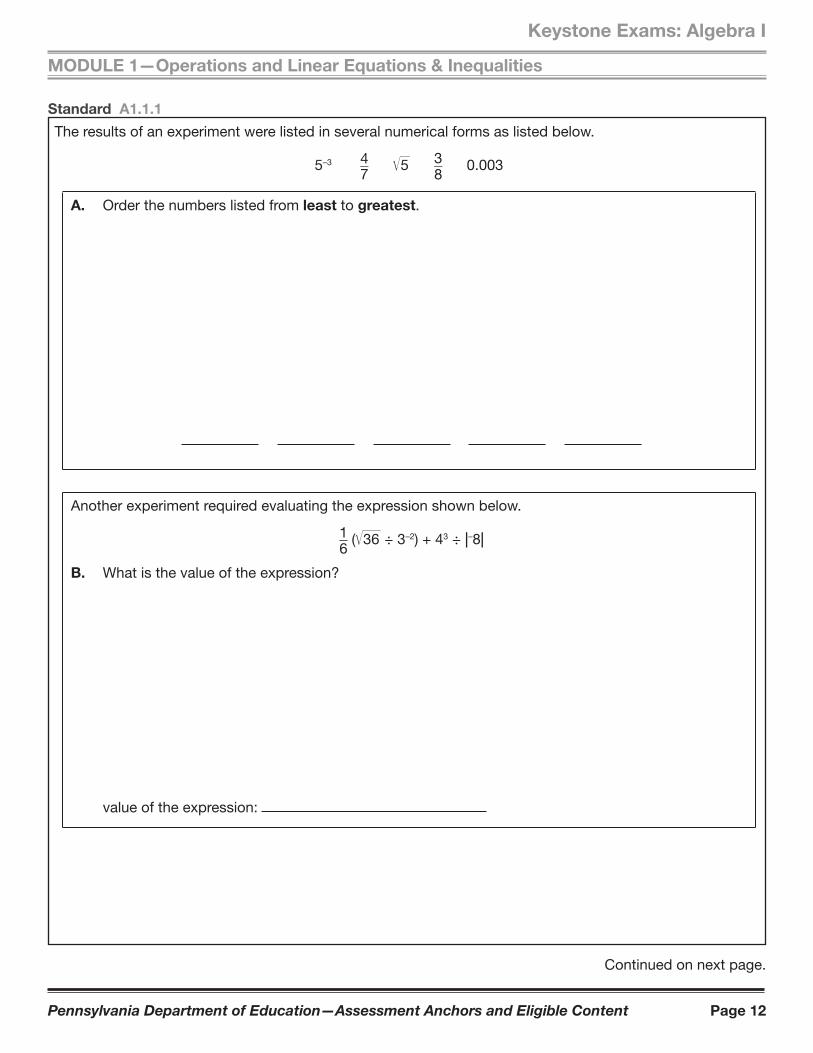
The results of an experiment were listed in several numerical forms as listed below.
5–3 4 } 7 Ï
}
5 3 } 8 0.003
A. Order the numbers listed from least to greatest.
Another experiment required evaluating the expression shown below.
1 } 6 ( Ï
}
36 ÷ 3–2) + 43 ÷ z–8z
B. What is the value of the expression?
value of the expression:
Continued on next page.
Pennsylvania Department of Education—Assessment Anchors and Eligible Content Page 13
Keystone Exams: Algebra I
MODULE 1—Operations and Linear Equations & Inequalities
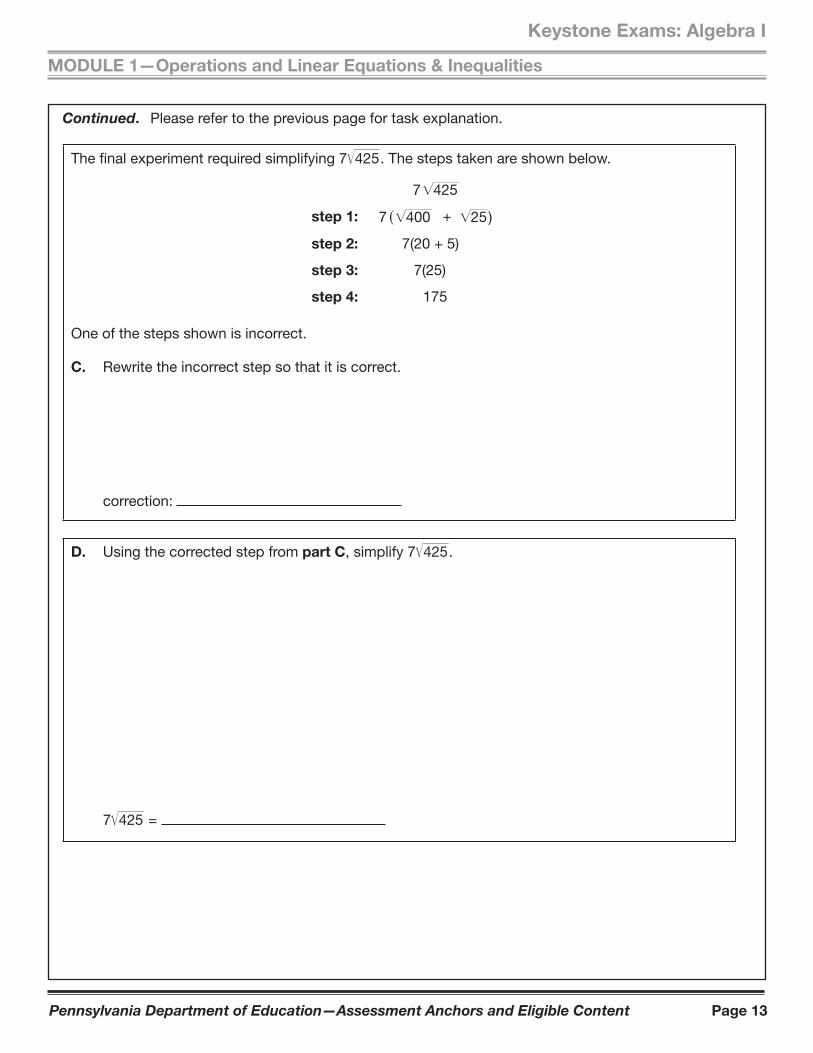
Continued. Please refer to the previous page for task explanation.
The final experiment required simplifying 7 Ï}
425 . The steps taken are shown below.
7 425
step 1: 7 400 25)
step 2: 7(20 + 5)
step 3: 7(25)
step 4: 175
+
One of the steps shown is incorrect.
C. Rewrite the incorrect step so that it is correct.
correction:
D. Using the corrected step from part C, simplify 7 Ï}
425 .
7 Ï}
425 =
Pennsylvania Department of Education—Assessment Anchors and Eligible Content Page 14
MODULE 1—Operations and Linear Equations & Inequalities
Keystone Exams: Algebra I
ASSESSMENT ANCHOR
A1.1.2 Linear Equations
Anchor Descriptor Eligible Content
PA Common
Core
Standards
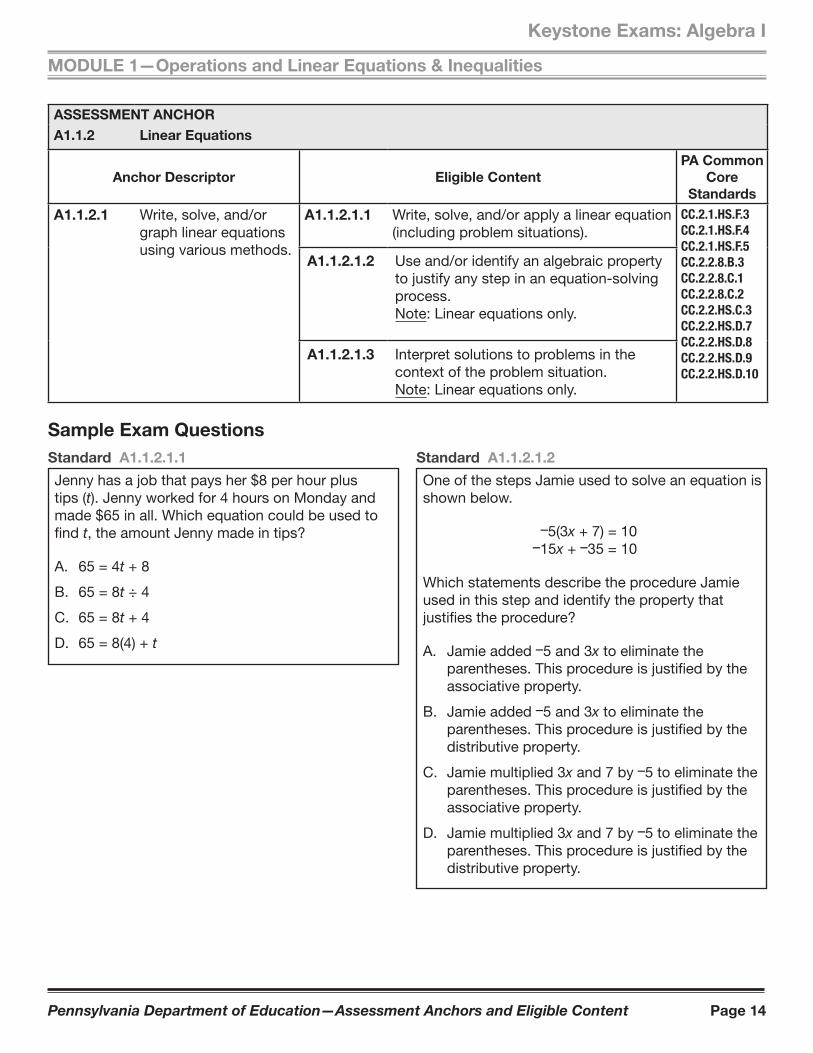
A1.1.2.1 Write, solve, and/or graph linear equations using various methods.
A1.1.2.1.1 Write, solve, and/or apply a linear equation (including problem situations).
CC.2.1.HS.F.3
CC.2.1.HS.F.4
CC.2.1.HS.F.5
CC.2.2.8.B.3
CC.2.2.8.C.1
CC.2.2.8.C.2
CC.2.2.HS.C.3
CC.2.2.HS.D.7
CC.2.2.HS.D.8
CC.2.2.HS.D.9
CC.2.2.HS.D.10
A1.1.2.1.2 Use and/or identify an algebraic property to justify any step in an equation-solving process.Note: Linear equations only.
A1.1.2.1.3 Interpret solutions to problems in the context of the problem situation.Note: Linear equations only.
Sample Exam Questions
Standard A1.1.2.1.1
Jenny has a job that pays her $8 per hour plus tips (t). Jenny worked for 4 hours on Monday and made $65 in all. Which equation could be used to find t, the amount Jenny made in tips?
A. 65 = 4t + 8
B. 65 = 8t ÷ 4
C. 65 = 8t + 4
D. 65 = 8(4) + t
Standard A1.1.2.1.2
One of the steps Jamie used to solve an equation is shown below.
–5(3x + 7) = 10–15x + –35 = 10
Which statements describe the procedure Jamie used in this step and identify the property that justifies the procedure?
A. Jamie added –5 and 3x to eliminate the parentheses. This procedure is justifi ed by the associative property.
B. Jamie added –5 and 3x to eliminate the parentheses. This procedure is justifi ed by the distributive property.
C. Jamie multiplied 3x and 7 by –5 to eliminate the parentheses. This procedure is justifi ed by the associative property.
D. Jamie multiplied 3x and 7 by –5 to eliminate the parentheses. This procedure is justifi ed by the distributive property.
Pennsylvania Department of Education—Assessment Anchors and Eligible Content Page 15
Keystone Exams: Algebra I
MODULE 1—Operations and Linear Equations & Inequalities
Sample Exam Question
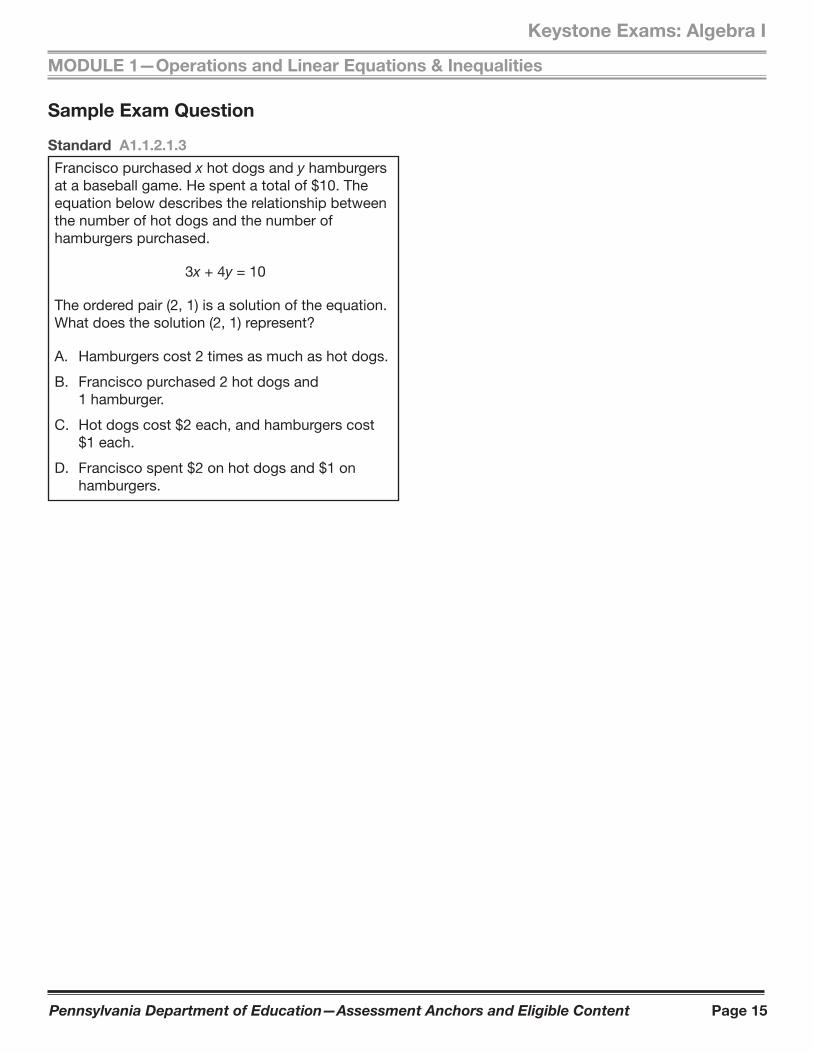
Standard A1.1.2.1.3
Francisco purchased x hot dogs and y hamburgers at a baseball game. He spent a total of $10. The equation below describes the relationship between the number of hot dogs and the number of hamburgers purchased.
3x + 4y = 10
The ordered pair (2, 1) is a solution of the equation. What does the solution (2, 1) represent?
A. Hamburgers cost 2 times as much as hot dogs.
B. Francisco purchased 2 hot dogs and 1 hamburger.
C. Hot dogs cost $2 each, and hamburgers cost $1 each.
D. Francisco spent $2 on hot dogs and $1 on hamburgers.
Pennsylvania Department of Education—Assessment Anchors and Eligible Content Page 16
MODULE 1—Operations and Linear Equations & Inequalities
Keystone Exams: Algebra I
ASSESSMENT ANCHOR
A1.1.2 Linear Equations
Anchor Descriptor Eligible Content
PA Common
Core
Standards
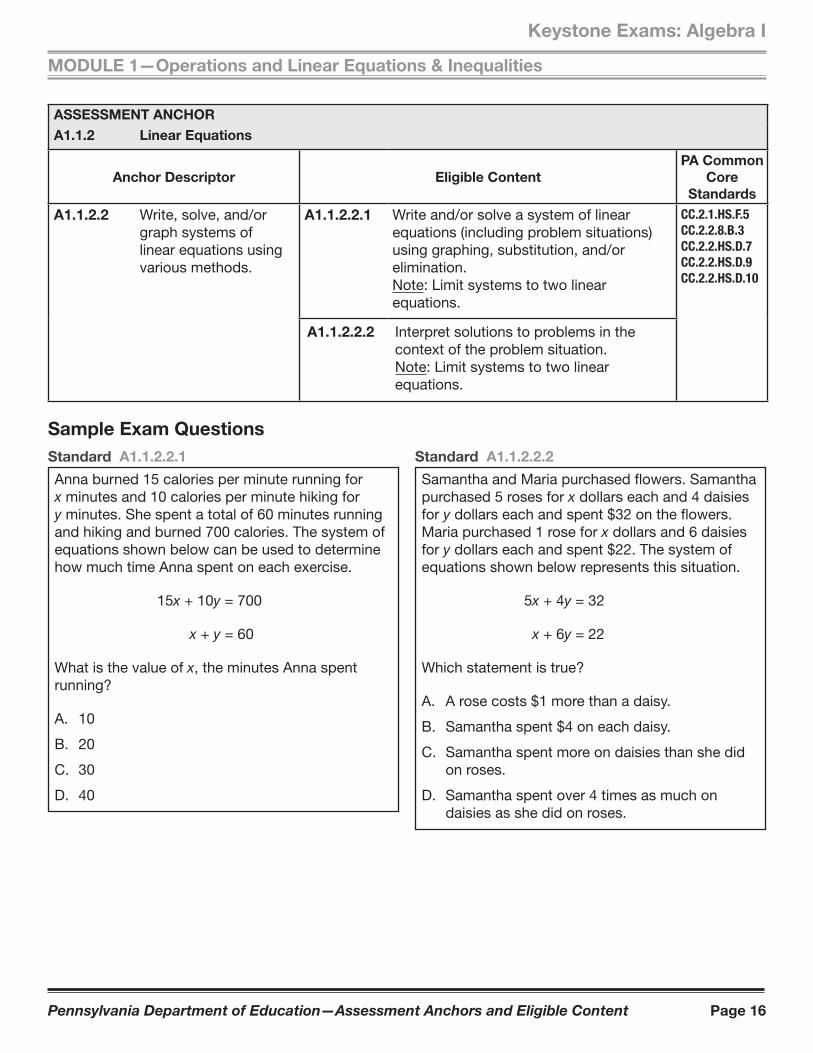
A1.1.2.2 Write, solve, and/or graph systems of linear equations using various methods.
A1.1.2.2.1 Write and/or solve a system of linear equations (including problem situations) using graphing, substitution, and/or elimination.Note: Limit systems to two linear equations.
CC.2.1.HS.F.5
CC.2.2.8.B.3
CC.2.2.HS.D.7
CC.2.2.HS.D.9
CC.2.2.HS.D.10
A1.1.2.2.2 Interpret solutions to problems in the context of the problem situation.Note: Limit systems to two linear equations.
Sample Exam Questions
Standard A1.1.2.2.1
Anna burned 15 calories per minute running for x minutes and 10 calories per minute hiking for y minutes. She spent a total of 60 minutes running and hiking and burned 700 calories. The system of equations shown below can be used to determine how much time Anna spent on each exercise.
15x + 10y = 700
x + y = 60
What is the value of x, the minutes Anna spent running?
A. 10
B. 20
C. 30
D. 40
Standard A1.1.2.2.2
Samantha and Maria purchased flowers. Samantha purchased 5 roses for x dollars each and 4 daisies for y dollars each and spent $32 on the flowers. Maria purchased 1 rose for x dollars and 6 daisies for y dollars each and spent $22. The system of equations shown below represents this situation.
5x + 4y = 32
x + 6y = 22
Which statement is true?
A. A rose costs $1 more than a daisy.
B. Samantha spent $4 on each daisy.
C. Samantha spent more on daisies than she did on roses.
D. Samantha spent over 4 times as much on daisies as she did on roses.
Pennsylvania Department of Education—Assessment Anchors and Eligible Content Page 17
Keystone Exams: Algebra I
MODULE 1—Operations and Linear Equations & Inequalities
Standard A1.1.2
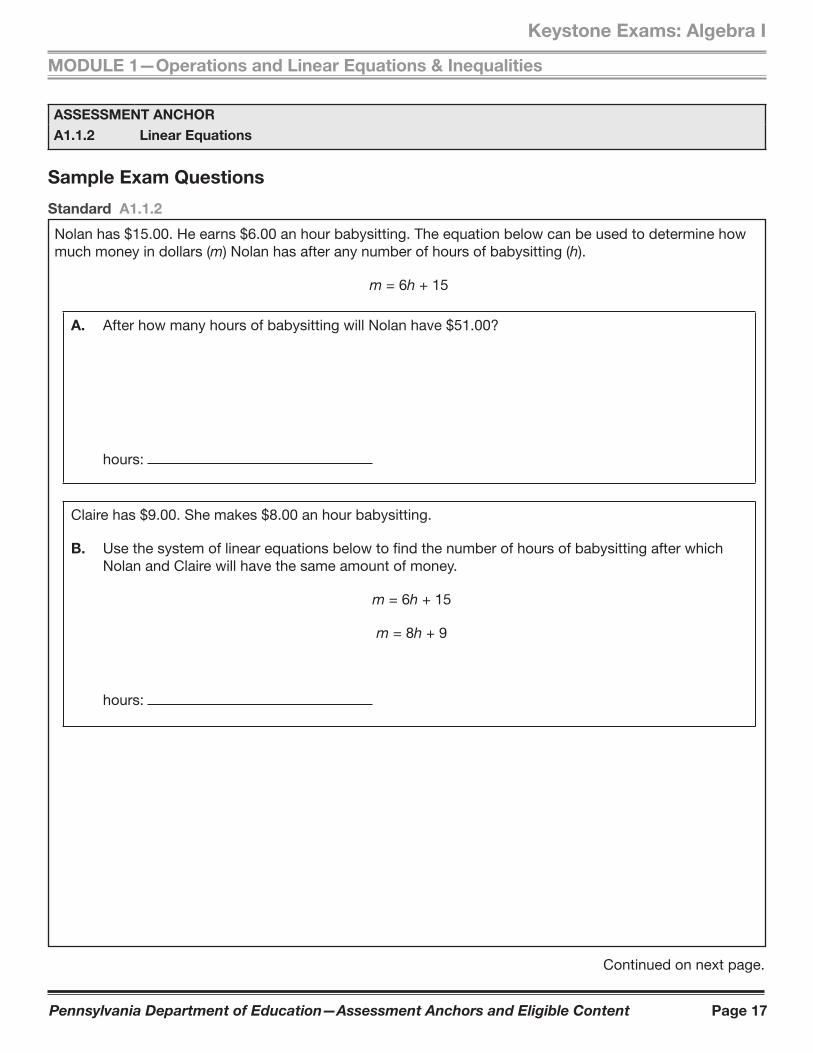
Nolan has $15.00. He earns $6.00 an hour babysitting. The equation below can be used to determine how much money in dollars (m) Nolan has after any number of hours of babysitting (h).
m = 6h + 15
A. After how many hours of babysitting will Nolan have $51.00?
hours:
Claire has $9.00. She makes $8.00 an hour babysitting.
B. Use the system of linear equations below to find the number of hours of babysitting after which Nolan and Claire will have the same amount of money.
m = 6h + 15
m = 8h + 9
hours:
Continued on next page.
ASSESSMENT ANCHOR
A1.1.2 Linear Equations
Sample Exam Questions
Pennsylvania Department of Education—Assessment Anchors and Eligible Content Page 18
MODULE 1—Operations and Linear Equations & Inequalities
Keystone Exams: Algebra I
Continued. Please refer to the previous page for task explanation.
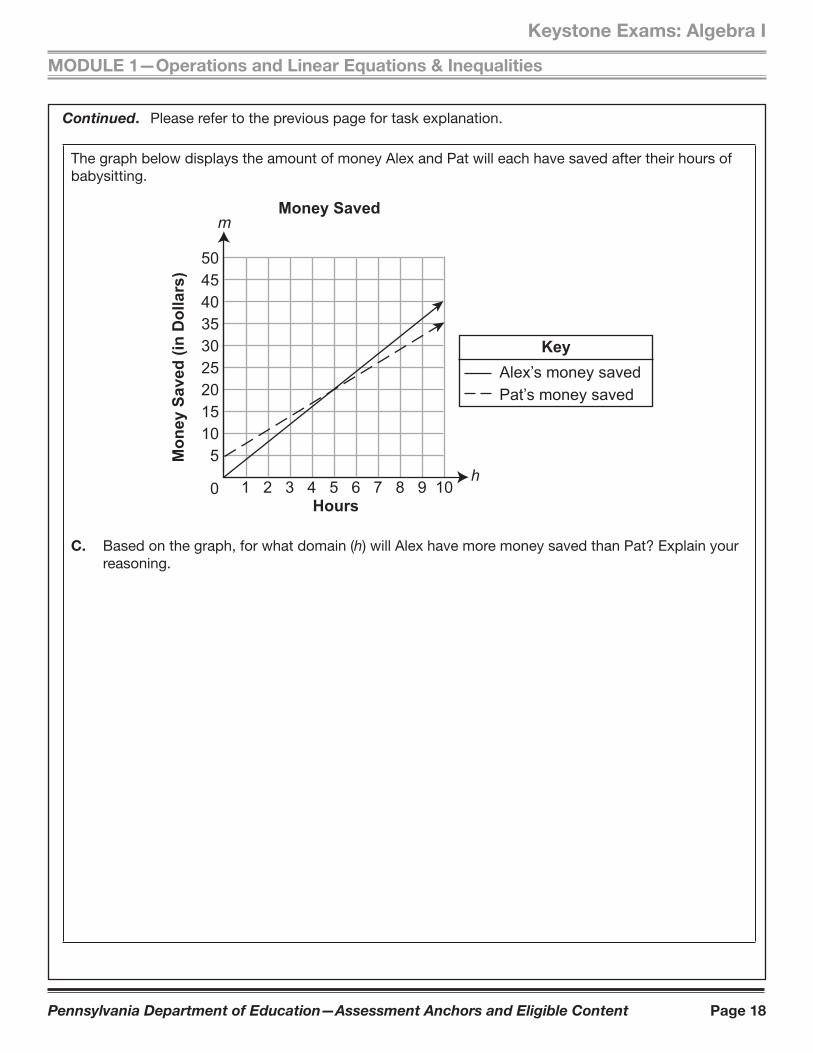
The graph below displays the amount of money Alex and Pat will each have saved after their hours of babysitting.
0Hours
Mon
ey S
aved
(in
Dol
lars
)
h
m
504540353025201510
5
1 2 3 4 5 6 7 8 9 10
Money Saved
KeyAlex’s money savedPat’s money saved
C. Based on the graph, for what domain (h) will Alex have more money saved than Pat? Explain your reasoning.

Pennsylvania Department of Education—Assessment Anchors and Eligible Content Page 19
Keystone Exams: Algebra I
MODULE 1—Operations and Linear Equations & Inequalities
Standard A1.1.2
The diagram below shows 5 identical bowls stacked one inside the other.
2 inches
5 inches
Bowls
The height of 1 bowl is 2 inches. The height of a stack of 5 bowls is 5 inches.
A. Write an equation using x and y to find the height of a stack of bowls based on any number of bowls.
equation:
Continued on next page.
Pennsylvania Department of Education—Assessment Anchors and Eligible Content Page 20
MODULE 1—Operations and Linear Equations & Inequalities
Keystone Exams: Algebra I
Continued. Please refer to the previous page for task explanation.
B. Describe what the x and y variables represent.
x-variable:
y-variable:
C. What is the height, in inches, of a stack of 10 bowls?
height: inches
Pennsylvania Department of Education—Assessment Anchors and Eligible Content Page 21
Keystone Exams: Algebra I
MODULE 1—Operations and Linear Equations & Inequalities
ASSESSMENT ANCHOR
A1.1.3 Linear Inequalities
Anchor Descriptor Eligible Content
PA Common
Core
Standards
A1.1.3.1 Write, solve, and/or graph linear inequalities using various methods.
A1.1.3.1.1 Write or solve compound inequalities and/or graph their solution sets on a number line (may include absolute value inequalities).
CC.2.1.HS.F.5
CC.2.2.HS.D.7
CC.2.2.HS.D.9
CC.2.2.HS.D.10
A1.1.3.1.2 Identify or graph the solution set to a linear inequality on a number line.
A1.1.3.1.3 Interpret solutions to problems in the context of the problem situation.Note: Linear inequalities only.
Sample Exam Questions
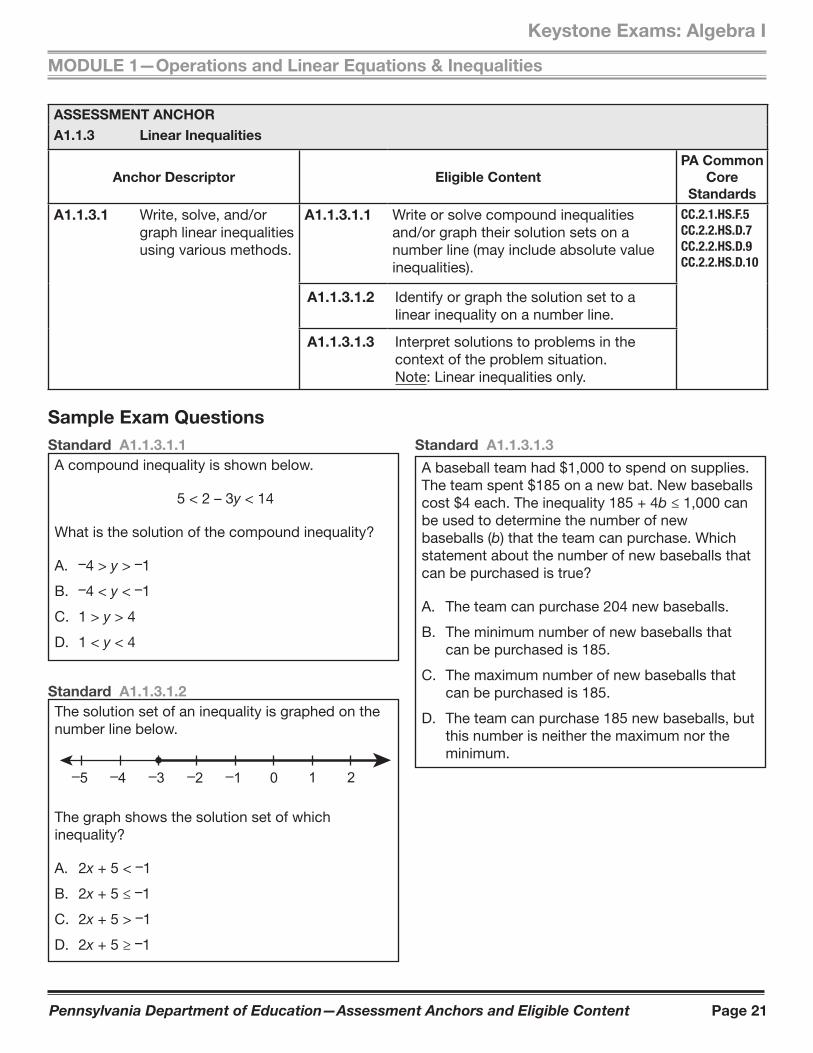
Standard A1.1.3.1.1
A compound inequality is shown below.
5 < 2 – 3y < 14
What is the solution of the compound inequality?
A. –4 > y > –1
B. –4 < y < –1
C. 1 > y > 4
D. 1 < y < 4
Standard A1.1.3.1.3
A baseball team had $1,000 to spend on supplies. The team spent $185 on a new bat. New baseballs cost $4 each. The inequality 185 + 4b ≤ 1,000 can be used to determine the number of new baseballs (b) that the team can purchase. Which statement about the number of new baseballs that can be purchased is true?
A. The team can purchase 204 new baseballs.
B. The minimum number of new baseballs that can be purchased is 185.
C. The maximum number of new baseballs that can be purchased is 185.
D. The team can purchase 185 new baseballs, but this number is neither the maximum nor the minimum.
Standard A1.1.3.1.2
The solution set of an inequality is graphed on the number line below.
–4–5 –3 –2 –1 0 1 2
The graph shows the solution set of which inequality?
A. 2x + 5 < –1
B. 2x + 5 ≤ –1
C. 2x + 5 > –1
D. 2x + 5 ≥ –1
Pennsylvania Department of Education—Assessment Anchors and Eligible Content Page 22
MODULE 1—Operations and Linear Equations & Inequalities
Keystone Exams: Algebra I
ASSESSMENT ANCHOR
A1.1.3 Linear Inequalities
Anchor Descriptor Eligible Content
PA Common
Core
Standards
A1.1.3.2 Write, solve, and/or graph systems of linear inequalities using various methods.
A1.1.3.2.1 Write and/or solve a system of linear inequalities using graphing.Note: Limit systems to two linear inequalities.
CC.2.1.HS.F.5
CC.2.2.HS.D.7
CC.2.2.HS.D.10
A1.1.3.2.2 Interpret solutions to problems in the context of the problem situation.Note: Limit systems to two linear inequalities.
Pennsylvania Department of Education—Assessment Anchors and Eligible Content Page 23
Keystone Exams: Algebra I
MODULE 1—Operations and Linear Equations & Inequalities
Sample Exam Question
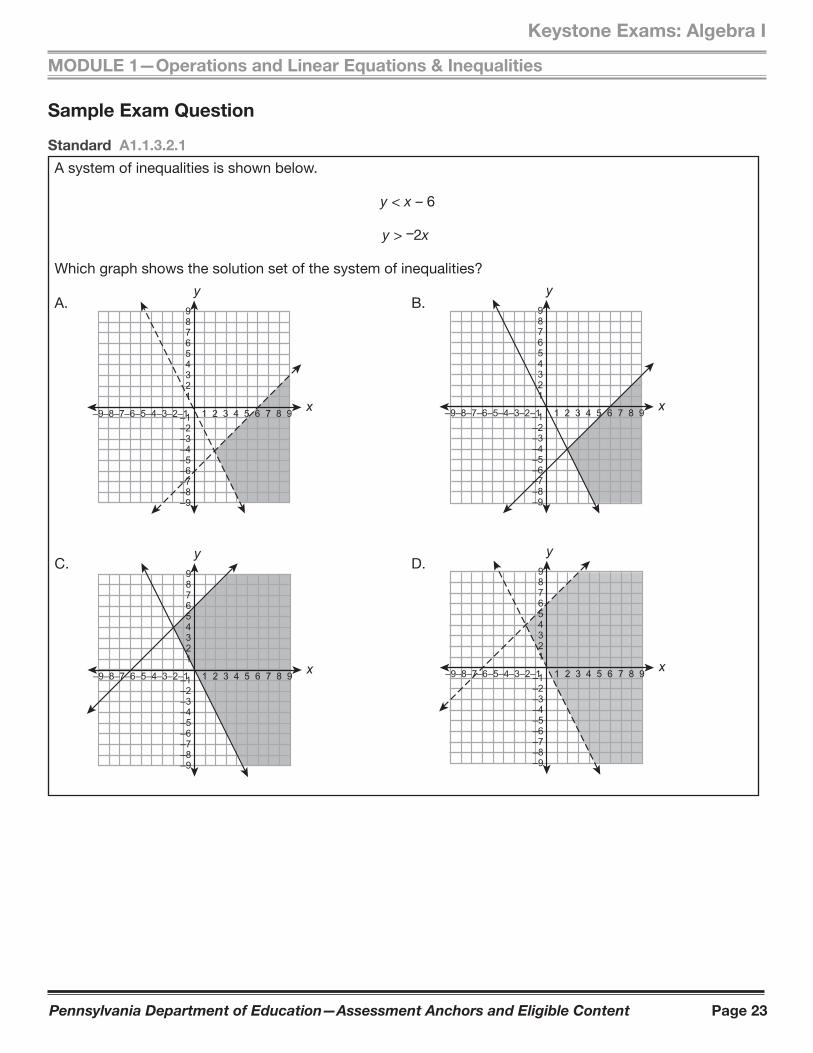
Standard A1.1.3.2.1
A system of inequalities is shown below.
y < x – 6
y > –2x
Which graph shows the solution set of the system of inequalities?
987654321
–1–2–3–4–5–6–7–8–9
1 2 3 4 5 6 7 8 9–9–8–7–6–5–4–3–2–1
y
x
987654321
–1–2–3–4–5–6–7–8–9
1 2 3 4 5 6 7 8 9–9–8–7–6–5–4–3–2–1
y
x
987654321
–1–2–3–4–5–6–7–8–9
1 2 3 4 5 6 7 8 9–9–8–7–6–5–4–3–2–1
y
x
987654321
–1–2–3–4–5–6–7–8–9
1 2 3 4 5 6 7 8 9–9–8–7–6–5–4–3–2–1
y
x
A. B.
C. D.
Pennsylvania Department of Education—Assessment Anchors and Eligible Content Page 24
MODULE 1—Operations and Linear Equations & Inequalities
Keystone Exams: Algebra I
Sample Exam Question
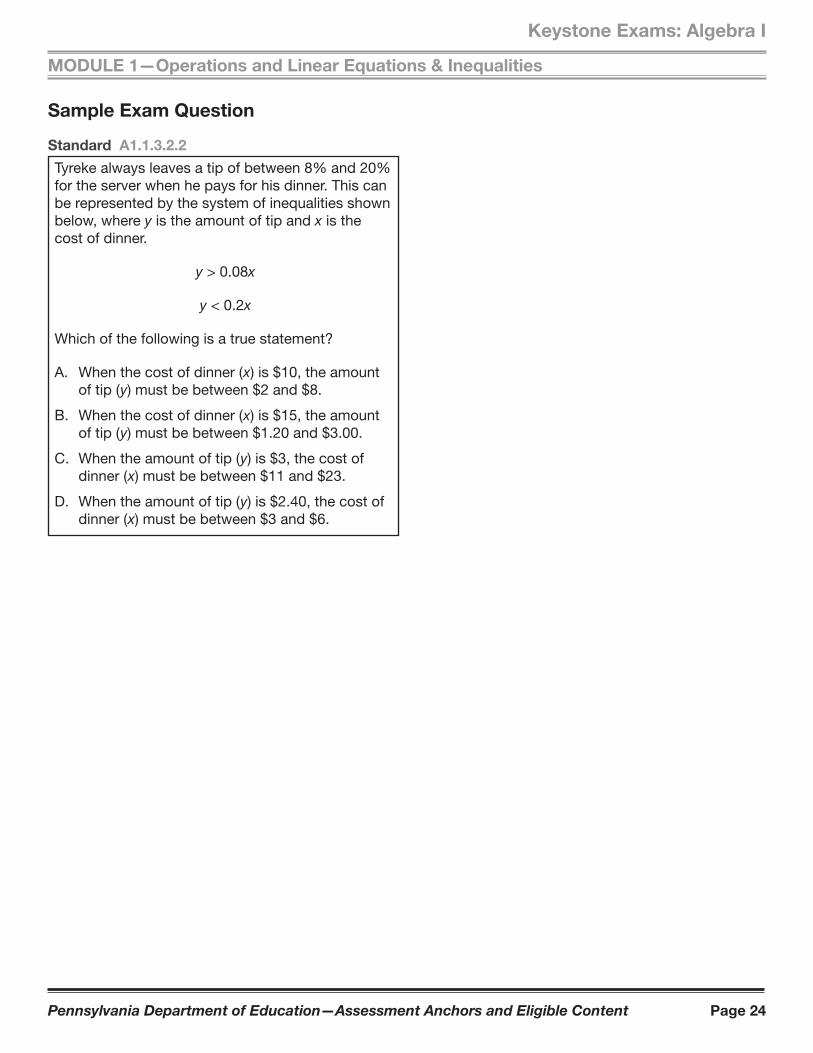
Standard A1.1.3.2.2
Tyreke always leaves a tip of between 8% and 20% for the server when he pays for his dinner. This can be represented by the system of inequalities shown below, where y is the amount of tip and x is the cost of dinner.
y > 0.08x
y < 0.2x
Which of the following is a true statement?
A. When the cost of dinner ( x) is $10, the amount of tip ( y) must be between $2 and $8.
B. When the cost of dinner ( x) is $15, the amount of tip ( y) must be between $1.20 and $3.00.
C. When the amount of tip ( y) is $3, the cost of dinner ( x) must be between $11 and $23.
D. When the amount of tip ( y) is $2.40, the cost of dinner ( x) must be between $3 and $6.
Pennsylvania Department of Education—Assessment Anchors and Eligible Content Page 25
Keystone Exams: Algebra I
MODULE 1—Operations and Linear Equations & Inequalities
Standard A1.1.3
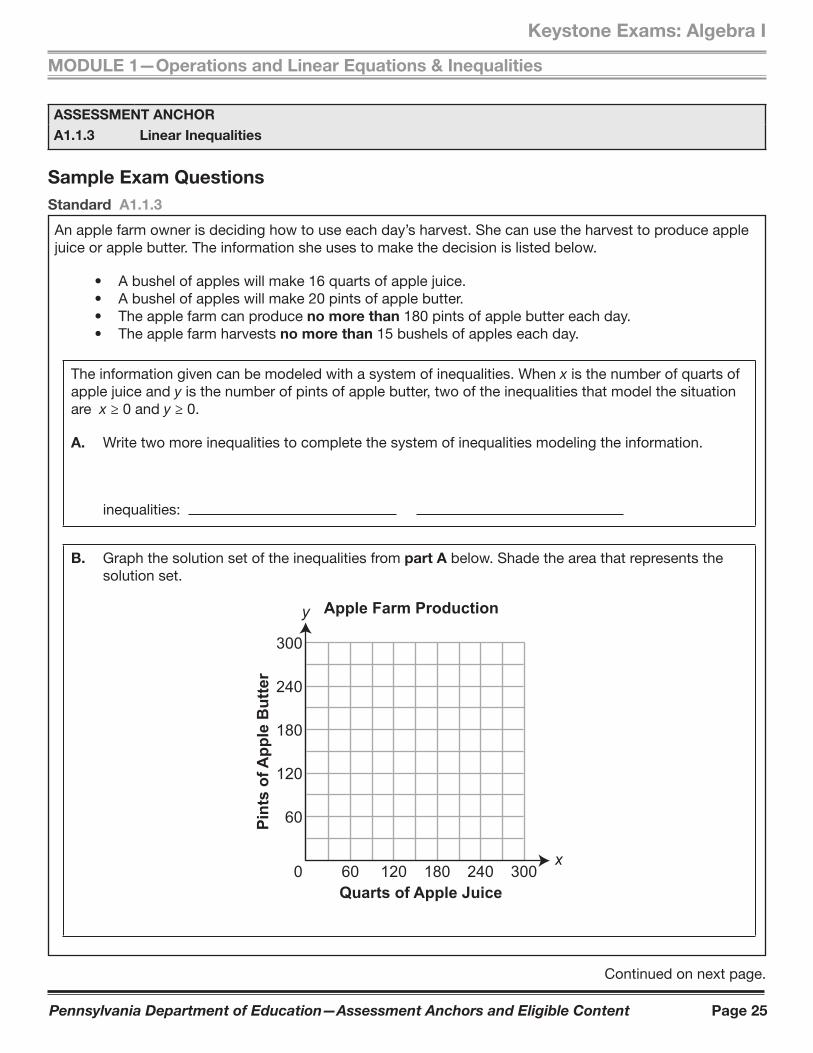
An apple farm owner is deciding how to use each day’s harvest. She can use the harvest to produce apple juice or apple butter. The information she uses to make the decision is listed below.
• A bushel of apples will make 16 quarts of apple juice. • A bushel of apples will make 20 pints of apple butter. • The apple farm can produce no more than 180 pints of apple butter each day. • The apple farm harvests no more than 15 bushels of apples each day.
The information given can be modeled with a system of inequalities. When x is the number of quarts of apple juice and y is the number of pints of apple butter, two of the inequalities that model the situation are x ≥ 0 and y ≥ 0.
A. Write two more inequalities to complete the system of inequalities modeling the information.
inequalities:
B. Graph the solution set of the inequalities from part A below. Shade the area that represents the solution set.
0Quarts of Apple Juice
Pint
s of
App
le B
utte
r
300
240
180
120
60
60 120 180 240 300
Apple Farm Production
x
y
Continued on next page.
ASSESSMENT ANCHOR
A1.1.3 Linear Inequalities
Sample Exam Questions
Pennsylvania Department of Education—Assessment Anchors and Eligible Content Page 26
MODULE 1—Operations and Linear Equations & Inequalities
Keystone Exams: Algebra I
Continued. Please refer to the previous page for task explanation.
The apple farm makes a profit of $2.25 on each pint of apple butter and $2.50 on each quart of apple juice.
C. Explain how you can be certain the maximum profit will be realized when the apple farm produces 96 quarts of apple juice and 180 pints of apple butter.
Pennsylvania Department of Education—Assessment Anchors and Eligible Content Page 27
Keystone Exams: Algebra I
MODULE 1—Operations and Linear Equations & Inequalities
Standard A1.1.3
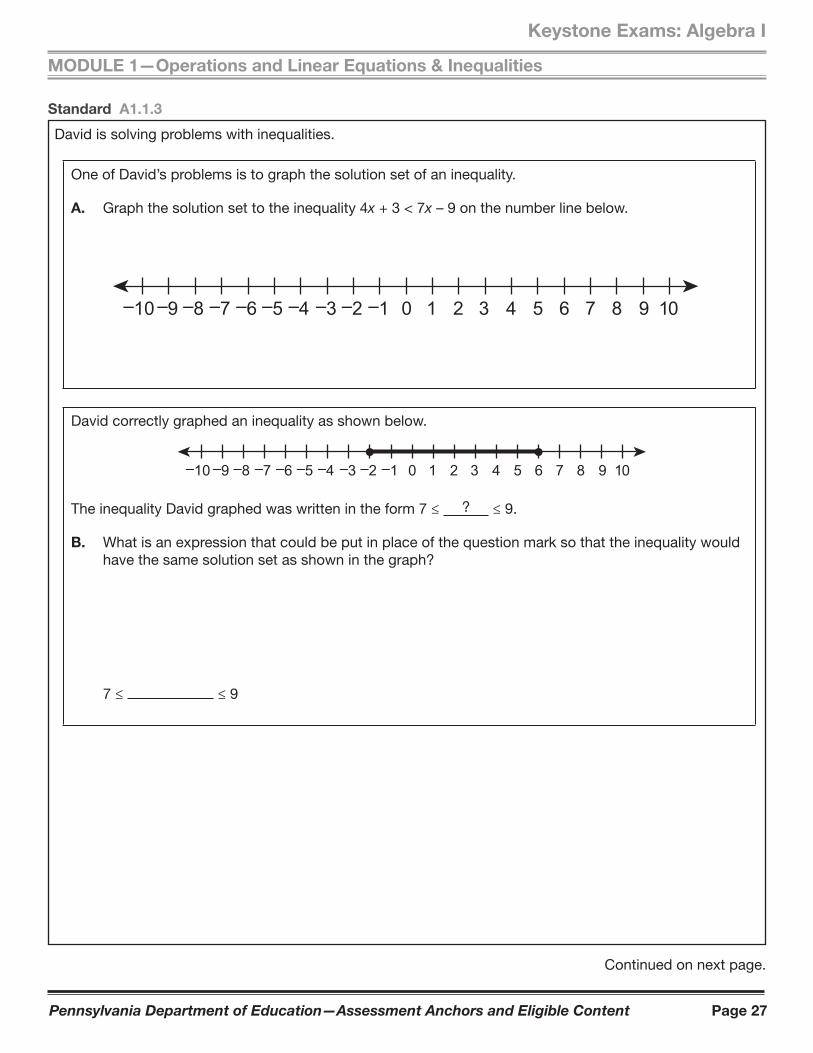
David is solving problems with inequalities.
One of David’s problems is to graph the solution set of an inequality.
A. Graph the solution set to the inequality 4x + 3 < 7x – 9 on the number line below.
–8–10 –9 –7 –6 104–5 7–2 –1 0 1 2 3 5 6 8 9–4 –3
David correctly graphed an inequality as shown below.
104 71 2 3 5 6 8 9–8–10 –9 –7 –6 –5 –2 –1 0–4 –3
The inequality David graphed was written in the form 7 ≤ ? ≤ 9.
B. What is an expression that could be put in place of the question mark so that the inequality would have the same solution set as shown in the graph?
7 ≤ ≤ 9
Continued on next page.
Pennsylvania Department of Education—Assessment Anchors and Eligible Content Page 28
MODULE 1—Operations and Linear Equations & Inequalities
Keystone Exams: Algebra I
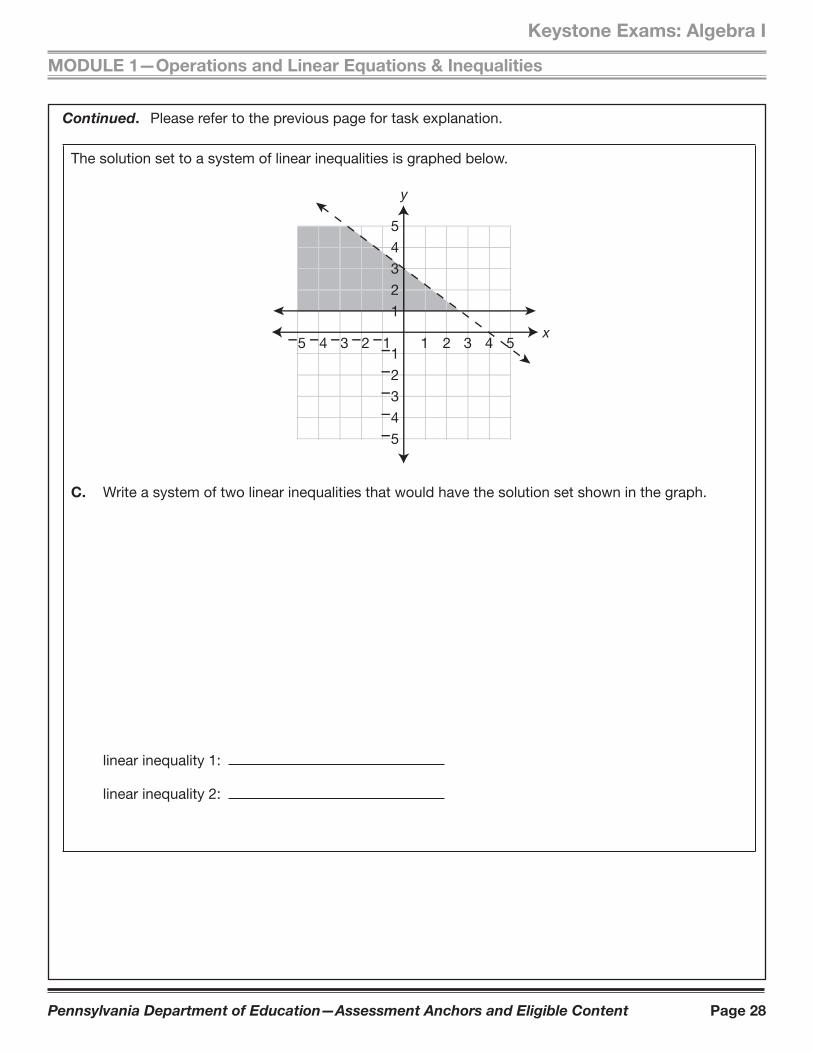
Continued. Please refer to the previous page for task explanation.
The solution set to a system of linear inequalities is graphed below.
x
y
1 2 3 4 5–5 –4 –3 –2 –1
54321
–1–2–3–4–5
C. Write a system of two linear inequalities that would have the solution set shown in the graph.
linear inequality 1:
linear inequality 2:
Pennsylvania Department of Education—Assessment Anchors and Eligible Content Page 29
Keystone Exams: Algebra I
MODULE 2—Linear Functions and Data Organizations
ASSESSMENT ANCHOR
A1.2.1 Functions
Anchor Descriptor Eligible Content
PA Common
Core
Standards
A1.2.1.1 Analyze and/or use patterns or relations.
A1.2.1.1.1 Analyze a set of data for the existence of a pattern and represent the pattern algebraically and/or graphically.
CC.2.2.8.C.1
CC.2.2.8.C.2
CC.2.2.HS.C.1
CC.2.2.HS.C.2
CC.2.2.HS.C.3
CC.2.4.HS.B.2
A1.2.1.1.2 Determine whether a relation is a function, given a set of points or a graph.
A1.2.1.1.3 Identify the domain or range of a relation (may be presented as ordered pairs, a graph, or a table).
Sample Exam Question
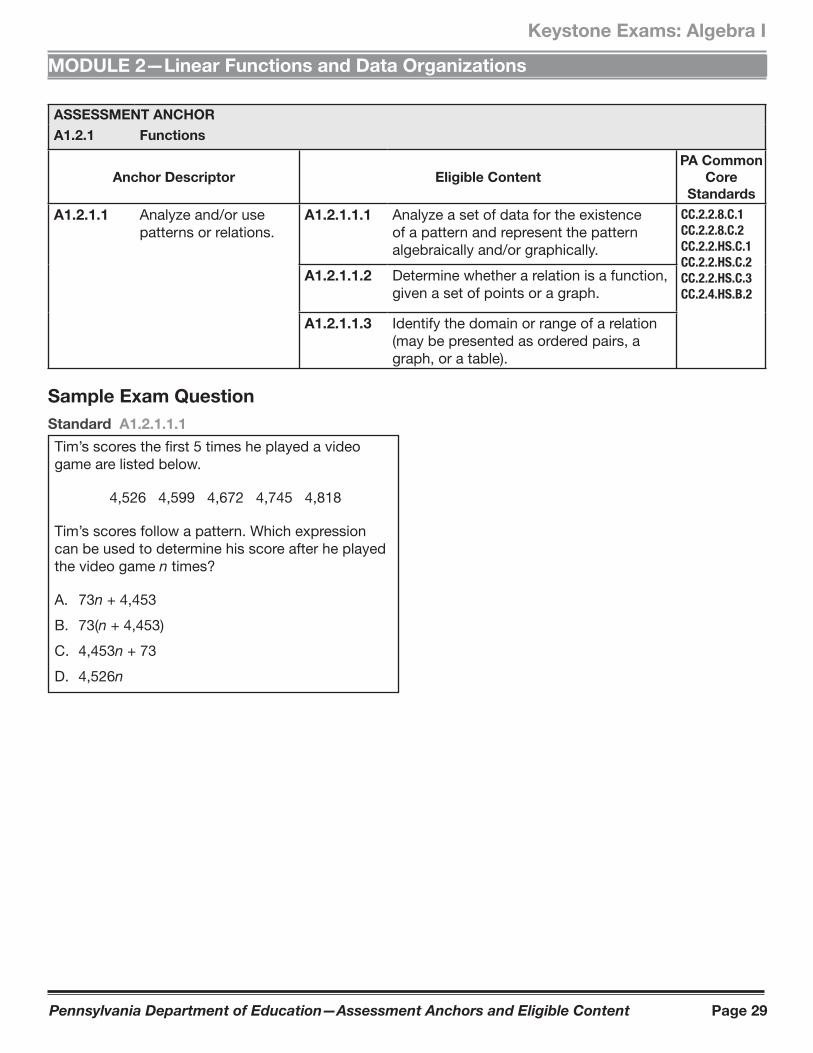
Standard A1.2.1.1.1
Tim’s scores the first 5 times he played a video game are listed below.
4,526 4,599 4,672 4,745 4,818
Tim’s scores follow a pattern. Which expression can be used to determine his score after he played the video game n times?
A. 73n + 4,453
B. 73(n + 4,453)
C. 4,453n + 73
D. 4,526n
Pennsylvania Department of Education—Assessment Anchors and Eligible Content Page 30
Keystone Exams: Algebra I
MODULE 2—Linear Functions and Data Organizations
Sample Exam Question
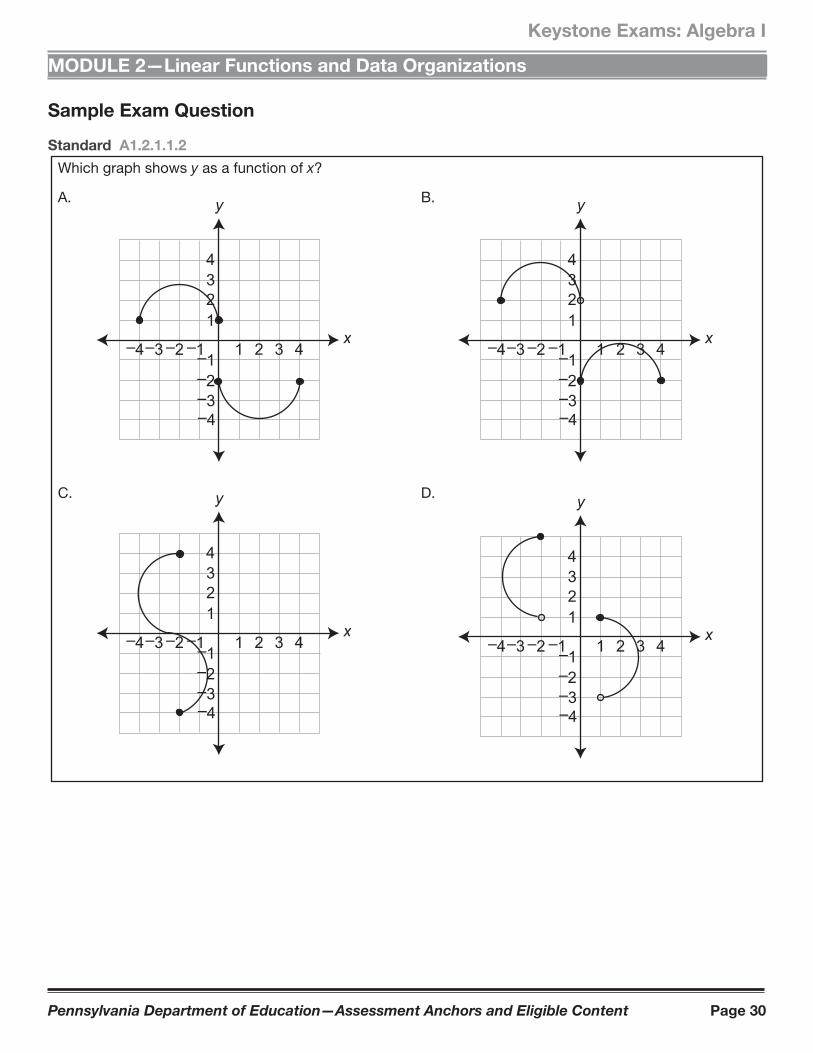
Standard A1.2.1.1.2
Which graph shows y as a function of x?
x
y
21 3 4–2–3–4
–4–3–2
1234
–1–1
x
y
21 3 4–2–3–4
–4–3–2
1234
–1–1
x
y
21 3 4–2–3–4
–4–3–2
1234
–1–1 x
y
21 3 4–2–3–4
–4–3–2
1234
–1–1
A. B.
C. D.
Pennsylvania Department of Education—Assessment Anchors and Eligible Content Page 31
Keystone Exams: Algebra I
MODULE 2—Linear Functions and Data Organizations
Sample Exam Question
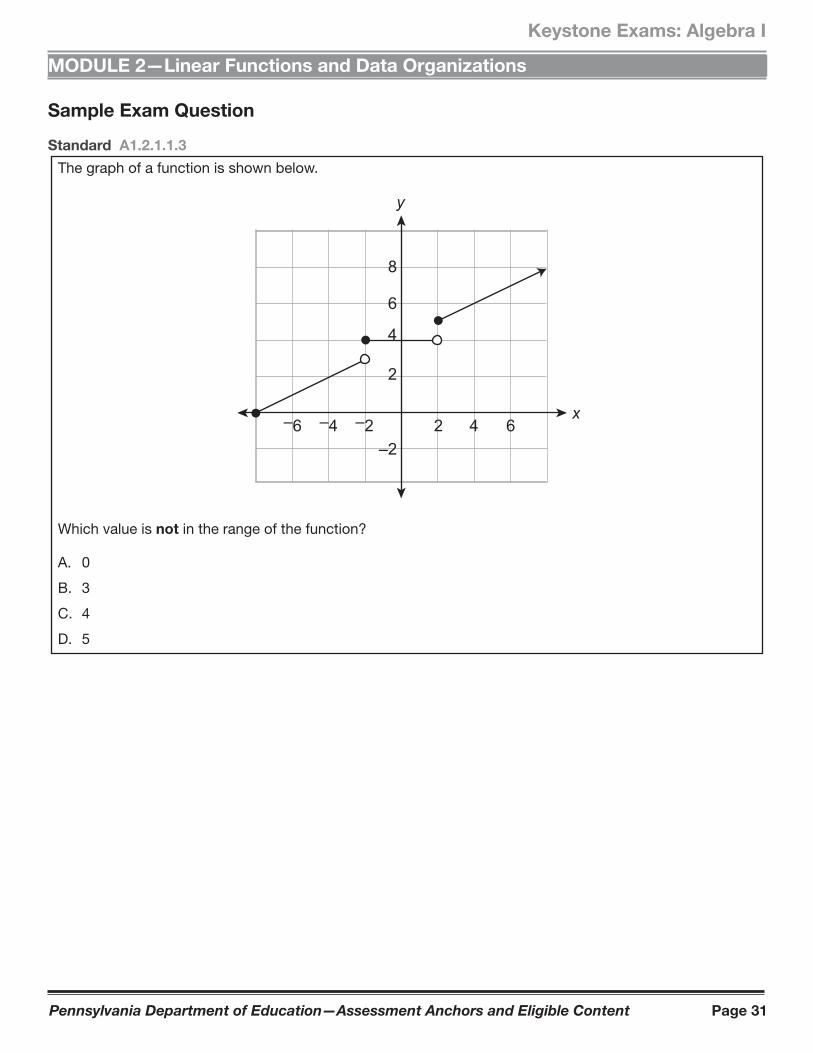
Standard A1.2.1.1.3
The graph of a function is shown below.
x2 4 6–6 –4 –2
8
6
4
2
–2
y
Which value is not in the range of the function?
A. 0
B. 3
C. 4
D. 5
Pennsylvania Department of Education—Assessment Anchors and Eligible Content Page 32
Keystone Exams: Algebra I
MODULE 2—Linear Functions and Data Organizations
ASSESSMENT ANCHOR
A1.2.1 Functions
Anchor Descriptor Eligible Content
PA Common
Core
Standards
A1.2.1.2 Interpret and/or use linear functions and their equations, graphs, or tables.
A1.2.1.2.1 Create, interpret, and/or use the equation, graph, or table of a linear function.
CC.2.1.HS.F.3
CC.2.1.HS.F.4
CC.2.2.8.B.2
CC.2.2.8.C.1
CC.2.2.8.C.2
CC.2.2.HS.C.2
CC.2.2.HS.C.3
CC.2.2.HS.C.4
CC.2.2.HS.C.6
CC.2.4.HS.B.2
A1.2.1.2.2 Translate from one representation of a linear function to another (i.e., graph, table, and equation).
Sample Exam Questions
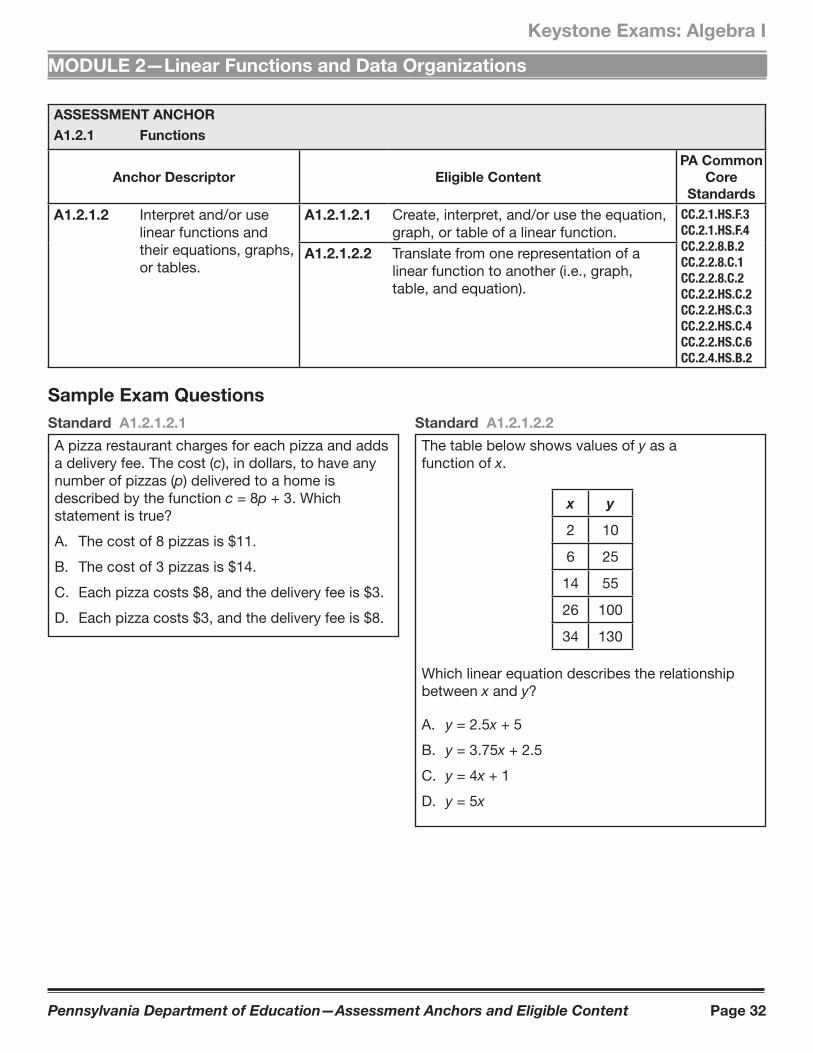
Standard A1.2.1.2.1
A pizza restaurant charges for each pizza and adds a delivery fee. The cost (c), in dollars, to have any number of pizzas (p) delivered to a home is described by the function c = 8p + 3. Which statement is true?
A. The cost of 8 pizzas is $11.
B. The cost of 3 pizzas is $14.
C. Each pizza costs $8, and the delivery fee is $3.
D. Each pizza costs $3, and the delivery fee is $8.
Standard A1.2.1.2.2
The table below shows values of y as a function of x.
x y
2 10
6 25
14 55
26 100
34 130
Which linear equation describes the relationship between x and y?
A. y = 2.5x + 5
B. y = 3.75x + 2.5
C. y = 4x + 1
D. y = 5x
Pennsylvania Department of Education—Assessment Anchors and Eligible Content Page 33
Keystone Exams: Algebra I
MODULE 2—Linear Functions and Data Organizations
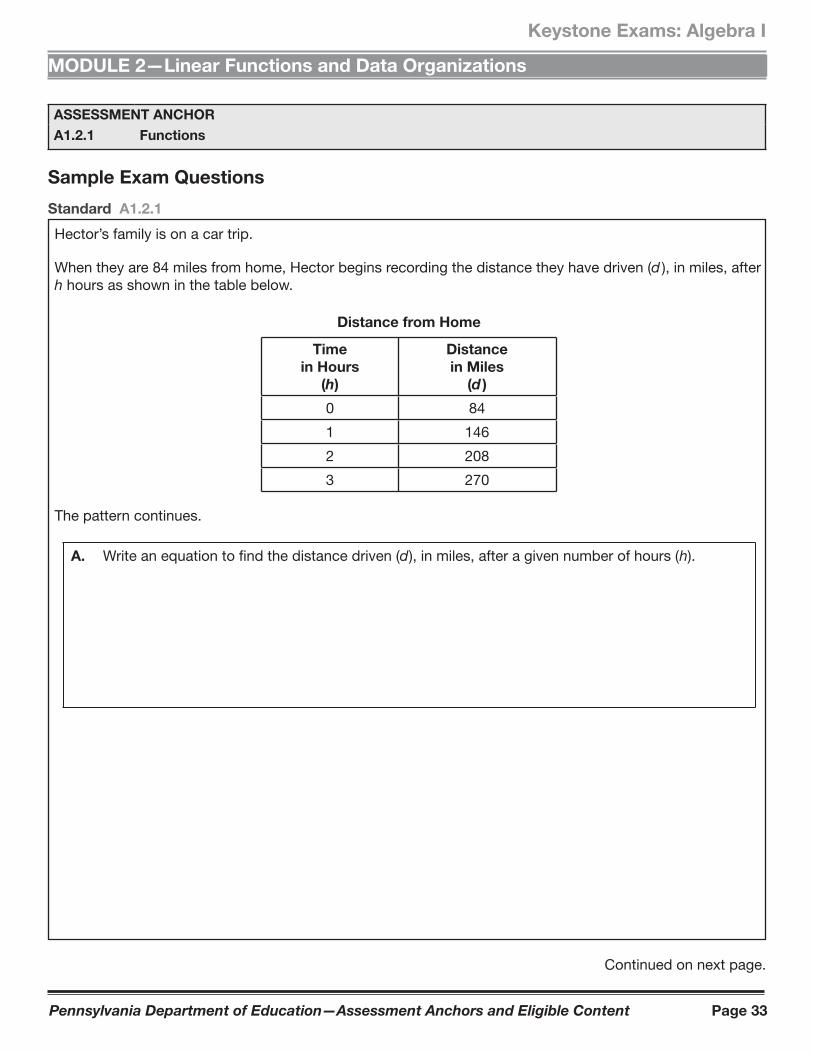
Standard A1.2.1
Hector’s family is on a car trip.
When they are 84 miles from home, Hector begins recording the distance they have driven (d ), in miles, after h hours as shown in the table below.
Distance from Home
Time
in Hours
(h)
Distance
in Miles
(d )
0 84
1 146
2 208
3 270
The pattern continues.
A. Write an equation to find the distance driven (d ), in miles, after a given number of hours ( h).
Continued on next page.
ASSESSMENT ANCHOR
A1.2.1 Functions
Sample Exam Questions
Pennsylvania Department of Education—Assessment Anchors and Eligible Content Page 34
Keystone Exams: Algebra I
MODULE 2—Linear Functions and Data Organizations
Continued. Please refer to the previous page for task explanation.
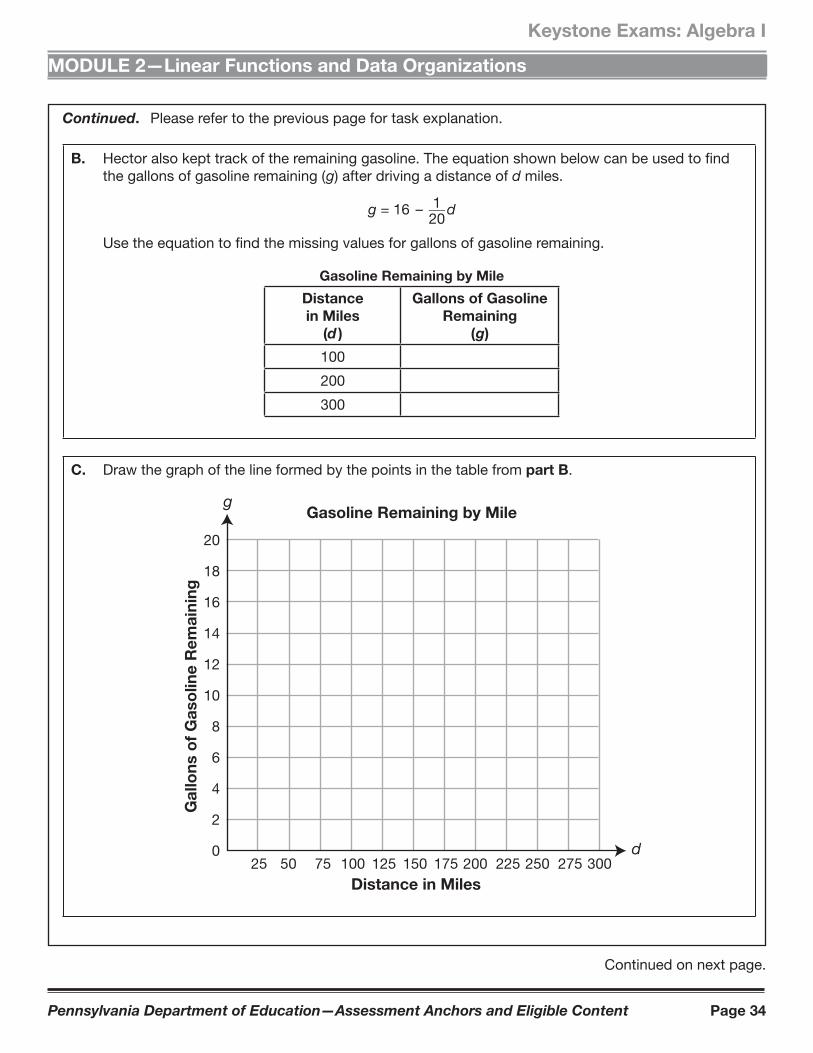
B. Hector also kept track of the remaining gasoline. The equation shown below can be used to find the gallons of gasoline remaining ( g) after driving a distance of d miles.
g = 16 – 1 } 20
d
Use the equation to find the missing values for gallons of gasoline remaining.
Gasoline Remaining by Mile
Distance
in Miles
(d )
Gallons of Gasoline
Remaining
( g)
100
200
300
C. Draw the graph of the line formed by the points in the table from part B.
g
d25 50 75 100 125 150 175 200 225 250 275 300
20
18
16
14
12
10
8
6
4
2
0
Gasoline Remaining by Mile
Ga
llo
ns o
f G
aso
lin
e R
em
ain
ing
Distance in Miles
Continued on next page.
Pennsylvania Department of Education—Assessment Anchors and Eligible Content Page 35
Keystone Exams: Algebra I
MODULE 2—Linear Functions and Data Organizations
Continued. Please refer to the previous page for task explanation.
D. Explain why the slope of the line drawn in part C must be negative.
Pennsylvania Department of Education—Assessment Anchors and Eligible Content Page 36
Keystone Exams: Algebra I
MODULE 2—Linear Functions and Data Organizations
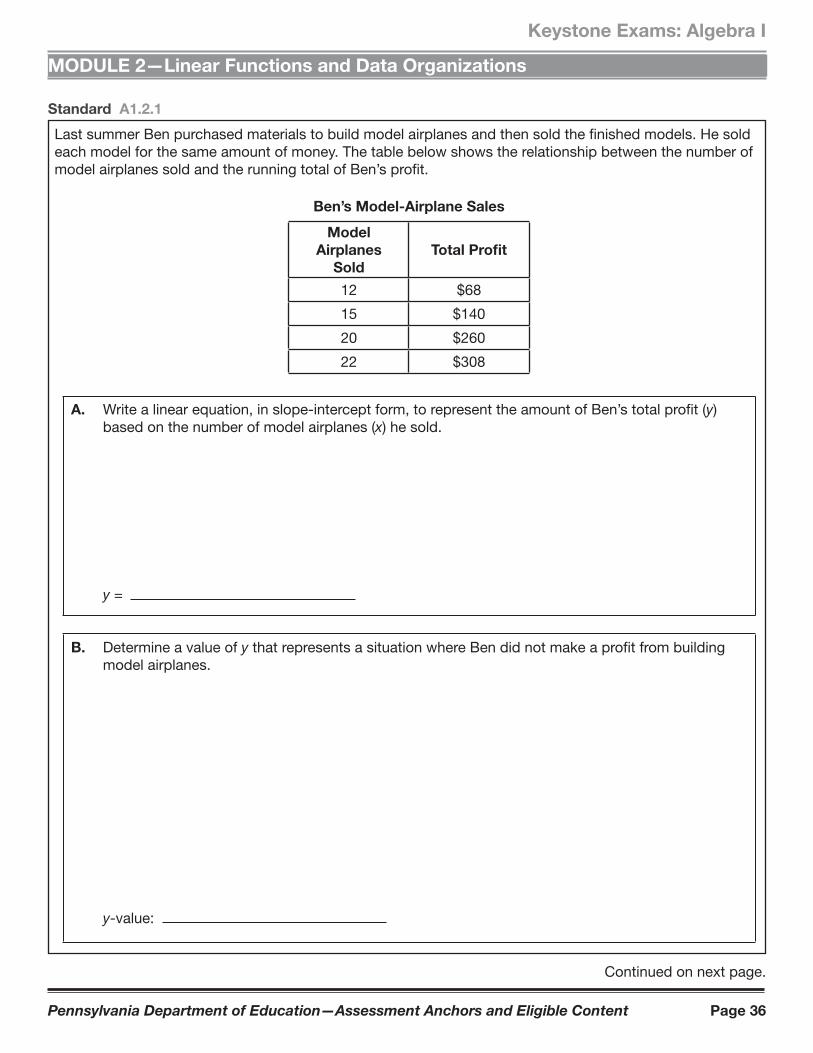
Standard A1.2.1
Last summer Ben purchased materials to build model airplanes and then sold the finished models. He sold each model for the same amount of money. The table below shows the relationship between the number of model airplanes sold and the running total of Ben’s profit.
Ben’s Model-Airplane Sales
Model
Airplanes
Sold
Total Profi t
12 $68
15 $140
20 $260
22 $308
A. Write a linear equation, in slope-intercept form, to represent the amount of Ben’s total profit (y) based on the number of model airplanes (x) he sold.
y =
B. Determine a value of y that represents a situation where Ben did not make a profit from building model airplanes.
y-value:
Continued on next page.
Pennsylvania Department of Education—Assessment Anchors and Eligible Content Page 37
Keystone Exams: Algebra I
MODULE 2—Linear Functions and Data Organizations
Continued. Please refer to the previous page for task explanation.
C. How much did Ben spend on the materials he needed to build his models?
$
D. What is the least number of model airplanes Ben needed to sell in order to make a profit?
least number:
Pennsylvania Department of Education—Assessment Anchors and Eligible Content Page 38
Keystone Exams: Algebra I
MODULE 2—Linear Functions and Data Organizations
ASSESSMENT ANCHOR
A1.2.2 Coordinate Geometry
Anchor Descriptor Eligible Content
PA Common
Core
Standards
A1.2.2.1 Describe, compute, and/or use the rate of change (slope) of a line.
A1.2.2.1.1 Identify, describe, and/or use constant rates of change.
CC.2.2.8.C.2
CC.2.2.HS.C.1
CC.2.2.HS.C.2
CC.2.2.HS.C.3
CC.2.2.HS.C.5
CC.2.2.HS.C.6
CC.2.4.HS.B.1
A1.2.2.1.2 Apply the concept of linear rate of change (slope) to solve problems.
A1.2.2.1.3 Write or identify a linear equation when given • the graph of the line, • two points on the line, or • the slope and a point on the line.
Note: Linear equation may be in point-slope, standard, and/or slope-intercept form.
A1.2.2.1.4 Determine the slope and/or y-intercept represented by a linear equation or graph.
Sample Exam Questions
Standard A1.2.2.1.1
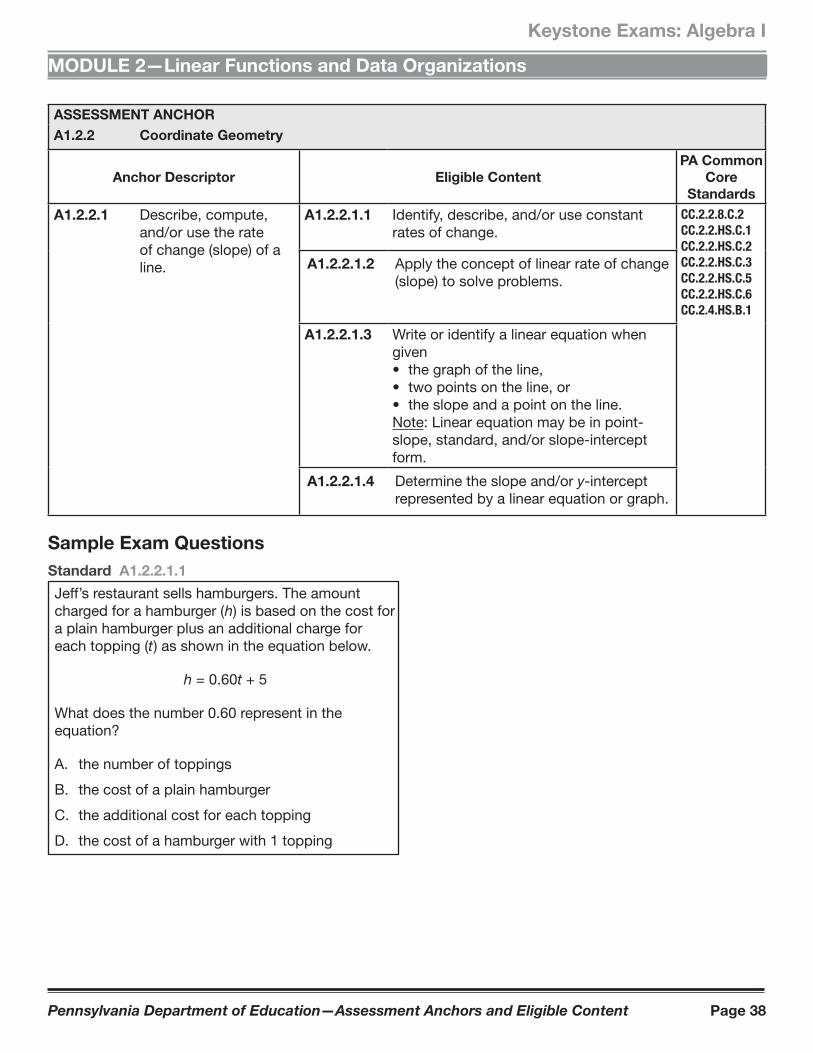
Jeff’s restaurant sells hamburgers. The amount charged for a hamburger ( h) is based on the cost for a plain hamburger plus an additional charge for each topping (t ) as shown in the equation below.
h = 0.60t + 5
What does the number 0.60 represent in the equation?
A. the number of toppings
B. the cost of a plain hamburger
C. the additional cost for each topping
D. the cost of a hamburger with 1 topping
Pennsylvania Department of Education—Assessment Anchors and Eligible Content Page 39
Keystone Exams: Algebra I
MODULE 2—Linear Functions and Data Organizations
Sample Exam Questions
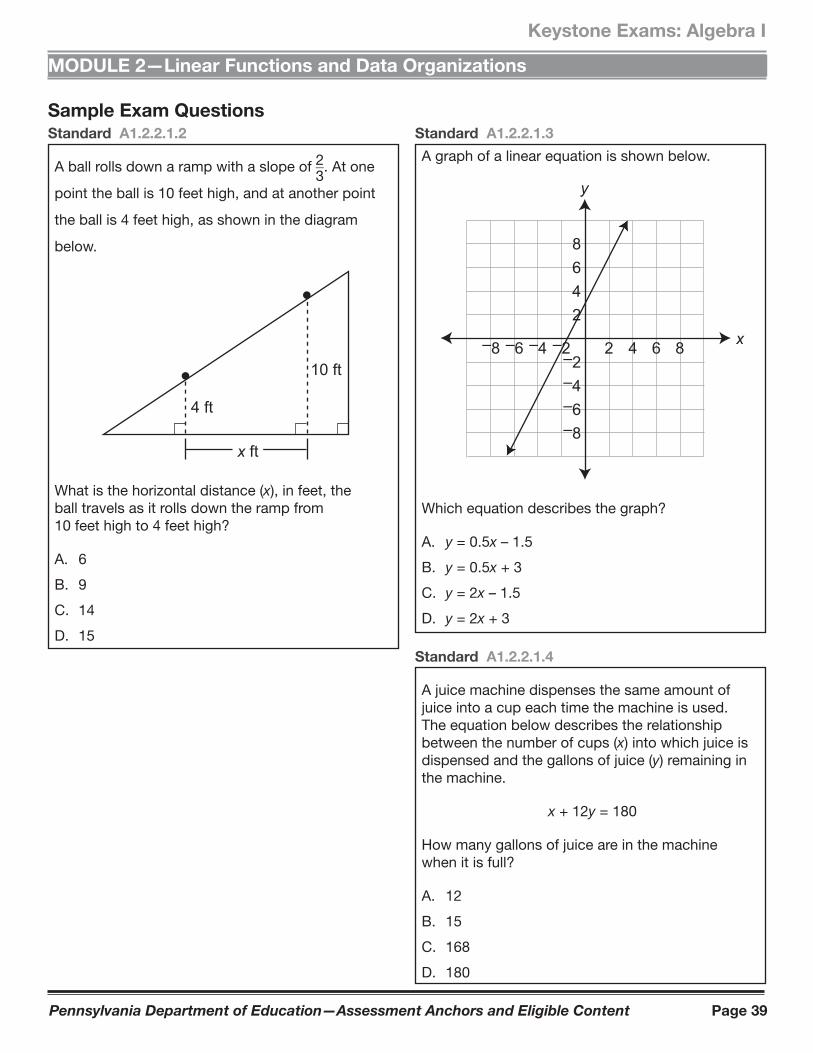
Standard A1.2.2.1.2
A ball rolls down a ramp with a slope of 2 } 3 . At one
point the ball is 10 feet high, and at another point
the ball is 4 feet high, as shown in the diagram
below.
x ft
4 ft
10 ft
What is the horizontal distance (x), in feet, the ball travels as it rolls down the ramp from 10 feet high to 4 feet high?
A. 6
B. 9
C. 14
D. 15
Standard A1.2.2.1.3
A graph of a linear equation is shown below.
x
y
8642
–2–4–6–8
2 4 6 8–8 –6 –4 –2
Which equation describes the graph?
A. y = 0.5x – 1.5
B. y = 0.5x + 3
C. y = 2x – 1.5
D. y = 2x + 3
Standard A1.2.2.1.4
A juice machine dispenses the same amount of juice into a cup each time the machine is used. The equation below describes the relationship between the number of cups (x) into which juice is dispensed and the gallons of juice (y) remaining in the machine.
x + 12y = 180
How many gallons of juice are in the machine when it is full?
A. 12
B. 15
C. 168
D. 180
Pennsylvania Department of Education—Assessment Anchors and Eligible Content Page 40
Keystone Exams: Algebra I
MODULE 2—Linear Functions and Data Organizations
ASSESSMENT ANCHOR
A1.2.2 Coordinate Geometry
Anchor Descriptor Eligible Content
PA Common
Core
Standards
A1.2.2.2 Analyze and/or interpret data on a scatter plot.
A1.2.2.2.1 Draw, identify, fi nd, and/or write an equation for a line of best fi t for a scatter plot.
CC.2.2.HS.C.6
CC.2.4.8.B.1
CC.2.4.HS.B.2
CC.2.4.HS.B.3
Sample Exam Questions
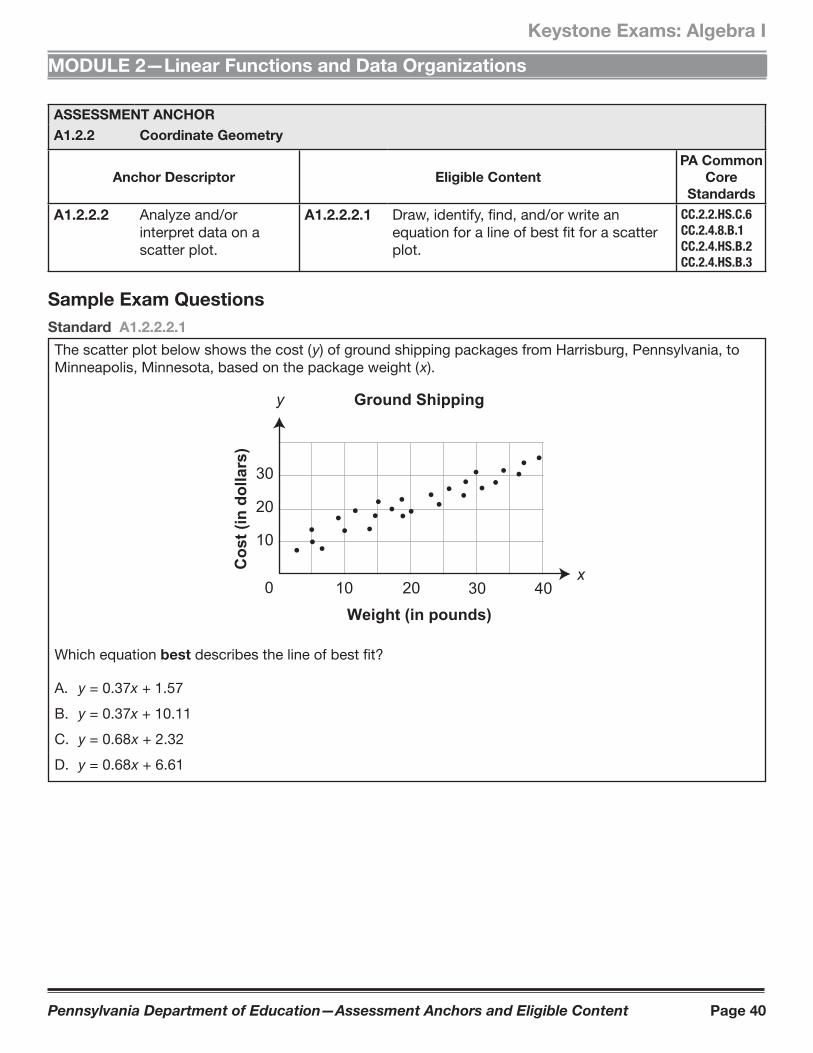
Standard A1.2.2.2.1
The scatter plot below shows the cost ( y) of ground shipping packages from Harrisburg, Pennsylvania, to Minneapolis, Minnesota, based on the package weight ( x).
x
y
Weight (in pounds)
Cos
t (in
dol
lars
)
10 20 30 40
Ground Shipping
0
30
20
10
Which equation best describes the line of best fit?
A. y = 0.37x + 1.57
B. y = 0.37x + 10.11
C. y = 0.68 x + 2.32
D. y = 0.68 x + 6.61
Pennsylvania Department of Education—Assessment Anchors and Eligible Content Page 41
Keystone Exams: Algebra I
MODULE 2—Linear Functions and Data Organizations
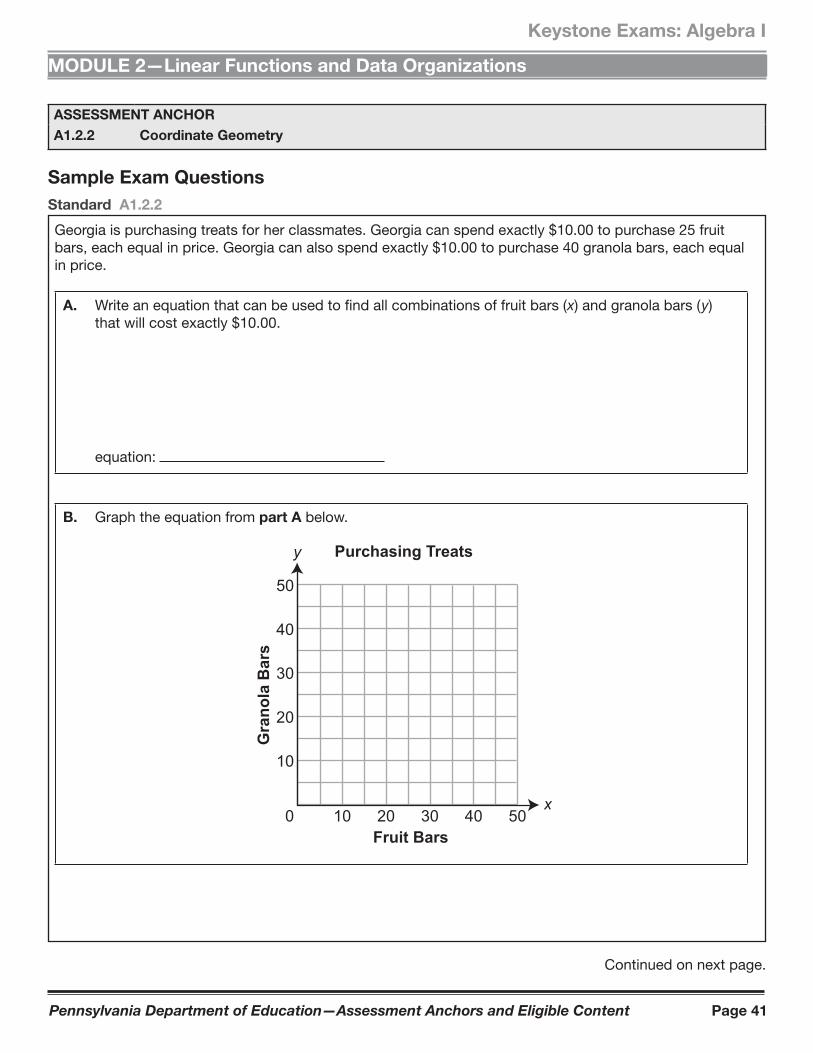
Standard A1.2.2
Georgia is purchasing treats for her classmates. Georgia can spend exactly $10.00 to purchase 25 fruit bars, each equal in price. Georgia can also spend exactly $10.00 to purchase 40 granola bars, each equal in price.
A. Write an equation that can be used to find all combinations of fruit bars ( x) and granola bars ( y) that will cost exactly $10.00.
equation:
B. Graph the equation from part A below.
Fruit Bars0
Gra
nola
Bar
s
50
40
30
20
10
10 20 30 40 50
Purchasing Treats
x
y
Continued on next page.
ASSESSMENT ANCHOR
A1.2.2 Coordinate Geometry
Sample Exam Questions
Pennsylvania Department of Education—Assessment Anchors and Eligible Content Page 42
Keystone Exams: Algebra I
MODULE 2—Linear Functions and Data Organizations
Continued. Please refer to the previous page for task explanation.
C. What is the slope of the line graphed in part B?
slope:
D. Explain what the slope from part C means in the context of Georgia purchasing treats.
Pennsylvania Department of Education—Assessment Anchors and Eligible Content Page 43
Keystone Exams: Algebra I
MODULE 2—Linear Functions and Data Organizations
Standard A1.2.2
Ahava is traveling on a train.
The train is going at a constant speed of 80 miles per hour.
A. How many hours will it take for the train to travel 1,120 miles?
hours:
Ahava also considered taking an airplane. The airplane can travel the same 1,120 miles in 12 hours less time than it takes the train.
B. What is the speed of the airplane in miles per hour (mph)?
speed of the airplane: mph
Continued on next page.
Pennsylvania Department of Education—Assessment Anchors and Eligible Content Page 44
Keystone Exams: Algebra I
MODULE 2—Linear Functions and Data Organizations
Continued. Please refer to the previous page for task explanation.
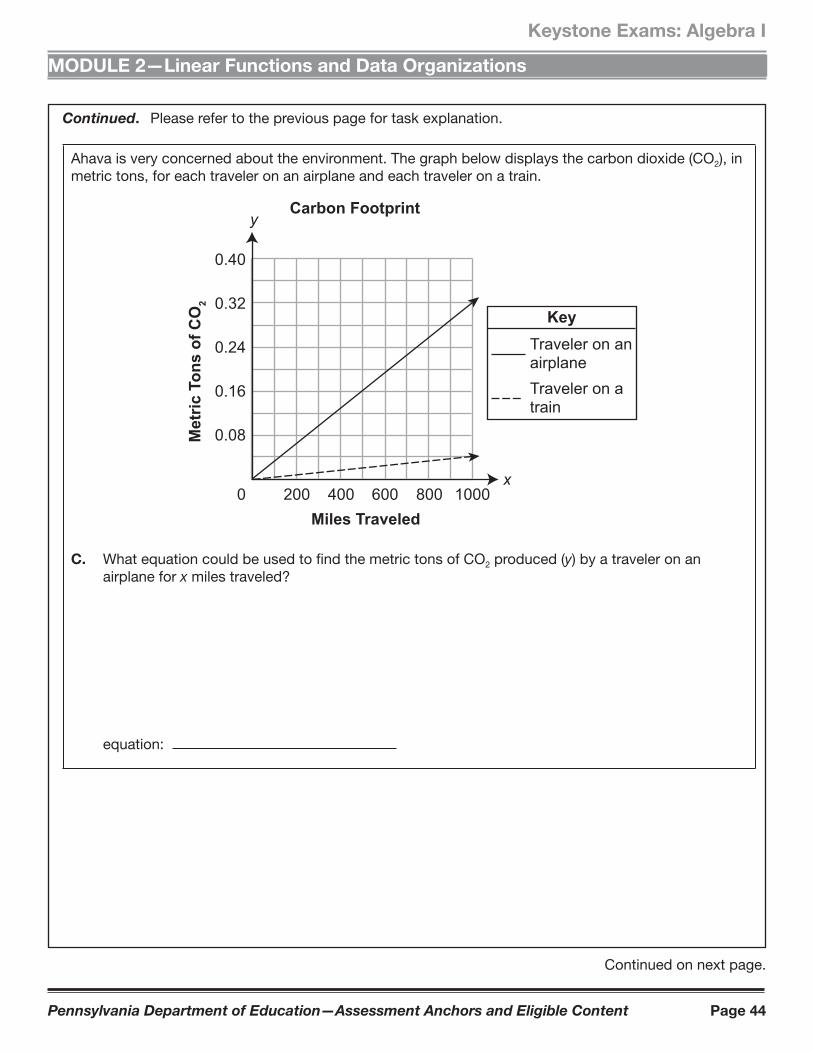
Ahava is very concerned about the environment. The graph below displays the carbon dioxide (CO2), in metric tons, for each traveler on an airplane and each traveler on a train.
0Miles Traveled
Met
ric T
ons
of C
O2
x
y
0.40
0.32
0.24
0.16
0.08
200 400 600 800 1000
Carbon Footprint
KeyTraveler on anairplaneTraveler on atrain
C. What equation could be used to find the metric tons of CO2 produced (y) by a traveler on an airplane for x miles traveled?
equation:
Continued on next page.
Pennsylvania Department of Education—Assessment Anchors and Eligible Content Page 45
Keystone Exams: Algebra I
MODULE 2—Linear Functions and Data Organizations
Continued. Please refer to the previous page for task explanation.
On another trip, Ahava traveled to her destination on a train and returned home on an airplane. Her total carbon footprint for the trip was 0.42 metric tons of CO2 produced.
D. How far, in miles, is Ahava’s destination from her home?
miles:
Pennsylvania Department of Education—Assessment Anchors and Eligible Content Page 46
Keystone Exams: Algebra I
MODULE 2—Linear Functions and Data Organizations
ASSESSMENT ANCHOR
A1.2.3 Data Analysis
Anchor Descriptor Eligible Content
PA Common
Core
Standards
A1.2.3.1 Use measures of dispersion to describe a set of data.
A1.2.3.1.1 Calculate and/or interpret the range, quartiles, and interquartile range of data.
CC.2.4.HS.B.1
CC.2.4.HS.B.3
Sample Exam Question
Standard A1.2.3.1.1
The daily high temperatures, in degrees Fahrenheit (°F), of a town are recorded for one year. The median high temperature is 62°F. The interquartile range of high temperatures is 32. Which statement is most likely true?
A. Approximately 25% of the days had a high temperature less than 30°F.
B. Approximately 25% of the days had a high temperature greater than 62°F.
C. Approximately 50% of the days had a high temperature greater than 62°F.
D. Approximately 75% of the days had a high temperature less than 94°F.
Pennsylvania Department of Education—Assessment Anchors and Eligible Content Page 47
Keystone Exams: Algebra I
MODULE 2—Linear Functions and Data Organizations
ASSESSMENT ANCHOR
A1.2.3 Data Analysis
Anchor Descriptor Eligible Content
PA Common
Core
Standards
A1.2.3.2 Use data displays in problem-solving settings and/or to make predictions.
A1.2.3.2.1 Estimate or calculate to make predictions based on a circle, line, bar graph, measure of central tendency, or other representation.
CC.2.4.HS.B.1
CC.2.4.HS.B.3
CC.2.4.HS.B.5
A1.2.3.2.2 Analyze data, make predictions, and/or answer questions based on displayed data (box-and-whisker plots, stem-and-leaf plots, scatter plots, measures of central tendency, or other representations).
A1.2.3.2.3 Make predictions using the equations or graphs of best-fi t lines of scatter plots.
Sample Exam Questions
Standard A1.2.3.2.1
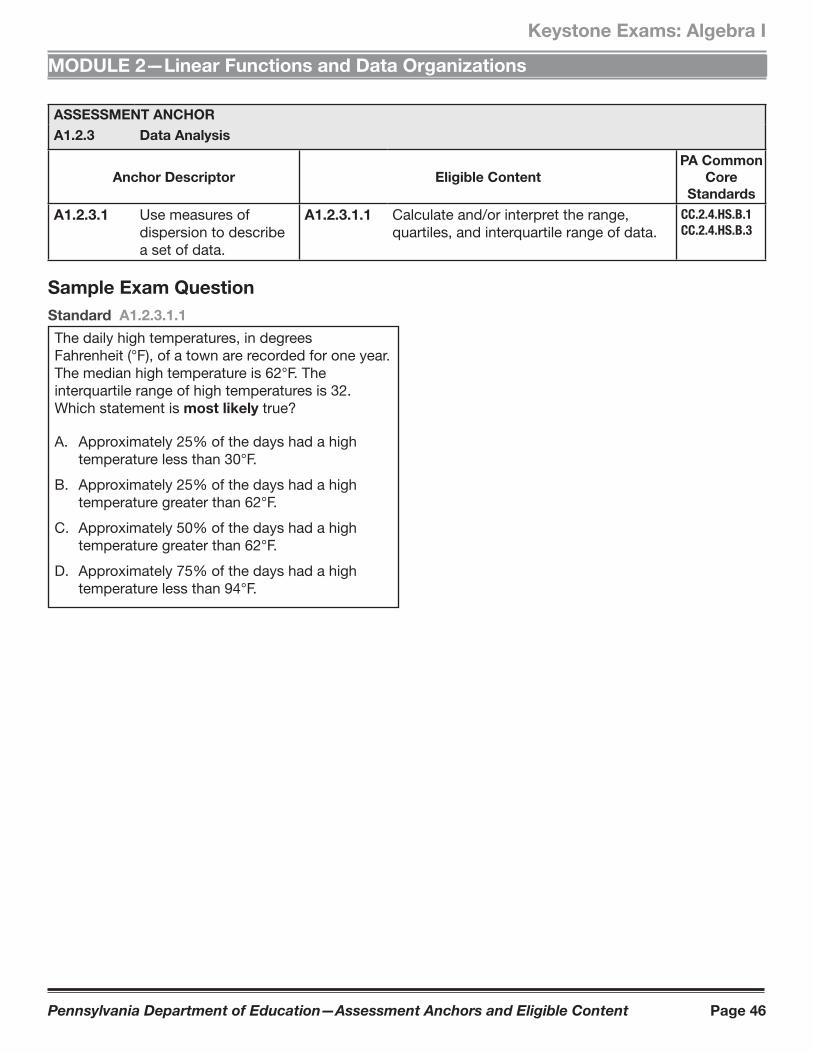
Vy asked 200 students to select their favorite sport and then recorded the results in the bar graph below.
Favorite Sport
Sports
Vote
s
8070605040302010
0football basketball baseball hockey volleyball track
and field
Vy will ask another 80 students to select their favorite sport. Based on the information in the bar graph, how many more students of the next 80 asked are likely to select basketball rather than football as their favorite sport?
A. 10
B. 20
C. 25
D. 30
Pennsylvania Department of Education—Assessment Anchors and Eligible Content Page 48
Keystone Exams: Algebra I
MODULE 2—Linear Functions and Data Organizations
Sample Exam Questions
Standard A1.2.3.2.2
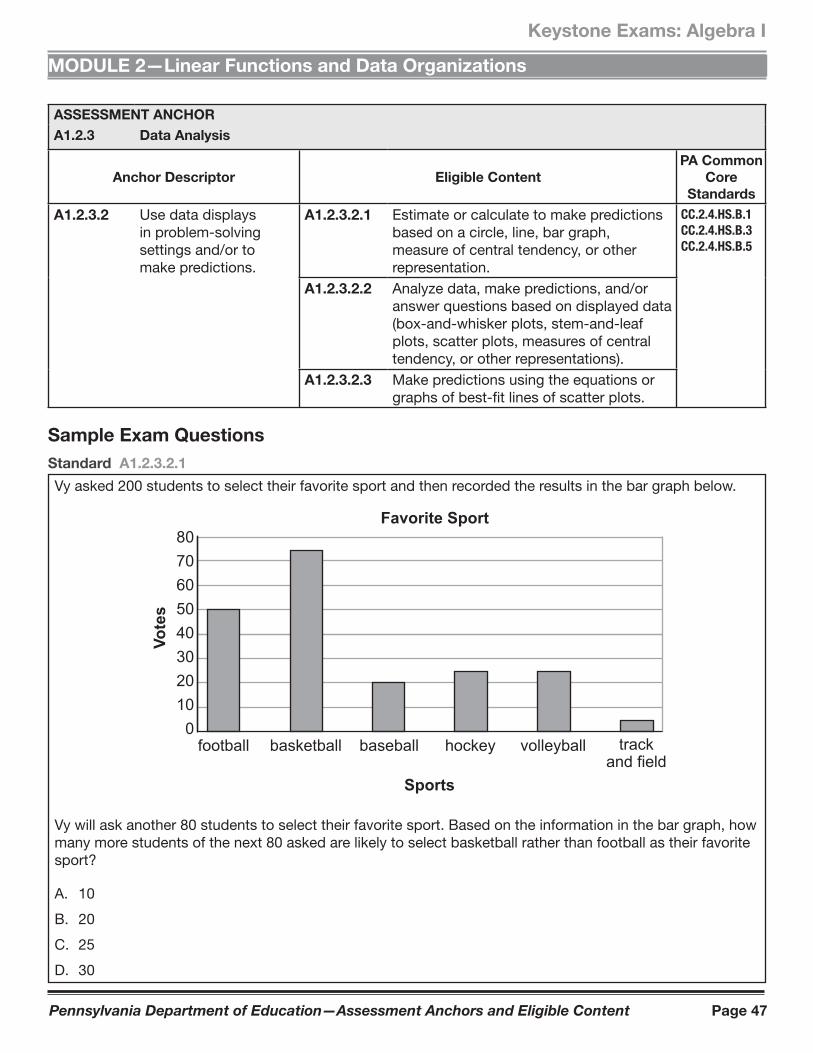
The points scored by a football team are shown in the stem-and-leaf plot below.
Football-Team Points
0123
6 2 3 4 7 0 3 4 4 7 8 8 80 7 8
Key1 | 3 = 13 points
What was the median number of points scored by the football team?
A. 24
B. 27
C. 28
D. 32
Pennsylvania Department of Education—Assessment Anchors and Eligible Content Page 49
Keystone Exams: Algebra I
MODULE 2—Linear Functions and Data Organizations
Sample Exam Questions
Standard A1.2.3.2.3
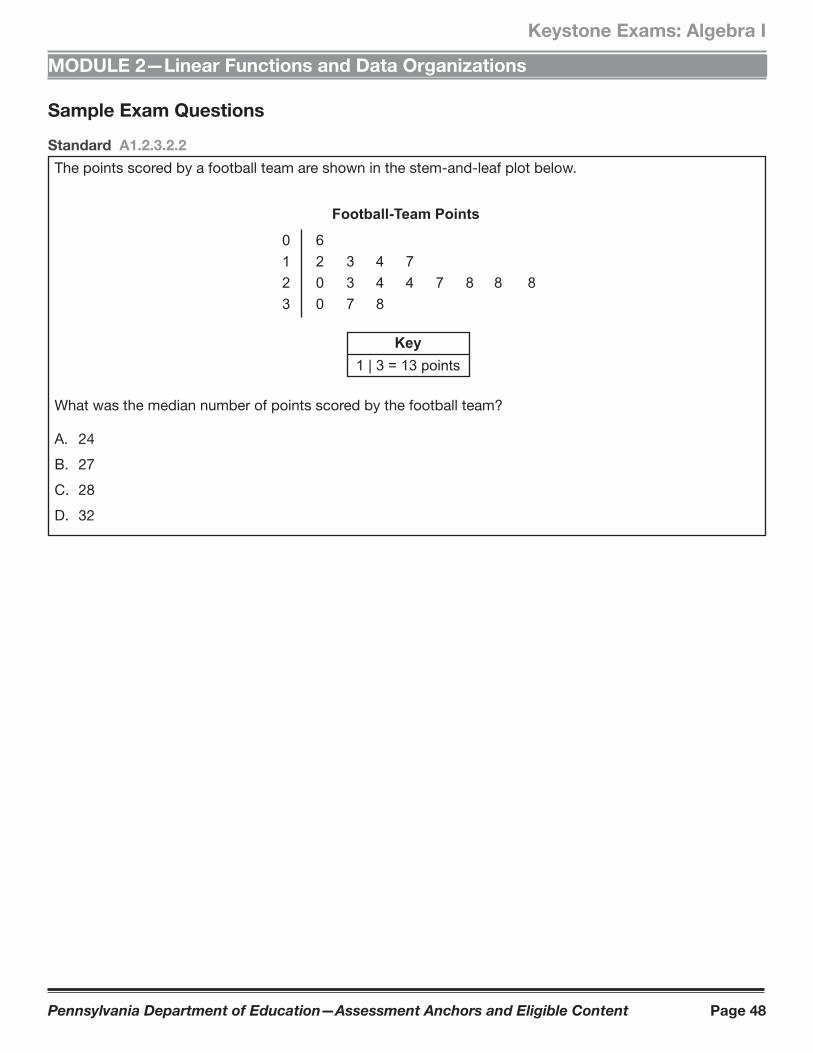
John recorded the weight of his dog Spot at different ages as shown in the scatter plot below.
Spot’s Weight
Age (in months)
Wei
ght (
in p
ound
s)
504540353025201510
5
20 4 6 8 1210 14 16
Based on the line of best fit, what will be Spot’s weight after 18 months?
A. 27 pounds
B. 32 pounds
C. 36 pounds
D. 50 pounds
Pennsylvania Department of Education—Assessment Anchors and Eligible Content Page 50
Keystone Exams: Algebra I
MODULE 2—Linear Functions and Data Organizations
ASSESSMENT ANCHOR
A1.2.3 Data Analysis
Anchor Descriptor Eligible Content
PA Common
Core
Standards
A1.2.3.3 Apply probability to practical situations.
A1.2.3.3.1 Find probabilities for compound events (e.g., fi nd probability of red and blue, fi nd probability of red or blue) and represent as a fraction, decimal, or percent.
CC.2.4.7.B.3
CC.2.4.HS.B.4
CC.2.4.HS.B.7
Sample Exam Questions
Standard A1.2.3.3.1
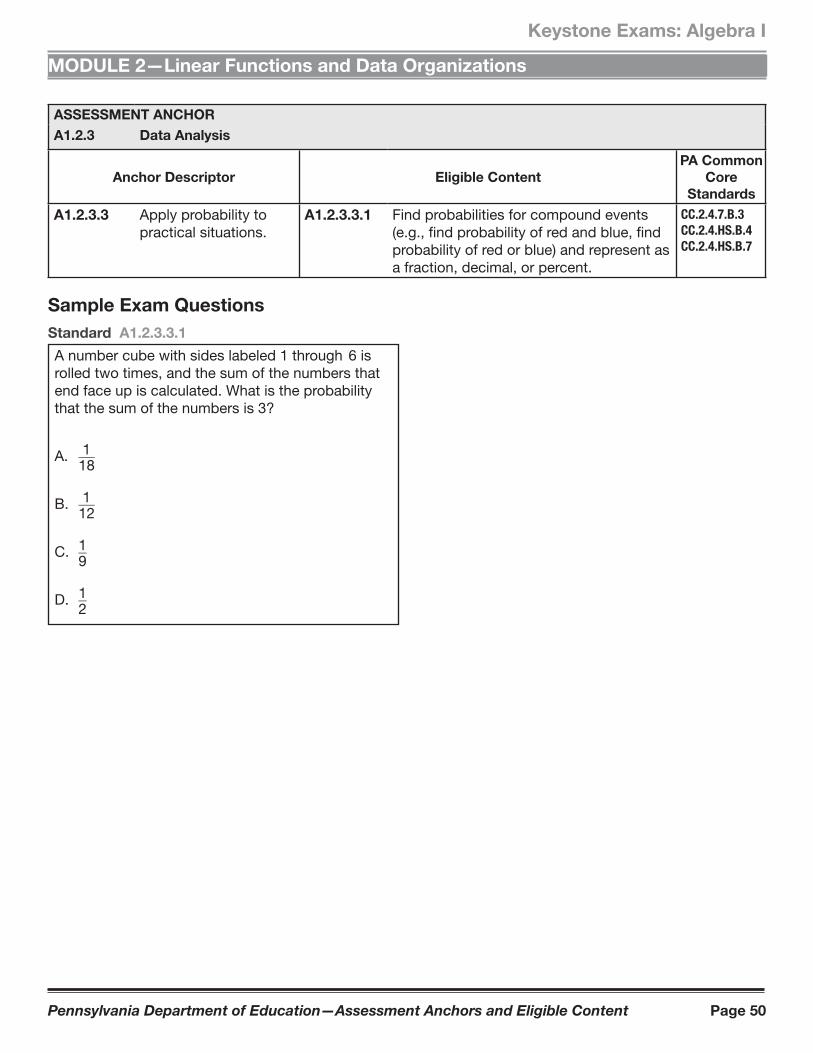
A number cube with sides labeled 1 through 6 is rolled two times, and the sum of the numbers that end face up is calculated. What is the probability that the sum of the numbers is 3?
A. 1 } 18
B. 1 } 12
C. 1 } 9
D. 1 } 2
Pennsylvania Department of Education—Assessment Anchors and Eligible Content Page 51
Keystone Exams: Algebra I
MODULE 2—Linear Functions and Data Organizations
Standard A1.2.3
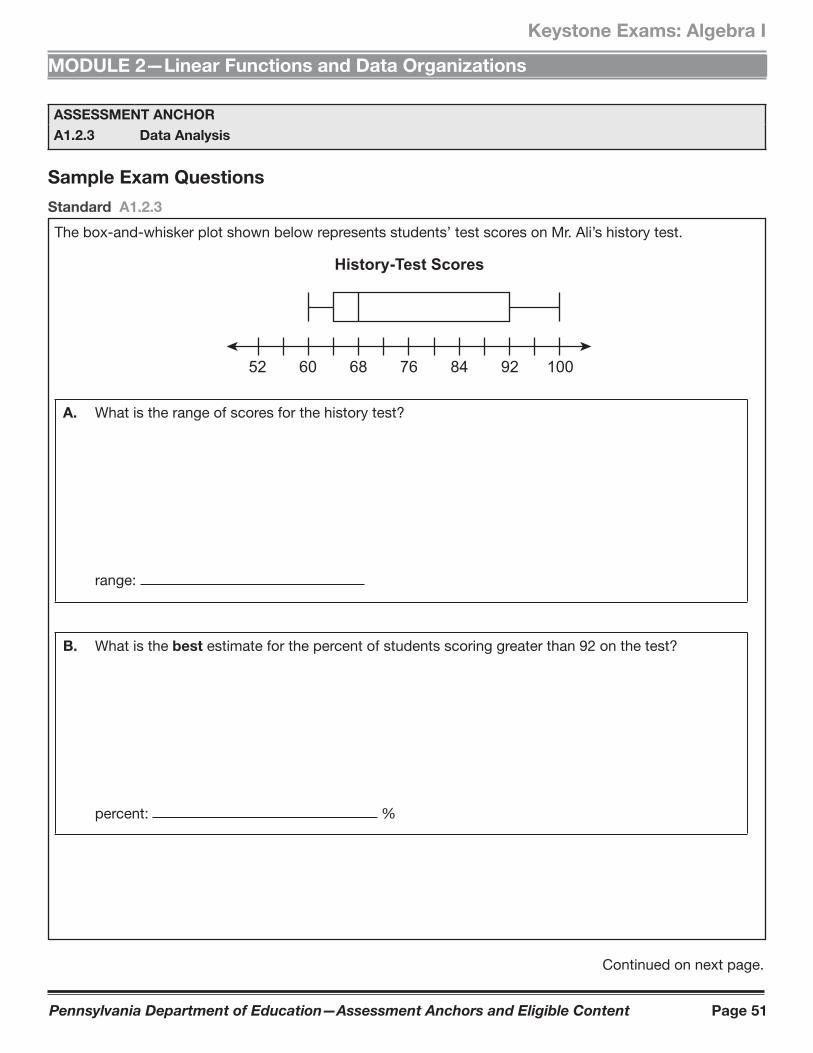
The box-and-whisker plot shown below represents students’ test scores on Mr. Ali’s history test.
52 60 68 76 84 92 100
History-Test Scores
A. What is the range of scores for the history test?
range:
B. What is the best estimate for the percent of students scoring greater than 92 on the test?
percent: %
Continued on next page.
ASSESSMENT ANCHOR
A1.2.3 Data Analysis
Sample Exam Questions
Pennsylvania Department of Education—Assessment Anchors and Eligible Content Page 52
Keystone Exams: Algebra I
MODULE 2—Linear Functions and Data Organizations
Continued. Please refer to the previous page for task explanation.
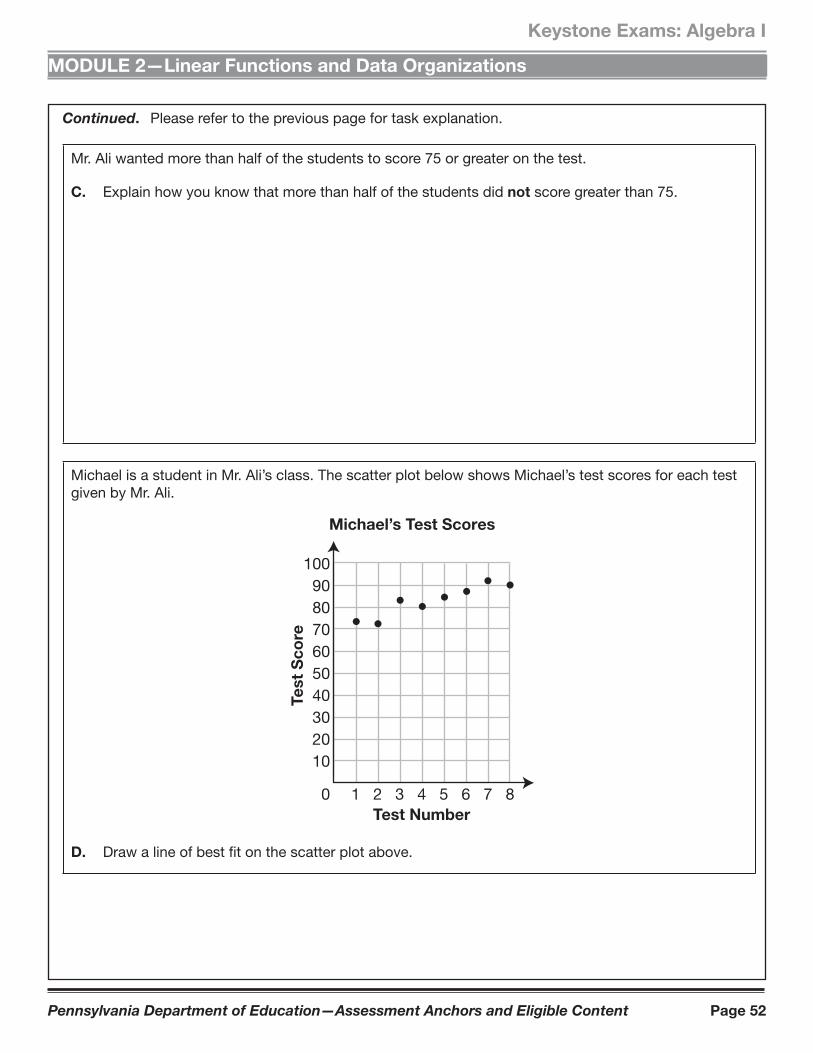
Mr. Ali wanted more than half of the students to score 75 or greater on the test.
C. Explain how you know that more than half of the students did not score greater than 75.
Michael is a student in Mr. Ali’s class. The scatter plot below shows Michael’s test scores for each test given by Mr. Ali.
0Test Number
Te
st
Sc
ore
100908070605040302010
1 2 3 4 5 6 7 8
Michael’s Test Scores
D. Draw a line of best fit on the scatter plot above.
Pennsylvania Department of Education—Assessment Anchors and Eligible Content Page 53
Keystone Exams: Algebra I
MODULE 2—Linear Functions and Data Organizations
Standard A1.2.3
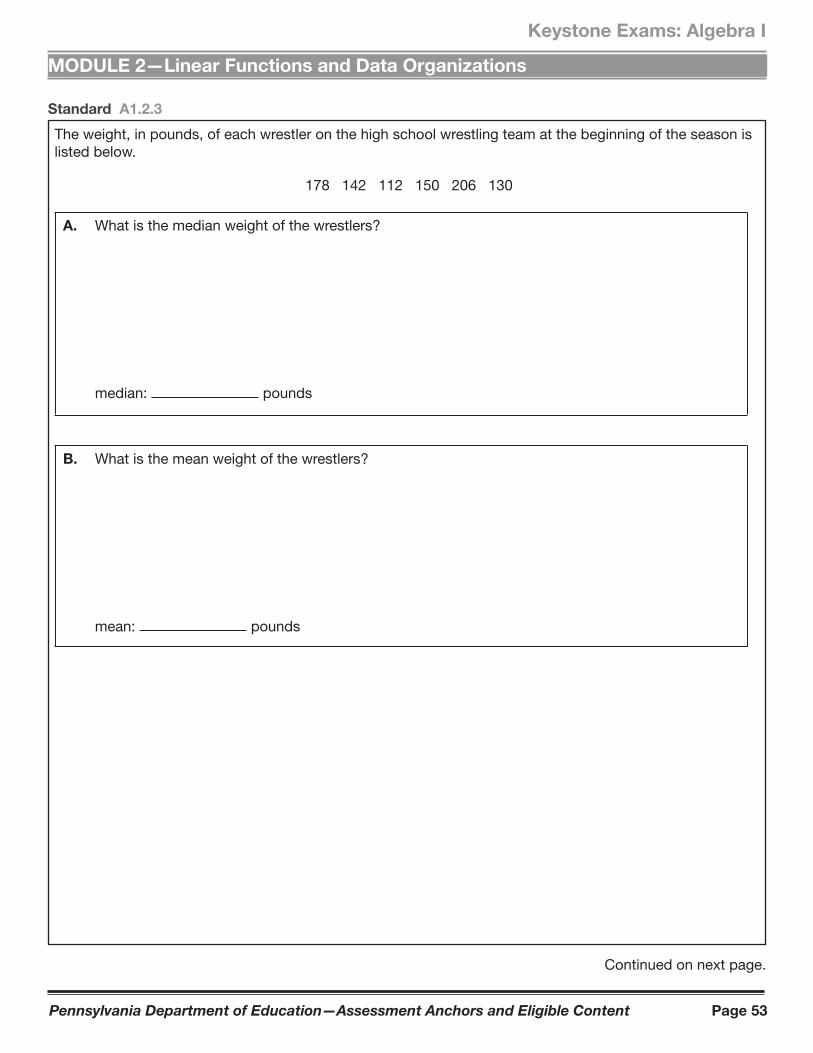
The weight, in pounds, of each wrestler on the high school wrestling team at the beginning of the season is listed below.
178 142 112 150 206 130
A. What is the median weight of the wrestlers?
median: pounds
B. What is the mean weight of the wrestlers?
mean: pounds
Continued on next page.
Pennsylvania Department of Education—Assessment Anchors and Eligible Content Page 54
Keystone Exams: Algebra I
MODULE 2—Linear Functions and Data Organizations
Continued. Please refer to the previous page for task explanation.
Two more wrestlers join the team during the season. The addition of these wrestlers has no effect on the mean weight of the wrestlers, but the median weight of the wrestlers increases 3 pounds.
C. Determine the weights of the two new wrestlers.
new wrestlers: pounds and pounds
Pennsylvania Department of Education—Assessment Anchors and Eligible Content Page 55
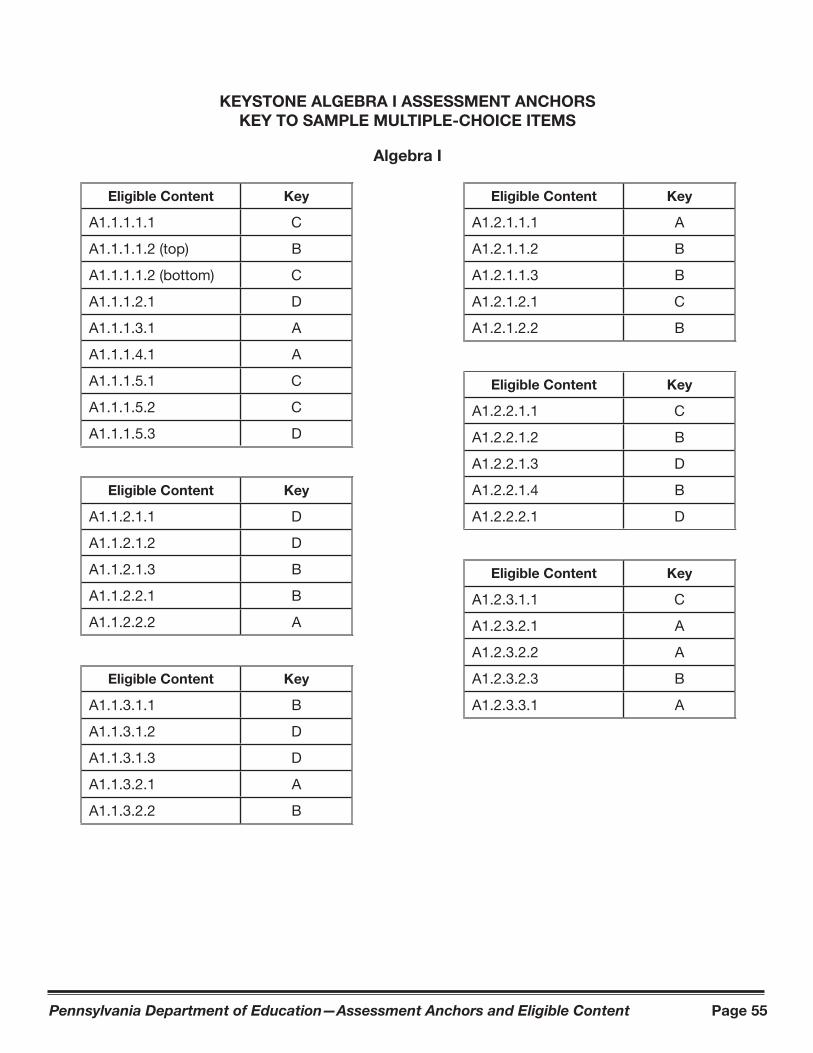
KEYSTONE ALGEBRA I ASSESSMENT ANCHORS
KEY TO SAMPLE MULTIPLE-CHOICE ITEMS
Algebra I
Eligible Content Key
A1.1.1.1.1 C
A1.1.1.1.2 (top) B
A1.1.1.1.2 (bottom) C
A1.1.1.2.1 D
A1.1.1.3.1 A
A1.1.1.4.1 A
A1.1.1.5.1 C
A1.1.1.5.2 C
A1.1.1.5.3 D
Eligible Content Key
A1.1.2.1.1 D
A1.1.2.1.2 D
A1.1.2.1.3 B
A1.1.2.2.1 B
A1.1.2.2.2 A
Eligible Content Key
A1.1.3.1.1 B
A1.1.3.1.2 D
A1.1.3.1.3 D
A1.1.3.2.1 A
A1.1.3.2.2 B
Eligible Content Key
A1.2.1.1.1 A
A1.2.1.1.2 B
A1.2.1.1.3 B
A1.2.1.2.1 C
A1.2.1.2.2 B
Eligible Content Key
A1.2.2.1.1 C
A1.2.2.1.2 B
A1.2.2.1.3 D
A1.2.2.1.4 B
A1.2.2.2.1 D
Eligible Content Key
A1.2.3.1.1 C
A1.2.3.2.1 A
A1.2.3.2.2 A
A1.2.3.2.3 B
A1.2.3.3.1 A

Key
ston
e Ex
ams:
Alg
ebra
Gl
ossa
ry to
the
As
sess
men
t Anc
hor &
Elig
ible
Con
tent
Th
e Ke
ysto
ne G
loss
ary
incl
udes
ter
ms
and
defin
itio
ns a
ssoc
iate
d w
ith
the
Keys
tone
Ass
essm
ent
Anc
hors
and
El
igib
le C
onte
nt.
The
term
s an
d de
finit
ions
inc
lude
d in
the
glo
ssar
y ar
e in
tend
ed t
o as
sist
Pen
nsyl
vani
a ed
ucat
ors
in b
ette
r un
ders
tand
ing
the
Keys
tone
Ass
essm
ent
Anc
hors
and
Elig
ible
Con
tent
. Th
e gl
ossa
ry d
oes
not
defin
e al
l pos
sibl
e te
rms
incl
uded
on
an a
ctua
l Key
ston
e Ex
am, a
nd it
is n
ot in
tend
ed t
o de
fine
term
s fo
r us
e in
cla
ssro
om in
stru
ctio
n fo
r a
part
icul
ar g
rade
leve
l or
cour
se.
Penn
sylv
ania
Dep
artm
ent o
f Edu
cati
on
ww
w.e
du
cati
on.s
tate
.pa.
us
Janu
ary
2013
K
eyst
one
Exam
s: A
lgeb
ra
Ass
essm
ent
An
chor
& E
ligi
ble
Con
ten
t G
loss
ary
Jan
uar
y 2
01
3
Pe
nnsy
lvan
ia D
epar
tmen
t of E
duca
tion
Page
2
Janu
ary
2013
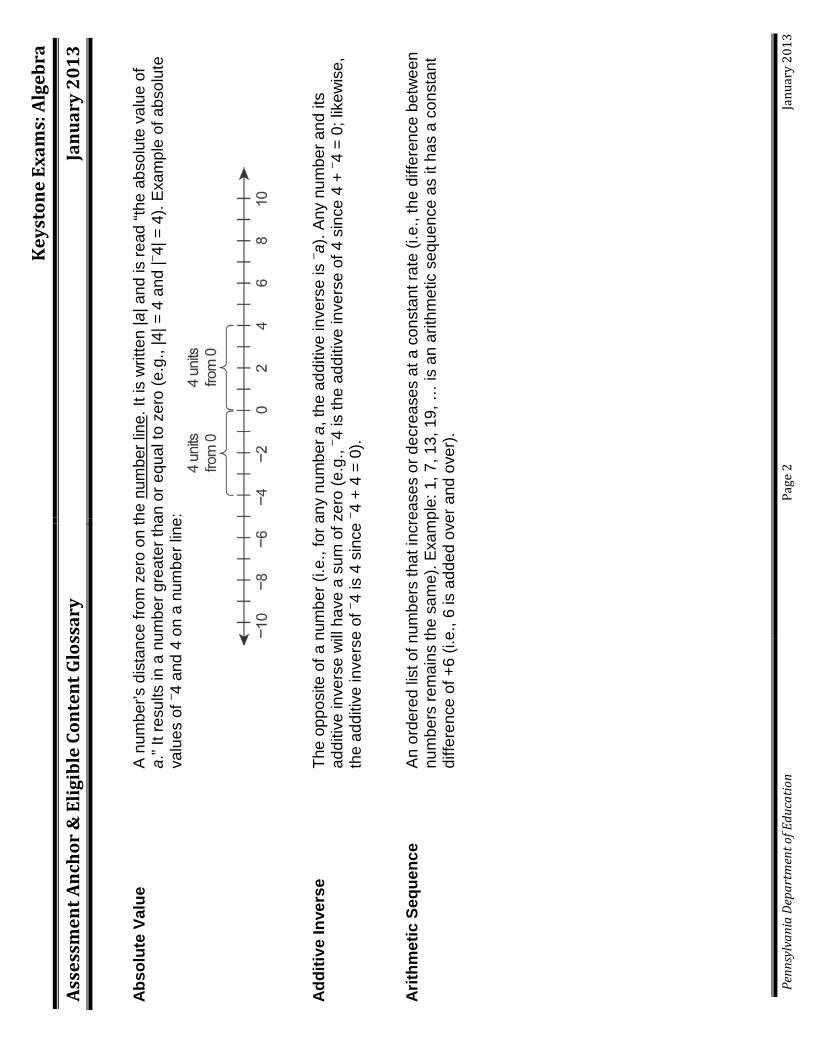
Abs
olut
e Va
lue
A n
umbe
r’s d
ista
nce
from
zer
o on
the
num
ber l
ine.
It is
writ
ten
|a| a
nd is
read
“the
abs
olut
e va
lue
of
a.” I
t res
ults
in a
num
ber g
reat
er th
an o
r equ
al to
zer
o (e
.g.,
|4| =
4 a
nd |– 4|
= 4
). E
xam
ple
of a
bsol
ute
valu
es o
f – 4 an
d 4
on a
num
ber l
ine:
Add
itive
Inve
rse
The
oppo
site
of a
num
ber (
i.e.,
for a
ny n
umbe
r a, t
he a
dditi
ve in
vers
e is
– a). A
ny n
umbe
r and
its
addi
tive
inve
rse
will
hav
e a
sum
of z
ero
(e.g
., – 4
is th
e ad
ditiv
e in
vers
e of
4 s
ince
4 +
– 4 =
0; li
kew
ise,
th
e ad
ditiv
e in
vers
e of
– 4 is
4 s
ince
– 4 +
4 =
0).
Arit
hmet
ic S
eque
nce
An
orde
red
list o
f num
bers
that
incr
ease
s or
dec
reas
es a
t a c
onst
ant r
ate
(i.e.
, the
diff
eren
ce b
etw
een
num
bers
rem
ains
the
sam
e). E
xam
ple:
1, 7
, 13,
19,
… is
an
arith
met
ic s
eque
nce
as it
has
a c
onst
ant
diffe
renc
e of
+6
(i.e.
, 6 is
add
ed o
ver a
nd o
ver).
K
eyst
one
Exam
s: A
lgeb
ra
Ass
essm
ent
An
chor
& E
ligi
ble
Con
ten
t G
loss
ary
Jan
uar
y 2
01
3
Pe
nnsy
lvan
ia D
epar
tmen
t of E
duca
tion
Page
3
Janu
ary
2013
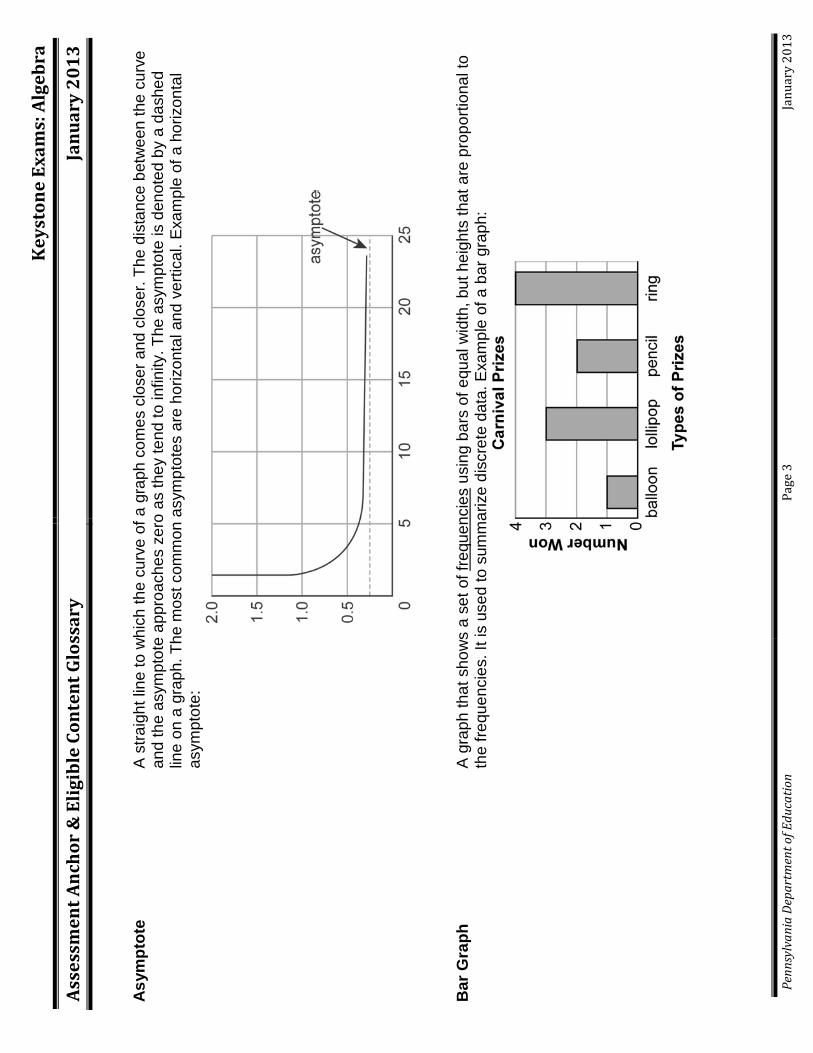
Asy
mpt
ote
A s
traig
ht li
ne to
whi
ch th
e cu
rve
of a
gra
ph c
omes
clo
ser a
nd c
lose
r. Th
e di
stan
ce b
etw
een
the
curv
e an
d th
e as
ympt
ote
appr
oach
es z
ero
as th
ey te
nd to
infin
ity. T
he a
sym
ptot
e is
den
oted
by
a da
shed
lin
e on
a g
raph
. The
mos
t com
mon
asy
mpt
otes
are
hor
izon
tal a
nd v
ertic
al. E
xam
ple
of a
hor
izon
tal
asym
ptot
e:
Bar
Gra
ph
A g
raph
that
sho
ws
a se
t of f
requ
enci
es u
sing
bar
s of
equ
al w
idth
, but
hei
ghts
that
are
pro
porti
onal
to
the
frequ
enci
es. I
t is
used
to s
umm
ariz
e di
scre
te d
ata.
Exa
mpl
e of
a b
ar g
raph
:
K
eyst
one
Exam
s: A
lgeb
ra
Ass
essm
ent
An
chor
& E
ligi
ble
Con
ten
t G
loss
ary
Jan
uar
y 2
01
3
Pe
nnsy
lvan
ia D
epar
tmen
t of E
duca
tion
Page
4
Janu
ary
2013
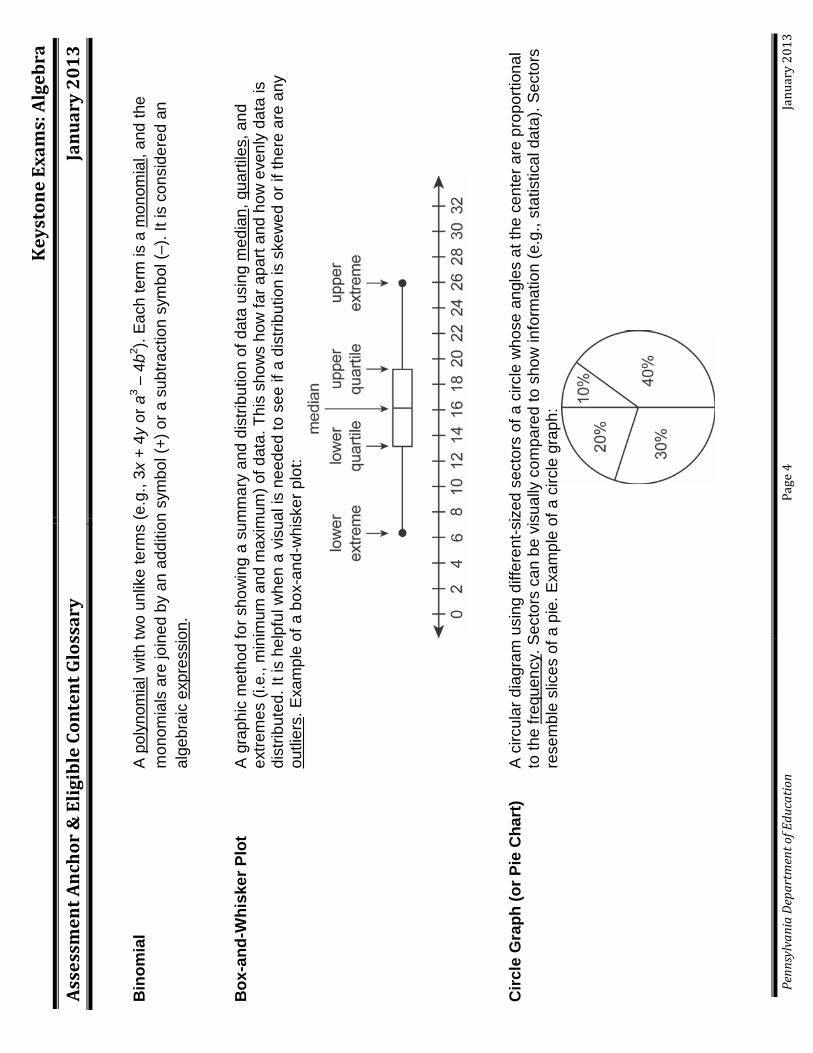
Bin
omia
l A
pol
ynom
ial w
ith tw
o un
like
term
s (e
.g.,
3x +
4y
or a
3 – 4
b2 ). Ea
ch te
rm is
a m
onom
ial,
and
the
mon
omia
ls a
re jo
ined
by
an a
dditi
on s
ymbo
l (+)
or a
sub
tract
ion
sym
bol (
–). I
t is
cons
ider
ed a
n al
gebr
aic
expr
essi
on.
Box
-and
-Whi
sker
Plo
t A
gra
phic
met
hod
for s
how
ing
a su
mm
ary
and
dist
ribut
ion
of d
ata
usin
g m
edia
n, q
uarti
les,
and
ex
trem
es (i
.e.,
min
imum
and
max
imum
) of d
ata.
Thi
s sh
ows
how
far a
part
and
how
eve
nly
data
is
dist
ribut
ed. I
t is
help
ful w
hen
a vi
sual
is n
eede
d to
see
if a
dis
tribu
tion
is s
kew
ed o
r if t
here
are
any
ou
tlier
s . E
xam
ple
of a
box
-and
-whi
sker
plo
t:
Circ
le G
raph
(or P
ie C
hart
) A
circ
ular
dia
gram
usi
ng d
iffer
ent-s
ized
sec
tors
of a
circ
le w
hose
ang
les
at th
e ce
nter
are
pro
porti
onal
to
the
frequ
ency
. Sec
tors
can
be
visu
ally
com
pare
d to
sho
w in
form
atio
n (e
.g.,
stat
istic
al d
ata)
. Sec
tors
re
sem
ble
slic
es o
f a p
ie. E
xam
ple
of a
circ
le g
raph
:
K
eyst
one
Exam
s: A
lgeb
ra
Ass
essm
ent
An
chor
& E
ligi
ble
Con
ten
t G
loss
ary
Jan
uar
y 2
01
3
Pe
nnsy
lvan
ia D
epar
tmen
t of E
duca
tion
Page
5
Janu
ary
2013
Coe
ffici
ent
The
num
ber,
usua
lly a
con
stan
t, th
at is
mul
tiplie
d by
a v
aria
ble
in a
term
(e.g
., 35
is th
e co
effic
ient
of
35x2 y)
; the
abs
ence
of a
coe
ffici
ent i
s th
e sa
me
as a
1 b
eing
pre
sent
(e.g
., x
is th
e sa
me
as 1
x).
Com
bina
tion
An
unor
dere
d ar
rang
emen
t, lis
ting
or s
elec
tion
of o
bjec
ts (e
.g.,
two-
lette
r com
bina
tions
of t
he th
ree
lette
rs X
, Y, a
nd Z
wou
ld b
e XY
, XZ,
and
YZ;
XY
is th
e sa
me
as Y
X an
d is
not
cou
nted
as
a di
ffere
nt
com
bina
tion)
. A c
ombi
natio
n is
sim
ilar t
o, b
ut n
ot th
e sa
me
as, a
per
mut
atio
n.
Com
mon
Log
arith
m
A lo
garit
hm w
ith b
ase
10. I
t is
writ
ten
log
x. T
he c
omm
on lo
garit
hm is
the
pow
er o
f 10
nece
ssar
y to
eq
ual a
giv
en n
umbe
r (i.e
., lo
g x
= y
is e
quiv
alen
t to
10y =
x).
Com
plex
Num
ber
The
sum
or d
iffer
ence
of a
real
num
ber a
nd a
n im
agin
ary
num
ber.
It is
writ
ten
in th
e fo
rm a
+ b
i,
whe
re a
and
b a
re re
al n
umbe
rs a
nd i
is th
e im
agin
ary
unit
(i.e.
, i =
1
−).
The
a is
cal
led
the
real
par
t,
and
the
bi is
cal
led
the
imag
inar
y pa
rt.
Com
posi
te N
umbe
r A
ny n
atur
al n
umbe
r with
mor
e th
an tw
o fa
ctor
s (e
.g.,
6 is
a c
ompo
site
num
ber s
ince
it h
as fo
ur
fact
ors:
1, 2
, 3, a
nd 6
). A
com
posi
te n
umbe
r is
not a
prim
e nu
mbe
r.
Com
poun
d (o
r Com
bine
d)
Even
t A
n ev
ent t
hat i
s m
ade
up o
f tw
o or
mor
e si
mpl
e ev
ents
, suc
h as
the
flipp
ing
of tw
o or
mor
e co
ins.
Com
poun
d In
equa
lity
Whe
n tw
o or
mor
e in
equa
litie
s ar
e ta
ken
toge
ther
and
writ
ten
with
the
ineq
ualit
ies
conn
ecte
d by
the
wor
ds a
nd o
r or (
e.g.
, x >
6 a
nd x
< 1
2, w
hich
can
als
o be
writ
ten
as 6
< x
< 1
2).
K
eyst
one
Exam
s: A
lgeb
ra
Ass
essm
ent
An
chor
& E
ligi
ble
Con
ten
t G
loss
ary
Jan
uar
y 2
01
3
Pe
nnsy
lvan
ia D
epar
tmen
t of E
duca
tion
Page
6
Janu
ary
2013
Con
stan
t A
term
or e
xpre
ssio
n w
ith n
o va
riabl
e in
it. I
t has
the
sam
e va
lue
all t
he ti
me.
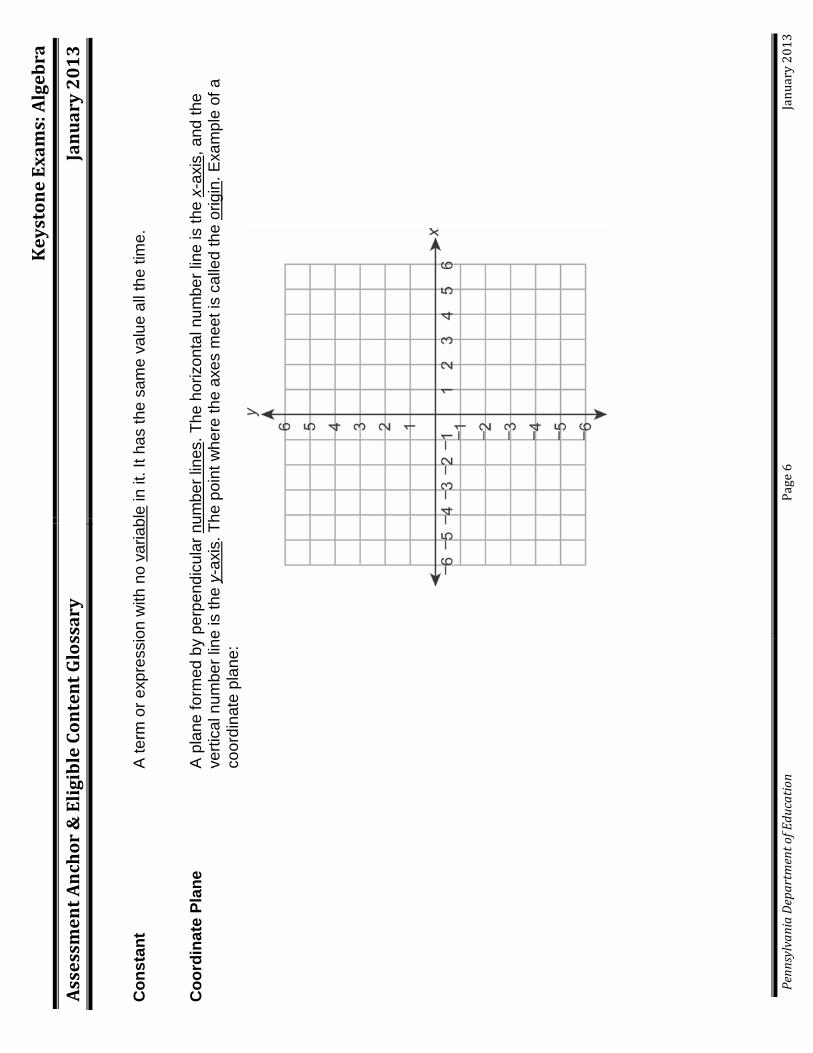
Coo
rdin
ate
Plan
e A
pla
ne fo
rmed
by
perp
endi
cula
r num
ber l
ines
. The
hor
izon
tal n
umbe
r lin
e is
the
x-ax
is, a
nd th
e ve
rtica
l num
ber l
ine
is th
e y-
axis
. The
poi
nt w
here
the
axes
mee
t is
calle
d th
e or
igin
. Exa
mpl
e of
a
coor
dina
te p
lane
:
K
eyst
one
Exam
s: A
lgeb
ra
Ass
essm
ent
An
chor
& E
ligi
ble
Con
ten
t G
loss
ary
Jan
uar
y 2
01
3
Pe
nnsy
lvan
ia D
epar
tmen
t of E
duca
tion
Page
7
Janu
ary
2013
Cub
e R
oot
One
of t
hree
equ
al fa
ctor
s (ro
ots)
of a
num
ber o
r exp
ress
ion;
a ra
dica
l exp
ress
ion
with
a d
egre
e of
3
(e.g
., 3
a).
The
cube
root
of a
num
ber o
r exp
ress
ion
has
the
sam
e si
gn a
s th
e nu
mbe
r or e
xpre
ssio
n
unde
r the
radi
cal (
e.g.
, 3
_6
343x
= – (7
x2 ) and
36
343x
= 7
x2 ).
Cur
ve o
f Bes
t Fit
(for a
Sc
atte
r Plo
t) S
ee li
ne o
r cur
ve o
f bes
t fit
(for a
sca
tter p
lot).
Deg
ree
(of a
Pol
ynom
ial)
The
valu
e of
the
grea
test
exp
onen
t in
a po
lyno
mia
l.
Dep
ende
nt E
vent
s Tw
o or
mor
e ev
ents
in w
hich
the
outc
ome
of o
ne e
vent
affe
cts
or in
fluen
ces
the
outc
ome
of th
e ot
her
even
t(s).
Dep
ende
nt V
aria
ble
The
outp
ut n
umbe
r or v
aria
ble
in a
rela
tion
or fu
nctio
n th
at d
epen
ds u
pon
anot
her v
aria
ble,
cal
led
the
inde
pend
ent v
aria
ble,
or i
nput
num
ber (
e.g.
, in
the
equa
tion
y =
2x +
4, y
is th
e de
pend
ent v
aria
ble
sinc
e its
val
ue d
epen
ds o
n th
e va
lue
of x
). It
is th
e va
riabl
e fo
r whi
ch a
n eq
uatio
n is
sol
ved.
Its
valu
es
mak
e up
the
rang
e of
the
rela
tion
or fu
nctio
n.
Dom
ain
(of a
Rel
atio
n or
Fu
nctio
n)
The
set o
f all
poss
ible
val
ues
of th
e in
depe
nden
t var
iabl
e on
whi
ch a
func
tion
or re
latio
n is
allo
wed
to
oper
ate.
Als
o, th
e fir
st n
umbe
rs in
the
orde
red
pairs
of a
rela
tion;
the
valu
es o
f the
x-c
oord
inat
es in
(x
, y).
Elim
inat
ion
Met
hod
See
line
ar c
ombi
natio
n.
K
eyst
one
Exam
s: A
lgeb
ra
Ass
essm
ent
An
chor
& E
ligi
ble
Con
ten
t G
loss
ary
Jan
uar
y 2
01
3
Pe
nnsy
lvan
ia D
epar
tmen
t of E
duca
tion
Page
8
Janu
ary
2013
Equa
tion
A m
athe
mat
ical
sta
tem
ent o
r sen
tenc
e th
at s
ays
one
mat
hem
atic
al e
xpre
ssio
n or
qua
ntity
is e
qual
to
anot
her (
e.g.
, x +
5 =
y –
7).
An
equa
tion
will
alw
ays
cont
ain
an e
qual
sig
n (=
).
Estim
atio
n St
rate
gy
An
appr
oxim
atio
n ba
sed
on a
judg
men
t; m
ay in
clud
e de
term
inin
g ap
prox
imat
e va
lues
, est
ablis
hing
th
e re
ason
able
ness
of a
nsw
ers,
ass
essi
ng th
e am
ount
of e
rror r
esul
ting
from
est
imat
ion,
and
/or
dete
rmin
ing
if an
erro
r is
with
in a
ccep
tabl
e lim
its.
Expo
nent
Th
e po
wer
to w
hich
a n
umbe
r or e
xpre
ssio
n is
rais
ed. W
hen
the
expo
nent
is a
frac
tion,
the
num
ber o
r
expr
essi
on c
an b
e re
writ
ten
with
a ra
dica
l sig
n (e
.g.,
x3/4 =
43 x
). S
ee a
lso
posi
tive
expo
nent
and
nega
tive
expo
nent
.
Expo
nent
ial E
quat
ion
An
equa
tion
with
var
iabl
es in
its
expo
nent
s (e
.g.,
4x = 5
0). I
t can
be
solv
ed b
y ta
king
loga
rithm
s of
bo
th s
ides
.
Expo
nent
ial E
xpre
ssio
n A
n ex
pres
sion
in w
hich
the
varia
ble
occu
rs in
the
expo
nent
(suc
h as
4x ra
ther
than
x4 ).
Ofte
n it
occu
rs
whe
n a
quan
tity
chan
ges
by th
e sa
me
fact
or fo
r eac
h un
it of
tim
e (e
.g.,
“dou
bles
eve
ry y
ear”
or
“dec
reas
es 2
% e
ach
mon
th”).
Expo
nent
ial F
unct
ion
(or
Mod
el)
A fu
nctio
n w
hose
gen
eral
equ
atio
n is
y =
a •
bx whe
re a
and
b a
re c
onst
ants
.
Expo
nent
ial G
row
th/D
ecay
A
situ
atio
n w
here
a q
uant
ity in
crea
ses
or d
ecre
ases
exp
onen
tially
by
the
sam
e fa
ctor
ove
r tim
e; it
is
used
for s
uch
phen
omen
a as
infla
tion,
pop
ulat
ion
grow
th, r
adio
activ
ity o
r dep
reci
atio
n.
K
eyst
one
Exam
s: A
lgeb
ra
Ass
essm
ent
An
chor
& E
ligi
ble
Con
ten
t G
loss
ary
Jan
uar
y 2
01
3
Pe
nnsy
lvan
ia D
epar
tmen
t of E
duca
tion
Page
9
Janu
ary
2013
Expr
essi
on
A m
athe
mat
ical
phr
ase
that
incl
udes
ope
ratio
ns, n
umbe
rs, a
nd/o
r var
iabl
es (e
.g.,
2x +
3y
is a
n al
gebr
aic
expr
essi
on, 1
3.4
– 4.
7 is
a n
umer
ic e
xpre
ssio
n). A
n ex
pres
sion
doe
s no
t con
tain
an
equa
l si
gn (=
) or a
ny ty
pe o
f ine
qual
ity s
ign.
Fact
or (n
oun)
Th
e nu
mbe
r or e
xpre
ssio
n th
at is
mul
tiplie
d by
ano
ther
to g
et a
pro
duct
(e.g
., 6
is a
fact
or o
f 30,
and
6x
is a
fact
or o
f 42x
2 ).
Fact
or (v
erb)
To
exp
ress
or w
rite
a nu
mbe
r, m
onom
ial,
or p
olyn
omia
l as
a pr
oduc
t of t
wo
or m
ore
fact
ors.
Fact
or a
Mon
omia
l To
exp
ress
a m
onom
ial a
s th
e pr
oduc
t of t
wo
or m
ore
mon
omia
ls.
Fact
or a
Pol
ynom
ial
To e
xpre
ss a
pol
ynom
ial a
s th
e pr
oduc
t of m
onom
ials
and
/or p
olyn
omia
ls (e
.g.,
fact
orin
g th
e po
lyno
mia
l x2 +
x –
12
resu
lts in
the
prod
uct (
x –
3)(x
+ 4
)).
Freq
uenc
y H
ow o
ften
som
ethi
ng o
ccur
s (i.
e., t
he n
umbe
r of t
imes
an
item
, num
ber,
or e
vent
hap
pens
in a
set
of
dat
a).
Func
tion
A re
latio
n in
whi
ch e
ach
valu
e of
an
inde
pend
ent v
aria
ble
is a
ssoc
iate
d w
ith a
uni
que
valu
e of
a
depe
nden
t var
iabl
e (e
.g.,
one
elem
ent o
f the
dom
ain
is p
aire
d w
ith o
ne a
nd o
nly
one
elem
ent o
f the
ra
nge)
. It i
s a
map
ping
whi
ch in
volv
es e
ither
a o
ne-to
-one
cor
resp
onde
nce
or a
man
y-to
-one
co
rresp
onde
nce,
but
not
a o
ne-to
-man
y co
rresp
onde
nce.
K
eyst
one
Exam
s: A
lgeb
ra
Ass
essm
ent
An
chor
& E
ligi
ble
Con
ten
t G
loss
ary
Jan
uar
y 2
01
3
Pe
nnsy
lvan
ia D
epar
tmen
t of E
duca
tion
Page
10
Ja
nuar
y 20
13
Fund
amen
tal C
ount
ing
Prin
cipl
e A
way
to c
alcu
late
all
of th
e po
ssib
le c
ombi
natio
ns o
f a g
iven
num
ber o
f eve
nts.
It s
tate
s th
at if
ther
e ar
e x
diffe
rent
way
s of
doi
ng o
ne th
ing
and
y di
ffere
nt w
ays
of d
oing
ano
ther
thin
g, th
en th
ere
are
xy d
iffer
ent w
ays
of d
oing
bot
h th
ings
. It u
ses
the
mul
tiplic
atio
n ru
le.
Geo
met
ric S
eque
nce
A
n or
dere
d lis
t of n
umbe
rs th
at h
as th
e sa
me
ratio
bet
wee
n co
nsec
utiv
e te
rms
(e.g
., 1,
7, 4
9, 3
43, …
is
a g
eom
etric
seq
uenc
e th
at h
as a
ratio
of 7
/1 b
etw
een
cons
ecut
ive
term
s; e
ach
term
afte
r the
firs
t te
rm c
an b
e fo
und
by m
ultip
lyin
g th
e pr
evio
us te
rm b
y a
cons
tant
, in
this
cas
e th
e nu
mbe
r 7 o
r 7/1
).
Gre
ates
t Com
mon
Fac
tor
(GC
F)
The
larg
est f
acto
r tha
t tw
o or
mor
e nu
mbe
rs o
r alg
ebra
ic te
rms
have
in c
omm
on. I
n so
me
case
s th
e G
CF
may
be
1 or
one
of t
he a
ctua
l num
bers
(e.g
., th
e G
CF
of 1
8x3 a
nd 2
4x5 is
6x3 ).
Imag
inar
y N
umbe
r Th
e sq
uare
root
of a
neg
ativ
e nu
mbe
r, or
the
oppo
site
of t
he s
quar
e ro
ot o
f a n
egat
ive
num
ber.
It is
writ
ten
in th
e fo
rm b
i, w
here
b is
a re
al n
umbe
r and
i is
the
imag
inar
y ro
ot (i
.e.,
i =
1−
or i
2 = – 1)
.
Inde
pend
ent E
vent
(s)
Two
or m
ore
even
ts in
whi
ch th
e ou
tcom
e of
one
eve
nt d
oes
not a
ffect
the
outc
ome
of th
e ot
her
even
t(s) (
e.g.
, tos
sing
a c
oin
and
rollin
g a
num
ber c
ube
are
inde
pend
ent e
vent
s). T
he p
roba
bilit
y of
tw
o in
depe
nden
t eve
nts
(A a
nd B
) occ
urrin
g is
writ
ten
P(A
and
B) o
r P(A
B
) and
equ
als
P(A
) • P
(B)
(i.e.
, the
pro
duct
of t
he p
roba
bilit
ies
of th
e tw
o in
divi
dual
eve
nts)
.
Inde
pend
ent V
aria
ble
The
inpu
t num
ber o
r var
iabl
e in
a re
latio
n or
func
tion
who
se v
alue
is s
ubje
ct to
cho
ice.
It is
not
de
pend
ent u
pon
any
othe
r val
ues.
It is
usu
ally
the
x-va
lue
or th
e x
in f(
x). I
t is
grap
hed
on th
e x-
axis
. Its
val
ues
mak
e up
the
dom
ain
of th
e re
latio
n or
func
tion.
K
eyst
one
Exam
s: A
lgeb
ra
Ass
essm
ent
An
chor
& E
ligi
ble
Con
ten
t G
loss
ary
Jan
uar
y 2
01
3
Pe
nnsy
lvan
ia D
epar
tmen
t of E
duca
tion
Page
11
Ja
nuar
y 20
13
Ineq
ualit
y A
mat
hem
atic
al s
ente
nce
that
con
tain
s an
ineq
ualit
y sy
mbo
l (i.e
., >,
<, ≥
, ≤, o
r ≠).
It co
mpa
res
two
quan
titie
s. T
he s
ymbo
l > m
eans
gre
ater
than
, the
sym
bol <
mea
ns le
ss th
an, t
he s
ymbo
l ≥ m
eans
gr
eate
r tha
n or
equ
al to
, the
sym
bol ≤
mea
ns le
ss th
an o
r equ
al to
, and
the
sym
bol ≠
mea
ns n
ot
equa
l to.
Inte
ger
A n
atur
al n
umbe
r, th
e ad
ditiv
e in
vers
e of
a n
atur
al n
umbe
r, or
zer
o. A
ny n
umbe
r fro
m th
e se
t of
num
bers
repr
esen
ted
by {…
, – 3, – 2,
– 1, 0
, 1, 2
, 3, …
}.
Inte
rqua
rtile
Ran
ge (o
f Dat
a)
The
diffe
renc
e be
twee
n th
e fir
st (l
ower
) and
third
(upp
er) q
uarti
le. I
t rep
rese
nts
the
spre
ad o
f the
m
iddl
e 50
% o
f a s
et o
f dat
a.
Inve
rse
(of a
Rel
atio
n)
A re
latio
n in
whi
ch th
e co
ordi
nate
s in
eac
h or
dere
d pa
ir ar
e sw
itche
d fro
m a
giv
en re
latio
n. T
he p
oint
(x
, y) b
ecom
es (y
, x),
so (3
, 8) w
ould
bec
ome
(8, 3
).
Irrat
iona
l Num
ber
A re
al n
umbe
r tha
t can
not b
e w
ritte
n as
a s
impl
e fra
ctio
n (i.
e., t
he ra
tio o
f tw
o in
tege
rs).
It is
a n
on-
term
inat
ing
(infin
ite) a
nd n
on-re
peat
ing
deci
mal
. The
squ
are
root
of a
ny p
rime
num
ber i
s irr
atio
nal,
as
are π
and
e.
Leas
t (or
Low
est)
Com
mon
M
ultip
le (L
CM
) Th
e sm
alle
st n
umbe
r or e
xpre
ssio
n th
at is
a c
omm
on m
ultip
le o
f tw
o or
mor
e nu
mbe
rs o
r alg
ebra
ic
term
s, o
ther
than
zer
o.
Like
Ter
ms
Mon
omia
ls th
at c
onta
in th
e sa
me
varia
bles
and
cor
resp
ondi
ng p
ower
s an
d/or
root
s. O
nly
the
coef
ficie
nts
can
be d
iffer
ent (
e.g.
, 4x3 a
nd 1
2x3 ).
Like
term
s ca
n be
add
ed o
r sub
tract
ed.
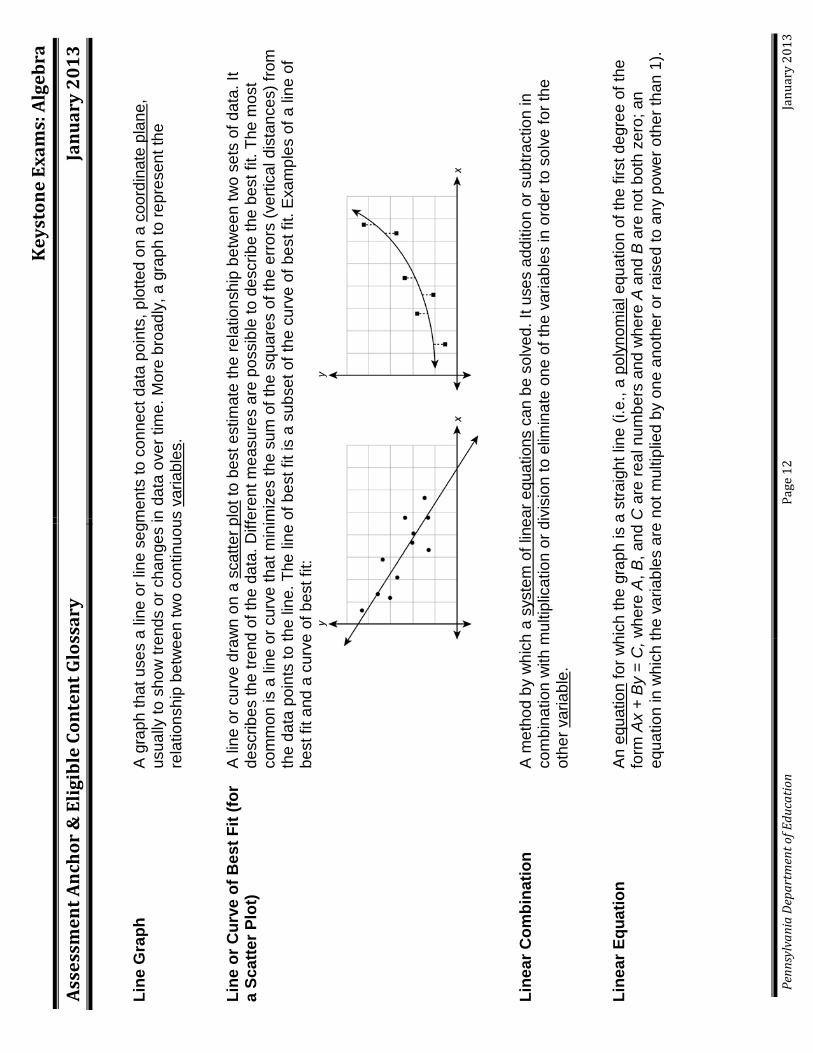
K
eyst
one
Exam
s: A
lgeb
ra
Ass
essm
ent
An
chor
& E
ligi
ble
Con
ten
t G
loss
ary
Jan
uar
y 2
01
3
Pe
nnsy
lvan
ia D
epar
tmen
t of E
duca
tion
Page
12
Ja
nuar
y 20
13
Line
Gra
ph
A g
raph
that
use
s a
line
or li
ne s
egm
ents
to c
onne
ct d
ata
poin
ts, p
lotte
d on
a c
oord
inat
e pl
ane,
us
ually
to s
how
tren
ds o
r cha
nges
in d
ata
over
tim
e. M
ore
broa
dly,
a g
raph
to re
pres
ent t
he
rela
tions
hip
betw
een
two
cont
inuo
us v
aria
bles
.
Line
or C
urve
of B
est F
it (fo
r a
Scat
ter P
lot)
A li
ne o
r cur
ve d
raw
n on
a s
catte
r plo
t to
best
est
imat
e th
e re
latio
nshi
p be
twee
n tw
o se
ts o
f dat
a. It
de
scrib
es th
e tre
nd o
f the
dat
a. D
iffer
ent m
easu
res
are
poss
ible
to d
escr
ibe
the
best
fit.
The
mos
t co
mm
on is
a li
ne o
r cur
ve th
at m
inim
izes
the
sum
of t
he s
quar
es o
f the
erro
rs (v
ertic
al d
ista
nces
) fro
m
the
data
poi
nts
to th
e lin
e. T
he li
ne o
f bes
t fit
is a
sub
set o
f the
cur
ve o
f bes
t fit.
Exa
mpl
es o
f a li
ne o
f be
st fi
t and
a c
urve
of b
est f
it:
Line
ar C
ombi
natio
n A
met
hod
by w
hich
a s
yste
m o
f lin
ear e
quat
ions
can
be
solv
ed. I
t use
s ad
ditio
n or
sub
tract
ion
in
com
bina
tion
with
mul
tiplic
atio
n or
div
isio
n to
elim
inat
e on
e of
the
varia
bles
in o
rder
to s
olve
for t
he
othe
r var
iabl
e.
Line
ar E
quat
ion
An
equa
tion
for w
hich
the
grap
h is
a s
traig
ht li
ne (i
.e.,
a po
lyno
mia
l equ
atio
n of
the
first
deg
ree
of th
e fo
rm A
x +
By
= C
, whe
re A
, B, a
nd C
are
real
num
bers
and
whe
re A
and
B a
re n
ot b
oth
zero
; an
equa
tion
in w
hich
the
varia
bles
are
not
mul
tiplie
d by
one
ano
ther
or r
aise
d to
any
pow
er o
ther
than
1).
K
eyst
one
Exam
s: A
lgeb
ra
Ass
essm
ent
An
chor
& E
ligi
ble
Con
ten
t G
loss
ary
Jan
uar
y 2
01
3
Pe
nnsy
lvan
ia D
epar
tmen
t of E
duca
tion
Page
13
Ja
nuar
y 20
13
Line
ar F
unct
ion
A fu
nctio
n fo
r whi
ch th
e gr
aph
is a
non
-ver
tical
stra
ight
line
. It i
s a
first
deg
ree
poly
nom
ial o
f the
co
mm
on fo
rm f(
x) =
mx
+ b,
whe
re m
and
b a
re c
onst
ants
and
x is
a re
al v
aria
ble.
The
con
stan
t m is
ca
lled
the
slop
e an
d b
is c
alle
d th
e y-
inte
rcep
t. It
has
a co
nsta
nt ra
te o
f cha
nge.
Line
ar In
equa
lity
Th
e re
latio
n of
two
expr
essi
ons
usin
g th
e sy
mbo
ls <
, >, ≤
, ≥, o
r ≠ a
nd w
hose
bou
ndar
y is
a s
traig
ht
line.
The
line
div
ides
the
coor
dina
te p
lane
into
two
parts
. If t
he in
equa
lity
is e
ither
≤ o
r ≥, t
hen
the
boun
dary
is s
olid
. If t
he in
equa
lity
is e
ither
< o
r >, t
hen
the
boun
dary
is d
ashe
d. If
the
ineq
ualit
y is
≠,
then
the
solu
tion
cont
ains
eve
ryth
ing
exce
pt fo
r the
bou
ndar
y.
Loga
rithm
Th
e ex
pone
nt re
quire
d to
pro
duce
a g
iven
num
ber (
e.g.
, sin
ce 2
rais
ed to
a p
ower
of 5
is 3
2, th
e lo
garit
hm b
ase
2 of
32
is 5
; thi
s is
writ
ten
as lo
g 2 3
2 =
5). T
wo
frequ
ently
use
d ba
ses
are
10 (c
omm
on
loga
rithm
) and
e (n
atur
al lo
garit
hm).
Whe
n a
loga
rithm
is w
ritte
n w
ithou
t a b
ase,
it is
und
erst
ood
to b
e ba
se 1
0.
Loga
rithm
ic E
quat
ion
An
equa
tion
whi
ch c
onta
ins
a lo
garit
hm o
f a v
aria
ble
or n
umbe
r. S
omet
imes
it is
sol
ved
by re
writ
ing
the
equa
tion
in e
xpon
entia
l for
m a
nd s
olvi
ng fo
r the
var
iabl
e (e
.g.,
log 2
32
= 5
is th
e sa
me
as 2
5 = 3
2).
It is
an
inve
rse
func
tion
of th
e ex
pone
ntia
l fun
ctio
n.
Map
ping
Th
e m
atch
ing
or p
airin
g of
one
set
of n
umbe
rs to
ano
ther
by
use
of a
rule
. A n
umbe
r in
the
dom
ain
is
mat
ched
or p
aire
d w
ith a
num
ber i
n th
e ra
nge
(or a
rela
tion
or fu
nctio
n). I
t may
be
a on
e-to
-one
co
rresp
onde
nce,
a o
ne-to
-man
y co
rresp
onde
nce,
or a
man
y-to
-one
cor
resp
onde
nce.
Max
imum
Val
ue (o
f a G
raph
) Th
e va
lue
of th
e de
pend
ent v
aria
ble
for t
he h
ighe
st p
oint
on
the
grap
h of
a c
urve
.
K
eyst
one
Exam
s: A
lgeb
ra
Ass
essm
ent
An
chor
& E
ligi
ble
Con
ten
t G
loss
ary
Jan
uar
y 2
01
3
Pe
nnsy
lvan
ia D
epar
tmen
t of E
duca
tion
Page
14
Ja
nuar
y 20
13
Mea
n A
mea
sure
of c
entra
l ten
denc
y th
at is
cal
cula
ted
by a
ddin
g al
l the
val
ues
of a
set
of d
ata
and
divi
ding
th
at s
um b
y th
e to
tal n
umbe
r of v
alue
s. U
nlik
e m
edia
n, th
e m
ean
is s
ensi
tive
to o
utlie
r val
ues.
It is
al
so c
alle
d “a
rithm
etic
mea
n” o
r “av
erag
e”.
Mea
sure
of C
entr
al
Tend
ency
A
mea
sure
of l
ocat
ion
of th
e m
iddl
e (c
ente
r) of
a d
istri
butio
n of
a s
et o
f dat
a (i.
e., h
ow d
ata
clus
ters
). Th
e th
ree
mos
t com
mon
mea
sure
s of
cen
tral t
ende
ncy
are
mea
n, m
edia
n, a
nd m
ode.
Mea
sure
of D
ispe
rsio
n A
mea
sure
of t
he w
ay in
whi
ch th
e di
strib
utio
n of
a s
et o
f dat
a is
spr
ead
out.
In g
ener
al th
e m
ore
spre
ad o
ut a
dis
tribu
tion
is, t
he la
rger
the
mea
sure
of d
ispe
rsio
n. R
ange
and
inte
rqua
rtile
rang
e ar
e tw
o m
easu
res
of d
ispe
rsio
n.
Med
ian
A m
easu
re o
f cen
tral t
ende
ncy
that
is th
e m
iddl
e va
lue
in a
n or
dere
d se
t of d
ata
or th
e av
erag
e of
the
two
mid
dle
valu
es w
hen
the
set h
as tw
o m
iddl
e va
lues
(occ
urs
whe
n th
e se
t of d
ata
has
an e
ven
num
ber o
f dat
a po
ints
). It
is th
e va
lue
halfw
ay th
roug
h th
e or
dere
d se
t of d
ata,
bel
ow a
nd a
bove
whi
ch
ther
e is
an
equa
l num
ber o
f dat
a va
lues
. It i
s ge
nera
lly a
goo
d de
scrip
tive
mea
sure
for s
kew
ed d
ata
or
data
with
out
liers
.
Min
imum
Val
ue (o
f a G
raph
) Th
e va
lue
of th
e de
pend
ent v
aria
ble
for t
he lo
wes
t poi
nt o
n th
e gr
aph
of a
cur
ve.
Mod
e A
mea
sure
of c
entra
l ten
denc
y th
at is
the
valu
e or
val
ues
that
occ
ur(s
) mos
t ofte
n in
a s
et o
f dat
a. A
se
t of d
ata
can
have
one
mod
e, m
ore
than
one
mod
e, o
r no
mod
e.
Mon
omia
l A
pol
ynom
ial w
ith o
nly
one
term
; it c
onta
ins
no a
dditi
on o
r sub
tract
ion.
It c
an b
e a
num
ber,
a va
riabl
e,
or a
pro
duct
of n
umbe
rs a
nd/o
r mor
e va
riabl
es (e
.g.,
2 • 5
or x
3 y4 or
24 3
rπ).
K
eyst
one
Exam
s: A
lgeb
ra
Ass
essm
ent
An
chor
& E
ligi
ble
Con
ten
t G
loss
ary
Jan
uar
y 2
01
3
Pe
nnsy
lvan
ia D
epar
tmen
t of E
duca
tion
Page
15
Ja
nuar
y 20
13
Mul
tiplic
ativ
e In
vers
e Th
e re
cipr
ocal
of a
num
ber (
i.e.,
for a
ny n
on-z
ero
num
ber a
, the
mul
tiplic
ativ
e in
vers
e is
1 a; f
or a
ny
ratio
nal n
umbe
r b c
, whe
re b
≠ 0
and
c ≠
0, t
he m
ultip
licat
ive
inve
rse
is c b
). A
ny n
umbe
r and
its
mul
tiplic
ativ
e in
vers
e ha
ve a
pro
duct
of 1
(e.g
., 1 4
is th
e m
ultip
licat
ive
inve
rse
of 4
sin
ce 4
• 1 4
= 1
;
likew
ise,
the
mul
tiplic
ativ
e in
vers
e of
1 4 is
4 s
ince
1 4 •
4 =
1).
Mut
ually
Exc
lusi
ve E
vent
s Tw
o ev
ents
that
can
not o
ccur
at t
he s
ame
time
(i.e.
, eve
nts
that
hav
e no
out
com
es in
com
mon
). If
two
even
ts A
and
B a
re m
utua
lly e
xclu
sive
, the
n th
e pr
obab
ility
of A
or B
occ
urrin
g is
the
sum
of t
heir
indi
vidu
al p
roba
bilit
ies:
P(A
U B
) = P
(A) +
P(B
). A
lso
defin
ed a
s w
hen
the
inte
rsec
tion
of tw
o se
ts is
em
pty,
writ
ten
as A
∩ B
= Ø
.
Nat
ural
Log
arith
m
A lo
garit
hm w
ith b
ase
e. It
is w
ritte
n ln
x. T
he n
atur
al lo
garit
hm is
the
pow
er o
f e n
eces
sary
to e
qual
a
give
n nu
mbe
r (i.e
., ln
x =
y is
equ
ival
ent t
o e y
= x
). Th
e co
nsta
nt e
is a
n irr
atio
nal n
umbe
r who
se v
alue
is
app
roxi
mat
ely
2.71
828…
.
Nat
ural
Num
ber
A c
ount
ing
num
ber.
A n
umbe
r rep
rese
ntin
g a
posi
tive,
who
le a
mou
nt. A
ny n
umbe
r fro
m th
e se
t of
num
bers
repr
esen
ted
by {1
, 2, 3
, …}.
Som
etim
es, i
t is
refe
rred
to a
s a
“pos
itive
inte
ger”.
Neg
ativ
e Ex
pone
nt
An
expo
nent
that
indi
cate
s a
reci
proc
al th
at h
as to
be
take
n be
fore
the
expo
nent
can
be
appl
ied
(e.g
., 2
215
5−=
or
1x
xa
a−=
). It
is u
sed
in s
cien
tific
not
atio
n fo
r num
bers
bet
wee
n – 1
and
1.
K
eyst
one
Exam
s: A
lgeb
ra
Ass
essm
ent
An
chor
& E
ligi
ble
Con
ten
t G
loss
ary
Jan
uar
y 2
01
3
Pe
nnsy
lvan
ia D
epar
tmen
t of E
duca
tion
Page
16
Ja
nuar
y 20
13
Num
ber L
ine
A g
radu
ated
stra
ight
line
that
repr
esen
ts th
e se
t of a
ll re
al n
umbe
rs in
ord
er. T
ypic
ally
, it i
s m
arke
d sh
owin
g in
tege
r val
ues.
Odd
s A
com
paris
on, i
n ra
tio fo
rm (a
s a
fract
ion
or w
ith a
col
on),
of o
utco
mes
. “O
dds
in fa
vor”
(or s
impl
y “o
dds”
) is
the
ratio
of f
avor
able
out
com
es to
unf
avor
able
out
com
es (e
.g.,
the
odds
in fa
vor o
f pic
king
a
red
hat w
hen
ther
e ar
e 3
red
hats
and
5 n
on-re
d ha
ts is
3:5
). “O
dds
agai
nst”
is th
e ra
tio o
f unf
avor
able
ou
tcom
es to
favo
rabl
e ou
tcom
es (e
.g.,
the
odds
aga
inst
pic
king
a re
d ha
t whe
n th
ere
are
3 re
d ha
ts
and
5 no
n-re
d ha
ts is
5:3
).
Ord
er o
f Ope
ratio
ns
Rul
es d
escr
ibin
g w
hat o
rder
to u
se in
eva
luat
ing
expr
essi
ons:
(1
) Per
form
ope
ratio
ns in
gro
upin
g sy
mbo
ls (p
aren
thes
es a
nd b
rack
ets)
, (2
) Eva
luat
e ex
pone
ntia
l exp
ress
ions
and
radi
cal e
xpre
ssio
ns fr
om le
ft to
righ
t, (3
) Mul
tiply
or d
ivid
e fro
m le
ft to
righ
t, (4
) Add
or s
ubtra
ct fr
om le
ft to
righ
t.
Ord
ered
Pai
r A
pai
r of n
umbe
rs u
sed
to lo
cate
a p
oint
on
a co
ordi
nate
pla
ne, o
r the
sol
utio
n of
an
equa
tion
in tw
o va
riabl
es. T
he fi
rst n
umbe
r tel
ls h
ow fa
r to
mov
e ho
rizon
tally
, and
the
seco
nd n
umbe
r tel
ls h
ow fa
r to
mov
e ve
rtica
lly; w
ritte
n in
the
form
(x-c
oord
inat
e, y
-coo
rdin
ate)
. Ord
er m
atte
rs: t
he p
oint
(x, y
) is
not
the
sam
e as
(y, x
).
Orig
in
The
poin
t (0,
0) o
n a
coor
dina
te p
lane
. It i
s th
e po
int o
f int
erse
ctio
n fo
r the
x-a
xis
and
the
y-ax
is.
Out
lier
A v
alue
that
is m
uch
grea
ter o
r muc
h le
ss th
an th
e re
st o
f the
dat
a. It
is d
iffer
ent i
n so
me
way
from
the
gene
ral p
atte
rn o
f dat
a. It
dire
ctly
sta
nds
out f
rom
the
rest
of t
he d
ata.
Som
etim
es it
is re
ferre
d to
as
any
data
poi
nt m
ore
than
1.5
inte
rqua
rtile
rang
es g
reat
er th
an th
e up
per (
third
) qua
rtile
or l
ess
than
th
e lo
wer
(firs
t) qu
artil
e.
K
eyst
one
Exam
s: A
lgeb
ra
Ass
essm
ent
An
chor
& E
ligi
ble
Con
ten
t G
loss
ary
Jan
uar
y 2
01
3
Pe
nnsy
lvan
ia D
epar
tmen
t of E
duca
tion
Page
17
Ja
nuar
y 20
13
Patte
rn (o
r Seq
uenc
e)
A s
et o
f num
bers
arra
nged
in o
rder
(or i
n a
sequ
ence
). Th
e nu
mbe
rs a
nd th
eir a
rrang
emen
t are
de
term
ined
by
a ru
le, i
nclu
ding
repe
titio
n an
d gr
owth
/dec
ay ru
les.
See
arit
hmet
ic s
eque
nce
and
geom
etric
seq
uenc
e.
Perf
ect S
quar
e A
num
ber w
hose
squ
are
root
is a
who
le n
umbe
r (e.
g., 2
5 is
a p
erfe
ct s
quar
e si
nce
25 =
5).
A
perfe
ct s
quar
e ca
n be
foun
d by
rais
ing
a w
hole
num
ber t
o th
e se
cond
pow
er (e
.g.,
52 = 2
5).
Perm
utat
ion
An
orde
red
arra
ngem
ent o
f obj
ects
from
a g
iven
set
in w
hich
the
orde
r of t
he o
bjec
ts is
sig
nific
ant
(e.g
., tw
o-le
tter p
erm
utat
ions
of t
he th
ree
lette
rs X
, Y, a
nd Z
wou
ld b
e XY
, YX,
XZ,
ZX,
YZ,
and
ZY)
. A
perm
utat
ion
is s
imila
r to,
but
not
the
sam
e as
, a c
ombi
natio
n.
Poin
t-Slo
pe F
orm
(of a
Li
near
Equ
atio
n)
An
equa
tion
of a
stra
ight
, non
-ver
tical
line
writ
ten
in th
e fo
rm y
– y
1 = m
(x –
x1)
, whe
re m
is th
e sl
ope
of th
e lin
e an
d (x
1, y 1
) is
a gi
ven
poin
t on
the
line.
Poly
nom
ial
An
alge
brai
c ex
pres
sion
that
is a
mon
omia
l or t
he s
um o
r diff
eren
ce o
f tw
o or
mor
e m
onom
ials
(e.g
., 6a
or 5
a2 + 3
a –
13 w
here
the
expo
nent
s ar
e na
tura
l num
bers
).
Poly
nom
ial F
unct
ion
A fu
nctio
n of
the
form
f(x)
= a
nxn +
an–
1xn–
1 + …
+ a
1x +
a0,
whe
re a
n ≠ 0
and
nat
ural
num
ber n
is th
e de
gree
of t
he p
olyn
omia
l.
Posi
tive
Expo
nent
In
dica
tes
how
man
y tim
es a
bas
e nu
mbe
r is
mul
tiplie
d by
itse
lf. In
the
expr
essi
on x
n , n is
the
posi
tive
expo
nent
, and
x is
the
base
num
ber (
e.g.
, 23 =
2 •
2 • 2
).
K
eyst
one
Exam
s: A
lgeb
ra
Ass
essm
ent
An
chor
& E
ligi
ble
Con
ten
t G
loss
ary
Jan
uar
y 2
01
3
Pe
nnsy
lvan
ia D
epar
tmen
t of E
duca
tion
Page
18
Ja
nuar
y 20
13
Pow
er
The
valu
e of
the
expo
nent
in a
term
. The
exp
ress
ion
an is re
ad “a
to th
e po
wer
of n
.” To
rais
e a
num
ber,
a, to
the
pow
er o
f ano
ther
who
le n
umbe
r, n,
is to
mul
tiply
a b
y its
elf n
tim
es (e
.g.,
the
num
ber
43 is re
ad “f
our t
o th
e th
ird p
ower
” and
repr
esen
ts 4
• 4
• 4).
Pow
er o
f a P
ower
A
n ex
pres
sion
of t
he fo
rm (a
m)n . I
t can
be
foun
d by
mul
tiply
ing
the
expo
nent
s (e
.g.,
(23 )4 =
23•
4 = 2
12 =
4,0
96).
Pow
ers
of P
rodu
cts
An
expr
essi
on o
f the
form
am •
an . It c
an b
e fo
und
by a
ddin
g th
e ex
pone
nts
whe
n m
ultip
lyin
g po
wer
s th
at h
ave
the
sam
e ba
se (e
.g.,
23 • 24
= 23+
4 = 2
7 = 1
28).
Prim
e N
umbe
r A
ny n
atur
al n
umbe
r with
exa
ctly
two
fact
ors,
1 a
nd it
self
(e.g
., 3
is a
prim
e nu
mbe
r sin
ce it
has
onl
y tw
o fa
ctor
s: 1
and
3).
[Not
e: S
ince
1 h
as o
nly
one
fact
or, i
tsel
f, it
is n
ot a
prim
e nu
mbe
r.] A
prim
e nu
mbe
r is
not a
com
posi
te n
umbe
r.
Prob
abili
ty
A n
umbe
r fro
m 0
to 1
(or 0
% to
100
%) t
hat i
ndic
ates
how
like
ly a
n ev
ent i
s to
hap
pen.
A v
ery
unlik
ely
even
t has
a p
roba
bilit
y ne
ar 0
(or 0
%) w
hile
a v
ery
likel
y ev
ent h
as a
pro
babi
lity
near
1 (o
r 100
%).
It is
w
ritte
n as
a ra
tio (f
ract
ion,
dec
imal
, or e
quiv
alen
t per
cent
). Th
e nu
mbe
r of w
ays
an e
vent
cou
ld
happ
en (f
avor
able
out
com
es) i
s pl
aced
ove
r the
tota
l num
ber o
f eve
nts
(tota
l pos
sibl
e ou
tcom
es) t
hat
coul
d ha
ppen
. A p
roba
bilit
y of
0 m
eans
it is
impo
ssib
le, a
nd a
pro
babi
lity
of 1
mea
ns it
is c
erta
in.
Prob
abili
ty o
f a C
ompo
und
(or C
ombi
ned)
Eve
nt
Ther
e ar
e tw
o ty
pes:
1.
Th
e un
ion
of tw
o ev
ents
A a
nd B
, whi
ch is
the
prob
abilit
y of
A o
r B o
ccur
ring.
Thi
s is
re
pres
ente
d as
P(A
U B
) = P
(A) +
P(B
) – P
(A) •
P(B
). 2.
Th
e in
ters
ectio
n of
two
even
ts A
and
B, w
hich
is th
e pr
obab
ility
of A
and
B o
ccur
ring.
Thi
s is
re
pres
ente
d as
P(A
∩ B
) = P
(A) •
P(B
).
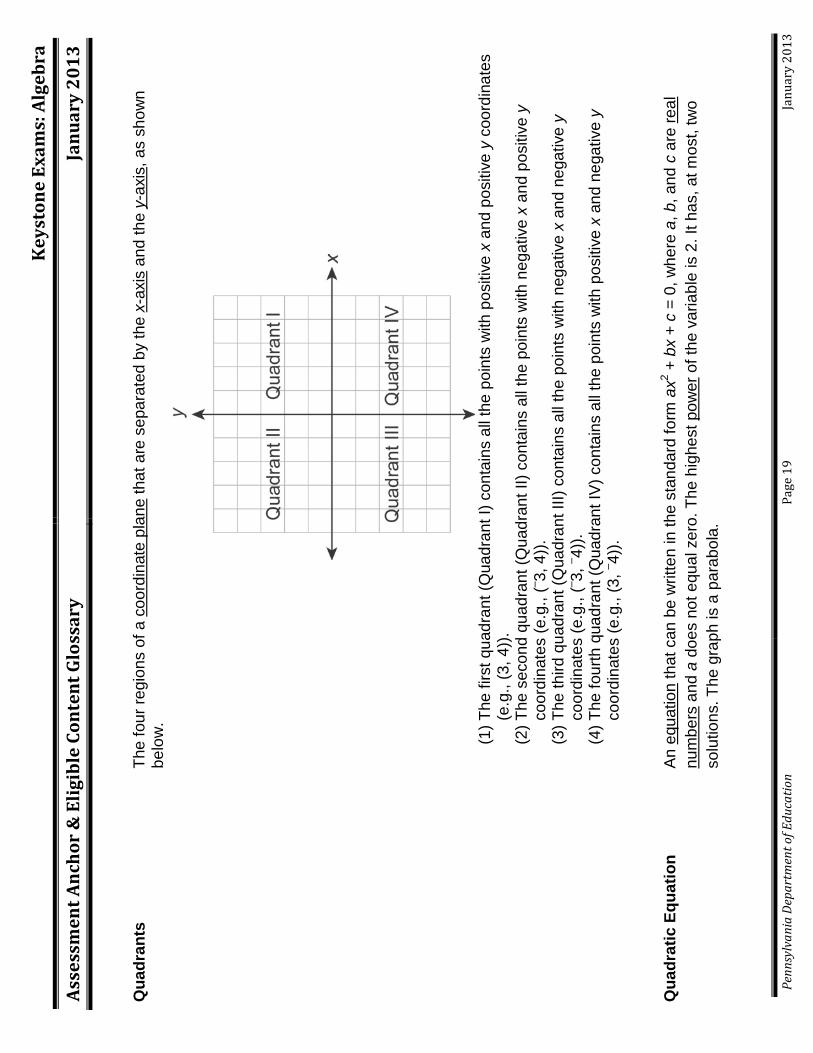
K
eyst
one
Exam
s: A
lgeb
ra
Ass
essm
ent
An
chor
& E
ligi
ble
Con
ten
t G
loss
ary
Jan
uar
y 2
01
3
Pe
nnsy
lvan
ia D
epar
tmen
t of E
duca
tion
Page
19
Ja
nuar
y 20
13
Qua
dran
ts
The
four
regi
ons
of a
coo
rdin
ate
plan
e th
at a
re s
epar
ated
by
the
x-ax
is a
nd th
e y-
axis
, as
show
n be
low
.
(1
) The
firs
t qua
dran
t (Q
uadr
ant I
) con
tain
s al
l the
poi
nts
with
pos
itive
x a
nd p
ositi
ve y
coo
rdin
ates
(e
.g.,
(3, 4
)).
(2) T
he s
econ
d qu
adra
nt (Q
uadr
ant I
I) co
ntai
ns a
ll th
e po
ints
with
neg
ativ
e x
and
posi
tive
y co
ordi
nate
s (e
.g.,
(– 3, 4
)).
(3) T
he th
ird q
uadr
ant (
Qua
dran
t III)
con
tain
s al
l the
poi
nts
with
neg
ativ
e x
and
nega
tive
y co
ordi
nate
s (e
.g.,
(– 3, – 4)
). (4
) The
four
th q
uadr
ant (
Qua
dran
t IV
) con
tain
s al
l the
poi
nts
with
pos
itive
x a
nd n
egat
ive
y co
ordi
nate
s (e
.g.,
(3, – 4)
).
Qua
drat
ic E
quat
ion
An
equa
tion
that
can
be
writ
ten
in th
e st
anda
rd fo
rm a
x2 + b
x +
c =
0, w
here
a, b
, and
c a
re re
al
num
bers
and
a d
oes
not e
qual
zer
o. T
he h
ighe
st p
ower
of t
he v
aria
ble
is 2
. It h
as, a
t mos
t, tw
o so
lutio
ns. T
he g
raph
is a
par
abol
a.
K
eyst
one
Exam
s: A
lgeb
ra
Ass
essm
ent
An
chor
& E
ligi
ble
Con
ten
t G
loss
ary
Jan
uar
y 2
01
3
Pe
nnsy
lvan
ia D
epar
tmen
t of E
duca
tion
Page
20
Ja
nuar
y 20
13
Qua
drat
ic F
orm
ula
The
solu
tions
or r
oots
of a
qua
drat
ic e
quat
ion
in th
e fo
rm a
x2 + b
x +
c =
0, w
here
a ≠
0, a
re g
iven
by
the
form
ula
24
2b
bac
xa
−±
−=
.
Qua
drat
ic F
unct
ion
A fu
nctio
n th
at c
an b
e ex
pres
sed
in th
e fo
rm f(
x) =
ax2 +
bx
+ c,
whe
re a
≠ 0
and
the
high
est p
ower
of
the
varia
ble
is 2
. The
gra
ph is
a p
arab
ola.
Qua
rtile
O
ne o
f thr
ee v
alue
s th
at d
ivid
es a
set
of d
ata
into
four
equ
al p
arts
: 1.
M
edia
n di
vide
s a
set o
f dat
a in
to tw
o eq
ual p
arts
. 2.
Lo
wer
qua
rtile
(25th
per
cent
ile) i
s th
e m
edia
n of
the
low
er h
alf o
f the
dat
a.
3.
Upp
er q
uarti
le (7
5th p
erce
ntile
) is
the
med
ian
of th
e up
per h
alf o
f the
dat
a.
Rad
ical
Exp
ress
ion
An
expr
essi
on c
onta
inin
g a
radi
cal s
ymbo
l (n
a).
The
expr
essi
on o
r num
ber i
nsid
e th
e ra
dica
l (a)
is
calle
d th
e ra
dica
nd, a
nd th
e nu
mbe
r app
earin
g ab
ove
the
radi
cal (
n) is
the
degr
ee. T
he d
egre
e is
al
way
s a
posi
tive
inte
ger.
Whe
n a
radi
cal i
s w
ritte
n w
ithou
t a d
egre
e, it
is u
nder
stoo
d to
be
a de
gree
of
2 a
nd is
read
as
“the
squa
re ro
ot o
f a.”
Whe
n th
e de
gree
is 3
, it i
s re
ad a
s “th
e cu
be ro
ot o
f a.”
For
any
othe
r deg
ree,
the
expr
essi
on n
a is
read
as
“the
nth
root
of a
.” W
hen
the
degr
ee is
an
even
nu
mbe
r, th
e ra
dica
l exp
ress
ion
is a
ssum
ed to
be
the
prin
cipa
l (po
sitiv
e) ro
ot (e
.g.,
alth
ough
(– 7)2 =
49,
49
= 7
).
Ran
ge (o
f a R
elat
ion
or
Func
tion)
Th
e se
t of a
ll po
ssib
le v
alue
s fo
r the
out
put (
depe
nden
t var
iabl
e) o
f a fu
nctio
n or
rela
tion;
the
set o
f se
cond
num
bers
in th
e or
dere
d pa
irs o
f a fu
nctio
n or
rela
tion;
the
valu
es o
f the
y-c
oord
inat
es in
(x, y
).
K
eyst
one
Exam
s: A
lgeb
ra
Ass
essm
ent
An
chor
& E
ligi
ble
Con
ten
t G
loss
ary
Jan
uar
y 2
01
3
Pe
nnsy
lvan
ia D
epar
tmen
t of E
duca
tion
Page
21
Ja
nuar
y 20
13
Ran
ge (o
f Dat
a)
In s
tatis
tics,
a m
easu
re o
f dis
pers
ion
that
is th
e di
ffere
nce
betw
een
the
grea
test
val
ue (m
axim
um
valu
e) a
nd th
e le
ast v
alue
(min
imum
val
ue) i
n a
set o
f dat
a.
Rat
e A
ratio
that
com
pare
s tw
o qu
antit
ies
havi
ng d
iffer
ent u
nits
(e.g
., 16
8 m
iles
3.5
hour
s o
r 12
2.5
calo
ries
5 cu
ps).
Whe
n
the
rate
is s
impl
ified
so
that
the
seco
nd (i
ndep
ende
nt) q
uant
ity is
1, i
t is
calle
d a
unit
rate
(e.g
.,
48 m
iles
per h
our o
r 24.
5 ca
lorie
s pe
r cup
).
Rat
e (o
f Cha
nge)
Th
e am
ount
a q
uant
ity c
hang
es o
ver t
ime
(e.g
., 3.
2 cm
per
yea
r). A
lso
the
amou
nt a
func
tion’
s ou
tput
ch
ange
s (in
crea
ses
or d
ecre
ases
) for
eac
h un
it of
cha
nge
in th
e in
put.
See
slo
pe.
Rat
e (o
f Int
eres
t) Th
e pe
rcen
t by
whi
ch a
mon
etar
y ac
coun
t acc
rues
inte
rest
. It i
s m
ost c
omm
on fo
r the
rate
of i
nter
est
to b
e m
easu
red
on a
n an
nual
bas
is (e
.g.,
4.5%
per
yea
r), e
ven
if th
e in
tere
st is
com
poun
ded
perio
dica
lly (i
.e.,
mor
e fre
quen
tly th
an o
nce
per y
ear).
Rat
io
A c
ompa
rison
of t
wo
num
bers
, qua
ntiti
es o
r exp
ress
ions
by
divi
sion
. It i
s of
ten
writ
ten
as a
frac
tion,
but n
ot a
lway
s (e
.g.,
2 3, 2
:3, 2
to 3
, 2 ÷
3 a
re a
ll th
e sa
me
ratio
s).
Rat
iona
l Exp
ress
ion
An
expr
essi
on th
at c
an b
e w
ritte
n as
a p
olyn
omia
l div
ided
by
a po
lyno
mia
l, de
fined
onl
y w
hen
the
latte
r is
not e
qual
to z
ero.
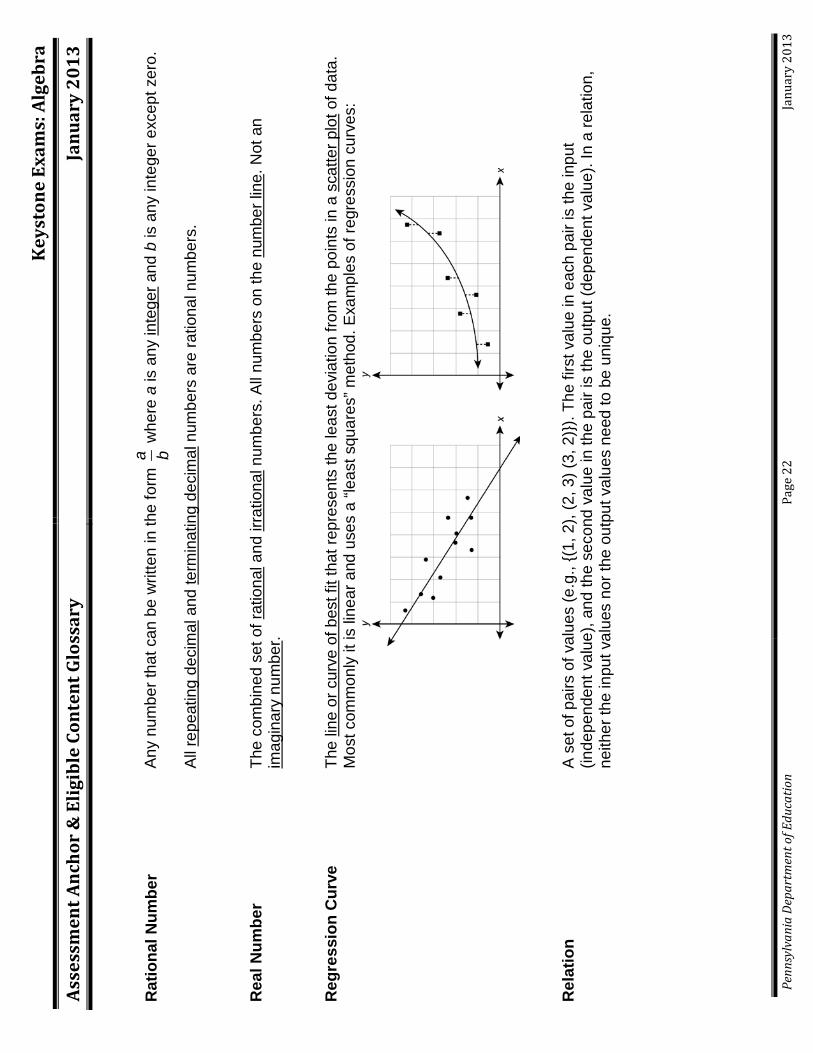
K
eyst
one
Exam
s: A
lgeb
ra
Ass
essm
ent
An
chor
& E
ligi
ble
Con
ten
t G
loss
ary
Jan
uar
y 2
01
3
Pe
nnsy
lvan
ia D
epar
tmen
t of E
duca
tion
Page
22
Ja
nuar
y 20
13
Rat
iona
l Num
ber
Any
num
ber t
hat c
an b
e w
ritte
n in
the
form
a b w
here
a is
any
inte
ger a
nd b
is a
ny in
tege
r exc
ept z
ero.
All
repe
atin
g de
cim
al a
nd te
rmin
atin
g de
cim
al n
umbe
rs a
re ra
tiona
l num
bers
.
Rea
l Num
ber
The
com
bine
d se
t of r
atio
nal a
nd ir
ratio
nal n
umbe
rs. A
ll nu
mbe
rs o
n th
e nu
mbe
r lin
e. N
ot a
n im
agin
ary
num
ber.
Reg
ress
ion
Cur
ve
The
line
or c
urve
of b
est f
it th
at re
pres
ents
the
leas
t dev
iatio
n fro
m th
e po
ints
in a
sca
tter p
lot o
f dat
a.
Mos
t com
mon
ly it
is li
near
and
use
s a
“leas
t squ
ares
” met
hod.
Exa
mpl
es o
f reg
ress
ion
curv
es:
Rel
atio
n A
set
of p
airs
of v
alue
s (e
.g.,
{(1, 2
), (2
, 3) (
3, 2
)}). T
he fi
rst v
alue
in e
ach
pair
is th
e in
put
(inde
pend
ent v
alue
), an
d th
e se
cond
val
ue in
the
pair
is th
e ou
tput
(dep
ende
nt v
alue
). In
a re
latio
n,
neith
er th
e in
put v
alue
s no
r the
out
put v
alue
s ne
ed to
be
uniq
ue.
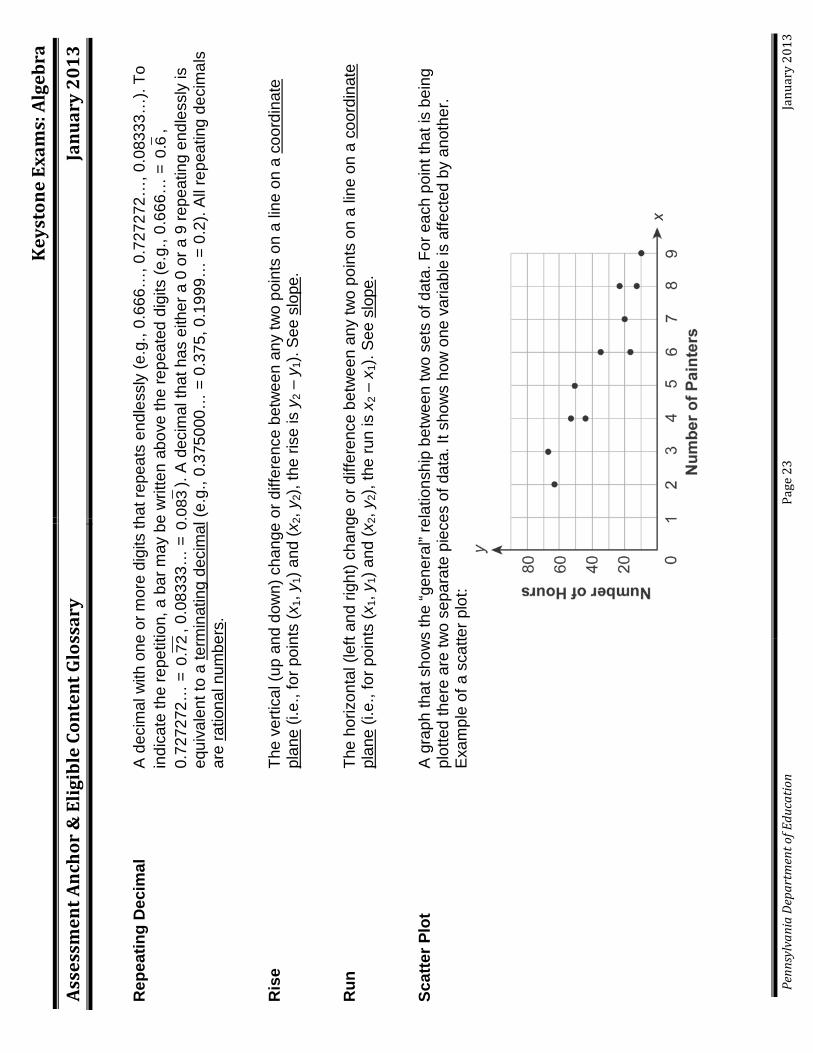
K
eyst
one
Exam
s: A
lgeb
ra
Ass
essm
ent
An
chor
& E
ligi
ble
Con
ten
t G
loss
ary
Jan
uar
y 2
01
3
Pe
nnsy
lvan
ia D
epar
tmen
t of E
duca
tion
Page
23
Ja
nuar
y 20
13
Rep
eatin
g D
ecim
al
A d
ecim
al w
ith o
ne o
r mor
e di
gits
that
repe
ats
endl
essl
y (e
.g.,
0.66
6…, 0
.727
272…
, 0.0
8333
…).
To
indi
cate
the
repe
titio
n, a
bar
may
be
writ
ten
abov
e th
e re
peat
ed d
igits
(e.g
., 0.
666…
= 0
.6,
0.72
7272
… =
0.7
2, 0
.083
33…
= 0
.083
). A
dec
imal
that
has
eith
er a
0 o
r a 9
repe
atin
g en
dles
sly
is
equi
vale
nt to
a te
rmin
atin
g de
cim
al (e
.g.,
0.37
5000
… =
0.3
75, 0
.199
9… =
0.2
). A
ll re
peat
ing
deci
mal
s ar
e ra
tiona
l num
bers
.
Ris
e Th
e ve
rtica
l (up
and
dow
n) c
hang
e or
diff
eren
ce b
etw
een
any
two
poin
ts o
n a
line
on a
coo
rdin
ate
plan
e (i.
e., f
or p
oint
s (x
1, y 1
) and
(x2,
y 2),
the
rise
is y
2 – y
1). S
ee s
lope
.
Run
Th
e ho
rizon
tal (
left
and
right
) cha
nge
or d
iffer
ence
bet
wee
n an
y tw
o po
ints
on
a lin
e on
a c
oord
inat
e pl
ane
(i.e.
, for
poi
nts
(x1,
y 1) a
nd (x
2, y 2
), th
e ru
n is
x2 –
x1)
. See
slo
pe.
Scat
ter P
lot
A g
raph
that
sho
ws
the
“gen
eral
” rel
atio
nshi
p be
twee
n tw
o se
ts o
f dat
a. F
or e
ach
poin
t tha
t is
bein
g pl
otte
d th
ere
are
two
sepa
rate
pie
ces
of d
ata.
It s
how
s ho
w o
ne v
aria
ble
is a
ffect
ed b
y an
othe
r. E
xam
ple
of a
sca
tter p
lot:
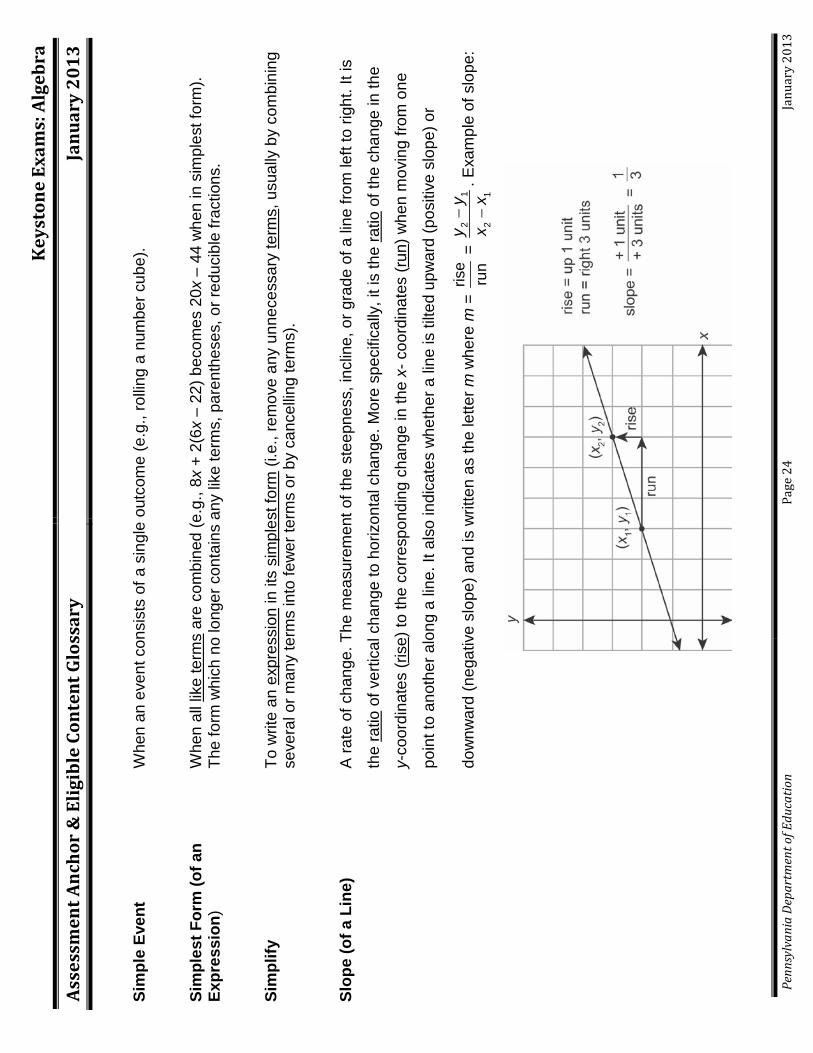
K
eyst
one
Exam
s: A
lgeb
ra
Ass
essm
ent
An
chor
& E
ligi
ble
Con
ten
t G
loss
ary
Jan
uar
y 2
01
3
Pe
nnsy
lvan
ia D
epar
tmen
t of E
duca
tion
Page
24
Ja
nuar
y 20
13
Sim
ple
Even
t W
hen
an e
vent
con
sist
s of
a s
ingl
e ou
tcom
e (e
.g.,
rollin
g a
num
ber c
ube)
.
Sim
ples
t For
m (o
f an
Expr
essi
on)
Whe
n al
l lik
e te
rms
are
com
bine
d (e
.g.,
8x +
2(6
x –
22) b
ecom
es 2
0x –
44
whe
n in
sim
ples
t for
m).
The
form
whi
ch n
o lo
nger
con
tain
s an
y lik
e te
rms,
par
enth
eses
, or r
educ
ible
frac
tions
.
Sim
plify
To
writ
e an
exp
ress
ion
in it
s si
mpl
est f
orm
(i.e
., re
mov
e an
y un
nece
ssar
y te
rms,
usu
ally
by
com
bini
ng
seve
ral o
r man
y te
rms
into
few
er te
rms
or b
y ca
ncel
ling
term
s).
Slop
e (o
f a L
ine)
A
rate
of c
hang
e. T
he m
easu
rem
ent o
f the
ste
epne
ss, i
nclin
e, o
r gra
de o
f a li
ne fr
om le
ft to
righ
t. It
is
the
ratio
of v
ertic
al c
hang
e to
hor
izon
tal c
hang
e. M
ore
spec
ifica
lly, i
t is
the
ratio
of t
he c
hang
e in
the
y-co
ordi
nate
s (ri
se) t
o th
e co
rresp
ondi
ng c
hang
e in
the
x- c
oord
inat
es (r
un) w
hen
mov
ing
from
one
poin
t to
anot
her a
long
a li
ne. I
t als
o in
dica
tes
whe
ther
a li
ne is
tilte
d up
war
d (p
ositi
ve s
lope
) or
dow
nwar
d (n
egat
ive
slop
e) a
nd is
writ
ten
as th
e le
tter m
whe
re m
= ris
eru
n =
2
1
21
yy
xx
− −. E
xam
ple
of s
lope
:
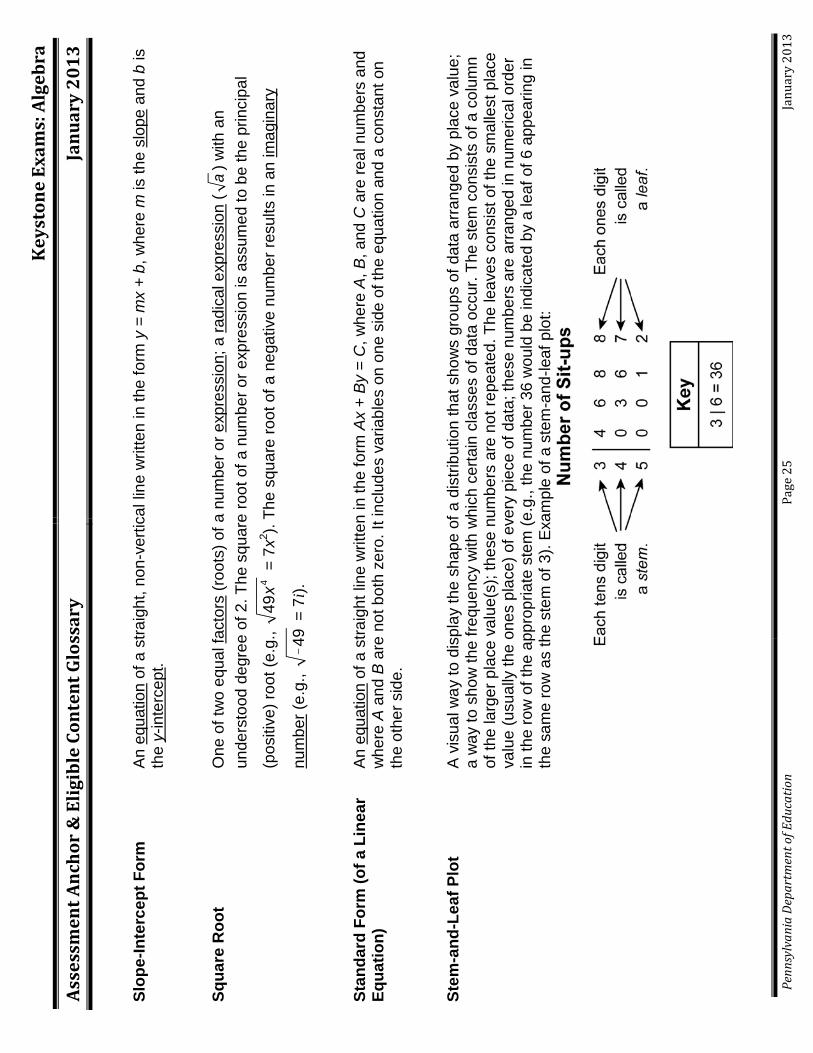
K
eyst
one
Exam
s: A
lgeb
ra
Ass
essm
ent
An
chor
& E
ligi
ble
Con
ten
t G
loss
ary
Jan
uar
y 2
01
3
Pe
nnsy
lvan
ia D
epar
tmen
t of E
duca
tion
Page
25
Ja
nuar
y 20
13
Slop
e-In
terc
ept F
orm
A
n eq
uatio
n of
a s
traig
ht, n
on-v
ertic
al li
ne w
ritte
n in
the
form
y =
mx
+ b,
whe
re m
is th
e sl
ope
and
b is
th
e y-
inte
rcep
t.
Squa
re R
oot
One
of t
wo
equa
l fac
tors
(roo
ts) o
f a n
umbe
r or e
xpre
ssio
n; a
radi
cal e
xpre
ssio
n (
a) w
ith a
n un
ders
tood
deg
ree
of 2
. The
squ
are
root
of a
num
ber o
r exp
ress
ion
is a
ssum
ed to
be
the
prin
cipa
l
(pos
itive
) roo
t (e.
g.,
449
x =
7x2 ).
The
squa
re ro
ot o
f a n
egat
ive
num
ber r
esul
ts in
an
imag
inar
y
num
ber (
e.g.
, _49
= 7
i).
Stan
dard
For
m (o
f a L
inea
r Eq
uatio
n)
An
equa
tion
of a
stra
ight
line
writ
ten
in th
e fo
rm A
x +
By
= C
, whe
re A
, B, a
nd C
are
real
num
bers
and
w
here
A a
nd B
are
not
bot
h ze
ro. I
t inc
lude
s va
riabl
es o
n on
e si
de o
f the
equ
atio
n an
d a
cons
tant
on
the
othe
r sid
e.
Stem
-and
-Lea
f Plo
t A
vis
ual w
ay to
dis
play
the
shap
e of
a d
istri
butio
n th
at s
how
s gr
oups
of d
ata
arra
nged
by
plac
e va
lue;
a
way
to s
how
the
frequ
ency
with
whi
ch c
erta
in c
lass
es o
f dat
a oc
cur.
The
stem
con
sist
s of
a c
olum
n of
the
larg
er p
lace
val
ue(s
); th
ese
num
bers
are
not
repe
ated
. The
leav
es c
onsi
st o
f the
sm
alle
st p
lace
va
lue
(usu
ally
the
ones
pla
ce) o
f eve
ry p
iece
of d
ata;
thes
e nu
mbe
rs a
re a
rrang
ed in
num
eric
al o
rder
in
the
row
of t
he a
ppro
pria
te s
tem
(e.g
., th
e nu
mbe
r 36
wou
ld b
e in
dica
ted
by a
leaf
of 6
app
earin
g in
th
e sa
me
row
as
the
stem
of 3
). E
xam
ple
of a
ste
m-a
nd-le
af p
lot:
K
eyst
one
Exam
s: A
lgeb
ra
Ass
essm
ent
An
chor
& E
ligi
ble
Con
ten
t G
loss
ary
Jan
uar
y 2
01
3
Pe
nnsy
lvan
ia D
epar
tmen
t of E
duca
tion
Page
26
Ja
nuar
y 20
13
Subs
titut
ion
The
repl
acem
ent o
f a te
rm o
r var
iabl
e in
an
expr
essi
on o
r equ
atio
n by
ano
ther
that
has
the
sam
e va
lue
in o
rder
to s
impl
ify o
r eva
luat
e th
e ex
pres
sion
or e
quat
ion.
Syst
em o
f Lin
ear E
quat
ions
A
set
of t
wo
or m
ore
linea
r equ
atio
ns w
ith th
e sa
me
varia
bles
. The
sol
utio
n to
a s
yste
m o
f lin
ear
equa
tions
may
be
foun
d by
line
ar c
ombi
natio
n, s
ubst
itutio
n, o
r gra
phin
g. A
sys
tem
of t
wo
linea
r eq
uatio
ns w
ill ei
ther
hav
e on
e so
lutio
n, in
finite
ly m
any
solu
tions
, or n
o so
lutio
ns.
Syst
em o
f Lin
ear
Ineq
ualit
ies
Two
or m
ore
linea
r ine
qual
ities
with
the
sam
e va
riabl
es. S
ome
syst
ems
of in
equa
litie
s m
ay in
clud
e eq
uatio
ns a
s w
ell a
s in
equa
litie
s. T
he s
olut
ion
regi
on m
ay b
e cl
osed
or b
ound
ed b
ecau
se th
ere
are
lines
on
all s
ides
, whi
le o
ther
sol
utio
ns m
ay b
e op
en o
r unb
ound
ed.
Syst
ems
of E
quat
ions
A
set
of t
wo
or m
ore
equa
tions
con
tain
ing
a se
t of c
omm
on v
aria
bles
.
Term
A
par
t of a
n al
gebr
aic
expr
essi
on. T
erm
s ar
e se
para
ted
by e
ither
an
addi
tion
sym
bol (
+) o
r a
subt
ract
ion
sym
bol (
–). I
t can
be
a nu
mbe
r, a
varia
ble,
or a
pro
duct
of a
num
ber a
nd o
ne o
r mor
e va
riabl
es (e
.g.,
in th
e ex
pres
sion
4x2 +
6y, 4
x2 and
6y
are
both
term
s).
Term
inat
ing
Dec
imal
A
dec
imal
with
a fi
nite
num
ber o
f dig
its. A
dec
imal
for w
hich
the
divi
sion
ope
ratio
n re
sults
in e
ither
re
peat
ing
zero
es o
r rep
eatin
g ni
nes
(e.g
., 0.
3750
00…
= 0
.375
, 0.1
999…
= 0
.2).
It is
gen
eral
ly w
ritte
n to
the
last
non
-zer
o pl
ace
valu
e, b
ut c
an a
lso
be w
ritte
n w
ith a
dditi
onal
zer
oes
in s
mal
ler p
lace
val
ues
as n
eede
d (e
.g.,
0.25
can
als
o be
writ
ten
as 0
.250
0). A
ll te
rmin
atin
g de
cim
als
are
ratio
nal n
umbe
rs.
Trin
omia
l A
pol
ynom
ial w
ith th
ree
unlik
e te
rms
(e.g
., 7a
+ 4
b +
9c).
Eac
h te
rm is
a m
onom
ial,
and
the
mon
omia
ls a
re jo
ined
by
an a
dditi
on s
ymbo
l (+)
or a
sub
tract
ion
sym
bol (
–). I
t is
cons
ider
ed a
n al
gebr
aic
expr
essi
on.
K
eyst
one
Exam
s: A
lgeb
ra
Ass
essm
ent
An
chor
& E
ligi
ble
Con
ten
t G
loss
ary
Jan
uar
y 2
01
3
Pe
nnsy
lvan
ia D
epar
tmen
t of E
duca
tion
Page
27
Ja
nuar
y 20
13
Uni
t Rat
e A
rate
in w
hich
the
seco
nd (i
ndep
ende
nt) q
uant
ity o
f the
ratio
is 1
(e.g
., 60
wor
ds p
er m
inut
e, $
4.50
pe
r pou
nd, 2
1 st
uden
ts p
er c
lass
).
Varia
ble
A le
tter o
r sym
bol u
sed
to re
pres
ent a
ny o
ne o
f a g
iven
set
of n
umbe
rs o
r oth
er o
bjec
ts (e
.g.,
in th
e eq
uatio
n y
= x
+ 5,
the
y an
d x
are
varia
bles
). S
ince
it c
an ta
ke o
n di
ffere
nt v
alue
s, it
is th
e op
posi
te o
f a
cons
tant
.
Who
le N
umbe
r A
nat
ural
num
ber o
r zer
o. A
ny n
umbe
r fro
m th
e se
t of n
umbe
rs re
pres
ente
d by
{0, 1
, 2, 3
, …}.
Som
etim
es it
is re
ferre
d to
as
a “n
on-n
egat
ive
inte
ger”.
x-A
xis
The
horiz
onta
l num
ber l
ine
on a
coo
rdin
ate
plan
e th
at in
ters
ects
with
a v
ertic
al n
umbe
r lin
e, th
e y-
axis
; the
line
who
se e
quat
ion
is y
= 0
. The
x-a
xis
cont
ains
all
the
poin
ts w
ith a
zer
o y-
coor
dina
te
(e.g
., (5
, 0)).
x-In
terc
ept(s
) Th
e x-
coor
dina
te(s
) of t
he p
oint
(s) a
t whi
ch th
e gr
aph
of a
n eq
uatio
n cr
osse
s th
e x-
axis
(i.e
., th
e va
lue(
s) o
f the
x-c
oord
inat
e w
hen
y =
0). T
he s
olut
ion(
s) o
r roo
t(s) o
f an
equa
tion
that
is s
et e
qual
to
0.
y-A
xis
The
verti
cal n
umbe
r lin
e on
a c
oord
inat
e pl
ane
that
inte
rsec
ts w
ith a
hor
izon
tal n
umbe
r lin
e, th
e x-
axis
; the
line
who
se e
quat
ion
is x
= 0
. The
y-a
xis
cont
ains
all
the
poin
ts w
ith a
zer
o x-
coor
dina
te
(e.g
., (0
, 7)).
y-In
terc
ept(s
) Th
e y-
coor
dina
te(s
) of t
he p
oint
(s) a
t whi
ch th
e gr
aph
of a
n eq
uatio
n cr
osse
s th
e y-
axi
s (i.
e., t
he
valu
e(s)
of t
he y
-coo
rdin
ate
whe
n x
= 0)
. For
a li
near
equ
atio
n in
slo
pe-in
terc
ept f
orm
(y =
mx
+ b)
, it i
s in
dica
ted
by b
.
Cover photo © Hill Street Studios/Harmik Nazarian/Blend Images/Corbis.
Copyright © 2013 by the Pennsylvania Department of Education. The materials contained in this publication may be
duplicated by Pennsylvania educators for local classroom use. This permission does not extend to the duplication
of materials for commercial use.
Keystone Exams: Algebra I
Assessment Anchors and Eligible Contentwith Sample Questions and Glossary
January 2013